 Heng Wang1,2
 Yisheng Peng3Chen Wang4*Qingke Wen5Jinyong Xu5
 Zhan Hu2,6,7*Xing Jia4
 Xuemei Zhao8Weihang Lian9
 Stijn Temmerman10
 Judith Wolf11
 Tjeerd Bouma12,13
- 1Institute of Estuarine and Coastal Research, School of Marine Engineering and Technology, Sun Yat-sen University, Zhuhai, China
- 2Southern Marine Science and Engineering Guangdong Laboratory (Zhuhai), Zhuhai, China
- 3Guangdong Provincial Key Laboratory of Environmental Pollution Control and Remediation Technology, School of Environmental Science and Engineering, Sun Yat-sen University, Guangzhou, China
- 4State Environmental Protection Key Laboratory of Satellite Remote Sensing, Center for Satellite Application on Ecology and Environment, Ministry of Ecology and Environment, Beijing, China
- 5Aerospace Information Research Institute, Chinese Academy of Sciences, Beijing, China
- 6Guangdong Provincial Key Laboratory of Marine Resources and Coastal Engineering, School of Marine Science, Sun Yat-sen University, Guangzhou, China
- 7Pearl River Estuary Marine Ecosystem Research Station, Ministry of Education, Zhuhai, China
- 8School of Information Management and Engineering, Shanghai University of Finance and Economics, Shanghai, China
- 9Guangdong Research Institute of Water Resources and Hydropower, Guangzhou, China
- 10Ecosystem Management Research Group, University of Antwerp, Antwerp, Belgium
- 11National Oceanography Centre, Liverpool, United Kingdom
- 12Department of Estuarine and Delta Systems, NIOZ Royal Netherlands Institute for Sea Research, Utrecht University, Utrecht, Netherlands
- 13Department of Physical Geography, Utrecht University, Utrecht, Netherlands
Understanding the recent changes in mangrove adjacent to mega-cities is critical for conservation, management, and policymaking in coastal zones with fast population growth and global change. Here we investigated mangrove area changes in one of the world’s largest urban areas near the main estuaries in the Guangdong-Hong Kong-Macao Greater Bay Area (GBA). Mangrove area changes are quantified for the period 1990–2018 by analyzing multiple sources of satellite images by classification algorithms. We found that estuarine mangrove area dynamics are driven by human actions and are contrasting between these two periods. (1) During 1990–2000, the estuarine mangrove area approximately decreased from 11.5 to 6.9 km2, among which the bulk part was transformed into aquaculture ponds (41.1%) and built-up area (29.9%). (2) During 2000–2018, the estuarine mangrove area rapidly increased to 18.3 km2 resulting from the protection and restoration efforts. Proportions of mangrove occurring in nature reserves increased from 37.5% in 1990 to >80% in the 2000s. Two major mangrove expansion ways, natural establishment (NE, in protected areas without any human interference) and human afforestation (HA) accounted almost equally (53.1 and 46.9%) for the gained estuarine mangrove area during 2010–2018. A future projection according to the current mangrove increasing rate suggests that all the low-lying land that is theoretically suitable for mangrove afforestation would be used up by 2060. Although afforestation has contributed to important gains in mangrove quantity, we highlight that it may also imply decreased habitat quality. It has resulted in a great occupation of high tidal mudflats and a loss of their valuable ecosystem services, and it may lead to spreading of non-native species, e.g., Sonneratia apetala, used in afforestation programs. Future restoration approaches should adopt more eco-friendly strategies, like reversing (abandoned) aquaculture ponds to native mangrove forests. Knowledge obtained from the GBA in this study may be also instrumental to ecological restorations for mangrove forests in other urbanized estuaries.
Introduction
Mangroves are important ecosystems in tropical and subtropical coastal zones, providing invaluable ecosystem services, such as biodiversity, fishery, carbon storage/sequestration, and shoreline stabilization (Chen et al., 2012; Alongi, 2014; He et al., 2018; Ouyang and Lee, 2020; Wang et al., 2020). They have reduced the disaster loss of tsunamis and hurricanes (Mazda et al., 2006; Giri et al., 2007; Alongi, 2008; Sidik et al., 2018; Hochard et al., 2019), which is crucial to the safety of low-elevation coastal zones with a dense population that might reach more than 650 million by 2030 (Neumann et al., 2015). When mangroves are close to coastal cities, they are subject to both global-scale external forcing (e.g., sea-level rise induced by climate change) and more local-scale human activities (e.g., urban expansion and concomitant hazards to ecosystems) (Mcleod et al., 2010; Nicholls and Cazenave, 2010; Pontee, 2013; Lovelock et al., 2015; Friess et al., 2019). Many mangrove habitats around mega-cities like Singapore (Lai et al., 2015), and densely populated deltas like the Mekong Delta, Vietnam (Veettil et al., 2019), Ganges Delta in India (Pramanik, 2014), and Pearl River Delta (PRD), China (Ai et al., 2019a), have been reported with rapid loss and degradation. Such rapid mangrove area loss and associated weakened functions have called for an urgent need for mangrove restoration. To this end, it is essential to understand the roles of human activities in mangrove dynamics, which may guide future policies on conservation and management of coastal wetland ecosystems.
Mangroves usually grow in muddy intertidal zone in delta, estuary, lagoon, and other depositional landforms with sheltered hydrological conditions (Giri et al., 2011; Woodroffe et al., 2016; Hu Z. et al., 2020). Large rivers transport sediment and nutrients, resulting in deposition of intertidal ecosystems (e.g., tidal flats and mangroves). Sediment supply directly affects the expansion or retreat of mangroves in a delta (Kondolf et al., 2014; Woodroffe et al., 2016). However, major estuaries worldwide experience a sediment load reduction for dam constructions and sand excavation that might shrink mangroves further (Kondolf et al., 2014). Unfortunately, the gained intertidal area is often used for city expansion or aquaculture ponds, resulting in mangrove loss. Consequently, mangroves located at estuaries are susceptible to external forces, e.g., sediment reduction and over-exploitation from human activities, indicating the greater uncertainty than that with stable conditions, e.g., along the inner-land river channels, open coasts, and lagoons (Long et al., 2021).
The Guangdong-Hong Kong-Macao Greater Bay Area (GBA), located in the Pearl River Estuary, contains Hong Kong, Macao, and PRD (nine cities of Guangdong Province). It has experienced a population and economic boost since the 1980s and overtook Tokyo (42 million populations and 13,400 km2) as the world’s largest urban area in both size (56,000 km2) and population (42 million populations in PRD) (The World Bank Group, 2015). The PRD has gained 1,160 km2 of new built-up land, mostly through land reclamation since the 1850s (Wu et al., 2018). Given the rapid urbanization and economic development, mangrove conservation and restoration in the GBA is a great challenge. The local estuarine mangrove ecosystem has been affected by a large-scale anthropogenic disturbance and high risks of flooding (Dominicis et al., 2020; Zheng et al., 2020). A negative correlation was found between the changes in mangrove areas and that of built-up land. Mangrove areas in PRD are 27 km2 in 1985, and the net loss of mangrove area is 11.73 km2 (c.a. 45%) till 2015 (Ai et al., 2019a).
Previous studies investigated the spatial-temporal variation in mangrove forests in the GBA and worldwide (e.g., Giri et al., 2007; Liu et al., 2008; Jia et al., 2016; Ai et al., 2019a), whereas the nature and cause of such changes (i.e., to which land cover types have mangroves converted) have not been fully revealed. Unraveling the key drivers of estuarine mangrove dynamics in the GBA would provide an illustrative case study for rapidly developing areas worldwide.
In this study, we aim to (1) quantify the spatial-temporal changes of estuarine mangrove area and the mangrove-related land type conversions, (2) evaluate the contribution of nature reserves and contrasting ecological measures, natural establishment vs. human afforestation) for mangrove expansion, and (3) identify the key drivers of mangrove area changes by accessing the role of human activities in the GBA since 1990. We focused on dynamics of estuarine mangrove, whereas mangroves located along the river channels, open coasts, and lagoons are thus out of the scope of this paper. In this paper, human afforestation (HA) refers to planting the mangrove saplings to expand forests artificially. And the mangrove expansion without human intervention is referred to as “natural establishment (NE).” Multiple sources of aerial images, including Landsat and Sentinel-2 were used to detect the changes in land cover type classification (e.g., mangrove, saltmarsh, tidal flat, built-up area, aquaculture ponds) in the years of 1990, 2000, 2010, and 2018. Also, based on the obtained mangrove changing rate in the past decades, future possible variations under several potential scenarios and the sustainability of restoration were analyzed. We highlighted the effects of the current restoration approach and provide guidelines on a policy that is more sustainable according to ecological principles.
Materials and Methods
Study Area
The GBA is in southern China (20°41′-25°26′N, 111°24′-115°25′E), contains nine cities (Guangzhou, Shenzhen, Zhuhai, Foshan, Dongguan, Zhongshan, Jiangmen, Huizhou, and Zhaoqing) of the Guangdong Province and two of China’s special administrative regions of Hong Kong and Macao. The region has a subtropical monsoon climate with an annual average temperature of 21.9 degrees Celsius and an average annual rainfall of 1,790 mm. This area is prone to be impacted by tropical cyclones, rainstorms, droughts, typhoons, strong winds, and other factors (Wu et al., 2015). Native mangrove species in the GBA include Rhizophora stylosa, Kandelia obovata, Bruguiera gymnhoriza, Aegiceras corniculatum, and Avicennia marina (Chang et al., 1998). During the mid-1990s and early 2000s, the non-native Sonneratia apetala, Sonneratia caseolaris, and Laguncularia racemosa have been introduced into southern China to control the invasive species Spartina alterniflora and promote afforestation of mangroves (Zan et al., 2003). Saltmarsh species in the GBA mainly include Phragmites australis, Cyperus malaccensis var. brevifolius, and S. alterniflora. According to the scope of this study, mangrove locates around the mouths of the Pearl River, Nafu River, Shenjing River and Shenzhen River was classified by means of remote sensing (RS) technology. To identify the estuarine mangrove changes detailly, the whole study area was divided into six typical sites (marked as A-F in Figure 1), which were classified by means of RS. Consequently, all mangrove patches from the classification are located near the river outlet, hereinafter referred to as “estuarine mangrove.”
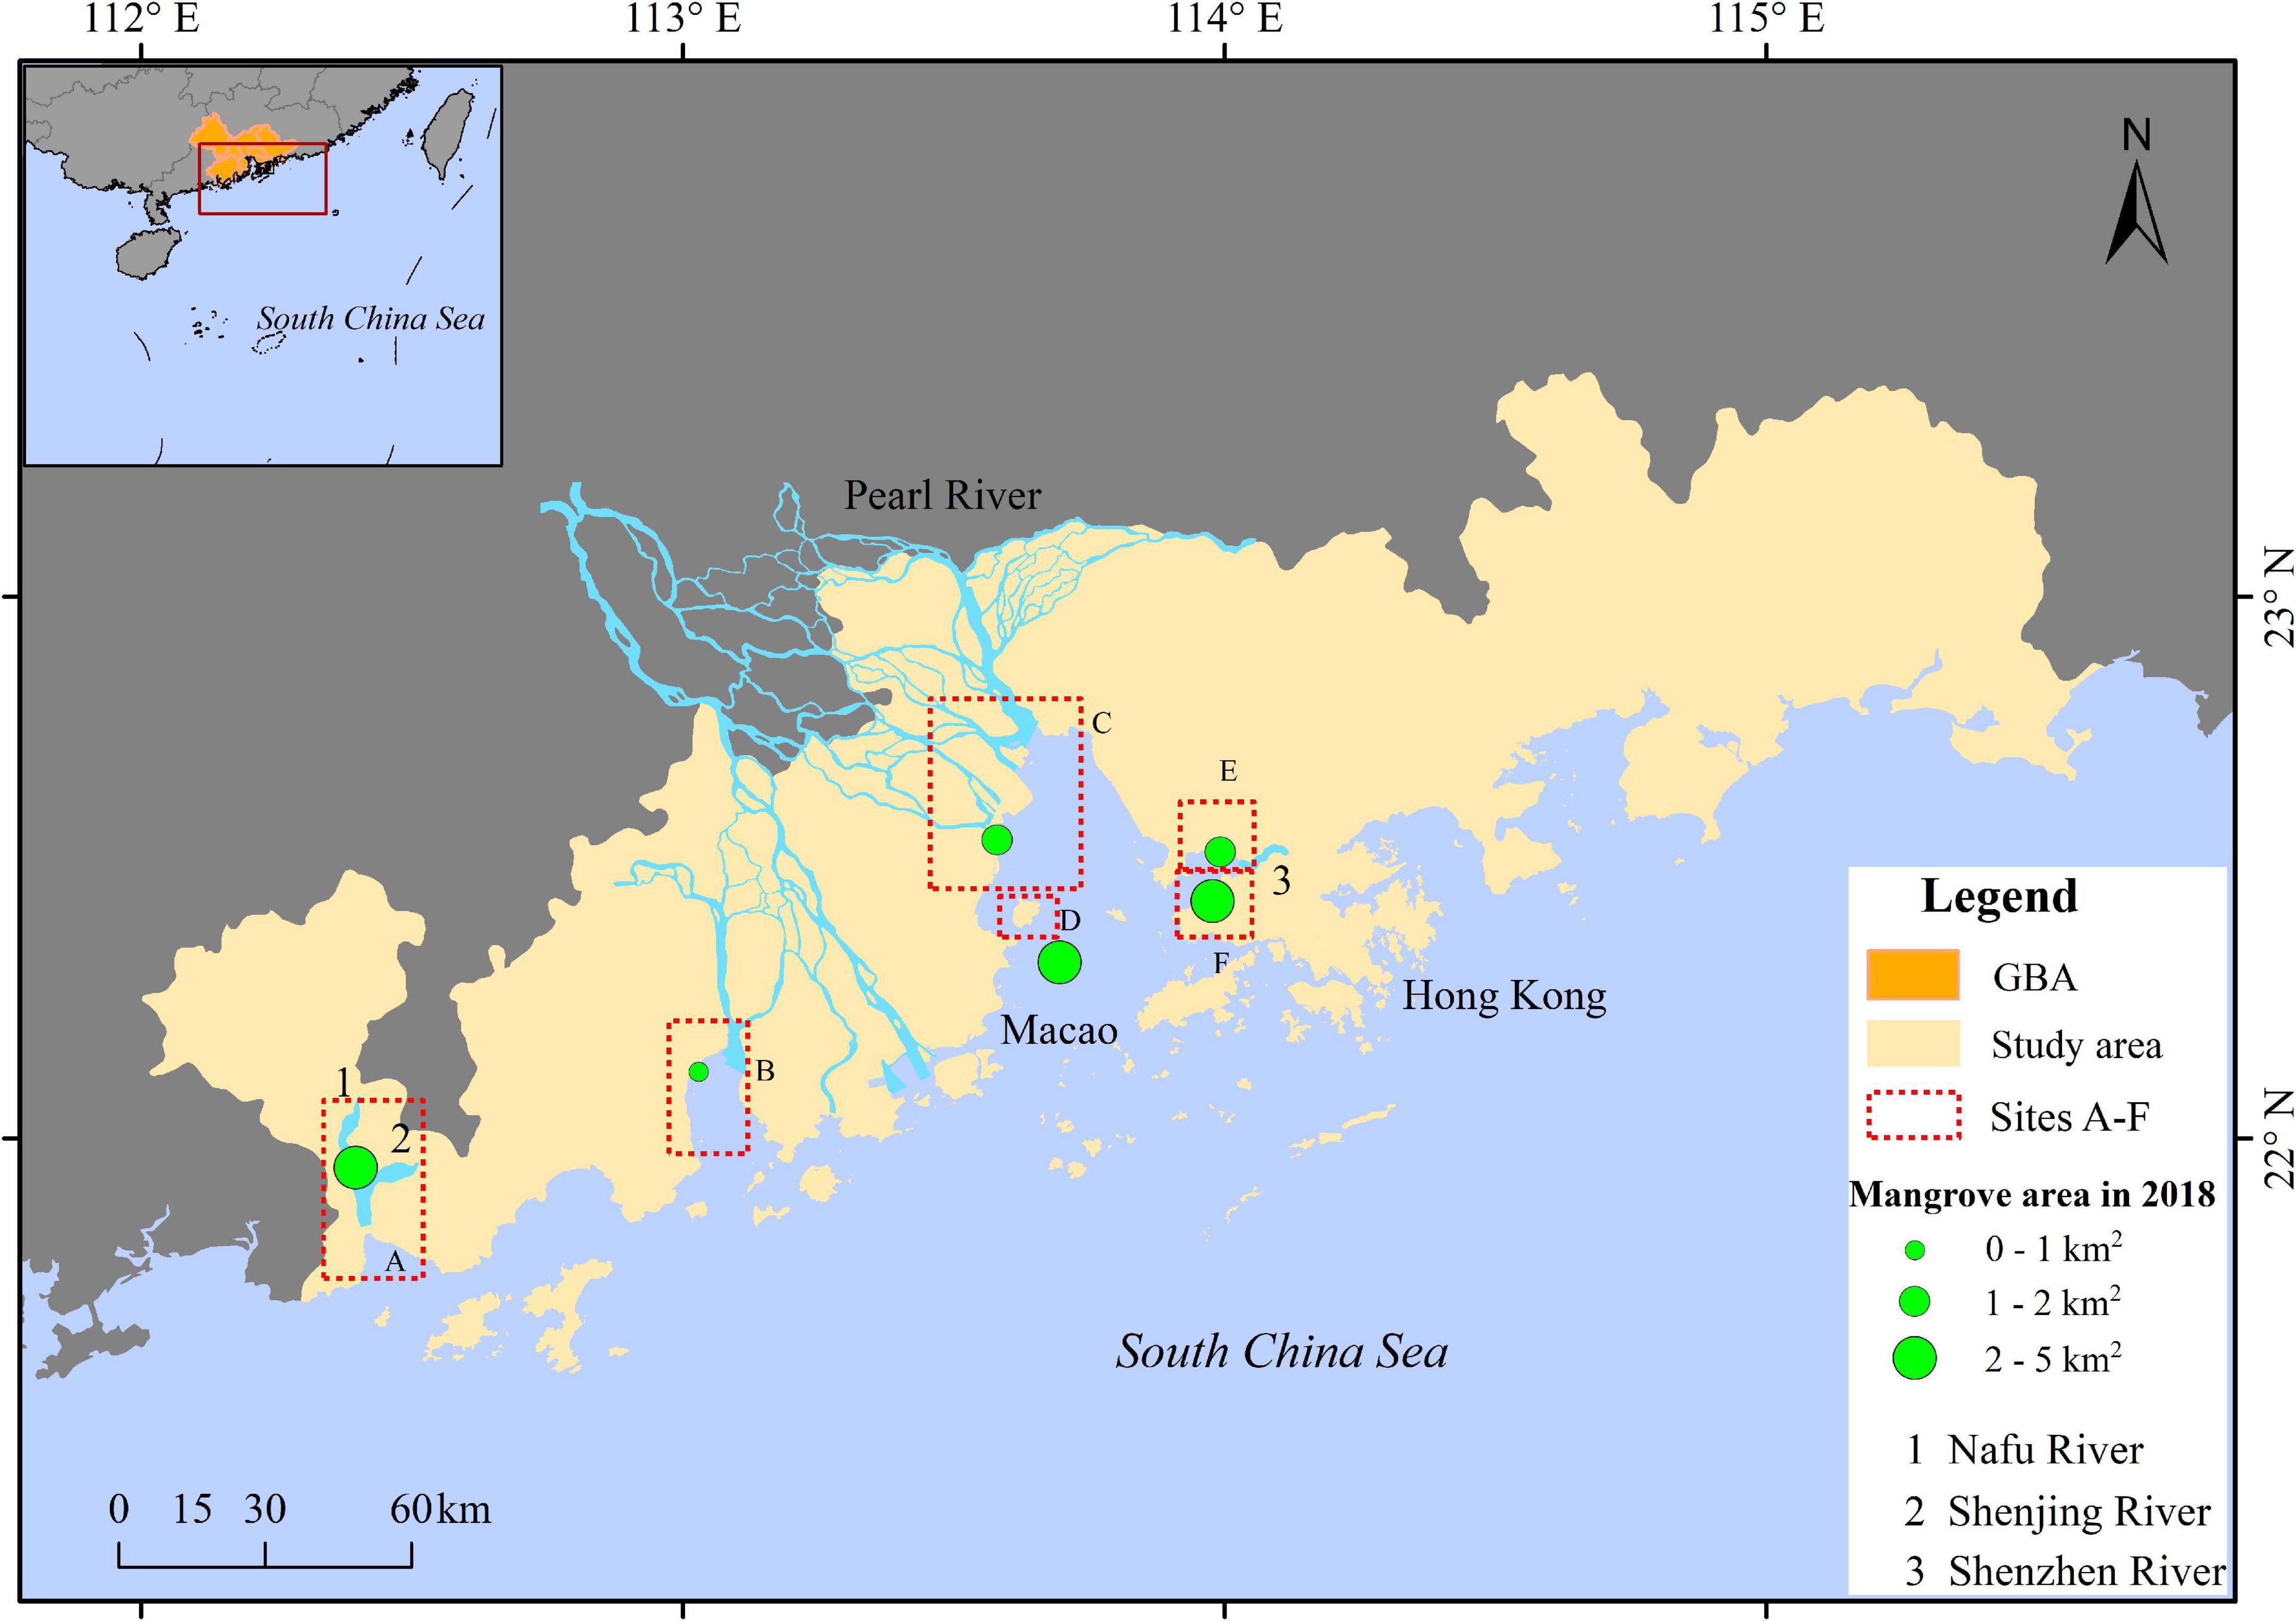
Figure 1. The geography of Guangdong-Hong Kong-Macao Greater Bay Area. Boxes marked with letters (A–F) show the locations of main mangrove sites at the estuaries: (A) Zhenhai Gulf, (B) Huangmao Bay, (C) Lingding Bay, (D) Qi’ao Island, (E) Futian, and (F) Mai Po Nature Reserve.
Zhenhai Gulf (site A), in Jiangmen, Guangdong Province, is connected to two river mouths, those of the Nafu and Shenjing Rivers, which flow south and southwest, respectively.
Huangmao Bay (site B) is the westernmost outlet of the Pearl River Estuary, located at the junction of Jiangmen and Zhuhai, Guangdong Province. Mangrove areas in this site were the smallest among the six sites.
Lingding Bay (site C) receives a large amount of river discharge and sediment from the Pearl River. The main cities of PRD (i.e., Guangzhou, Shenzhen, Zhuhai, and Dongguan) are located around the bay, therefore exerting intensive human intervention. Since few mangroves were found on the eastern side of the bay due to land reclamation in the 1980s, we focused on mangrove changes in the western Lingding Bay in this paper.
Qi’ao Island (site D), located in the southern part of the upper Lingding Bay, is affiliated to Zhuhai, Guangdong Province. The mangrove forest in this site has been strictly protected and restored after the nature reserve was established in the year 1999. In 2002, 2008, and 2013, S. apetala was transplanted stepwise on the tidal flat (An et al., 2015).
Futian Nature Reserve (site E), Shenzhen, is located at the northern side of the Shenzhen River’s outlet. This nature reserve was established in 1984 and approved to be the second national Nature Reserve of mangroves in 1988. Afforestation has been conducted since 2000 in this site.
Mai Po Nature Reserve (site F), Hong Kong, is located at the southern side of the Shenzhen River’s outlet. It has been protected by the World Wide Fund for Nature Hong Kong (WWFHK) since 1983 and was added to a Wetland of International Importance under the Ramsar Convention in 1995 (Jia et al., 2016). The whole Mai Po Nature Reserve is closed for the public, to obtain a strict protection of birds and the related wetland habitats. Vegetations mainly include mangrove and saltmarsh.
Data Acquisition
To investigate the mangrove forest distribution and quantify its dynamics, multiple sources of RS images from 1987 to 2018 were used in the interpretation (20 images in total, see Supplementary Table 1). Images taken before 2018 were obtained from Thematic Mapper (TM) and Enhanced Thematic Mapper (ETM+) scenes collected from Landsat 5 (resolution: 30 m), and images from 2018 were obtained from Sentinel-2 (resolution: 20 m). The images were downloaded freely from the European Space Agency1 and the United States Geological Survey (USGS2). Sentinel-2, with a state-of-the-art sensor of 13 spectral bands and a 2∼5 days re-entry cycle, makes it possible to capture detailed spatiotemporal changes in a vegetation community (Drusch et al., 2012; Valderrama-Landeros et al., 2020). Images acquired in 1987–1990, 1999–2000, 2009–2010, and 2018 were used for the years 1990, 2000, 2010, and 2018, respectively, for high cloud coverage of some images (Supplementary Table 1). Since estuarine mangroves are located along the coasts, a buffer with both seaward and landward distance of 10 km based on the shoreline of GBA was generated to clip the satellite images. Classification, statistics, and analysis in this study were all conducted within this buffer.
Interpretation Method
Remote sensing and geographic information systems technologies have become more and more widely applied as key tools for large-scale vegetation monitoring (Giri et al., 2007; Jia et al., 2016; Son et al., 2016; Zhu et al., 2017). Development of RS sensors (e.g., multi-spectral and panchromatic images) and classification algorithms [from traditional maximum likelihood or decision tree classifiers to machine learning like random forest (RF) classification method] have led to an improvement of the precision of vegetation classification at a large scale [reviewed by Kuenzer et al. (2011) and Wang et al. (2019)]. In this study, the classification of 2018 was based on the Sentinel-2 images via the RF algorithm (Breiman, 2001; Akar and Gungor, 2012; Khatami et al., 2016; Zhao and Tang, 2016; Tian et al., 2020), while the classifications of the years 1990, 2000, and 2010 were based on the Landsat TM/ETM + images via visual classification and manually delineating, with the false color band composition using Near Infrared Red, Red, and Green.
For the 2018 classification, we first checked different images throughout the year to find the best season for mangrove identification. Images taken in March with cloud coverage of less than 1%, were selected for the 2018 mangrove extraction. The training sets of saltmarsh, mangrove, tidal flat, built-up area, and water area were selected from Futian nature reserve, Shenzhen City. The 1–12 band in the Sentinel-2 image of 21st March was used as the input feature, and the RF algorithm was used to train and obtain the classification model (Supplementary Table 1). The classification map involves saltmarsh (code 10), mangrove (code 200), tidal flat (code 300), water (code 400, including the rivers, lakes, and ponds), built-up area (code 500), and others (code 600, including forests and other unclassified types). Training areas were selected from typical mangrove patches scattered in the study area, including 19 mangrove patches, nine water patches, six tidal flat patches, 15 built-up patches, two saltmarsh patches, nine other coastal vegetation patches and 17 cloud-covered patches areas. The trained classification RF model in Futian Region was consequently applied in the whole study area using the images on the same date with the same bands. The interpretation mapping method was used at the last step to revise all these unideal classification results. The interpretation mapping standard adopts the 1:100,000 land use RS mapping standard of the Chinese Academy of Sciences, and finally completes RS mapping of the current mangrove wetland status in 2018.
Interpretation of Land-Cover Type Transformation and Gained Mangrove From HA or NE
The mangrove-related land use transformation during 2010–2018, 2000–2010, and 1990–2000 were detected using a 6-digit dynamic code. The first 3-digit code indicates the information of the land-cover type of the earlier year, and the latter 3-digit code indicates that of the later year. The dynamic code has an advantage in identifying some uncertainties in the process of visual interpretation (Zhang et al., 2014). For example, the 6-digit dynamic code “300200” records a tidal flat type patch being transformed to mangrove type, indicating the recovery of mangroves on bare mudflats. For example, in order to distinguish the influence of natural factors and human activities on mangrove-related land-cover transformation, the water area type was extended into subtypes of rivers, lakes, and ponds with the codes of 200410, 200420, and 200430, respectively. The maps of land-cover type shared the common boundaries of patches in the maps of adjacent years, making it possible to track and quantify the mangrove-related land type transformation.
Patches of mangrove gained by HA or NE were distinguished based on local policies of mangrove management (Jia et al., 2016) and the detailed records of historical field survey during July 2012 to October 2014 in GBA mangrove forest, including coordinates, mangrove species, ages, density, and other plant characters (Peng et al., 2016b). New patches of exotic species S. apetala, were recognized as gained from HA. For nature reserve sites, site E (the core area) and site F, the policy of strictly banning exotic species indicates that the newly mangrove patch is gained from NE only. In sites B and C, the planned HA can be traced by the usually clear edge, regular shape (strips or rectangles), and large size (short edge scale > 60 m).
Classification Accuracy Assessment
Ground validation samples selected from field surveys (July 2012 to October 2014, see Peng et al., 2016b) and high-resolution images in Google Earth were used to verify the classification results (Estoque et al., 2018; Jia et al., 2018; Ma et al., 2019). The sampled land cover types resulting from the classification in 2018 were transformed into KML format and were imported into Google Earth (Figure 2). The resulting confusion matrix contains all the information about the relationship between the classification results and the reference map. Then, the overall accuracy, users’ accuracy, producers’ accuracy, and Kappa coefficient were calculated from the confusion matrix. These four indices were used to describe the quality of the classification result (Supplementary Table 2). Specifically, the overall accuracy of the classification of the year 2018 is 97.24% with a Kappa coefficient of 95.85% (Supplementary Table 2).
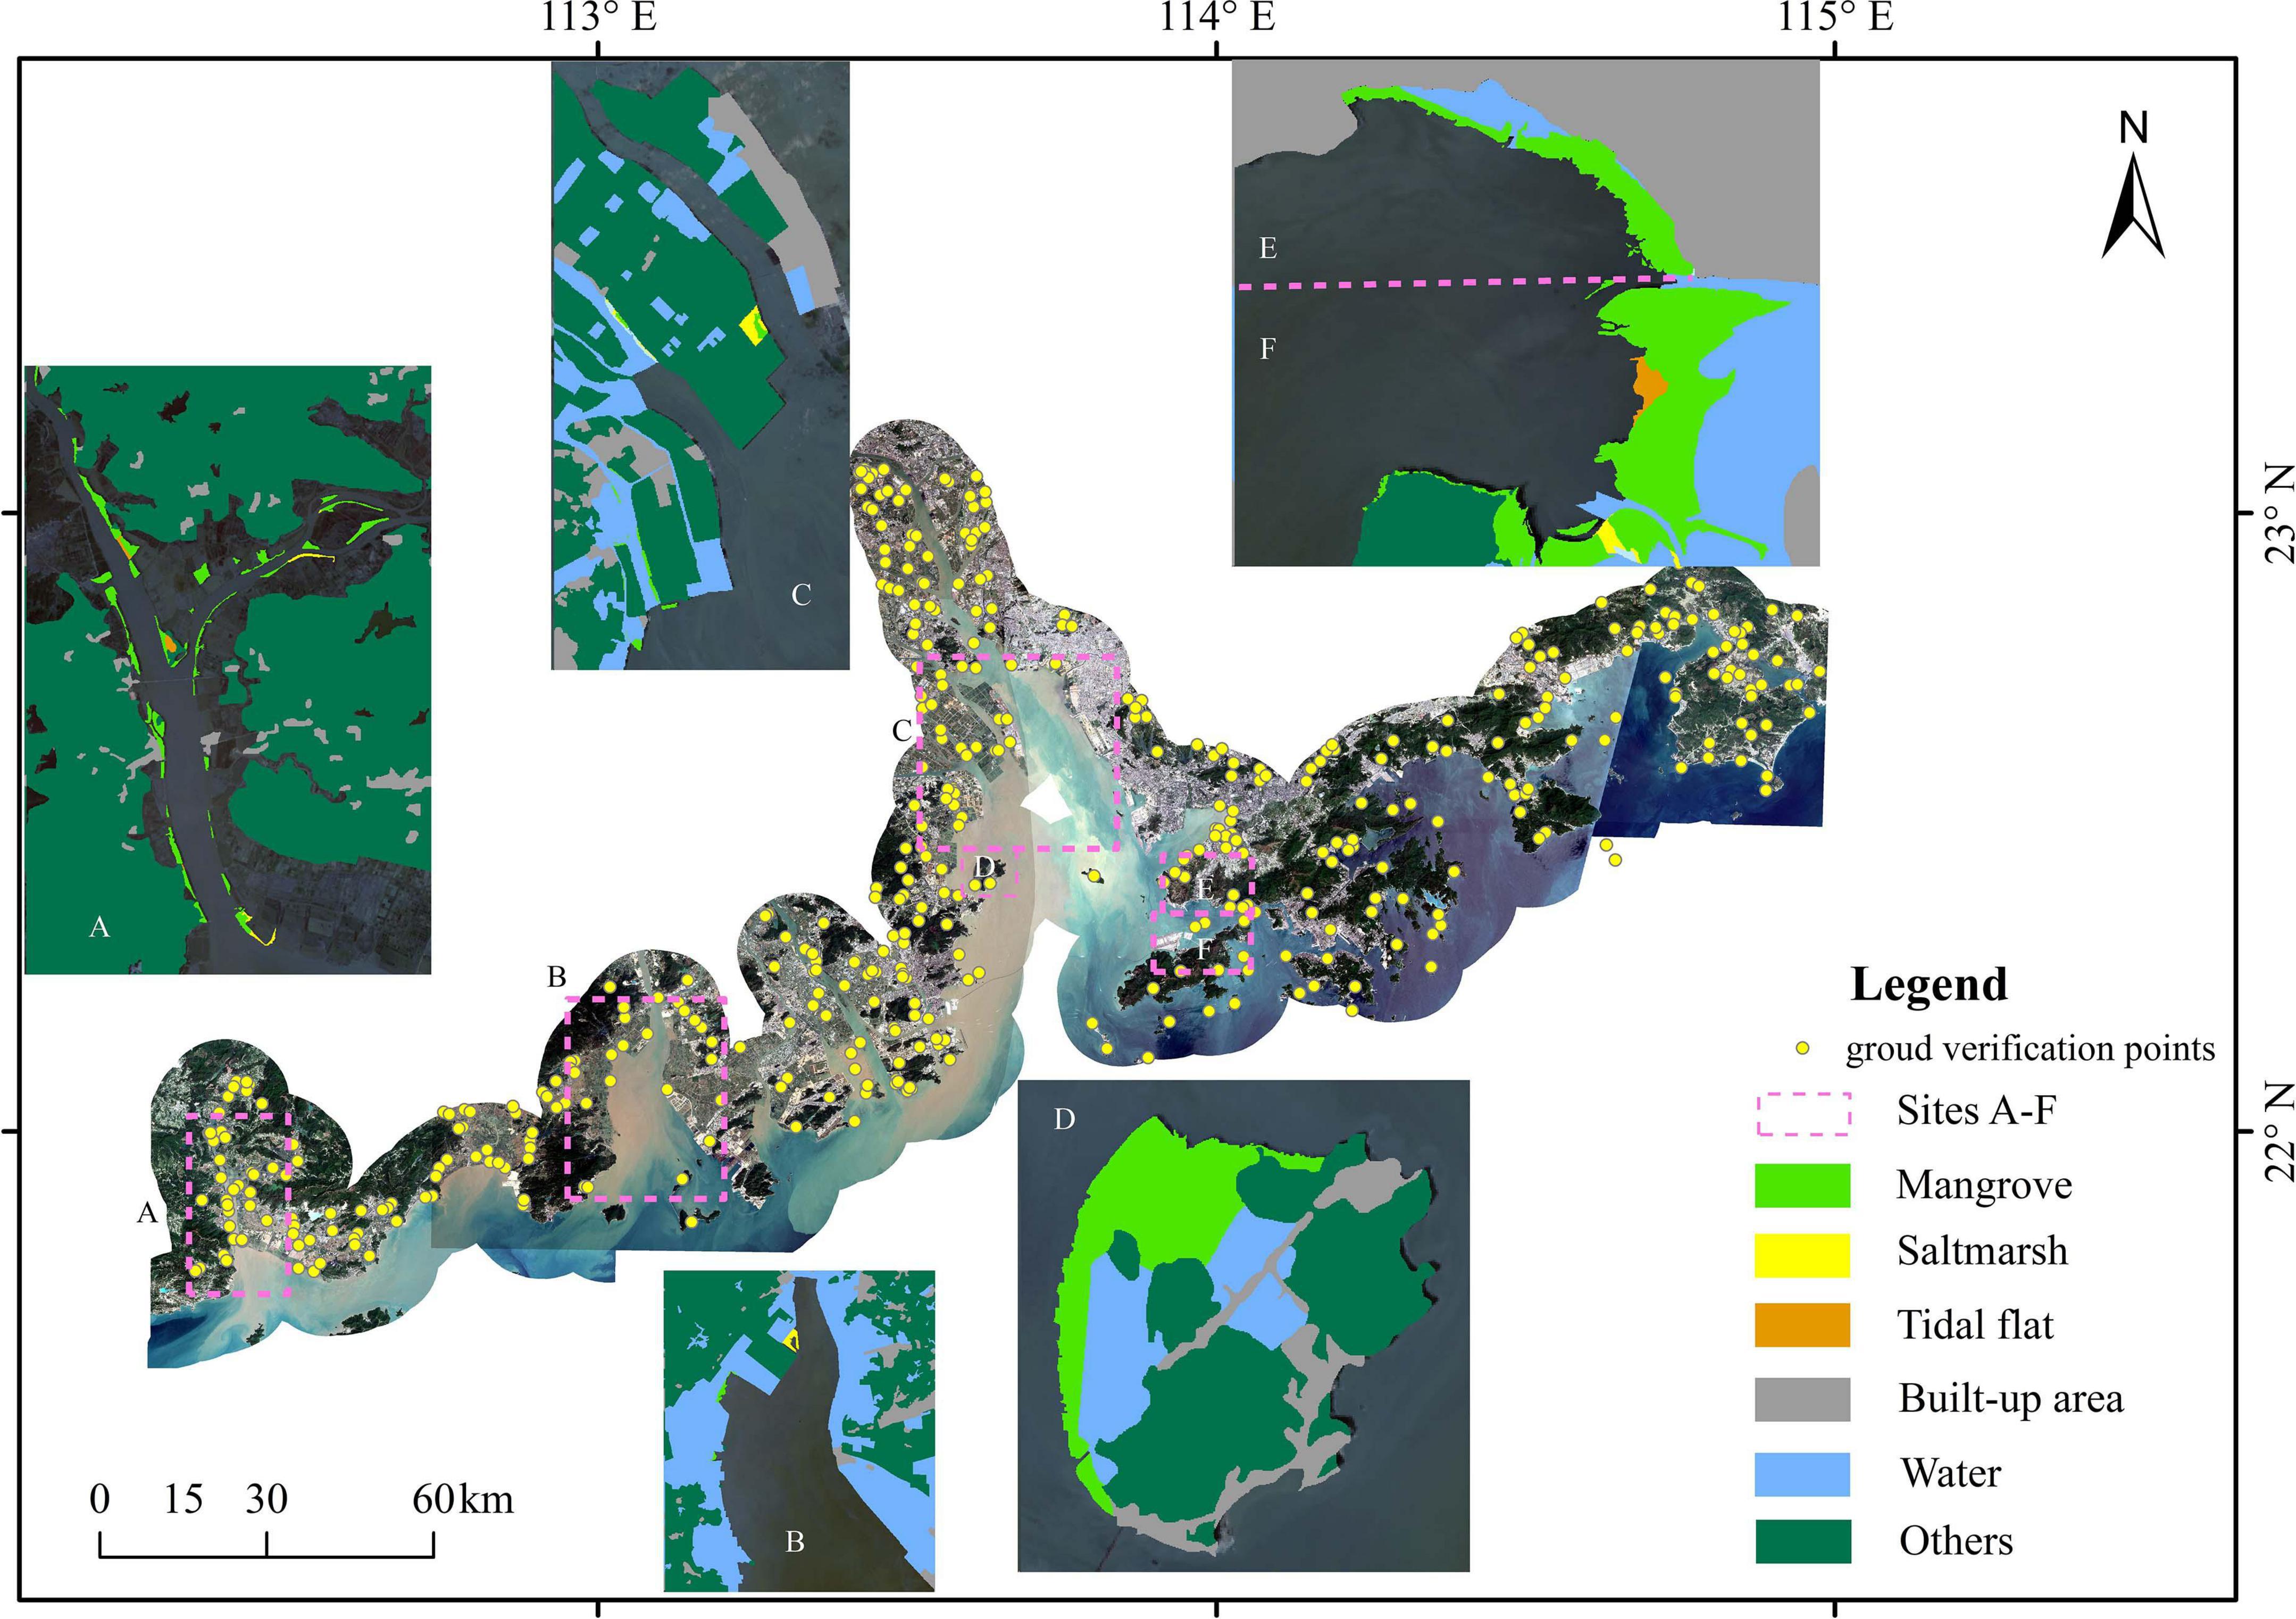
Figure 2. Satellite images covering the study area in 2018, clipped with a 10 km buffer of shoreline. The subplots are the classification results by the Random Forest algorithm of sites A-F.
Results
Overall Land Cover Changes in the GBA
The total area of mangrove decreased during 1990–2000 and increased during 2000–2018 (Table 1). During the 1990s, gained mangrove area was 3.4 km2, and the net change of mangrove area was −4.6 km2 (Figure 3C). The total area of mangrove decreased to 6.9 km2 in 2000, and then it rebounded to 13.0 km2 in 2010 and kept increasing to 18.3 km2 by 2018. The total mangrove area had a net increase of 6.8 km2 (59%) during 1990–2018. The red bars in Figure 3 indicate that the loss of mangrove area mainly occurred in the 1990s (8.0 km2) and few in the 2000s and 2010s (less than 0.4 km2). A sharp increase has occurred since the 2000s. The net change of the mangrove area during the 2000s (6.1 km2) and the 2010s (5.3 km2) were comparable (Figures 3F,I).
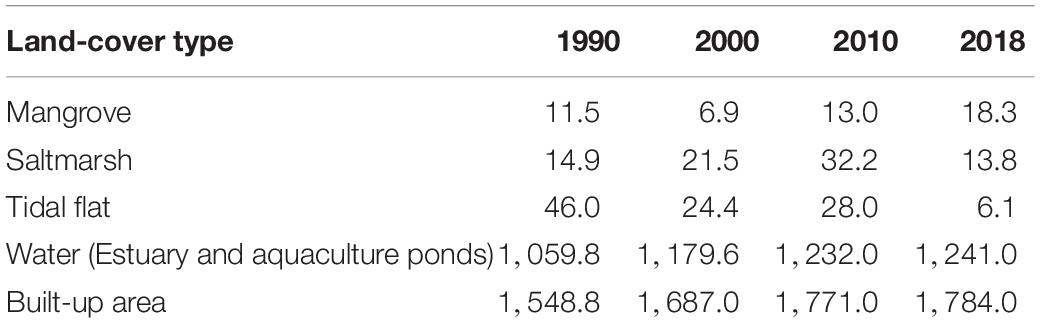
Table 1. Temporal variation of land-type areas (km2) within the 10 km coastal buffer in the GBA.
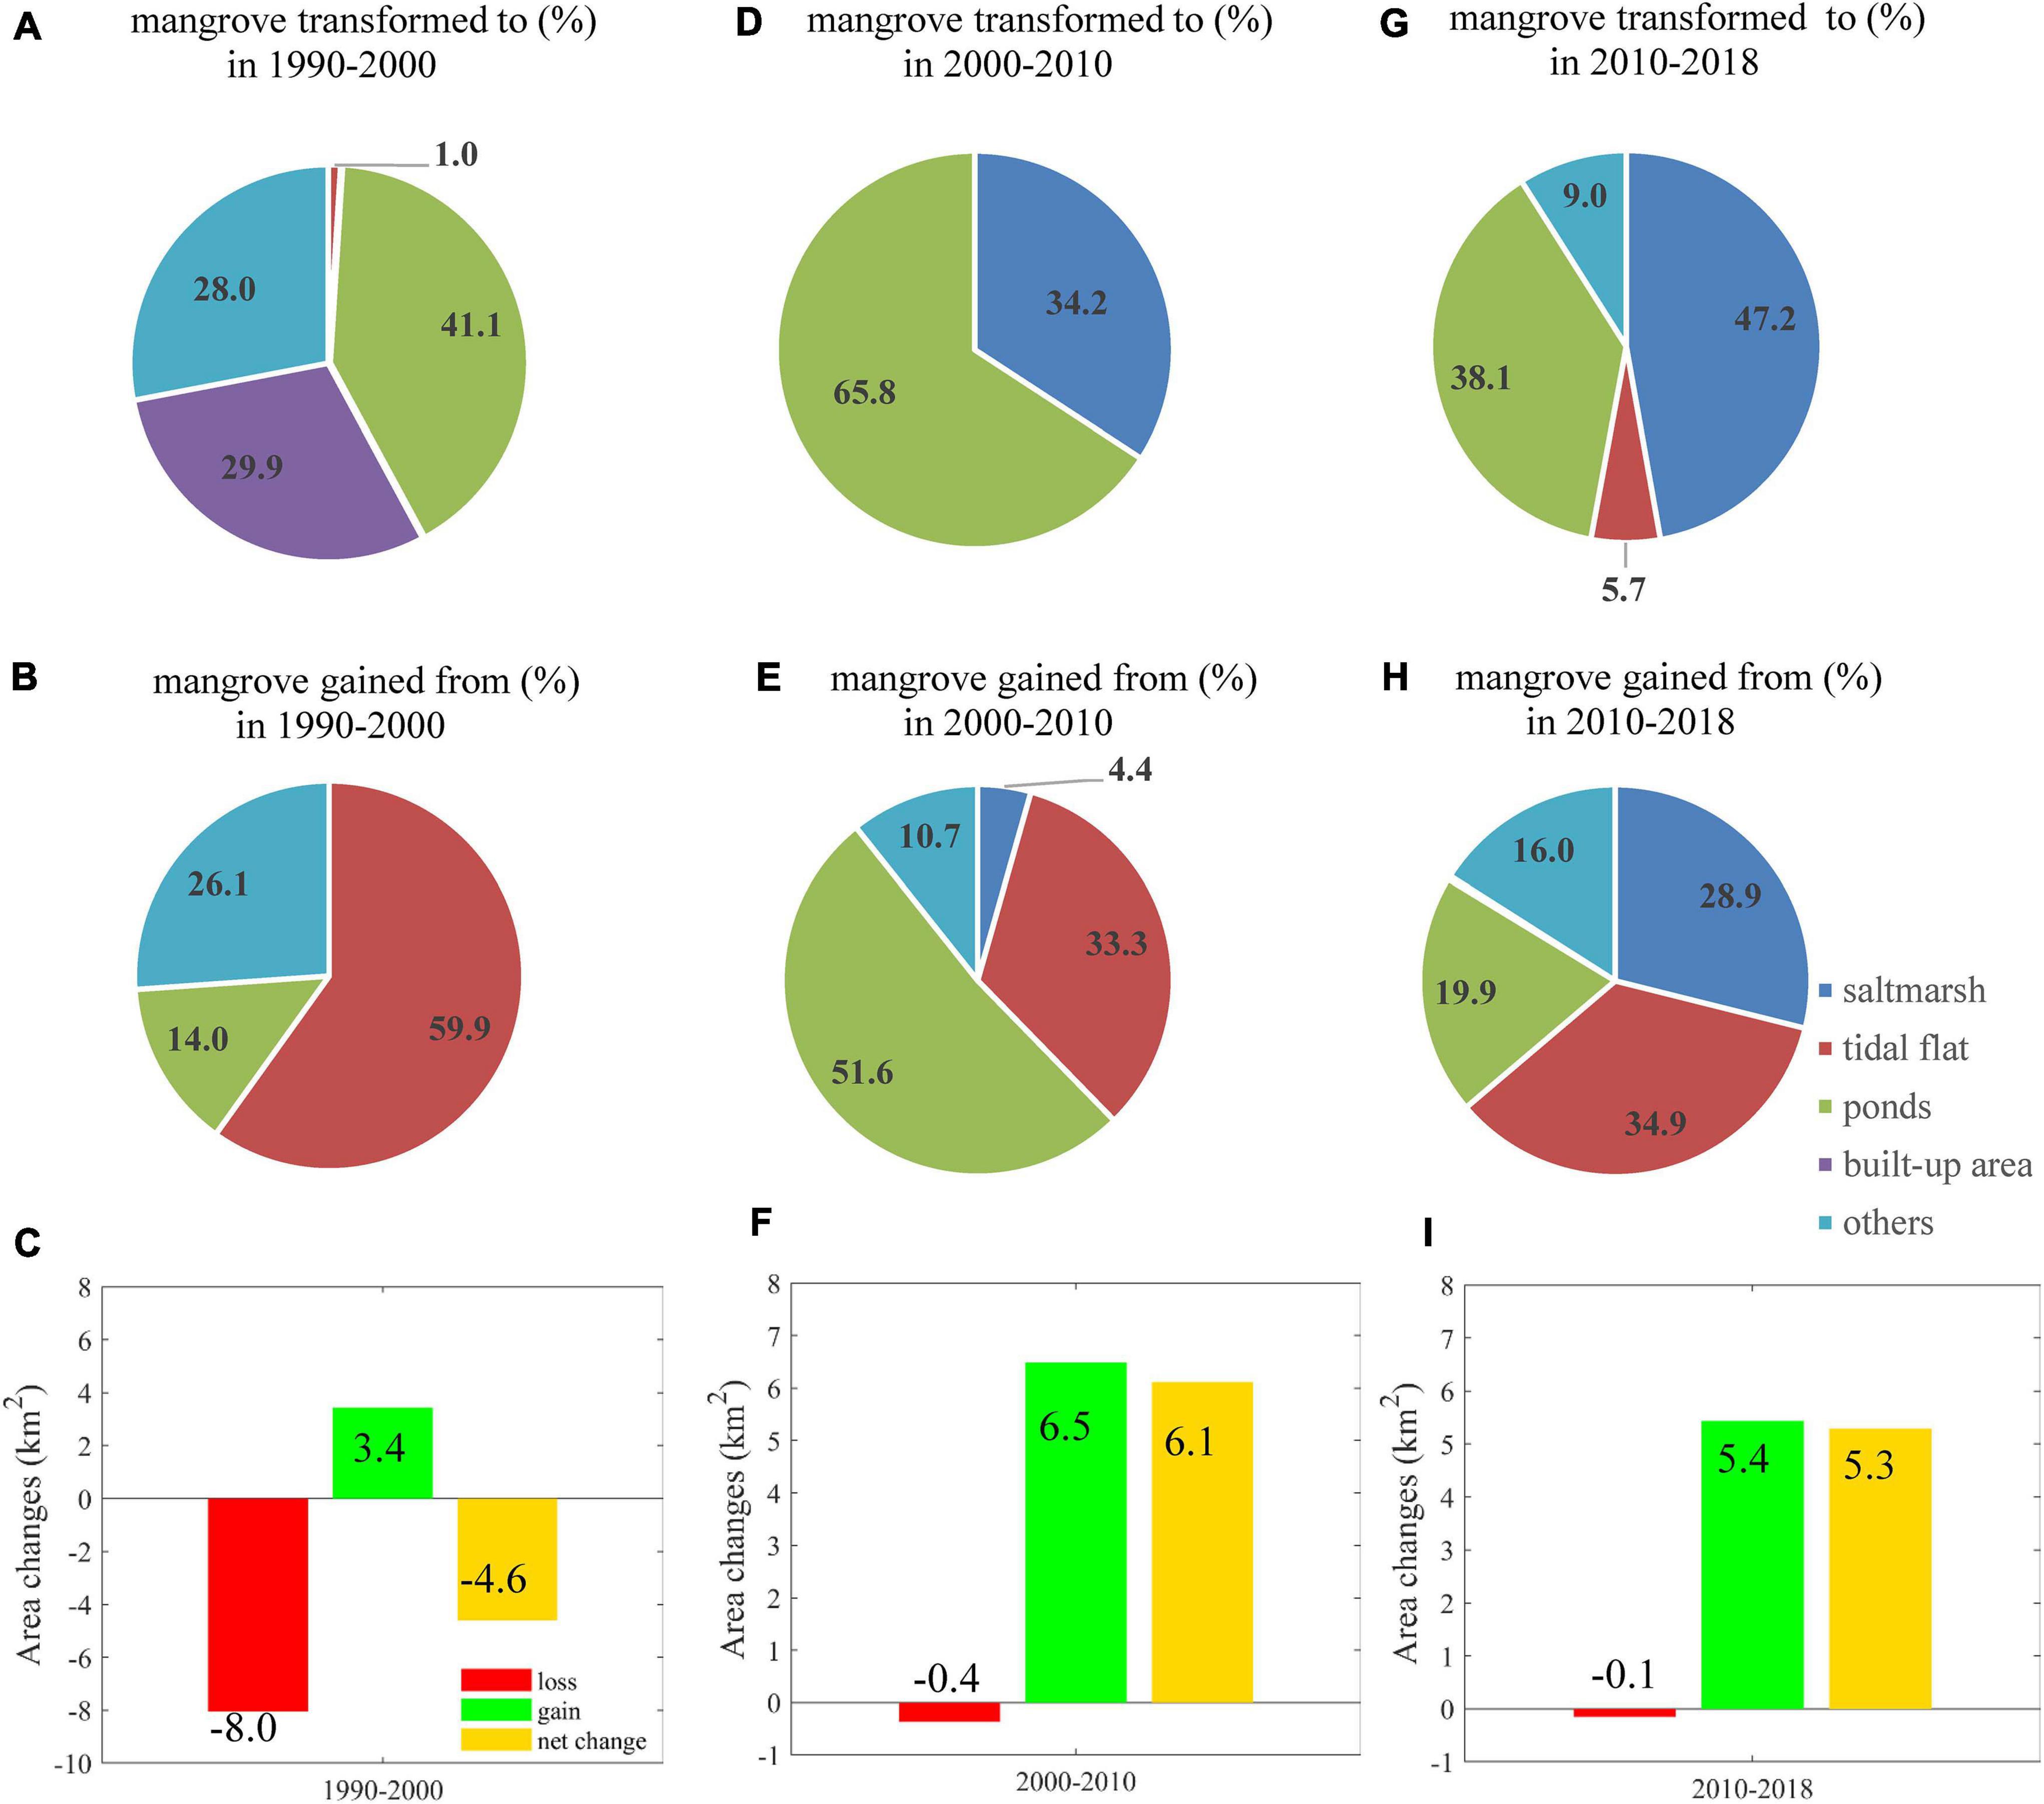
Figure 3. Changes in proportions (%) and areas (km2) of mangrove during 1990–2000, 2000–2010, and 2010–2018. Proportions of mangrove transformed to other land-use types are in panel (A) 1990–2000, panel (D) 2000–2010, and panel (G) 2010–2018. Subplots in panels (B,E,H) show the proportions of mangrove gain from other land-use types in 1990–2000, 2000–2010, and 2010–2018, respectively. The net changes of mangrove area during three periods were plotted in panels (C,F,I). Mangrove area gains and losses are corresponding with the locations mangrove transformation modes shown in Table 3 and Figure 4.
In addition to mangroves, saltmarsh areas were also summarized. The saltmarsh area increased during 1990–2010 (from 14.9 km2 to 32.2 km2) and decreased onward (Table 1). Estuarine saltmarsh and mangrove in the year 1990 accounted for 56.5% (14.9 km2) and 43.5% (11.5 km2) of the total intertidal vegetation area, respectively. The area of saltmarsh became less than that of mangrove in 2018, indicating the domination of mangrove among the coastal and estuarine vegetation ecosystems recently. The area of tidal flats fluctuated in the study period and reached a minimum in 2018 (Table 1). In contrast, the built-up area kept increasing from 1,548.8 km2 (in 1990) to 1,784.0 km2 (in 2018) and was approximately 50-fold more than that of coastal habitat (38.2 km2) involving saltmarsh, mangrove, and tidal mudflat in 2018.
Mangrove Distribution at Each Site and Nature Reserves
The percentage of mangrove area in the sites A-F to the total estuary mangrove area in GBA increased from 69.6% in 1990 to 95.5% in 2018 (Table 2). Mangrove in sites A-F contributed more than 95% since 2000, indicating mangrove aggregation in these focused sites. The mangrove area in sites A and B had experienced a decreasing trend during the 1990s, then increased during 2000–2018. The mangrove area in sites C, D, E, and F has increased continuously since 1990.
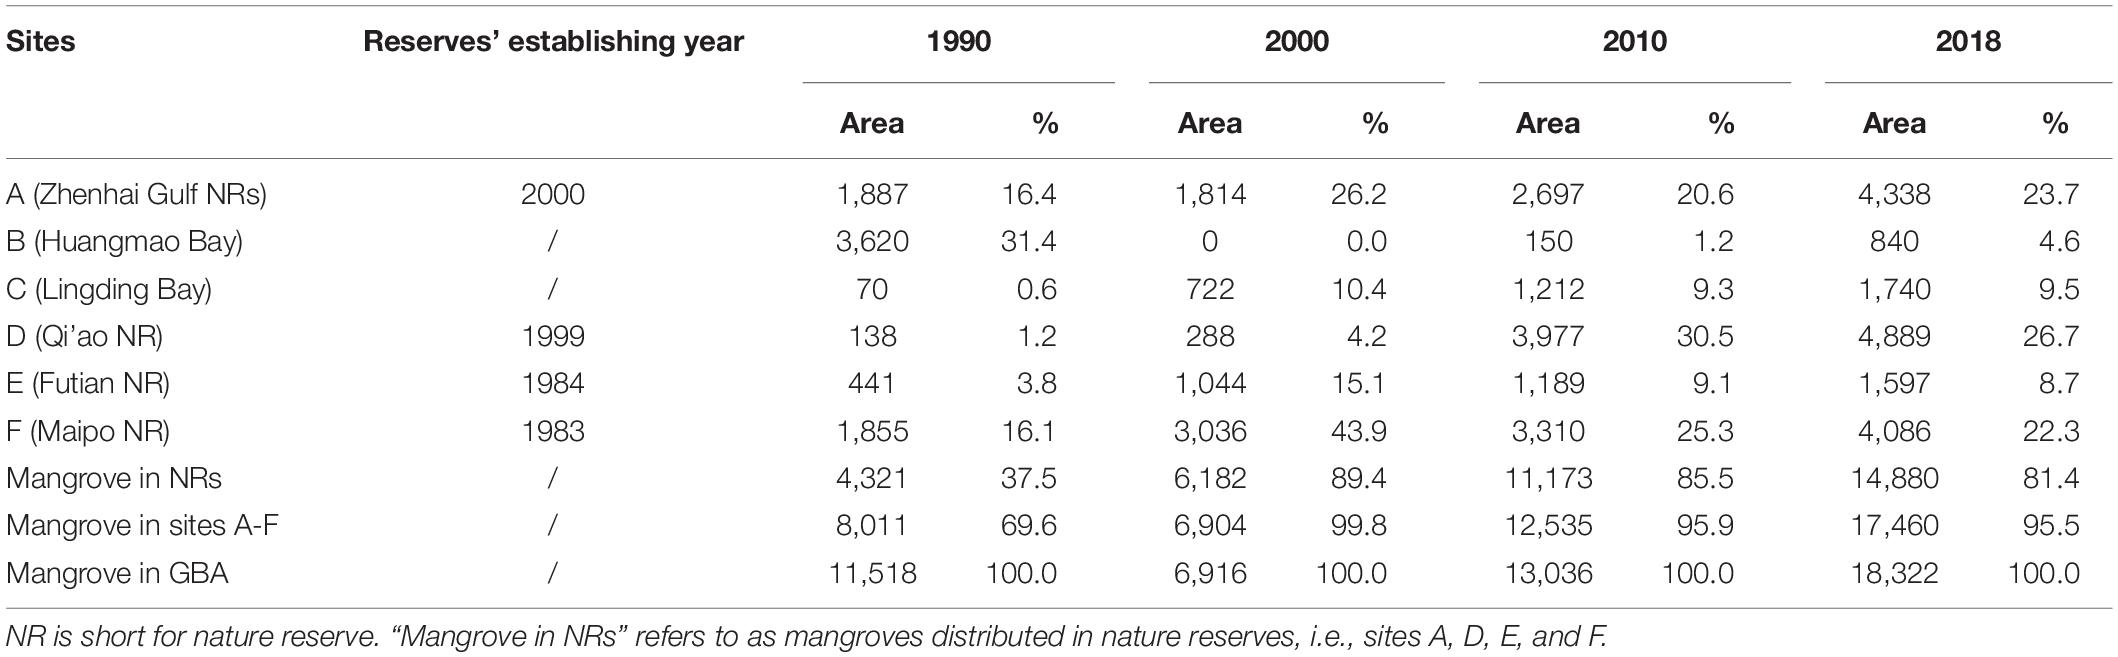
Table 2. Estuarine mangrove areas (ha) and proportion (%) for each site.
In the year 1990, the largest mangrove areas were present in sites A, B, and F (Table 2). The areas of mangrove in these three sites were 1,887 ha km2, 3,620 ha, and 1,855 ha in 1990, accounting for 16.4, 31.4, and 16.1% of the mangrove area in the GBA, respectively. Mangrove area in sites C and D is estimated at 218 ha only.
By 2000, the mangrove in site B had disappeared. Site F accounted for the majority of mangrove area among the GBA (Table 2). It contained 3,036 ha of mangrove, representing 43.9% of the total mangrove area. Site A still had the region’s second-largest mangrove, which was 1,814 ha and accounted for 26.2% of the total estuarine mangrove in 2000. The proportion of mangrove in nature reserves reached 89.4%.
In 2010, site D became the largest mangrove area. Mangroves were mainly in the sites A, D, and F (Table 2). The mangrove area in these three sites was 2,697, 3,977, and 3,310 ha, respectively, which represented 76.4% of the mangrove area in GBA.
By 2018, site D still has the largest mangrove area of 4,889 ha, which represented 26.7% of the total mangrove (Table 2). The second largest one was in site A, which is 4,338 ha and accounted for 23.7% of the total area. The rest was mainly distributed in Mai Po Nature Reserve (F), with an area of 4,086 ha that represented 22.3% of the total estuarine mangrove in GBA. The proportion of mangrove in nature reserves slightly decreased to 81.4%.
Transformation Between Mangrove and Other Land Cover Types
The stepwise changes of land-cover type, i.e., area and percentage, are shown in Figure 3. During 1990–2000, mangroves were mostly transformed to ponds (41.1%) and built-up area (29.9%) (Figure 3A). The lost mangroves were mainly changed to saltmarsh (34.2%) and ponds (65.8%) (Figure 3D). Besides, saltmarsh and tidal flat contributed 4.4 and 33.3% to mangrove gain (Figure 3E). During 2010–2018, the area of gained mangrove was 5.4 km2, and this was attributed to the transition from saltmarsh (28.9%), tidal flat (34.9%), and ponds (19.9%) and the other land cover types (Figures 3H,I). In general, mangrove loss was rare in the GBA and even negligible during the 2000s and 2010s (Figures 3F,I).
Figure 4 and Table 3 showed the location and areas of net changes in mangrove-related land-cover transformation in the whole study period (between 1990 and 2018), respectively. The stable mangrove between 1990 and 2018 is mainly scattered in sites A, E, and F (Figures 4A,D). The area of patches that transformed from mangroves to other land cover types was 799.1 ha, among which more than 60% of mangroves shifted to water and urban area. 90% of mangrove gained from tidal flat and aquaculture ponds (Table 3).
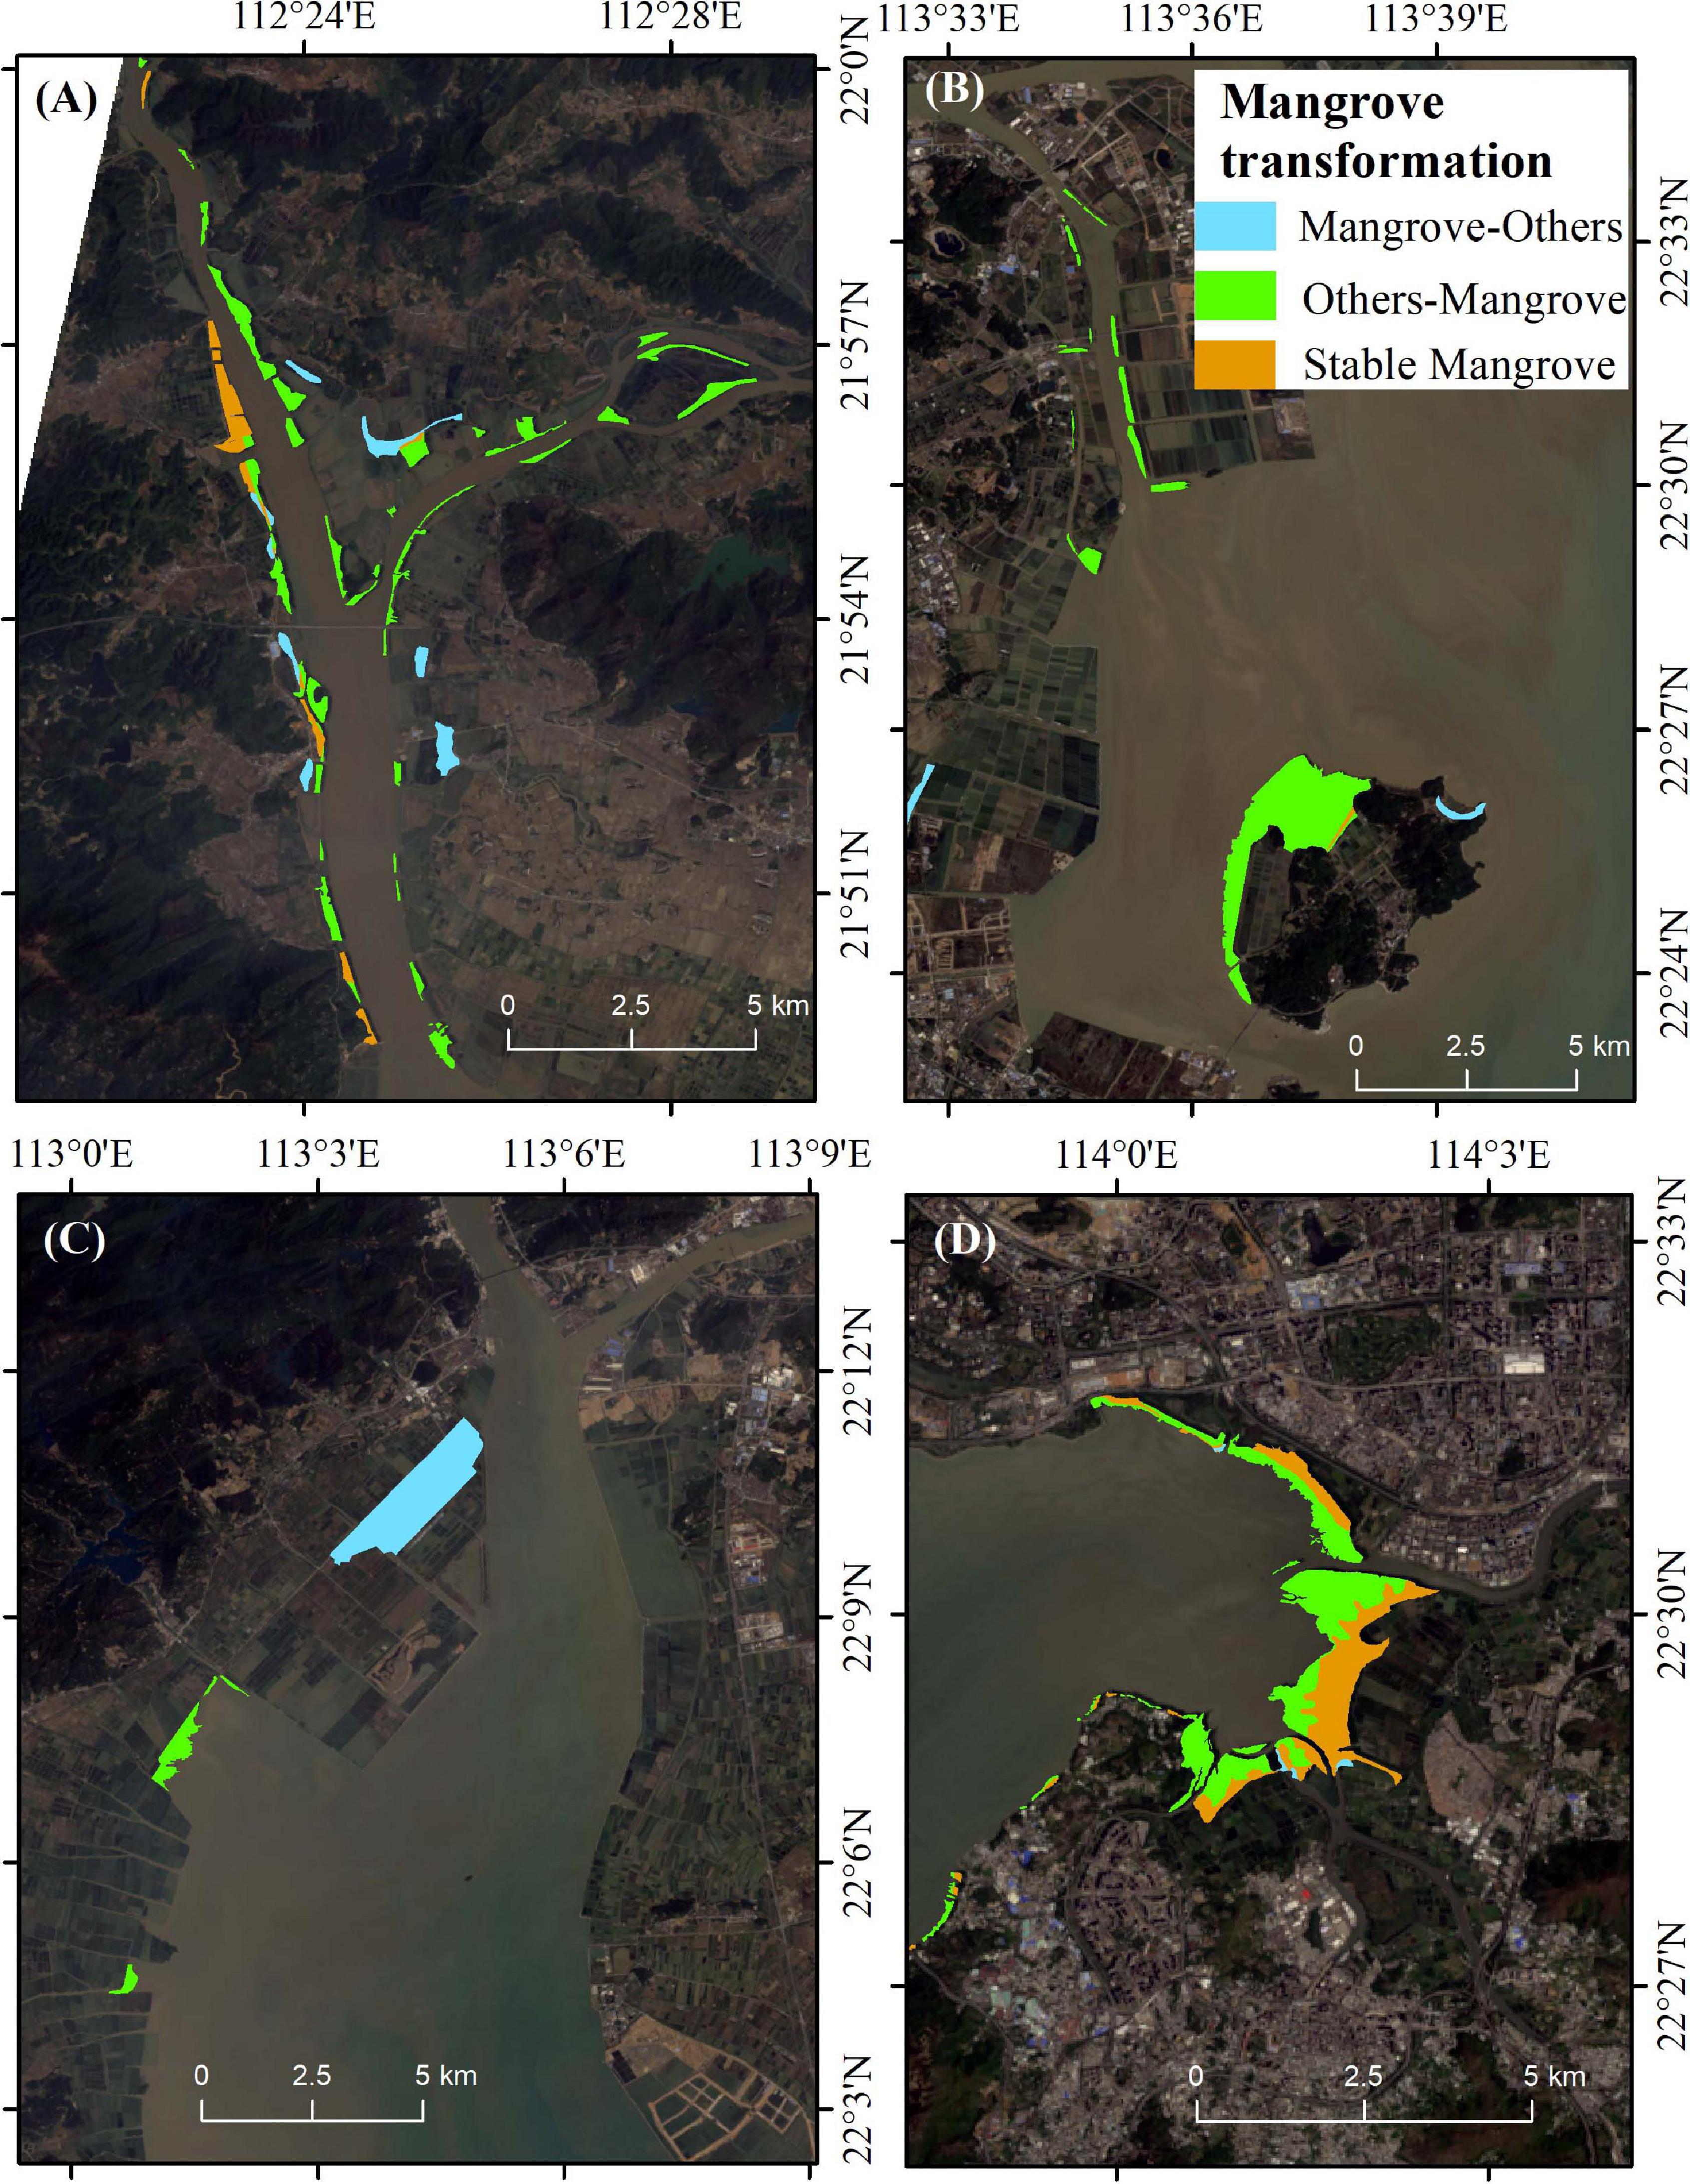
Figure 4. Distributions of three transformation modes of estuarine mangrove sites between 1990 and 2018. (A) Site A; (B) Sites C and D; (C) Site B; (D) Sites E and F.
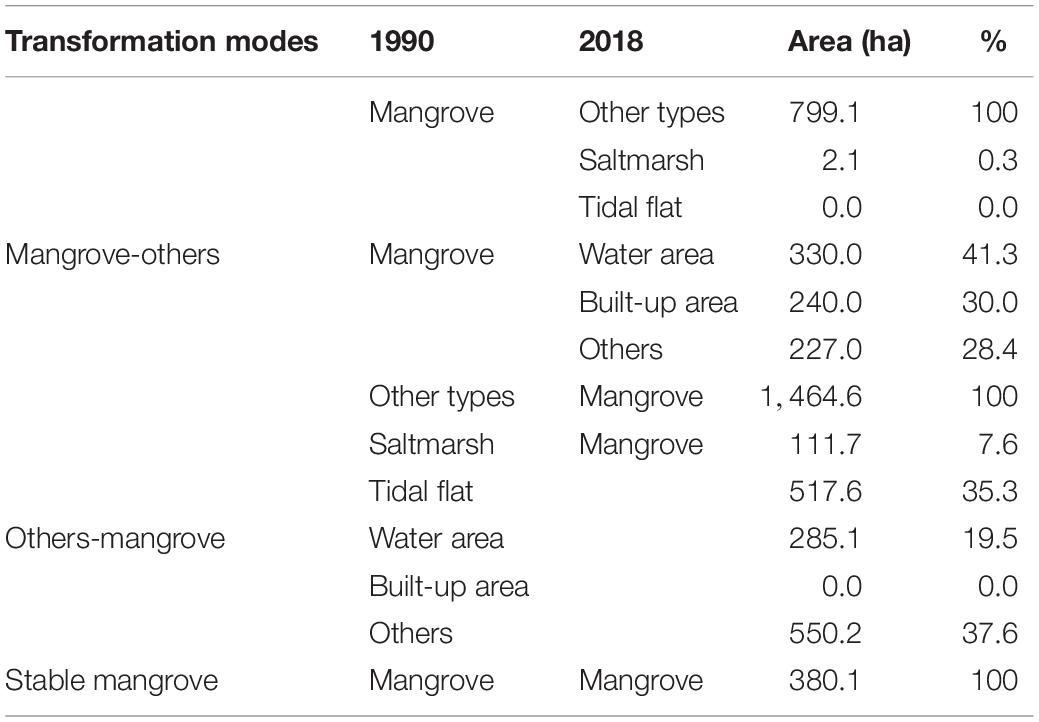
Table 3. Three transformation modes between mangrove and other types between 1990 and 2018.
The Contributions of Human Afforestation in Mangrove Area Recovery
In the study area, mangrove expansion mainly results from HA or NE. The area and proportions of these two ways of mangrove expansion are shown in Table 4. NE contributed 98.4% of mangrove expansion in the 1990s. The proportion of HA increased to 73.7% in the 2000s but decreased to 46.9% in the 2010s. In Futian Nature Reserve (site E), in the 1990s and 2010s, NE covered more than 80% of gained mangrove forest. While in the 2000s, HA accounts for the half of mangrove recovery (Table 4) and mostly at the seaward fringe during the 2000s (Figure 5B). While in the adjacent site F, NE contributes 100% since 1990. A similar pattern is observed in site A, where the mangrove gain by NE accounted for 90.3% in the 2010s (Figure 5A). In contrast, HA was the dominant ways of mangrove expansion in site D. As a result, site D was primarily covered by afforested mangroves (Figure 5C).
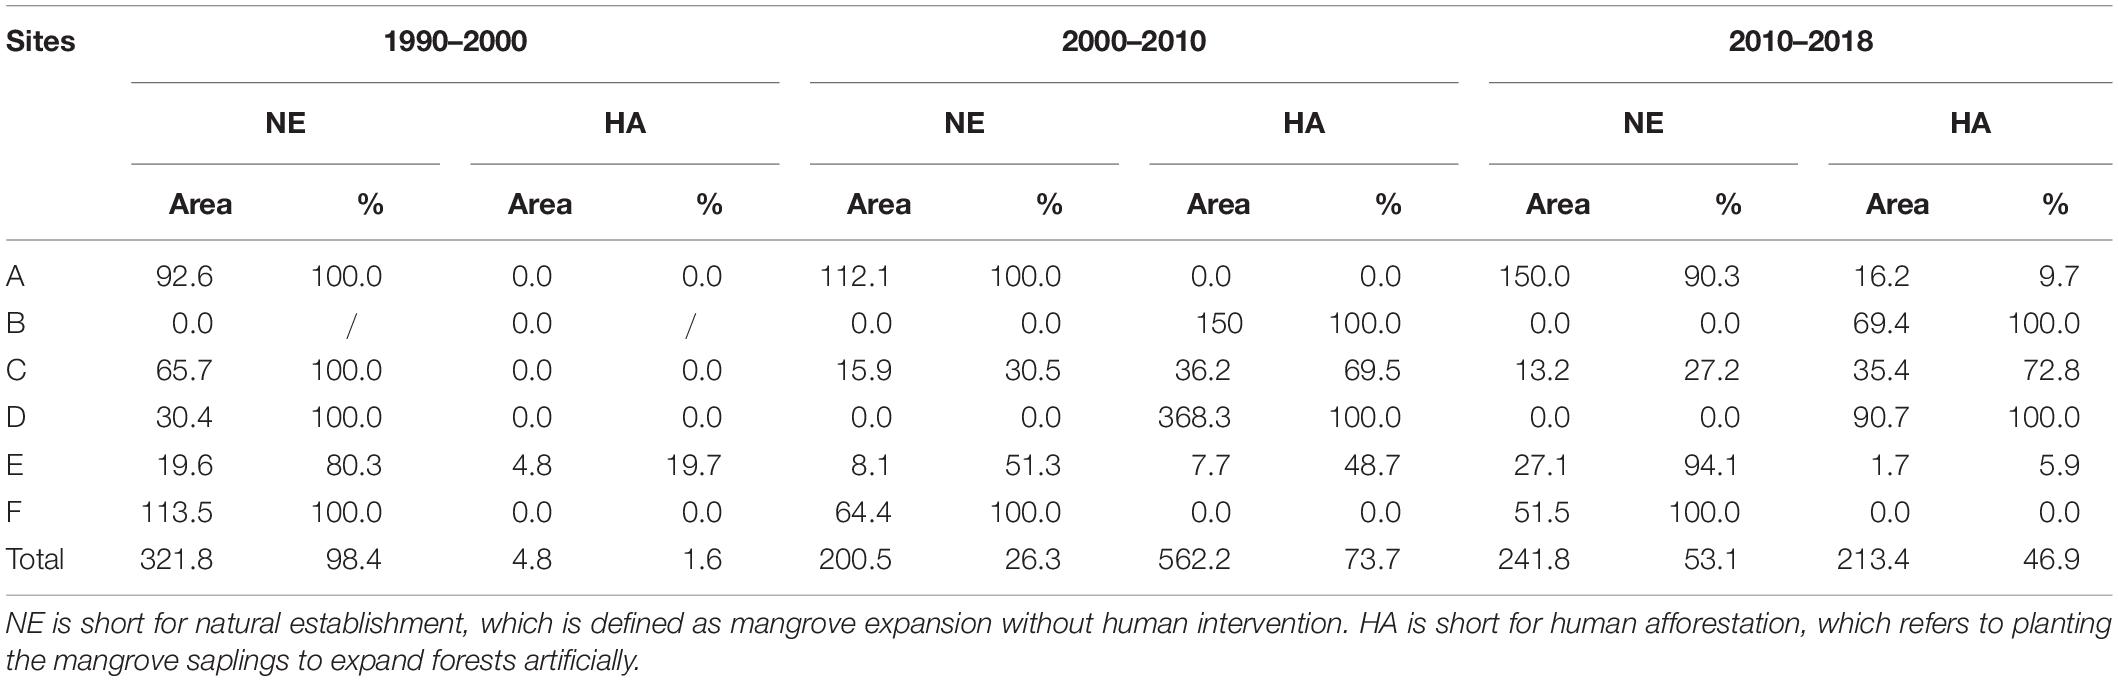
Table 4. Areas (ha) and proportion (%) of mangrove forest in newly gained (restored) mangrove during studied periods in sites A-F.
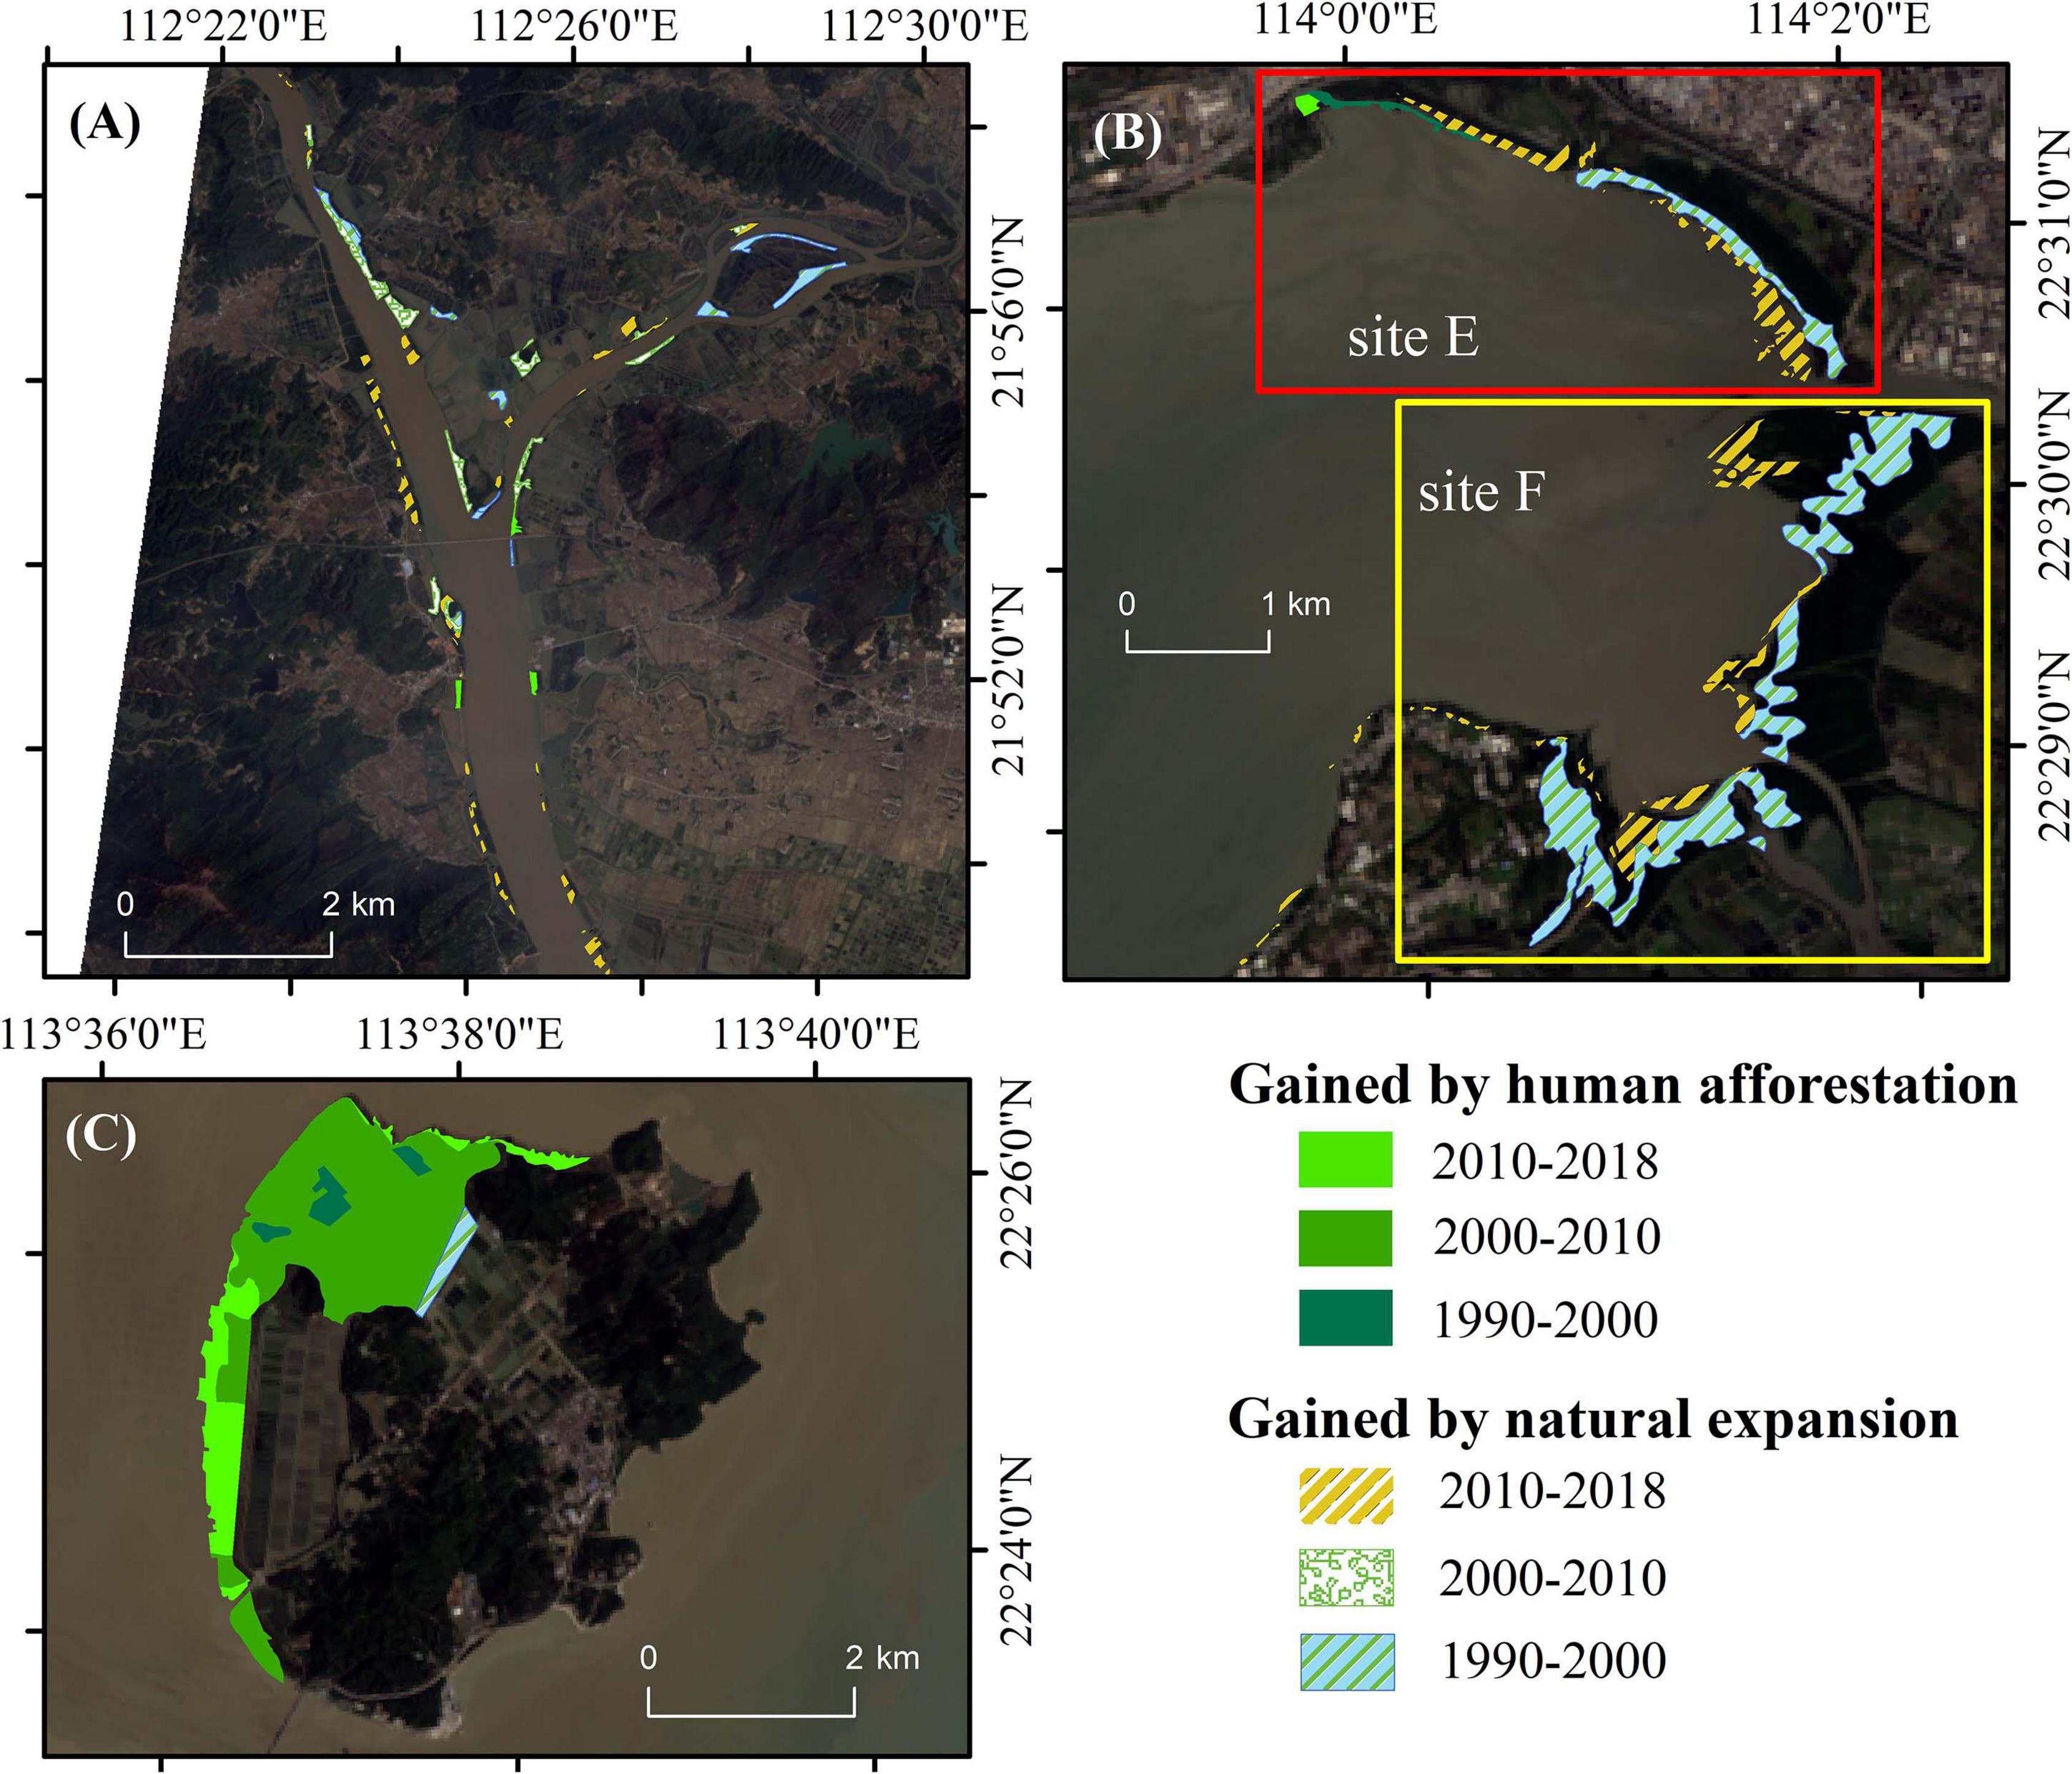
Figure 5. Spatial-temporal distribution of restored estuarine mangrove area at estuarine mangrove sites. The gained mangrove area by human afforestation and natural establishment are marked with solid and variegated patches, respectively. (A) site A, (B) site E and F; (C) site D.
Forecasting Mangrove Area Changes in the Future
To reveal how mangrove area may change in various management scenarios, four scenarios of future mangrove area changes were simulated as follows: (1) GBA loss rate: mangrove loss at a rate of −0.46 km2⋅y–1 (−4%⋅y–1), i.e., the rate of mangrove loss in 1990–2000 in GBA, which is much higher than the (2) global loss rate: 1.9%⋅y–1 in the 20th century (Friess et al., 2019); (3) current restoration rate including both HA and NE: mangrove gain at a rate of 0.64 km2⋅y–1, i.e., the increasing rate in GBA during 2000–2018; and (4) accelerated restoration rate: mangrove gain at a rate of 1.5 times the rate of scenario (3) (Figure 6). The theoretical maximal mangrove forest area (MAA) (58.4 km2) was calculated as the sum of the existing mangrove area (18.3 km2), tidal flat (6.1 km2), saltmarsh (13.8 km2), and aquaculture ponds (20.2 km2) in 2018. The assumption for the scenarios is that all tidal flat, saltmarsh and aquaculture areas would be theoretically suitable for HA and would all be colonized, irrespective of climate change effects (e.g., sea-level rise, sediment, and freshwater supply) and urban expansion. The results of these linear predictions show that, in scenario (1), all mangroves would disappear by 2060, if mangrove exploitation and degradation continued at the same rate as during the 1990s. Compared to scenario (1), mangrove loss at the global average rate in scenario (2) is reduced. Under scenarios (3) and (4), mangroves will cover all the theoretically suitable land for afforestation before the years of 2080 and 2060, respectively (Figure 6).
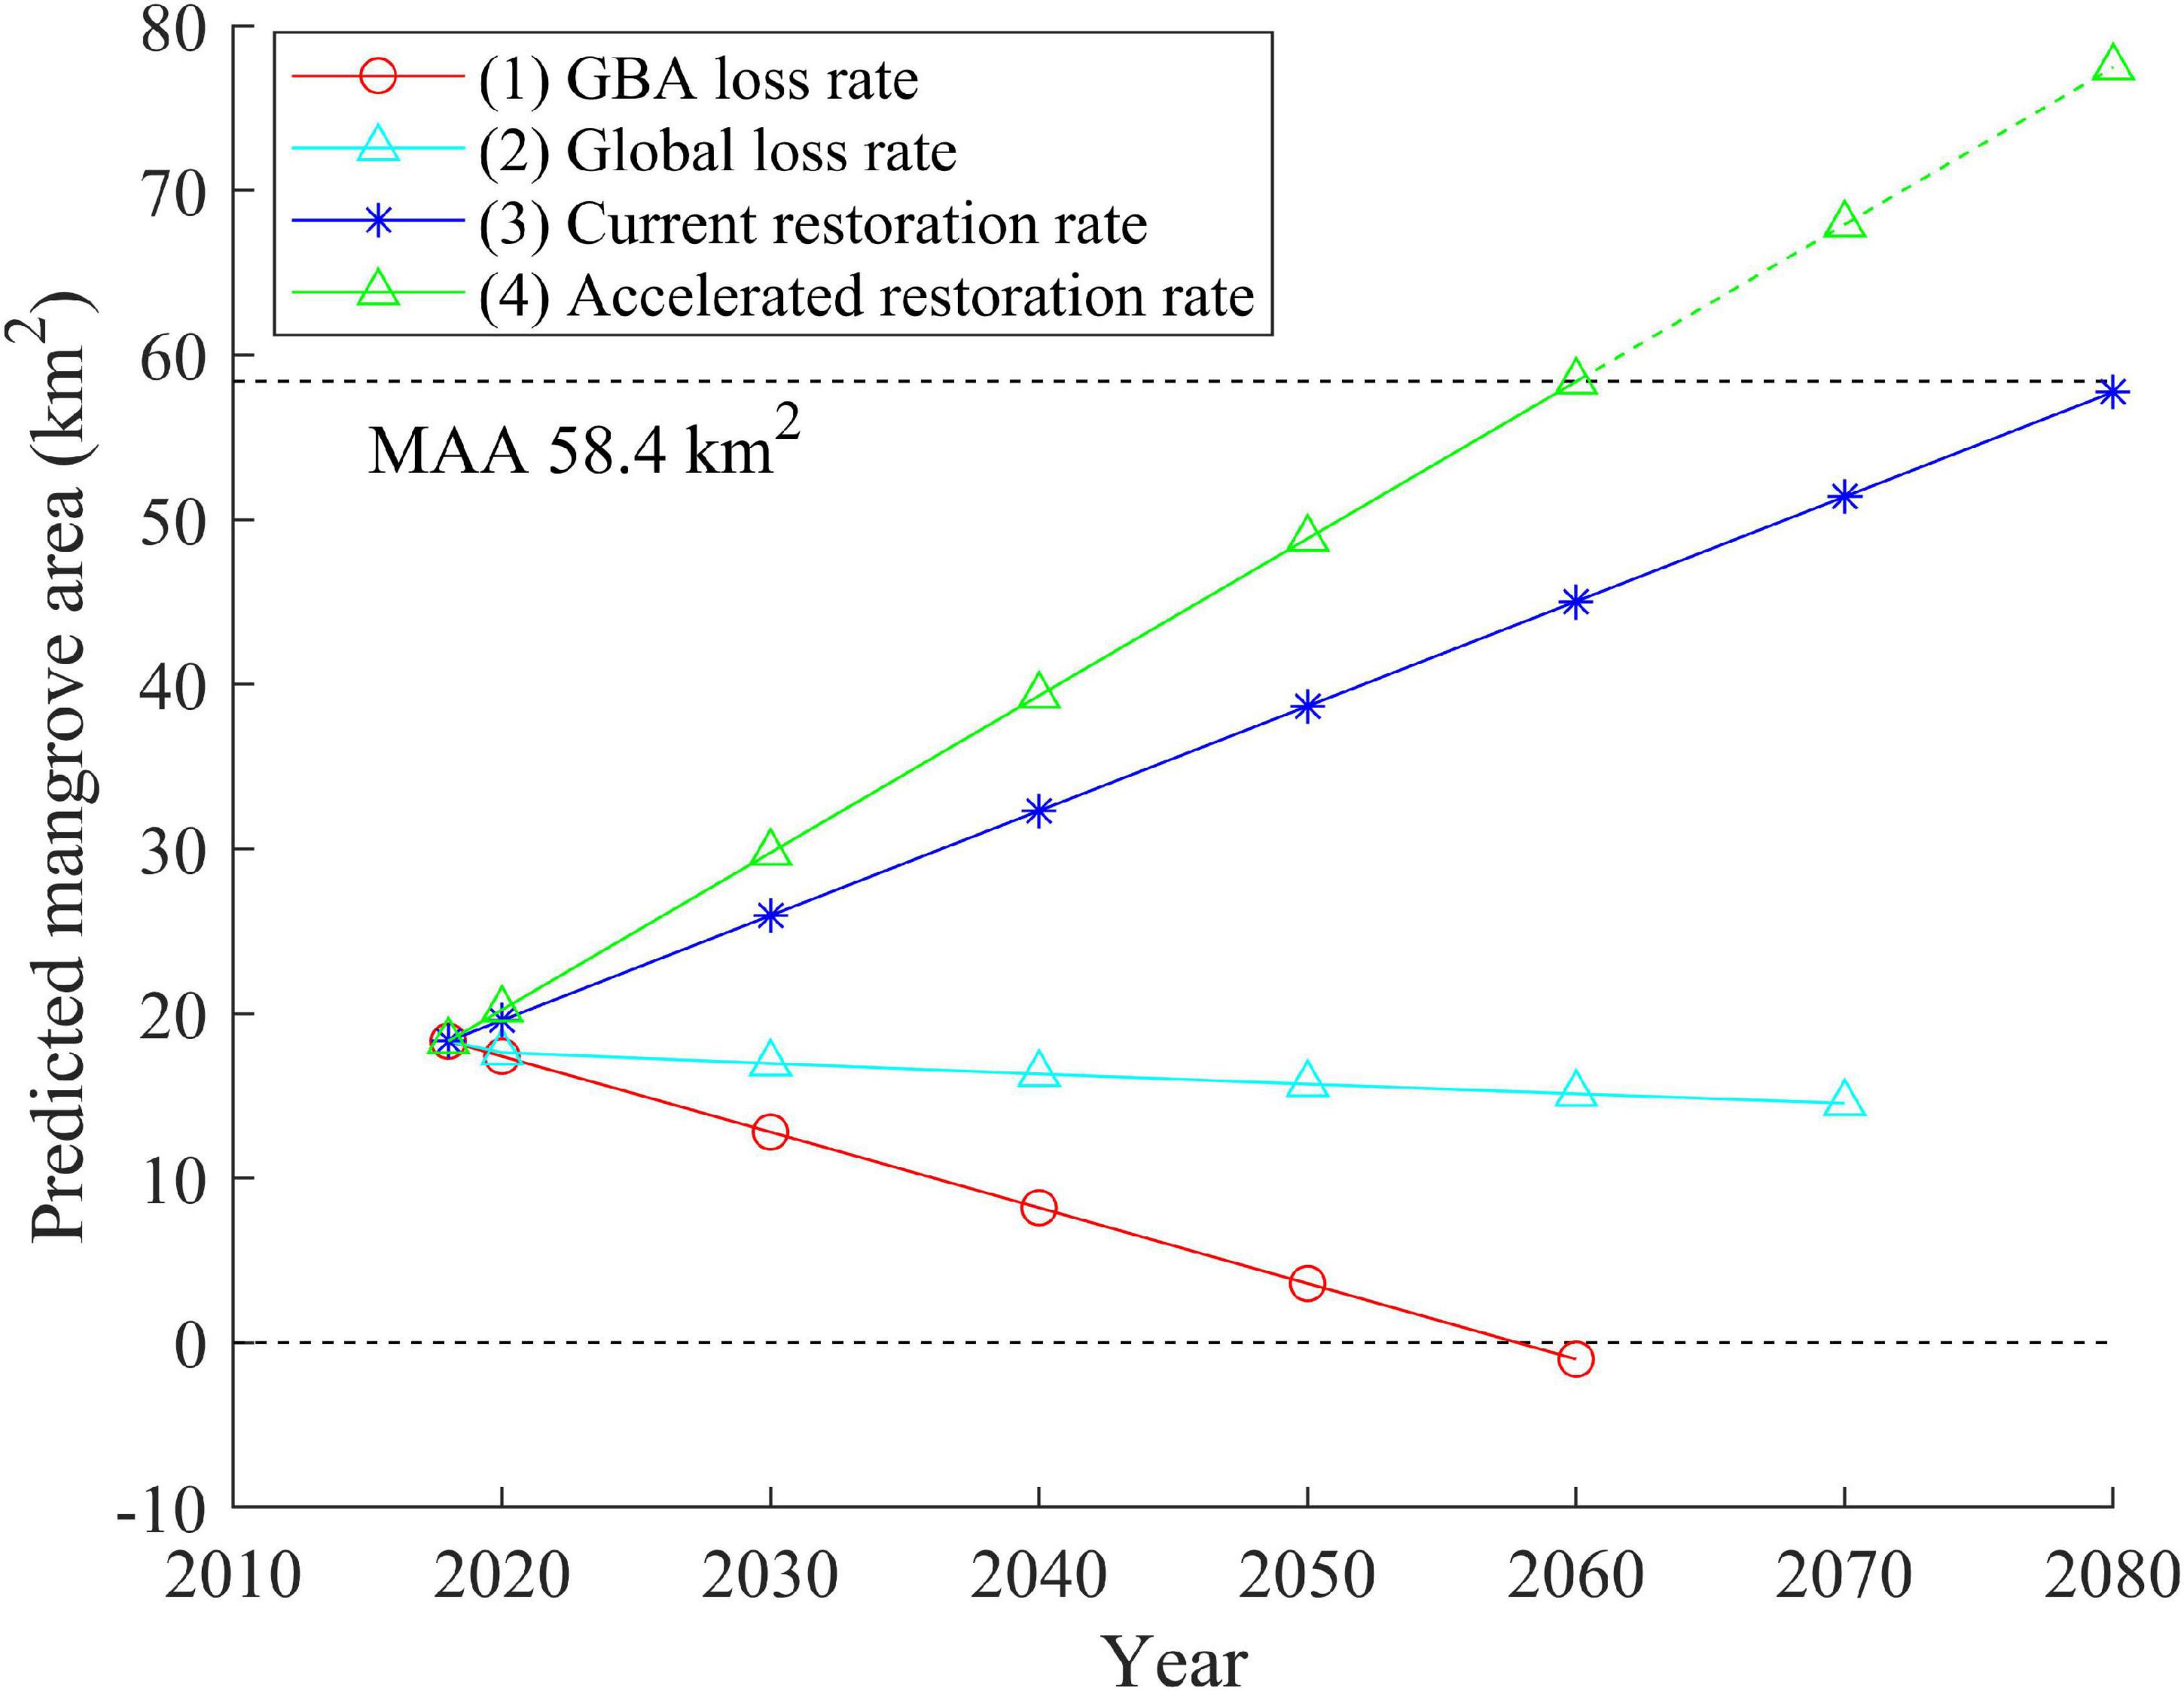
Figure 6. Prediction of mangrove dynamics under four scenarios: (1) mangrove loss in the rate as observed between 1990 and 2000 in this study; (2) mangrove loss in the global loss rate as observed in the 20th century; (3) mangrove restoration in the current rate including forests from both human afforestation and natural establishment; and (4) mangrove expansion in the accelerated restoration rate. The upper dashed line shows the maximal afforestation area (MAA = 58.4 km2), which is the sum of saltmarsh, tidal flat, and water areas in 2018.
Discussion
Spatio-Temporal Dynamics of Mangrove in the GBA Driven by Human Activities
This study showed that human activity has played a major role in both loss and gain of estuarine mangrove area in the GBA. On the one hand, large-scale mangrove areas were converted to aquaculture ponds and built-up areas for development during the 1990s. This finding is in accordance with previous observations that the armored coastline length of the PRD has gradually increased from 580.9 km in the 1980s to 744.9 km in 2017 due to the seaward land reclamation (Ai et al., 2019b), which caused a rapid mangrove loss (Wang et al., 2020). The reclamation intensity was relatively low before 1990, peaked in the 1990s, and then reduced after 2000 (Liu et al., 2017). Similar negative anthropogenic effects on ecosystems in other coastal cities in the world have been reported (Yeung, 2001; Lai et al., 2015). Their extent and intensity highly depend on urbanization (Ai et al., 2019b). Land reclamation and aquaculture transformed mangroves to built-up areas and ponds, respectively, suggesting the major direct causes of mangrove area reduction. Moreover, engineered seawalls were built for flood control along city shorelines, are commonly characterized by a steep slope. These seawalls were by far the dominant type of landward boundary for mangroves in China (Wang et al., 2020). These seawalls (hard engineering for coastal defense) have blocked landward mangrove migration directly and influencing the delivery and removal of mangrove propagules and organic matter by modifying the physical and biological processes indirectly (Critchley et al., 2021). Consequently, negative human activities, e.g., land reclamation and seawall constructions, have damaged mangrove forests and aggravated the vulnerability of inundation and die-back of mangroves from sea-level rise.
On the other hand, the positive human activities, e.g., protection and restoration measures, have halted and even reversed the trends of habitat loss. For example, the area of mangroves in the Guangdong Province increased since 2000, which is consistent with our result that the great majority (>80%) of estuarine mangrove areas occurs within nature reserves (Ma et al., 2019). As reported by Liu et al. (2016), the area of mangrove forest in site A has increased with 63.2 ha during 1999–2007, and gained 105.2 ha during 2007–2015, benefiting from two nature reserves established (in counties Taishan and Enping) in 2000 and 2005, respectively. Our results suggest mangrove has grown steadily in nature reserves (e.g., site A) compared to that in the sites without regulation (e.g., site B and C). Based on these facts, we found that habitat recovery in a region without strict protection and designed afforestation is much slower than that in the nature reserves. The protected mangrove area reached 67% of the total mangrove area in China (Wang et al., 2020), suggesting the increasing awareness of marine environmental issues in the last two decades. Positive and progressive anthropogenic efforts, like establishing nature reserves and concomitant afforestation, are efficient measures of mangrove habitat restoration benefiting the remaining coastal habitats that suffered from over-exploitation.
Uncertainties of Current Mangrove Restoration and Management
According to our results and previous studies (e.g., Ai et al., 2019a; Ma et al., 2019), it is shown that proper human activities have facilitated and even accelerated mangrove expansion in the GBA after the 1990s. We would be optimistic about the future of the estuarine mangrove ecosystem in the GBA. However, there is still uncertainty in the present restoration programs with respect to mangrove ecosystem quality and functions. Several recent studies have emphasized that native mangrove species with higher biodiversity provide better ecosystem services (e.g., carbon stock and carbon sequestration rate) than the exotic ones (Peng et al., 2016a, b; Lee et al., 2019; Wu et al., 2020). The introduced S. apetala and L. racemosa are characterized by greater adaptability and a higher growth rate than the native species. They have largely covered the restored mangrove habitats (Zan et al., 2003; Ren et al., 2009), resulting in the reduction in the proportion of the native mangrove species (i.e., K. obovata, A. corniculatum, and A. marina) inevitably. Afforestation with exotic mangrove species in the tidal flats has indeed led to an apparent increase in forest area but has also raised a species-related latent loss in functionality (e.g., carbon storage and biological nitrogen fixation) and rampant degradation of native mangrove species in China from the perspective of ecosystem services (Peng et al., 2016b; He et al., 2018; Liu et al., 2020; Wang et al., 2020; Wu et al., 2020). Therefore, we argue that besides focusing on the area of restored mangroves (habitat quantity), restoration programs should also aim at recovery of the ecosystem functions and services (habitat quality).
Another uncertainty of the present mangrove restoration is the insufficient suitable space. About 75% of the potential area suitable for mangrove forests has been lost because of human land use and is no longer available for mangrove restoration in China (Hu W. et al., 2020). Mangrove forests are mainly restored at tidal flats, being the low intertidal, pioneer vegetation in the GBA. Planting mangrove saplings on the tidal flats was currently the most popular restoration measure in the southern part of China, and some Southeast Asian countries (Lewis, 2001; Primavera and Esteban, 2008; Primavera et al., 2011; Duncan et al., 2016; Fan and Mo, 2018). However, plantations in soft mudflat usually led to weak root anchoring and the saplings’ survival rate is generally disappointingly low due to the harsh environmental conditions, such as long inundation time in lower elevated tidal flats, and damage from storm surges (Lin and Liu, 2003; Duncan et al., 2016), calling for more labor and investment to manage the tender plants. In certain cases, where treatment of plantings is insufficient, this may lead to high mortality of mangrove saplings and failure of success of restoration projects. Additionally, bare tidal flats are important habitats for benthic macrofauna and birds (Erftemeijer and Iii, 2000), and as such are a critical habitat within coastal wetlands (Hu et al., 2015; Bouma et al., 2016; van Bijsterveldt et al., 2020). Rapid HA on the valuable tidal flats has thus incidental ecological risks over a long-time span (Primavera et al., 2011).
Strategies for Future Mangrove Restoration
During 1980–2000, around 130 km2 of mangrove was lost, and 97% of it was converted to aquaculture ponds in southern China (Department of Forest Resources Management, 2002). Shrimp farming could provide a tremendous income at the beginning but after some time may suffer from serious problems due to the outbreak of diseases and pollution (Johnson et al., 2007; Thomas et al., 2010; Duncan et al., 2016). As a result, 30% of shrimp ponds in southern China have been abandoned (Fan and Wang, 2017), and similar cases were found in Thailand, Malaysia, Sri Lanka (Bournazel et al., 2015), and Indonesia (Gusmawati et al., 2018; van Bijsterveldt et al., 2020). The great area of abandoned shrimp ponds, which was originally transformed from mangrove, might provide potential and promising spaces for mangrove restoration in the near future, as abandoned ponds often have environmental conditions suitable for mangrove establishment, such as mild hydrodynamic conditions, suitable (mid-high intertidal) elevations, and low wave energy compared to the low-lying tidal flats (van Bijsterveldt et al., 2020). Thus, mangrove restoration at abandoned shrimp ponds has much potential to be feasible and should become a prior restoration effort. It deserves more investment through pilot restoration programs, accompanied by the monitoring of habitat development and evaluation of ecosystem functionality, and comparison of the costs and benefits of different restoration methods. Besides, mixed shrimp-mangrove farming systems are widely considered to be a win-win measure. According to Truong and Do (2018), 60% is the optimal mangrove coverage for shrimp farming, not only complying with the local ecological conservation policy, but also benefiting shrimp farmers. The corresponding optimal mangrove coverage around aquaculture ponds in the GBA needs further exploration and practice. It may depend on the types of aquaculture products and other environmental conditions.
For the shrimp ponds outside seawalls, a breach at the seaward edge would allow tidal supplies of water, sediment, and mangrove propagules to enter the abandoned ponds, resulting in gradual nourishment and restoration of mangrove forests. Much greater areas of shrimp ponds (20.2 km2) exist in the GBA compared to the tidal flats (6.1 km2), and hence abandoned shrimp ponds may become suitable areas for mangrove restoration in the future. As such mangrove restoration in abandoned aquaculture ponds may contribute to finding a sustainable balance between ecological conservation and human societal development in coastal cities (Duncan et al., 2016; Lee et al., 2019), following the mechanisms of coastal vegetation on attenuating hydrological forces (van Loon-Steensma et al., 2014; Yao et al., 2018). It may help to achieve urban marine sustainability via a top-down approach in other coastal cities facing similar challenges as in the GBA.
Conclusion
In this study, the spatio-temporal changes in the estuarine mangrove areas as well as its transformation to and from other land-cover types were quantified from multi-temporal RS images. We conclude that estuarine mangroves in the GBA have first undergone a loss and then a gain of area over the last 30 years. Nearly 40% of mangrove areas were lost during the 1990s, mainly resulting from human exploitation of the coastal landscape (conversion to built-up area and aquaculture ponds), but then the mangrove area has almost tripled over the next two decades from 2000 to 2018 accounting for the establishment of nature reserves. These distinct stages of estuarine mangrove dynamics suggest that contrasting human activities, i.e., over-exploitation vs. ecological restoration, exert a dominant control on changes of mangrove area. In recent decades, mangrove afforestation on tidal flats has played a positive role in mangrove restoration, accounting for 46.9% of the increase in mangrove area. However, the dominating exotic species used in afforestation and their potentially harmful effects on ecosystem functions such as biodiversity and related ecosystem services, are still disturbing. Moreover, considering the available area of high tidal mudflat with a suitable elevation and adjacent to mangroves, and considering the current rate of restoration, this approach of mangrove afforestation on tidal flats will have reached its limits by 2060. Therefore, it is necessary to seek for alternative restoration strategies, like using abandoned shrimp ponds for mangrove afforestation. In terms of the future protection policy for mangroves in the GBA region, the lessons and experiences in previous restoration practices may guide the local management to effectively protect and recover the mangrove area and its associated ecosystem services.
Data Availability Statement
The original contributions presented in the study are included in the article/Supplementary Material, further inquiries can be directed to the corresponding author/s.
Author Contributions
HW: conceptualization, formal analysis, software, writing – original draft, and funding acquisition. YP: validation and writing – review and editing. CW: supervision, methodology supervision, and funding acquisition. QW, JX, and XJ: methodology and data analysis. ZH: supervision, funding acquisition, and project administration. XZ: data analysis and writing – review and editing. WL: data analysis and funding acquisition. JW and TB: funding acquisition and writing – review and editing. All authors contributed to the article and approved the submitted version.
Funding
This work was supported by the National Key Research and Development Program of China (No. 2016YFC0402600), the Joint Research Project of NSFC, NWO, and EPSRC (Nos. 51761135022, ALWSD.2016.026, and EP/R024537/1), National Natural Science Foundation of China (Grant Nos. 42006153, 41771095, and 41501116), Guangdong Provincial Department of Science and Technology (Grant No. 2019ZT08G090), Fundamental Research Funds for the Central Universities of China (Nos. 19lgpy87 and 20lgzd16), and Innovation Group Project of Southern Marine Science and Engineering Guangdong Laboratory (Zhuhai) (No. 311021004).
Conflict of Interest
The authors declare that the research was conducted in the absence of any commercial or financial relationships that could be construed as a potential conflict of interest.
Acknowledgments
The authors would like to thank Yi Zhang for her assistance with data processing and validation.
Supplementary Material
The Supplementary Material for this article can be found online at: https://www.frontiersin.org/articles/10.3389/fmars.2021.693450/full#supplementary-material
Footnotes
References
Ai, B., Ma, C., Zhao, J., and Zhang, R. (2019a). The impact of rapid urban expansion on coastal mangroves: a case study in Guangdong Province, China. Front. Earth Sci. 14, 37–49. doi: 10.1007/s11707-019-0768-6
Ai, B., Zhang, R., Zhang, H., Ma, C., and Gu, F. (2019b). Dynamic process and artificial mechanism of coastline change in the Pearl River Estuary. Reg. Stud. Mar. Sci. 30:100715. doi: 10.1016/j.rsma.2019.100715
Akar, Ö, and Gungor, O. (2012). Classification of multispectral images using random forest Algorithm. J. Geodesy Geoinformation 1, 105–112. doi: 10.9733/jgg.241212.1
Alongi, D. M. (2008). Mangrove forests: resilience, protection from tsunamis, and responses to global climate change. Estuar. Coast. Shelf Sci. 76, 1–13. doi: 10.1016/j.ecss.2007.08.024
Alongi, D. M. (2014). Carbon cycling and storage in mangrove forests. Annu. Rev. Mar. Sci. 6, 195–219. doi: 10.1146/annurev-marine-010213-135020
An, D., Miao, S., Chen, W., Tao, W., Zeng, Q., Long, L., et al. (2015). Population Characteristics of Seedlings Under the Man-Made Sonneratia Apetala Forest at Qi’ao Island. Zhuhai: Guangzhou University.
Bouma, T. J., van Belzen, J., Balke, T., van Dalen, J., Klaassen, P., Hartog, A. M., et al. (2016). Short-term mudflat dynamics drive long-term cyclic salt marsh dynamics. Limnol. Oceanogr. 61, 2261–2275. doi: 10.1002/lno.10374
Bournazel, J., Kumara, M. P., Jayatissa, L. P., Viergever, K., Morel, V., and Huxham, M. (2015). The impacts of shrimp farming on land-use and carbon storage around Puttalam lagoon, Sri Lanka. Ocean Coast. Manag. 113, 18–28. doi: 10.1016/j.ocecoaman.2015.05.009
Chang, H. T., Chen, G. Z., Liu, Z. P., and Zhang, S. Y. (1998). Studies on Futian Mangrove Wetland Ecosystem. Shenzhen Guangdong Province. Guangzhou: Guangdong Science and Technology Press.
Chen, L., Zeng, X., Tam, N. F. Y., Lu, W., Luo, Z., Du, X., et al. (2012). Comparing carbon sequestration and stand structure of monoculture and mixed mangrove plantations of Sonneratia caseolaris and S. apetala in Southern China. For. Ecol. Manag. 284, 222–229. doi: 10.1016/j.foreco.2012.06.058
Critchley, L. P., Bugnot, A. B., Dafforn, K. A., Marzinelli, E. M., and Bishop, M. J. (2021). Comparison of wrack dynamics between mangrove forests with and without seawalls. Sci. Total Environ. 751:141371. doi: 10.1016/j.scitotenv.2020.141371
Department of Forest Resources Management (2002). National Mangrove Resource Inventory Report; The State Forestry Administration of the People’s Republic of China. Beijing: Department of Forest Resources Management.
Dominicis, M., Wolf, J., Jevrejeva, S., Zheng, P., and Hu, Z. (2020). Future interactions between sea level rise, tides, and storm surges in the world’s largest Urban Area. Geophys. Res. Lett. 47:e2020GL087002.
Drusch, M., Bello, U. D., Carlier, S., Colin, O., Fernandez, V., Gascon, F., et al. (2012). Sentinel-2: ESA’s optical high-resolution mission for GMES operational services. Remote Sens. Environ. 120, 25–36. doi: 10.1016/j.rse.2011.11.026
Duncan, C., Primavera, J. H., Pettorelli, N., Thompson, J. R., Loma, R. J. A., and Koldewey, H. J. (2016). Rehabilitating mangrove ecosystem services: a case study on the relative benefits of abandoned pond reversion from Panay Island, Philippines. Mar. Pollut. Bull. 109, 772–782. doi: 10.1016/j.marpolbul.2016.05.049
Erftemeijer, P., and Iii, R. (2000). “Planting mangroves on intertidal mudflats: habitat restoration or habitat conversion?,” in Proceedings of the Regional Seminar for East and Southeast Asian Countries: ECOTONE VIII, Ranong & Phuket, 23-28 May 1999. Bangkok: UNESCO.
Estoque, R. C., Myint, S. W., Wang, C., Ishtiaque, A., Aung, T. T., Emerton, L., et al. (2018). Assessing environmental impacts and change in Myanmar’s mangrove ecosystem service value due to deforestation (2000–2014). Glob. Change Biol. 24, 5391–5410. doi: 10.1111/gcb.14409
Fan, H. Q., and Mo, Z. C. (2018). The history, achievements and lessons learnt for mangrove restoration in Guangxi. China. Guangxi Sci. 25, 363–387.
Fan, H. Q., and Wang, W. Q. (2017). Some thematic issues for mangrove conservation in China. J. Xiamen Univ. Nat. Sci. 56, 323–330.
Friess, D. A., Rogers, K., Lovelock, C. E., Krauss, K. W., Hamilton, S. E., Lee, S. Y., et al. (2019). The State of the World’s mangrove forests: past, present, and future. Annu. Rev. Environ. Resour. 44, 89–115.
Giri, C., Ochieng, E., Tieszen, L. L., Zhu, Z., Singh, A., Loveland, T., et al. (2011). Status and distribution of mangrove forests of the world using earth observation satellite data. Glob. Ecol. Biogeogr. 20, 154–159. doi: 10.1111/j.1466-8238.2010.00584.x
Giri, C., Pengra, B., Zhu, Z., Singh, A., and Tieszen, L. L. (2007). Monitoring mangrove forest dynamics of the Sundarbans in Bangladesh and India using multi-temporal satellite data from 1973 to 2000. Estuar. Coast. Shelf Sci. 73, 91–100. doi: 10.1016/j.ecss.2006.12.019
Gusmawati, N. F., Soulard, B., Selmaouifolcher, N., Proisy, C., Mustafa, A., Gendre, R. L., et al. (2018). Surveying shrimp aquaculture pond activity using multitemporal VHSR satellite images - case study from the Perancak estuary, Bali, Indonesia. Mar. Pollut. Bull. 131, 49–60. doi: 10.1016/j.marpolbul.2017.03.059
He, Z., Peng, Y., Guan, D., Hu, Z., Chen, Y., and Lee, S. Y. (2018). Appearance can be deceptive: shrubby native mangrove species contributes more to soil carbon sequestration than fast-growing exotic species. Plant Soil 432, 425–436. doi: 10.1007/s11104-018-3821-4
Hochard, J. P., Hamilton, S., and Barbier, E. B. (2019). Mangroves shelter coastal economic activity from cyclones. Natl. Acad. Sci. 116, 12232–12237. doi: 10.1073/pnas.1820067116
Hu, W., Wang, Y., Zhang, D., Yu, W., Chen, G., Xie, T., et al. (2020). Mapping the potential of mangrove forest restoration based on species distribution models: a case study in China. Sci. Total Environ. 748:142321. doi: 10.1016/j.scitotenv.2020.142321
Hu, Z., van Belzen, J., van der Wal, D., Balke, T., Wang, Z. B., Stive, M., et al. (2015). Windows of opportunity for salt marsh vegetation establishment on bare tidal flats: the importance of temporal and spatial variability in hydrodynamic forcing. J. Geophys. Res. Biogeo. 120, 1450–1469. doi: 10.1002/2014jg002870
Hu, Z., Zhou, J., Wang, C., Wang, H., He, Z., Peng, Y., et al. (2020). A Novel instrument for bed dynamics observation supports machine learning applications in mangrove biogeomorphic processes. Water Resour. Res. 56:e2020WR027257.
Jia, M., Liu, M., Wang, Z., Mao, D., Ren, C., and Cui, H. (2016). Evaluating the effectiveness of conservation on mangroves: a remote sensing-based comparison for two adjacent protected areas in shenzhen and Hong Kong, China. Remote Sens. 8:627. doi: 10.3390/rs8080627
Jia, M., Wang, Z., Zhang, Y., Mao, D., and Wang, C. (2018). Monitoring loss and recovery of mangrove forests during 42 years: the achievements of mangrove conservation in China. Int. J. Appl. Earth Obs. 73, 535–545. doi: 10.1016/j.jag.2018.07.025
Johnson, P. T. J., Chase, J. M., Dosch, K. L., Hartson, R. B., Gross, J. A., Larson, D. J., et al. (2007). Aquatic eutrophication promotes pathogenic infection in amphibians. Proc. Natl. Acad. Sci. 104, 15781–15786. doi: 10.1073/pnas.0707763104
Khatami, R., Mountrakis, G., and Stehman, S. V. (2016). A meta-analysis of remote sensing research on supervised pixel-based land-cover image classification processes: general guidelines for practitioners and future research. Remote Sens. Environ. 177, 89–100. doi: 10.1016/j.rse.2016.02.028
Kondolf, G. M., Rubin, Z. K., and Minear, J. T. (2014). Dams on the Mekong: cumulative sediment starvation. Water Resour. Res. 50, 5158–5169. doi: 10.1002/2013wr014651
Kuenzer, C., Bluemel, A., Gebhardt, S., Quoc, T. V., and Dech, S. (2011). Remote sensing of mangrove ecosystems: a review. Remote Sens. 3, 878–928. doi: 10.3390/rs3050878
Lai, S., Loke, L. H. L., Hilton, M. J., Bouma, T. J., and Todd, P. A. (2015). The effects of urbanisation on coastal habitats and the potential for ecological engineering: a Singapore case study. Ocean Coast. Manag. 103, 78–85. doi: 10.1016/j.ocecoaman.2014.11.006
Lee, S. Y., Hamilton, S., Barbier, E. B., Primavera, J., and Lewis, R. R. (2019). Better restoration policies are needed to conserve mangrove ecosystems. Nat. Ecol. Evol. 3, 870–872. doi: 10.1038/s41559-019-0861-y
Lewis, R. R. (2001). “Mangrove restoration - costs and benefits of successful ecological restoration,” in Proceedings of the Mangrove Valuation Workshop, Universiti Sains Malaysia, Penang, 4-8 April, 2001. Sweden: Beijer International Institute of Ecological Economics.
Lin, Z. D., and Liu, H. M. (2003). Protection and management countermeasures for mangrove resource in Guangdong Province. For. Survey Planning Central Southern China 22, 35–38.
Liu, K., Li, X., Shi, X., and Wang, S. (2008). Monitoring mangrove forest changes using remote sensing and GIS data with decision-tree learning. Wetlands 28:336. doi: 10.1672/06-91.1
Liu, K., Zhu, Y., Li, Q., Li, Y., Xiao, W., and Meng, L. (2016). Analysis on mangrove resources changes of Zhenhai Bay in Guangdong based on multi source remote sensing images. Trop. Geogr. 36, 850–859.
Liu, X. L., Deng, R. R., Xu, J. H., and Gong, Q. H. (2017). Spatiotemporal evolution characteristics of coastlines and driving force analysis of the Pearl River Estuary in the past 40 years. J. Geo Inform. Sci. 19, 1336–1345.
Liu, X., Yang, C., Yu, X., Yu, H., Zhuang, W., Gu, H., et al. (2020). Revealing structure and assembly for rhizophyte-endophyte diazotrophic community in mangrove ecosystem after introduced Sonneratia apetala and Laguncularia racemosa. Sci. Total Environ. 721:137807. doi: 10.1016/j.scitotenv.2020.137807
Long, C. Q., Dai, Z. J., Zhou, X. Y., Mei, X. F., and Van, C. M. (2021). Mapping mangrove forests in the Red River Delta, Vietnam. For. Ecol. Manag. 483:118910. doi: 10.1016/j.foreco.2020.118910
Lovelock, C. E., Cahoon, D. R., Friess, D. A., Guntenspergen, G. R., Krauss, K. W., Reef, R., et al. (2015). The vulnerability of Indo-Pacific mangrove forests to sea-level rise. Nature 526, 559–563. doi: 10.1038/nature15538
Ma, C., Ai, B., Zhao, J., Xu, X., and Huang, W. (2019). Change detection of mangrove forests in coastal Guangdong during the past three decades based on remote sensing data. Remote Sens. 11:921. doi: 10.3390/rs11080921
Mazda, Y., Magi, M., Ikeda, Y., Kurokawa, T., and Asano, T. (2006). Wave reduction in a mangrove forest dominated by Sonneratia spp. Wetlands Ecol. Manag. 14, 365–378. doi: 10.1007/s11273-005-5388-0
Mcleod, E., Poulter, B., Hinkel, J., Reyes, E., and Salm, R. (2010). Sea-level rise impact models and environmental conservation: a review of models and their applications. Ocean Coast. Manag. 53, 507–517. doi: 10.1016/j.ocecoaman.2010.06.009
Neumann, B., Vafeidis, A. T., Zimmermann, J., and Nicholls, R. J. (2015). Future coastal population growth and exposure to sea-level rise and coastal flooding - a global assessment. PLoS One 10:e0131375. doi: 10.1371/journal.pone.0131375
Nicholls, R. J., and Cazenave, A. (2010). Sea-level rise and its impact on coastal zones. Science 328:1517. doi: 10.1126/science.1185782
Ouyang, X., and Lee, S. Y. (2020). Improved estimates on global carbon stock and carbon pools in tidal wetlands. Nat. Commun. 11:317.
Peng, Y., Diao, J., Zheng, M., Guan, D., Zhang, R., Chen, G., et al. (2016a). Early growth adaptability of four mangrove species under the canopy of an introduced mangrove plantation: implications for restoration. For. Ecol. Manag. 373, 179–188. doi: 10.1016/j.foreco.2016.04.044
Peng, Y., Zheng, M., Zheng, Z., Wu, G., Chen, Y., Xu, H., et al. (2016b). Virtual increase or latent loss? a reassessment of mangrove populations and their conservation in Guangdong, southern China. Mar. Pollut. Bull. 109, 691–699. doi: 10.1016/j.marpolbul.2016.06.083
Pontee, N. (2013). Defining coastal squeeze: a discussion. Ocean Coast. Manag. 84, 204–207. doi: 10.1016/j.ocecoaman.2013.07.010
Pramanik, M. K. (2014). Assessment the impact of sea level rise on mangrove dynamics of Ganges Delta in India using remote sensing and GIS. J. Envir. Earth Sci. 4, 117–127.
Primavera, J. H., and Esteban, J. M. A. (2008). A review of mangrove rehabilitation in the Philippines: successes, failures and future prospects. Wetl. Ecol. Manag. 16, 345–358. doi: 10.1007/s11273-008-9101-y
Primavera, J. H., Rollon, R. N., and Samson, M. S. (2011). The pressing challenges of mangrove rehabilitation: pond reversion and coastal protection. Treatise Estuar. Coast. Sci. 33, 217–244. doi: 10.1016/b978-0-12-374711-2.01010-x
Ren, H., Lu, H., Shen, W., Huang, C., Guo, Q., Li, Z. A., et al. (2009). Sonneratia apetala Buch.Ham in the mangrove ecosystems of China: an invasive species or restoration species? Ecol. Eng. 35, 1243–1248. doi: 10.1016/j.ecoleng.2009.05.008
Sidik, F., Supriyanto, B., Krisnawati, H., and Muttaqin, M. Z. (2018). Mangrove conservation for climate change mitigation in Indonesia. WIREs Clim. Change 9:e529.
Son, N. T., Thanh, B. X., and Da, C. T. (2016). Monitoring mangrove forest changes from multi-temporal Landsat data in Can Gio biosphere reserve, vietnam. Wetlands 36, 565–576. doi: 10.1007/s13157-016-0767-2
The World Bank Group (2015). World Bank Report: Provides new data to Help Ensure urban Growth Benefits the Poor. Washington, DC: World Bank.
Thomas, Y., Courties, C., El Helwe, Y., Herbland, A., and Lemonnier, H. (2010). Spatial and temporal extension of eutrophication associated with shrimp farm wastewater discharges in the New Caledonia lagoon. Mar. Pollut. Bull. 61, 387–398. doi: 10.1016/j.marpolbul.2010.07.005
Tian, Y., Jia, M., Wang, Z., Mao, D., Du, B., and Wang, C. (2020). Monitoring invasion process of Spartina alterniflora by seasonal Sentinel-2 imagery and an object-based random forest classification. Remote Sens. 12:1383. doi: 10.3390/rs12091383
Truong, T. D., and Do, L. H. (2018). Mangrove forests and aquaculture in the Mekong river delta. Land Use Policy 73, 20–28. doi: 10.1016/j.landusepol.2018.01.029
Valderrama-Landeros, L., Flores-Verdugo, F., Rodríguez-Sobreyra, R., Kovacs, J. M., and Flores-De-Santiago, F. (2020). Extrapolating canopy phenology information using Sentinel-2 data and the Google Earth Engine platform to identify the optimal dates for remotely sensed image acquisition of semiarid mangroves. J. Environ. Manag. 279:111617. doi: 10.1016/j.jenvman.2020.111617
van Bijsterveldt, C. E. J., van Wesenbeeck, B. K., van der Wal, D., Afiati, N., Pribadi, R., Brown, B., et al. (2020). How to restore mangroves for greenbelt creation along eroding coasts with abandoned aquaculture ponds. Estuar. Coast. Shelf Sci. 235:106576. doi: 10.1016/j.ecss.2019.106576
van Loon-Steensma, J. M., Slim, P. A., Decuyper, M., and Hu, Z. (2014). Salt-marsh erosion and restoration in relation to flood protection on the Wadden Sea barrier island Terschelling. J. Coast. Conserv. 18, 415–430. doi: 10.1007/s11852-014-0326-z
Veettil, B. K., Ward, R. D., Quang, N. X., Trang, N. T. T., and Giang, T. H. (2019). Mangroves of Vietnam: historical development, current state of research and future threats. Estuar. Coast. Shelf Sci. 218, 212–236. doi: 10.1016/j.ecss.2018.12.021
Wang, L., Jia, M., Yin, D., and Tian, J. (2019). A review of remote sensing for mangrove forests: 1956–2018. Remote Sens. Environ. 231:111223. doi: 10.1016/j.rse.2019.111223
Wang, W., Fu, H., Lee, S. Y., Fan, H., and Wang, M. (2020). Can strict protection stop the decline of mangrove ecosystems in China? from rapid destruction to rampant degradation. Forests 11:55. doi: 10.3390/f11010055
Woodroffe, C. D., Rogers, K., Mckee, K. L., Lovelock, C. E., Mendelssohn, I. A., and Saintilan, N. (2016). Mangrove sedimentation and response to relative sea-level rise. Ann. Rev. Mar. Sci. 8, 243–266. doi: 10.1146/annurev-marine-122414-034025
Wu, H. Y., Liu, W. Q., Zhang, J., and Li, C. M. (2015). Summary of the climate of Guangdong Province in 2015. Guangdong Meteorol. 38, 1–5.
Wu, M., He, Z., Fung, S., Cao, Y., Guan, D., Peng, Y., et al. (2020). Species choice in mangrove reforestation may influence the quantity and quality of long-term carbon sequestration and storage. Sci. Total Environ. 217:136742. doi: 10.1016/j.scitotenv.2020.136742
Wu, Z., Milliman, J. D., Zhao, D., Cao, Z., Zhou, J., and Zhou, C. (2018). Geomorphologic changes in the lower Pearl River Delta, 1850–2015, largely due to human activity. Geomorphology 314, 42–54. doi: 10.1016/j.geomorph.2018.05.001
Yao, P., Chen, H., Huang, B., Tan, C., Hu, Z., Ren, L., et al. (2018). Applying a new force–velocity synchronizing algorithm to derive drag coefficients of rigid vegetation in oscillatory flows. Water 10:906. doi: 10.3390/w10070906
Yeung, Y. M. (2001). Coastal mega-cities in Asia: transformation, sustainability and management. Ocean Coast. Manag. 44, 319–333. doi: 10.1016/s0964-5691(01)00053-9
Zan, Q. J., Wang, B. S., Wang, Y. J., and Li, M. G. (2003). Ecological assessment on the introduced Sonneratia caseolaris and S. apetala at the mangrove forest of shenzhen bay. China. Acta Bot. Sinica 45, 544–551.
Zhang, Z., Wang, X., Zhao, X., Liu, B., Yi, L., Zuo, L., et al. (2014). A 2010 update of national land use/cover database of China at 1:100000 scale using medium spatial resolution satellite images. Remote Sens. Environ. 149, 142–154. doi: 10.1016/j.rse.2014.04.004
Zhao, L., and Tang, P. (2016). Scalability analysis of typical remote sensing data classification methods: a case of remote sensing image scene. J. Remote Sens. 20, 157–171.
Zheng, P., Li, M., Wang, C., Wolf, J., Chen, X., et al. (2020). Tide-surge interaction in the pearl river estuary: a case study of Typhoon Hato. Front. Mar. Sci. 7:236.
Keywords: mangrove, human activities, Guangdong-Hong Kong-Macao Greater Bay Area, afforestation, estuary, mega-cities
Citation: Wang H, Peng Y, Wang C, Wen Q, Xu J, Hu Z, Jia X, Zhao X, Lian W, Temmerman S, Wolf J and Bouma T (2021) Mangrove Loss and Gain in a Densely Populated Urban Estuary: Lessons From the Guangdong-Hong Kong-Macao Greater Bay Area. Front. Mar. Sci. 8:693450. doi: 10.3389/fmars.2021.693450
Received: 11 April 2021; Accepted: 10 June 2021;
Published: 02 July 2021.
Edited by:
Zhi-jun Dai, East China Normal University, ChinaReviewed by:
Mingming Jia, Northeast Institute of Geography and Agroecology (CAS), ChinaChuqi Long, East China Normal University, China
Copyright © 2021 Wang, Peng, Wang, Wen, Xu, Hu, Jia, Zhao, Lian, Temmerman, Wolf and Bouma. This is an open-access article distributed under the terms of the Creative Commons Attribution License (CC BY). The use, distribution or reproduction in other forums is permitted, provided the original author(s) and the copyright owner(s) are credited and that the original publication in this journal is cited, in accordance with accepted academic practice. No use, distribution or reproduction is permitted which does not comply with these terms.
*Correspondence: Chen Wang, d2FuZ2NoZW5fY2hAMTYzLmNvbQ==; Zhan Hu, aHV6aDlAbWFpbC5zeXN1LmVkdS5jbg==