 Sabrina Natalie Wilms
- 1Department of Ecological Chemistry, Alfred Wegener Institute, Helmholtz Centre for Polar and Marine Research (AWI), Bremerhaven, Germany
- 2Faculty of Biology/Chemistry, University of Bremen, Bremen, Germany
The variety of Earth’s organisms is manifold. However, it is the small-scale marine community that makes the world goes round. Microbial organisms of pro- and eukaryotic origin drive the carbon supply and nutrient cycling, thus are mediating the primary productivity within the world largest ecosystem called ocean. But due to the ocean’s great size and large number of biogeographically habitats, the total of microbial species can hardly be grabbed and therefore their functional roles not fully described. However, recent advances in high-throughput sequencing technologies are revolutionizing our understanding of the marine microbial diversity, ecology and evolution. Nowadays, research questions on species differentiation can be solved with genomic approaches such as metabarcoding, while transcriptomics offers the possibility to assign gene functions even to a single cell, e.g., single-cell transcriptomics. On the other hand, due to the diversified amount of sequencing data, the certainty of a data crisis is currently evolving. Scientists are forced to broaden their view on bioinformatics resources for analysis and data storage in from of, e.g., cloud services, to ensure the data’s exchangeability. Which is why time resources are now shifting toward solving data problems rather than answering the eco-evolutionary questions stated in the first place. This review is intended to provide exchange on *omics approaches and key points for discussions on data handling used to decipher the relevant diversity and functions of microbial organisms in the marine ecosystem.
Introduction
The ocean is essential to all aspects of well-being and livelihood on earth as it thrives fundamental processes like global climate regulation, carbon and nutrient cycles (Salazar and Sunagawa, 2017; IPCC, 2019). In addition, it is home to the largest continuous ecosystem, rich in marine biodiversity, ranging from unicellular organisms to marine mammals that rely on the ocean for their existence (Costello and Chaudhary, 2017; IPCC, 2019).
Understanding how marine microbes of pro- and eukaryotic origin1 function and relate to one another within this ecosystem has been a primary goal of taxonomists, ecologists, and evolutionary biologists alike for centuries (Bungartz et al., 2012). In addition to established methods, such as microscopy and Sanger sequencing (Hoffecker et al., 2019), next-generations of sequencing technologies with high-throughput have become an almost everyday research tool for revealing the intracellular-flow of genetic information ranging from single-cells to whole communities (Chui et al., 2020). These sequencing results improve the overall ability to understand biological processes across above mentioned disciplines and answer fundamental questions about microbial diversity and activity; hereby ranging from microbiome studies (Sunagawa et al., 2015), biomonitoring surveys (Pawlowski et al., 2016) to concepts of species and evolution (Strassert et al., 2018; Keeling, 2019). But regardless of the increasing availability of sequencing data, deciphering the code of life and its range of capabilities remains a challenge (Giani et al., 2020; Kapli et al., 2020).
This review is divided into three distinct, yet interrelated parts, and is intended for an audience with a background in ecology but moderate knowledge of *omics sequencing approaches:
(i) On Resilient Marine Ecosystems and Species Diversity, hence a brief overview of important factors/processes that influence the marine microbial community and explain its high complexity;
(ii) On Sequencer Platforms, Experimental Design and Data Integration, hence about the sequencing technology, the experimental approaches to study microbial communities, from sampling to data analysis, and their possible limitations, with the aim of raising their awareness in advance;
(iii) Sequencing Analysis on a Broader View, hence about the diversity of current *omics approaches and their applications and biases for the study of the microbial community, explaining the prevailing methods in detail and context, with the goal of facilitating room for discussion in which the best method for experiments and/or studies can be worked out individually.
The review’s aim is to present the prevailing *omics approaches to characterize the wide range of microbial biodiversity in our oceans. The information given here should lower the hurdle for many scientists in the field who lack practical expertise, however wish to apply such methods to their research by considering details from sampling itself to downstream analysis.
On Resilient Marine Ecosystems and Species Diversity
Unicellular microbial species of pro- and eukaryotic origin have been populating the ocean for already more than 3–1.5 billion years, respectively (French et al., 2015; Salazar and Sunagawa, 2017). And are likewise responsible for several key services such as climate regulation, carbon and nitrogen fixation as well as remineralization of organic matter within aquatic ecosystems, while also forming the base of the marine food web (Fenchel, 1988; Cavicchioli et al., 2019; IPCC, 2019). A census calculated a global biomass of ∼550 gigatons of carbon (Gt C) distributed among all kingdoms of life in terrestrial, marine and deep subsurface environments (Bar-On et al., 2018). Of these, ∼6 Gt C are allocated to marine environments dominated by microbial eukaryotic protists, and ∼70 Gt C are assigned to deep subsurface environments, such as the ocean crust and aquifers, dominated by prokaryotes (Bar-On et al., 2018). Thus, although these microbial communities are only present a minor fraction of the global biomass (∼13%), their relatively high turnover rates make them greatly efficient (Sheldon et al., 1972), herein providing 45–80% of the oxygen for Earth’s atmosphere (Field et al., 1998; NOAA, 2021).
Despite the harsh conditions in different aquatic habitats, such as changes in temperature, pressure and depth, microbial pro- and eukaryotic organisms managed to adapt to these conditions in many interesting and effective ways (Sundstrom and Allen, 2019). In certain habitats, as depending on regional properties like climatic or biogeographic conditions, whole communities can undergo seasonal changes as well (Bang et al., 2018; Ardyna and Arrigo, 2020). In general, while regions near the equator show relatively small transitions in temperature during the year, polar regions are driven by higher temperature fluctuations and severe differences in sunlight intensity and duration (Slagstad et al., 2011; Ardyna and Arrigo, 2020)—thus pressuring the communities compositions and/or single species resilience. Global abiotic changes force marine microorganisms into a continuous adaptation process characterized by short individual turnover rates (Sheldon et al., 1972), dynamic community movement and relatively large population sizes (Lewis et al., 2017; Nifong and Silliman, 2017). This means that distribution patterns of these unicellular species in the environment are indirectly and directly influenced by non-living factors, like nutrient concentration, solar radiation and temperature (de Vargas et al., 2015)—however, the underlying mechanistic processes leading to shifts remain unexplained. Conversely, the effects of biotic interactions on ecosystems, which were caused by pronounced regional changes in microbial communities due to changing habitat conditions in the first place, remain yet unpredictable. Ultimately forcing microbial species to perform differently, thus leading to a potential fundamental change in ecosystem function. Therefore, despite being small, the microbial impact on the environment is potentially mighty and driven by multiple stressors in a non-linear way (Pagaling et al., 2014).
Entire microbial communities or subpopulations within communities may respond to these environmental stressors by e.g., shifting their migration toward their respective environmental gradient needed for life.2 For instance, move poleward as predicted by models (Follows et al., 2007; Barton et al., 2010; Thomas M. K. et al., 2012) and confirmed by a global analysis of abundance trends ranging from plankton to marine mammals (Hastings et al., 2020) and genomic signatures among uncultured marine bacteria (Swan et al., 2013). But as the environmental factors range in transitions, whole communities and/or subpopulations can show a wide range of adaptive transformations to different conditions (Hagstrom and Levin, 2017), even leading to permanent alterations of their morphological and/or genetic diversity (Bang et al., 2018).
Most common measurements already couple the description on what kind of species are present with assessments on their morphological or genetic virtues; hence providing insights to the species functional capacity, thus establishing a mechanistic link between abundance, trait and function (Pinsky et al., 2020). However, the distribution and functional patterns are not permanent for every species and will change in response to the availability of resources and habitats. In addition, interpretations on the species compositions will depend upon the scale at which they are viewed (Zari, 2014). Nevertheless, species groups that are highly diverse and present a varied set of ecological adaptations along an environmental gradient (Edwards et al., 2016) may be of importance for understanding ecological niche differences and future reactions of the community toward climatic changes (Swenson, 2011).
On Sequencer Platforms, Experimental Design, and Data Integration
On the Evolution of Sequencing Platforms
The evolution of sequencing platforms, specific technologies, and even terminologies was driven by the need for rapid yet inexpensive and accurate sequencers (Heather and Chain, 2016). This resulted in so-called “generations” of platforms and the active usage of the suffix *omics to distinguish research approaches since its first introduction in the late 1960s (Kuska, 1998). Apart from different applied sequencing technologies per se, the generations can be characterized by their ability of sequencing short-reads or long-reads (van Dijk et al., 2018; Segerman, 2020).
• Short-read sequencing technologies (commonly read lengths of ∼50–1,000 base pairs) are comparably less expensive and enable population-scale analyses of single nucleotides and other small variants, but the analysis of larger structural variations remains difficult (Kulski, 2016; Segerman, 2020). In particular, de novo assemblies consisting only of short-reads may be missing entire portions of a genome or transcriptome, hence be missing important genes.
• Long-read sequencing technologies, with common read lengths greater than 1,000 base pairs up to tens of thousands of base pairs, are in contrast therefore well-suited for e.g., de novo genome assemblies and full-length isoform sequencing (Goodwin et al., 2016; Kulski, 2016; van Dijk et al., 2018).
The predominant technical platforms of each generation shall be listed and their main technical advantages and disadvantages briefly highlighted below (Figure 1).
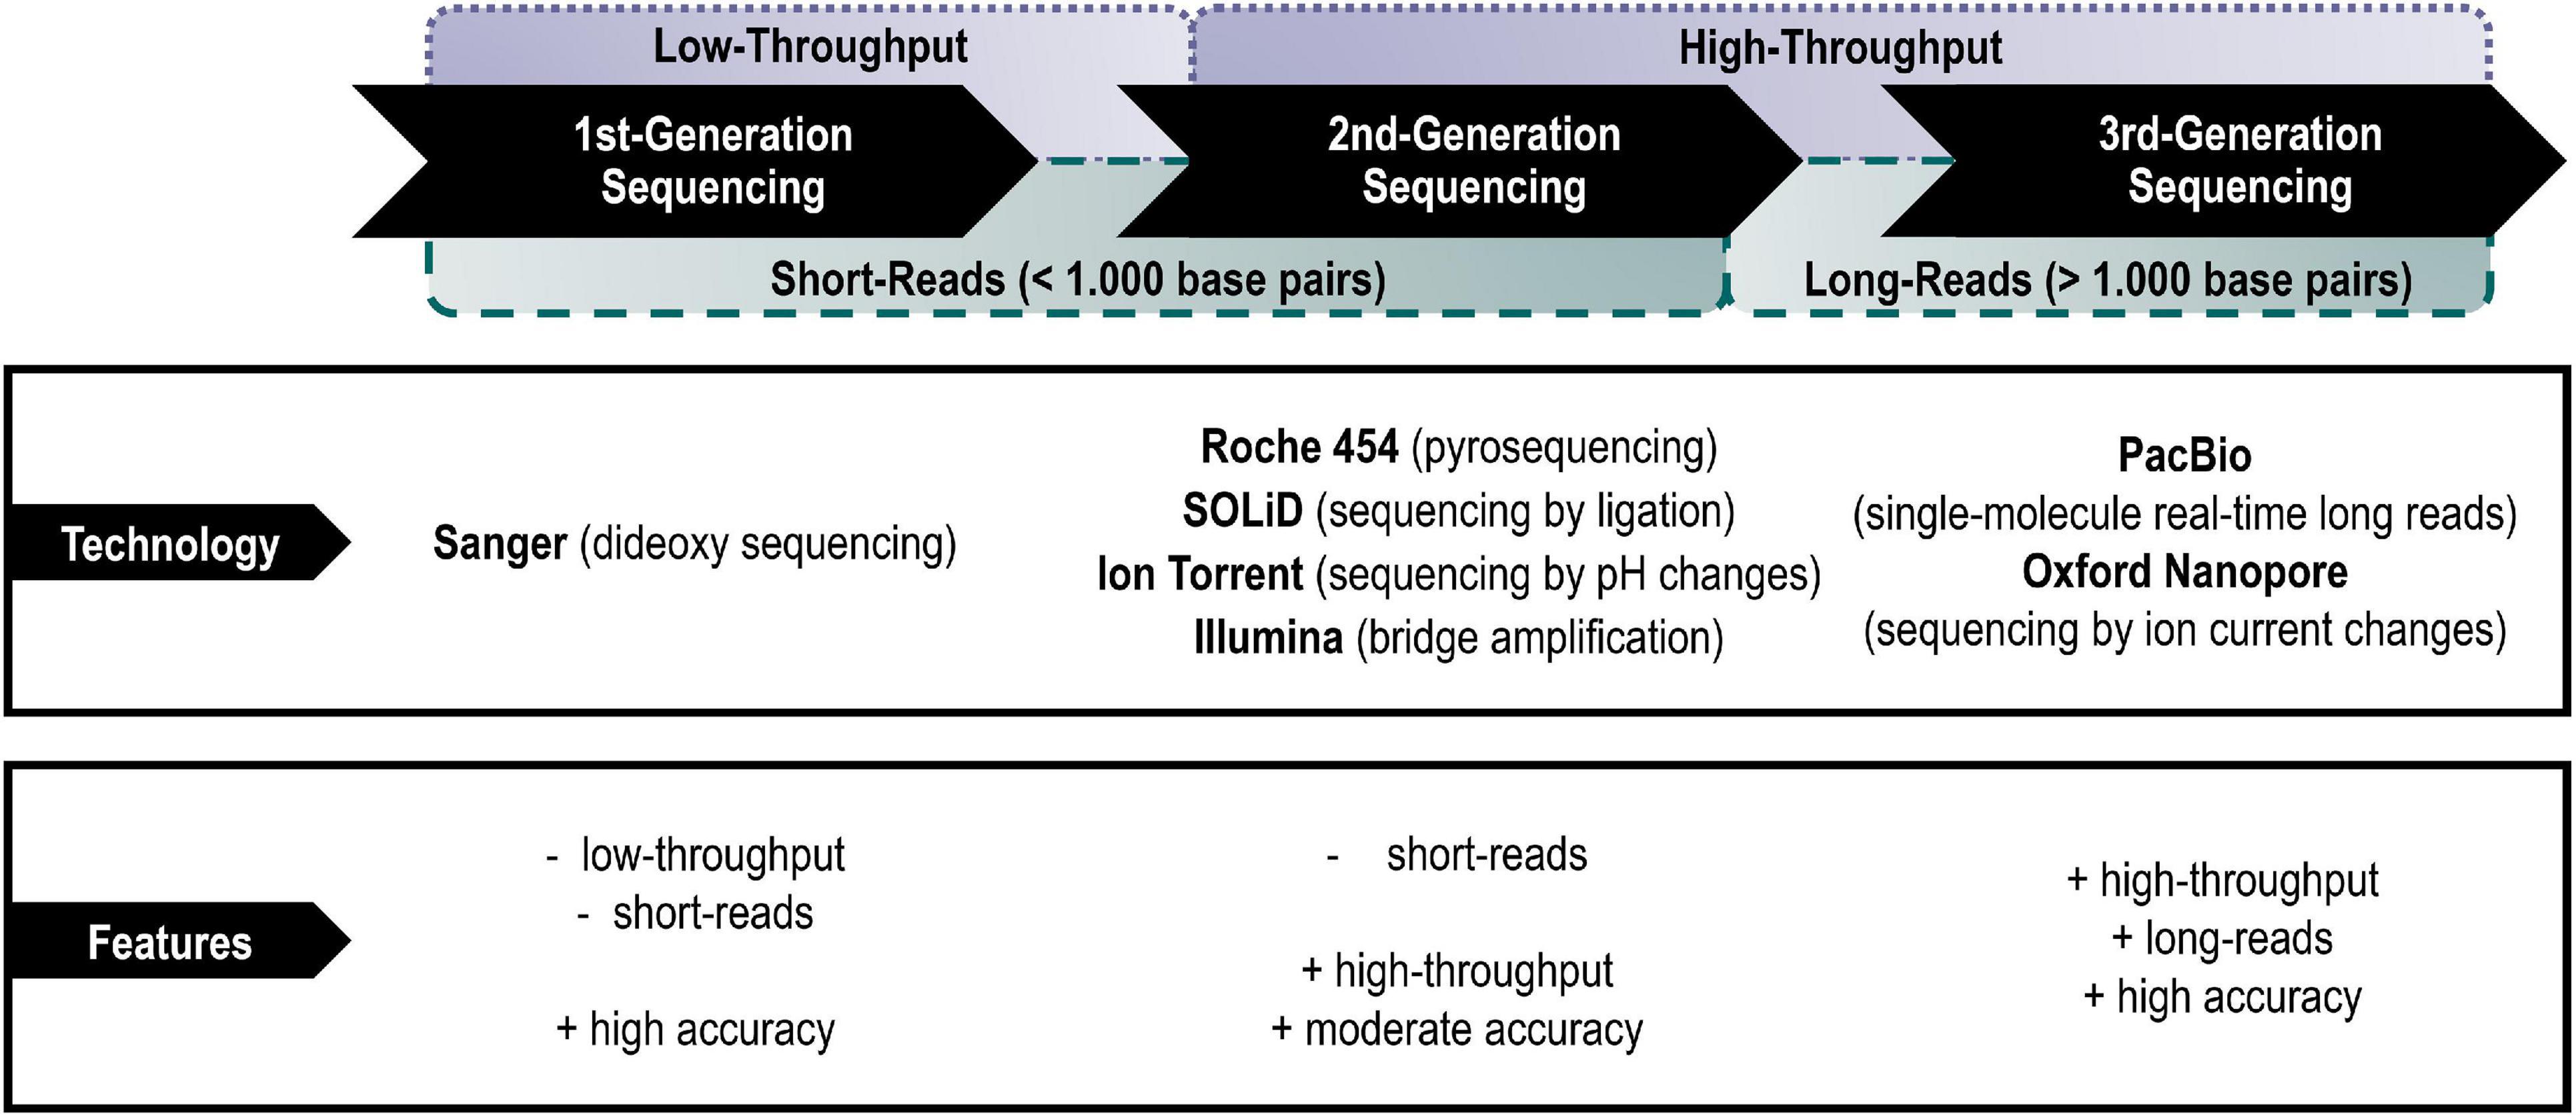
Figure 1. Main representatives of the different generations of sequencing platforms with their main advantages and disadvantages.
(A) First-generation sequencing (also addressed as Sanger sequencing)
The first-generation sequencing technology is based on the chain termination method developed by Sanger and Coulson in 1975 and was used to sequence the first deoxyribonucleic acid (DNA) genome of the bacteriophage ϕX174 with a total length of 5,375 bases in 1977 (Sanger et al., 1977; Heather and Chain, 2016). After years of improvements of Sanger’s dideoxy sequencing method, Applied Biosystems (today a brand of Thermo Fisher Scientific) launched the first automated sequencer (AB370) in 1987, which uses capillary electrophoresis for sequencing to this day (Kulski, 2016; Gupta and Gupta, 2020). Sanger sequencing has a read length of up to 1,000 base pairs with 99.999% accuracy (Kulski, 2016). However, the high costs and low throughput have serious impacts on large-scale applications (Heather and Chain, 2016)—nevertheless, it continues to be used in small-scale experimental approaches with focus single gene sequencing.
(B) Second-generation sequencing (also addressed as next-generation sequencing)
Second-generation sequencing, also called next-generation sequencing (NGS), is characterized by a high-throughput of sequence reads in less time, easier library preparation and at lower costs than Sanger sequencing (Reuter et al., 2015). The parallelization of sequencing reactions was achieved through the reduction/change of sequencing reactions, the development of microfluidics and improved detection systems (Kulski, 2016). However, depending on the research question, the relatively short-read lengths may be a major limitation of these platforms. As e.g., genomes often contain numerous repeated sequences that are longer than the usual NGS reads generated (∼150–300 base pairs) the read assembly may lead to gaps in the overall genome (re-) construction with an increased number of contigs due to fragmentation (Goodwin et al., 2016; van Dijk et al., 2018).
The Roche 454 sequencing platform was the first commercially successful second-generation sequencing system. The system was developed by 454 Life Sciences in 2005 and acquired by Roche in 2007 (Heather and Chain, 2016). However, in 2013, Roche announced that it would no longer supply or service the sequencing equipment and pyrosequencing reagents after 2016 (Hollmer, 2013). The sequencing itself was performed by pyrosequencing-by-synthesis and used clonal DNA libraries bound to beads washed over a picotiter reaction plate, which ideally fit only one bead per well-coated with only one clonal DNA molecule per bead (Goodwin et al., 2016). The actual pyrosequencing occurred in each of these wells, with light generated by an enzyme reaction following the incorporation of a matching nucleotide by DNA polymerases (Liu et al., 2012). The number of light signals generated was proportional to the number of nucleotides incorporated, and the sequence detected by a sensor under the reaction well (Goodwin et al., 2016; Heather and Chain, 2016). With this setup, read lengths of approximately 400–500 base pairs could be achieved (Kulski, 2016). Because each sequencing reaction was performed in an independent well of a picotiter plate, mutual interference and bias in sequencing were greatly reduced (Biogene Blog, 2017). Nevertheless, the Roche 454 was found to have a high error rate in homopolymer regions of consecutive identical bases, introducing insertions and deletions into the generated read and reducing its accuracy (Biogene Blog, 2017). The device has now effectively disappeared and is no longer in use.
Supported Oligonucleotide Ligation and Detection (SOLiD) is a next-generation sequencer instrument marketed by Life Technologies that had been purchased by Applied Biosciences in 2006 and commercially released in 2008 (Liu et al., 2012). It is based on 2-nucleotide sequencing-by-ligation reaction, by sequential annealing of probes to the template and their subsequent ligation. The advantage of this method is its high accuracy by interrogating each base twice (Gupta and Gupta, 2020). The major disadvantages are the short read lengths (∼50–75 base pairs of ∼99.94% accuracy) (Wong et al., 2019), the very long run times of 7–14 days and the additional need for extra computationally steps for raw data conversion (Liu et al., 2012; Kulski, 2016).
Ion Torrent technology was developed by the inventors of the Roche 454 sequencing platform and introduced two changes that distinguish this technology from others (Kulski, 2016). First, nucleotide sequences are detected electronically by changes in the pH of the surrounding solution proportional to the number of nucleotides incorporated (Reuter et al., 2015). The usual generation of light signals and their detection with optical components does not appear in this method. Second, the sequencing reaction is performed in a microchip connected to flow cells and electronic sensors at the bottom of each cell. Which means, that detected nucleotides are continuously converted into an electronic signal that is detected by the electronic sensors (Reuter et al., 2015; Heather and Chain, 2016). The major disadvantages of the system are problems with reading homopolymer sections and repeats (Segerman, 2020). In contrast, read lengths are relatively great (∼200–600 base pairs) and even used to complement sequencing data from other platforms (Kchouk et al., 2017) to this day.
Illumina Inc. acquired the Solexa Genome Analyzer in 2006 and launched it in 2007 (Kulski, 2016). Today, it is Illumina providing the most successful sequencing system, especially with the HiSeq and MiSeq platforms, with a claimed market dominance (Goodwin et al., 2016; Kulski, 2016). The Illumina sequencer employs the sequencing-by-synthesis technology using detachable fluorescently labeled chain-end nucleotides, which allow for greater output at lower reagent costs (Heather and Chain, 2016; Kchouk et al., 2017). The clonally enriched DNA template for sequencing is generated by PCR bridge amplification that generate clusters of molecules bound on a flow cell (Goodwin et al., 2016). The output of sequencing data per run is higher, costs are lower, and run times are moderately faster than most other systems (up to 3 days), but in contrast read lengths being shorter (up to 300 base pairs) (Gupta and Gupta, 2020).
(C) Third-generation sequencing (also addressed as long-read sequencing)
Pacific Biosciences (PacBio) currently markets the PacBio RS II sequencer and its single-molecule real-time sequencing (SMRT) technology since its introduction in 2010 (Lee et al., 2016). SMRT sequencing is performed in cells containing a large number of ultra-microwells in which a single molecule of DNA polymerase is immobilized at the bottom of each well (Goodwin et al., 2016). For sequencing, the single-stranded DNA template will be linked to the immobilized DNA polymerase, whereupon fluorescently labeled nucleotides are incorporated into the growing strand within the well (Goodwin et al., 2016; Heather and Chain, 2016). Cameras continuously monitor the wells as a series of observed pulses that are converted into single molecular tracks representing the template sequences (Gupta and Gupta, 2020). Because all four nucleotides are added simultaneously and measured in real time, the speed of sequencing is much faster compared to technologies in which individual nucleotides are flushed in sequentially one after another (Heather and Chain, 2016; Wong et al., 2019). And after technical improvements, the PacBio sequencer surpassed its initial read lengths of about 900 base pairs at 99.3% accuracy rate and enabled longer read lengths up to thousands of base pairs with improved accuracy to >99.999% (Travers et al., 2010; Koren et al., 2013). Nevertheless, some of the ultra-microcells fail to link a DNA template, resulting in a decrease in the number of sequencing reads (Goodwin et al., 2016).
Oxford Nanopore Technologies offer the latest systems for single-molecule sequencing since their release in 2014 (Reuter et al., 2015). The MinION is hereby a portable handheld molecular sequencing instrument that connects directly to a laptop/computer via a USB port, while PromethION being a small benchtop instrument (Kulski, 2016). Nanopore sequencing is based on the idea that the conductivity of ion currents in the pore changes as the template strand passes through it (Goodwin et al., 2016). In other words, since nucleotides have different shapes, each nucleotide is recognized by its effect on changing the ion current while passing through the pore (Kchouk et al., 2017). The main advantage of this approach is that sample preparation is minimal compared to second-generation sequencing methods and long read lengths in the kilo base pair range can be achieved (Goodwin et al., 2016; Kulski, 2016; Kchouk et al., 2017). The main problem with this technology is that the speed of the template passing through the nanopore must be optimized to ensure reliable measurement of ion current changes and to reduce the high error rates in base recognition (Wang et al., 2015).
On Higher-Generation Sequencing Costs
The relatively high costs of aged sequencing platforms themselves and their operation prevented sequencing projects from producing data in a high-throughput manner (Reuter et al., 2015; Chui et al., 2020). Samples were rarely replicated and many projects showed a descriptive structure to ultimately identify an individual and/or name characteristics of a microbial population being studied (Cristescu, 2014). In addition, these projects often focused on selective taxonomic groups, e.g., usually being easy to cultivate and/or of great economic and ecological importance, like harmful algae bloom species (del Campo et al., 2014; Hennon and Dyhrman, 2020) and marine pathogens (King et al., 2019) affecting aquaculture farms.
Some of the greatest research leaps, in terms of technological challenges and bioinformatics, are related to the Human Genome Project. The Human Genome Project was the international research effort to determine the DNA sequence of the entire human genome, which began in 1990 and was declared complete in 2003 (International Human Genome Sequencing Consortium, 2004). The human genome ended up costing nearly $3 billion (not adjusted for inflation) and is made up of 3 billion base pairs (International Human Genome Sequencing Consortium, 2004; Chui et al., 2020). However, only several years later, human genome sequencing did cost about $300,000 in 2006 and dropped to a price of about $1,000 in 2014 (both on Illumina Inc.’s equipment)—and it is expected to cost <$100 within the next decade (Brown, 2019; Chui et al., 2020; Regalado, 2020).
Total cost considerations for next-generation sequencing approaches typically focus on the acquisition and consumable costs of the sequencer, the condition of the laboratory and additional equipment itself (like quantity and quality instrumentation) and the experience of the staff in handling library preparation and sequencing reagents (Christensen et al., 2015; Schwarze et al., 2020). However, (bio-)informatics costs related to data analysis, submission and storage are generally not associated with the sequencing process, but also influence the final cost per sequencing run (Mardis, 2010). Taking these issues (and run failures) into account, the average cost per sequencing run in practice ranges from $1,000 to $10,000 and greatly depends on the complexity of the library preparation, device and labor (Christensen et al., 2018; Schwarze et al., 2020).
This still represents a significant decrease in sequencing costs over the years. As a result, more opportunistic and normative experimental designs can be pursued to explain fundamental questions of ecology and evolution. However, the costs depend greatly on the depth of the question and its *omics pipeline chosen to answer it. Therefore, experimental design considerations are inevitable in any *omics approach and must be carried out beforehand, in order to save valuable resources, including the sample material itself.
On Experimental Design Considerations in Any *Omics Approach
As with any technological advancement, the ability to create a safe and solid experimental design must mature as well. Otherwise, it might hinder the ability to (re-) produce robust and comparable estimates on microbial biodiversity. Therefore, there are several principal points to have in mind while conceptualizing a valid experimental design.
Even in the era of *omics, the need of sufficient technical and biological replicates remains valid to avoid systematic bias and batch effects (Auer and Doerge, 2010; Button et al., 2013). Even though this attitude may cause problems in field studies with very opportunistic sampling. Nevertheless, a thoughtful number of samples within the study hypothesis lays the ground for a realistic biodiversity representation within the sampled community; otherwise, this error might be the first step in under- or overestimating the biodiversity and imply variations driven by other factors than by biology itself (Auer and Doerge, 2010; Tung et al., 2017).
In addition, it should be noted that especially environmental samples are mainly carried out in bulk by sampling a large volume of water to increase species abundance. Even individual samples taken from laboratory environments harbor the potential to introduce sequences as contaminants (e.g., prokaryotic traces in a eukaryotic sample, but also vice versa). Having various DNA and ribonucleic acid (RNA) matrices present in one sample implies an appropriate choice of extraction and enrichment efforts. Therefore, independent extractions and parallel polymerase-chain-reaction (PCR) amplifications are important to increase the reliance on the intermediate PCR steps that enrich the DNA/RNA templates extracted from a sample (Cristescu, 2014). In particular, the amplification step can be easily biased as it tends to introduce initial errors and uneven amplification that can affect biodiversity estimates (Aylagas et al., 2016). These problems are encompassed by sequencing errors introduced by sequencing platforms themselves, thereby increasing the overall error rate against individual nucleotide bases (Fox et al., 2014; Paszkiewicz et al., 2014).
Depending on the hypothesis to be answered, the robustness of the gene marker should be taken into account (Ledergerber and Dessimoz, 2011; Cristescu, 2014). A good first consideration for this is the general availability of the marker sequence in databases in order to compare newly obtained sequences with verified ones and to expand the study. Interest in evolutionary events that occurred in a relatively short period of time would require rapidly evolving markers that changed under the same selected environmental pressures (Allan and Max, 2010). On the contrary, studying deep-branching events and evolutionary relationships would require highly conserved ones not being strongly affected by environmental changes throughout time thus rather being housekeeping-like genes (Morgan et al., 2003). In addition, genes useful for barcoding are not necessarily good at inferring evolutionary relationships. A good barcode needs to be able to differentiate between various organisms, whereas it does not have to depict evolutionary relationships exactly as a genetic marker would (Rubinoff and Holland, 2005; Spouge and Mariño-Ramírez, 2012). Typical eukaryotic barcodes used to assess eukaryotic diversity include the 18S-V4 region of the small ribosomal subunit (Medlin et al., 1988) or the 28S-D1-D2 region of the large ribosomal subunit (Scholin et al., 1994), as well as the ribulose-1,5-biphosphate carboxylase oxygenase gene (rbcL) marker to assess photosynthetically active protists (Hamsher et al., 2013). Commonly used DNA barcodes to infer the diversity of prokaryotic organisms are the 16S ribosomal marker sequence (Weisburg et al., 1991), the COI gene (cytochrome c oxidase subunit I, Smith et al., 2012) and the cpn60 (chaperonin-60, Goh et al., 1998). Due to slow evolutionary rates of this gene region, ribosomal sequences can also be considered as good evolutionary markers, especially 16S and 18S sequences are considered stable (Woese et al., 1990). In addition, genes identified as orthologs can be used to identify evolutionary relationships. BUSCO (Benchmarking Universal Single-Copy Orthologs, odb10 lineages) is a tool that identified 124 single-copy orthologous genes for bacteria, such as “transcription antitermination protein NusB,” and 255 genes for eukaryotes, such as “DNA-directed RNA polymerase subunit,” to infer species evolution (Seppey et al., 2019). But since the actual number of species is not yet known and the universality of the genes not fully addressable, it implies that any marker must be used with caution and carefully validated throughout the data analysis process.
Before any attempt of clustering, assembling or aligning sequencing data, various validation and quality steps should be actively taken into account and be repeated throughout the sequence analysis (Moreton et al., 2016; Akbar et al., 2018; Chui et al., 2020). These steps should not only include the removal of amplification artifacts and contaminations by references, but also the use of independent benchmarking algorithms to access the overall performance and comparability of the sequencing run and the subsequent analysis pipelines (Cristescu, 2014). In this way, it will be possible to determine taxonomic classifications and phylogenetic placements with certainty and reproducible by raw data availability.
These steps will channel the initiative research question and create a data management plan for the *omics approach to choose from. Reasoning the analytical and quality-assuring steps beforehand will ensure a complete understanding of the outcome and secure a valid interpretation of the data. Additionally, by actively implementing new sequences into existing databases, previously invisible cellular, metabolic and life-cycle processes within microbial communities will be revealed (Ching et al., 2018). This will allow a broader analytic view into the dark matter of so far insufficiently described environmental sequences that will annotate metabolic and cellular processes that might turn out to be crucial for the ecosystem functioning (Marcy et al., 2007; Grattepanche et al., 2018). The discovery and characterization of deep-branching lineages of marine microbes will be essential for studying the origin and evolution of life in marine ecosystems. It will elucidate how genotypic diversity shapes phenotypic variances and highlight how this diversity influences the functioning of marine ecosystems (Stork, 2009; Heidelberg et al., 2010).
On Data Storage in the *Omics Era
The continuously created amount of data underlines that a huge data explosion in bioinformatics has taken place in the last decades (Papageorgiou et al., 2018; Chui et al., 2020). A good example of data aggregation is the Sequence Read Archive (SRA), the largest and most diverse collection of next-generation sequencing data from human, non-human, and microbial sources (Kodama et al., 2012; NCBI Insights, 2020.) which has started in 2005. Through almost exponential growth, it has currently reached 43 petabytes (PB) of data and notes that it has passed its own sustainability tipping point (NCBI Insights, 2020, 2021). In a certain sense, the scientific community is experiencing a data crisis. As sometimes, the time spent on solving storage space problems is longer than the time spent on collecting and analyzing data (Papageorgiou et al., 2018). Large data centers are trying to counteract this data crisis by achieving high storage capacities (Gandomi and Haider, 2015). Nevertheless, certain infrastructure malfunctions and storage problems can lead to a massive and permanent loss of extensive information (Eglen et al., 2017).
The digital universe is exponentially producing an unprecedented amount of data, which has brought both benefits and fundamental challenges to businesses and scientific communities (Sowe and Zettsu, 2014). This trend is inherently exciting for the development and deployment of cloud platforms (like SRA) to support scientific communities that curate large amounts of data (Chui et al., 2020). The excitement stems from the fact that scientists can now access and extract values from the large body of data, establish relationships between bits and pieces of information from many types of data, and collaborate with a diverse community of researchers from different fields (Cristescu, 2014; Eglen et al., 2017; Papageorgiou et al., 2018).
The technical challenges of large data sets are as great as understanding the dynamics of microbial communities itself. The age of big data also means that large data platforms for data-intensive research must be designed in such a way that researchers can easily search and find data for their research, upload and download data sets for on-site/off-site use, perform calculations and analyses, share their results and research experience, and collaborate seamlessly with their colleagues (Eglen et al., 2017).
The benefits for such infrastructure are obvious: results become more robust and at the same time transparent. Developed methods are adapted easier, faster and continuously improved, further, communicated more widely (Chui et al., 2020), which brings the productivity of scientific work to a higher level. On short term, scientific publications would already benefit the most by the direct publication of the full analysis code used, as any code will be a more accurate and complete representation of the analysis than the same part summarized in the body of a text (Eglen et al., 2017; Chui et al., 2020; Gemeinholzer et al., 2020).
On Bridging Functional and Phylogenetic Diversity With *Omics Approaches
Marine science uses genomic, transcriptomic and proteomic tools to learn more about the holistic diversity of marine microbial organisms and their place and order in the ecosystem (Konopka et al., 2015; Caron et al., 2017). The aim is to broaden the understanding of the ecological and evolutionary processes that drive the patterns of diversity seen in marine taxa today (Swenson, 2011). It also aims to find answers in applied questions and contribute to understand how marine microbes affect, for instance, aquaculture stocks, or what role toxins may play in the drug discovery (Querellou, 2010; Díaz et al., 2019).
Functional diversity characterizes the functional aspects within a microbial community. It is assumed that the species of a community correlate positively with the number of functionalities expressed by the community (Caron et al., 2017; Caron and Hu, 2019; Escalas et al., 2019). In contrast to the functional diversity indicated, the phylogenetic diversity of a microbial community varies according to the phylogenetic relationships represented by a taxonomic or phylogenetic tree (Venail et al., 2015). Overall, it is expected that genetic affinity will result in different species sharing functional traits inherited from their common ancestors (Swenson, 2011). A multigene phylogenetic analysis will be the best approach to provide a framework for the correct interpretation of genomic and related trait changes in marine microbes and to complement information on microbial driven processes, e.g., to show the robustness of the organism with respect to climate change (Woyke et al., 2009; Stephens et al., 2018).
Molecular sequence information for marine pro- and eukaryotes are still very limited (Grattepanche et al., 2018; Zhang et al., 2020), especially for functional genes (Gifford et al., 2013; de Vargas et al., 2015). To complement the existing taxonomy of marine microbial communities and to resolve the underlying eco-functional processes, the research is being supported by pursuing the growing field of meta-analyses and unicellular molecular approaches (Cristescu, 2014; Schneider et al., 2020). Obtained sequences of expressed genes will be implemented into existing databases and allow an analytical view into previously undescribed environmental sequences that may highlight metabolic and cellular processes that are crucial for ecosystem functioning. The discovery and characterization of deeply branched relationships between marine microbes will be crucial for the study of the origin and evolution of life in marine ecosystems (Burki et al., 2016; Mathur et al., 2019). It will elucidate how genotypic diversity shapes phenotypic variety and show how this diversity influences the overall functioning of marine ecosystems, e.g., in terms of trophic modes (Faktorová et al., 2020; Schneider et al., 2020).
Sequencing Analysis on a Broader View
On Sequence Analysis Trends
Generally, sequence analysis can be understood as a term for computer-assisted analysis from DNA and RNA originated sequences to gain knowledge on its individual properties, biological functions, structures, and evolution (Karlin and Cardon, 1994). Hence it is important to understand the source of the data and the different molecular methods used to determine and interpret the biological sequence in a correct way and later to combine the respective methods for the best sequence information coverage possible (Rinke et al., 2013; Cristescu, 2014).
Sequencing performances can be carried out as meta and single-cell related approaches. Technological advances, especially improvements in sequencing sensitivity, drive the current trend of approaches toward the later, as single-cell genomics and complementary transcriptomics make it possible to retrieve a large percentage or even almost the entire genomic and transcriptomic information of an investigated cell (Liu et al., 2017; Chui et al., 2020).
On Single*Omics Analysis
Single-cell*omics through second- and third-generation sequencing is emerging as a powerful tool to profile cell-to-cell variability on genomic and transcriptomic levels and to identify individual taxa (Wu et al., 2014). Phenotypically identical cells can vary in behavior and metabolism during their lifespan—and this variation is reflected in their genome and expressed genes as the output from their transcriptome (Conesa et al., 2016; Fan et al., 2020). Overall, enabling unique opportunities to dissect the interplay between intrinsic cellular processes and extrinsic stimuli such as the local environment or neighboring cells under laboratory conditions (Swenson, 2011; Saliba et al., 2014).
Through the variety of *omics approaches, the analysis of individual cells has the potential to change our understanding of the organismic structure, since the heterogeneity and fate of cells within a population can be described and ultimately, the performance of a single unit within the community modeled (Boit et al., 2012; Escalas et al., 2019). Furthermore, since the vast majority of living cells in the environment cannot be cultivated, single-cell*omics pipelines hold the promise of discovering yet unknown species directly from the field by omitting culturing efforts (Kolisko et al., 2014).
Nevertheless, it is also possible to generate and examine the whole genome and transcriptome independently of direct studies on external influences by laboratory experiments. Thus, trying to create the most complete catalog of the genome or transcriptome by direct sequencing of DNA and RNA templates from one cell, respectively (Kunin et al., 2008). By subsequently using marker sequences or by predicting orthologous genes in the targeted *ome, taxa-specific signatures can then be recognized and phylogenies pursued (Rotterová et al., 2020). And by storing the individual sequences in public databases, the resolution of existing sequences can be improved; later facilitating in new marker gene predictions (Keeling et al., 2014).
On Meta*Omics Analysis
Meta*omics analysis of samples with many species make it possible to investigate obtained data in a higher context. Contrary to the single*omics molecular pipelines, these approaches have in common that they rely on “bulk” sampling in which the samples content can be described as being averaged, thus the keyword meta* (Cristescu, 2014). However, bulk sampling, especially on environmental samples, has the disadvantage that sequences from species and genes that are less abundant in the sample are also less frequently sequenced and annotated to a reference, if at all (Cristescu, 2014; Geisen et al., 2019). One could speak of an aggregating effect, in which often-existing sequences come to the foreground, but for this very reason, less frequently occurring ones are pushed into the background. Nevertheless, the sum of such data is greater than the individual drawbacks that can be covered with single-cell approaches as mentioned above.
So-called metabarcoding can provide biodiversity information by the relative abundance of species taxa through corresponding abundance on grouped sequence reads generated via marker gene amplification on environmental samples (Egge et al., 2013; Okie et al., 2020). Combined with metatranscriptomics, hence with information on gene activity during cellular/metabolic processes, the different functions of present species can be elucidated (Moran et al., 2013; Gutleben et al., 2018). Therefore, independently of the single-cell approaches, the combination of these two methods, will intercalate the discussion on the genetic diversity and abundance of species with their spectrum of functions, however, with a broader resolution than on the single-cell level, but giving clues on the population.
As well here, whole genome and transcriptome sequencing can be pursued (Kolisko et al., 2014; Sieracki et al., 2019). Similar to the single-cell technique, this method is non-discriminant toward the DNA or RNA template, so that the sequencer will sequence everything present in the sample as there was no matrix selective step in the workflow (del Campo et al., 2014; Roy et al., 2014). Using this procedure on a pure culture offers the possibly to cover the genome or transcriptome almost fully, as it will sequence many different parts of each organism’s targeted sequence making the reconstruction process strait forward by overlapping a great amount of reads from the same origin.
On Microbial Dark Matter in Databases
Sequencing improves the understanding of individual biological units by providing blueprints for the evolutionary and functional diversity that characterizes the biosphere. However, currently available data on microbial sequences are of limited phylogenetic coverage, as most organisms cannot be cultivated in the laboratory because the right factors for supply under controlled conditions have not been met (Bungartz et al., 2012). With any additional *omic information, it will be possible to resolve many relationships within and between strains and propose new species, taxa and perhaps superphyla. Unexpected metabolic properties will be uncovered and broaden, perhaps even challenge established boundaries between the areas of life.
Nevertheless, the actual extent of marine diversity remains unclear and the number of unassignable sequences continues to increase, limiting the view of the remarkable diversity (del Campo et al., 2014; Grattepanche et al., 2018). This effect may intensify, so that certain species run the risk of being classified incorrectly by force or not at all and then disappear in the pool of dark matter of unannotated sequence reads (Marcy et al., 2007). Without comprehensive and publically available reference data a lot of information will remain lost and not assigned to any species or function (Caron et al., 2009; Caron, 2016). An analysis of the eukaryotic SAR clade (Stramenopila, Alveolata, and Rhizaria) highlights the gap between morphologically described species for which molecular data are lacking: out of 54,275 living species, only 5,663 living species show a distinct molecular entry—this means that almost 90% of the molecular information is missing for this clade (Grattepanche et al., 2018). As for prokaryotes, it is estimated that only 2.1% of the global prokaryotic taxa have been sampled, only covering ∼200,000 bacterial and archaeal genomes sequenced so far (Zhang et al., 2020).
Open-access software tools and web services are often used to perform a bioinformatics analysis described as “sequence matching” (Daugelaite et al., 2013). Herein, the experimental sequence is compared with published sequences in a database of interest. The most commonly used databases are the UniProt Knowledgebase (UniProtKB) and data from the Swiss Institute of Bioinformatics (SwissProt); UniProtKB/SwissProt are both manually annotated databases of verified and non-redundant protein sequences and mostly used in combination (Bateman, 2019). Both knowledge bases combine experimental results, calculated features and scientific conclusions through extensive literature research. In contrast, Protein Families (Pfam) is a database of proteins with one or more functional regions and their different combinations with respect to their function (El-Gebali et al., 2019). Most search queries are entered through the National Center for Biotechnology Information (NCBI), which promotes science and health by providing access to biomedical and genomic information. Further, it is possible to perform searches in GenBank (Clark et al., 2016) and the European Nucleotide Archive (ENA, Leinonen et al., 2011). However, there are also specialized databases available, such as the Marine Microbial Eukaryote Project (with transcriptomic data, Keeling et al., 2014) or the Tara Oceans Science survey (with the V9 region of 18S rRNA, Bork et al., 2015), as well as the Protist Ribosomal Reference Database (PR2, Guillou et al., 2012) for eukaryotic microbes. For prokaryotic microbes, databases like Greengenes (16S, McDonald et al., 2012), Silva (16S, Quast et al., 2013), EzBioCloud (16S, Yoon et al., 2017) and the Ribosomal Database Project (RDP, 16S, Cole et al., 2011) are being available.
It is worthwhile mentioning, that many of these alignments are performed with translated nucleotide sequences, as the sequence length and file size are minimized, thus reducing the computational time and effort. Nucleotide sequences of contigs can be searched in these databases for homologies in amino acid sequences using the Basic Local Alignment Search Tool (BLAST, here blastp) or simply as nucleotide sequences themselves for homologies in nucleotide repositories (blastn) (Altschul et al., 1990). Translation from nucleotide to protein sequence is achieved by identifying open reading frames (ORFs) that are predicted to encode protein sequences based on the nucleotide triplets or codons from the genetic code (Grabherr et al., 2011). Some of the dominant tools for gene prediction in use are Prodigal (for prokaryotes, Hyatt et al., 2010), AUGUSTUS (for eukaryotes, Stanke and Waack, 2003) and TransDecoder (applicable for both groups, Haas et al., 2013). The translated proteins are further searched for homology to known amino acid sequences using blastp against the UniProtKB/SwissProt database and used for a Pfam search, in which protein domains are identified by using probabilistic models, which are called “profile hidden Markov models” (HMMer, Finn et al., 2011). Additional properties such as signal peptides (SignalP, Petersen et al., 2011) and probable transmembrane spanning regions (TmHMM, Krogh et al., 2001) are also queried from databases. Furthermore, euKaryotic Orthologous Groups (KOG) are identified and clustered via EggNOG (Powell et al., 2012). The KOG database offers an integrated representation of genes, gene products and involved pathways. Predicted genes can be further annotated with the database of Gene Ontologies (GO, Ashburner et al., 2000) and their pathway position is given in the Kyoto Encyclopedia of Genes and Genomes (KEGG, Kanehisa and Goto, 2000; Kanehisa et al., 2012). GO arranges biological terms under three ontologies: molecular, cellular and biological processes. Hits within the molecular function describe tasks performed by individual gene products, such as ATPase activity. Entries for biological processes describe broad biological targets, such as metabolic activity, which are achieved by a progression of molecular functions. Entries for cellular processes, on the other hand, name the products that are active in subcellular structures/complexes and sites. The Kegg output stores functions at the molecular level as KO numbers (Kegg orthology), allowing to retrieve knowledge about enzymes, pathways and proteins related to sequenced biological material.
Gen*Omics as the Answer to What Is There?
Gen*omic sequencing is the process of determining the order of nucleotide bases of molecules of DNA (Figure 2). Within these following paragraphs, genomic DNA shall correspond to DNA extracted from a single individual or from a collection of individuals belonging to the same species. Community DNA shall be understood as genomic fragments from many individuals that do not necessarily belong to one species.
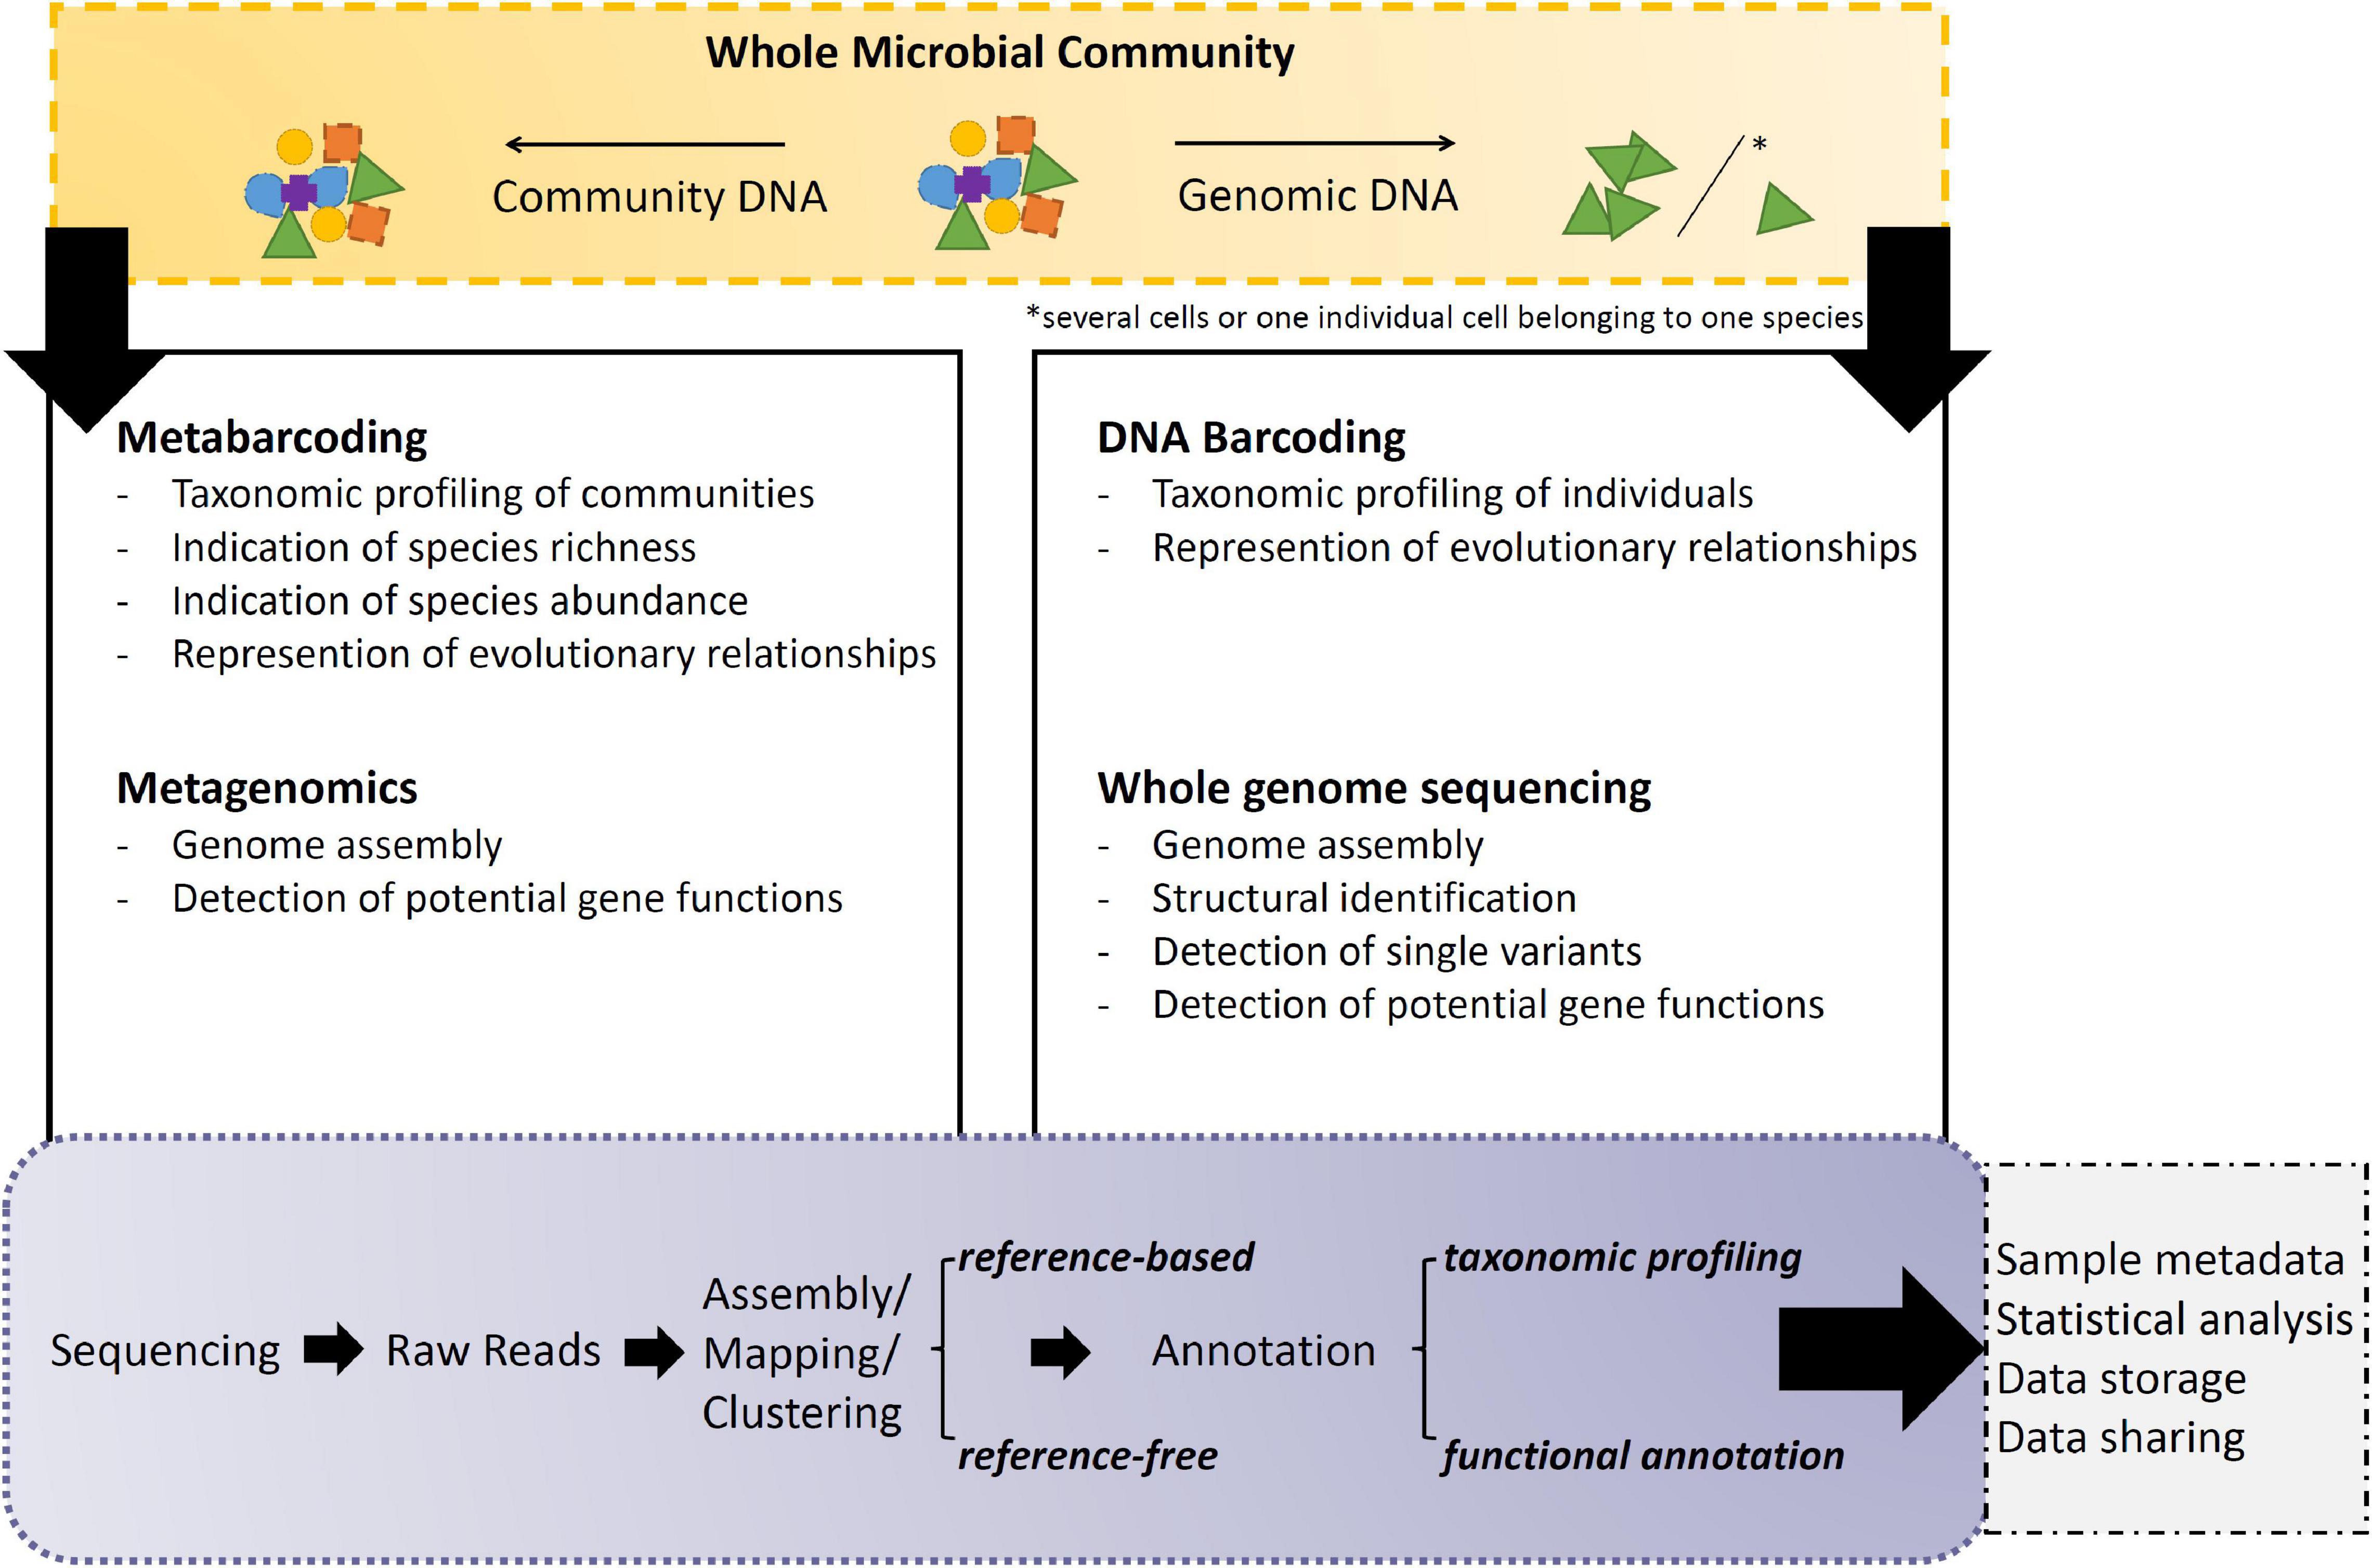
Figure 2. Overall summary of the listed gen*omics applications and their major uses/applications.
(A) DNA barcoding allows the taxonomical identification of a microbial individual based on a PCR product amplified from its genomic DNA (Cristescu, 2014; Zimmermann et al., 2015). The result is a straight forward sequence, corresponding to the marker used, e.g., ribosomal sequences like 16S for prokaryotes and 18S for eukaryotes. So ultimately, after DNA extraction, amplification and sequencing, this amplicon sequence is compared against a reference database containing other sequences amplified with the same barcode (Guillou et al., 2012), e.g., SILVA for prokaryotic ribosomal sequences and PR2 for eukaryotes, respectively. Depending on the resolution, the gene marker is representative of a certain phyla, clade or species, hence being specific enough to distinguish the potential new species from others and eventually leading to its final identification (Spouge and Mariño-Ramírez, 2012). Thus, the DNA barcode must be able to differentiate between different organisms, while not having to represent evolutionary relationships exactly as a marker for orthologous genes in phylogenetic studies would (Spouge and Mariño-Ramírez, 2012; Ekblom and Wolf, 2014). However, in some cases these two options go hand in hand, like with ribosomal primers. When barcoding is used to identify organisms from a sample containing DNA from more than one organism (∼community DNA), it is referred to as metabarcoding (see below).
Advantages: straightforward molecular protocol • taxonomic identification by database matching according to marker gene • suitable for laboratory samples and environmental/field samples • suitable for single-cells and cells originating from culture • approach is resolving cryptic species/phylogenetic placement according gene directly possible • suitable for single-cells from environments (after extensive cleaning).
Limitations: identification limited to database entry/robust reference database needed • universality of the primer to address all species to address species of interest • several genes for phylogenetic identification needed • PCR amplification bias.
Highlights: Medlin et al. (1988) published the primary structure of the 16S-like rRNA from the marine diatom and hereby established the 18S primer pair for marine eukaryotes (1F and 1528R) which is used to this day.
(B) Metabarcoding allows the multiple taxonomical identification of species within an environmental microbial community based on a PCR product amplified from the sample’s extracted community DNA (Aylagas et al., 2016). DNA barcoding and metabarcoding both generate millions of copies from pre-chosen gene regions in parallel, however, the difference lies within the template and the resulting depth of information (Moorthie et al., 2011). As next to the possibility to identify multiple species simultaneously, metabarcoding results can also estimate species abundances to a certain degree (Truchy et al., 2015; Escalas et al., 2019). Thus making it an appropriate tool for monitoring programs, e.g., to capture the seasonal transition in planktonic community composition and food web structure through the year (Armbrust, 2014). Analysis steps for these raw sequences include sample demultiplexing and quality filtering (e.g., trimming), followed by clustering and annotation of clusters based on reference database entries. However, all estimates of species richness and abundance in environmental samples depend on the overall analysis pipeline and the clustering tool chosen (Straub et al., 2020). Avoiding quantification bias due to gene copy number variations is an ongoing discussion in data interpretation (e.g., rRNA copy number variation depending on cell size; Prokopowich et al., 2003). Certain studies report an improvement in data accuracy of microbial community profiles by general (Kembel et al., 2012) or lineage-specific (Angly et al., 2014) gene copy number corrections. Amongst others, there are studies claiming the opposite and do not see the need for such correction at all (Starke et al., 2021) or see limited benefits that only apply for a small fraction of taxa (Louca et al., 2018). Due to the ambiguity of the problem, the analytical approach to be adopted depends strongly on the planned study, where it cannot be excluded that several pipelines have to be tested to find the best species estimate (Pérez-Cobas et al., 2020; Prodan et al., 2020). The read clustering can be performed by two different approaches.3 The comparable “older method” clusters reads by high similarity into units to minimize the effect of possibly introduced errors through sample handling and sequencing (Cristescu, 2014; Bhat et al., 2019). Each then generated operational taxonomic unit (OTU) generated by distance-based clustering is treated as a representative sequence that can be taxonomically assigned based on the marker used (Bhat et al., 2019). However, these OTUs are only valid per study and not comparable with other OTUs from the literature, unless one would combine all reads of all studies of interest and repeat the whole analysis. So on a broader view, this method is limited, as it is not offering a global comparison of results. Thus, a “newer method” has been developed by inferring amplicon sequence variants (ASVs) which pipeline generates “true” sequences based on the statistical support for each sequence’s existence and not by direct similarity (Callahan et al., 2017). As these ASVs represent exact sequences, it opens up the possibility to compare ASVs from multiple studies from the literature. However, as based on statistics, “true” sequences with a lower statistical value might get lost (Callahan et al., 2017; Brandt et al., 2020). In addition, as seen in a recent benchmarking study on bacterial genomes, which often have multiple and not identical 16S rRNA genes, there is a risk of either artificially splitting bacterial genomes into more separate clusters or, conversely, collapsing sequence clusters of different bacterial origin into the same depending on the threshold used (Schloss, 2021). Due to the unknown nature of microbial diversity, this potential obstacle should be considered when working with eukaryotes (Wong et al., 2019) and recently identified new species to avoid bias.
Advantages: straightforward molecular protocol • suitable for laboratory samples and environmental/field samples • characterization of bulk samples with regards to species richness/composition (from laboratory and field) • no need for cell isolation/cultivation.
Limitations: universality of the primer to address all species • identification limited to database entry/robust reference database • limited ability to quantify species abundance • gene copy number variations • PCR amplification bias • artificial splitting or collapsing of sequence clusters.
Highlights: Stoeck et al. (2010) published a Roche 454 protocol for sampling and characterizing 18S assemblages of eukaryote microbes of which the primers are is still in use for metabarcoding approaches.
(C) Whole genome sequencing (WGS) is the study of the complete genome with all coding and non-coding regions of an organism from its genomic DNA (Ekblom and Wolf, 2014). Hereby it is possible to perform this method on a single-celled individuals or multiple cells belonging to one species (Macaulay et al., 2016; Wang and Song, 2017). Unlike focused approaches, such as exome sequencing, which analyze a limited portion of the genome, WGS can deliver a comprehensive view of the entire genome (Leconte et al., 2020). Herein, Whole Genome Amplification (WGA)4 is a crucial step, as unlike conventional PCR it is amplifying the entire genome rather than a specific region of it (Mueller and Brueck, 2021). As this molecular pipeline generates millions of copies of not pre-chosen regions from the genomic DNA, the sequencer is generating reads from all bits of the genome without any pre-selection, which are afterward all assembled into one genome. Overall, this method offers a wide resolution, from detecting single nucleotide variants, insertions/deletions, copy number changes, and large structural variants, etc., in coding and non-coding regions of the genome (Yoon et al., 2011). Single Amplified Genomes (SAGs) are the product of single-cell performed WGA and have been first applied on the ocean’s prokaryotes (Woyke et al., 2009; Stepanauskas, 2012). The methodological approach includes the single cell isolation (manual or via flow cytometric cell sorting), cell lysis, WGA and sequencing. The reconstruction of the single-cell originated genome yields reconstruction rates between 20% in eukaryotes (Mangot et al., 2017) and completeness in prokaryotes (even from uncultured environmental species, Woyke et al., 2010). In addition, it is possible to combine multiple SAGs of a species in a complementary manner, increasing the whole genome recovery rate by up to 70%, by merging reads derived from environmental samples after similarity analysis (Mangot et al., 2017).
Advantages: full identification of all sequence variants of the genome • no pre-selection of genomics regions • no need for cultivation, one biological unit potentially containing a full copy of the DNA is sufficient • generally applicable on bulk and single-cell samples from one species.
Limitations: high computational load for de novo assemblies • only one species at a time/no meta-analysis possible (no applicability on field samples, due to potential contamination) • PCR amplification bias.
Highlights: Woyke et al. (2009) published the first investigation of the biogeographic distribution of uncultured marine Flavobacteria by singe-cell generated genomes.
(D) Metagenomics is the study of multiple genomes obtained from community DNA (Roy et al., 2014; Gutleben et al., 2018), in most cases environmental samples. The metagenome is sequenced as such by random shotgun sequencing with or without prior genome amplification (Thomas T. et al., 2012). Acquired reads are clustered into groups, so-called “bins,” assuming that sequence similarity is reasoned by being derived from the same organism by applying similarity thresholds and other analysis (like tetranucleotide frequency) (Labarre et al., 2021). This process called “binning” is creating individual metagenome-assembled-genomes (MAGs) (Alneberg et al., 2017). Binning is challenged by the presence of related species or contaminations within the community (Worden et al., 2012), which may share conservative genomic regions and uneven reading coverage due to variations in the frequency of different microbes in the sample (Kunin et al., 2008; Mukherjee et al., 2015). The application is especially challenging toward marine eukaryotes, as marine microbial communities are dominated by prokaryotes—additionally, unicellular eukaryotes have larger genomes and lower gene density than marine bacteria and are less abundant, which makes efficient sequence recovery difficult (Cuvelier et al., 2010; Lepere et al., 2011; Stepanauskas, 2012). However, rRNA sequence screening can be used to determine the taxonomic composition of the metagenome to provide clues as to which species are present in the sample (similarly, this can be used with SAGs, Mangot et al., 2017, Supplementary). Ultimately, this can lead to targeted assemblies of individual genomes from metagenomics studies (Vaulot et al., 2012). Metagenomic approaches can be used to study functional responses in DNA as well and therefore facilitate the determination of novel genes (Chauhan, 2019; Labarre et al., 2021). And as with many other methods, the ability to annotate metagenomic samples should further improve as the number of annotated (single) genomes in public databases increases (Gemeinholzer et al., 2020).
Advantages: no pre-selection of genomics regions • applicability mainly on environmental samples • no need for cell isolation/cultivation • overall relatively low input of molecular material.
Limitations: high computational load in deciphering the different genomes present • masking or grouping effect of underrepresented and/or conservative regions.
Highlights: Edwards et al. (2006) is one of the first to apply metagenomics to mine groundwater, sequencing two environmental metagenomes using Roche 454 high-throughput sequencing, resulting in the identification of a number of previously unknown prokaryotes after sequence annotation.
Transcript*Omics as the Answer to What Goes On?
Transcript*omic sequencing is the process of determining the order of nucleotide bases of molecules of expressed genes through sequences of RNA (Figure 3; Kukurba and Montgomery, 2015). Within these following paragraphs, transcriptomic RNA corresponds to total RNA extracted from a single individual or from a collection of individuals belonging to the same species. Community RNA shall be understood as total transcriptomic fragments from many individuals that do not necessarily belong to one species.
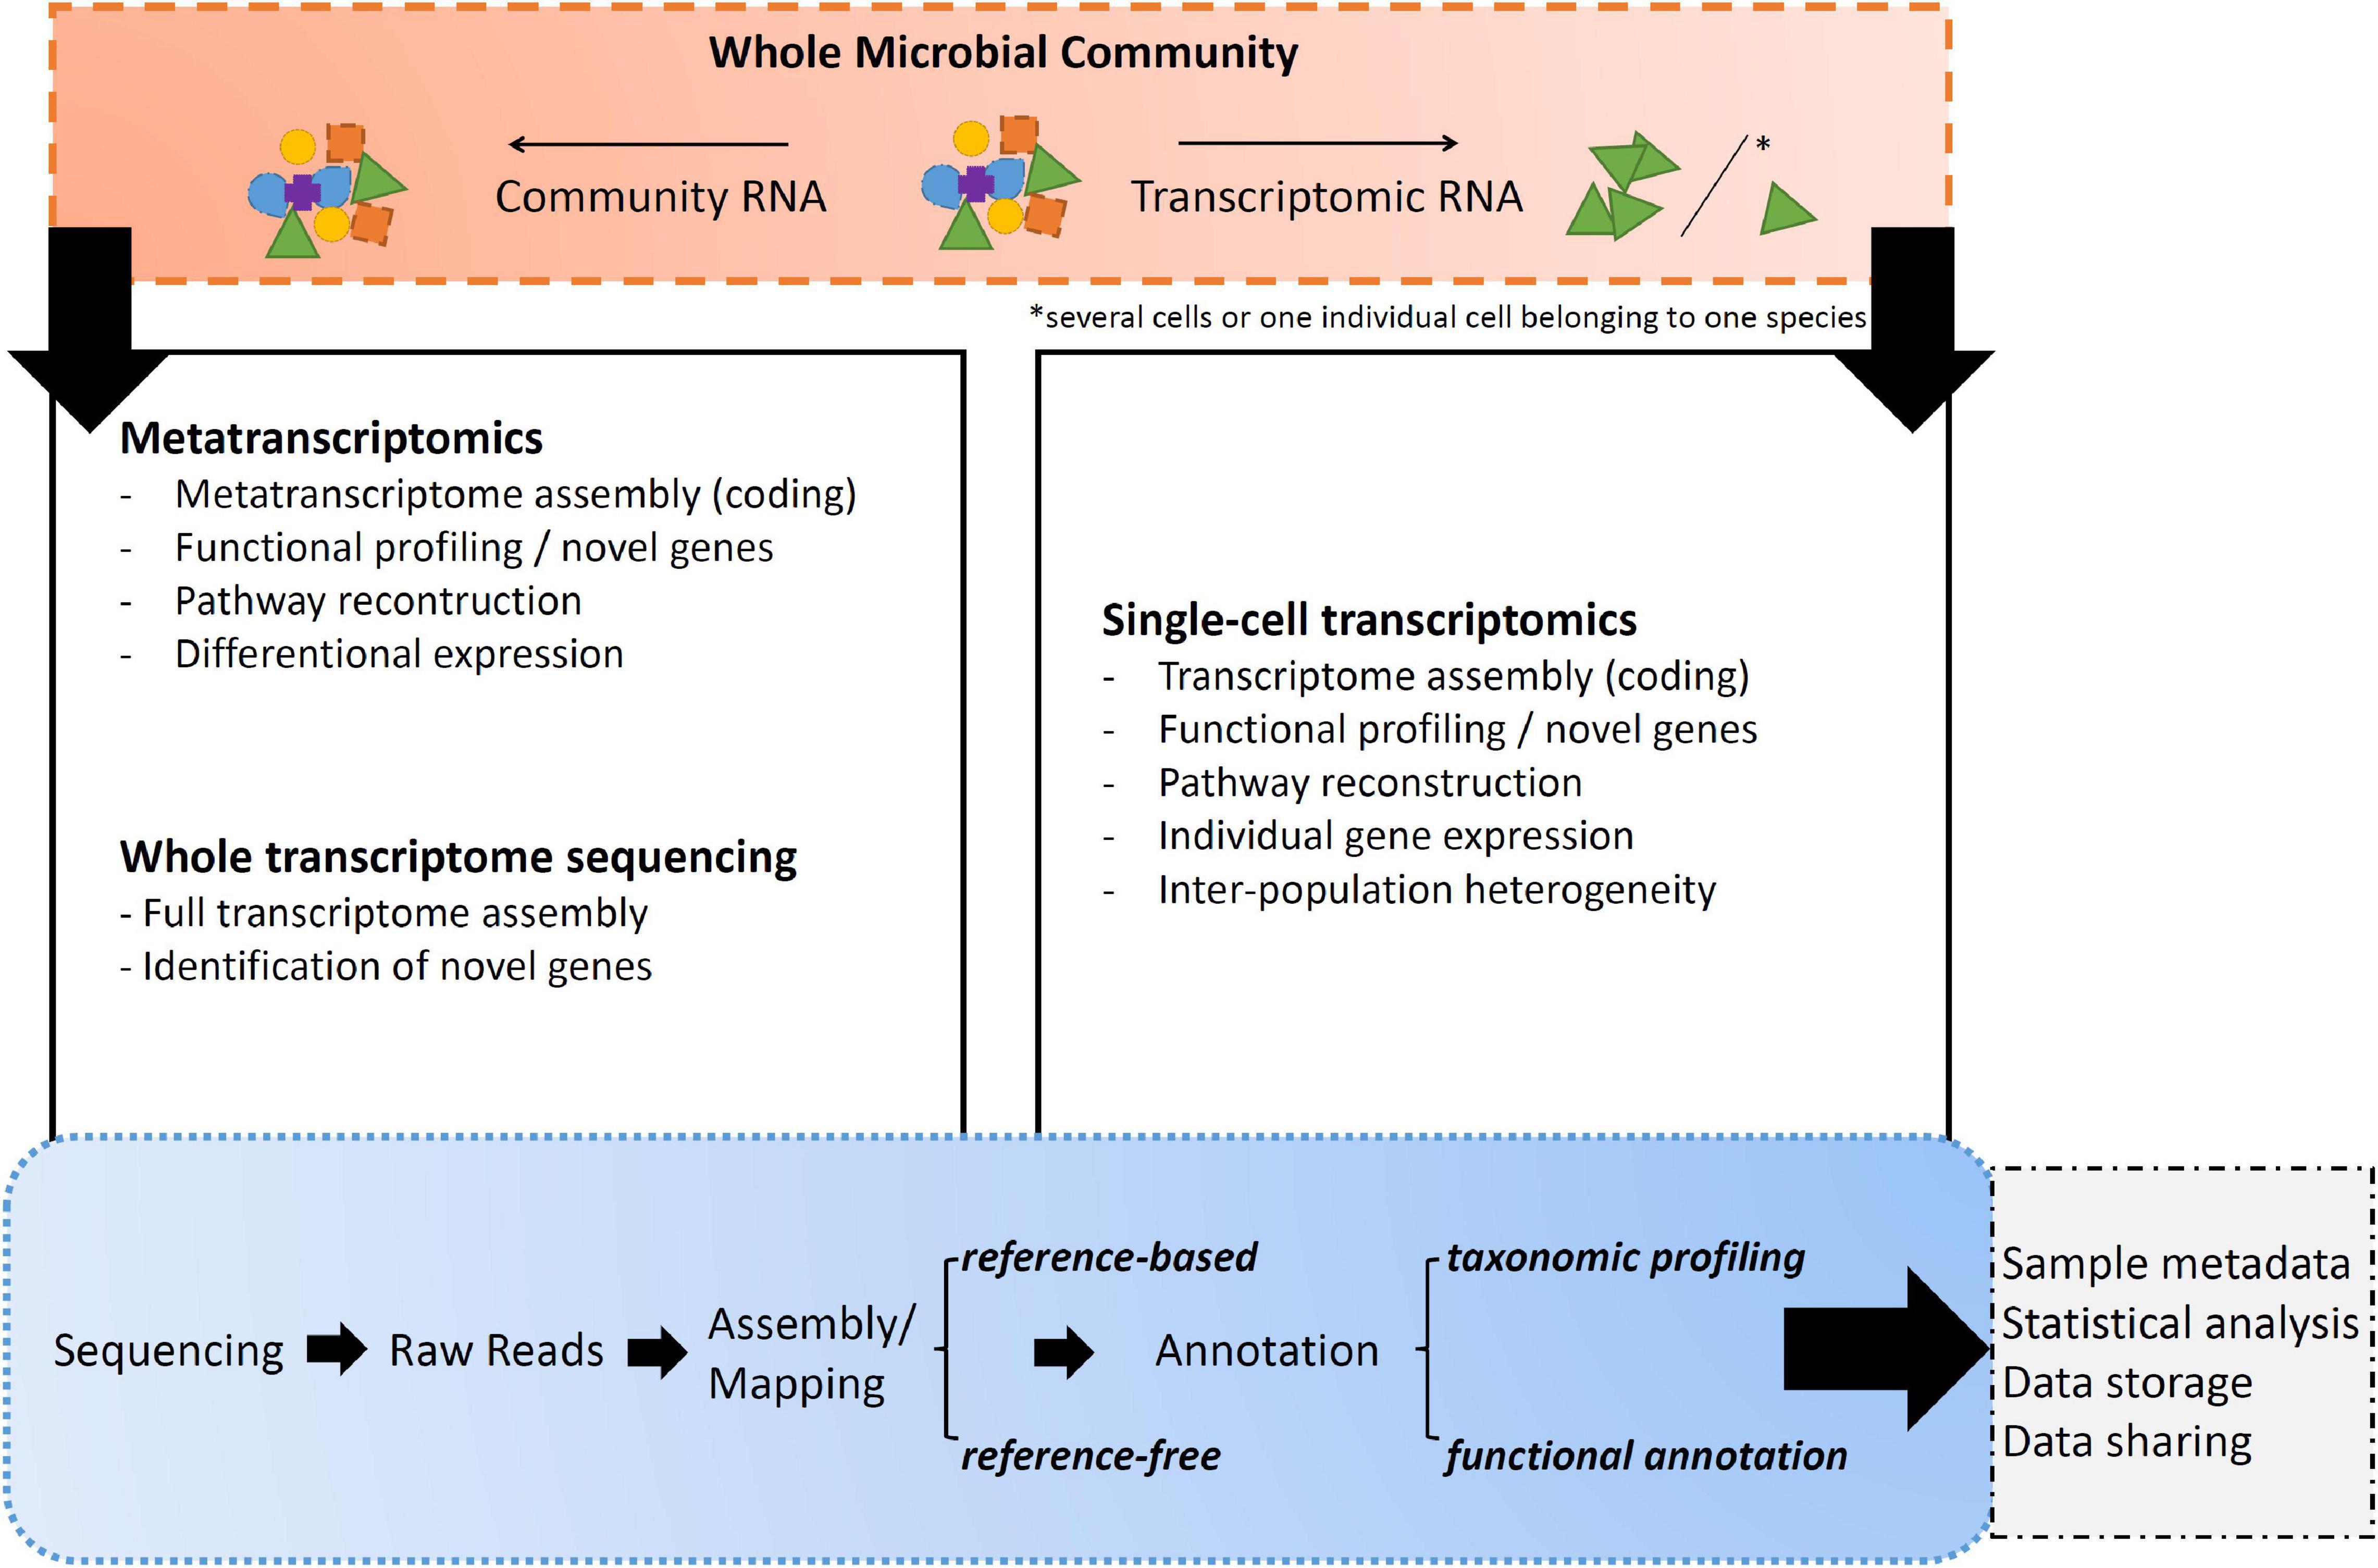
Figure 3. Overall summary of the listed transcript*omics applications and their major uses/applications.
RNA molecules play a significant role in all living cells and moderate a variety of processes (Baßler and Hurt, 2019). Messenger RNA (mRNA) for example is the template responsible for translating the genetic information stored in DNA into proteins composed of amino acids (Gerlt and Babbitt, 2000), each of which has its own type of transfer RNA (tRNA) that binds and transports them to the growing polypeptide chain when needed. Ribosomal RNA (rRNA) is an integral part of both large and small subunits of ribosomes being responsible for protein synthesis in cells. But there are many more varieties of (non-coding) RNA which interplay is not yet fully understood (Thomson et al., 2013).
Transcript*omics allows to study the type and amount of each of the RNA molecules in a given cell under a specific condition and at a given moment (Ziegenhain et al., 2017). A typical RNA sequencing experiment consists of the extraction of total RNA, either from a single cell or a group of cells, purification and evaluation of the RNAs purity and yield (Delhomme et al., 2014). Depending on the molecular pipeline and sequencing platform, enrichment steps can be performed; e.g., by polyadenylated RNA (polyA) selection for mRNA sequencing, size selection or removal of non-target sequences by hybridization on probes (Saliba et al., 2014; Ziegenhain et al., 2018). Nevertheless, most protocols usually start the first-strand synthesis with the reverse transcription of RNA into complementary DNA (cDNA) to stabilize the molecular fragile sequence (Picelli et al., 2013). After clean up, the so-called cDNA libraries may need to be fragmented to meet the size specification of the sequencing platform. After cDNA sequencing, data analysis turns to quality control of the reads in order to align these de novo or, if possible, with a reference. Transcript quantification and differential expression analysis will allow detecting variations in gene expression levels and transcript frequency, alternative splicing as well as gene-isoforms and variations in individual nucleotides, and will highlight the post-transcriptional modifications—which may lead to the discovery of new genes that explain the diverse functional capacity of the ecosystem.
Most of the methods used for RNA-seq data analysis rely on well-annotated reference genomes and on accurate genes of model organisms. Without a reference, a de novo transcriptome assembly is a strait forward approach to study, e.g., gene evolution in species for which reference sequences are lacking (Grabherr et al., 2011; Montero-Mendieta et al., 2017). De novo transcriptome assemblies are based on algorithms that may vary depending on the software used (Haas et al., 2013). However, all de novo assemblers have in common that they are reconstructing the original sequence by using the sequence reads alone, as mentioned, without any references (Miller et al., 2010; Svensson et al., 2018). By use of greedy algorithms, each sequencing read is aligned to every other reads to build an overlapping graph. Afterward, distinct paths through the graph are used to calculate the consensus sequence (Grabherr et al., 2011; Baker, 2012). Contigs are contiguous sequences of reads mapped to this consensus sequence and named transcripts in these studies. One problem within this approach is that repeats are being collapsed into a single contig and unambiguous sequences are seen as individual ones despite maybe just being an isoform. Nevertheless, assembly will become less challenging in the future as the length of reads increases and algorithms are continuously improved (Auer and Doerge, 2010).
(A) Whole transcriptome sequencing (WTS) is the sequencing approach toward transcriptomic RNA extracted from a single individual or from a collection of individuals belonging to the same species (Richardson, 2008). WTS goal is to obtain the most complete picture of the total RNA present in the sample. In this case, the molecular pipeline is not performing any selection to gather all the present RNA fragments, whether they are expressing genes or involved in process regulation (Mason et al., 2012; Weisse, 2017). However, as up to 98% of the cell is consisting of rRNA in any form, it is worth considering rRNA depletion prior library construction as otherwise the sequencing platform might get swamped with this kind of RNA and not capturing the full variety of it, like small RNAs (Tang et al., 2009; Zhuang et al., 2013).
Advantages: full identification of all sequence variants of the transcriptome • no pre-selection of transcriptomic regions • coding and non-coding RNA are retrieved • no need for cultivation • applicable on bulk and single-cell samples.
Limitations: high computational load for de novo assemblies • only one species at a time/no meta-analysis between diverse species possible (therefore rather not or very limited applicability on field samples, due to potential contamination) • transcript identification limited to database entry • multiple sequencing runs might be necessary to recover individual RNA variations.
Highlights: Although the method can be applied as such, no direct marine study is available in which the entire transcriptome, i.e., not only mRNA but equally other small and non-coding RNA species,5 were sequenced and combined. Looking into the molecular protocols for library preparations, it is clear that most perform a polyA selection after which any other form of RNA shall be excluded. Therefore, due to the variability of RNA species, it seems necessary to perform multiple sequencing, after which each RNA species must be sequenced separately and using approaches other than elaborated NGS protocols, as in the case of Lopez-Gomollon et al. (2014), who performed a characterization of small non-coding RNAs in marine microalgae by Illumina sequencing after Northern blotting.
(B) Most dominant transcriptomics approaches can work on both transcriptomic and community extracted total RNA (Gutleben et al., 2018). The difference toward WTS however is, that these RNA-seq libraries are actively targeting the cells mRNA by use of enrichment methods. The standard one is polyA selection of polyadenylated transcripts using oligo dT primers, as in theory all (eukaryotic) mature and coding mRNAs are RNAs with 3′ end polyA tails (Picelli et al., 2013), but will not work on prokaryotic organisms (hence rRNA depletions steps are being pursued). Consequently, by analyzing a collection of ideally pure mRNA sequences from a cell or community, it can be determined when and where each gene was turned “on” or “off” and which processes were active in the metabolism. By collecting and comparing transcriptomes of different types of cells at different stages and under different abiotic factors, a deeper understanding of what constitutes a specific cell type function will be gained (Salazar and Sunagawa, 2017).
(B.1) Single-cell transcriptome sequencing creates a snapshot of mRNAs throughout an isolated cell by use of transcriptomic RNA with polyA selection for eukaryotes or rRNA depletion for prokaryotes (Kong et al., 2008). In recent years, low-input RNA-sequencing methods have been adapted to work with single cells. Thus, increasing the number of unicellular transcriptomes sequenced and deepening the knowledge about the species distribution as well as phylogeny based on functional data analysis pipelines (Svensson et al., 2018). Studies demonstrated the possibility to exploit single-cells to quantify inter-population heterogeneity previously masked in bulk measurements in the field, but also under laboratory conditions (Kolodziejczyk et al., 2015). In addition, the method bypasses the need of cell cultivation. Ultimately, single cell approaches will open new analytical avenues for studying culture independent unicellular microbial species in terms of cell subtypes and gene expression dynamics even in remote areas.
Advantages: exploring gene expression profile at the single-cell level • variations between cells belonging to the same species measurable • applicable on laboratory and environmental samples • detection of low abundance genes.
Limitations: compared to bulk RNA-seq, scRNA-seq produces nosier and more variable data • high computational load in assembly • loss of cell due to isolation step • transcript identification limited to database entry • PCR amplification bias.
Highlights: Liu et al. (2017) compared the transcript recovery rates between one cell and bulk samples originating from two marine laboratory cultures, indicating that transcript recovery is lower due to low copy mRNA numbers and related to cell size.
(B.2) Metatranscriptomic sequencing creates a snapshot of mRNAs throughout a sample originated from community RNA with polyA selection for eukaryotes or rRNA depletion for prokaryotes, thus providing information on gene expression profiles of complex microbial communities (Conesa et al., 2016; Gutleben et al., 2018). This is a very efficient way of generating a large set of functional gene information from across a community of organisms playing a variety of functional roles (Swenson, 2011). The approach is particularly informative for microbial communities when applied in an experimental context where both taxonomic and gene expression patterns are monitored while particular biotic and/or abiotic parameters are being manipulated, hence helping to predict the relationship between mRNA abundance and protein activity (Salazar and Sunagawa, 2017; Faktorová et al., 2020). However, environmental metatranscriptomics is not without challenges, including the inability to assign functions to a majority of mRNA sequences as most of the existing databases contain mostly genes from cultured species and the most abundant genes from a limited number of environmental samples (del Campo et al., 2014; Keeling et al., 2014). Despite these current limitations, analysis of mRNA pools in environmental sample is still a powerful *omics tool for assessing microbial driven ecological processes (Acevedo-Trejos et al., 2015).
Advantages: applicable on laboratory and environmental samples • presents averaged gene expression across thousands of cells • no individual cell isolation needed.
Limitations: high computational load in assembly • masking effect on low abundant genes • transcript identification limited to database entry • PCR amplification bias.
Highlights: Frias-Lopez et al. (2008) performed the first metatranscriptomic study on Prochlorococcus cultures and revealed not only indigenous gene- and taxon-specific expression patterns but also gene categories being undetected in previous metagenomic surveys taken from the field.
On Phylo*Omics Through Multiple Sequence Alignment
In terms of biodiversity studies, phylo*omics can be most useful to refine the species identification and to understand their evolutionary history at different taxonomic levels (Burki et al., 2016). Although most studies aim to identify taxa using DNA markers with a single signature, some groups may be problematic and may require multiple markers for correct species classification (Daugelaite et al., 2013). In fact, these sequences may show differences at the nucleotide level, but are still very similar overall. Classical alignment algorithms compare and recognize similarities between biological sequences (Zielezinski et al., 2017). Which “similarities” are detected depends on the goals of the respective alignment process used.
Multiple sequence alignment has the unique advantage that it can reveal more biological information than many of the pairwise alignments (Zielezinski et al., 2017; Bayat et al., 2019). For example, it allows the identification of conserved sequence patterns and motifs throughout the sequence family, which would not be easily detected when comparing only two of the sequences (Bleidorn, 2017). Many conserved and functionally critical amino acid residues can be identified in a protein multiple alignment. Multiple sequence alignment is also an essential prerequisite for phylogenetic analyses of sequence families and the prediction of secondary and tertiary protein structures (Daugelaite et al., 2013; Chatzou et al., 2016). The results are then converted into evolutionary distances to create a distance matrix for all sequences involved. The tree reflects the evolutionary proximity between all sequences—in this case the evolutionary relationship between marine microbial microbes and can be based on DNA and RNA retrieved sequences alike (del Campo et al., 2014; Adl et al., 2019).
Advantages: • identification of functionally important and conversed motifs • phylogenetic analysis (even for yet non-annotated sequences) • structure prediction • global and local alignments possible (depending on the sequence’s confidence and complexity).
Limitations: • computationally complex • iterative choice of substitution matrix • large evolutionary distances between sequences create phylogenetic uncertainty • phylogenetic classification of unannotated sequences depends on the certainty/identity of sequences from the database • unequal sequence lengths and multi-domain proteins (in terms of gap penalties).
Highlights: Janouškovec et al. (2017) created a dataset of dinoflagellate transcriptomes to resolve internal phylogenetic relationships this diverse group, revealing major molecular and morphological transitions in by horizontal gene transfer.
Conclusion
The microbial structure and interaction of microbes within marine food webs determines the overall systems productivity and performance. The lack of precise taxonomic information makes the planktonic assessment of the aquatic system difficult. Bulk sampling of marine microbial organisms results involuntarily in a loss of taxonomic information, which is essential for monitoring community changes driven by e.g., climate change.
The taxonomic identity contains information on the overall functional potential, since different species or genera have different lifestyles and thus perform a variety of different functions within the marine ecosystem. But only the combination of metagenomic analyses and metatranscriptomics alike will ultimately clarify how current species are responding to different and changing environmental conditions. Metabarcoding and metatranscriptomics combined have proven to be good methods to link snapshots of community compositions to averaged gene expressions in environmental bulk samples, but single-cell*omics approaches are emerging as they are determining functional insights of individuals by directly linking expressed genes to a function.
But without single-cell reference data, the pool of unassigned reads will grow and studies based on meta-analyses will continue to be largely biased. The possibility to work with one single cell eliminates the need of cell cultivation and gives the opportunity to process a cell directly from the field. Further, it enables the identification of phylogenetic markers for evolutionary studies and phylogenetic systematics to study various microbial organisms of pro- and eukaryotic origin via multiple sequence alignment. Nevertheless, all of the sequencing approaches should be multidisciplinary coupled with other fields within chemistry and biology and never work as a stand-alone tool to determine the organism’s identity and its genes true function.
Outlook
The paramount description of the organismic and functional diversity of marine microbes is a central dogma in order to understand how marine ecosystems work. And as the number of sequencing platforms grows, so is the amount of data being generated to answer essential questions on the ecosystem function. With every further technical development, faster software and, in particular, falling costs for high-throughput methods, the possibilities of experimental designs increase. Herein, *omics approaches proof themselves as a valuable toolbox elucidating the black box on the complexity of life’s networks.
With a greater amount of data, including technical and biological replicates, any analysis will become more robust and stable in identifying correlations and statistically significant patterns. However, with a greater variety of data and scientific questions to answer, the need to build appropriate bioinformatics tools and infrastructures to enable robust algorithms and efficient pipelines for data analysis will rise. And while sequencing costs are expected to continue to fall, the costs of data analysis and storage shall remain more or less constant. Therefore, the large gap between sequencing and analysis functions is expected to widen and eventually shifting its focus from analysis to storage.
As in every rapidly growing field, the need for respective experts for molecular work, sequencing itself and general bioinformatics analysis increase which carries the risk of encapsulating knowledge along the pipeline. Therefore, we must think more interdisciplinary than before, so that the methodological approaches are not wasted, but result in the best possible synergies to answer specific questions in order to take appropriate actions in relation to climate change.
Author Contributions
SNW drafted and reviewed the article based on the comments and suggestions of peer reviewers.
Funding
This work was supported by the Deutsche Forschungsgemeinschaft (DFG) in the framework of the “Taxon-OMICS” priority program (SPP 1991 – JO 702/13-1).
Conflict of Interest
The author declares that the research was conducted in the absence of any commercial or financial relationships that could be construed as a potential conflict of interest.
Publisher’s Note
All claims expressed in this article are solely those of the authors and do not necessarily represent those of their affiliated organizations, or those of the publisher, the editors and the reviewers. Any product that may be evaluated in this article, or claim that may be made by its manufacturer, is not guaranteed or endorsed by the publisher.
Footnotes
- ^ Marine viruses play an important role in the cycling of matter through cell lysis and the associated release of nutrients (Jover et al., 2014). Likewise are archaea critical contributors to the global carbon and nitrogen redox cycles (Parada and Fuhrman, 2017). Despite the stated importance of both microbial groups, this review focuses on microbial prokaryotes and eukaryotes in general, to keep certain aspects shorter and therefore more beneficial for the reader.
- ^ L.G.M.B. Becking’s paradigm that all microbial life is globally distributed, but that most microbial species are only latently present in a given environment, is one of the most important ecological concepts (Becking, 1934; O’Malley, 2007). It also states that most small-scale microbial biodiversity escapes our observation because most species occur at densities below our detection limit (de Wit and Bouvier, 2006; O’Malley, 2007). Overall, this paradigm opens the door to a full discussion of species distribution and abundance (Falkowski et al., 2008), whether molecular methods have the potential to accurately reflect them and how functional genes have adapted alike (Fondi et al., 2016)—however, this will not be addressed further in this review. But the reader is encouraged to engage with the literature cited.
- ^ Selected clustering approaches for operational taxonomic unit (OTU) are: Swarm (Mahé et al., 2014), mothur (Schloss et al., 2009), QUIIME (Callahan et al., 2016), VSEARCH (Rognes et al., 2016). Selected clustering approaches for amplicon sequence variants (ASVs) are: DADA2 (Callahan et al., 2016), QIIME2-Deblur (Amir et al., 2017, ASVs are referred to as “sub-OTUs”; Bolyen et al., 2019), USEARCH-UNOISE3 (Edgar, 2016, ASVs are referred to as “zero noise OTUs”). Prodan et al. (2020) are benchmarking selected clustering approaches, for OTU and ASV alike.
- ^ Several methods have been developed for WGA, including multiple displacement amplification (MDA, Blanco et al., 1989), degenerate oligonucleotide PCR (DOP-PCR; Telenius et al., 1992), and primer extension preamplification (PEP, Zhang et al., 1992). While DOP-PCR and PEP are based on standard PCR techniques, MDA can be achieved with an isothermal reaction setup (New England BioLabs Inc, 2021).
- ^ More generalized information on non-coding RNA variants can be found in Storz (2002) and Wang et al. (2009).
References
Acevedo-Trejos, E., Brandt, G., Bruggeman, J., and Merico, A. (2015). Mechanisms shaping size structure and functional diversity of phytoplankton communities in the ocean. Sci. Rep. 5:8918. doi: 10.1038/srep08918
Adl, S. M., Bass, D., Lane, C. E., Lukeš, J., Schoch, C. L., Smirnov, A., et al. (2019). Revisions to the Classification, Nomenclature, and Diversity of Eukaryotes. J. Eukaryot. Microbiol. 66, 4–119. doi: 10.1111/jeu.12691
Akbar, M. A., Ahmad, A., Usup, G., and Bunawan, H. (2018). Current Knowledge and Recent Advances in Marine Dinoflagellate Transcriptomic Research. J. Mar. Sci. Eng. 6:13. doi: 10.3390/jmse6010013
Allan, G. J., and Max, T. L. (2010). Molecular Genetic Techniques and Markers for Ecological Research. Nat. Educ. Knowl. 3:2.
Alneberg, J., Karlsson, C., Divne, A.-M., Bergin, C., Homa, F., Lindh, M., et al. (2017). Genomes from uncultivated prokaryotes: a comparison of metagenome-assembled and single-amplified genomes. bioRxiv [preprint]. doi: 10.1101/219295
Altschul, S. F., Gish, W., Miller, W., Myers, E. W., and Lipman, D. J. (1990). Basic local alignment search tool. J. Mol. Biol. 215, 403–410. doi: 10.1016/S0022-2836(05)80360-2
Amir, A., McDonald, D., Navas-Molina, J. A., Kopylova, E., Morton, J. T., Zech, X. Z., et al. (2017). Deblur rapidly resolves single-nucleotide community sequence patterns. mSystems 2. doi: 10.1128/mSystems.00191-16
Angly, F. E., Dennis, P. G., Skarshewski, A., Vanwonterghem, I., Hugenholtz, P., and Tyson, G. W. (2014). CopyRighter: a rapid tool for improving the accuracy of microbial community profiles through lineage-specific gene copy number correction. Microbiome 2:11. doi: 10.1186/2049-2618-2-11
Ardyna, M., and Arrigo, K. R. (2020). Phytoplankton dynamics in a changing Arctic Ocean. Nat. Clim. Chang. 10, 892–903. doi: 10.1038/s41558-020-0905-y
Armbrust, E. V. (2014). Taking the pulse of ocean microbes. Science 345, 134–135. doi: 10.1126/science.1256578
Ashburner, M., Ball, C. A., Blake, J. A., Botstein, D., Butler, H., Cherry, J. M., et al. (2000). Gene Ontology: tool for the unification of biology. Nat. Genet. 25, 25–29. doi: 10.1038/75556
Auer, P. L., and Doerge, R. W. (2010). Statistical design and analysis of RNA sequencing data. Genetics 185, 405–416. doi: 10.1534/genetics.110.114983
Aylagas, E., Borja, Á, Irigoien, X., and Rodríguez-Ezpeleta, N. (2016). Benchmarking DNA metabarcoding for biodiversity-based monitoring and assessment. Front. Mar. Sci. 3:96. doi: 10.3389/fmars.2016.00096
Baker, M. (2012). De novo genome assembly: what every biologist should know. Nat. Methods 9, 333–337. doi: 10.1038/nmeth.1935
Bang, C., Dagan, T., Deines, P., Dubilier, N., Duschl, W. J., Fraune, S., et al. (2018). Metaorganisms in extreme environments: do microbes play a role in organismal adaptation? Zoology 127, 1–19. doi: 10.1016/j.zool.2018.02.004
Bar-On, Y. M., Phillips, R., and Milo, R. (2018). The biomass distribution on Earth. Proc. Natl. Acad. Sci. U. S. A. 115, 6506–6511. doi: 10.1073/pnas.1711842115
Barton, A. D., Dutkiewicz, S., Flierl, G., Bragg, J., and Follows, M. J. (2010). Patterns of Diversity in Marine Phytoplankton. Science 327, 1509–1511. doi: 10.1126/science.1184961
Bateman, A. (2019). UniProt: a worldwide hub of protein knowledge. Nucleic Acids Res. 47, D506–D515. doi: 10.1093/nar/gky1049
Bayat, A., Gaëta, B., Ignjatovic, A., and Parameswaran, S. (2019). Pairwise alignment of nucleotide sequences using maximal exact matches. BMC Bioinformatics 20:261. doi: 10.1186/s12859-019-2827-0
Baßler, J., and Hurt, E. (2019). Eukaryotic Ribosome Assembly. Annu. Rev. Biochem. 88, 281–306. doi: 10.1146/annurev-biochem-013118-110817
Becking, L. G. M. B. (1934). Geobiologie of inleiding tot de milieukunde (No. 18-19). Netherlands: WP Van Stockum & Zoon.
Bhat, A. H., Prabhu, P., and Balakrishnan, K. (2019). A critical analysis of state-of-the-art metagenomics OTU clustering algorithms. J. Biosci. 44:148. doi: 10.1007/s12038-019-9964-5
Biogene Blog (2017). The Next Generation Sequencing Platform of Roche 454. Roche 454, 1. Available Online at: https://www.creative-biogene.com/blog/index.php/2017/02/02/the-next-generation-sequencing-platform-of-roche-454/ (accessed July 27, 2021)
Blanco, L., Bernad, A., Lázaro, J. M., Martín, G., Garmendia, C., and Salas, M. (1989). Highly efficient DNA synthesis by the phage phi 29 DNA polymerase. Symmetrical mode of DNA replication. J. Biol. Chem. 264, 8935–8940.
Bleidorn, C. (2017). Phylogenomics. 1st ed. Cham: Springer International Publishing, doi: 10.1007/978-3-319-54064-1
Boit, A., Martinez, N. D., Williams, R. J., and Gaedke, U. (2012). Mechanistic theory and modelling of complex food-web dynamics in Lake Constance. Ecol. Lett. 15, 594–602. doi: 10.1111/j.1461-0248.2012.01777.x
Bolyen, E., Rideout, J. R., Dillon, M. R., Bokulich, N. A., Abnet, C. C., Al-Ghalith, G. A., et al. (2019). Reproducible, interactive, scalable and extensible microbiome data science using QIIME 2. Nat. Biotechnol. 37, 852–857. doi: 10.1038/s41587-019-0209-9
Bork, P., Bowler, C., de Vargas, C., Gorsky, G., Karsenti, E., and Wincker, P. (2015). Tara Oceans studies plankton at planetary scale. Science 348:873. doi: 10.1126/science.aac5605
Brandt, M. I., Trouche, B., Quintric, L., Wincker, P., Poulain, J., and Arnaud-Haond, S. (2020). A flexible pipeline combining clustering and correction tools for prokaryotic and eukaryotic metabarcoding. bioRxiv [preprint]. doi: 10.1101/717355
Brown, K. V. (2019). A $100 Genome is Within Reach, Illumina CEO Asks if World is Ready, Bloomberg, February 27, 2019. Available online at: https://www.bloomberg.com/news/articles/2019-02-27/a-100-genome-within-reach-illumina-ceo-asks-if-world-is-ready (accessed August 20, 2021).
Bungartz, F., Ziemmeck, F., Tirado, N., Jaramillo, P., Herrera, H., and Jiménez-Uzcátegui, G. (2012). “The neglected majority: biodiversity inventories as an integral part of conservation biology”, in The Role of Science for Conservation, eds M. Wolff and M. Gardener (Milton Park: Routledge), 119–142. doi: 10.4324/9780203126790
Burki, F., Kaplan, M., Tikhonenkov, D. V., Zlatogursky, V., Minh, B. Q., Radaykina, L. V., et al. (2016). Untangling the early diversification of eukaryotes: a phylogenomic study of the evolutionary origins of Centrohelida, Haptophyta and Cryptista. Proc. R. Soc. B Biol. Sci. 283, 1–10. doi: 10.1098/rspb.2015.2802
Button, K. S., Ioannidis, J. P. A., Mokrysz, C., Nosek, B. A., Flint, J., Robinson, E. S. J., et al. (2013). Power failure: why small sample size undermines the reliability of neuroscience. Nat. Rev. Neurosci. 14, 365–376. doi: 10.1038/nrn3475
Callahan, B. J., McMurdie, P. J., and Holmes, S. P. (2017). Exact sequence variants should replace operational taxonomic units in marker-gene data analysis. ISME J. 11, 2639–2643. doi: 10.1038/ismej.2017.119
Callahan, B. J., McMurdie, P. J., Rosen, M. J., Han, A. W., Johnson, A. J. A., and Holmes, S. P. (2016). DADA2: high-resolution sample inference from Illumina amplicon data. Nat. Methods 13, 581–583. doi: 10.1038/nmeth.3869
Caron, D. A. (2016). Mixotrophy stirs up our understanding of marine food webs. Proc. Natl. Acad. Sci. U. S. A. 113, 2806–2808. doi: 10.1073/pnas.1600718113
Caron, D. A., Alexander, H., Allen, A. E., Archibald, J. M., Armbrust, E. V., Bachy, C., et al. (2017). Probing the evolution, ecology and physiology of marine protists using transcriptomics. Nat. Rev. Microbiol. 15, 6–20. doi: 10.1038/nrmicro.2016.160
Caron, D. A., and Hu, S. K. (2019). Are We Overestimating Protistan Diversity in Nature? Trends Microbiol. 27, 197–205. doi: 10.1016/j.tim.2018.10.009
Caron, D. A., Worden, A. Z., Countway, P. D., Demir, E., and Heidelberg, K. B. (2009). Protists are microbes too: a perspective. ISME J. 3, 4–12. doi: 10.1038/ismej.2008.101
Cavicchioli, R., Ripple, W. J., Timmis, K. N., Azam, F., Bakken, L. R., Baylis, M., et al. (2019). Scientists’ warning to humanity: microorganisms and climate change. Nat. Rev. Microbiol. 17, 569–586. doi: 10.1038/s41579-019-0222-5
Chatzou, M., Magis, C., Chang, J.-M., Kemena, C., Bussotti, G., Erb, I., et al. (2016). Multiple sequence alignment modeling: methods and applications. Brief. Bioinform. 17, 1009–1023. doi: 10.1093/bib/bbv099
Chauhan, N. S. (2019). “Metagenome analysis and interpretation,” in Data Processing Handbook for Complex Biological Data Sources, ed G. Misra (Amsterdam: Elsevier), 139–160. doi: 10.1016/B978-0-12-816548-5.00010-1
Ching, T., Himmelstein, D. S., Beaulieu-Jones, B. K., Kalinin, A. A., Do, B. T., Way, G. P., et al. (2018). Opportunities and obstacles for deep learning in biology and medicine. J. R. Soc. Interface 15:20170387. doi: 10.1098/rsif.2017.0387
Christensen, K., Dukhovny, D., Siebert, U., and Green, R. (2015). Assessing the Costs and Cost-Effectiveness of Genomic Sequencing. J. Pers. Med. 5, 470–486. doi: 10.3390/jpm5040470
Christensen, K. D., Phillips, K. A., Green, R. C., and Dukhovny, D. (2018). Cost Analyses of Genomic Sequencing: lessons Learned from the MedSeq Project. Value Health 21, 1054–1061. doi: 10.1016/j.jval.2018.06.013
Chui, M., Evers, M., Manyika, J., Zheng, A., and Nisbet, T. (2020). The Bio Revolution: innovations Transforming Economies, Societies, and Our Lives, San Francisco: McKinsey & Co.
Clark, K., Karsch-Mizrachi, I., Lipman, D. J., Ostell, J., and Sayers, E. W. (2016). GenBank. Nucleic Acids Res. 44, D67–D72. doi: 10.1093/nar/gkv1276
Cole, J. R., Wang, Q., Chai, B., and Tiedje, J. M. (2011). “The Ribosomal Database Project: sequences and software for high-throughput rRNA analysis,” in Handbook of Molecular Microbial Ecology I: metagenomics and Complementary Approaches, ed. F. J. de Bruijn (Hoboken, NJ: J. Wiley & Sons, Inc).
Conesa, A., Madrigal, P., Tarazona, S., Gomez-Cabrero, D., Cervera, A., McPherson, A., et al. (2016). A survey of best practices for RNA-seq data analysis. Genome Biol. 17:13. doi: 10.1186/s13059-016-0881-8
Costello, M. J., and Chaudhary, C. (2017). Marine Biodiversity, Biogeography, Deep-Sea Gradients, and Conservation. Curr. Biol. 27, R511–R527. doi: 10.1016/j.cub.2017.04.060
Cristescu, M. E. (2014). From barcoding single individuals to metabarcoding biological communities: towards an integrative approach to the study of global biodiversity. Trends Ecol. Evol. 29, 566–571. doi: 10.1016/j.tree.2014.08.001
Cuvelier, M. L., Allen, A. E., Monier, A., McCrow, J. P., Messie, M., Tringe, S. G., et al. (2010). Targeted metagenomics and ecology of globally important uncultured eukaryotic phytoplankton. Proc. Natl. Acad. Sci. U. S. A. 107, 14679–14684. doi: 10.1073/pnas.1001665107
Daugelaite, J., O’ Driscoll, A., and Sleator, R. D. (2013). An Overview of Multiple Sequence Alignments and Cloud Computing in Bioinformatics. ISRN Biomath. 2013, 1–14. doi: 10.1155/2013/615630
de Vargas, C., Audic, S., Henry, N., Decelle, J., Mahe, F., Logares, R., et al. (2015). Eukaryotic plankton diversity in the sunlit ocean. Science 348:1261605. doi: 10.1126/science.1261605
de Wit, R., and Bouvier, T. (2006). “Everything is everywhere, but, the environment selects”; what did Baas Becking and Beijerinck really say? Environ. Microbiol. 8, 755–758. doi: 10.1111/j.1462-2920.2006.01017.x
del Campo, J., Sieracki, M. E., Molestina, R., Keeling, P., Massana, R., and Ruiz-Trillo, I. (2014). The others: our biased perspective of eukaryotic genomes. Trends Ecol. Evol. 29, 252–259. doi: 10.1016/j.tree.2014.03.006
Delhomme, N., Mahler, N., Schiffthaler, B., Sundell, D., Mannapperuma, C., Hvidsten, T. R., et al. (2014). Guidelines for RNA-Seq data analysis. Epigenesys Protoc. 67, 1–24.
Díaz, P. A., Álvarez, G., Varela, D., Pérez-Santos, I., Díaz, M., Molinet, C., et al. (2019). Impacts of harmful algal blooms on the aquaculture industry: chile as a case study. Perspect. Phycol. 6, 39–50. doi: 10.1127/pip/2019/0081
Edgar, R. (2016). UNOISE2: improved error-correction for Illumina 16S and ITS amplicon sequencing. bioRxiv [preprint] doi: 10.1101/081257
Edwards, K. F., Thomas, M. K., Klausmeier, C. A., and Litchman, E. (2016). Phytoplankton growth and the interaction of light and temperature: a synthesis at the species and community level. Limnol. Oceanogr. 61, 1232–1244. doi: 10.1002/lno.10282
Edwards, R. A., Rodriguez-Brito, B., Wegley, L., Haynes, M., Breitbart, M., Peterson, D. M., et al. (2006). Using pyrosequencing to shed light on deep mine microbial ecology. BMC Genomics 7:57. doi: 10.1186/1471-2164-7-57
Egge, E., Bittner, L., Andersen, T., Audic, S., de Vargas, C., and Edvardsen, B. (2013). 454 Pyrosequencing to Describe Microbial Eukaryotic Community Composition, Diversity and Relative Abundance: a Test for Marine Haptophytes. PLoS One 8:e74371. doi: 10.1371/journal.pone.0074371
Eglen, S. J., Marwick, B., Halchenko, Y. O., Hanke, M., Sufi, S., Gleeson, P., et al. (2017). Toward standard practices for sharing computer code and programs in neuroscience. Nat. Neurosci. 20, 770–773. doi: 10.1038/nn.4550
Ekblom, R., and Wolf, J. B. W. (2014). A field guide to whole-genome sequencing, assembly and annotation. Evol. Appl. 7, 1026–1042. doi: 10.1111/eva.12178
El-Gebali, S., Mistry, J., Bateman, A., Eddy, S. R., Luciani, A., Potter, S. C., et al. (2019). The Pfam protein families database in 2019. Nucleic Acids Res. 47, D427–D432. doi: 10.1093/nar/gky995
Escalas, A., Hale, L., Voordeckers, J. W., Yang, Y., Firestone, M. K., Alvarez-Cohen, L., et al. (2019). Microbial functional diversity: from concepts to applications. Ecol. Evol. 9, 12000–12016. doi: 10.1002/ece3.5670
Faktorová, D., Nisbet, R. E. R., Fernández Robledo, J. A., Casacuberta, E., Sudek, L., Allen, A. E., et al. (2020). Genetic tool development in marine protists: emerging model organisms for experimental cell biology. Nat. Methods 17, 481–494. doi: 10.1038/s41592-020-0796-x
Falkowski, P. G., Fenchel, T., and Delong, E. F. (2008). The Microbial Engines That Drive Earth’s Biogeochemical Cycles. Science 320, 1034–1039. doi: 10.1126/science.1153213
Fan, J., Slowikowski, K., and Zhang, F. (2020). Single-cell transcriptomics in cancer: computational challenges and opportunities. Exp. Mol. Med. 52, 1452–1465. doi: 10.1038/s12276-020-0422-0
Fenchel, T. (1988). Marine Plankton Food Chains. Annu. Rev. Ecol. Syst. 19, 19–38. doi: 10.1146/annurev.es.19.110188.000315
Field, C. B., Behrenfeld, M. J., Randerson, J. T., and Falkowski, P. (1998). Primary production of the biosphere: integrating terrestrial and oceanic components. Science 281, 237–240. doi: 10.1126/science.281.5374.237
Finn, R. D., Clements, J., and Eddy, S. R. (2011). HMMER web server: interactive sequence similarity searching. Nucleic Acids Res. 39, W29–W37. doi: 10.1093/nar/gkr367
Follows, M. J., Dutkiewicz, S., Grant, S., and Chisholm, S. W. (2007). Emergent Biogeography of Microbial Communities in a Model Ocean. Science 315, 1843–1846. doi: 10.1126/science.1138544
Fondi, M., Karkman, A., Tamminen, M. V., Bosi, E., Virta, M., Fani, R., et al. (2016). “Every Gene Is Everywhere but the Environment Selects”: global Geolocalization of Gene Sharing in Environmental Samples through Network Analysis. Genome Biol. Evol. 8, 1388–1400. doi: 10.1093/gbe/evw077
Fox, E. J., Reid-Bayliss, K. S., Emond, M. J., and Loeb, L. A. (2014). Accuracy of Next Generation Sequencing Platforms. Next Gener. Seq. Appl. 1, 61–70. doi: 10.4172/jngsa.1000106
French, K. L., Hallmann, C., Hope, J. M., Schoon, P. L., Zumberge, J. A., Hoshino, Y., et al. (2015). Reappraisal of hydrocarbon biomarkers in Archean rocks. Proc. Natl. Acad. Sci. U. S. A. 112, 5915–5920. doi: 10.1073/pnas.1419563112
Frias-Lopez, J., Shi, Y., Tyson, G. W., Coleman, M. L., Schuster, S. C., Chisholm, S. W., et al. (2008). Microbial community gene expression in ocean surface waters. Proc. Natl. Acad. Sci. U. S. A. 105, 3805–3810. doi: 10.1073/pnas.0708897105
Gandomi, A., and Haider, M. (2015). Beyond the hype: big data concepts, methods, and analytics. Int. J. Inf. Manage. 35, 137–144. doi: 10.1016/j.ijinfomgt.2014.10.007
Geisen, S., Vaulot, D., Mahé, F., Lara, E., and de Vargas, C. (2019). A user guide to environmental protistology: primers, metabarcoding, sequencing, and analyses. bioRxiv [preprint]. doi: 10.1101/850610
Gemeinholzer, B., Vences, M., Beszteri, B., Bruy, T., Felden, J., Kostadinov, I., et al. (2020). Data storage and data re-use in taxonomy—the need for improved storage and accessibility of heterogeneous data. Org. Divers. Evol. 20, 1–8. doi: 10.1007/s13127-019-00428-w
Gerlt, J. A., and Babbitt, P. C. (2000). Can sequence determine function? Genome Biol 1:REVIEWS0005. doi: 10.1186/gb-2000-1-5-reviews0005
Giani, A. M., Gallo, G. R., Gianfranceschi, L., and Formenti, G. (2020). Long walk to genomics: history and current approaches to genome sequencing and assembly. Comput. Struct. Biotechnol. J. 18, 9–19. doi: 10.1016/j.csbj.2019.11.002
Gifford, S. M., Sharma, S., Booth, M., and Moran, M. A. (2013). Expression patterns reveal niche diversification in a marine microbial assemblage. ISME J. 7, 281–298. doi: 10.1038/ismej.2012.96
Goh, S. H., Driedger, D., Gillett, S., Low, D. E., Hemmingsen, S. M., Amos, M., et al. (1998). Streptococcus iniae, a Human and Animal Pathogen: specific Identification by the Chaperonin 60 Gene Identification Method. J. Clin. Microbiol. 36, 2164–2166. doi: 10.1128/JCM.36.7.2164-2166.1998
Goodwin, S., McPherson, J. D., and McCombie, W. R. (2016). Coming of age: ten years of next-generation sequencing technologies. Nat. Rev. Genet. 17, 333–351. doi: 10.1038/nrg.2016.49
Grabherr, M. G., Haas, B. J., Yassour, M., Levin, J. Z., Thompson, D. A., Amit, I., et al. (2011). Full-length transcriptome assembly from RNA-Seq data without a reference genome. Nat. Biotechnol. 29, 644–652. doi: 10.1038/nbt.1883
Grattepanche, J.-D., Walker, L. M., Ott, B. M., Paim Pinto, D. L., Delwiche, C. F., Lane, C. E., et al. (2018). Microbial Diversity in the Eukaryotic SAR Clade: illuminating the Darkness Between Morphology and Molecular Data. BioEssays 40:e1700198. doi: 10.1002/bies.201700198
Guillou, L., Bachar, D., Audic, S., Bass, D., Berney, C., Bittner, L., et al. (2012). The Protist Ribosomal Reference database (PR2): a catalog of unicellular eukaryote Small Sub-Unit rRNA sequences with curated taxonomy. Nucleic Acids Res. 41, D597–D604. doi: 10.1093/nar/gks1160
Gupta, A. K., and Gupta, U. (2020). “Next generation sequencing and its applications,” in Animal Biotechnology, A. Verma and A. Singh, (Amsterdam: Elsevier), 395–421. doi: 10.1016/B978-0-12-811710-1.00018-5
Gutleben, J., Chaib De Mares, M., van Elsas, J. D., Smidt, H., Overmann, J., and Sipkema, D. (2018). The multi-omics promise in context: from sequence to microbial isolate. Crit. Rev. Microbiol. 44, 212–229. doi: 10.1080/1040841X.2017.1332003
Haas, B. J., Papanicolaou, A., Yassour, M., Grabherr, M., Blood, P. D., Bowden, J., et al. (2013). De novo transcript sequence reconstruction from RNA-seq using the Trinity platform for reference generation and analysis. Nat. Protoc. 8, 1494–1512. doi: 10.1038/nprot.2013.084
Hagstrom, G. I., and Levin, S. A. (2017). Marine Ecosystems as Complex Adaptive Systems: emergent Patterns, Critical Transitions, and Public Goods. Ecosystems 20, 458–476. doi: 10.1007/s10021-017-0114-3
Hamsher, S. E., LeGresley, M. M., Martin, J. L., and Saunders, G. W. (2013). A Comparison of Morphological and Molecular-Based Surveys to Estimate the Species Richness of Chaetoceros and Thalassiosira (Bacillariophyta), in the Bay of Fundy. PLoS One 8:e73521. doi: 10.1371/journal.pone.0073521
Hastings, R. A., Rutterford, L. A., Freer, J. J., Collins, R. A., Simpson, S. D., and Genner, M. J. (2020). Climate Change Drives Poleward Increases and Equatorward Declines in Marine Species. Curr. Biol. 30, 1572–1577.e2. doi: 10.1016/j.cub.2020.02.043
Heather, J. M., and Chain, B. (2016). The sequence of sequencers: the history of sequencing DNA. Genomics 107, 1–8. doi: 10.1016/j.ygeno.2015.11.003
Heidelberg, K. B., Gilbert, J. A., and Joint, I. (2010). Marine genomics: at the interface of marine microbial ecology and biodiscovery: minireview. Microb. Biotechnol. 3, 531–543. doi: 10.1111/j.1751-7915.2010.00193.x
Hennon, G. M. M., and Dyhrman, S. T. (2020). Progress and promise of omics for predicting the impacts of climate change on harmful algal blooms. Harmful Algae 91:101587. doi: 10.1016/j.hal.2019.03.005
Hoffecker, I. T., Yang, Y., Bernardinelli, G., Orponen, P., and Högberg, B. (2019). A computational framework for DNA sequencing microscopy. Proc. Natl. Acad. Sci. U. S. A. 116, 19282–19287. doi: 10.1073/pnas.1821178116
Hollmer, M. (2013). Roche to close 454 Life Sciences as it reduces gene sequencing focus. FIERCE Biotech, 1. Available Online at: https://www.fiercebiotech.com/medical-devices/roche-to-close-454-life-sciences-as-it-reduces-gene-sequencing-focus (accessed July 27, 2021)
Hyatt, D., Chen, G.-L., Locascio, P. F., Land, M. L., Larimer, F. W., and Hauser, L. J. (2010). Prodigal: prokaryotic gene recognition and translation initiation site identification. BMC Bioinformatics 11:119. doi: 10.1186/1471-2105-11-119
International Human Genome Sequencing Consortium (2004). Finishing the euchromatic sequence of the human genome. Nature 431, 931–945. doi: 10.1038/nature03001
IPCC (2019). IPPC Special Report on the Ocean and Cryosphere in a Changing Climate. Cambridge: Cambridge University Press.
Janouškovec, J., Gavelis, G. S., Burki, F., Dinh, D., Bachvaroff, T. R., Gornik, S. G., et al. (2017). Major transitions in dinoflagellate evolution unveiled by phylotranscriptomics. Proc. Natl. Acad. Sci. U. S. A. 114, E171–E180. doi: 10.1073/pnas.1614842114
Jover, L. F., Effler, T. C., Buchan, A., Wilhelm, S. W., and Weitz, J. S. (2014). The elemental composition of virus particles: implications for marine biogeochemical cycles. Nat. Rev. Microbiol. 12, 519–528. doi: 10.1038/nrmicro3289
Kanehisa, M., and Goto, S. (2000). KEGG: kyoto encyclopedia of genes and genomes. Nucleic Acids Res. 28, 27–30. doi: 10.1093/nar/28.1.27
Kanehisa, M., Goto, S., Sato, Y., Furumichi, M., and Tanabe, M. (2012). KEGG for integration and interpretation of large-scale molecular data sets. Nucleic Acids Res. 40, D109–D114. doi: 10.1093/nar/gkr988
Kapli, P., Yang, Z., and Telford, M. J. (2020). Phylogenetic tree building in the genomic age. Nat. Rev. Genet. 21, 428–444. doi: 10.1038/s41576-020-0233-0
Karlin, S., and Cardon, L. R. (1994). Computational DNA sequence analysis. Annu. Rev. Microbiol. 48, 619–654. doi: 10.1146/annurev.mi.48.100194.003155
Kchouk, M., Gibrat, J. F., and Elloumi, M. (2017). Generations of Sequencing Technologies: from First to Next Generation. Biol. Med. 09, 1–8. doi: 10.4172/0974-8369.1000395
Keeling, P. J. (2019). Combining morphology, behaviour and genomics to understand the evolution and ecology of microbial eukaryotes. Philos. Trans. R. Soc. B Biol. Sci. 374:20190085. doi: 10.1098/rstb.2019.0085
Keeling, P. J., Burki, F., Wilcox, H. M., Allam, B., Allen, E. E., Amaral-Zettler, L. A., et al. (2014). The Marine Microbial Eukaryote Transcriptome Sequencing Project (MMETSP): illuminating the Functional Diversity of Eukaryotic Life in the Oceans through Transcriptome Sequencing. PLoS Biol. 12:e1001889. doi: 10.1371/journal.pbio.1001889
Kembel, S. W., Wu, M., Eisen, J. A., and Green, J. L. (2012). Incorporating 16S Gene Copy Number Information Improves Estimates of Microbial Diversity and Abundance. PLoS Comput. Biol. 8:e1002743. doi: 10.1371/journal.pcbi.1002743
King, W. L., Siboni, N., Kahlke, T., Green, T. J., Labbate, M., and Seymour, J. R. (2019). A New High Throughput Sequencing Assay for Characterizing the Diversity of Natural Vibrio Communities and Its Application to a Pacific Oyster Mortality Event. Front. Microbiol. 10:2907. doi: 10.3389/fmicb.2019.02907
Kodama, Y., Shumway, M., and Leinonen, R. (2012). The sequence read archive: explosive growth of sequencing data. Nucleic Acids Res. 40, D54–D56. doi: 10.1093/nar/gkr854
Kolisko, M., Boscaro, V., Burki, F., Lynn, D. H., and Keeling, P. J. (2014). Single-cell transcriptomics for microbial eukaryotes. Curr. Biol. 24, R1081–R1082. doi: 10.1016/j.cub.2014.10.026
Kolodziejczyk, A. A., Kim, J. K., Svensson, V., Marioni, J. C., and Teichmann, S. A. (2015). The Technology and Biology of Single-Cell RNA Sequencing. Mol. Cell 58, 610–620. doi: 10.1016/j.molcel.2015.04.005
Kong, Q., Stockinger, M. P., Chang, Y., Tashiro, H., and Lin, C. G. (2008). The presence of rRNA sequences in polyadenylated RNA and its potential functions. Biotechnol. J. 3, 1041–1046. doi: 10.1002/biot.200800122
Konopka, A., Lindemann, S., and Fredrickson, J. (2015). Dynamics in microbial communities: unraveling mechanisms to identify principles. ISME J. 9, 1488–1495. doi: 10.1038/ismej.2014.251
Koren, S., Harhay, G. P., Smith, T. P. L., Bono, J. L., Harhay, D. M., Mcvey, S. D., et al. (2013). Reducing assembly complexity of microbial genomes with single-molecule sequencing. Genome Biol. 14:R101. doi: 10.1186/gb-2013-14-9-r101
Krogh, A., Larsson, B., von Heijne, G., and Sonnhammer, E. L. L. (2001). Predicting transmembrane protein topology with a hidden markov model: application to complete. J. Mol. Biol. 305, 567–580. doi: 10.1006/jmbi.2000.4315
Kukurba, K. R., and Montgomery, S. B. (2015). RNA Sequencing and Analysis. Cold Spring Harb. Protoc. 2015, 951–969. doi: 10.1101/pdb.top084970
Kulski, J. K. (2016). “Next-Generation Sequencing - An Overview of the History, Tools, and ‘Omic’ Applications,” in Next Generation Sequencing - Advances, Applications and Challenges, Chap. 1, ed. J. K. Kulski (London: InTech), doi: 10.5772/61964
Kunin, V., Copeland, A., Lapidus, A., Mavromatis, K., and Hugenholtz, P. (2008). A Bioinformatician’s Guide to Metagenomics. Microbiol. Mol. Biol. Rev. 72, 557–578. doi: 10.1128/mmbr.00009-08
Kuska, B. (1998). Beer, Bethesda, and Biology: how “Genomics” Came Into Being. JNCI J. Natl. Cancer Inst. 90, 93–93. doi: 10.1093/jnci/90.2.93
Labarre, A., López-Escardó, D., Latorre, F., Leonard, G., Bucchini, F., Obiol, A., et al. (2021). Comparative genomics reveals new functional insights in uncultured MAST species. ISME J. 15, 1767–1781. doi: 10.1038/s41396-020-00885-8
Ledergerber, C., and Dessimoz, C. (2011). Base-calling for next-generation sequencing platforms. Brief. Bioinform. 12, 489–497. doi: 10.1093/bib/bbq077
Lee, H., Gurtowski, J., Yoo, S., Nattestad, M., Marcus, S., Goodwin, S., et al. (2016). Third-Generation Sequencing and the Future of Genomics. BioRxiv [preprint] doi: 10.1101/048603
Leinonen, R., Akhtar, R., Birney, E., Bower, L., Cerdeno-Tarraga, A., Cheng, Y., et al. (2011). The European Nucleotide Archive. Nucleic Acids Res. 39, D28–D31. doi: 10.1093/nar/gkq967
Leconte, J., Benites, L. F., Vannier, T., Wincker, P., Piganeau, G., and Jaillon, O. (2020). Genome resolved biogeography of mamiellales. Genes (Basel) 11. doi: 10.3390/genes11010066
Lepere, C., Demura, M., Kawachi, M., Romac, S., Probert, I., and Vaulot, D. (2011). Whole-genome amplification (WGA) of marine photosynthetic eukaryote populations. FEMS Microbiol. Ecol. 76, 513–523. doi: 10.1111/j.1574-6941.2011.01072.x
Lewis, J. S., Farnsworth, M. L., Burdett, C. L., Theobald, D. M., Gray, M., and Miller, R. S. (2017). Biotic and abiotic factors predicting the global distribution and population density of an invasive large mammal. Sci. Rep. 7:44152. doi: 10.1038/srep44152
Liu, L., Li, Y., Li, S., Hu, N., He, Y., Pong, R., et al. (2012). Comparison of Next-Generation Sequencing Systems. J. Biomed. Biotechnol. 2012, 1–11. doi: 10.1155/2012/251364
Liu, Z., Hu, S. K., Campbell, V., Tatters, A. O., Heidelberg, K. B., and Caron, D. A. (2017). Single-cell transcriptomics of small microbial eukaryotes: limitations and potential. ISME J. 11, 1282–1285. doi: 10.1038/ismej.2016.190
Lopez-Gomollon, S., Beckers, M., Rathjen, T., Moxon, S., Maumus, F., Mohorianu, I., et al. (2014). Global discovery and characterization of small non-coding RNAs in marine microalgae. BMC Genomics 15:697. doi: 10.1186/1471-2164-15-697
Louca, S., Doebeli, M., and Parfrey, L. W. (2018). Correcting for 16S rRNA gene copy numbers in microbiome surveys remains an unsolved problem. Microbiome 6:41. doi: 10.1186/s40168-018-0420-9
Macaulay, I. C., Teng, M. J., Haerty, W., Kumar, P., Ponting, C. P., and Voet, T. (2016). Separation and parallel sequencing of the genomes and transcriptomes of single cells using G&T-seq. Nat. Protoc. 11, 2081–2103. doi: 10.1038/nprot.2016.138
Mahé, F., Rognes, T., Quince, C., de Vargas, C., and Dunthorn, M. (2014). Swarm: robust and fast clustering method for amplicon-based studies. PeerJ 2:e593. doi: 10.7717/peerj.593
Mangot, J.-F., Logares, R., Sánchez, P., Latorre, F., Seeleuthner, Y., Mondy, S., et al. (2017). Accessing the genomic information of unculturable oceanic picoeukaryotes by combining multiple single cells. Sci. Rep. 7:41498. doi: 10.1038/srep41498
Marcy, Y., Ouverney, C., Bik, E. M., Lösekann, T., Ivanova, N., Martin, H. G., et al. (2007). Dissecting biological “dark matter” with single-cell genetic analysis of rare and uncultivated TM7 microbes from the human mouth. Proc. Natl. Acad. Sci. U. S. A. 104, 11889–11894. doi: 10.1073/pnas.0704662104
Mardis, E. R. (2010). The $1,000 genome, the $100,000 analysis? Genome Med. 2:84. doi: 10.1186/gm205
Mason, O. U., Hazen, T. C., Borglin, S., Chain, P. S. G., Dubinsky, E. A., Fortney, J. L., et al. (2012). Metagenome, metatranscriptome and single-cell sequencing reveal microbial response to Deepwater Horizon oil spill. ISME J. 6, 1715–1727. doi: 10.1038/ismej.2012.59
Mathur, V., Kolísko, M., Hehenberger, E., Irwin, N. A. T., Leander, B. S., and Kristmundsson, Á, et al. (2019). Multiple Independent Origins of Apicomplexan-Like Parasites. Curr. Biol. 29, 2936–2941.e5. doi: 10.1016/j.cub.2019.07.019
McDonald, D., Price, M. N., Goodrich, J., Nawrocki, E. P., DeSantis, T. Z., Probst, A., et al. (2012). An improved Greengenes taxonomy with explicit ranks for ecological and evolutionary analyses of bacteria and archaea. ISME J. 6, 610–618. doi: 10.1038/ismej.2011.139
Medlin, L., Elwood, H. J., Stickel, S., and Sogin, M. L. (1988). The characterization of enzymatically amplified eukaryotic 16S-like rRNA-coding regions. Gene 71, 491–499. doi: 10.1016/0378-1119(88)90066-2
Miller, J. R., Koren, S., and Sutton, G. (2010). Assembly algorithms for next-generation sequencing data. Genomics 95, 315–327. doi: 10.1016/j.ygeno.2010.03.001
Montero-Mendieta, S., Grabherr, M., Lantz, H., De la Riva, I., Leonard, J. A., Webster, M. T., et al. (2017). A practical guide to build de-novo assemblies for single tissues of non-model organisms: the example of a Neotropical frog. PeerJ 5:e3702. doi: 10.7717/peerj.3702
Moorthie, S., Mattocks, C. J., and Wright, C. F. (2011). Review of massively parallel DNA sequencing technologies. Hugo J. 5, 1–12. doi: 10.1007/s11568-011-9156-3
Moran, M. A., Satinsky, B., Gifford, S. M., Luo, H., Rivers, A., Chan, L., et al. (2013). Sizing up metatranscriptomics. ISME J. 7, 237–243. doi: 10.1038/ismej.2012.94
Moreton, J., Izquierdo, A., and Emes, R. D. (2016). Assembly, Assessment, and Availability of De novo Generated Eukaryotic Transcriptomes. Front. Genet. 6:361. doi: 10.3389/fgene.2015.00361
Morgan, T. J., Garland, T., Irwin, B. L., Swallow, J. G., and Carter, P. A. (2003). The mode of evolution of molecular markers in populations of hose mice under artificial selection for locomotor behavior. J. Hered. 94, 236–242. doi: 10.1093/jhered/esg021
Mueller, E., and Brueck, C. (2021). Whole Genome Amplification for Single Cell Biology. n.a., 1. Available Online at: https://www.sigmaaldrich.com/DE/de/technical-documents/technical-article/genomics/pcr/whole-genome-amplification (accessed July 29, 2021).
Mukherjee, S., Huntemann, M., Ivanova, N., Kyrpides, N. C., and Pati, A. (2015). Large-scale contamination of microbial isolate genomes by illumina Phix control. Stand. Genomic Sci. 10, 1–4. doi: 10.1186/1944-3277-10-18
NCBI Insights (2020). We want to hear from you about changes to NIH’s Sequence Read Archive data format and storage. Available Online at: https://ncbiinsights.ncbi.nlm.nih.gov/2020/06/30/sra-rfi/#more-4025 (accessed on 2021-06-10).
NCBI Insights (2021). The wait is over…NIH’s Public Sequence Read Archive is now open access on the cloud. Available Online at: https://ncbiinsights.ncbi.nlm.nih.gov/2021/05/27/nih-open-access-cloud-sra/#more-5813 (accessed on 2021-06-10).
New England BioLabs Inc (2021). Whole Genome Application. Available Online at: https://international.neb.com/applications/dna-amplification-pcr-and-qpcr/whole-genome-amplification (accessed on 2021-06-11).
Nifong, J. C., and Silliman, B. (2017). Abiotic factors influence the dynamics of marine habitat use by a highly mobile “freshwater” top predator. Hydrobiologia 802, 155–174. doi: 10.1007/s10750-017-3255-7
NOAA (2021). How much oxygen comes from the ocean? National Ocean Service website. Available Online at: https://oceanservice.noaa.gov/facts/ocean-oxygen.html (accessed on 2021-06-09).
Okie, J. G., Poret-Peterson, A. T., Lee, Z. M. P., Richter, A., Alcaraz, L. D., Eguiarte, L. E., et al. (2020). Genomic adaptations in information processing underpin trophic strategy in a whole-ecosystem nutrient enrichment experiment. Elife 9:e49816. doi: 10.7554/eLife.49816
O’Malley, M. A. (2007). The nineteenth century roots of “everything is everywhere.”. Nat. Rev. Microbiol. 5, 647–651. doi: 10.1038/nrmicro1711
Pagaling, E., Strathdee, F., Spears, B. M., Cates, M. E., Allen, R. J., and Free, A. (2014). Community history affects the predictability of microbial ecosystem development. ISME J. 8, 19–30. doi: 10.1038/ismej.2013.150
Papageorgiou, L., Eleni, P., Raftopoulou, S., Mantaiou, M., Megalooikonomou, V., and Vlachakis, D. (2018). Genomic big data hitting the storage bottleneck. EMBnet J. 24, 139–148.
Parada, A. E., and Fuhrman, J. A. (2017). Marine archaeal dynamics and interactions with the microbial community over 5 years from surface to seafloor. ISME J. 11, 2510–2525. doi: 10.1038/ismej.2017.104
Paszkiewicz, K. H., Farbos, A., O’Neill, P., and Moore, K. (2014). Quality control on the frontier. Front. Genet. 5:157. doi: 10.3389/fgene.2014.00157
Pawlowski, J., Lejzerowicz, F., Apotheloz-Perret-Gentil, L., Visco, J., and Esling, P. (2016). Protist metabarcoding and environmental biomonitoring: time for change. Eur. J. Protistol. 55, 12–25. doi: 10.1016/j.ejop.2016.02.003
Pérez-Cobas, A. E., Gomez-Valero, L., and Buchrieser, C. (2020). Metagenomic approaches in microbial ecology: an update on whole-genome and marker gene sequencing analyses. Microb. Genomics 6, 1–22. doi: 10.1099/mgen.0.000409
Petersen, T. N., Brunak, S., von Heijne, G., and Nielsen, H. (2011). SignalP 4.0: discriminating signal peptides from transmembrane regions. Nat. Methods 8, 785–786. doi: 10.1038/nmeth.1701
Picelli, S., Björklund, ÅK., Faridani, O. R., Sagasser, S., Winberg, G., and Sandberg, R. (2013). Smart-seq2 for sensitive full-length transcriptome profiling in single cells. Nat. Methods 10, 1096–1108. doi: 10.1038/nmeth.2639
Pinsky, M. L., Selden, R. L., and Kitchel, Z. J. (2020). Climate-Driven Shifts in Marine Species Ranges: scaling from Organisms to Communities. Ann. Rev. Mar. Sci. 12, 153–179. doi: 10.1146/annurev-marine-010419-010916
Powell, S., Szklarczyk, D., Trachana, K., Roth, A., Kuhn, M., Muller, J., et al. (2012). eggNOG v3.0: orthologous groups covering 1133 organisms at 41 different taxonomic ranges. Nucleic Acids Res. 40, D284–D289. doi: 10.1093/nar/gkr1060
Prodan, A., Tremaroli, V., Brolin, H., Zwinderman, A. H., Nieuwdorp, M., and Levin, E. (2020). Comparing bioinformatic pipelines for microbial 16S rRNA amplicon sequencing. PLoS One 15:e0227434. doi: 10.1371/journal.pone.0227434
Prokopowich, C. D., Gregory, T. R., and Crease, T. J. (2003). The correlation between rDNA copy number and genome size in eukaryotes. Genome 46, 48–50. doi: 10.1139/g02-103
Quast, C., Pruesse, E., Yilmaz, P., Gerken, J., Schweer, T., Yarza, P., et al. (2013). The SILVA ribosomal RNA gene database project: improved data processing and web-based tools. Nucleic Acids Res. 41, D590–D596. doi: 10.1093/nar/gks1219
Querellou, J. (2010). Marine Biotechnology: a New Vision and Strategy for Europe. Mar. Board ESF Position Paper 15, 64–68.
Regalado, A. (2020). China’s BGI Says it Can Sequence a Genome for Just $100. MIT Technology Review, February 26, 2020. Available online at: https://www.technologyreview.com/2020/02/26/905658/china-bgi-100-dollar-genome/ (accessed August 20, 2021).
Reuter, J. A., Spacek, D. V., and Snyder, M. P. (2015). High-Throughput Sequencing Technologies. Mol. Cell 58, 586–597. doi: 10.1016/j.molcel.2015.05.004
Rinke, C., Schwientek, P., Sczyrba, A., Ivanova, N. N., Anderson, I. J., Cheng, J.-F., et al. (2013). Insights into the phylogeny and coding potential of microbial dark matter. Nature 499, 431–447. doi: 10.1038/nature12352
Rognes, T., Flouri, T., Nichols, B., Quince, C., and Mahé, F. (2016). VSEARCH: a versatile open source tool for metagenomics. PeerJ 4:e2584. doi: 10.7717/peerj.2584
Rotterová, J., Salomaki, E., Pánek, T., Bourland, W., Žihala, D., Táborský, P., et al. (2020). Genomics of New Ciliate Lineages Provides Insight into the Evolution of Obligate Anaerobiosis. Curr. Biol. 30, 2037–2050.e6. doi: 10.1016/j.cub.2020.03.064
Roy, R. S., Price, D. C., Schliep, A., Cai, G., Korobeynikov, A., Yoon, H. S., et al. (2014). Single cell genome analysis of an uncultured heterotrophic stramenopile. Sci. Rep. 4:4780. doi: 10.1038/srep04780
Rubinoff, D., and Holland, B. S. (2005). Between two extremes: mitochondrial DNA is neither the panacea nor the nemesis of phylogenetic and taxonomic inference. Syst. Biol. 54, 952–961. doi: 10.1080/10635150500234674
Salazar, G., and Sunagawa, S. (2017). Marine microbial diversity. Curr. Biol. 27, R489–R494. doi: 10.1016/j.cub.2017.01.017
Saliba, A.-E., Westermann, A. J., Gorski, S. A., and Vogel, J. (2014). Single-cell RNA-seq: advances and future challenges. Nucleic Acids Res. 42, 8845–8860. doi: 10.1093/nar/gku555
Sanger, F., Nicklen, S., and Coulson, A. R. (1977). DNA sequencing with chain-terminating inhibitors. Proc. Natl. Acad. Sci. U. S. A. 74, 5463–5467. doi: 10.1073/pnas.74.12.5463
Schloss, P. D. (2021). Amplicon Sequence Variants Artificially Split Bacterial Genomes into Separate Clusters. mSphere 6:e0019121. doi: 10.1128/mSphere.00191-21
Schloss, P. D., Westcott, S. L., Ryabin, T., Hall, J. R., Hartmann, M., Hollister, E. B., et al. (2009). Introducing mothur: open-Source, Platform-Independent, Community-Supported Software for Describing and Comparing Microbial Communities. Appl. Environ. Microbiol. 75, 7537–7541. doi: 10.1128/AEM.01541-09
Schneider, L. K., Anestis, K., Mansour, J., Anschütz, A. A., Gypens, N., Hansen, P. J., et al. (2020). A dataset on trophic modes of aquatic protists. Biodivers. Data J. 8:e56648. doi: 10.3897/BDJ.8.e56648
Scholin, C. A., Herzog, M., Sogin, M., and Anderson, D. M. (1994). Identification of group- and strain-specific genetic markers for globally distributed Alexandrium (dinophyceae). ii. Sequence analysis of a fragment of the LSU rRNA gene1. J. Phycol. 30, 999–1011. doi: 10.1111/j.0022-3646.1994.00999.x
Schwarze, K., Buchanan, J., Fermont, J. M., Dreau, H., Tilley, M. W., Taylor, J. M., et al. (2020). The complete costs of genome sequencing: a microcosting study in cancer and rare diseases from a single center in the United Kingdom. Genet. Med. 22, 85–94. doi: 10.1038/s41436-019-0618-7
Segerman, B. (2020). The Most Frequently Used Sequencing Technologies and Assembly Methods in Different Time Segments of the Bacterial Surveillance and RefSeq Genome Databases. Front. Cell. Infect. Microbiol. 10:527102. doi: 10.3389/fcimb.2020.527102
Seppey, M., Manni, M., and Zdobnov, E. M. (2019). BUSCO: assessing Genome Assembly and Annotation Completeness. Methods Mol. Biol. 1962, 227–245. doi: 10.1007/978-1-4939-9173-0_14.
Sheldon, R. W., Prakash, A., and Sutcliffe, W. H. (1972). THE SIZE DISTRIBUTION OF PARTICLES IN THE OCEAN1. Limnol. Oceanogr. 17, 327–340. doi: 10.4319/lo.1972.17.3.0327
Sieracki, M. E., Poulton, N. J., Jaillon, O., Wincker, P., de Vargas, C., Rubinat-Ripoll, L., et al. (2019). Single cell genomics yields a wide diversity of small planktonic protists across major ocean ecosystems. Sci. Rep. 9:6025. doi: 10.1038/s41598-019-42487-1
Slagstad, D., Ellingsen, I. H., and Wassmann, P. F. J. (2011). Evaluating primary and secondary production in an Arctic Ocean void of summer sea ice: an experimental simulation approach. Prog. Oceanogr. 90, 117–131. doi: 10.1016/j.pocean.2011.02.009
Smith, M. A., Bertrand, C., Crosby, K., Eveleigh, E. S., Fernandez-Triana, J., Fisher, B. L., et al. (2012). Wolbachia and DNA Barcoding Insects: patterns, Potential, and Problems. PLoS One 7:e36514. doi: 10.1371/journal.pone.0036514
Sowe, S. K., and Zettsu, K. (2014). Curating big data made simple: perspectives from scientific communities. Big Data 2, 23–33. doi: 10.1089/big.2013.0046
Spouge, J. L., and Mariño-Ramírez, L. (2012). The practical evaluation of DNA barcode efficacy. Methods Mol. Biol. 858, 365–377. doi: 10.1007/978-1-61779-591-6_17
Stanke, M., and Waack, S. (2003). Gene prediction with a hidden Markov model and a new intron submodel. Bioinformatics 19, ii215–ii225. doi: 10.1093/bioinformatics/btg1080
Starke, R., Pylro, V. S., and Morais, D. K. (2021). 16S rRNA Gene Copy Number Normalization Does Not Provide More Reliable Conclusions in Metataxonomic Surveys. Microb. Ecol. 81, 535–539. doi: 10.1007/s00248-020-01586-7
Stepanauskas, R. (2012). Single cell genomics: an individual look at microbes. Curr. Opin. Microbiol. 15, 613–620. doi: 10.1016/j.mib.2012.09.001
Stephens, T. G., Ragan, M. A., Bhattacharya, D., and Chan, C. X. (2018). Core genes in diverse dinoflagellate lineages include a wealth of conserved dark genes with unknown functions. Sci. Rep. 8:17175. doi: 10.1038/s41598-018-35620-z
Stoeck, T., Bass, D., Nebel, M., Christen, R., Jones, M. D. M., Breiner, H.-W., et al. (2010). Multiple marker parallel tag environmental DNA sequencing reveals a highly complex eukaryotic community in marine anoxic water. Mol. Ecol. 19, 21–31. doi: 10.1111/j.1365-294X.2009.04480.x
Stork, N. E. (2009). Biodiversity. Encycl. Insects 2009, 75–80. doi: 10.1016/B978-0-12-374144-8.00021-7
Storz, G. (2002). An Expanding Universe of Noncoding RNAs. Science 296, 1260–1263. doi: 10.1126/science.1072249
Strassert, J. F. H., Karnkowska, A., Hehenberger, E., del Campo, J., Kolisko, M., Okamoto, N., et al. (2018). Single cell genomics of uncultured marine alveolates shows paraphyly of basal dinoflagellates. ISME J. 12, 304–308. doi: 10.1038/ismej.2017.167
Straub, D., Blackwell, N., Langarica-Fuentes, A., Peltzer, A., Nahnsen, S., and Kleindienst, S. (2020). Interpretations of Environmental Microbial Community Studies Are Biased by the Selected 16S rRNA (Gene) Amplicon Sequencing Pipeline. Front. Microbiol. 11:550420. doi: 10.3389/fmicb.2020.550420
Sunagawa, S., Coelho, L. P., Chaffron, S., Kultima, J. R., Labadie, K., Salazar, G., et al. (2015). Structure and function of the global ocean microbiome. Science 348:1261359. doi: 10.1126/science.1261359
Sundstrom, S. M., and Allen, C. R. (2019). The adaptive cycle: more than a metaphor. Ecol. Complex. 39:100767. doi: 10.1016/j.ecocom.2019.100767
Svensson, V., Vento-Tormo, R., and Teichmann, S. A. (2018). Exponential scaling of single-cell RNA-seq in the past decade. Nat. Protoc. 13, 599–604. doi: 10.1038/nprot.2017.149
Swan, B. K., Tupper, B., Sczyrba, A., Lauro, F. M., Martinez-Garcia, M., Gonzalez, J. M., et al. (2013). Prevalent genome streamlining and latitudinal divergence of planktonic bacteria in the surface ocean. Proc. Natl. Acad. Sci. U. S. A. 110, 11463–11468. doi: 10.1073/pnas.1304246110
Swenson, N. G. (2011). The role of evolutionary processes in producing biodiversity patterns, and the interrelationships between taxonomic, functional and phylogenetic biodiversity. Am. J. Bot. 98, 472–480. doi: 10.3732/ajb.1000289
Tang, F., Barbacioru, C., Wang, Y., Nordman, E., Lee, C., Xu, N., et al. (2009). mRNA-Seq whole-transcriptome analysis of a single cell. Nat. Methods 6, 377–382. doi: 10.1038/nmeth.1315
Telenius, H., Carter, N. P., Bebb, C. E., Nordenskjöld, M., Ponder, B. A. J., and Tunnacliffe, A. (1992). Degenerate oligonucleotide-primed PCR: general amplification of target DNA by a single degenerate primer. Genomics 13, 718–725. doi: 10.1016/0888-7543(92)90147-K
Thomas, M. K., Kremer, C. T., Klausmeier, C. A., and Litchman, E. (2012). A global pattern of thermal adaptation in marine phytoplankton. Science 338, 1085–1088. doi: 10.1126/science.1224836
Thomas, T., Gilbert, J., and Meyer, F. (2012). Metagenomics - a guide from sampling to data analysis. Microb. Inform. Exp. 2:3. doi: 10.1186/2042-5783-2-3
Thomson, E., Ferreira-Cerca, S., and Hurt, E. (2013). Eukaryotic ribosome biogenesis at a glance. J. Cell Sci. 126, 4815–4821. doi: 10.1242/jcs.111948
Travers, K. J., Chin, C.-S., Rank, D. R., Eid, J. S., and Turner, S. W. (2010). A flexible and efficient template format for circular consensus sequencing and SNP detection. Nucleic Acids Res. 38:e159. doi: 10.1093/nar/gkq543
Truchy, A., Angeler, D. G., Sponseller, R. A., Johnson, R. K., and McKie, B. G. (2015). Linking biodiversity, ecosystem functioning and services, and ecological resilience: towards an integrative framework for improved management. Adv. Ecol. Res. 53, 55–96. doi: 10.1016/bs.aecr.2015.09.004
Tung, P.-Y., Blischak, J. D., Hsiao, C. J., Knowles, D. A., Burnett, J. E., Pritchard, J. K., et al. (2017). Batch effects and the effective design of single-cell gene expression studies. Sci. Rep. 7:39921. doi: 10.1038/srep39921
van Dijk, E. L., Jaszczyszyn, Y., Naquin, D., and Thermes, C. (2018). The Third Revolution in Sequencing Technology. Trends Genet. 34, 666–681. doi: 10.1016/j.tig.2018.05.008
Vaulot, D., Lepère, C., Toulza, E., De la Iglesia, R., Poulain, J., Gaboyer, F., et al. (2012). Metagenomes of the Picoalga Bathycoccus from the Chile Coastal Upwelling. PLoS One 7:e39648. doi: 10.1371/journal.pone.0039648
Venail, P., Gross, K., Oakley, T. H., Narwani, A., Allan, E., Flombaum, P., et al. (2015). Species richness, but not phylogenetic diversity, influences community biomass production and temporal stability in a re-examination of 16 grassland biodiversity studies. Funct. Ecol. 29, 615–626. doi: 10.1111/1365-2435.12432
Wang, J., and Song, Y. (2017). Single cell sequencing: a distinct new field. Clin. Transl. Med. 6, 1–10. doi: 10.1186/s40169-017-0139-4
Wang, Y., Yang, Q., and Wang, Z. (2015). The evolution of nanopore sequencing. Front. Genet. 5:449. doi: 10.3389/fgene.2014.00449
Wang, Z., Gerstein, M., and Snyder, M. (2009). RNA-Seq: a revolutionary tool for transcriptomics. Nat. Rev. Genet. 10, 57–63. doi: 10.1038/nrg2484
Weisburg, W. G., Barns, S. M., Pelletier, D. A., and Lane, D. J. (1991). 16S ribosomal DNA amplification for phylogenetic study. J. Bacteriol. 173, 697–703. doi: 10.1128/jb.173.2.697-703.1991
Weisse, T. (2017). Functional diversity of aquatic ciliates. Eur. J. Protistol. 61, 331–358. doi: 10.1016/j.ejop.2017.04.001
Woese, C. R., Kandler, O., and Wheelis, M. L. (1990). Towards a natural system of organisms: proposal for the domains Archaea, Bacteria, and Eucarya. Proc. Natl. Acad. Sci. U. S. A. 87, 4576–4579. doi: 10.1073/pnas.87.12.4576
Wong, K.-C., Zhang, J., Yan, S., Li, X., Lin, Q., Kwong, S., et al. (2019). DNA Sequencing Technologies. ACM Comput. Surv. 52, 1–30. doi: 10.1145/3340286
Worden, A. Z., Janouskovec, J., McRose, D., Engman, A., Welsh, R. M., Malfatti, S., et al. (2012). Global distribution of a wild alga revealed by targeted metagenomics. Curr. Biol. 22, R675–R677. doi: 10.1016/j.cub.2012.07.054
Woyke, T., Tighe, D., Mavromatis, K., Clum, A., Copeland, A., Schackwitz, W., et al. (2010). One bacterial cell, one complete genome. PLoS One 5:e10314. doi: 10.1371/journal.pone.0010314
Woyke, T., Xie, G., Copeland, A., González, J. M., Han, C., Kiss, H., et al. (2009). Assembling the marine metagenome, one cell at a time. PLoS One 4:e5299. doi: 10.1371/journal.pone.0005299
Wu, A. R., Neff, N. F., Kalisky, T., Dalerba, P., Treutlein, B., Rothenberg, M. E., et al. (2014). Quantitative assessment of single-cell RNA-sequencing methods. Nat. Methods 11, 41–46. doi: 10.1038/nmeth.2694
Yoon, H. S., Price, D. C., Stepanauskas, R., Rajah, V. D., Sieracki, M. E., Wilson, W. H., et al. (2011). Single-Cell Genomics Reveals Organismal Interactions in Uncultivated Marine Protists. Science 332, 714–717. doi: 10.1126/science.1203163
Yoon, S.-H., Ha, S.-M., Kwon, S., Lim, J., Kim, Y., Seo, H., et al. (2017). Introducing EzBioCloud: a taxonomically united database of 16S rRNA gene sequences and whole-genome assemblies. Int. J. Syst. Evol. Microbiol. 67, 1613–1617. doi: 10.1099/ijsem.0.001755
Zari, M. P. (2014). Ecosystem services analysis in response to biodiversity loss caused by the built environment. S.A.P.I.EN.S [Online]. Available online at: http://journals.openedition.org/sapiens/1684 (accessed November 01, 2021).
Zhang, L., Cui, X., Schmitt, K., Hubert, R., Navidi, W., and Arnheim, N. (1992). Whole genome amplification from a single cell: implications for genetic analysis. Proc. Natl. Acad. Sci. U. S. A. 89, 5847–5851. doi: 10.1073/pnas.89.13.5847
Zhang, Z., Wang, J., Wang, J., Wang, J., and Li, Y. (2020). Estimate of the sequenced proportion of the global prokaryotic genome. Microbiome 8:134. doi: 10.1186/s40168-020-00903-z
Zhuang, Y., Zhang, H., and Lin, S. (2013). Polyadenylation of 18S rRNA in algae. J. Phycol. 49, 570–579. doi: 10.1111/jpy.12068
Ziegenhain, C., Vieth, B., Parekh, S., Hellmann, I., and Enard, W. (2018). Quantitative single-cell transcriptomics. Brief. Funct. Genomics 17, 220–232. doi: 10.1093/bfgp/ely009
Ziegenhain, C., Vieth, B., Parekh, S., Reinius, B., Guillaumet-Adkins, A., Smets, M., et al. (2017). Comparative Analysis of Single-Cell RNA Sequencing Methods. Mol. Cell 65, 631–643. doi: 10.1016/j.molcel.2017.01.023
Zielezinski, A., Vinga, S., Almeida, J., and Karlowski, W. M. (2017). Alignment-free sequence comparison: benefits, applications, and tools. Genome Biol. 18, 1–17. doi: 10.1186/s13059-017-1319-7
Keywords: microbial organisms, molecular ecology, high-throughput sequencing, diversity estimates, functional traits, data science
Citation: Wilms SN (2021) A Beginner’s Guide on Integrating *Omics Approaches to Study Marine Microbial Communities: Details and Discussions From Sample Collection to Bioinformatics Analysis. Front. Mar. Sci. 8:692538. doi: 10.3389/fmars.2021.692538
Received: 09 April 2021; Accepted: 24 August 2021;
Published: 09 December 2021.
Edited by:
Viola Liebich, Bremen Society for Natural Sciences, GermanyReviewed by:
Adam Michael Reitzel, University of North Carolina at Charlotte, United StatesJean-François Mangot, Consejo Superior de Investigaciones Científicas (CSIC), Spain
Copyright © 2021 Wilms. This is an open-access article distributed under the terms of the Creative Commons Attribution License (CC BY). The use, distribution or reproduction in other forums is permitted, provided the original author(s) and the copyright owner(s) are credited and that the original publication in this journal is cited, in accordance with accepted academic practice. No use, distribution or reproduction is permitted which does not comply with these terms.
*Correspondence: Sabrina Natalie Wilms, c2FicmluYS53aWxtc0Bhd2kuZGU=