- 1Key Laboratory of Sustainable Development of Marine Fisheries, Ministry of Agriculture and Rural Affairs, Yellow Sea Fisheries Research Institute, Chinese Academy of Fishery Sciences, Qingdao, China
- 2Research Centre for Indian Ocean Ecosystem, Tianjin University of Science and Technology, Tianjin, China
- 3College of Marine Science and Technology, China University of Geosciences, Wuhan, China
Biogenic silica (bSi) standing stocks and carbon (C) biomass of small plankton are rarely studied together in previous analyses, especially in oligotrophic gyres. Within the oligotrophic western tropical North Pacific, based on size-fractionated bSi and biovolume-derived C analyses in three size fractions (i.e., 0.2–2; 2–20; >20 μm), we observed that picophytoplankton (<2 μm) contributed a measurable and significant proportion of both bSi standing stocks and C biomass. The estimated contributions of pico-sized fraction to total bSi standing stocks and living C biomass averaged 66 and 49%, respectively, indicating the ecological importance of small plankton in the Si and C cycles in oligotrophic areas. In contrast, the average contributions of large diatoms (i.e., cells >2 μm) to total bSi standing stocks and living C biomass were 9 and 16%, respectively, suggesting that the role of diatoms in marine Si and C cycles may have been overestimated in previous analyses. Due to the overwhelming predominance of picocyanobacteria in the oligotrophic western tropical North Pacific, their contributions to total bSi stocks and C biomass were quantitatively important and accounted for more of the bSi and C associated with living cells than did diatoms. In addition, water temperature and light intensity were likely the key determinants of the variations in size-fractionated bSi standing stocks and living C biomass, but not nutrient availability. Collectively, these findings encourage a reconsideration of the previously underestimated role of small plankton in understanding the Si and C cycles in the ocean, and may provide insights into the interpretations of disproportionate budgets of Si and C in oligotrophic oceans.
Introduction
Diatoms are the most species-rich group of algae in the ocean and are frequently dominant in eutrophic ecosystems (Mann, 1999). These photosynthetic protists absorb dissolved silicic acid from the water and precipitate opaline silica to form their cell walls (Milligan and Morel, 2002). Due to their high diversity and cosmopolitan distribution, diatoms can contribute close to one-quarter of global primary production (Hamm et al., 2003; Leblanc et al., 2012). As such, diatoms are thought to be the primary organisms responsible for the low levels of dissolved silicic acid observed in the surface ocean and the export of silicon (Si) and carbon (C) to depth (Baines et al., 2012). The marine Si cycle is thus thought to be mechanistically tied to the C cycle through its effect on the growth of diatoms. Although the presence of several siliceous species (e.g., silicoflagellates and Rhizarians) may reduce the proportional importance of diatoms to the standing stocks of water column biogenic silica (bSi), a fundamental knowledge about the role of biota in the marine Si cycle is that diatoms dominate bSi stocks overwhelmingly.
As a result of small cell size, slow individual sinking rates, and high rates of recycling, picophytoplankton (<2 μm) have long been considered to be less important in transporting organic matter to the deep ocean (Buesseler, 1998; Lomas and Moran, 2011; Tang et al., 2014). However, recent studies in oligotrophic areas have suggested that picophytoplankton contribute more than 50% of the phytoplankton biomass and are major primary producers in the transport of C from the atmosphere into the ocean (Richardson and Jackson, 2007). In addition, Baines et al. (2012) have suggested that picocyanobacteria (<1.2 μm) can accumulate significant amounts of Si and may exert a previously unrecognized influence on marine Si cycle. Subsequently, Tang et al. (2014) provided the evidence that Si is deposited on extracellular polymeric substance associated with decomposing picocyanobacteria (called EPS-Si), which may be a precursor of micro-blebs (a new group of marine particles enriched in Si) observed in the deep ocean. In particular, size-fractionated bSi measurements by Baines et al. (2012) and Krause et al. (2017) in the Sargasso Sea showed that the bSi stock within the pico-sized fraction averaged nearly 16–20% of the total. These previously unexplored Si and C sources, however, may further enhance export of picophytoplankton to the deep ocean, and may alter our understanding of the long-term controls on oceanic Si cycling and C sequestration.
A caveat to previous studies regarding the C cycle is that the contribution of pico-sized fraction to total C biomass was estimated using traditional size-fractionated chlorophyll and particulate organic carbon (POC) analyses, i.e., detailed C biomass information in picophytoplankton could not be accurately acquired. Additionally, the significant contribution of pico-sized fraction to total bSi stocks was only estimated from the equatorial Pacific (Baines et al., 2012), the Sargasso Sea (Krause et al., 2017) and the tropical South Pacific (Leblanc et al., 2018). However, these estimates are not enough to address spatial variation in small-sized bSi stock across the world’s oceans, and more data are needed to further understand the global variability of picoplankton bSi stock. Moreover, we would like to verify the hypothesis proposed by Baines et al. (2012); Krause et al. (2017) and Leblanc et al. (2018) that “picophytoplankton may exert an important influence on the global Si cycle.” Our previous study revealed that picophytoplankton were approximately 4–5 orders of magnitude higher in abundance than large diatoms (>2 μm cells), in spite of low nutrient concentrations in the western tropical Pacific Ocean (Wei et al., 2020). Therefore, we also infer that the contribution of picophytoplankton to bSi standing stocks and living C biomass may be quantitatively important across this understudied region of the North Pacific. To determine the magnitude and variability in the contributions of pico-sized fraction to both total bSi stocks and C biomass in the western tropical North Pacific, here we report an expanded examination of bSi stocks and C biomass in three size fractions (0.2–2; 2–20; >20 μm; Supporting Information, Parts 1–3) with an emphasis on the crucial role of small plankton in oligotrophic gyre settings.
Materials and Methods
Study Area and Sample Collection
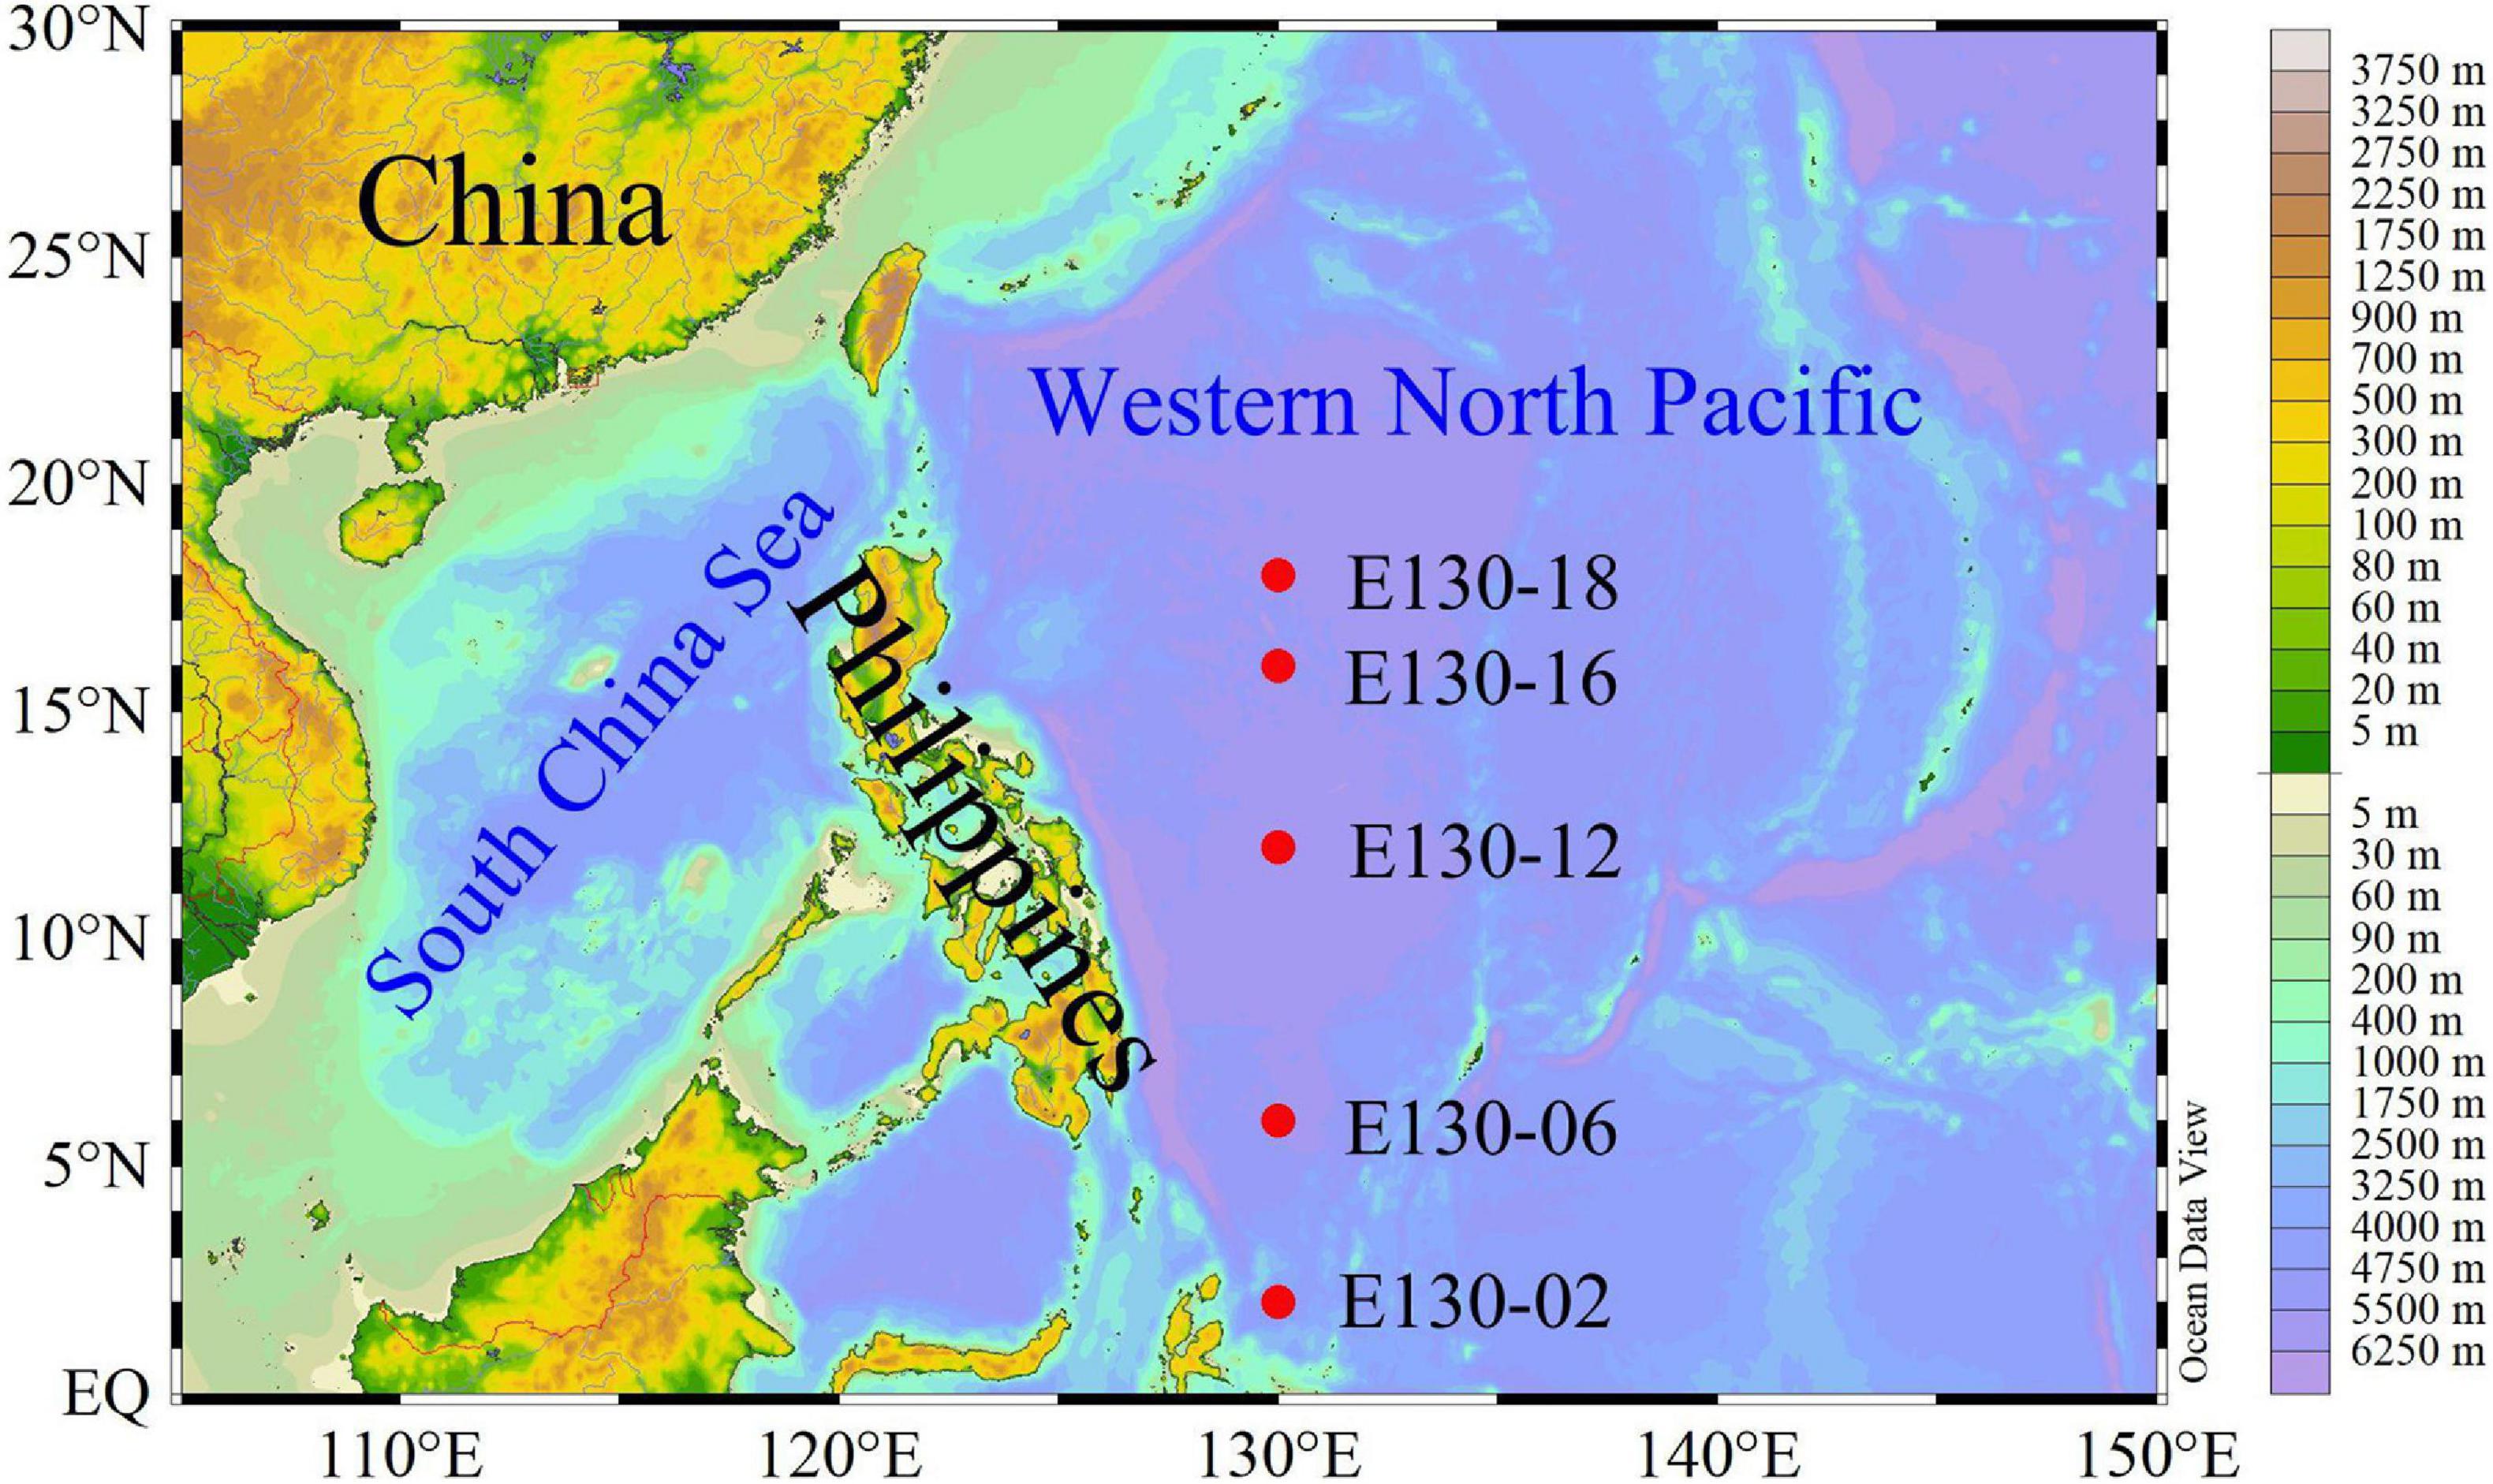
One oceanographic cruise was conducted in the western tropical North Pacific (3°N–20°N, 125°E–130°E) aboard the R/V Kexue from 3rd October to 5th November 2016, and five stations were investigated (Figure 1). Seawater sampling and measurements of temperature and salinity were performed using 12 L Niskin bottles equipped with a Sea-Bird CTD (Conductivity, Temperature and Depth; SBE 19 Plus) rosette sampler. Light intensity was detected using an in situ photosynthetically active radiation (PAR) sensor (RBR, XRX-620). Nutrient samples were collected in 150 mL PE vials and immediately frozen at −20°C for further analysis. More details about the sampling strategy and analysis for nutrients are given in our previously published article (Wei et al., 2020) and will not be presented in detail here. Samples for the measurements of size-fractionated bSi and chlorophyll a (Chl a) as well as phytoplankton communities were taken at up to 6 depths within the upper 200 m, i.e., 5, 25, and 50, DCM (depth of Chl a maximum, determined for each hydrocast via in situ fluorometry), 150 and 200 m (Table 1). All reported biological and chemical parameters were determined on seawater collected from the same bottles.

Table 1. Sampling stations and depths for the measurements of size-fractionated bSi and Chl a as well as phytoplankton communities in the western tropical North Pacific.
Biological Sample Analysis
For our specific objectives, ∼2 L of seawater samples were filtered through three successive filter holders (47 mm) with 20 μm nylon membrane, then followed by 2 and 0.2 μm pore size polycarbonate filters (Whatman Corp.). Filtered bSi samples were rinsed with 0.2 μm filtered seawater, and refrigerated at −20°C immediately for further analysis (Zhang et al., 2019). This volume could provide sufficient analytical signal even with low bSi concentrations (Krause et al., 2017). For brevity, bSi size fractions were referred to as total (>0.2 μm), >20 μm (i.e., just the larger size fraction), 2–20 μm (i.e., nano-sized fraction), and <2 μm (i.e., pico-sized fraction) fractions. On shore, size-fractionated bSi concentrations were analyzed manually using a sequential NaOH–HF digestion procedure, with reactions carried out in Teflons tubes (Brzezinski and Nelson, 1995; Krause et al., 2009). To eliminate the interference of lithogenic Si (lSi), we assumed that the largest reported 15% lSi dissolved during our NaOH digestion (Ragueneau and Tréguer, 1994). Although correction of bSi by 15% lSi interference resulted in low estimates of size-fractionated bSi concentrations, Baines et al. (2012) and Krause et al. (2017) both used this same 15% correction in the Pacific Ocean, and its presence would not change the distributional patterns.
2 L of seawater samples for size-fractionated Chl a analysis were filtered serially through 20 μm nylon membrane, 2 and 0.2 μm polycarbonate membrane filters (47 mm; Whatman Corp.) under low vacuum pressure (<0.04 MPa). Subsequently, these Chl a filters were folded in quarters, and stored in liquid nitrogen at -80°C until processing. Extraction was carried out in 5 mL 90% acetone (for 24 h at 4°C). After removal of the filters, extracted pigments (i.e., size-fractionated Chl a concentrations) were determined using a CE Turner Designs Fluorometer following the acidification method of Welschmeyer (1994).
Samples for micro/nanophytoplankton (cell size > 2 μm) analysis were fixed with 2% buffered formalin and then stored in darkness. After returning to the laboratory, preserved samples were concentrated with 100 mL settlement columns for 24–48 h according to the Utermöhl method (Edler and Elbrächter, 2010). Subsequently, the micro/nanophytoplankton taxonomy and abundance were identified and enumerated, respectively, under an inverted microscope (Motic BA300) at 200× magnification. The lower size limit for phytoplankton analyzed by microscope was usually >2 μm, below which the cells (i.e., picophytoplankton) were very difficult to classify and identify. Thereafter, their biovolumes (V) were calculated for converting C biomass based on similar geometric models using the empirical relationship: logC = 0.94 × logV - 0.60 (Eppley et al., 1970; Sun and Liu, 2003). Under most circumstances, the standard error was <5% of mean biovolume after the measurements of 10–15 cells.
Flow cytometry (FCM) samples for picophytoplankton (<2 μm) were fixed on board with paraformaldehyde (1% final concentration). FCM samples were kept in the dark without treatment at room temperature for 10–15 min to capture the maximum fluorescence efficiency, then quickly freeze-trapped in liquid nitrogen until analysis (Jiao et al., 2005). Picophytoplankton, including Synechococcus, Prochlorococcus, and picoeukaryotes, were classified by different fluorescence and scatter properties and quantified by FCM (BD Accuri C6) following the standard methods detailed in Wei et al. (2019). The upper size limit for phytoplankton analyzed by FCM was usually <2 μm, above which the cells (i.e., micro/nanophytoplankton) were very rare and could not be accurately quantified. Traditionally, picophytoplankton abundances were converted to C biomass by using the classical conversion factors of the Pacific Ocean: 53 fg C cell–1 for Prochlorococcus, 250 fg C cell–1 for Synechococcus, and a carbon content of 964 fg C cell–1 for picoeukaryotes (Campbell et al., 1997; Wei et al., 2020).
Statistical Analysis
Average data were given as the values ± standard deviation (SD). Pearson correlation analysis (r) was used to examine relationships between size-fractionated bSi and phytoplankton abundance, whereas Spearman correlation analysis (α) was used to examine the relationships between biological and environmental variables (SPSS, V 19). The significance level was set to p < 0.05. All Spearman correlation analysis results were subsequently visualized based on “pheatmap” package in R (V 4.0.2). Linear regression models (R2) and t-tests were applied for exploring the significant differences between groups of data. Unless otherwise stated, size-fractionated bSi and phytoplankton abundance (biomass) used for presenting the spatial variation or for comparisons among size fractions were expressed as depth-weighted averages, the depth-weighted average equation was calculated as:
Where Ai is the bSi concentration (nmol L–1) or phytoplankton abundance (cells L–1) or biomass (μg L–1) at sampling layer i; n is the number of sampling layers and Di is the depth at sampling layer i (m); D200 and Dsurface are the depths of maximum sampling layer (m) and the surface sampling depth, respectively. Note the same D200 depth was used at each station.
Results
Hydrological Systems and Nutrient Availability
Within the upper 200 m, water temperature was generally between 16.27 and 29.92°C (averaging 25.58 ± 4.49°C), except at station E130-06 where surface average temperature (>50 m) was 28.90 ± 0.78°C, rapidly decreasing to 12.79°C at 150 m (Figure 2a). Salinity observed in the upper 200 m ranged from 34.11 to 35.93, with an average of 34.58 ± 0.43 (Figure 2b). At the station E130-06, however, the average value of salinity (34.83 ± 0.68; Table 2) was relatively higher than other sampling stations. Analysis of the vertical profiles showed that high-salinity cold water markedly shoaled (<150 m) at the station E130-06 compared to other stations. Moreover, analysis of the satellite altimetry data1 revealed that a negative sea level anomaly was present near the station E130-06 at the time of our cruise. Collectively, the sea level anomaly and the distinct hydrological system at the station E130-06 were consistent with the presence of a cyclonic eddy, suggesting a potential influence of a cold-core eddy. Surface light intensity typically ranged between 150 and 993 μmol quanta m–2 s–1, but decreased drastically to <100 μmol quanta m–2 s–1 at 50–75 m (Figure 2c).
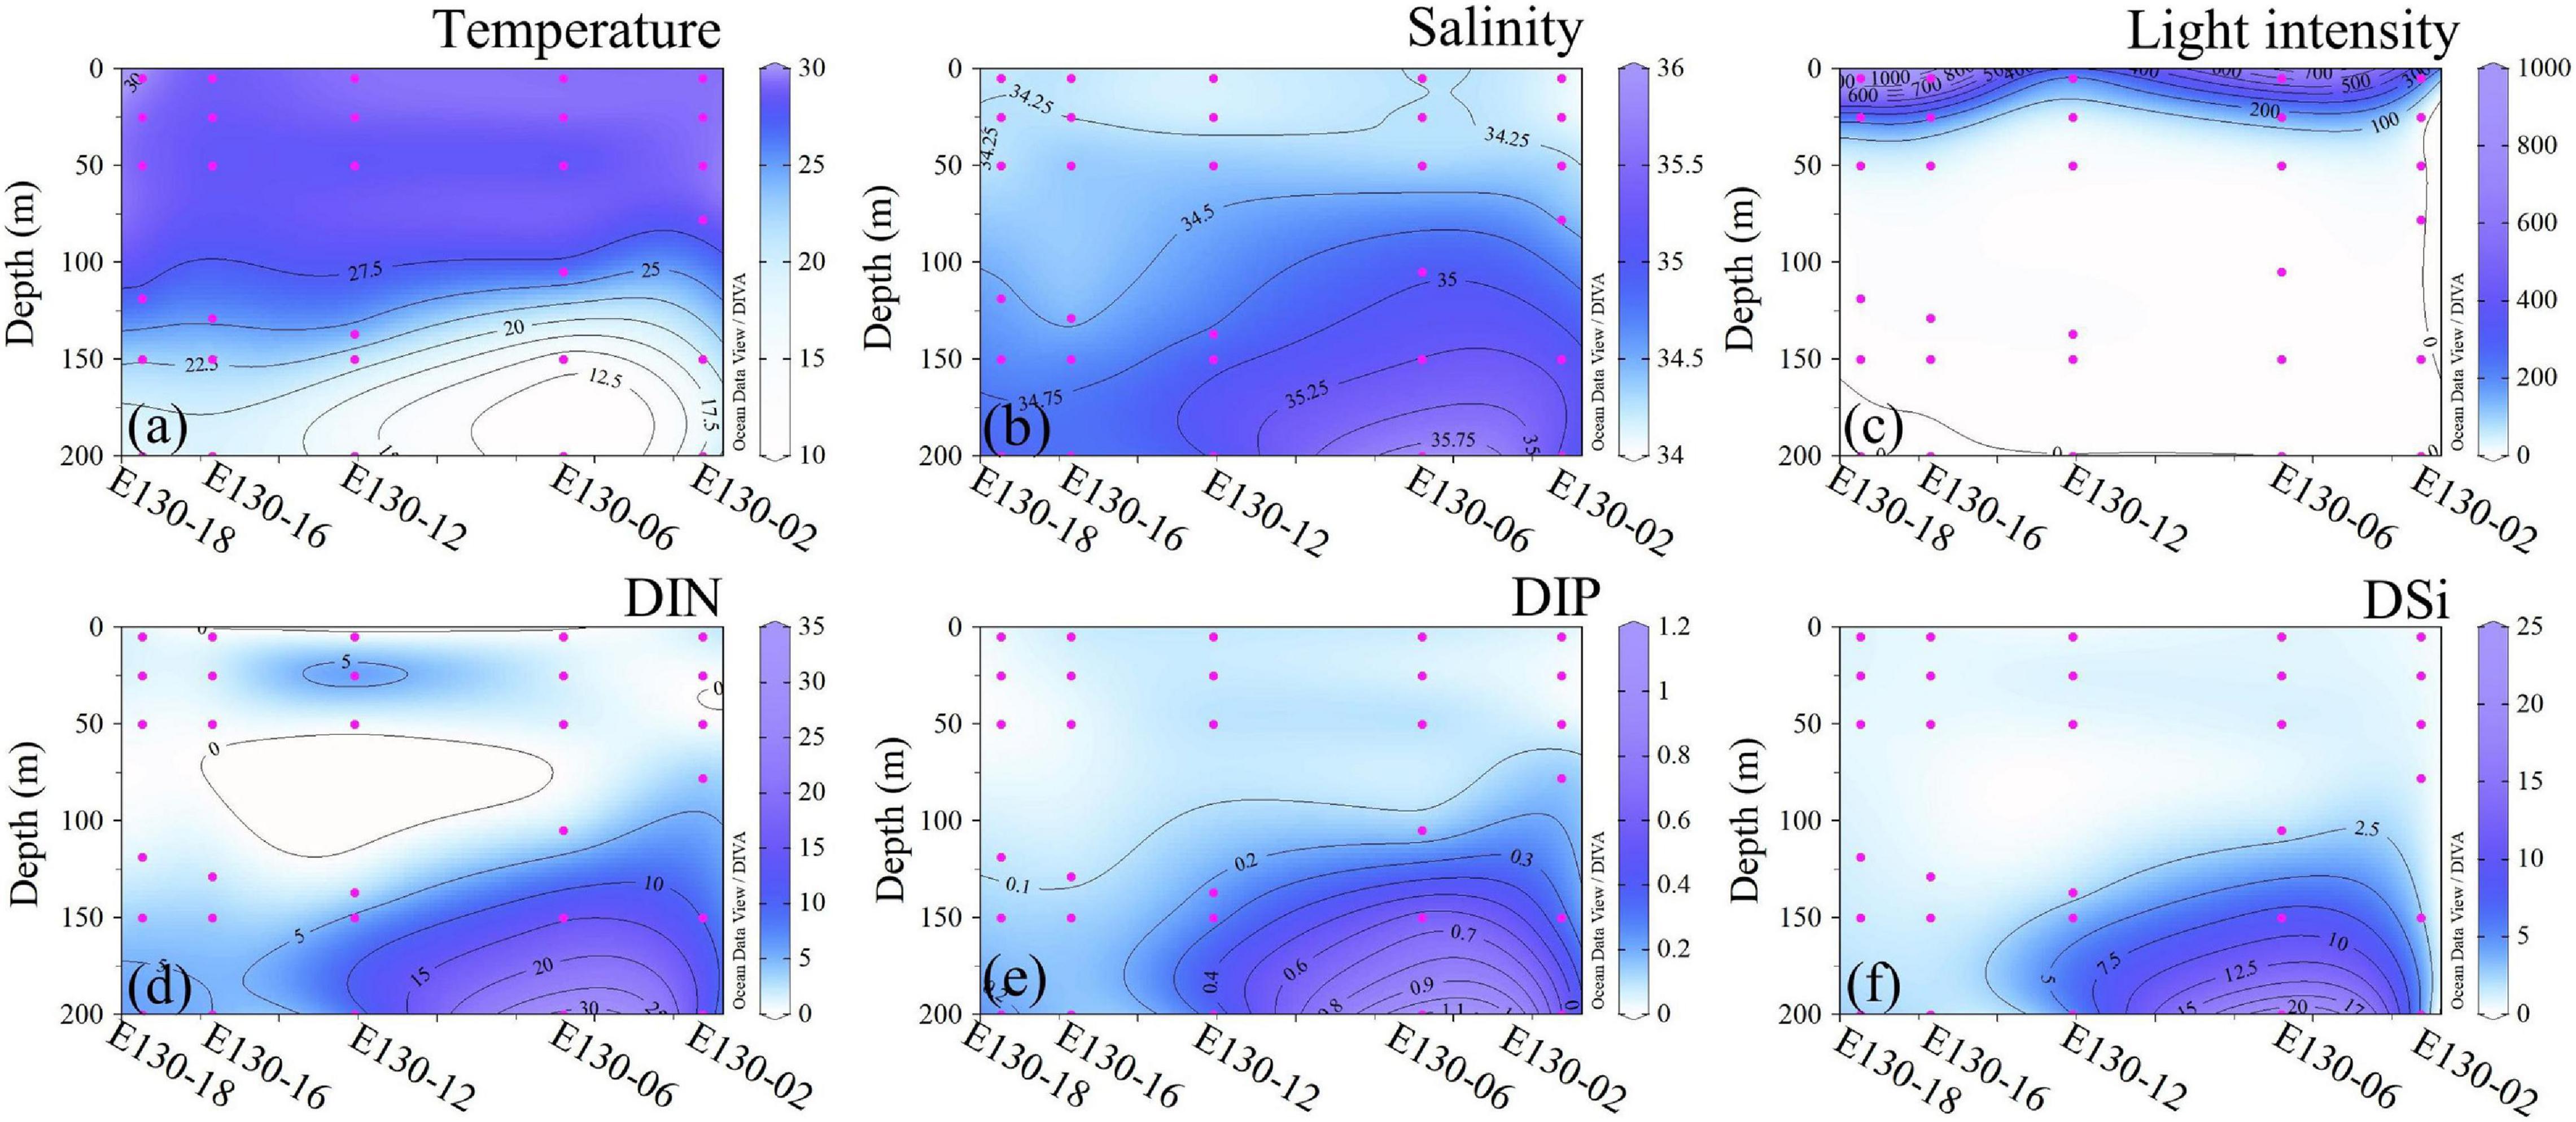
Figure 2. Vertical profiles for (a) temperature (°C), (b) salinity, (c) light intensity (μmol quanta m−2 s−1), and concentrations (μmol L−1) of dissolved inorganic (d) nitrogen (DIN, the sum of NH4+, NO3−, and NO2−), (e) phosphorus (DIP) and (f) silicate (DSi).

Table 2. Average values (±SD) of temperature (°C), salinity, and inorganic nutrient concentrations (μmol L–1) at different sampling stations.
As expected, nutrient concentrations with similar vertical structures within the upper 200 m were consistently low across the western tropical North Pacific (Figures 2d–f), thus representing a typical oligotrophic condition. Apart from the eddy-affected station E130-06, DIN concentration in the upper 200 m ranged from 0.24 to 13.08 μmol L–1, and averaged at 3.26 ± 2.43 μmol L–1 (Figure 2d); DIP concentration was generally near the detection limit (i.e., <0.10 μmol L–1) or undetectable within the upper 200 m, ranging from <0.10 to 0.60 μmol L–1 (average 0.13 ± 0.09 μmol L–1) (Figure 2e); DSi concentration was also relatively low in the upper 200 m, varying between 0.40 and 4.66 μmol L–1 (average 1.45 ± 1.23 μmol L–1) (Figure 2f). Due to the potential influence of a cold-core eddy, the average concentrations of DIN (8.63 ± 6.81 μmol L–1), DIP (0.36 ± 0.44 μmol L–1), and DSi (5.96 ± 3.73 μmol L–1) at the station E130-06 were much higher than other stations (Table 2).
Abundance Variability of Phytoplankton Communities
Picophytoplankton (∼107 cells L–1) was approximately 4–5 orders of magnitude more abundant than micro/nanophytoplankton (∼102–3 cells L–1) (Figure 3), suggesting that picophytoplankton contributed a significant abundance proportion of total phytoplankton communities. This is further confirmed by the size-fractionated Chl a concentrations: pico-sized Chl a (i.e., Chl a in <2 μm size fraction) represented on average 78 ± 10% of total Chl a concentrations in the western tropical North Pacific (Figure 4). Prochlorococcus was typically much more abundant than Synechococcus or picoeukaryotes, with a maximum abundance of up to 2.84 × 10⁷ cells L–1 at station E130-02 (Supplementary Table 1). The relative proportions of Prochlorococcus and Synechococcus to total abundance averaged 85 and 12%, respectively, suggesting that picophytoplankton was primarily characterized by a great abundance of picocyanobacteria (Figure 3A). However, the vertical dynamics of abundance observed for Prochlorococcus, Synechococcus, and picoeukaryotes were significantly different across the western tropical North Pacific (Pearson r < 0.33, p > 0.05; Supplementary Figure 1).
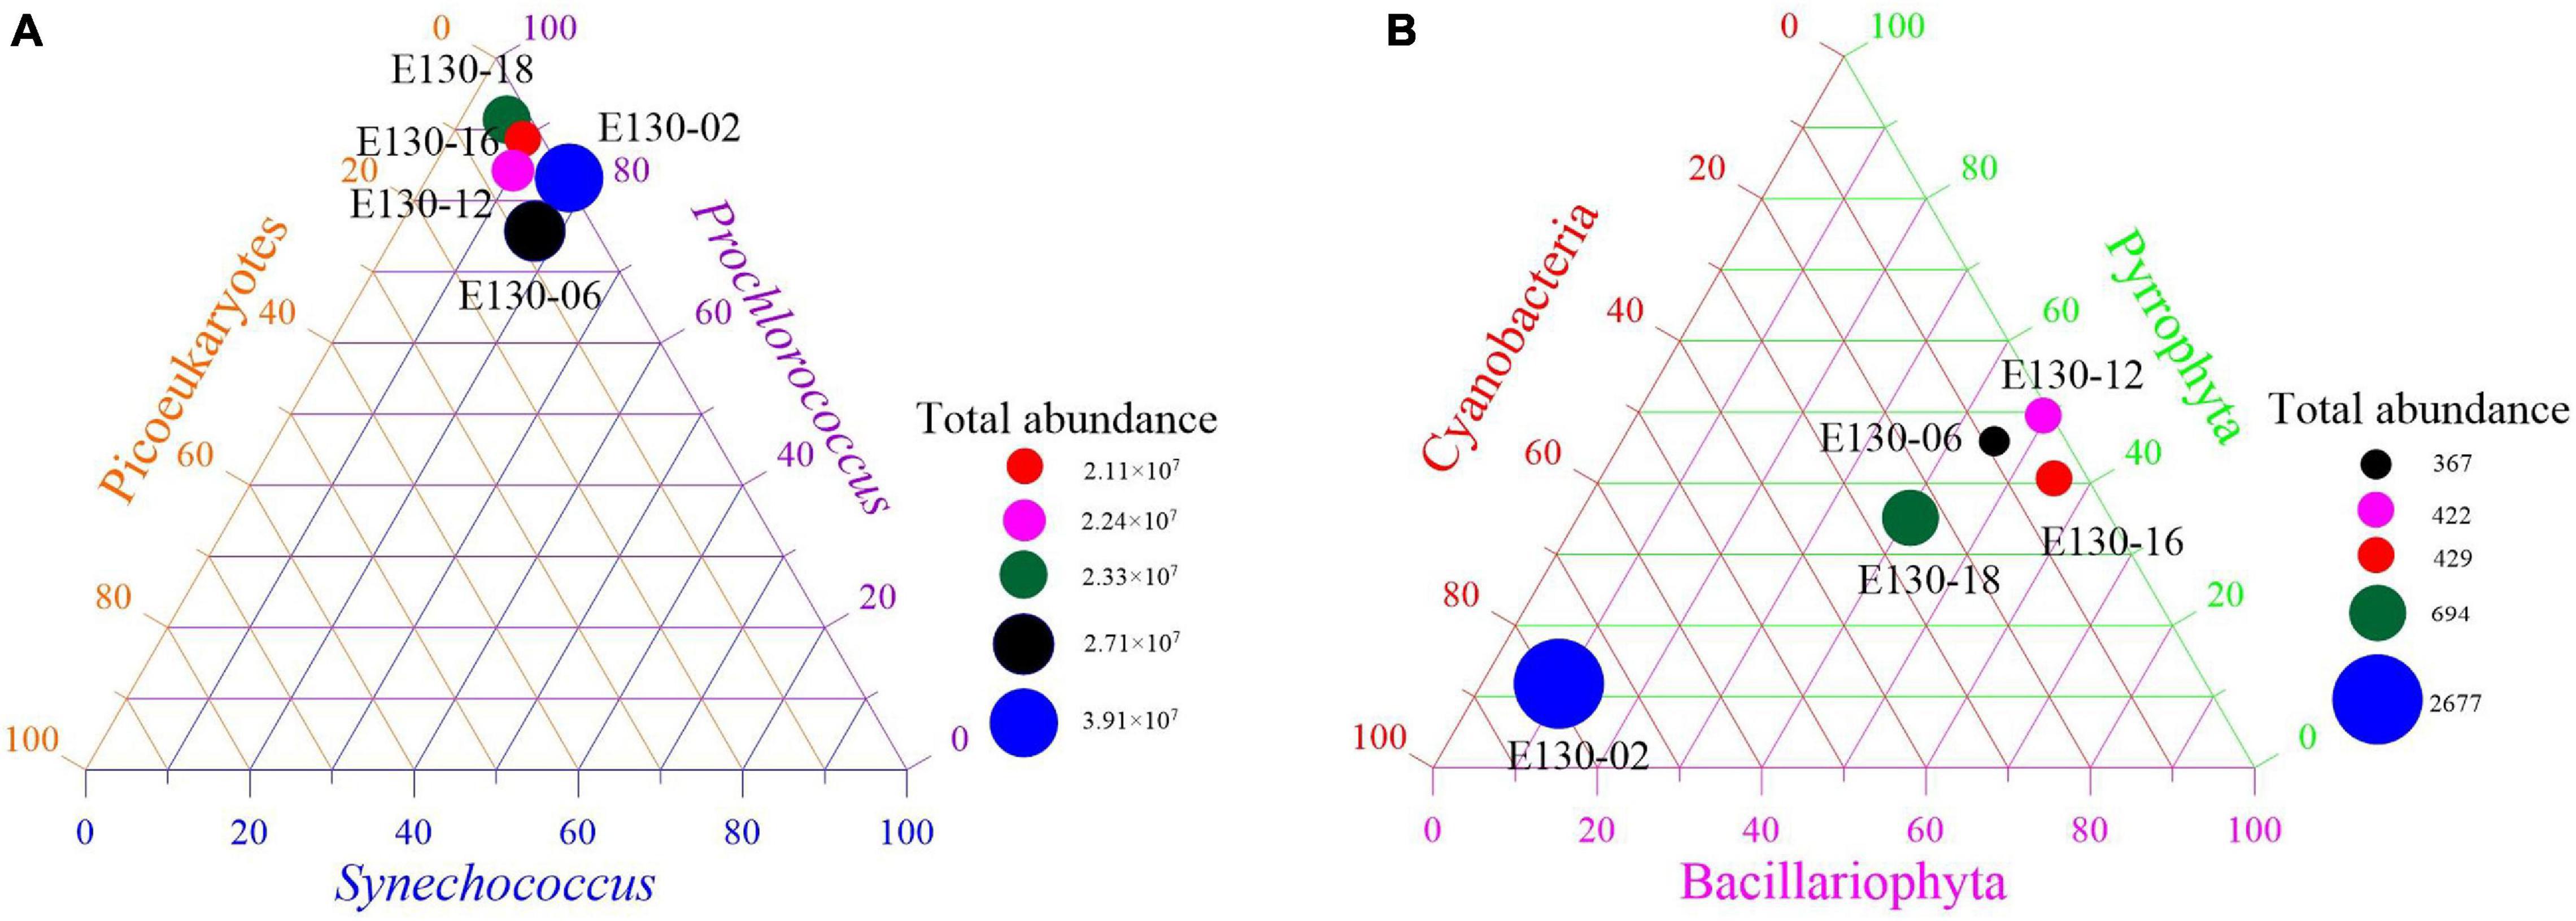
Figure 3. Total abundance (cells L–1) and abundance proportion (%) of (A) dominant picophytoplankton (i.e., Synechococcus, Prochlorococcus, picoeukaryotes) and (B) micro/nanophytoplankton (i.e., diatom, dinoflagellate, cyanobacteria) at each sampling station. Abundance data were expressed as depth-weighted averages within the upper 200 m (common depth for all stations).
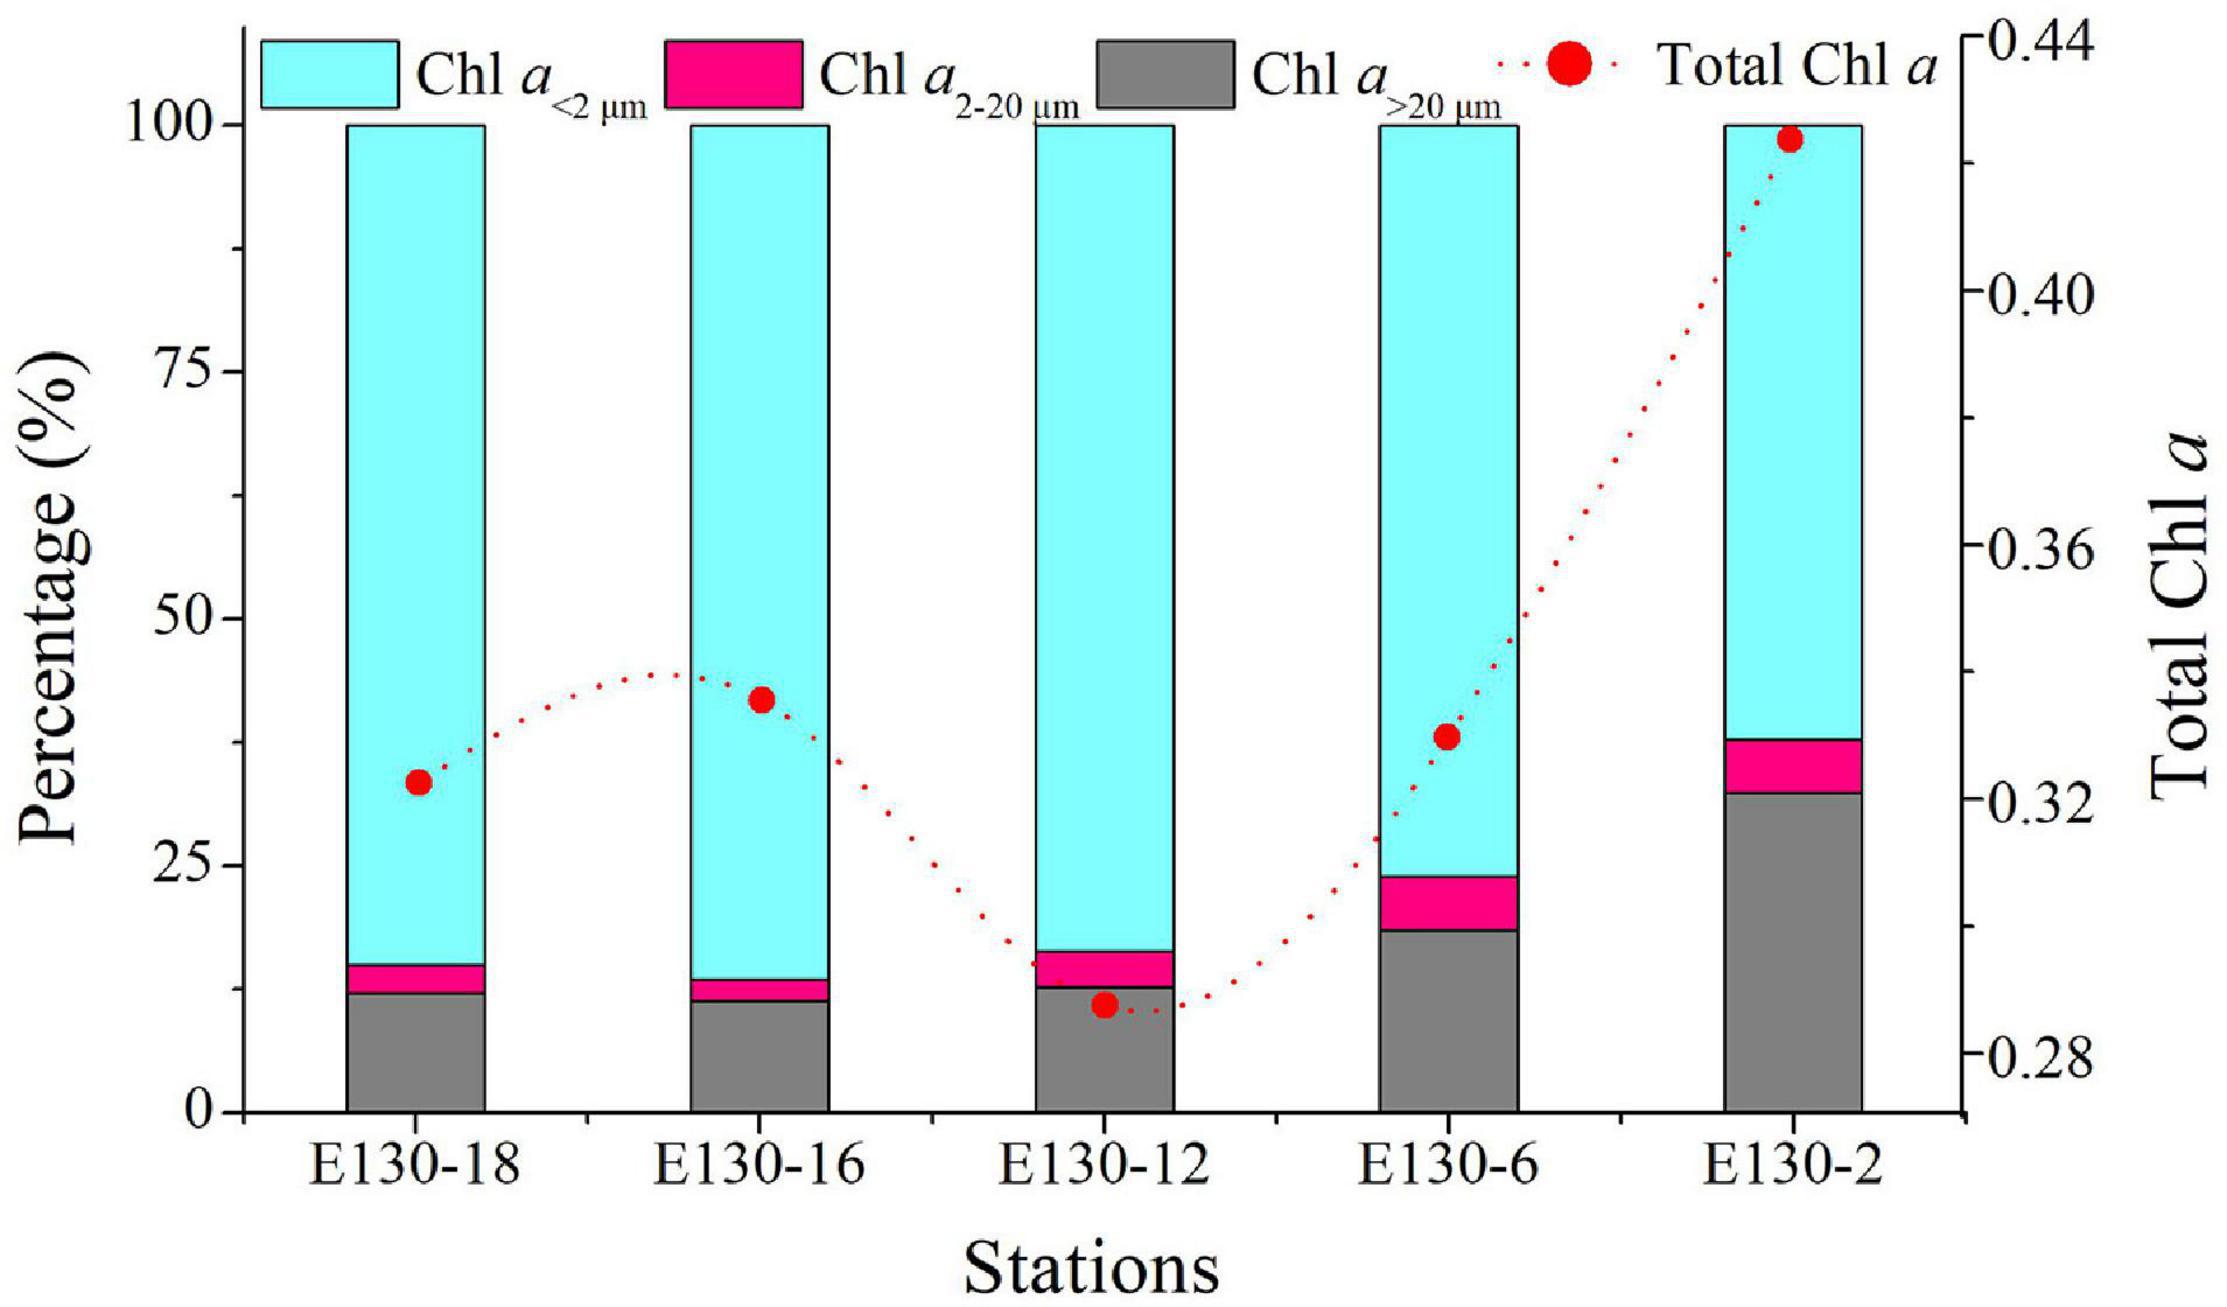
Figure 4. Spatial differences of total Chl a (μg L–1) and percentage of size-fractionated Chl a among sampling stations in the western tropical North Pacific. Red dotted line and dots represent the total Chl a concentrations. Total Chl a data were expressed as depth-weighted averages within the upper 200 m. Chl a<2 μm, pico-sized Chl a; Chl a2–20 μm, nano-sized Chl a; Chl a > 20 μm, micro-sized Chl a.
Micro/nanophytoplankton abundance varied by one order of magnitude in the western tropical North Pacific, ranging from 0.37 × 10³ to 2.67 × 10³ cells L–1 (average 9.17 ± 1.4 × 10² cells L–1) (Figure 3B). The highest abundance of micro/nanophytoplankton was similarly observed at station E130-02, where the community structure was mostly dominated by filamenteous cyanobacteria, such as Trichodesmium spp. (cells > 2 μm). Abundance proportions of the micro/nanophytoplankton communities were averaged, consisting of approximately 39% diatoms, 36% dinoflagellates, 24% cyanobacteria, and 1% chrysophytes. The implication is that diatoms were the numerically dominant components of micro/nanophytoplankton communities. Within the nanophytoplankton communities, the dominant diatoms were mainly composed of pennate species, e.g., Nitzschia spp., Thalassiothrix longissima, Mastogloia rostrata, Fragilaria spp., and Synedra spp.; while in the microphytoplankton communities, diatoms were primarily dominated by the large centriae species, e.g., Coscinodiscus subtilis, Coscinodiscus marginato-lineatus, and Planktoniella blanda (Supplementary Tables 2, 3). Obvious spatial variations in abundances of these dominant diatoms were observed among stations (Supplementary Figures 2, 3).
Biogenic Silica Standing Stocks
Total depth-weighted average bSi stocks (referred to as “total bSi stocks”) were between 43 and 67 nmol L–1, averaging 52 ± 4 nmol L–1 (Figure 5). Similarly, total bSi stocks at station E130-02 were the highest observed, ∼twofold higher than other stations. The depth-weighted average bSi>20 μm standing stock (referred to as “bSi > 20 μm”) was considerably low among stations, ranging from 3 to 13 nmol L–1 (average 7 ± 0.6 nmol L–1). The bSi > 20 μm was between 8 and 20% of total bSi stocks and averaged ∼15%. The contribution of bSi2–20 μm to total bSi stocks was similarly low, ranging from 8 to 30% and averaging ∼19%. In contrast, depth-weighted average bSi < 2 μm stock (referred to as “bSi < 2 μm”) varied from 30 to 38 nmol L–1 (average 34 ± 2 nmol L–1), and was broadly higher both within and among stations. The average contribution of bSi < 2 μm alone to total bSi stocks was close to 66%, indicating that more than half of bSi standing stocks was contained in the pico-sized fraction. In addition, no major vertical trends were observed in the concentrations of bSi in three size fractions, and bSi2–20 μm and bSi > 20 μm showed somewhat mirror image, but the reason for this mirror image was unclear (Figure 6).
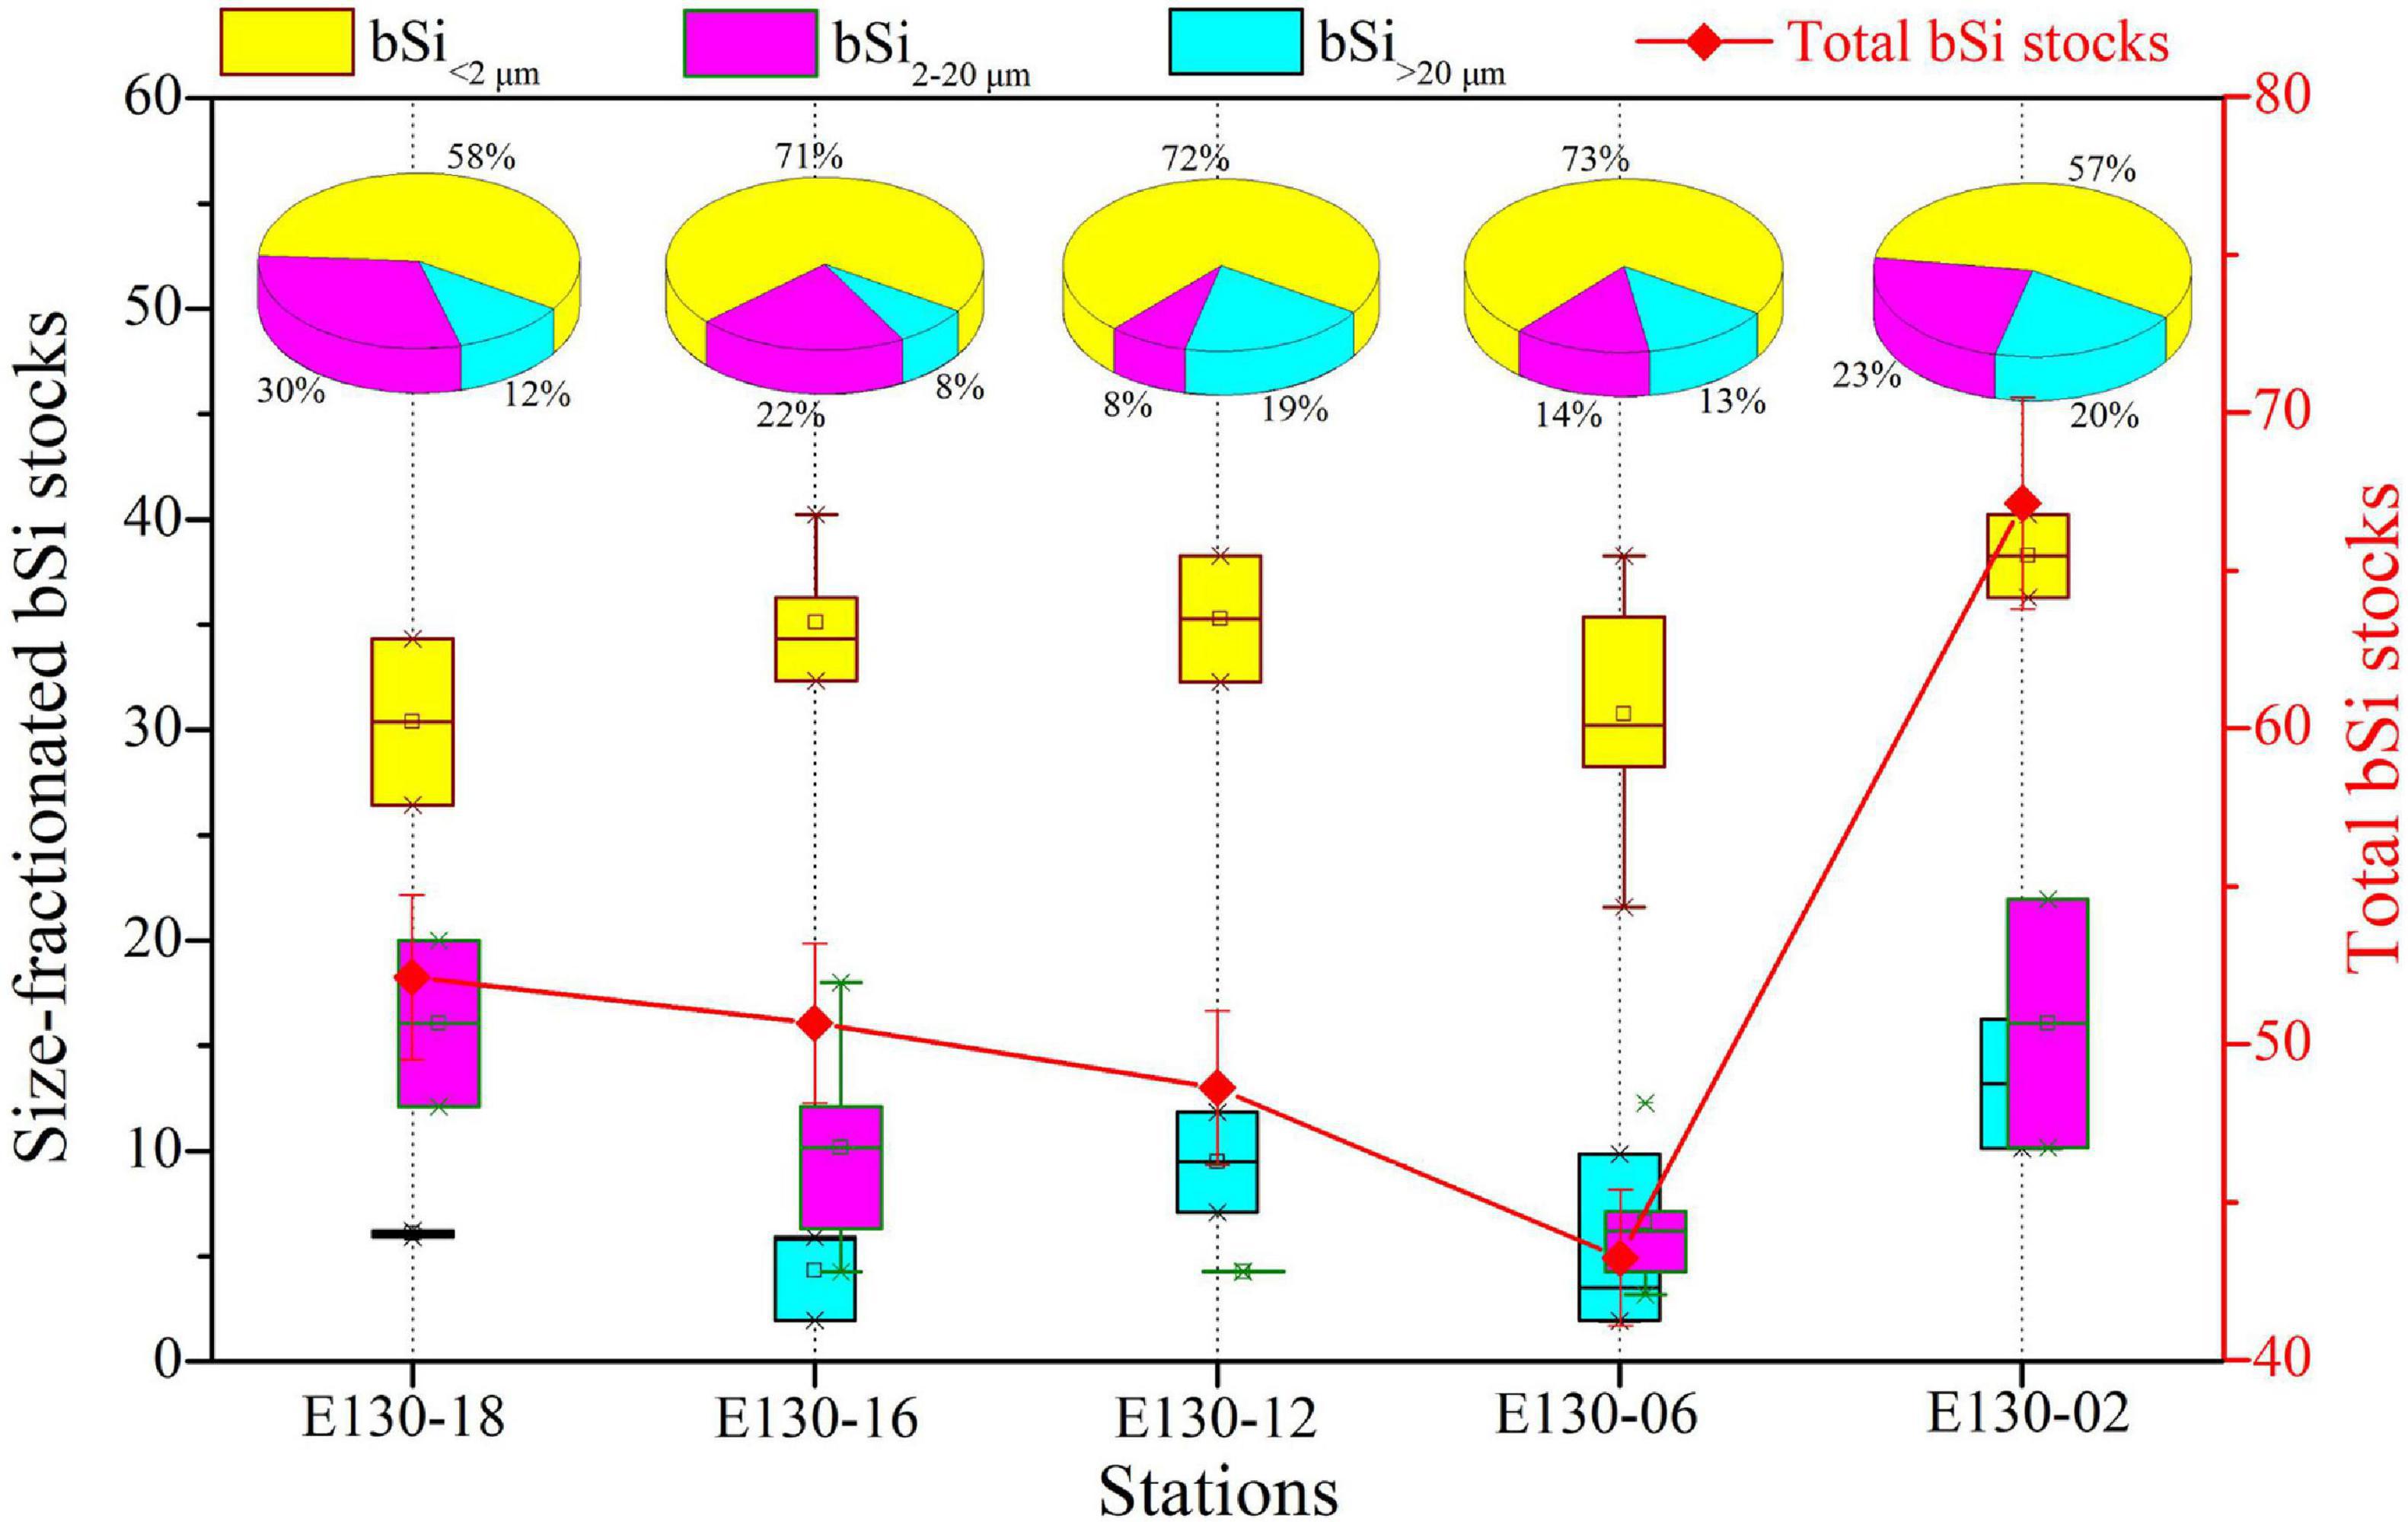
Figure 5. Station difference in size-fractionated bSi stocks (i.e., bSi < 2 μm, bSi2–20 μm, and bSi > 20 μm) and total bSi stocks (red line) (nmol L–1) along with respective contributions (%) to total bSi stocks. BSi data were expressed as depth-weighted averages within the upper 200 m.
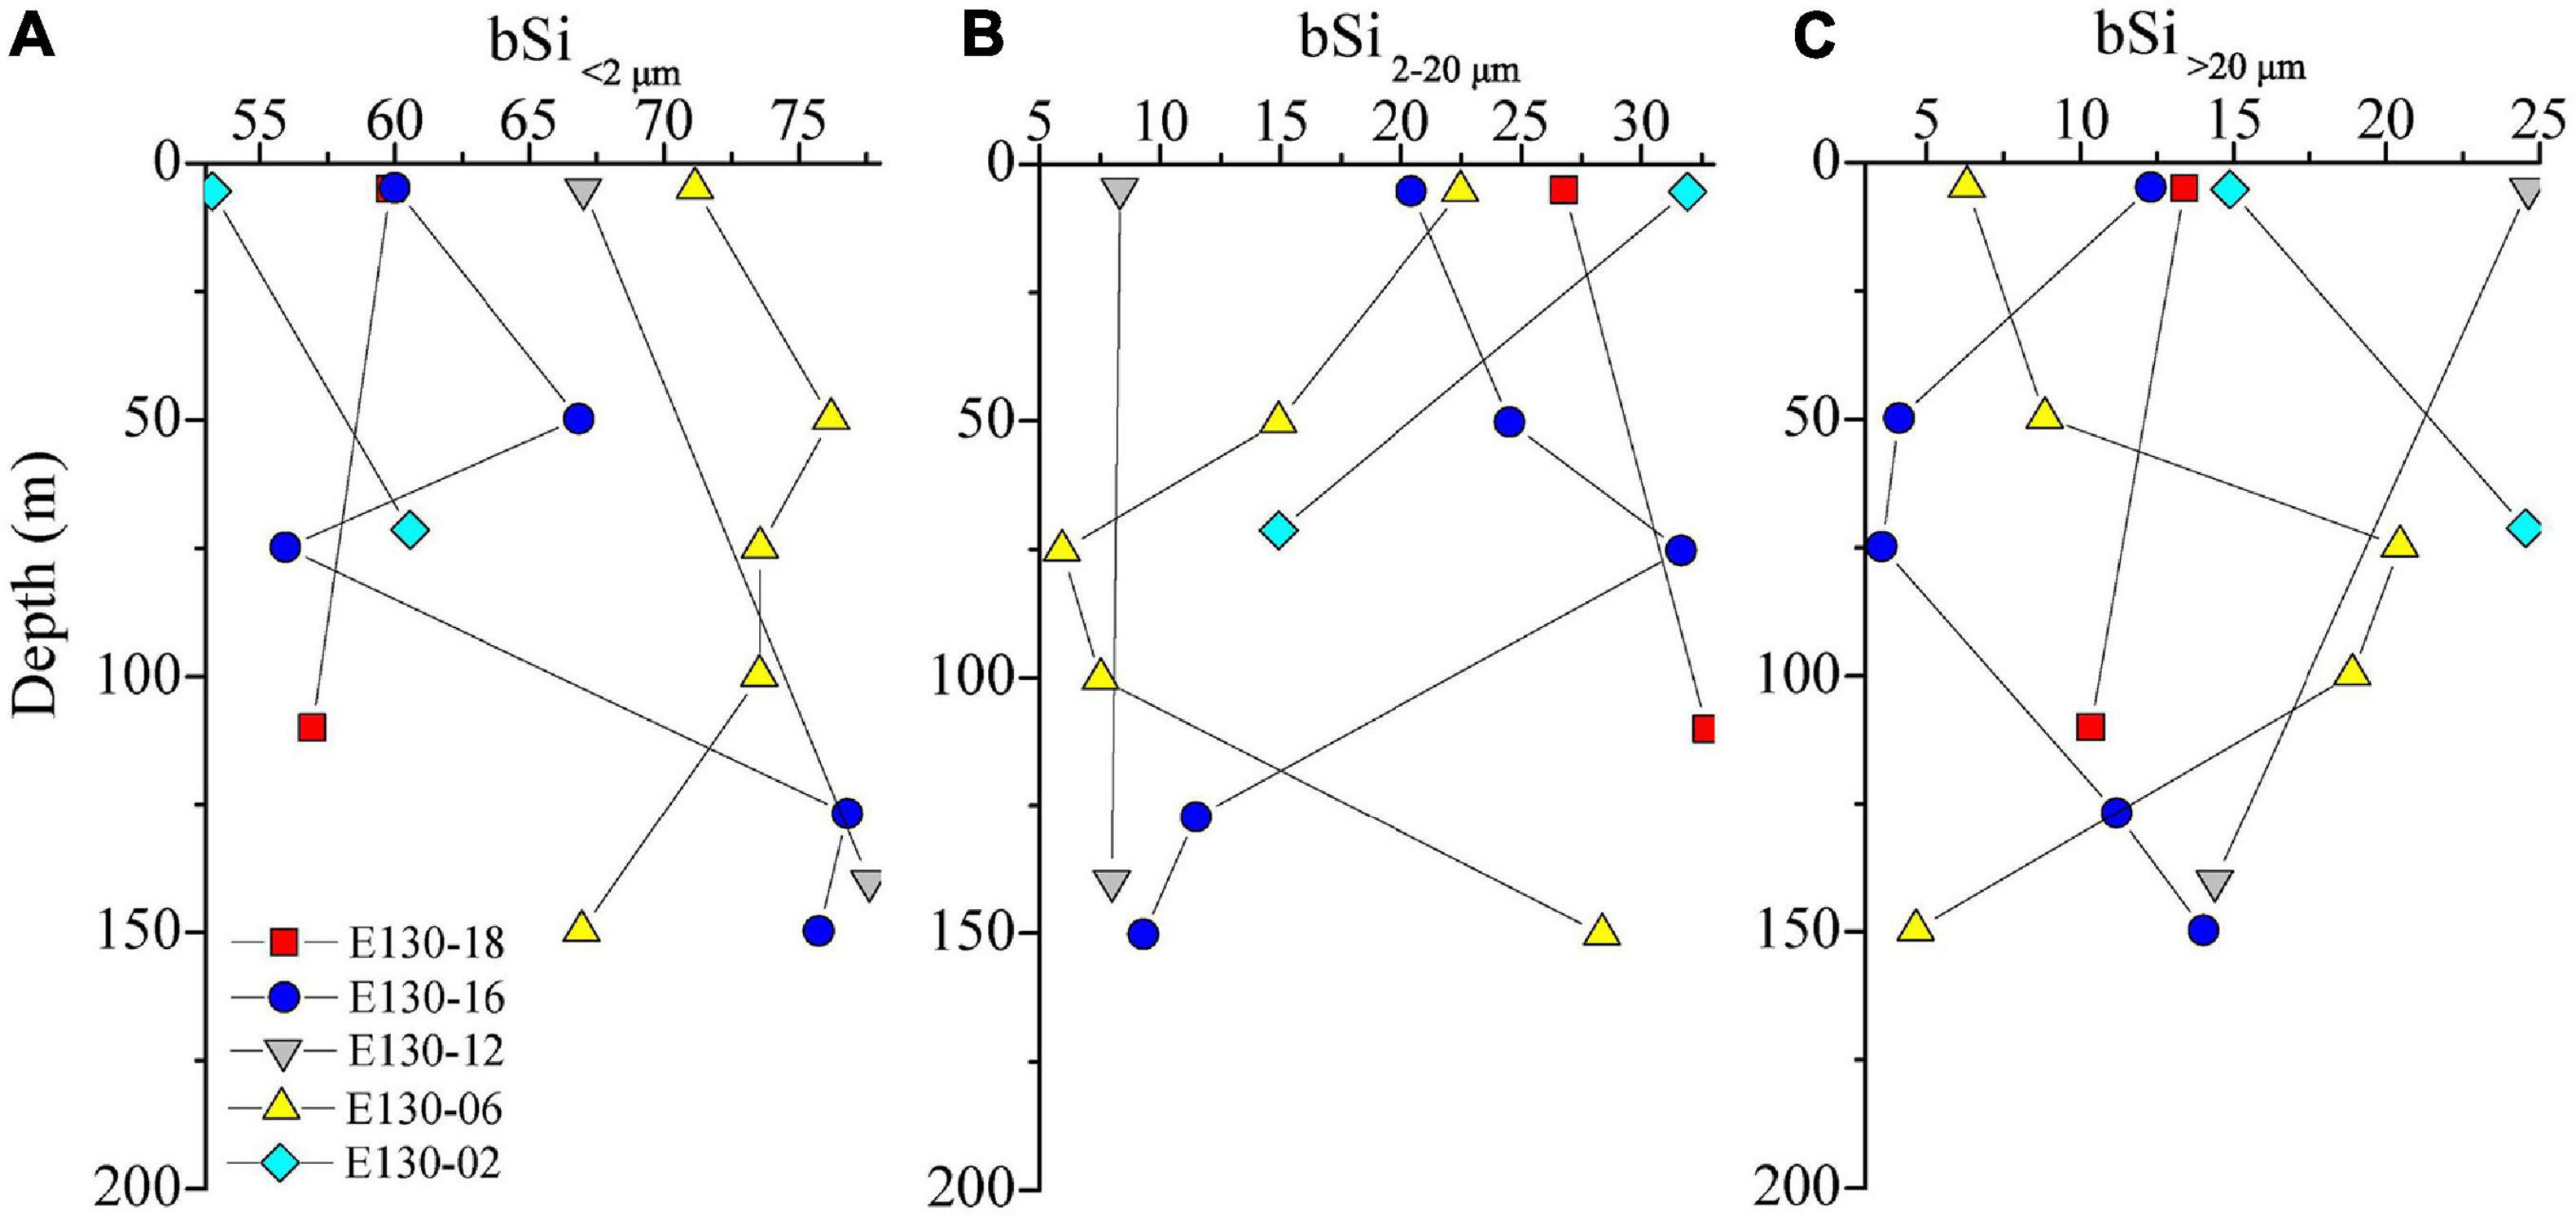
Figure 6. Vertical profiles for size-fractionated bSi standing stocks (nmol L–1) in panel (A) <2 μm (bSi < 2 μm), (B) 2–20 μm (bSi2–20 μm), and (C) >20 μm (bSi > 20 μm) size fractions. Symbols and colors represent different sampling stations as shown in panel (A). Note the x-axis scale in panel (A).
As expected, a significant contribution of pico-sized fraction to total bSi standing stocks was observed in the western tropical North Pacific (Figures 5, 6). Statistically, changes in absolute values between total bSi stocks and micro/nanophytoplankton abundance were significant (r = 0.97, p < 0.01, R2 = 0.82; Figure 7A), thus indicating that micro/nanophytoplankton had a relevant contribution to bSi standing stocks. This could be further confirmed by the higher total abundance of micro/nanophytoplankton at station E130-02 where total bSi stocks were also the highest observed (Figures 3B, 5). A significant relationship between picophytoplankton abundance and total bSi stocks was also observed in the western tropical North Pacific (r = 0.74, p < 0.05, R2 = 0.51; Figure 7A), suggesting that picophytoplankton had a potential effect on the variability of total bSi stocks. In particular, linear regression analysis showed a significant effect of picocyanobacteria abundance on the bSi in <2 μm pico-sized class (r = 0.48, p < 0.05, R2 = 0.34; Figure 7B), suggesting that a major fraction of the bSi < 2 μm standing stock was closely associated with Synechococcus and Prochlorococcus. On the other hand, marine picocyanobacteria appeared to be the primary driver of the variability in bSi < 2 μm standing stock. However, there was no clear correlation between large diatoms and bSi < 2 μm concentration (r = 0.05, p > 0.05, R2 = −0.32; Figure 7B), suggesting that the picoplankton bSi was not driven or influenced by large diatoms. Given the significant contribution of the pico-sized fraction to total bSi standing stocks (Figures 5, 6), marine picocyanobacteria may exert an important influence on the oceanic Si cycle.
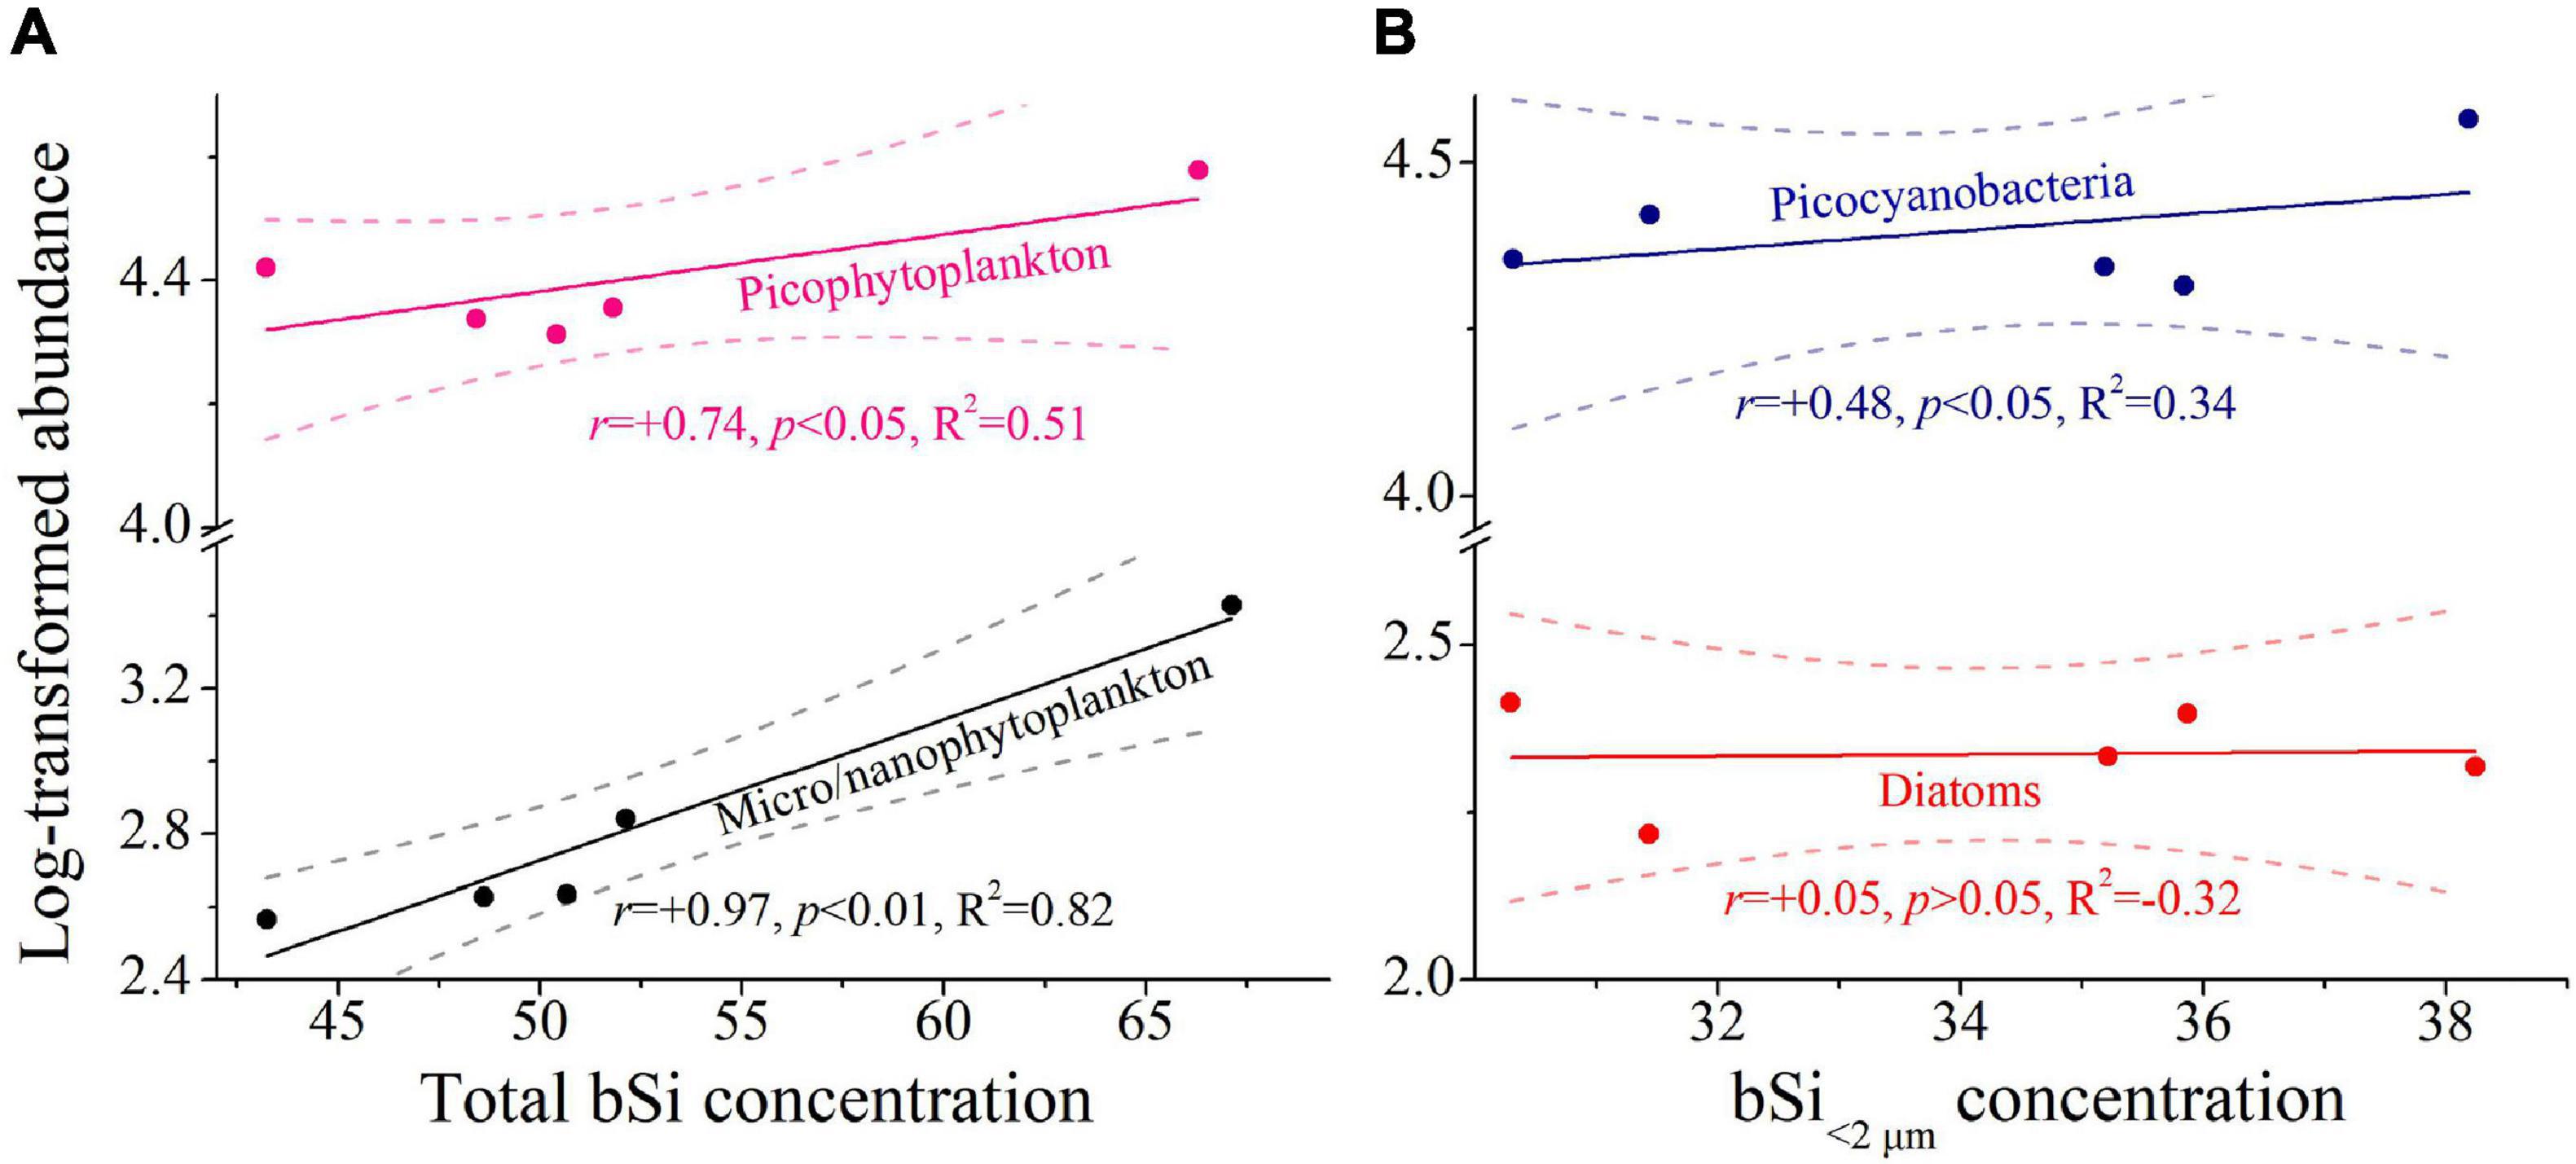
Figure 7. Relationships between size-fractionated bSi concentration (i.e., bSi > 20 μm, bSi2–20 μm, and bSi > 2 μm; nmol L−1) and phytoplankton abundance (cells mL−1/L−1). (A) total bSi concentration. (B) bSi<2 μm concentration. Colored line denotes the least square regression (Pearson r, p values and regression variance R2). Dashed lines denote 95% confidence bands. Abundance data were log transformed prior to analysis. All bSi and abundance data were expressed as depth-weighted averages within the upper 200 m. Note the scale break in y-axis.
Living Carbon Biomass
Total depth-weighted average C biomass of phytoplankton communities (referred to as “total C biomass”) generally varied from 3.26 to 10.79 μg L–1, with an average of 5.97 ± 0.92 μg L–1 (Figure 8A). Apparently, the spatial variability of total C biomass among stations was significantly associated with that of total bSi stocks (Pearson r = 0.89, p < 0.01; Figure 5). Similarly, the station E130-02 had greater total C biomass. Depth-weighted average C>20 μm biomass (referred to as “C>20 μm biomass”) ranged from 1.77 to 6.56 μg L–1 (average 3.12 ± 0.23 μg L–1), and the contribution of C>20 μm to total C biomass was high and variable, averaging 49%. Depth-weighted average C<2 μm biomass (referred to as “C<2 μm biomass”) was between 1.91 and 4.11 μg L–1 (average 2.74 ± 0.51 μg L–1). The C<2 μm biomass also averaged 49% of total C biomass with a range of 39–64%. In contrast, depth-weighted average C2–20 μm biomass (called “C2–20 μm biomass”) was much lower and less variable, averaging 0.11 ± 0.02 μg L–1 and ranging 0.08–0.17 μg L–1. The total C biomass showed a positive correlation with C>20 μm biomass (Pearson r = 0.97, p < 0.001), indicating a significant fraction of living C biomass was attributed to larger cells. Although not statistically significant (Pearson r = 0.86, p > 0.05), picophytoplankton also contributed a measurable and large proportion (49%) of the total C biomass in the western tropical North Pacific. Furthermore, average contributions of diatoms, dinoflagellates, large cyanobacteria (cells > 2 μm) and picocyanobacteria to total living C biomass were 16, 21, 13, and 36%, respectively, suggesting that the key driver in contributing to the total C biomass is marine picocyanobacteria, but not large diatoms.
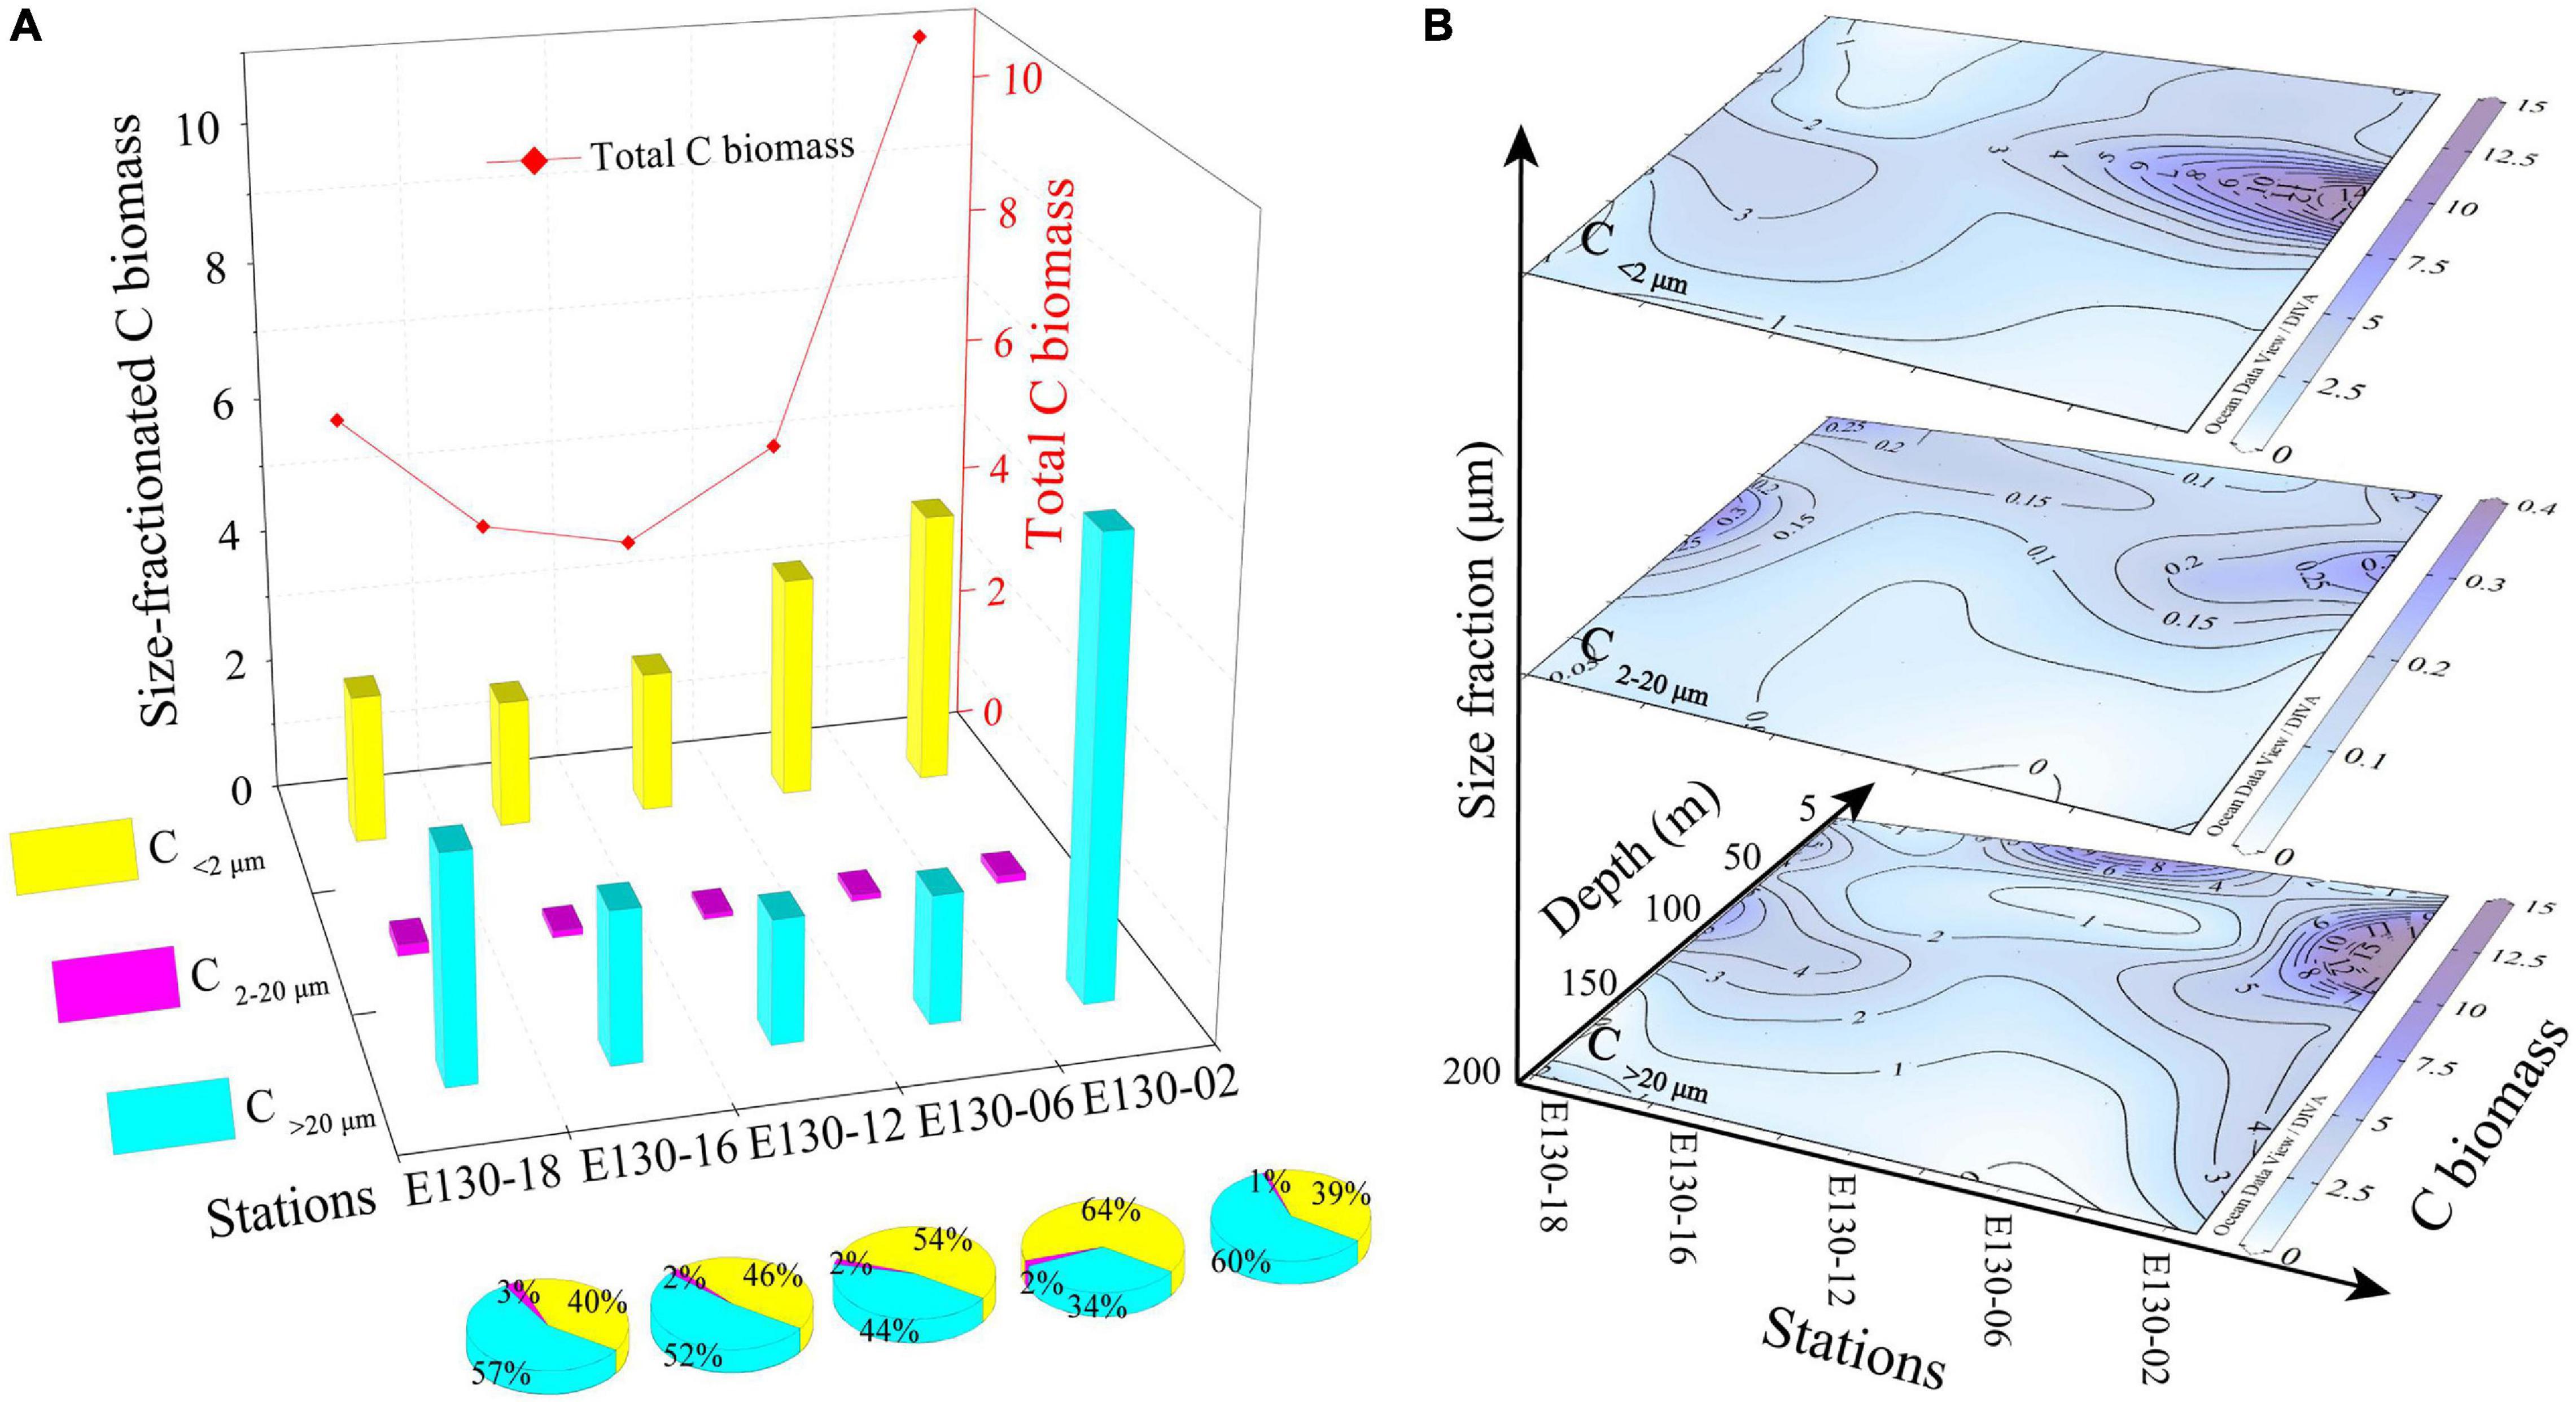
Figure 8. Spatial variability of size-fractionated C biomass (μg L–1; i.e., C<2 μm, C2–20 μm, and C>20 μm) among stations and depths. (A) Station difference in size-fractionated C biomass and total C biomass (red line) along with respective contributions (%) to total C biomass. Biomass data here was expressed as depth-weighted average within the upper 200 m. (B) Vertical profiles for living C<2 μm, C2–20 μm, and C>20 μm biomass. Note the color bar of C biomass in the 2–20 μm size fraction.
The vertical profiles for size-fractionated living C biomass in the upper 200 m were markedly different among stations (Figure 8B). Living C biomass for three size fractions (i.e., C<2 μm, C2–20 μm, and C>20 μm) were higher within the upper 50–75 m, with a rapid decline at depths deeper than 100 m. The C<2 μm biomass was relatively low apart from station E130-02, where it was typically found in a subsurface maximum of up to 15.24 μg L–1 at 50–100 m depth. The living C>20 μm biomass was highly uneven with depth ranging between 0.32 and 18.44 μg L–1, but was much higher at stations E130-02 (50 m) and E130-18 (75 m). The vertical trend observed for C2–20 μm biomass was similar to that for C>20 μm biomass, whereas the living C2–20 μm biomass was considerably lower than other two size fractions.
Discussion
Potential Contributions of the Pico-Sized Plankton to bSi Standing Stock and Living C Biomass
Diatoms are thought to be the primary organisms responsible for the intimately coupled Si and C cycles, owing to density-driven particle sedimentation. However, Tang et al. (2014) have discovered that picocyanobacteria are also important in transporting organic matter to depth, i.e., Si can be deposited on extracellular polymeric substance associated with decomposing picocyanobacteria (EPS-Si), which may be a precursor of micro-blebs observed in the deep ocean. Furthermore, Krause et al. (2017) have demonstrated that picoplankton may contribute a measurable and at times significant proportion of the bSi stock and production in the Sargasso Sea. Thereafter, Leblanc et al. (2018) have confirmed recent findings of an active biological uptake of Si in the pico-sized fraction, and revealed a non-negligible contribution of the picoplankton to bSi standing stocks. In addition to the significant role in marine C cycle (Richardson and Jackson, 2007), we therefore infer that the pico-sized plankton may also have a significant contribution to particle-associated bSi stocks in the upper ocean (Baines et al., 2012; Krause et al., 2017; Leblanc et al., 2018). Given the global distribution of picoplankton, especially in oligotrophic open ocean gyres, there may be potential to influence global oceanic Si fluxes. Presuming that the average bSi stock (34 ± 2 nmol L–1; Figure 5) for picoplankton measured in the present study was representative and taking the average C biomass for picoplankton as 2.74 ± 0.51 μg L–1 (i.e., ∼228 nmol L–1; Figure 8) suggests a Si/C molar ratio of 0.14. In a synthesis of flow cytometry data, Buitenhuis et al. (2012) estimated that the global C biomass of picoplankton ranged from 0.53 to 1.32 Pg C (Pg C = 103 Tg C). Converting picoplankton C to Si, using the derived Si/C ratio (i.e., 0.14), provides an estimated global picoplankton bSi stock of ∼6–15 Tmol Si that is twofold to threefold higher than global diatom bSi stock (∼3–4 Tmol Si; Leblanc et al., 2012). Applying the mean C export of picoplankton (∼6.21 mmol C m–2 d–1; Richardson and Jackson, 2007) estimated from the oligotrophic gyres to this derived Si/C ratio (i.e., 0.14) implies a picoplankton Si export of 0.86 mmol Si m–2 d–1 that is up to twofold higher than the total diatom Si export. These calculations have large uncertainty due to the lack of data and should only be considered as first-order estimates. However, these results suggest a crucial role for the pico-sized plankton in the marine Si cycle at regional and global scales.
Recent studies have suggested that Synechococcus can account for 2–14% of the total bSi standing stocks in the Atlantic Ocean, the equatorial Pacific, and the tropical South Pacific (Baines et al., 2012; Ohnemus et al., 2016; Leblanc et al., 2018). Therefore, Baines et al. (2012) have suggested that “picocyanobacteria may exert a previously unrecognized influence on the oceanic Si cycle, especially in oligotrophic marine environments.” To date, however, limited data made it difficult to estimate the potential contributions of Synechococcus to regional bSi standing stocks and living C biomass concurrently. Synechococcus cellular Si contents vary widely, from 1 to 4,700 amol Si cell–1 (Ohnemus et al., 2016). For instance, Synechococcus within a station varied in Si content by an order of magnitude in the Sargasso Sea (Baines et al., 2012). Averaging the cellular Si contents (i.e., QSi = 413 amol Si cell–1) reported by Baines et al. (2012) for the Pacific Ocean and combining them with Synechococcus abundance (ASyn, cells L–1), pico-sized (bSi<2 μm) and total (bSi>0.2 μm) bSi stocks (nmol L–1) allow us to assess the potential contributions of Synechococcus to bSi<2 μm and bSi>0.2 μm stocks (SiSyn, %) (Krause et al., 2017). The equation was calculated as:
Additionally, size-fractionated C biomass for phytoplankton communities have seldom been derived by biovolume, mostly focusing on the vague chlorophyll and POC analyses. Given this dearth of information, we also estimated the potential contributions of picocyanobacteria to pico-sized (C<2 μm) and total (C>0.2 μm) C biomass based on the biovolume geometric models (Sun and Liu, 2003; Table 3).

Table 3. Estimated contributions of picocyanobacteria to pico-sized (<2 μm) and total (>0.2 μm) bSi standing stocks or living C biomass.
Synechococcus had a small contribution to both bSi<2 μm and bSi>0.2 μm standing stocks across the western tropical North Pacific, averaging ∼4 and 3%, respectively (Table 3). However, this small contribution is comparable to that in the Atlantic Ocean (<4%; Ohnemus et al., 2016). It is not surprising given that the preponderance of total bSi pool in the open ocean is detrital and not associated with living cells (Baines et al., 2012). Krause et al. (2010) have revealed that the detrital bSi merely not associated with living diatoms comprised 70–90% of the total bSi pool in the equatorial Pacific Ocean. This finding implies that a large fraction of the bSi pool is associated with detritus. Analogously, significant bSi detritus is also present in bSi<2 μm pool (Krause et al., 2017; Leblanc et al., 2018). Owing to the phylogenetic similarity between Synechococcus and Prochlorococcus, Baines et al. (2012) and Krause et al. (2017) both suggested Prochlorococcus can also accumulate substantial amounts of Si in the ocean. However, the contribution of these organisms to the bSi pool is currently unknown, in part because they are too small. If we assumed that Prochlorococcus and Synechococcus have similar contributions to the bSi pool, the contribution of picocyanobacteria to total bSi stocks (∼6%) is nearly 30–60% of that for large diatoms (Krause et al., 2010, 2013). In some cases, the water column inventory of Si in Synechococcus can exceed that of diatoms (Baines et al., 2012; Tang et al., 2014). Moreover, we observed a significant link between picocyanobacteria abundance and bSi<2 μm standing stock based on the linear regression analysis (r = 0.48, p < 0.05, R2 = 0.34; Figure 7B). These results indicate that picocyanobacteria may have an important contribution to regional bSi stocks.
We also made a detailed estimation of the picocyanobacteria contribution to living C biomass (Table 3). Some studies have revealed that picocyanobacteria contribute substantially more to C export than previously believed (Lomas and Moran, 2011; Tang et al., 2014). However, the importance of picocyanobacteria in living C biomass in previous studies was mostly derived from the size-fractionated chlorophyll and POC analyses. Based on the biovolume geometric models (Sun and Liu, 2003), here we provided the first-order evidence that picocyanobacteria accounted for up to ∼36% of the total C biomass of phytoplankton communities in the western tropical North Pacific, suggesting that picocyanobacteria contributed a measurable and significant proportion of the living C biomass in regional oligotrophic gyres. In contrast, diatoms were responsible for just 16% of the total living C biomass of phytoplankton communities in the oligotrophic western tropical North Pacific (Figure 8).
Magnitude and Variability of bSi Stocks and Living C Biomass in Natural Phytoplankton Communities
Comparing our field data of size-fractionated bSi and biovolume-derived C to other studies or systems is difficult, because measurements of the bSi standing stock and C biomass have seldom been conducted together in three size fractions (i.e., 0.2–2; 2–20; >20 μm). Furthermore, previous bSi measurements were typically characterized by large size cutoffs (e.g., >2 μm) instead of focusing on the pico-sized fraction, and the C biomass was extrapolated from traditional size-fractionated chlorophyll and POC analyses. Although Baines et al. (2012) and Krause et al. (2017) have analyzed the size-fractionated bSi in the Sargasso Sea, their bSi measurements were collected from just two size fractions (i.e., >3 and <3 μm), and were not in combination with C biomass. We thus compared the total bSi stocks (i.e., bSi>0.2 μm) to previous data, given complexity of the datasets. For example, average bSi>0.2 μm in the Sargasso Sea was reported to be 22–23 nmol L–1 (Baines et al., 2012), which is twofold lower than our average (52 nmol L–1) observed in the western tropical North Pacific (Figure 5). However, the average bSi>0.2 μm of approximately 50 nmol L–1 previously observed for the Pacific Ocean (Brzezinski et al., 1998; Leynaert et al., 2001; Krause et al., 2010) is comparatively similar to our result.
Previous studies have demonstrated that more than 75% of the euphotic zone bSi pool is not associated with living diatoms (Krause et al., 2010). Assuming a smallest detrital proportion for bSi>2 μm pool of 75%, living diatoms in >2 μm size fraction still account for 25% of the bSi>2 μm stocks (referred to as bSidiatom), of which the average bSidiatom in 2–20 μm (bSidiatom 2–20 μm) and >20 μm (bSidiatom > 20 μm) fractions are 2.6 ± 1.1 and 1.9 ± 0.6 nmol L–1, respectively (Figure 5). Thus, living diatoms (>2 μm) contribute on average ∼9% of the total bSi stocks. Conley et al. (1989) have observed a statistically significant correlation between Si content and biovolume in individual diatoms. Combining average bSidiatom with the derived biovolume (Vol., μm3), diatom abundance (Adiatom, cells L–1; 78.26 and 109.87 cells L–1 for diatoms in 2–20 and >20 μm fractions, respectively), and a conversion factor of 0.96 × 10⁻⁴ (μ; Conley, 1988) allows us to roughly estimate the Si content per cell (Sidiatom, pg cell–1) for living dominant diatoms (>2 μm) in natural phytoplankton communities (Table 4):
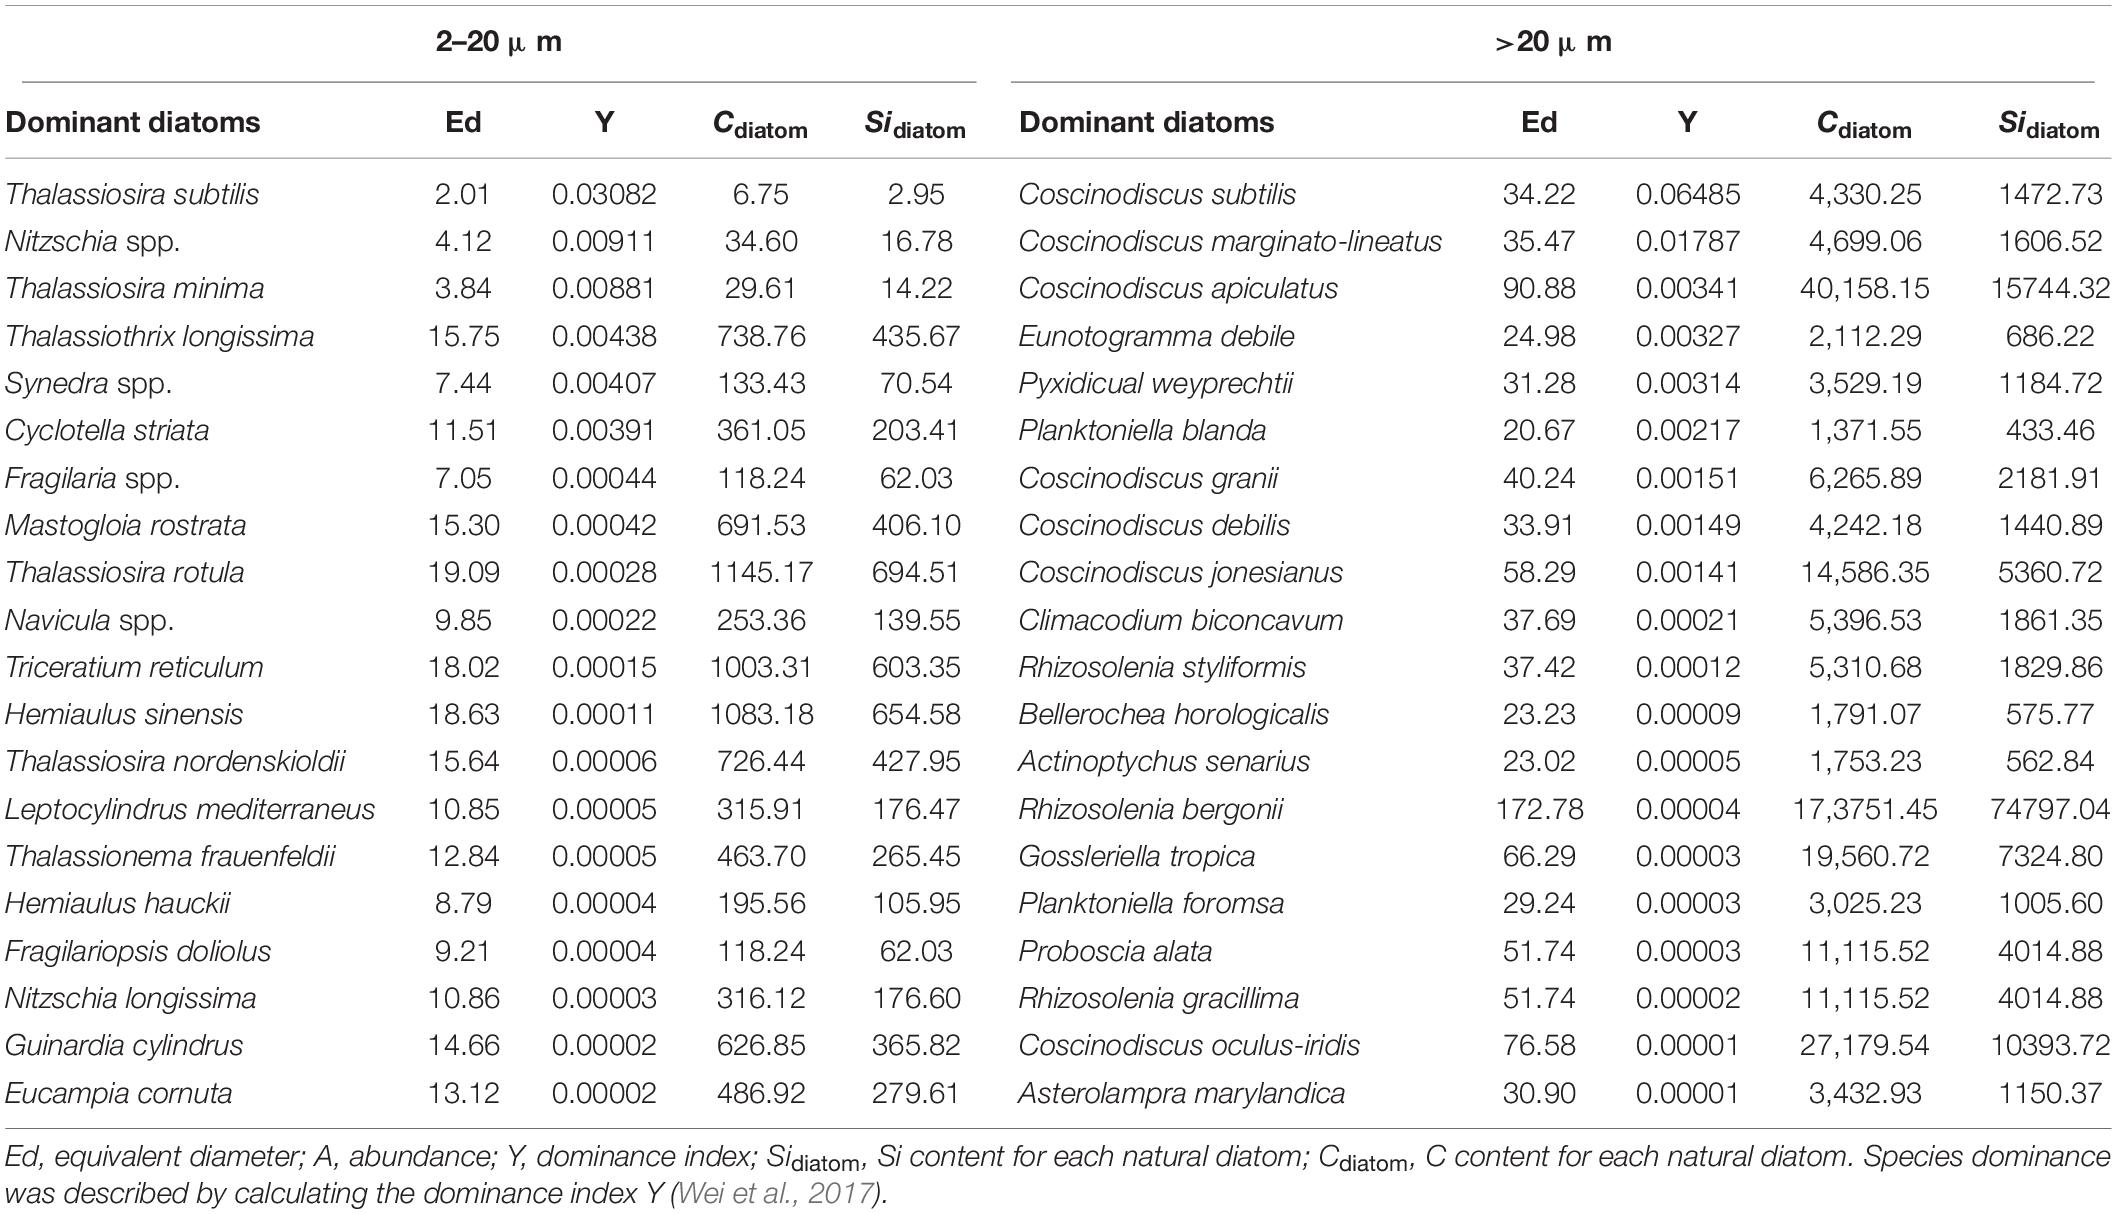
Table 4. Equivalent diameter, dominance index, Cdiatom (pg cell–1) and Sidiatom (pg cell–1) of top-twenty dominant diatoms in 2–20 and >20 μm size fractions.
Consistent with previous observations (Conley, 1988; Conley et al., 1989; Liu et al., 2016; Kienel et al., 2017), however, there is considerable variation in cellular Si and C contents among different dominant diatoms in the present study (Table 4). Even within a given species, the Si and C contents can vary by up to an order of magnitude (Conley et al., 1989), as they are a function of cell size in cell cycle (Conley, 1988; Sun and Liu, 2003), growth rate (Conley et al., 1989), sexual reproduction (Liu et al., 2016), and external factors (e.g., temperature, salinity, light, and nutrients) (Claquin et al., 2002; and many others). It is reasonably concluded that the higher bSi standing stocks and living C biomass at stations E130-18 and E130-02 were influenced, respectively, by different environmental conditions (Chen et al., 2015; Wu et al., 2015). In summary, the Si and C contents in marine diatoms vary greatly among different species and even within a given species growing under different environmental conditions and physiological status.
What Are the Key Environmental Factors Controlling the Variability of Size-Fractionated bSi Standing Stocks and Living C Biomass?
Except for the biological process, the variability of size-fractionated bSi standing stocks and living C biomass also appears to be regulated by environmental factors (Harrison et al., 1976; Brzezinski, 1985; Sarthou et al., 2005; Krause et al., 2013; Wei et al., 2020). Across the western tropical North Pacific, as a result of pronounced stratification together with the biological removal of nearly all nutrients from the surface waters, nutrient concentrations (i.e., DIN, DIP, and DSi) observed within the upper 200 m were consistently low (Figure 2 and Table 2). In particular, it has been documented that the Si/C and Si/N ratios of marine diatoms could change depending on nutrient-replete or depleted conditions (Brzezinski, 1985; Takeda, 1998). Hence, the surface depletion of nutrients (especially DSi) under stratified conditions may be a limiting factor for the variability of size-fractionated bSi standing stocks and living C biomass. In this study, however, Spearman correlation analysis showed no significant relationships between nutrient concentrations and size-fractionated bSi standing stocks and living C biomass except the C2–20 μm (p > 0.05; Figure 9), indicating that their variability is not directly associated with these major nutrients that needed for phytoplankton growth. Indeed, experiments examining the kinetics of DSi use at the BATS site have demonstrated that Si uptake is chronically limited by the <1.0 μmol L–1 DSi, which is very similar to the Si-limited behavior of cultured diatoms at a DSi of <0.7 μmol L–1 (Paasche, 1973; Brzezinski and Nelson, 1995). Therefore, DSi limitation is unlikely to occur in the western tropical North Pacific, as the measured average DSi were always >1.0 μmol L–1 among stations (Table 2). Furthermore, recent studies of both field and culture experiments have implied that DSi is not a required nutrient for picocyanobacteria growth and metabolism, although their special Si transport system and Si precipitation machinery are both unclear at present (Baines et al., 2012; Tang et al., 2014; Ohnemus et al., 2016). Taken together, nutrient supply (especially DSi) is not likely the key determinant (maybe acting as an indirect trigger) of the variations in size-fractionated bSi standing stocks and living C biomass among stations and depths. This is further confirmed by the low values of total bSi standing stocks and C biomass at the station E130-06 (Figures 5, 8), where nutrient concentrations were relatively high due to the presence of cold eddy (Figure 2 and Table 2). Analogously, Adjou et al. (2011) have suggested that marine bSi pools are under control of biological rather than physical processes. On the contrary, some of the high reported diatom bSi events under oligotrophic conditions (e.g., the Sargasso Sea) have been associated with mesoscale eddy features, suggesting the potential influence of physical process on the bSi dynamics (Conte et al., 2003; Benitez-Nelson et al., 2007; Krause et al., 2009). For instance, Benitez-Nelson et al. (2007) have determined that a diatom bloom in a North Pacific cold-core eddy can act as a selective Si pump, if the living diatoms have a Si/N ratio of 1:1 (Nelson and Brzezinski, 1997; and references therein). However, little information is available with regard to the mechanisms connecting the physical forcing with the dynamics of bSi in different size fractions, which will need to be elucidated by future research.
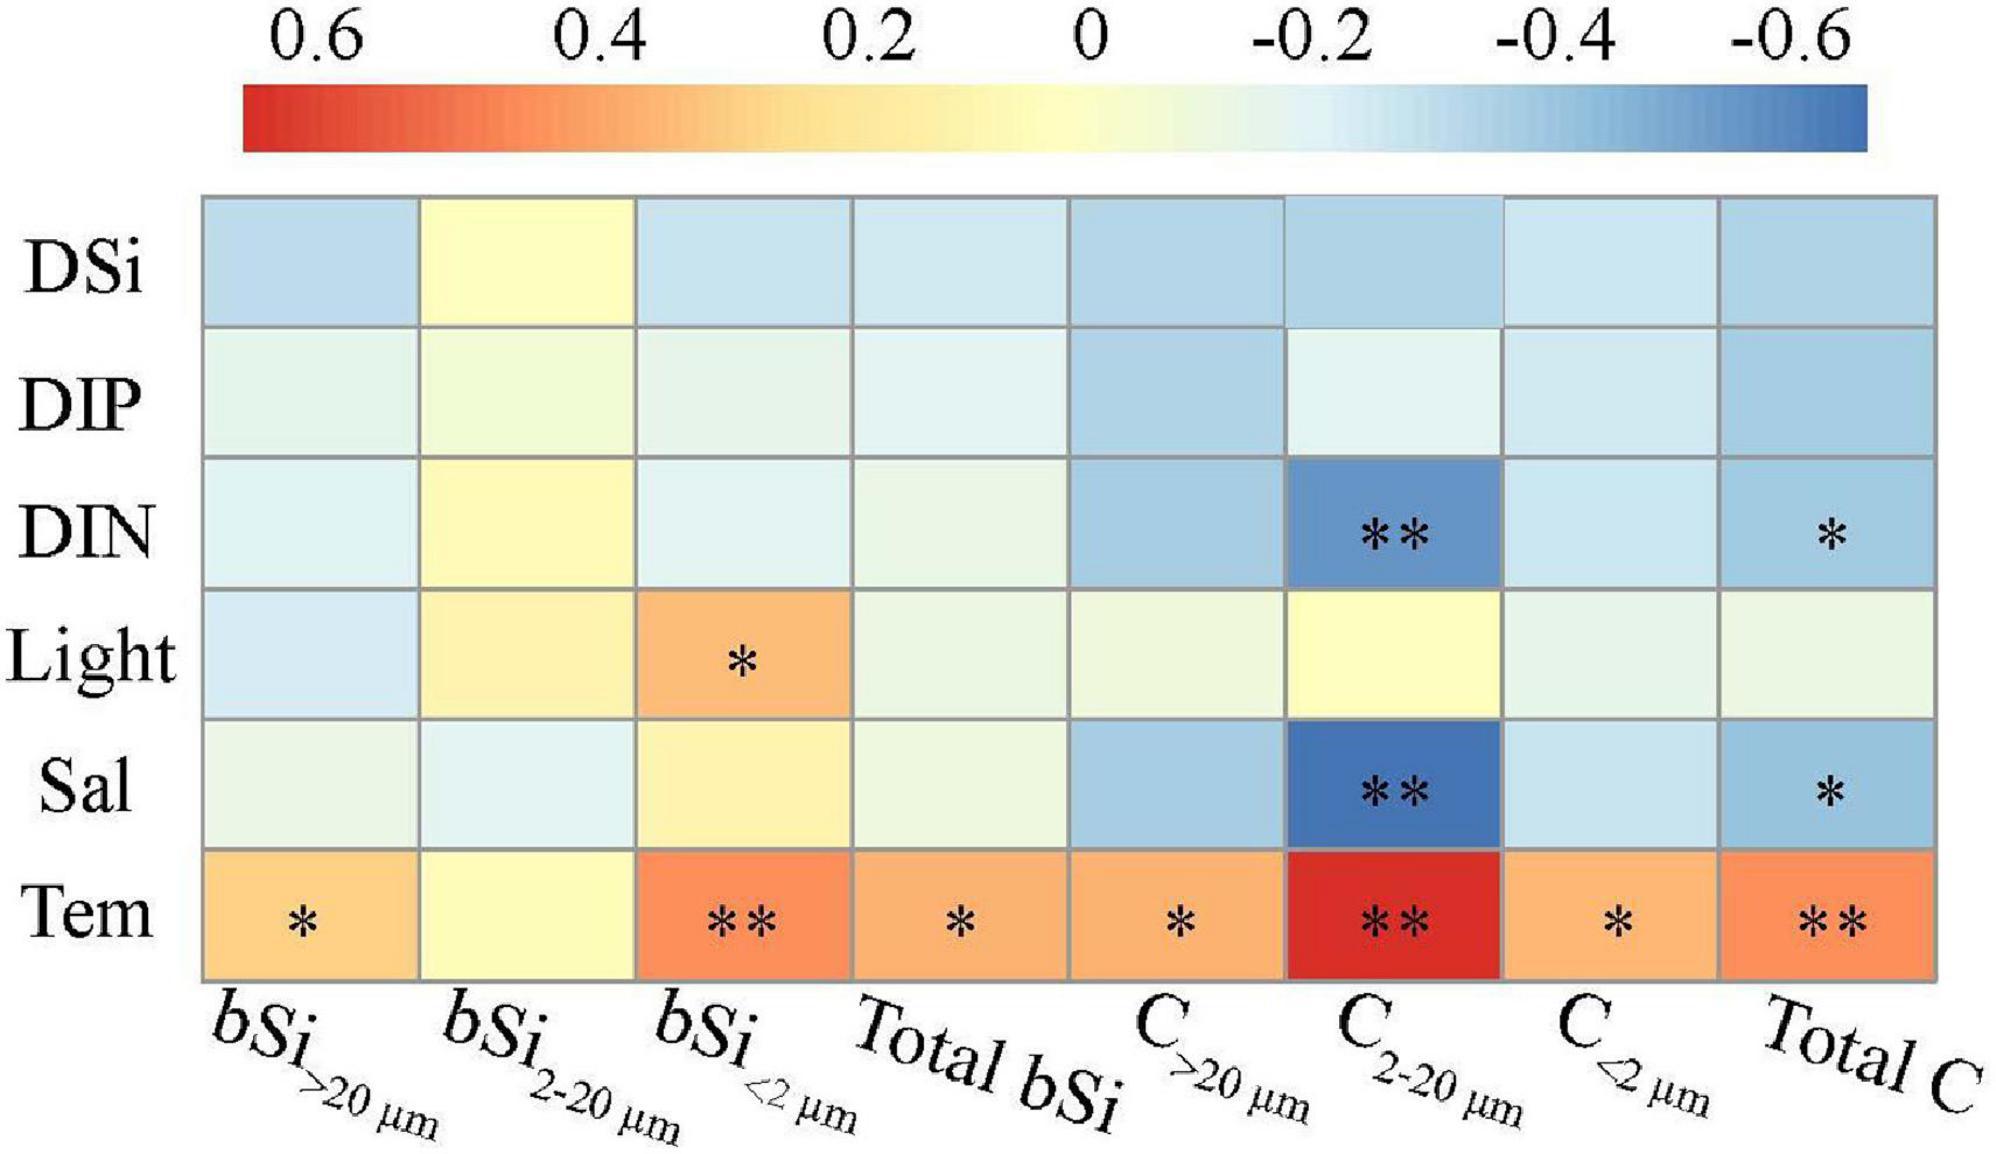
Figure 9. Relationships between size-fractionated bSi standing stocks (living C biomass) and various environmental factors. Spearman correlation coefficients (α) ranged from negative to positive and are indicated by color intensity changing from dark blue to red, respectively. ∗∗p < 0.01; ∗p < 0.05 (two-tailed). Sal, salinity; Tem, temperature. DIN, the sum of NH4+, NO3–, and NO2–; DIP and DSi, dissolved inorganic phosphorus and silicate, respectively.
In the present study, the variability of size-fractionated bSi standing stocks and living C biomass was observed in late fall (3rd October to 5th November). Generally, this period in the western tropical North Pacific is characterized by increasing vertical stratification, with solar irradiance decreasing. However, the effects of stratification (i.e., low nutrient availability), combined with the decrease in solar irradiance would limit the growth of phytoplankton communities, such as diatoms (Cotner and Wetzel, 1992; Krause et al., 2009). Consequently, the light regime in the upper water column may be favorable for phytoplankton growth, probably driving the bSi and C dynamics (Brzezinski, 1985; Wei et al., 2017, 2020). This is also in line with our results, as light intensity showed a significant correlation with bSi<2 μm, thus suggesting that light intensity may be a key factor affecting the variance in pico-sized bSi stocks (p < 0.05; Figure 9). In addition, the size-fractionated bSi standing stocks and living C biomass were positively correlated with water temperature, indicating water temperature was another dependent factor regulating their variations (p < 0.05; Figure 9). This result is also consistent with previous findings (Agawin et al., 2000; Natori et al., 2006; Wei et al., 2021), i.e., there are significant correlations between water temperature and bSi standing stocks and C biomass. This is confirmed by our measurements of low bSi and C biomass at the eddy-affected station E130-06 (Figures 5, 8), of which one possibility is that low temperature may decrease the bSi and C production rates of marine phytoplankton, due to the temperature dependence of metabolic activity (Krause et al., 2017; Padfield et al., 2017).
Conclusion
This study provides new measurements of bSi and C in the pico-sized fraction. In the oligotrophic western tropical North Pacific, the estimated contributions of pico-sized fraction to total bSi standing stocks and living C biomass averaged 66 and 49%, respectively. In contrast, the average contributions of large diatoms (i.e., cells > 2 μm) to total bSi stocks and living C biomass were 9 and 16%, respectively. Since the overwhelming predominance of picocyanobacteria (i.e., Prochlorococcus and Synechococcus), their contributions to total bSi stocks and C biomass were quantitatively important. Synechococcus had a small contribution to both bSi<2 μm and bSi>0.2 μm standing stocks across the western tropical North Pacific, averaging ∼4 and 3%, respectively. It is not surprising, given that most of the total bSi pool in the open ocean consists of detrital material and is not associated with living cells (Baines et al., 2012). If Prochlorococcus and Synechococcus have similar contributions to the bSi pool, the contribution of picocyanobacteria to total bSi stocks (∼6%) is nearly 30–60% of that for diatoms (Krause et al., 2010). These findings will impact our understanding of the long-term controls on oceanic Si and C cycling, and the interpretations of disproportionate Si and C budgets in oligotrophic oceans.
Data Availability Statement
The datasets presented in this study can be found in online repositories. The names of the repository/repositories and accession number(s) can be found below: Data and computer codes for analyses are available in GitHub repository: https://github.com/phytoplankton-sunjun/Frontiers-in-MS.
Author Contributions
JS conceived the ideas and designed methodology. YW, ZZ, and ZC performed the experiments and analysis. YW wrote the manuscript and prepared the tables and figures. All authors edited and revised the manuscript.
Funding
This work was supported by the National Natural Science Foundation of China grants (41876134, 41676112, and 41276124), the University Innovation Team Training Program for Tianjin (TD12-5003), the Tianjin 131 Innovation Team Program (20180314), and the Changjiang Scholar Program of Chinese Ministry of Education (T2014253) to JS.
Conflict of Interest
The authors declare that the research was conducted in the absence of any commercial or financial relationships that could be construed as a potential conflict of interest.
Publisher’s Note
All claims expressed in this article are solely those of the authors and do not necessarily represent those of their affiliated organizations, or those of the publisher, the editors and the reviewers. Any product that may be evaluated in this article, or claim that may be made by its manufacturer, is not guaranteed or endorsed by the publisher.
Acknowledgments
We would like to thank the Open Cruise Project in Western Pacific Ocean of National Nature Science Foundation of China (NORC2017-09) for sharing their ship time.
Supplementary Material
The Supplementary Material for this article can be found online at: https://www.frontiersin.org/articles/10.3389/fmars.2021.691367/full#supplementary-material
Footnotes
References
Adjou, M., Tréguer, P., Dumousseaud, C., Corvaisier, R., Brzezinski, M. A., and Nelson, D. M. (2011). Particulate silica and Si recycling in the surface waters of the eastern equatorial pacific. Deep Sea Res. Part II Top. Stud. Oceanog. 58, 449–461. doi: 10.1016/j.dsr2.2010.08.002
Agawin, N. S., Duarte, C. M., and Agustí, S. (2000). Nutrient and temperature control of the contribution of picoplankton to phytoplankton biomass and production. Limnol. Oceanog. 45, 591–600. doi: 10.4319/lo.2000.45.3.0591
Baines, S. B., Twining, B. S., Brzezinski, M. A., Krause, J. W., Vogt, S., Assael, D., et al. (2012). Significant silicon accumulation by marine picocyanobacteria. Nat. Geosci. 5:886. doi: 10.1038/ngeo1641
Benitez-Nelson, C. R., Bidigare, R. R., Dickey, T. D., Landry, M. R., Leonard, C. L., Brown, S. L., et al. (2007). Mesoscale eddies drive increased silica export in the subtropical Pacific Ocean. Science 316, 1017–1021. doi: 10.1126/science.1136221
Brzezinski, M. A. (1985). The si: C: N ratio of marine diatoms: interspecific variability and the effect of some environmental variables. J. Phycol. 21, 347–357. doi: 10.1111/j.0022-3646.1985.00347.x
Brzezinski, M. A., and Nelson, D. M. (1995). The annual silica cycle in the sargasso sea near bermuda. Deep Sea Res. I 42, 1215–1237. doi: 10.1016/0967-0637(95)93592-3
Brzezinski, M. A., Villareal, T. A., and Lipschultz, F. (1998). Silica production and the contribution of diatoms to new and primary production in the central North Pacific. Mari. Ecol. Prog. Series 167, 89–104. doi: 10.3354/meps167089
Buesseler, K. O. (1998). The decoupling of production and particulate export in the surface ocean. Global Biogeochem. Cycles 12, 297–310. doi: 10.1029/97gb03366
Buitenhuis, E. T., Li, W. K., Vaulot, D., Lomas, M. W., Landry, M. R., Partensky, F., et al. (2012). Picophytoplankton biomass distribution in the global ocean. Earth Syst. Sci. Data 4, 37–46. doi: 10.5194/essd-4-37-2012
Campbell, L. D., Liu, H., Nolla, H. A., and Vaulot, D. (1997). Annual variability of phytoplankton and bacteria in the subtropical north pacific ocean at station aloha during the 1991-1994 enso event. Deep Sea Res. Part I Oceanog. Res. Papers 30, 167–192. doi: 10.1016/s0967-0637(96)00102-1
Chen, Y. L. L., Chen, H. Y., Jan, S., Lin, Y. H., Kuo, T. H., and Hung, J. J. (2015). Biologically active warm-core anticyclonic eddies in the marginal seas of the western Pacific Ocean. Deep Sea Res. Part I Oceanog. Res. Papers 106, 68–84. doi: 10.1016/j.dsr.2015.10.006
Claquin, P., Martin-Jézéquel, V. R., Kromkamp, J. C., Veldhuis, M., and Kraay, G. W. (2002). Uncoupling of silicon compared with carbon and nitrogen metabolisms and the role of the cell cycle in continuous cultures of Thalassiosira pseudonana (Bacillariophyceae) under light, nitrogen and phosphorus control. Journal of Phycology 38, 922–930. doi: 10.1046/j.1529-8817.2002.t01-1-01220.x
Conley, D. J. (1988). Biogenic silica as an estimate of siliceous microfossil abundance in Great Lakes sediments. Biogeochemistry 6, 161–179. doi: 10.1007/bf02182994
Conley, D. J., Kilham, S. S., and Theriot, E. (1989). Differences in silica content between marine and freshwater diatoms. Limnol. Oceanog. 34, 205–212. doi: 10.4319/lo.1989.34.1.0205
Conte, M. H., Dickey, T. D., Weber, J. C., Johnson, R. J., and Knap, A. H. (2003). Transient physical forcing of pulsed export of bioreactive material to the deep sargasso sea. Deep Sea Res. Part I Oceanog. Res. Papers 50, 1157–1187. doi: 10.1016/s0967-0637(03)00141-9
Cotner, J. B. Jr., and Wetzel, R. G. (1992). Uptake of dissolved inorganic and organic bphosphorus compounds by phytoplankton and bacterioplankton. Limnol. Oceanog. 37, 232–243. doi: 10.4319/lo.1992.37.2.0232
Edler, L., and Elbrächter, M. (2010). The utermöhl method for quantitative phytoplankton analysis. Microscopic Mol. Methods Quant. Phytoplankton Analysis 110, 13–20.
Eppley, R. W., Reid, F. M. H., and Strickland, J. D. H. (1970). “Estimates of phytoplankton crop size, growth rate and primary production off La Jolla, CA in the period April through September 1967,” in Bulletin of the Scripps Institution of Oceanography, ed J. D. H. Strickland, 17, 33–42.
Hamm, C. E., Merkel, R., Springer, O., Jurkojc, P., Maier, C., Prechtel, K., et al. (2003). Architecture and material properties of diatom shells provide effective mechanical protection. Nature 421:841. doi: 10.1038/nature01416
Harrison, P. J., Conway, H. L., and Dugdale, R. C. (1976). Marine diatoms grown in chemostats under silicate or ammonium limitation. I. cellular chemical composition and steady-state growth kinetics of Skeletonema costatum. Mari. Biol. 35, 177–186. doi: 10.1007/bf00390939
Jiao, N., Yang, Y., Hong, N., Ma, Y., Harada, S., Koshikawa, H., et al. (2005). Dynamics of autotrophic picoplankton and heterotrophic bacteria in the east china sea. Continental Shelf Res. 25, 1265–1279. doi: 10.1016/j.csr.2005.01.002
Kienel, U., Kirillin, G., Brademann, B., Plessen, B., Lampe, R., and Brauer, A. (2017). Effects of spring warming and mixing duration on diatom deposition in deep Tiefer See, NE Germany. J. Paleolimnol. 57, 37–49. doi: 10.1007/s10933-016-9925-z
Krause, J. W., Brzezinski, M. A., Baines, S. B., Collier, J. L., Twining, B. S., and Ohnemus, D. C. (2017). Picoplankton contribution to biogenic silica stocks and production rates in the sargasso sea. Global Biogeochem. Cycles 31, 762–774.
Krause, J. W., Brzezinski, M. A., Landry, M. R., Baines, S. B., Nelson, D. M., Selph, K. E., et al. (2010). The effects of biogenic silica detritus, zooplankton grazing, and diatom size structure on silicon cycling in the euphotic zone of the eastern equatorial Pacific. Limnol. Oceanog. 55, 2608–2622. doi: 10.4319/lo.2010.55.6.2608
Krause, J. W., Brzezinski, M. A., Villareal, T. A., and Wilson, C. (2013). Biogenic silica cycling during summer phytoplankton blooms in the north pacific subtropical gyre. Deep Sea Res. Part I Oceanog. Res. Papers 71, 49–60. doi: 10.1016/j.dsr.2012.09.002
Krause, J. W., Lomas, M. W., and Nelson, D. M. (2009). Biogenic silica at the bermuda atlantic time-series study site in the sargasso sea: temporal changes and their inferred controls based on a 15-year record. Global Biogeochem. Cycles 23:GB3004.
Leblanc, K., Arístegui, J., Armand, L., Assmy, P., Beker, B., Bode, A., et al. (2012). A global diatom database–abundance, biovolume and biomass in the world ocean. Earth Syst. Sci. Data 4, 149–165. doi: 10.5194/essd-4-149-2012
Leblanc, K., Cornet, V., Rimmelin-Maury, P., Grosso, O., Helias-Nunige, S., Brunet, C., et al. (2018). Silicon cycle in the tropical South Pacific: contribution to the global Si cycle and evidence for an active pico-sized siliceous plankton. Biogeosciences 15, 5595–5620. doi: 10.5194/bg-15-5595-2018
Leynaert, A., Tréguer, P., Lancelot, C., and Rodier, M. (2001). Silicon limitation of biogenic silica production in the Equatorial Pacific. Deep Sea Res. Part I Oceanog. Res. Papers 48, 639–660. doi: 10.1016/s0967-0637(00)00044-3
Liu, H., Chen, M., Zhu, F., and Harrison, P. J. (2016). Effect of diatom silica content on copepod grazing, growth and reproduction. Front. Mari. Sci. 3:89.
Lomas, M. W., and Moran, S. B. (2011). Evidence for aggregation and export of cyanobacteria and nano-eukaryotes from the Sargasso Sea euphotic zone. Biogeosciences 8, 203–216. doi: 10.5194/bg-8-203-2011
Mann, D. G. (1999). The species concept in diatoms. Phycologia 38, 437–495. doi: 10.2216/i0031-8884-38-6-437.1
Milligan, A. J., and Morel, F. M. (2002). A proton buffering role for silica in diatoms. Science 297, 1848–1850. doi: 10.1126/science.1074958
Natori, Y., Haneda, A., and Suzuki, Y. (2006). Vertical and seasonal differences in biogenic silica dissolution in natural seawater in Suruga Bay, Japan: effects of temperature and organic matter. Mari. Chem. 102, 230–241. doi: 10.1016/j.marchem.2006.04.007
Nelson, D. M., and Brzezinski, M. A. (1997). Diatom growth and productivity in an oligo-trophic midocean gyre: a 3-yr record from the Sargasso Sea near Bermuda. Limnol. Oceanog. 42, 473–486. doi: 10.4319/lo.1997.42.3.0473
Ohnemus, D. C., Rauschenberg, S., Krause, J. W., Brzezinski, M. A., Collier, J. L., Geraci-Yee, S., et al. (2016). Silicon content of individual cells of Synechococcus from the North Atlantic Ocean. Mari. Chem. 187, 16–24. doi: 10.1016/j.marchem.2016.10.003
Paasche, E. (1973). Silicon and the ecology of marine plankton diatoms. II. Silicate-uptake kinetics in five diatom species. Mari. Biol. 19, 262–269. doi: 10.1007/bf02097147
Padfield, D., Lowe, C., Buckling, A., Ffrench-Constant, R., Student Research Team, Jennings, S., et al. (2017). Metabolic compensation constrains the temperature dependence of gross primary production. Ecol. Lett. 20, 1250–1260. doi: 10.1111/ele.12820
Ragueneau, O., and Tréguer, P. (1994). Determination of biogenic silica in coastal waters: applicability and limits of the alkaline digestion method. Mari. Chem. 45, 43–51. doi: 10.1016/0304-4203(94)90090-6
Richardson, T. L., and Jackson, G. A. (2007). Small phytoplankton and carbon export from the surface ocean. Science 315, 838–840. doi: 10.1126/science.1133471
Sarthou, G., Timmermans, K. R., Blain, S., and Tréguer, P. (2005). Growth physiology and fate of diatoms in the ocean: a review. J. Sea Res. 53, 25–42. doi: 10.1016/j.seares.2004.01.007
Sun, J., and Liu, D. (2003). Geometric models for calculating cell biovolume and surface area for phytoplankton. J. Plankton Res. 25, 1331–1346. doi: 10.1093/plankt/fbg096
Takeda, S. (1998). Influence of iron availability on nutrient consumption ratio of diatoms in oceanic waters. Nature 393, 774–777. doi: 10.1038/31674
Tang, T., Kisslinger, K., and Lee, C. (2014). Silicate deposition during decomposition of cyanobacteria may promote export of picophytoplankton to the deep ocean. Nat. Commun. 5:4143.
Wei, Y., Huang, D., Zhang, G., Zhao, Y., and Sun, J. (2020). Biogeographic variations of picophytoplankton in three contrasting seas: the Bay of Bengal, South China Sea and Western Pacific Ocean. Aquatic Microbial Ecol. 84, 91–103. doi: 10.3354/ame01928
Wei, Y., Liu, H., Zhang, X., Xue, B., Munir, S., and Sun, J. (2017). Physicochemical conditions in affecting the distribution of spring phytoplankton community. Chin. J. Oceanol. Limnol. 35, 1342–1361. doi: 10.1007/s00343-017-6190-6
Wei, Y., Sun, J., Chen, Z., Zhang, Z., Zhang, G., and Liu, X. (2021). Significant contribution of picoplankton size fraction to biogenic silica standing stocks in the Western Pacific Ocean. Prog. Oceanog. 192:102516. doi: 10.1016/j.pocean.2021.102516
Wei, Y., Zhang, G., Chen, J., Wang, J., Ding, C., Zhang, X., et al. (2019). Dynamic responses of picophytoplankton to physicochemical variation in the eastern Indian Ocean. Ecol. Evolu. 9, 5003–5017. doi: 10.1002/ece3.5107
Welschmeyer, N. A. (1994). Fluorometric analysis of chlorophyll a in the presence of chlorophyll b and pheopigments. Limnol. Oceanog. 39, 1985–1992. doi: 10.4319/lo.1994.39.8.1985
Wu, K., Dai, M., Chen, J., Meng, F., Li, X., Liu, Z., et al. (2015). Dissolved organic carbon in the South China Sea and its exchange with the Western Pacific Ocean. Deep Sea Res. Part II Top. Stud. Oceanog. 122, 41–51. doi: 10.1016/j.dsr2.2015.06.013
Keywords: picophytoplankton, diatom, biogenic silica, carbon biomass, western North Pacific
Citation: Wei Y, Zhang Z, Cui Z and Sun J (2021) Size-Fractionated Biogenic Silica Standing Stocks and Carbon Biomass in the Western Tropical North Pacific: Evidence for the Ecological Importance of Pico-Sized Plankton in Oligotrophic Gyres. Front. Mar. Sci. 8:691367. doi: 10.3389/fmars.2021.691367
Received: 06 April 2021; Accepted: 13 July 2021;
Published: 02 August 2021.
Edited by:
James Cotner, University of Minnesota Twin Cities, United StatesReviewed by:
Yoshiko Kondo, Nagasaki University, JapanAnne Willem Omta, Massachusetts Institute of Technology, United States
Copyright © 2021 Wei, Zhang, Cui and Sun. This is an open-access article distributed under the terms of the Creative Commons Attribution License (CC BY). The use, distribution or reproduction in other forums is permitted, provided the original author(s) and the copyright owner(s) are credited and that the original publication in this journal is cited, in accordance with accepted academic practice. No use, distribution or reproduction is permitted which does not comply with these terms.
*Correspondence: Jun Sun, cGh5dG9wbGFua3RvbkAxNjMuY29t
 Yuqiu Wei
 Zhaoyi Zhang2
 Jun Sun