 Gonzalo Bravo1*
 Nicolas Moity2
 Edgardo Londoño-Cruz3
 Frank Muller-Karger4
 Gregorio Bigatti1,5
 Eduardo Klein6
 Francis Choi7
 Lark Parmalee7
 Brian Helmuth7
 Enrique Montes4*
- 1Instituto de Biología de Organismos Marinos, IBIOMAR-CONICET, Puerto Madryn, Argentina
- 2Charles Darwin Research Station, Charles Darwin Foundation, Puerto Ayora, Ecuador
- 3Departamento de Biología, Universidad del Valle, Cali, Colombia
- 4College of Marine Science, University of South Florida St. Petersburg, St. Petersburg, FL, United States
- 5Centro de Investigaciones, Universidad Espíritu Santo, Samborondón, Ecuador
- 6Departamento de Estudios Ambientales, Universidad Simón Bolívar, Caracas, Venezuela
- 7Coastal Sustainability Institute, Northeastern University, Boston, MA, United States
Standardized methods for effectively and rapidly monitoring changes in the biodiversity of marine ecosystems are critical to assess status and trends in ways that are comparable between locations and over time. In intertidal and subtidal habitats, estimates of fractional cover and abundance of organisms are typically obtained with traditional quadrat-based methods, and collection of photoquadrat imagery is a standard practice. However, visual analysis of quadrats, either in the field or from photographs, can be very time-consuming. Cutting-edge machine learning tools are now being used to annotate species records from photoquadrat imagery automatically, significantly reducing processing time of image collections. However, it is not always clear whether information is lost, and if so to what degree, using automated approaches. In this study, we compared results from visual quadrats versus automated photoquadrat assessments of macroalgae and sessile organisms on rocky shores across the American continent, from Patagonia (Argentina), Galapagos Islands (Ecuador), Gorgona Island (Colombian Pacific), and the northeast coast of the United States (Gulf of Maine) using the automated software CoralNet. Photoquadrat imagery was collected at the same time as visual surveys following a protocol implemented across the Americas by the Marine Biodiversity Observation Network (MBON) Pole to Pole of the Americas program. Our results show that photoquadrat machine learning annotations can estimate percent cover levels of intertidal benthic cover categories and functional groups (algae, bare substrate, and invertebrate cover) nearly identical to those from visual quadrat analysis. We found no statistical differences of cover estimations of dominant groups in photoquadrat images annotated by humans and those processed in CoralNet (binomial generalized linear mixed model or GLMM). Differences between these analyses were not significant, resulting in a Bray-Curtis average distance of 0.13 (sd 0.11) for the full label set, and 0.12 (sd 0.14) for functional groups. This is the first time that CoralNet automated annotation software has been used to monitor “Invertebrate Abundance and Distribution” and “Macroalgal Canopy Cover and Composition” Essential Ocean Variables (EOVs) in intertidal habitats. We recommend its use for rapid, continuous surveys over expanded geographical scales and monitoring of intertidal areas globally.
Introduction
Sustained monitoring of the coastal zone is fundamental for the assessment, management, and conservation of living resources over scales ranging from local to global (Miloslavich et al., 2018; Canonico et al., 2019). There still exist major observational gaps across the world. Many protocols available for sampling of marine biota may not be easily implemented, and are time consuming and expensive, limiting their deployment (Titley et al., 2017; Muller-Karger et al., 2018). This has led to a pervasive absence of biodiversity surveys in much of the global coastal zones and ocean, and especially in the global south where resources can be especially limited (Barber et al., 2014).
Machine learning for automated analysis of photoquadrat images can accelerate the flow of information from monitoring programs to decision makers. This facilitates early detection of changes in biological communities and rapid responses to mitigate habitat degradation (González-Rivero et al., 2020). Over the past two decades, the availability of tools that extract taxonomic information from digital imagery of benthic communities has grown. Automated image annotations have already been used successfully in machine learning applications for rapid assessments of the health of coastal and marine habitats, such as in coral reefs (Marcos et al., 2005; Stokes and Deane, 2009; Shihavuddin et al., 2013; Beijbom et al., 2015; González-Rivero et al., 2016; Griffin et al., 2017; Williams et al., 2019; Raphael et al., 2020). Point annotations are typically performed using manual annotation software like pointCount99 (Porter et al., 2002), Coral Point Count with Excel Extensions (Kohler and Gill, 2006), photoQuad (Trygonis and Sini, 2012), or Biigle (Langenkämper et al., 2017). These facilitate the annotation process through graphical user interfaces and tools for the export of occurrence observations in various digital formats. The CoralNet software1 is one of these tools, which also serves as a collaborative research platform that allows multiple users to interact and analyze large common data sets simultaneously.
The use of images to identify benthic organisms and compare analyses between different locations requires standardized annotation, labels, and metadata. Categories for benthic substrates and biota have been proposed by the Collaborative and Automated Tools for Analysis of Marine Imagery (CATAMI; Althaus et al., 2015). The CATAMI categories include several of the biological and ecological Essential Ocean Variables (EOVs; Miloslavich et al., 2018), and thus provide opportunities for conducting standardized global assessment of benthic ecosystems using common indicators with relevance to societal needs. EOVs are being implemented by the Global Ocean Observing System (GOOS; Intergovernmental Oceanographic Commission of UNESCO), who define EOVs as “…those sustained measurements that are necessary to assess the state and change of marine ecosystems, address scientific and societal questions and needs, and positively impact society by providing data that will help mitigate pressures on ecosystems at local, regional and global scales.”
In this study, we specifically use machine learning to quantify the “Invertebrate Abundance and Distribution” and “Macroalgal Canopy Cover and Composition” EOVs in the rocky intertidal zones of four countries in the Americas participating in the Marine Biodiversity Observation Network Pole to Pole of the Americas (MBON Pole to Pole; Canonico et al., 2019). We evaluate the accuracy of the automated analysis done with the CoralNet software to quantify benthic cover of CATAMI categories. This leads to several recommendations for the implementation of image-based biodiversity surveys of macro-algal and sessile macro-invertebrate coastal communities.
Materials and Methods
Intertidal rocky shore localities in Argentina, Galapagos Islands, Colombia, and the northeastern United States (Gulf of Maine) were surveyed during 2018 and 2019. This was part of a large-scale MBON Pole to Pole collaboration. Five localities were sampled across these four countries (Table 1). At each locality, three sites separated by 1–10 km from each other were selected for sampling (Figure 1). At all sites, the rocky intertidal zone was divided into three strata (low, mid, and high tide level), based on the presence of indicator species in each stratum and tidal height. Due to logistical challenges at the United States sites, particularly of working in areas with very large tidal ranges, only two strata were sampled at these sites. At each level, ten 0.5 m × 0.5 m quadrats with a regular 100-point grid (except United States where quadrats were 0.25 m × 0.25 m) were laid at random locations over the substrate in a stretch of rocky shore that goes along the water for a distance of at least 50 m (ideally 100 m). The taxonomic identity and substrate below each grid intersection were registered in situ. These observations were used to quantify the fractional coverage of sessile fauna, macro-algae, and bare substrate. In this study we call these observations visual quadrats (VQ). A detailed field protocol is available on the Ocean Best Practices System2.
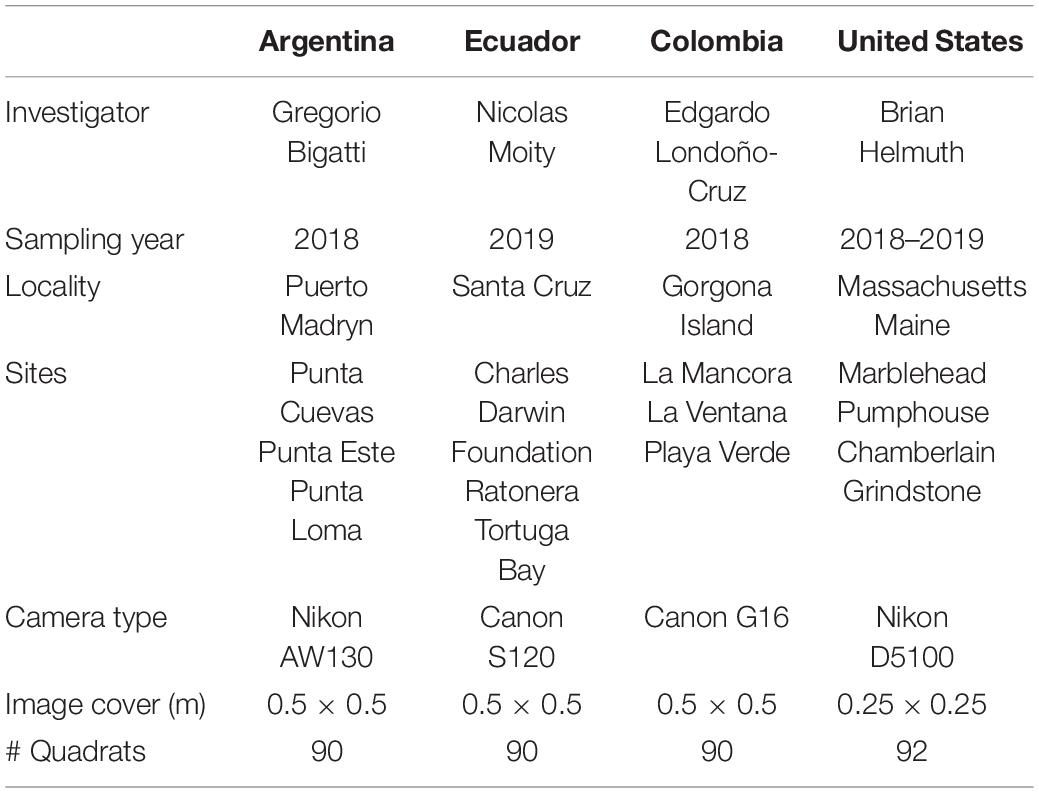
Table 1. Summary of sampling sites.
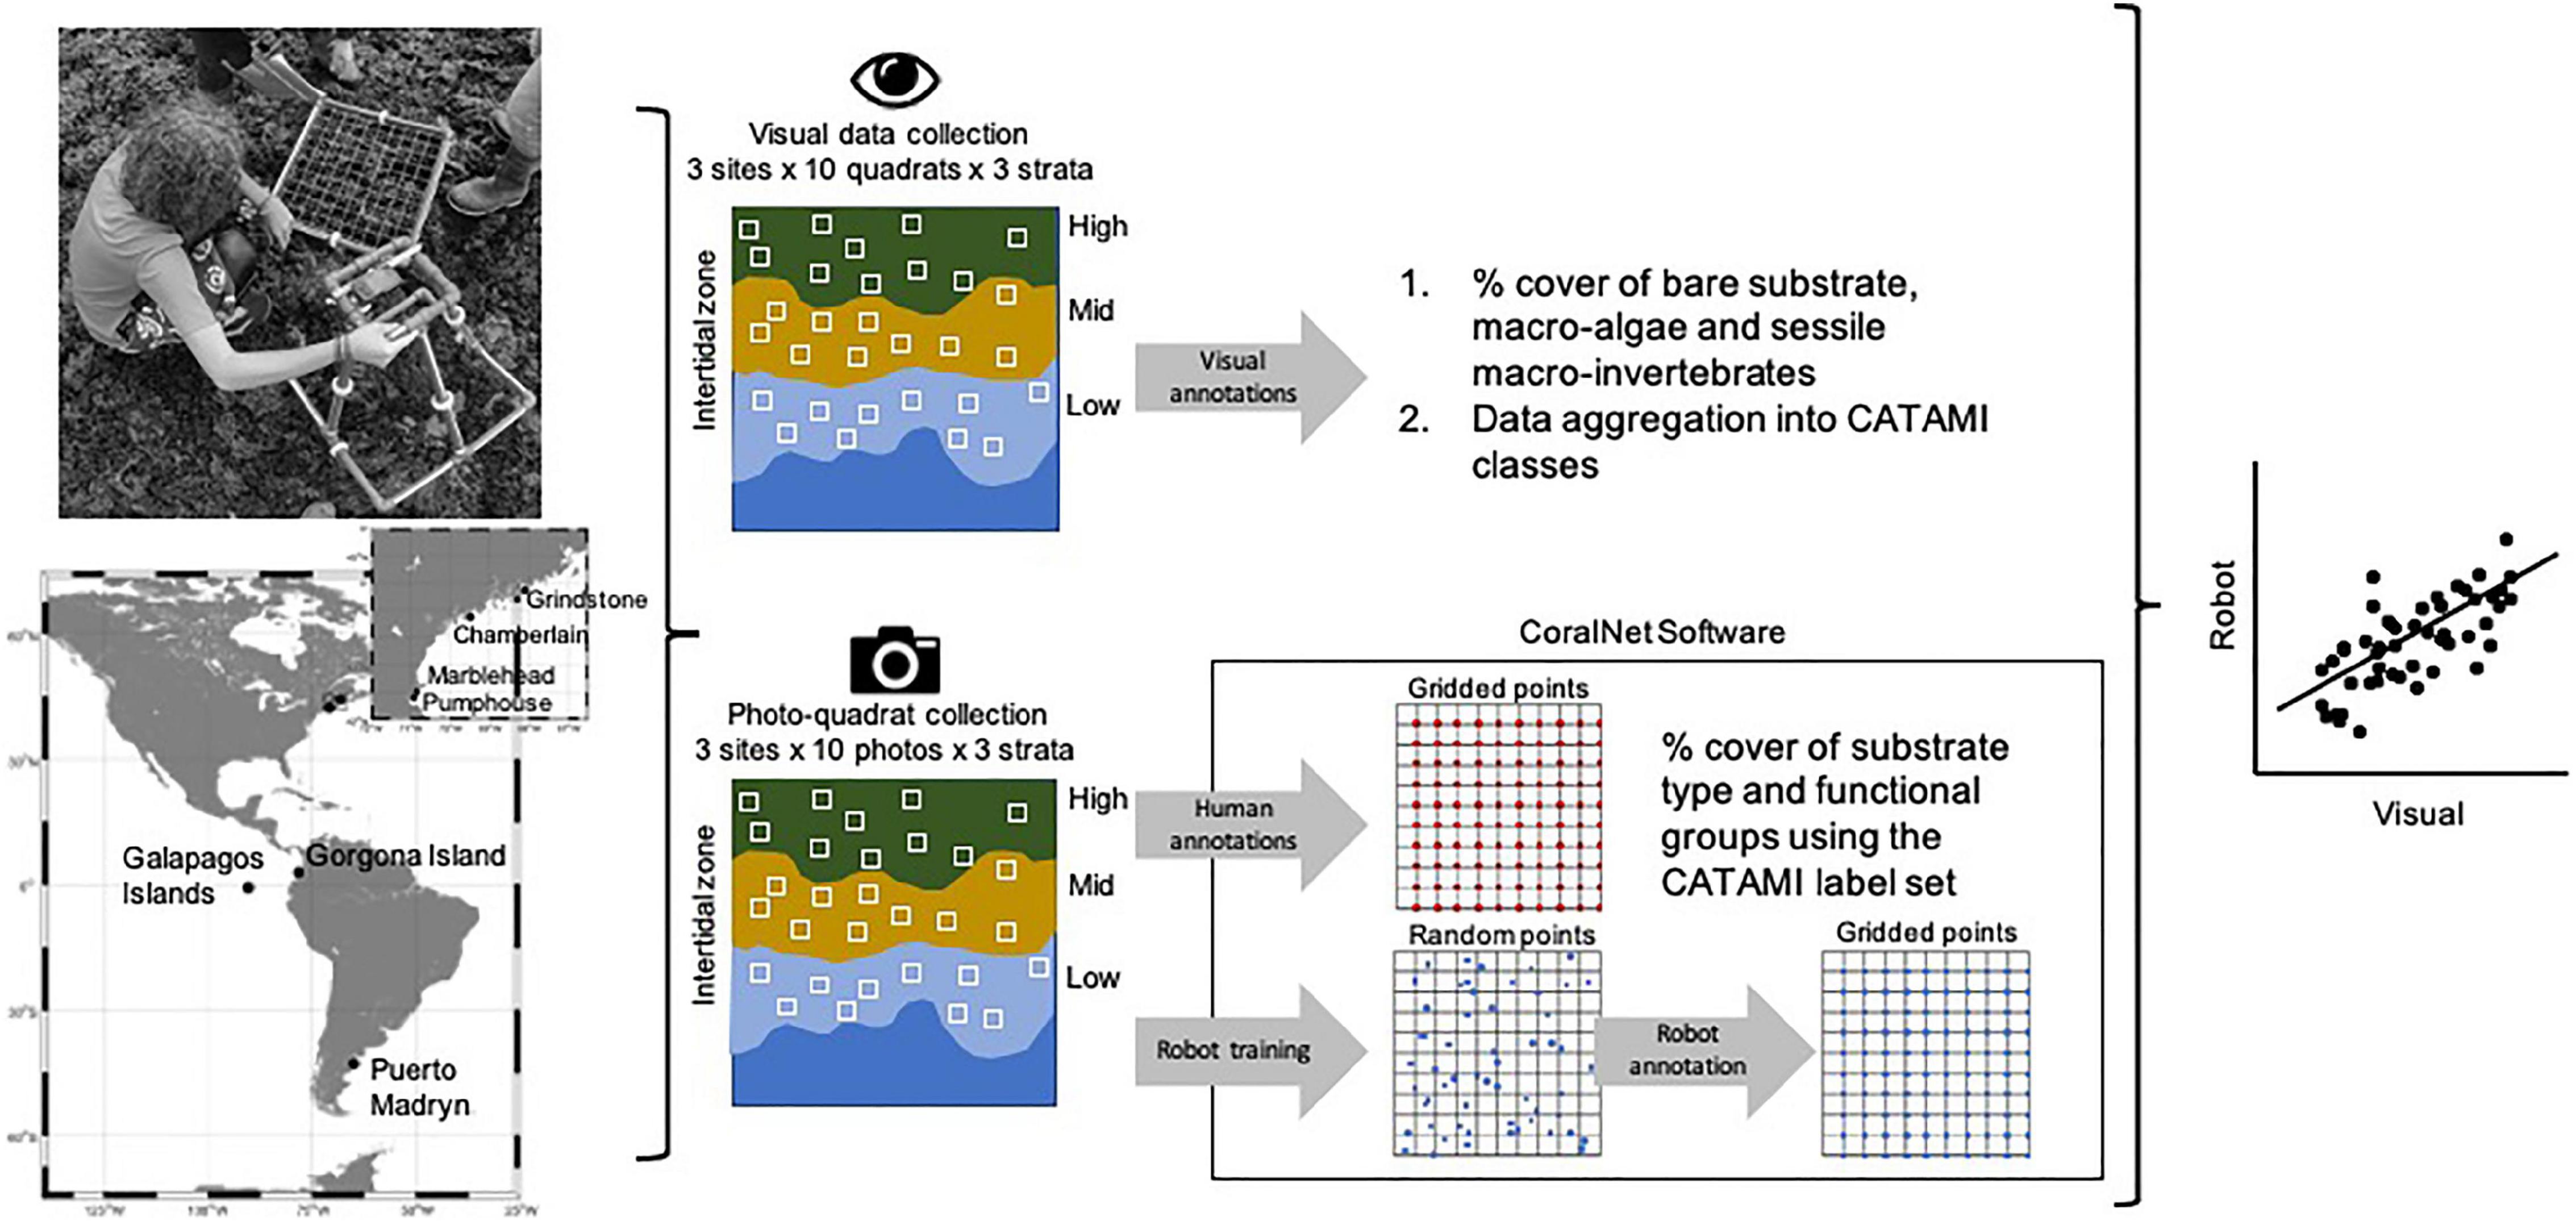
Figure 1. Study workflow showing the location of sampling localities, in situ collection of visual observations, photoquadrat imagery from each locality, and data processing and analysis. The inset map represents the area highlighted with the rectangle containing the four sampled sites in the United States (Marblehead, Pumphouse, Chamberlain, and Grindstone). Visual annotations collected on the field (above the map) were used to estimate percent cover of all taxa to the lowest possible taxonomic level and subsequently aggregated into CATAMI categories. Note that photoquadrats were collected in the same place than visual quadrats. CoralNet software was employed to estimate percent cover of CATAMI categories from direct human annotations and automatically by machine learning after training the algorithm with 100 points randomly distributed over 362 photoquadrats. Outputs from visual and photoquadrat (human and automated) annotations were then compared and statistically analyzed.
Photos of the same quadrats (photoquadrats – PQ) were taken with a digital compact camera fixed to a rigid structure to ensure a focal distance of 60 cm with respect to the substrate (Figure 1). At each site, ten photoquadrats were collected per tidal level for a cumulative total of 362 photoquadrats across all sampled sites. All images were uploaded to CoralNet and are publicly available on the CoralNet website at MBON_AR_CO_EC_US_Human3. A 100-point regular grid was digitally overlaid on each PQ and the identity of the item at each intersection was annotated by the observer (PQ.human). The percent cover for each photoquadrat was determined and the average percent cover was computed per country and tidal level for each category. The same sets of images were manually annotated by an observer, focusing on an independent set of 100 points randomly distributed on each image grid. This was done to train CoralNet automated annotator using EfficientNet-b0 (Tan and Le, 2019) as a feature extractor, and Multi-Layer Perceptron for a classifier. Randomly annotated photoquadrats by human observation, and automated annotation were stored in a different public source in CoralNet4. Photoquadrats were uploaded as an independent set of images to this CoralNet source for fully automated points-annotations (PQ.robot). We aimed to extract three types of percentage cover estimations from each quadrat (VQ, PQ.human, and PQ.robot), with the exception of the United States sites where VQ were not performed in the exact same area as PQ.
Statistical Analyses
We used the confusion matrix provided by CoralNet to evaluate the performance of the classifier. The accuracy metric is calculated by training the robot with 7/8 of the provided annotations (n = 31,853) and using the remaining data points as a test set (n = 4,347). Detailed accuracy for each of the benthic categories was also calculated using the R package “Caret” (Kuhn, 2009).
With the trained classifier, the percent cover estimates for each benthic category were compared between robot and human annotations, and robot versus visual annotations using a generalized (binomial) linear mixed model (GLMM) to detect effects of annotation methods (i.e., human vs. robot). As field percent cover estimates do not record the exact coordinate where the organism occurs below each intersect point in the gridded quadrat, it was not possible to match point annotations produced by the robot. Thus, we compared sets of taxa annotations derived from human observations with those from the automated annotations by the robot [i.e., PQ.robot vs. VQ, and PQ.robot vs. PQ.human] using Bray-Curtis (BC) distance with a generalized (binomial) nested model. BC distances were computed from paired community matrices derived from each of the methods for each of the quadrats. This metric is typically used to quantify differences in community composition between samples (beta diversity), and is adequate to these type of data (counts). Therefore, the analysis will determine the effect of the factors “stratum” and “country” on BC distances and allow to calculate how different estimates of community composition (in terms of percentage of similarity) are between methods. As photoquadrats in the United States were not taken at the exact location as those analyzed visually in the field, data from this country were not included in the comparison with visual observations.
To avoid performance problems of automated annotations due to a low set of training points, we used categories that accumulate up to 95% of all the points present in the quadrats (SC, MAF, MOB, MAEN, and MAA) (see Supplementary Table 1).
All statistical analyses and plots were performed in R (R Core Team, 2020); the GLMM was modeled with lme4 R package version 1.1-23 (Bates et al., 2015).
Study Locations
Patagonia, Argentina
Biodiversity data were collected at three Atlantic Patagonia sites: Punta Cuevas in the city of Puerto Madryn, Punta Este, and the Marine Protected Area Punta Loma (Figure 1). The three sites are located in Golfo Nuevo at ∼42.5°S, 65°W. Sea surface temperature ranges from 8 to 18°C at all sites. The Patagonian rocky intertidal zone is often exposed to extreme physical conditions, with air temperature variations of up to ∼40°C during the year, maximum wind speeds of ∼90 km/h, semidiurnal tides (Rechimont et al., 2013), high solar radiation, and exposure to prolonged desiccation.
Biological zonation at the low tide level of this rocky intertidal site is characterized by macro-algae assemblages of Corallina officinalis, Ulva sp., Ceramium sp., the invasive Undaria pinnatifida, and mobile invertebrates (Miloslavich et al., 2011). The mid tide level is typically dominated by mussel beds composed of two small species Brachidontes rodriguezii and Brachidontes (Perumytilus) purpuratus, and its predator Trophon geversianus. The high tide level is represented by large areas of bare substrate and partial cover of Ulva prolifera, Balanus glandula, encrusting algae of the Ralfsia genus, and the presence of the pulmonate false limpet Siphonaria lessonii.
Gorgona, Colombia
The Gorgona National Natural Park, which is part of the Tropical Eastern Pacific Marine Corridor, is a protected area located about 30 km off the Colombian Pacific coast (Figure 1). This island, along with Gorgonilla, is the largest insular territory on the Pacific coast of Colombia (Giraldo, 2012; Cardona-Gutiérrez and Londoño-Cruz, 2020). Tides range 4–5 m and the horizontal extent of the intertidal zone can range from a few centimeters to hundreds of meters depending on the slope of the coastal zone. The sea surface temperature varies between 26 and 29°C, although it can occasionally descend below 19°C during upwelling events at the beginning of the year (Diaz et al., 2001; Zapata, 2001).
Three sites were sampled: La Ventana, Playa Verde, and La Camaronera. The slope at sampled sites is gentle, hence, the intertidal is approximately 100–150 m wide during low tide. The high intertidal zone normally has a steeper slope producing a narrow band. This band is typically devoid of organisms likely due to high temperatures of rocks during daytime. Most inhabitants are mobile or well-adapted to these conditions, like littorinids and Nerita scabricosta. The mid-intertidal is wider, and the lichen Verrucaria sp. is common along with calcareous coralline algae such as Lithophyllum sp. and the green algae Cladophoropsis adhaerens. Snails like Vasula melones, Nerita funiculata, Parvanachis pygmaea, and the bivalve Isognomon janus are common. Chitons like Ischnochiton dispar and Chiton stokesii are relatively common in this zone. The low intertidal is similar in algal composition to the mid-intertidal but with higher coverage. Here, the red algae Ceramium sp. is common. In addition to the mollusks mentioned above, Fissurella virescens normally occupies this zone. Different species of ophiuroids are also present in this stratum.
Galápagos, Ecuador
We repeatedly sampled three sites in the south of Santa Cruz island, in the central part of the Galapagos archipelago near 0.74°S (Figure 1). The sites are Ratonera, the Charles Darwin Foundation (both located within Academy Bay in Puerto Ayora), and Tortuga Bay (located 5 km to the southwest). This area is seasonally influenced by the North Equatorial Counter Current the South Equatorial Current, and the Humboldt Current (Edgar et al., 2004; Palacios, 2004). Sea surface temperature in the study sites ranges from an average low of ∼22°C in the cold season to ∼25°C in the warm season; mean air temperature range from ∼21 to ∼27°C in the cold and warm season, respectively, with high solar radiation conditions all year round due to the proximity to the Equator. The rocky intertidal shores of Santa Cruz are characterized by a black, basaltic substratum of volcanic origin (Geist, 1996; Vinueza et al., 2014). The tides are semidiurnal, spanning 1.8–2.4 m (Wellington, 1975). Low tide level cover is characterized by the presence of Ulva spp. and Zoanthus spp. This is the only stratum where the slate pencil sea urchin Eucidaris galapagensis can be found. The mid-tide stratum has the highest abundance of the endemic thatched-roof barnacle (Tetraclita milleporosa) and the mobile invertebrate Thais sp. The high tide layer is almost entirely composed of bare black lava rock sparsely covered with biofilm (algae-bacterial mat), with macro algae only occurring in crevices and between boulders that retain humidity and are protected from direct sunlight exposure. Mobile invertebrates here are characterized by Plicopurpura sp. The intertidal shores are home to the only marine iguana in the world (Amblyrhynchus cristatus) and the abundant sally lightfoot crabs (Grapsus grapsus), which are important consumers of the macro-algae present in these habitats (Vinueza et al., 2006).
United States
The rocky intertidal zone in the northeast of the United States, specifically the Gulf of Maine (GOM), covers a vast area of the coast. Sea surface temperature in the GOM ranges from an average low of ∼5°C in winter to ∼18°C in summer, although recent years have seen considerably warmer temperatures in both winter (7°C) and summer (20°C). The region is among the fastest warming on the planet, with an increasing number of marine heat waves (Pershing et al., 2015). Tidal amplitude can be as large as 16 m in parts of the Bay of Fundy in the northern Gulf of Maine (Fautin et al., 2010); however, at the sites sampled the tidal range was between 4 and 5 m (Figure 1). Two localities in the GOM were used, the north shore of Massachusetts (MA) and the mid coast of Maine (ME) (Figure 1). Two sites at each locality were used, namely Pumphouse (Nahant) and Marblehead in MA; and Chamberlain and Grindstone in ME. We defined the “high zone” for this study as that corresponding to the upper half of the band defined by the presence of the sessile invertebrates Mytilus edulis and Semibalanus balanoides. The “mid zone” was defined as the lower half of the Mytilus- dominated zone. Moving lower in the intertidal, sessile invertebrates are gradually replaced by macroalgae, specifically Ascophyllum nodosum, and Fucus spp. Mobile invertebrates, such as Littorina littorea, Littorina obtusata, and Nucella lapillus, are usually associated with these macroalgal habitats.
Collaborative and Automated Tools for Analysis of Marine Imagery Label-Set
PQ.human and VQ were annotated using categories developed under CATAMI. The consensus label-set (Table 2) was defined by the same experts that performed VQ annotations.
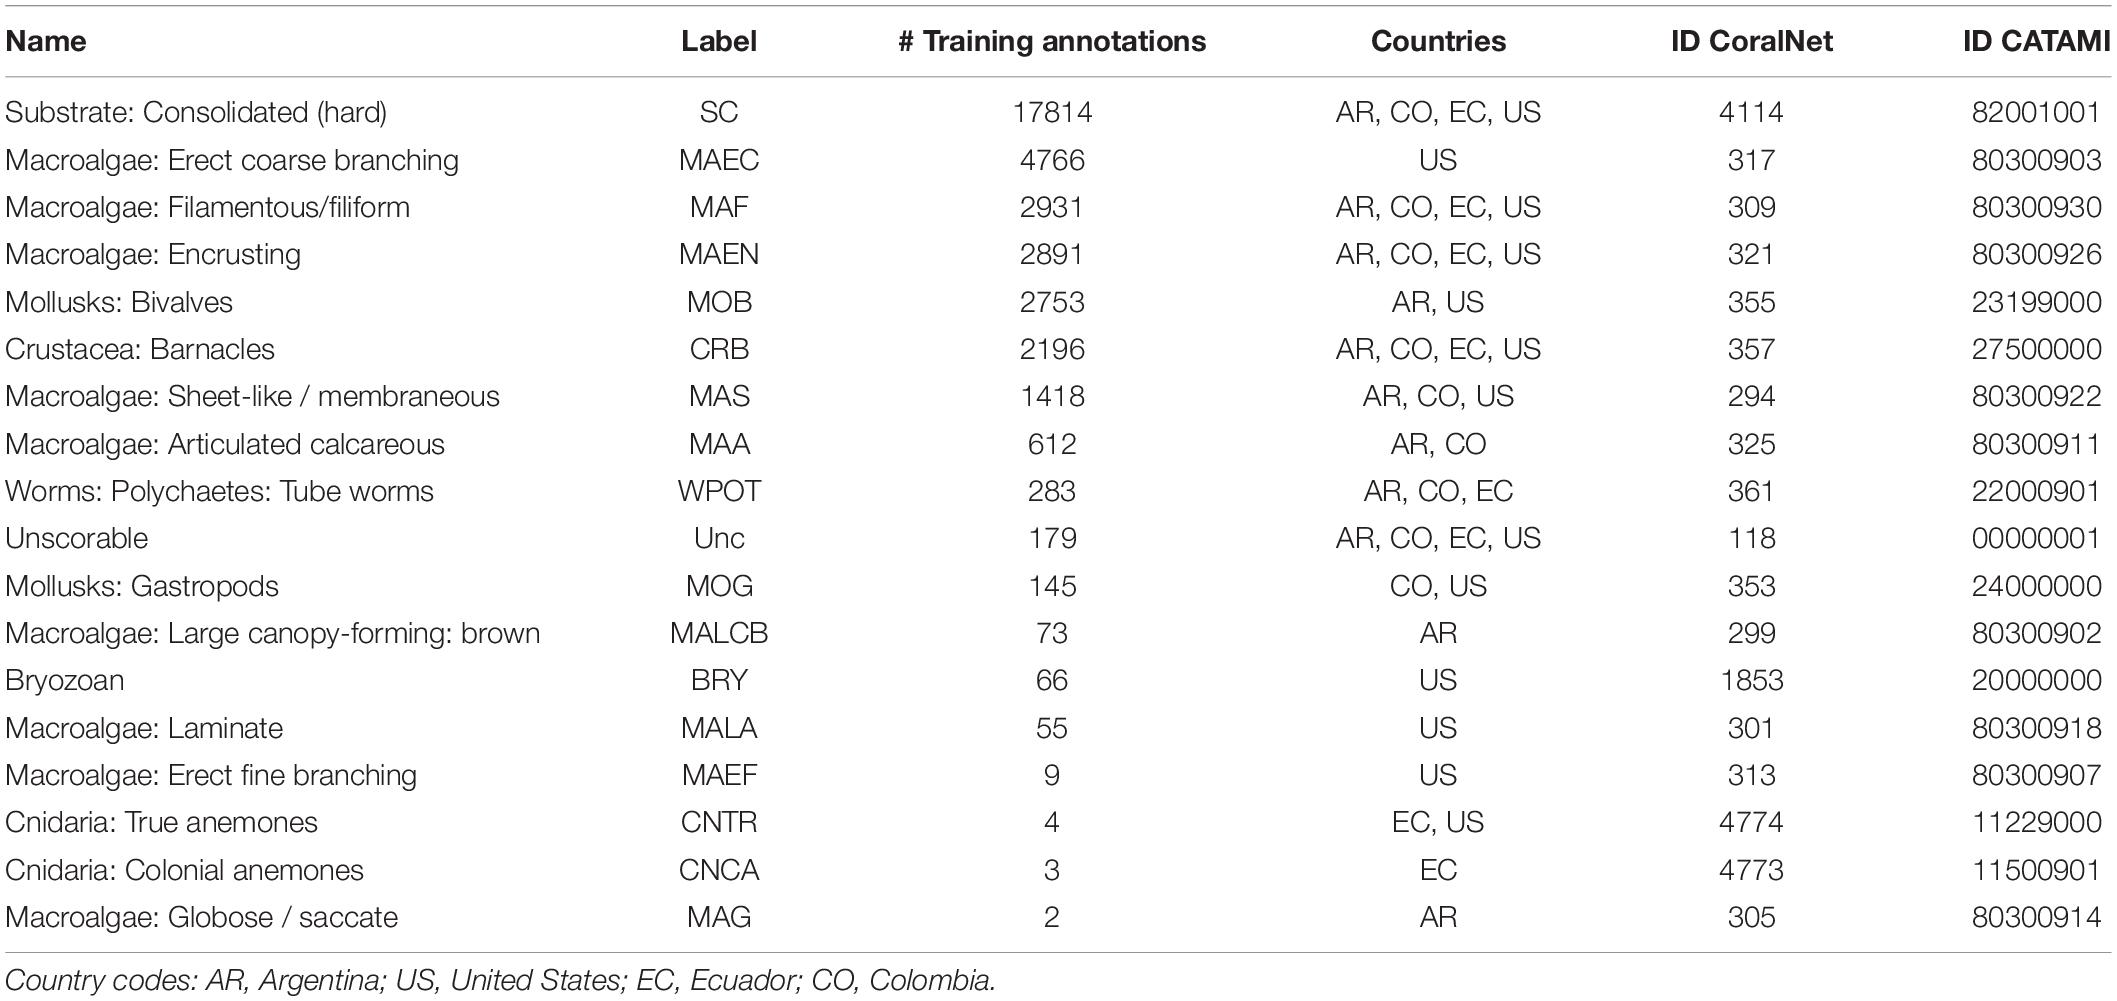
Table 2. Collaborative and Automated Tools for Analysis of Marine Imagery (CATAMI) classification scheme used in this study.
Results
A total of 18 CATAMI categories were included (Table 2), four of which were common to all the countries (barnacles, encrusting algae, filamentous algae, and hard substrate). Of these, eight categories found are presented in Figure 2. Rocky intertidal sites in Argentina presented more variability of CATAMI groups, with a marked dominance of the consolidated substrate class in the high tide zone, bivalves in the mid tide zone, and algae in the low tide zone. In Colombia and Ecuador, all tidal strata (low-, mid-, and high) presented low cover of algae and invertebrates, resulting in high cover of consolidated substrate. For the United States sites (Maine and Massachusetts) the erect coarse branching macroalgae covered most of the substrate, followed by barnacles (CRB).
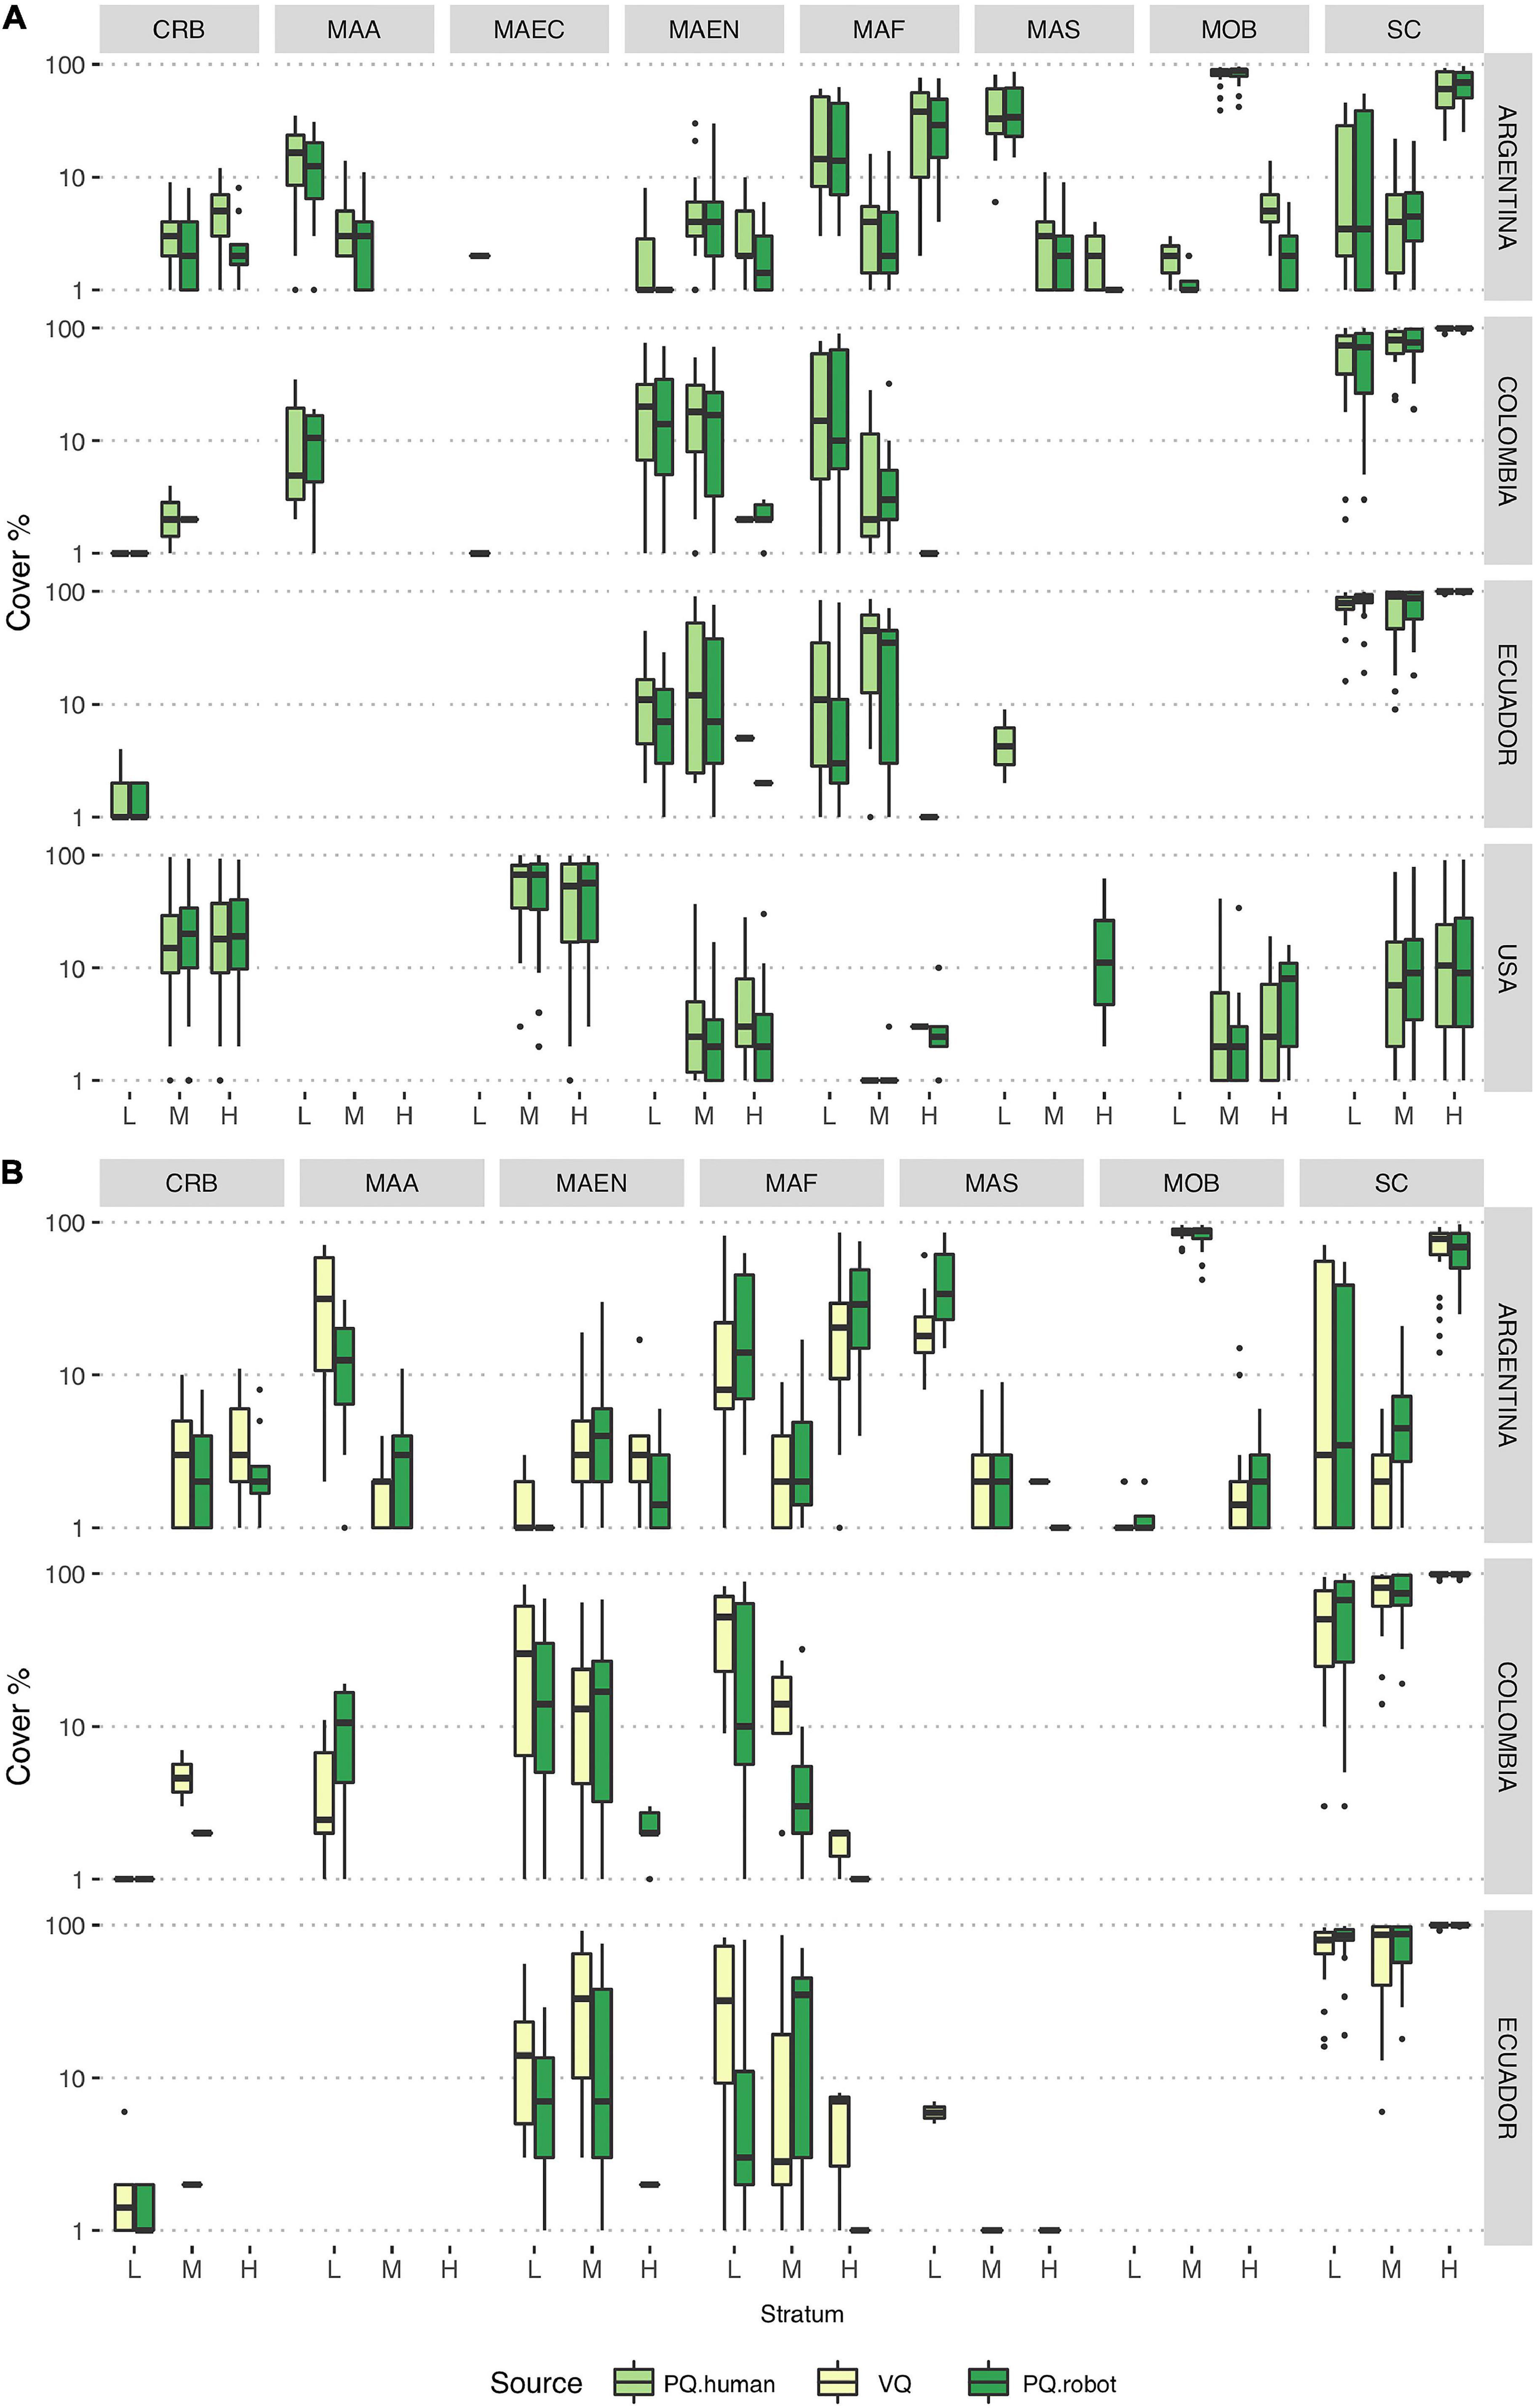
Figure 2. Boxplots showing percentage cover estimates of most abundant CATAMI categories [CRB, Crustacea: Barnacles; MOB, Mollusks: Bivalves; SC, Substrate: Consolidated (hard); MAF, Macroalgae: Filamentous/filiform; MAEN, Macroalgae: Encrusting; MAA, Macroalgae: Articulated calcareous; MAS, Macroalgae: Sheet-like/membranous; MAEC, Macroalgae: Erect coarse branching] in each country and tidal strata as determined by different annotation methods. The horizontal bar within boxes represents the median, the lower and upper boxes represent the 25th and 75th percentiles, respectively, and the whiskers the 5th and 95th percentiles. Black dots represent outliers above the 95th percentile. (A) PQ.human vs. PQ.robot, (B) VQ vs. PQ.robot. L, low tide level; M, mid tide level; H, high tide level.
Training of the automatic classifier resulted in an average accuracy of 87% (Supplementary Table 2 and Supplementary Figure 1). As expected, the classifier performed better with CATAMI labels that were well represented in the training set (SC, MAEC, MOB, MAF, CRB, MAS, MAA, accuracy between ∼90 and 98%). The accuracy of the classification of rare or less frequent labels was lower (e.g., MOG, WPOT, accuracy between ∼78%). For example, the Encrusting Macroalgae category (MAEN) presented a high number of training annotations (Table 2), but had a low detection rate resulting in a low accuracy (∼78%, Supplementary Table 2). Mollusk bivalves (MOB) had a similar training number to MAEN, but this category was clearly distinguished by humans in the photos and therefore resulted in a higher detection rate than the robot (accuracy ∼98%, Supplementary Table 2). The total accuracy of the classifier improved to ∼89% after classifying groups that aggregate CATAMI labels into broader categories that we refer to as “functional” groups, specifically “hard substrate,” “algae,” “invertebrates,” and “other” (Supplementary Table 3).
Comparisons between the CATAMI labels percent cover estimates from robot and human annotations resulted in non-significant differences in a fully nested GLMM model (Supplementary Table 4), using both the quadrats and sites as random factors. However, high variability was observed in less frequent groups of organisms in both robot and human estimates (Figures 2A,B).
Comparisons of percent cover estimates between PQ.human and PQ.robot revealed that the CoralNet algorithm reliably quantifies relative abundances of the most representative CATAMI categories (Figure 2). In some cases, the PQ.robot indicated presence of MAEC or MAF categories in countries or tidal levels where they were not present. In Argentina, for example, MALCB was misidentified as MAEC in four of the resulting classifications. Disparities between VQ records and PQ.robot annotations were more evident in areas with low percent cover values (Figure 2). Encrusting macroalgae (MAEN) was generally underestimated by the automated annotation in Ecuador and Colombia. Furthermore, percent cover of articulated calcareous macroalgae (MAA) was underestimated by the robot in Argentina whereas it was overestimated in Colombia. The opposite was observed with filamentous macroalgae (MAF), with overestimated percent cover values in Argentina and underestimated ones in Colombia and Ecuador.
Average percent cover of broad classes including algae, invertebrates, and substrate in each tidal level and country were computed by aggregating percent cover values of corresponding CATAMI categories (Figures 3A,B and Supplementary Table 5). Using these broad groups, PQ.human and automated PQ.robot percent cover also presented almost equal estimations, with the exception of algae cover in the high tide level in Colombia and Ecuador because of the misclassifications of the automated annotations. Comparison of VQ versus PQ.robot for the functional groups (hard substrate, algae, invertebrates, and other) showed similar results to PQ.human versus PQ.robot. However, percent cover of invertebrates detected by the robot in Ecuador was slightly lower than that estimated by VQ. Also, a slightly lower cover was estimated by the robot with algae cover in the high tide level of Ecuador and invertebrates in the low tide level of Colombia than that estimated by VQ.
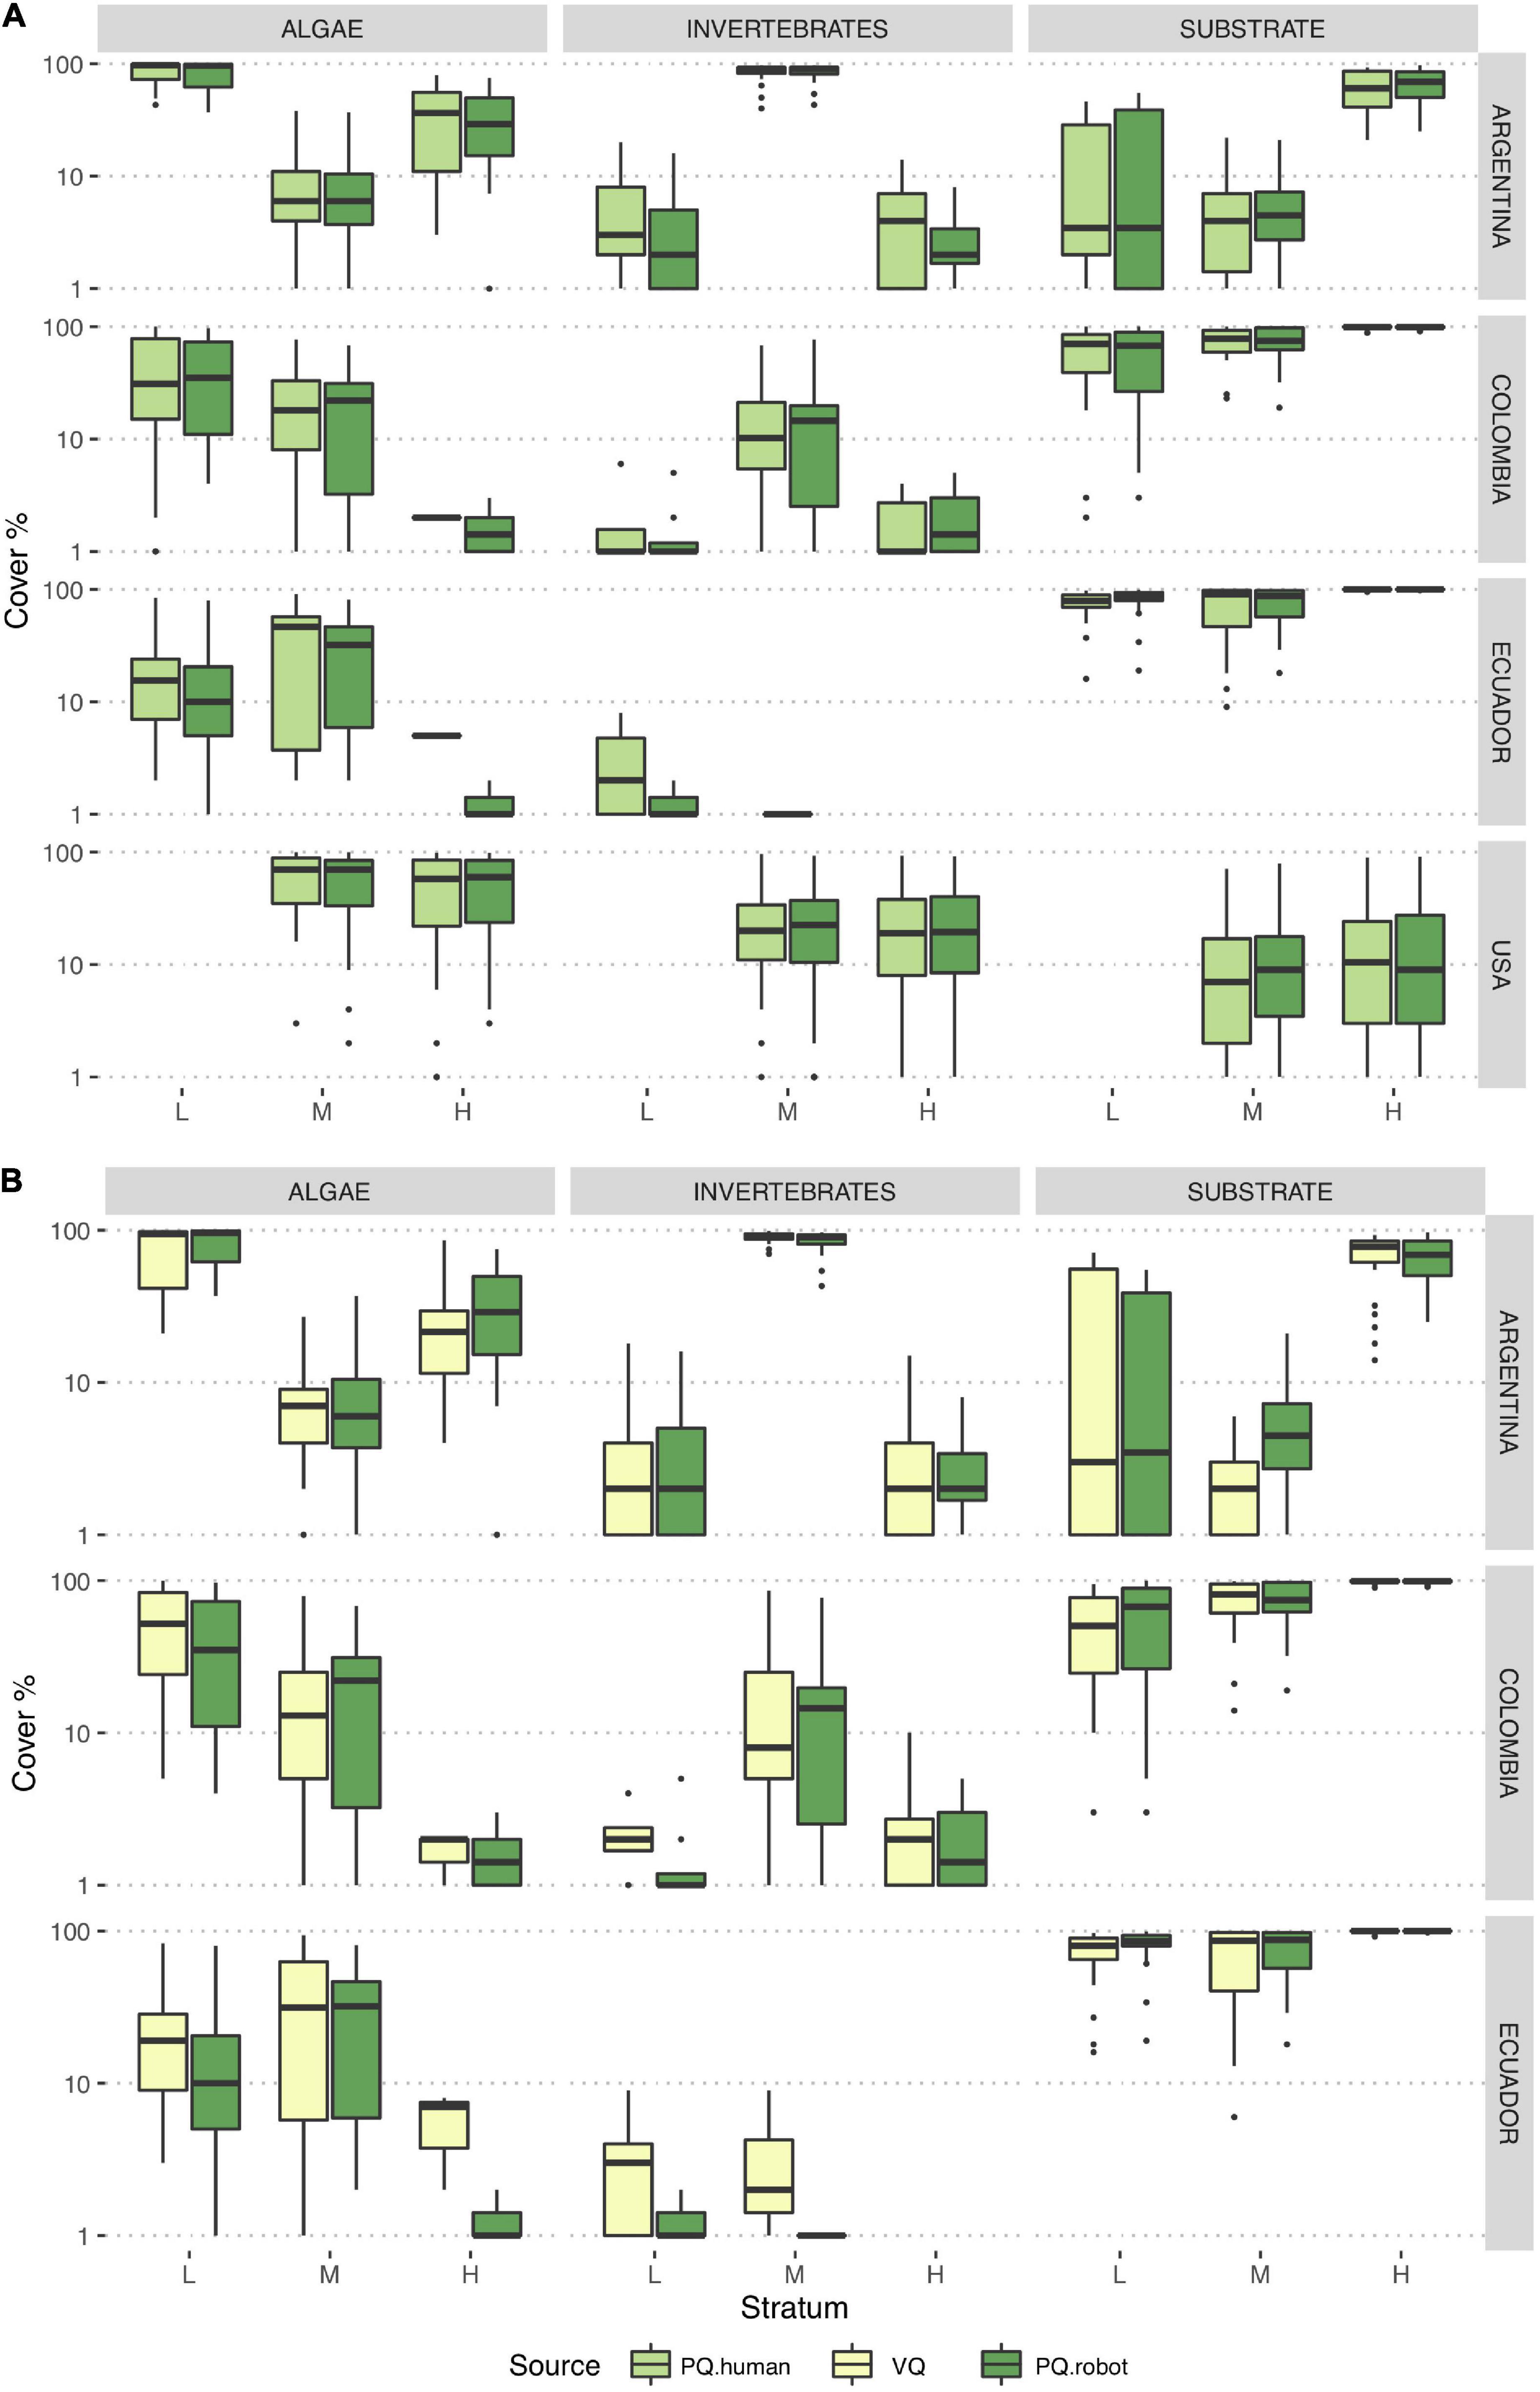
Figure 3. Boxplots showing percentage cover by tidal level in each country for algae, substrate, and invertebrates. The horizontal bar within boxes represents the median, the lower and upper boxes represent the 25th and 75th percentiles, and the whiskers the 5th and 95th percentiles. Black dots represent outliers values above the 95th percentile. (A) PQ.human vs. PQ.robot, (B) VQ vs. PQ.robot. L, low tide level; M, mid tide level; H, high tide level.
To compare the performance of the classifier at community level, we computed the Bray-Curtis (BC) distance between the percent cover of the dominant CATAMI categories and results from the CoralNet classifier (PQ.robot) and PQ annotated by human (PQ.human). We also computed BC distance between functional groups estimated using field annotations (VQ) and the PQ.robot and PQ.human. A BC value close to zero denotes no significant differences between the communities estimated by the two methods.
Functional groups were identified with more accuracy by the CoralNet classifier, thus yielding lower BC distances compared to those based on CATAMI categories (Figures 4A,B versus C,D). High tide strata in Colombia and Ecuador exhibited the lowest BC distances for both CATAMI and functional groups. In general, the largest BC distances were observed at the low tide level at all locations. However, no statistically significant differences were detected when tested with a GLMM nested model (Supplementary Tables 6, 7).
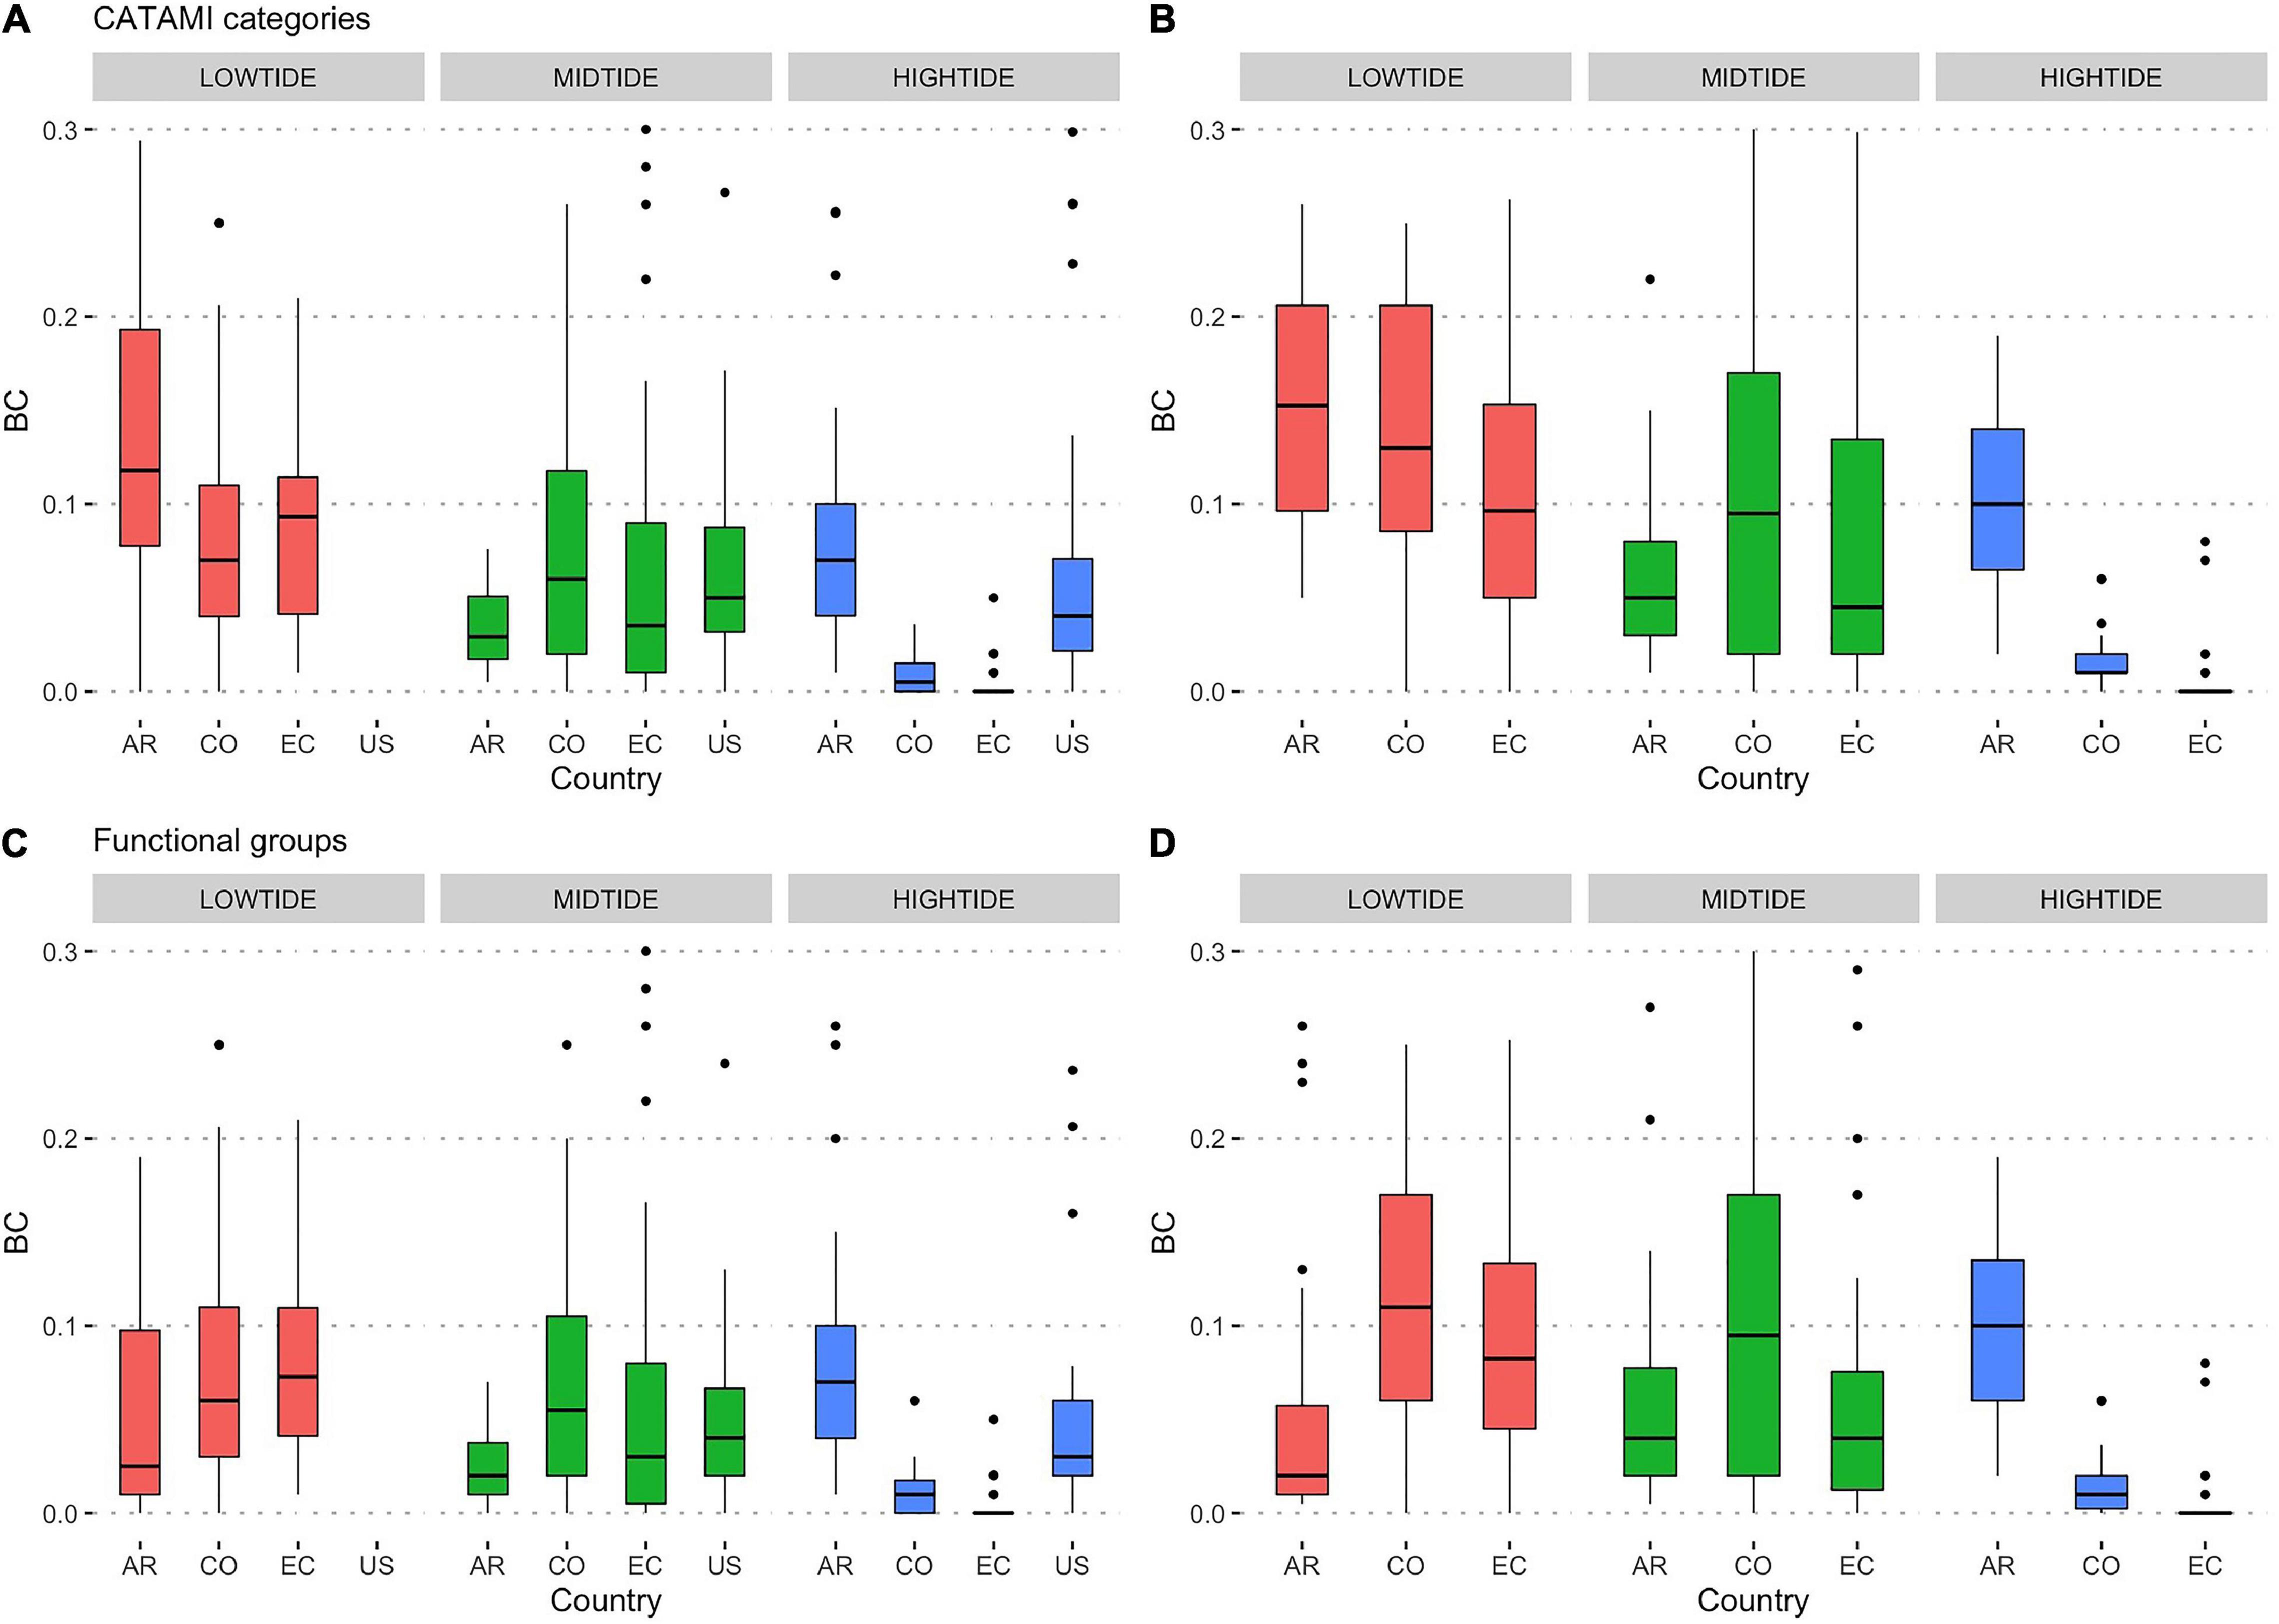
Figure 4. Boxplot of Bray-Curtis distances between the two methods (A,C) PQ.human vs. PQ.robot and (B,D) VQ vs. PQ.robot. (A,B) CATAMI categories, (C,D) functional groups. AR, Argentina, CO, Colombia; EC, Ecuador; US, United States. The horizontal bar inside bars represents the median, the lower and upper boxes represent the 25th and 75th percentiles, and the whiskers the 5th and 95th percentiles. Black dots represent outliers values above the 95th percentile.
Discussion
Standardized field methods and machine learning allowed to assess changes in Essential Ocean Variables of percent cover of intertidal rocky shore and benthic biodiversity in different locations of the Americas. Intertidal zones, like coral reefs, are potential bellwethers for the ongoing impacts of global climate change (Helmuth et al., 2006). Intertidal invertebrates and algae are exposed to extreme weather and climate variability with large fluctuations in temperature, salinity, and water availability (Madeira et al., 2012). Mass mortality events have been reported from intertidal sites across the globe (e.g., Harley, 2008; Mendez et al., 2021), and the incidence of marine heat waves is increasing (Hobday et al., 2016). It is not clear yet what the potential consequences of these mortality events are for patterns of species distribution, biodiversity, and ecosystem services (Román et al., 2020; Vye et al., 2020).
Using imagery from diverse rocky intertidal habitats we demonstrate that the CoralNet machine learning system can estimate nearly identical fractional abundances of functional groups (i.e., aggregates of CATAMI categories) as those derived from manual photoquadrat annotation. In most cases, results based on automated annotations were comparable to those obtained from in situ visual observations. This approach opens avenues for collecting biodiversity data to monitor rapid changes in marine coastal environments to inform management. Documenting changes in biodiversity using time series has proven incredibly valuable, but such efforts have occurred in only a few locations (e.g., Vye et al., 2020). Long-term records from the global south are rare. The use of artificial intelligence to facilitate analysis of photos, which can be accomplished rapidly by a few people and with relatively few resources, can play a valuable role in the creation of much-needed monitoring networks. They play an important role in locations where access to sites is limited, dangerous, or otherwise restricted. For example, in the Gulf of Maine, visual surveys were not conducted in the lowest part of the intertidal zone because of the extreme tidal range, which can cause very rapid rates of tidal return; coupled with large waves, this makes sampling in this zone for extensive time periods very difficult. The adoption of standardized methods, such as those used here, facilitates collaborative efforts that span wide geographic ranges.
The accuracy of automatic annotation of intertidal image collections depends on many factors. This includes imaging conditions (e.g., light level, angle of view, camera quality, and resolution), the number of training annotations and the variability of taxa sampled. Photos used in this study had similar lighting, camera quality, resolution, angle of view, and focal distances. This provided homogeneity among image sets. Nonetheless, we observed that shadows can affect portions of the photos and rendered them not suitable for automated classifications. We observed poor robot classification capacity in dark shadows or in overexposed areas of the photographs, as well as in areas with water, bubbles, and wind that moves these around. These areas, present in some photoquadrats, lowered the accuracy of the automated results. To provide a more uniform light to the area to be photographed, the target can be illuminated with lights or strobes. Also, shading the area where imagery will be captured with a sun cover over the frame (e.g., using an umbrella) to provide uniform illumination is another option to increase image quality.
By using 100 points per photoquadrat we trained the robot with more than 36,000 annotations. Nonetheless, we often had less than the 1,000 minimum training annotations recommended by CoralNet developers5. A solution to avoid misinterpretation is to use a semi-automated mode (known as “alleviate” mode) that uses classification scores to decide when to register automated annotations and when to leave annotations to be manually registered by humans. For example, Beijbom et al. (2015) showed that by using a level of alleviate of 50%, the quality of the percent cover estimation was not notably affected. In this study, the alleviate mode was not tested. Based on the machine confidence of our data, a 50% threshold would require a manual annotation of only ∼2% of the points (i.e., 724 points).
In situ visual surveys are often more effective than photoquadrats for species-level taxonomic identification and especially for counting rare species and mobile fauna that may be hidden in crevices and under the algal cover. However, we found instances when using photographs was advantageous. For example, we observed that differences between visual quadrat versus photoquadrat-based annotations of sessile (or semi-sessile, such as gastropods) species were likely due to parallax error in visual quadrat observations. The 100-point intersection grid in the visual quadrat is usually placed in the middle of the frame leaving some space between the intersections and the substrate. If the observer is not looking exactly above the quadrat (i.e., ∼0° zenith angle), incorrect annotations may be attributed to parallax (Hill and Wilkinson, 2004; Leujak and Ormond, 2007). Nevertheless, errors due to parallax are difficult to quantify and beyond the scope of this study. We tried to minimize its effect by always looking at the quadrat directly from above.
In addition, we noted that observers often identified rare species when they were located near, but not necessarily exactly on, a grid intersection. This resulted in the recording of rare species as the minimum cover percentage, which might better describe the richness of the site while introducing errors due to differences among observers when comparing sites. Such errors are not reproduced with photoquadrat methods, which use digitally gridded intersections that do not yield parallax errors and minimize the overestimation of rare species that do not fall exactly on the digital grid.
In this study, while the same observer performed visual annotations and photoquadrats analyses, there was a time gap between observations. Therefore, some differences can be expected in the classification of the same quadrat. One of the key benefits of CoralNet automated annotations is that the analysis is consistent across all the images and parallax, and inter-annotation errors will not interfere in the analysis performance (Beijbom et al., 2015). In this sense, typical human errors associated with manual annotations and data entry are minimized by this method, helping to standardize the protocol used. This methodology could be used in regional monitoring programs involving a great amount of samples in different sampling sites/countries.
In Colombia and Ecuador, it was difficult to discriminate among encrusting algae and hard substrate by direct human annotations. This impacted the robot classification performance for the MAEN category. In the field, investigators were able to touch the rock in order to detect the encrusting algae and this resulted in a higher cover estimation on the VQ. In such cases, where a category is difficult to detect in photoquadrats, we expected to find low accuracy in the automated classifier. Manual annotations can diminish this bias, but such errors are a problem for the machine learning tool.
CoralNet is a collaborative platform that can be adopted more widely to help large-scale, collaborative networks and communities of practice such as the MBON Pole to Pole to enhance the spatial coverage and sampling frequency of their biodiversity monitoring programs. This can augment the quality and interoperability of annotations by using a common label-set amongst multiple observers, while training the robot or new users that may use previous annotations for verification. We showed that 36,000 manual point annotations were enough to properly train the most dominant benthic cover categories over four distinctive locations along the American continent. However, combining several countries on the same CoralNet source may lead to confusion among similar categories from different locations. The creation of separate training sets for each country or even for each site should be investigated to avoid confusion among similar categories from different sites. The protocol used in our work gives the capacity to rapidly process a large set of new photos to obtain robust percent cover estimated within hours. Such estimates can then be used to detect rapid changes in biological and ecosystem EOVs resulting, for example, from massive mortality events, macroalgae blooms or the loss of benthic coverage. The protocol performed in our work helps advance ecological studies and can be applied for the detection of rapid changes in benthic coverage which could serve as an early warning of the impacts of contamination events or global climate change.
Conclusion
Image-based biodiversity surveys using automated annotations from CoralNet software were sufficiently robust to characterize the relative abundance of benthic cover categories and functional groups, specifically for “Invertebrate Abundance and Distribution” and “Macroalgal Canopy Cover and Composition” EOVs in rocky intertidal habitat in four countries of the Americas with very different environmental regimes and spanning more than 80° of latitude. We found no statistical differences in percent cover estimates of the dominant functional groups annotated visually by observers and automatically by CoralNet using photoquadrats. Differences between visual quadrats annotated in the field and automated annotations by CoralNet on photoquadrats based on the analysis of community matrices were not significant, resulting in a Bray-Curtis average distance of 0.13 (sd 0.11) for the full label set and 0.12 (sd 0.14) for functional groups set. Our results indicate that automated image-based annotations are a practical source of information for biodiversity monitoring in intertidal benthic habitats to detect rapid changes over large geographic domains, and can optimize sampling effort in the field to expand the area of monitoring sites and sampling frequency minimizing human errors while increasing field safety.
Data Availability Statement
The original contributions presented in the study are included in the article/Supplementary Material, further inquiries can be directed to the corresponding author/s.
Author Contributions
NM, EL-C, GBi, FC, LP, and BH performed field work and visual surveys on intertidal areas. GBi analyzed photoquadrats from Argentina, EL-C from Colombia, NM from Galápagos and FC from United States. GBr and EK coordinated the photoquadrats analysis in CoralNet software and performed statistical analyses. All authors designed the study and wrote the manuscript.
Funding
This project was supported by the NASA award titled “Laying the foundations of the Marine Biodiversity Observation Network Pole to Pole of the Americas” (grant number: 80NSSC18K0318), NASA grants NNX14AP62A and 80NSSC20K0017; NOAA U.S. Integrated Ocean Observing System (IOOS grant NA19NOS0120199); ANPCyT-FONCyT (PICT 2018-0969); United States National Science Foundation OCE-1635989; and the United States National Oceanographic Partnership Program (NOPP).
Conflict of Interest
The authors declare that the research was conducted in the absence of any commercial or financial relationships that could be construed as a potential conflict of interest.
Publisher’s Note
All claims expressed in this article are solely those of the authors and do not necessarily represent those of their affiliated organizations, or those of the publisher, the editors and the reviewers. Any product that may be evaluated in this article, or claim that may be made by its manufacturer, is not guaranteed or endorsed by the publisher.
Acknowledgments
The Charles Darwin Foundation (CDF) author would like to thank the Gordon and Betty Moore Foundation for funding the staff time, and Sofía Green for her help in the field. This study was conducted under the research permit of the Galapagos National Park Directorate No. PC-41-20. The authors from Argentina thank Juan Pablo Livore, María Marta Mendez, and María Eugenia Segade for field work and technical support. EL-C is deeply indebted to Maria Fernanda Cardona-Gutiérrez and Kevin Stiven Mendoza for field assistance and to Gorgona National Natural Park personnel, particularly Ximena Zorrilla and Luis Payán for logistic support. The authors from the United States thank Tim Briggs, Jaxon Derow, Sophia Ly, Sahana Simonetti, and Jessica Torossian for their help in the field. This publication is contribution number 2392 of the Charles Darwin Foundation for the Galápagos Islands and 154 of the Laboratorio de Reproducción y Biología Integrativa de Invertebrados Marinos (LARBIM).
Supplementary Material
The Supplementary Material for this article can be found online at: https://www.frontiersin.org/articles/10.3389/fmars.2021.691313/full#supplementary-material
Footnotes
- ^ https://coralnet.ucsd.edu/
- ^ https://repository.oceanbestpractices.org/handle/11329/1143
- ^ https://coralnet.ucsd.edu/source/2268/
- ^ https://coralnet.ucsd.edu/source/2048/
- ^ https://coralnet.ucsd.edu/blog/a-new-deep-learning-engine-for-coralnet/
References
Althaus, F., Hill, N., Ferrari, R., Edwards, L., Przeslawski, R., Schönberg, C. H. L., et al. (2015). A standardised vocabulary for identifying benthic biota and substrata from underwater imagery: the CATAMI classification scheme. PLoS One 10:e0141039. doi: 10.1371/journal.pone.0141039
Barber, P. H., Ablan-Lagman, M. C. A., Ambariyanto, A., Berlinck, R. G. S., Cahyani, D., Crandall, E. D., et al. (2014). Advancing biodiversity research in developing countries: the need for changing paradigms. Bull. Mar. Sci. 90, 187–210. doi: 10.5343/bms.2012.1108
Bates, D., Mächler, M., Bolker, B. M., and Walker, S. C. (2015). Fitting linear mixed-effects models using lme4. J. Stat. Softw. 67, 1–48. doi: 10.18637/jss.v067.i01
Beijbom, O., Edmunds, P. J., Roelfsema, C., Smith, J., Kline, D. I., Neal, B. P., et al. (2015). Towards Automated Annotation of Benthic Survey Images: variability of Human Experts and Operational Modes of Automation. PLoS One 10:e0130312. doi: 10.1371/journal.pone.0130312
Canonico, G., Buttigieg, P. L., Montes, E., Muller-Karger, F. E., Stepien, C., Wright, D., et al. (2019). Global observational needs and resources for marine biodiversity. Front. Mar. Sci. 6:367. doi: 10.3389/fmars.2019.00367
Cardona-Gutiérrez, M. F., and Londoño-Cruz, E. (2020). Boring worms (Sipuncula and Annelida: Polychaeta): their early impact on Eastern Tropical Pacific coral reefs. Mar. Ecol. Prog. Ser. 641, 101–110. doi: 10.3354/meps13298
Diaz, J., Pinzón, C. J., Perdomo, A., María, L., and López-Victoria, M. (2001). “Gorgona marina: contribución al conocimiento de una isla única,” in Edition: Serie Publicaciones Especiales 7Chapter: Generalidades, eds L. M. Barrios and M. L. ópez-Victoria (Santa Marta, Colombia: INVEMAR), 17–26.
Edgar, G. J., Banks, S., Fariña, J. M., Calvopiña, M., and Martínez, C. (2004). Regional biogeography of shallow reef fish and macro-invertebrate communities in the Galapagos archipelago. J. Biogeogr. 31, 1107–1124. doi: 10.1111/j.1365-2699.2004.01055.x
Fautin, D., Dalton, P., Incze, L. S., Leong, J. A. C., Pautzke, C., Rosenberg, A., et al. (2010). An overview of marine biodiversity in United States waters. PLoS One 5:e11914. doi: 10.1371/journal.pone.0011914
Geist, D. (1996). On the emergence and submergence of the Galapagos Islands. Not. Galapagos 56, 5–9.
Giraldo, A. (2012). “Geomorfología e hidroclimatología de isla Gorgona,” in Gorgona: paraíso de biodiversidad y ciencia, eds A. Giraldo and B. Valencia (Cali: Universidad del Valle), 226.
González-Rivero, M., Beijbom, O., Rodriguez-Ramirez, A., Bryant, D. E. P., Ganase, A., Gonzalez-Marrero, Y., et al. (2020). Monitoring of coral reefs using artificial intelligence: a feasible and cost-effective approach. Remote Sens. 12, 1–22. doi: 10.3390/rs12030489
González-Rivero, M., Beijbom, O., Rodriguez-Ramirez, A., Holtrop, T., González-Marrero, Y., Ganase, A., et al. (2016). Scaling up Ecological Measurements of Coral Reefs Using Semi-Automated Field Image Collection and Analysis. Remote Sens. 8:30. doi: 10.3390/rs8010030
Griffin, K. J., Hedge, L. H., González-Rivero, M., Hoegh-Guldberg, O. I., and Johnston, E. L. (2017). An evaluation of semi-automated methods for collecting ecosystem-level data in temperate marine systems. Ecol. Evol. 7, 4640–4650. doi: 10.1002/ece3.3041
Harley, C. D. G. (2008). Tidal dynamics, topographic orientation, and temperature-mediated mass mortalities on rocky shores. Mar. Ecol. Prog. Ser. 371, 37–46.
Helmuth, B., Mieszkowska, N., Moore, P., and Hawkins, S. J. (2006). Living on the Edge of Two Worlds: forecasting the Responses of Rocky Intertidal Ecosystems to Climate Change. Annu. Rev. Ecol. Syst. 37, 373–404. doi: 10.2307/annurev.ecolsys.37.091305.30000015
Hill, J., and Wilkinson, C. (2004). Methods for ecological monitoring of coral reefs. Townsville: Australian Institute of Marine Science (AIMS).
Hobday, A. J., Alexander, L. V., Perkins, S. E., Smale, D. A., Straub, S. C., Oliver, E. C. J., et al. (2016). A hierarchical approach to defining marine heatwaves. Prog. Oceanogr. 141, 227–238. doi: 10.1016/j.pocean.2015.12.014
Kohler, K. E., and Gill, S. M. (2006). Coral Point Count with Excel extensions (CPCe): a Visual Basic program for the determination of coral and substrate coverage using random point count methodology. Comput. Geosci. 32, 1259–1269. doi: 10.1016/j.cageo.2005.11.009
Kuhn, M. (2009). The caret package. J. Stat. Softw. 28, 1–26,Google Scholar
Langenkämper, D., Zurowietz, M., Schoening, T., and Nattkemper, T. W. (2017). BIIGLE 2.0 - Browsing and Annotating Large Marine Image Collections. Front. Mar. Sci. 4:83. doi: 10.3389/fmars.2017.00083
Leujak, W., and Ormond, R. F. G. (2007). Comparative accuracy and efficiency of six coral community survey methods. J. Exp. Mar. Bio. Ecol. 351, 168–187. doi: 10.1016/j.jembe.2007.06.028
Madeira, D., Narciso, L., Cabral, H. N., and Vinagre, C. (2012). Thermal tolerance and potential impacts of climate change on coastal and estuarine organisms. J. Sea Res. 70, 32–41.
Marcos, M. S. A. C., Soriano, M. N., and Saloma, C. A. (2005). Classification of coral reef images from underwater video using neural networks. Opt. Express 13:8766. doi: 10.1364/opex.13.008766
Mendez, M. M., Livore, J. P., Márquez, F., and Bigatti, G. (2021). Mass Mortality of Foundation Species on Rocky Shores: testing a Methodology for a Continental Monitoring Program. Front. Mar. Sci. 8:620866. doi: 10.3389/fmars.2021.620866
Miloslavich, P., Bax, N. J., Simmons, S. E., Klein, E., Appeltans, W., Aburto-Oropeza, O., et al. (2018). Essential ocean variables for global sustained observations of biodiversity and ecosystem changes. Glob. Chang. Biol. 24, 2416–2433. doi: 10.1111/gcb.14108
Miloslavich, P., Klein, E., Díaz, J. M., Hernández, C. E., Bigatti, G., Campos, L., et al. (2011). Marine biodiversity in the Atlantic and Pacific coasts of South America: knowledge and gaps. PLoS One 6:e14631. doi: 10.1371/journal.pone.0014631
Muller-Karger, F. E., Miloslavich, P., Bax, N. J., Simmons, S., Costello, M. J., Pinto, I. S., et al. (2018). Advancing marine biological observations and data requirements of the complementary Essential Ocean Variables (EOVs) and Essential Biodiversity Variables (EBVs) frameworks. Front. Mar. Sci. 5:211. doi: 10.3389/fmars.2018.00211
Palacios, D. M. (2004). Seasonal patterns of sea-surface temperature and ocean color around the Galápagos: regional and local influences. Deep Res. II Top. Stud. Oceanogr. 51, 43–57. doi: 10.1016/j.dsr2.2003.08.001
Pershing, A. J., Alexander, M. A., Hernandez, C. M., Kerr, L. A., Le Bris, A., Mills, K. E., et al. (2015). Slow adaptation in the face of rapid warming leads to collapse of the Gulf of Maine cod fishery. Science 350, 809–812. doi: 10.1126/science.aac9819
Porter, J. W., Kosmynin, V., Patterson, K. L., Porter, K. G., Jaap, W. C., Wheaton, J. L., et al. (2002). Detection of coral reef change by the Florida Keys coral reef monitoring project. The Everglades, Florida Bay, and Coral Reefs of the Florida Keys: An Ecosystem Sourcebook. 749–769. doi: 10.1201/9781420039412-32
R Core Team (2020). R: A language and environment for statistical computing. Austria: R Foundation for Statistical Computing.
Raphael, A., Dubinsky, Z., Iluz, D., Benichou, J. I. C., and Netanyahu, N. S. (2020). Deep neural network recognition of shallow water corals in the Gulf of Eilat (Aqaba). Sci. Rep. 10:12959. doi: 10.1038/s41598-020-69201-w
Rechimont, M. E., Galván, D. E., Sueiro, M. C., Casas, G., Piriz, M. L., Diez, M. E., et al. (2013). Benthic diversity and assemblage structure of a north Patagonian rocky shore: a monitoring legacy of the NaGISA project. J. Mar. Biol. Assoc. U. K. 93, 2049–2058. doi: 10.1017/S0025315413001069
Román, M., Román, S., Vázquez, E., Troncoso, J., and Olabarria, C. (2020). Heatwaves during low tide are critical for the physiological performance of intertidal macroalgae under global warming scenarios. Sci. Rep. 10:21408.
Shihavuddin, A. S. M., Gracias, N., Garcia, R., Gleason, A. C. R., and Gintert, B. (2013). Image-based coral reef classification and thematic mapping. Remote Sens. 5, 1809–1841. doi: 10.3390/rs5041809
Stokes, M. D., and Deane, G. B. (2009). Automated processing of coral reef benthic images. Limnol. Oceanogr. Methods 7, 157–168. doi: 10.4319/lom.2009.7.157
Tan, M., and Le, Q. V. (2019). “EfficientNet: rethinking model scaling for convolutional neural networks,” in Proceedings of the 36th International Conference on Machine Learning, (Long Beach: ICML), 6105-6114.
Titley, M. A., Snaddon, J. L., and Turner, E. C. (2017). Scientific research on animal biodiversity is systematically biased towards vertebrates and temperate regions. PLoS One 12:e0189577. doi: 10.1371/journal.pone.0189577
Trygonis, V., and Sini, M. (2012). PhotoQuad: a dedicated seabed image processing software, and a comparative error analysis of four photoquadrat methods. J. Exp. Mar. Bio. Ecol. 424–425, 99–108. doi: 10.1016/j.jembe.2012.04.018
Vinueza, L. R., Branch, G. M., Branch, M. L., and Bustamante, R. H. (2006). Top-down herbivory and bottom-up el niño effects on galápagos rocky-shore communities. Ecol. Monogr. 76, 111–131. doi: 10.1890/04-1957
Vinueza, L. R., Menge, B. A., Ruiz, D., and Palacios, D. M. (2014). Oceanographic and climatic variation drive top-down/bottom-up coupling in the Galápagos intertidal meta-ecosystem. Ecol. Monogr. 84, 411–434. doi: 10.1890/13-0169.1
Vye, S. R., Dickens, S., Adams, L., Bohn, K., Chenery, J., Dobson, N., et al. (2020). Patterns of abundance across geographical ranges as a predictor for responses to climate change: evidence from UK rocky shores. Divers. Distrib. 26, 1357–1365.
Wellington, G. M. (1975). Medio Ambientes Marinos Costeros de Galápagos. Quito: Un informe de recursos al Departamento de Parques Nacionales y Vida Silvestre.
Williams, I. D., Couch, C. S., Beijbom, O., Oliver, T. A., Vargas-angel, B., Schumacher, B. D., et al. (2019). Leveraging Automated Image Analysis Tools to Transform Our Capacity to Assess Status and Trends of Coral Reefs. Front. Mar. Sci. 6:222. doi: 10.3389/fmars.2019.00222
Keywords: Americas, biodiversity monitoring, machine learning, marine biodiversity, Essential Ocean Variables (EOVs), photoquadrats, rocky intertidal zone, CoralNet
Citation: Bravo G, Moity N, Londoño-Cruz E, Muller-Karger F, Bigatti G, Klein E, Choi F, Parmalee L, Helmuth B and Montes E (2021) Robots Versus Humans: Automated Annotation Accurately Quantifies Essential Ocean Variables of Rocky Intertidal Functional Groups and Habitat State. Front. Mar. Sci. 8:691313. doi: 10.3389/fmars.2021.691313
Received: 06 April 2021; Accepted: 31 August 2021;
Published: 23 September 2021.
Edited by:
Tim Wilhelm Nattkemper, Bielefeld University, GermanyReviewed by:
Boguslaw Cyganek, AGH University of Science and Technology, PolandFrederico Tapajós De Souza Tâmega, Federal University of Rio Grande, Brazil
Aiko Iwasaki, Tohoku University, Japan
Copyright © 2021 Bravo, Moity, Londoño-Cruz, Muller-Karger, Bigatti, Klein, Choi, Parmalee, Helmuth and Montes. This is an open-access article distributed under the terms of the Creative Commons Attribution License (CC BY). The use, distribution or reproduction in other forums is permitted, provided the original author(s) and the copyright owner(s) are credited and that the original publication in this journal is cited, in accordance with accepted academic practice. No use, distribution or reproduction is permitted which does not comply with these terms.
*Correspondence: Gonzalo Bravo, Z29uemFsb2JyYXZvYXJnZW50aW5hQGdtYWlsLmNvbQ==; Enrique Montes, ZW1vbnRlc2hAdXNmLmVkdQ==