 Esther D. Goldstein1*
 Thomas E. Helser1
 Johanna J. Vollenweider2Ashwin Sreenivasan3Fletcher F. Sewall2
- 1Resource Ecology and Fisheries Management Division, Alaska Fisheries Science Center, National Marine Fisheries Service, National Oceanic and Atmospheric Administration, Seattle, WA, United States
- 2Auke Bay Laboratories, Alaska Fisheries Science Center, National Marine Fisheries Service, National Oceanic and Atmospheric Administration, Juneau, AK, United States
- 3Sitka Sound Science Center, Sitka, AK, United States
Measuring fish population responses to climate change requires timely ecological information, warranting innovative approaches to data collection in fisheries research and management. Fourier transform near-infrared (FT-NIR) spectroscopy is a promising tool to efficiently and cost-effectively obtain multiple types of fisheries data including fish physiological health and energetics that can provide indicators of stock status and environmental change. We tested the applicability of FT-NIR spectroscopy to determine fish physiological state and condition by developing calibration models for morphometric indices of body condition [Fulton’s K and hepatosomatic index (HSI)], biochemical measurements of tissue composition (lipid content and energy density), and a nucleic acid-based index of recent growth (RNA:DNA) of juvenile Pacific cod (Gadus macrocephalus). Calibration models had the best predictive ability for lipid content followed by HSI and energy density, whereas spectral data had weak relationships with Fulton’s K and RNA:DNA. For lipid content, energy density, and HSI, informative spectral regions were primarily associated with carbon-hydrogen bonds in lipid molecules. Additionally, FT-NIR spectroscopy calibration models better predicted lipid content than morphometric measurements that are often used as proxies for measuring energy reserves, indicating that FT-NIR spectroscopy might serve as a more informative index of body condition and energy stores than other rapid methods. Efficient sample analysis by FT-NIR spectroscopy can supplement traditional metrics of body condition and be especially useful for ensuring the availability of monitoring data in support of fisheries research and management.
Introduction
Recent developments in fisheries research and management include the incorporation of ecological information to assess the impacts of environmental and climate change on fish populations and ecosystems. For example, essential fish habitat considerations have expanded to include growth, reproduction, and survival (Simpson et al., 2017), and there are efforts to incorporate fish responses to environmental fluctuations in ecosystem approaches to management (Townsend et al., 2019). Measuring complex ecological process and incorporating them into management presents practical challenges to develop, implement, and maintain fish population and ecosystem monitoring efforts. For instance, fisheries management, and the biological and physiological data informing it, often follow annual cycles. Thus, environmental and biological data must provide informative indices that are available at least annually to be effectively incorporated into decision making (Zador et al., 2017).
Fish energetics and physiological health are impacted by environmental conditions, and can therefore provide useful indicators of ecosystem change as well as insight into survival likelihood and reproductive potential (Marteinsdottir and Begg, 2002). Multiple indices of energetics, health, and condition (henceforth jointly referred to as condition) are utilized in fisheries research and management and present compromises between time investment, required expertise, equipment, and accuracy (Wuenschel et al., 2018) that impact their feasibility and utility for long-term monitoring. Traditional morphometric proxies for body condition such as length-weight relationships (e.g., Fulton’s condition factor or Fulton’s K) and hepatosomatic index (HSI; the ratio of liver weight to body weight) are frequently used for field-based research due to their speed and simplicity, despite potential inaccuracies or weak relationships with biochemical measurements of condition (Wuenschel et al., 2018). Energy density and body proximate composition provide analytical chemistry-based condition indices that are often more informative than rapid methods, but they can be costly, time consuming, and often require the use of hazardous chemicals. Other biochemical metrics such as the ratio of RNA to DNA (RNA:DNA) are appropriate for assessing recent impacts of environmental change or nutritional condition on growth, and may be particularly suitable for young life stages when a large proportion of energy is devoted to growth (Chícharo and Chícharo, 2008). The choice of index depends upon the specific aspects of condition that are measured by each metric, but researchers are often constrained by practicality or resources.
New applications of technologies such as Fourier transform near-infrared (FT-NIR) spectroscopy provide a promising approach to consolidate research tools, and to develop and operationalize informative and timely data collection methods for fisheries researchers and managers. FT-NIR spectroscopy measurements primarily hinge upon the relationship between reference data (ex: index of condition) and the measured spectra of a material. Specifically, by directing electromagnetic radiation (light of wavelengths ∼780–2,500 nm) at a substance, FT-NIR spectroscopy excites molecular vibrations primarily from C-H, O-H, and N-H chemical bonds. Measurements are based on non-fundamental absorption bands from overtones that are resonant frequencies above the fundamental frequency, and combination modes due to interactions between fundamental vibrations (Beć and Huck, 2019). This method can be used to infer the composition of unknown materials using calibration models developed from spectral and reference datasets (Beć and Huck, 2019). Accordingly, calibration models can potentially be developed for the numerous approaches that are used to quantify fish condition, as well as other life-history traits and physiological measurements. FT-NIR spectroscopy has seen limited use in fisheries research (Wedding et al., 2014; Helser et al., 2019) despite similarities between applications in other industries including food science and aquaculture and data needs associated with fish population dynamics such as lipid content (Wold and Isaksson, 1997; Azizian and Kramer, 2005; Liu et al., 2013), ovarian development (Lu et al., 2010), and egg development (Ishigaki et al., 2016). The potential for broad applications, portable instrumentation without the need for hazardous chemicals, and the non-destructive and rapid measurement process could enable diverse data collection in a field or lab setting, permit subsequent analysis with the same material or live specimen, and reduce resource requirements for fisheries monitoring.
To test the feasibility of using FT-NIR spectroscopy to measure indices of fish condition, we developed calibration models relating spectral data with traditionally-measured condition metrics for the juvenile stages of an important fisheries species in Alaskan waters (Gadus macrocephalus: Pacific cod) that recently experienced drastic population declines due to environmental change (Barbeaux et al., 2020). We focused on five metrics that assess differing aspects of condition and that range in required effort and resources for data collection: (1) Fulton’s K, (2) HSI, (3) energy density, (4) lipid content, and (5) RNA:DNA. We then discuss the limitations and merits of FT-NIR spectroscopy for fisheries data collection and suggest additional applications of spectroscopic tools in ecological and fisheries research.
Materials and Methods
Fish Collection and Laboratory Treatments
Juvenile Pacific cod were collected in Frederick Sound, Southeast Alaska, during September 2018 and June 2019 and subsequently reared in a laboratory for a concurrent experiment under varying temperature and food quality regimes to ensure variability in body condition among specimens. Fish were held for a month-long quarantine period at ambient seawater temperature and then reared at 9, 12, and 15°C for 35 days during 2018, and 6, 8, 10, and 12°C for 74 days during 2019. Fish were fed pellets consisting of Pacific herring (Clupea pallasii), squid (unknown species), euphausiids (Euphausia superba and E. pacifica), and multi-vitamins throughout the experimental period. Canola oil was added to high-lipid pellets to create high- and low-lipid rations [2018: 2.4 ± 0.41 and 4.0 ± 0.44 % lipid; 2019: 1.5 ± 0.28 and 6.0 ± 0.64 % lipid ± 1 standard deviation (SD)]. Fish sampled for analyses were fasted for 1 day before euthanizing in a solution of tricaine methanesulfonate (MS-222; 0.025 g/L) to avoid biases in condition indices from ingested food.
In preparation for biochemical analysis, individual whole fish were homogenized in a Bullet Blender. One aliquot was frozen for spectroscopy analysis, and a second (< 7 g) was dried to constant mass at 135 °C in a Thermogravimetric Analyzer (TGA) 701 (Leco, St. Joseph, MI, United States). Quality control samples analyzed with each batch included Meat 1546 (National Institute Standards and Technology: NIST; accuracy of < 4% deviation from a known value), and a replicate aliquot of one sample (precision of ≤ 1.4 g SD). Dried aliquots were then pulverized to a fine homogenized powder using a bead mill (Next Advance, Troy, NY, United States) in preparation for energy density and lipid determination.
Morphometric Indices
Wet mass and total lengths were measured for all fish to derive morphometric indices of condition. For the HSI calculation, livers were dissected, weighed and returned to the body cavity. Fulton’s K (Equation 1) and HSI (Equation 2) were then calculated as follows:
where W is the whole body weight of the fish (g), L is fish total length (mm), and Wliver is the weight (g) of the liver. HSI assumes that higher condition fish have a greater ratio of liver weight to body weight because livers are an important energy store (Copeman et al., 2017). Similarly, Fulton’s K assumes that weight to length ratio is positively correlated with body condition.
Biochemical Indices
Energy density (kJ/g dry mass) was measured by bomb calorimetry. An aliquot of dried fish homogenate was compressed into a pellet for combustion in a Parr 1425 micro-bomb calorimeter (Parr, Moline, IL, United States) to obtain energy content following standard protocols outlined in the instrument manual. Quality control samples included with each analytical run were benzoic acid standards for accuracy (SD < 0.14 kJ/g), a sample replicate (SD < 0.6 kJ/g between replicates), and an in-house reference of walleye pollock (Gadus chalcogrammus) (< 2.5% error from known value).
Lipid content was measured using a modified version of the sulfo-phospho-vanillin (SPV) method (Van Handel, 1985). An aliquot of dried fish homogenate was placed into a glass vial to which 2 mL of a chloroform-methanol solution was added (2:1 v:v). Samples were sonicated in a water bath for 30 min, diluted to 1:10, and then added to a glass 96-well plate in triplicate. Solvent was evaporated using a temperature-controlled block at 100°C for 10 min. Twenty μL of concentrated sulfuric acid was added to each well and samples were incubated at 100°C for 10 min. Two-hundred and eighty μL of a vanillin-phosphoric acid reagent (6.8 mM vanillin, 2.6 M phosphoric acid) was added and the samples were incubated at room temperature for 30 min. The absorbance at 490 nm was recorded using a Victor3 1420 Multilabel Counter (Perkin-Elmer, Wellesley, MA, United States). Total lipid was calculated by comparison of the absorbance values to a calibration curve generated using NIST-certified menhaden (Brevoortia tyrannus) oil. Quality control samples included with each analytical run were a sample replicate (< 0.55 SD between replicates) and an in-house reference of walleye pollock (≤ 2% error from known value). Lipid content (% lipid) was calculated on both a wet mass and dry mass basis to assess the impacts of lipid content calculations on relationships between reference data and FT-NIR spectra.
RNA:DNA was measured as an index of recent growth and condition with the assumption that RNA that is involved in protein synthesis will increase in comparison to DNA when an organism is in good condition or nutritional state (Chícharo and Chícharo, 2008). RNA:DNA was measured by a one dye-two enzyme (RNase and DNase) fluorometric protocol developed by Caldarone et al. (2001) and modified by Sreenivasan (2011). Muscle tissue plugs (10 mg) were placed in individual microcentrifuge vials with 300 mL 2 % N-lauroylsarcosil Tris-EDTA buffer and sonicated using a Branson Sonifier 250 (VWR Scientific, Radnor, PA, United States). Samples were then vortexed for 60 min, diluted with 1,200 mL Tris-EDTA buffer, and centrifuged for 15 min at 14,000 g. Supernatants were treated with 75 mL ethidium bromide (5 mg/mL). A Wallac 1420 microplate spectrophotometer (Perkin Elmer, Waltham, MA, United States) measured total fluorescence at excitation and emission wavelengths of 355 nm and 600 nm, respectively. Samples were sequentially treated with RNase and DNase, and the resulting reduced fluorescence measured to obtain RNA and DNA fluorescence, respectively. Standard curves were constructed using serial dilutions of 18S-28S rRNA (Sigma R-0889) and calf thymus DNA (Sigma D-4764) standards. Supernatants for RNA/DNA were read on Corning NBS 96-well black flat-bottom microplates (75 mL samples).
FT-NIR Spectroscopy
Fourier transform near-infrared spectroscopy data were collected from thawed homogenized fish tissue using a Bruker TANGO-R FT-NIR single-channel spectrometer (Bruker Optics, Ettlingen, German) with diffuse reflectance and a spectral range of 11,500–4,000 cm–1 to develop calibration models for reference morphometric (Fulton’s K and HSI) and biochemical (lipid content, energy density, and RNA:DNA) indices of fish condition. For each sample, 0.50 g (±0.01 g SD) of thawed tissue homogenate was scooped into a 22 mm diameter quartz vial and scanned on a quartz sample window (22 mm diameter) configured to reduce stray light using an auxiliary stainless steel ring with a 22 mm diameter inset for the vial. A stainless steel transflection stamp with a 2 mm path length and 22 mm diameter surface was nested in the vial over the sample. Tradeoffs in accuracy vs. processing speed with different instrumentation settings yielded similar spectra (Supplementary Figure 1). Therefore, analyses were performed using the setting with the fastest scan time of ∼40 s per sample using a scanner velocity of 7.5 kHz, 32 cm–1 resolution, and 64 replicate scans.
Statistical Analyses
Pearson’s correlation coefficients were calculated between all indices of condition to determine whether there was agreement regarding overall fish condition. Linear regression relationships were also calculated to determine the ability to predict biochemical indices (% lipid and energy density) from morphometric indices (Fulton’s K and HSI), with the assumption that morphometric measurements that provide estimates of energy storage reflect underlying biochemistry (e.g., body and liver weights increase due to increased lipid stores; Wuenschel et al., 2018).
Spectroscopy data analysis followed established chemometric procedures to compare reference datasets to spectra (Figure 1) because statistical analyses typically use absorbance values at each measured wavenumber as variables, resulting in a large number of collinear variables for modeling (Beć and Huck, 2019). Broadly, peaks and troughs in the FT-NIR absorbance spectra provide information about the molecular composition of a material. However, spectral data can be challenging to interpret without multivariate modeling techniques due to bond vibrations that obscure molecular “fingerprints” such as overlapping regions of absorption among functional groups, multiple vibrational overtones, and combinations of fundamental absorptions (Beć and Huck, 2019). Principal component (PC) analysis was used to determine unusual or outlier spectra for subsequent modeling and to qualitatively visualize spectra in relation to reference data. Quantitative calibration models were developed using partial least squares regression (PLSR) which is a multivariate latent variable modeling approach. PLSR is a decomposition technique that creates a linear regression model by simultaneously decomposing explanatory and response matrices (if there are multiple response variables). The method reduces variables into components similar to PCs and maximizes the relationship between the explanatory and response variables by projecting them both into new space for the regression analysis (Haenlein and Kaplan, 2004).
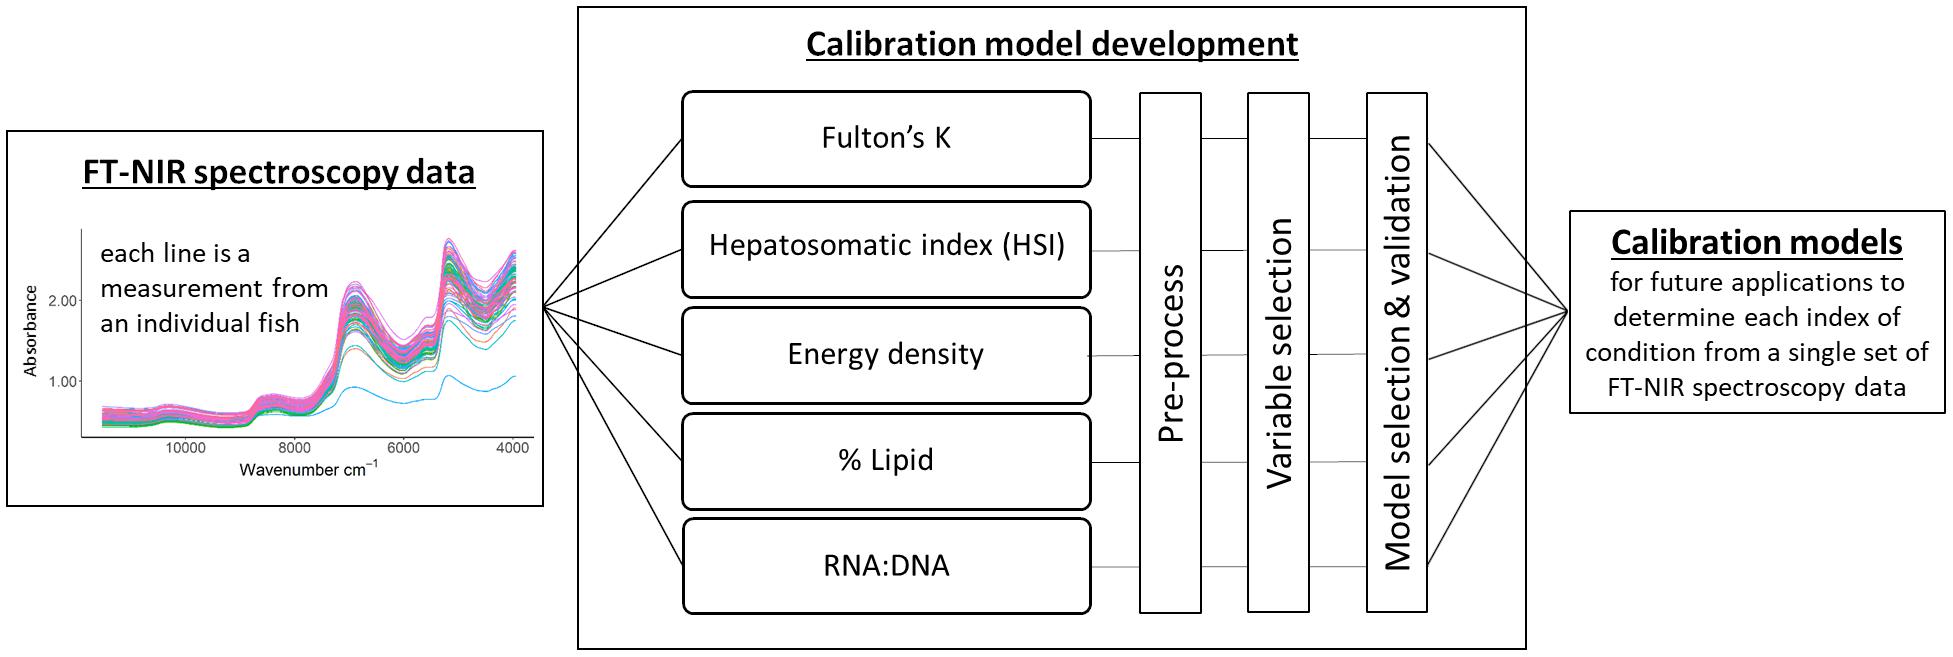
Figure 1. Calibration model development starting with the acquisition of Fourier transform near-infrared (FT-NIR) spectroscopy data, followed by the development of calibration models using a single spectral dataset for all condition indices. Model selection and validation encompassed the evaluation of cross-validated results and test datasets. The end product is a calibration model for each index of condition that can be used to estimate condition measures for unknown samples.
For PLSR and PC analyses, wavenumber values >10,800 cm–1 were removed from the dataset based on minimal spectral information (i.e., no peaks; Supplementary Figure 2) and data pre-processing steps were employed to remove the influence of undesired light scatter effects due to irregularities in the samples and to correct baseline shifts in the data such as those that resulted from instrument maintenance (Supplementary Figures 2, 3; Rinnan et al., 2009). A PC analysis that incorporated all specimens was used to identify outlier spectra. Varying polynomial order and window size for pre-preprocessing for the PC analysis did not alter the identification of outlier points. Six irregular spectra were considered outliers based on visual inspection of spectra and PC1 or PC2 scores > 0.25, and were excluded from subsequent metric-specific PC analyses and PLSR modeling (Figure 2 and Supplementary Figure 2). Notably, the energy density dataset was deficient in small individuals, and HSI did not incorporate many large high condition fish (Figures 2, 3 diagonal).
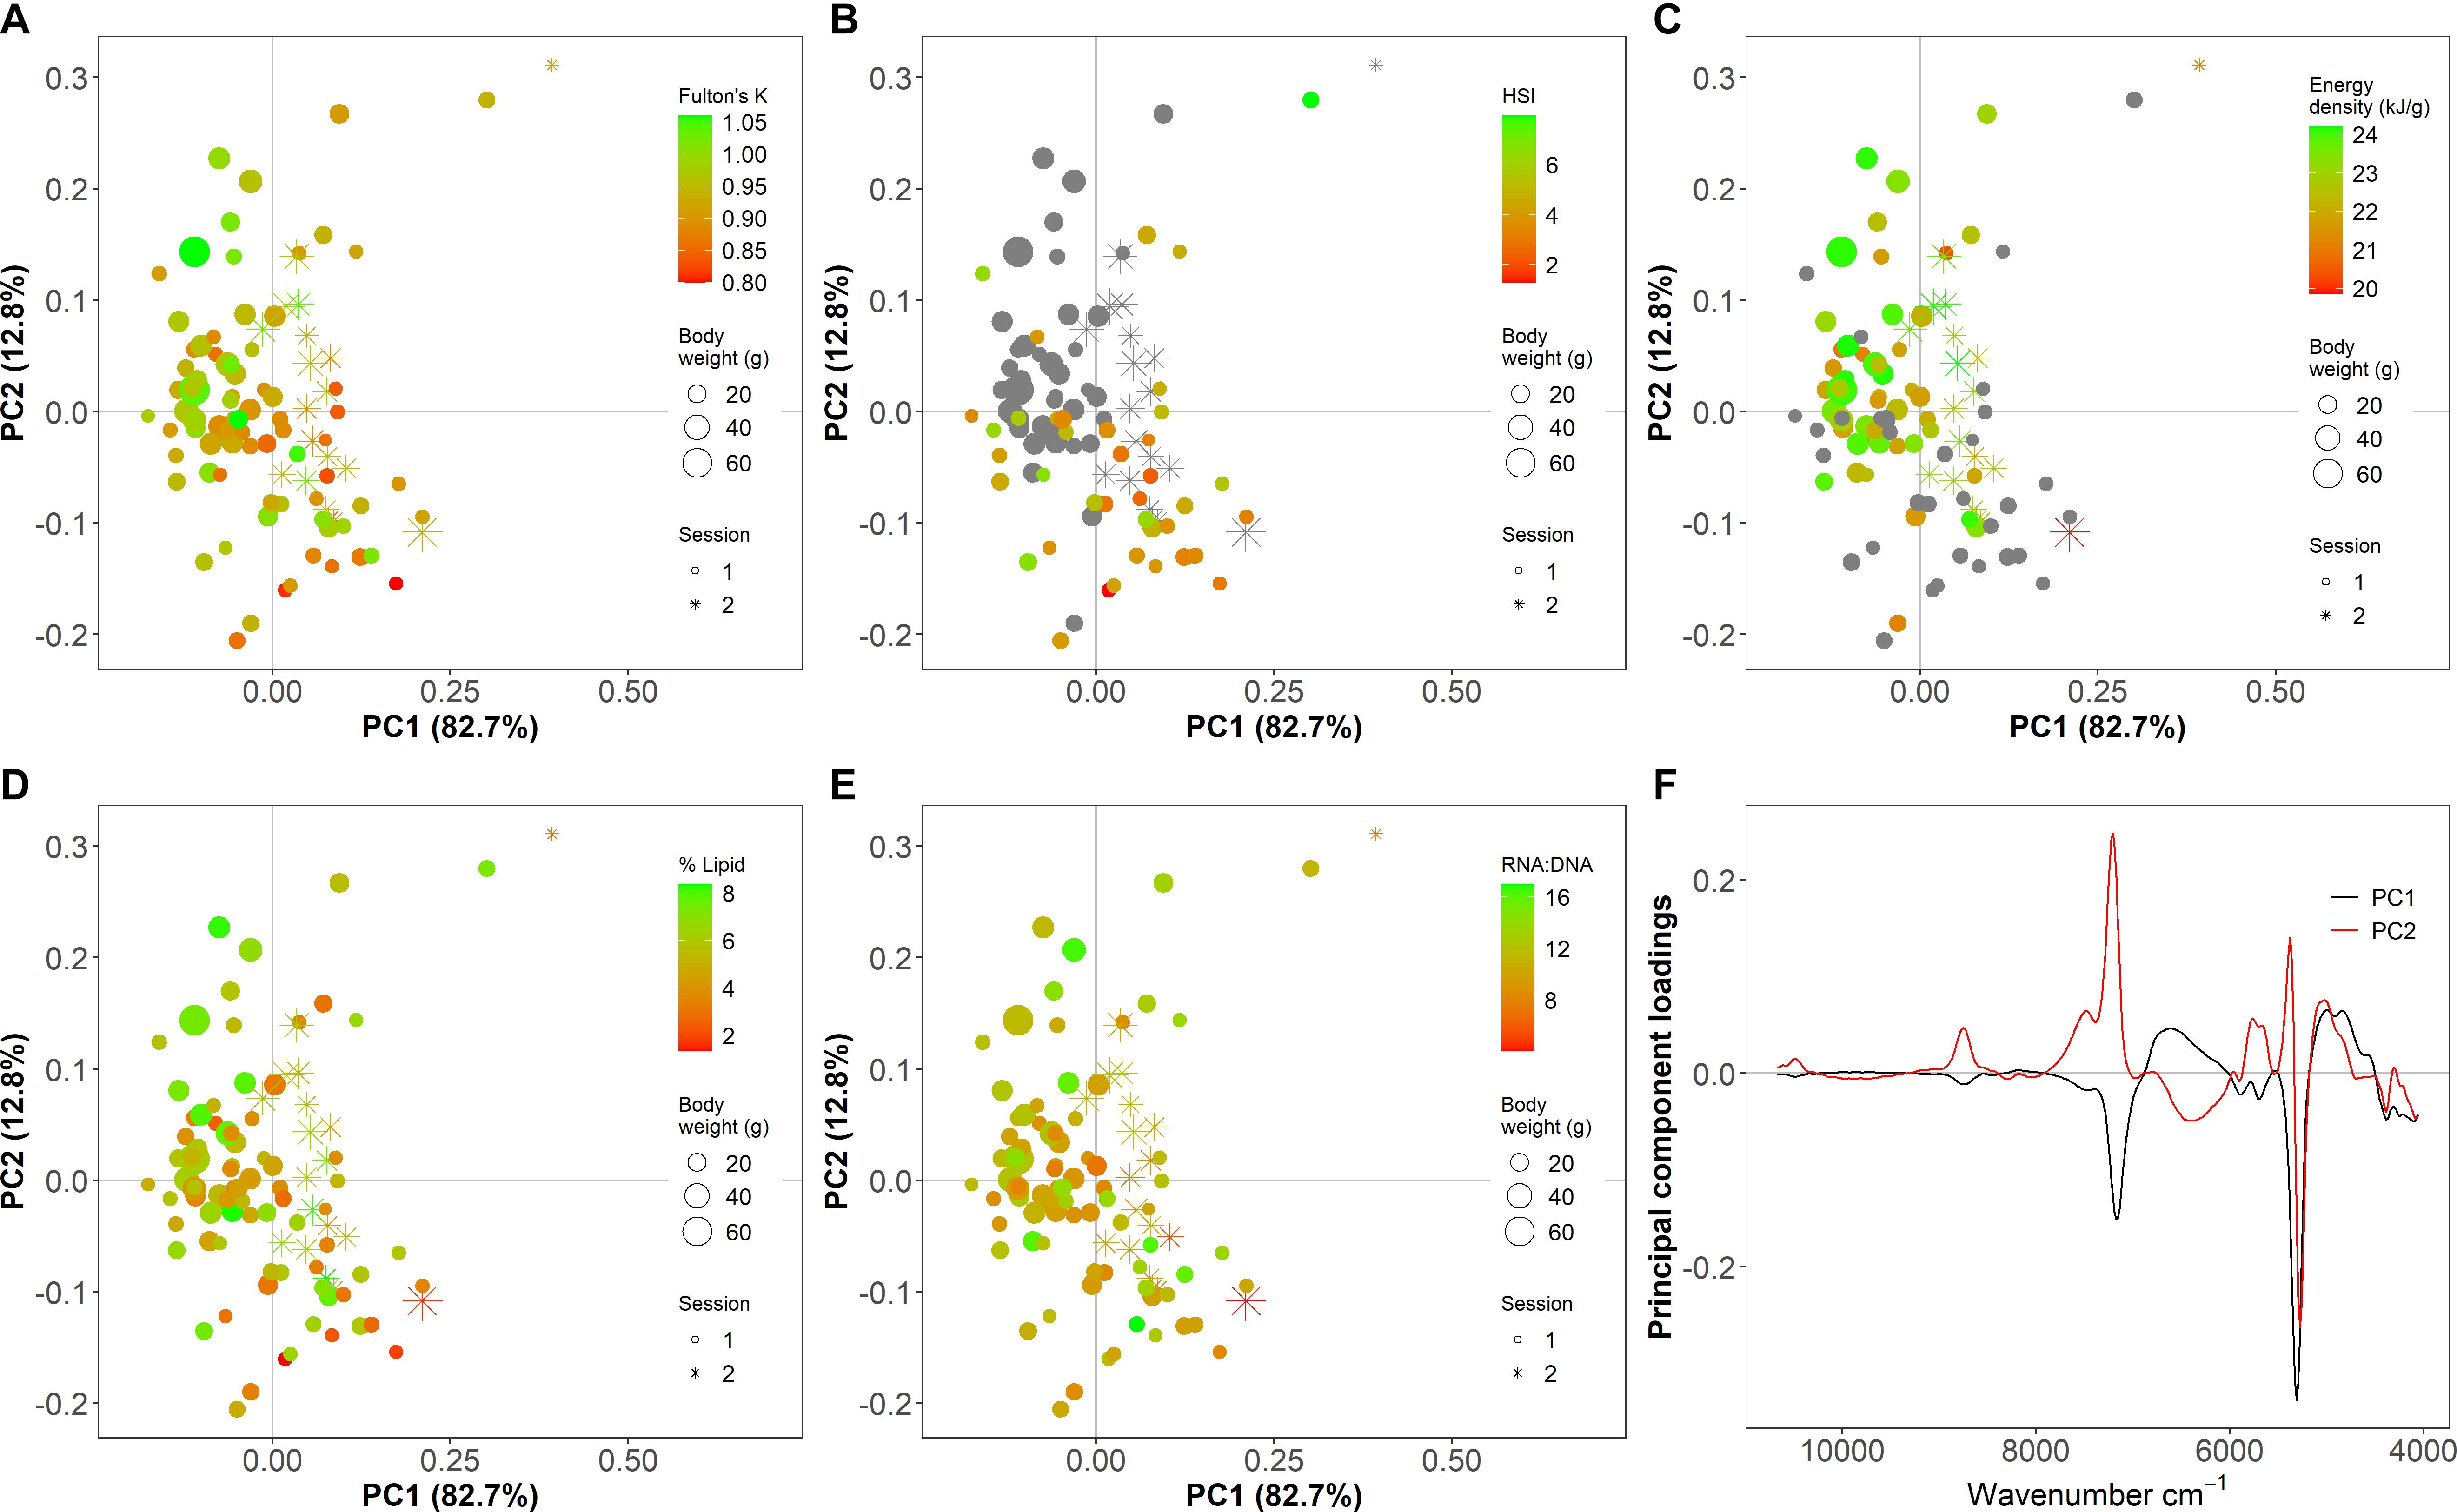
Figure 2. Principal component (PC) analysis scores (A–E) and loadings (F) of Fourier transform near-infrared (FT-NIR) spectroscopy data from thawed homogenized Pacific cod tissue showing (A) Fulton’s K, (B) hepatosomatic index (HSI), (C) energy density (kJ/g dry mass), (D) % lipid (% wet mass), and (E) ratio of RNA to DNA (RNA:DNA). Points are individual samples and the color scales indicate the value of each condition metric, where gray indicates no data. Symbol size shows the body weight (g) of individual fish and shape indicates the scan session (1 is before instrument maintenance, and 2 is after). Spectra are pre-processed with a Savitzky–Golay first derivative filter with polynomial order = 5 and window size = 15.
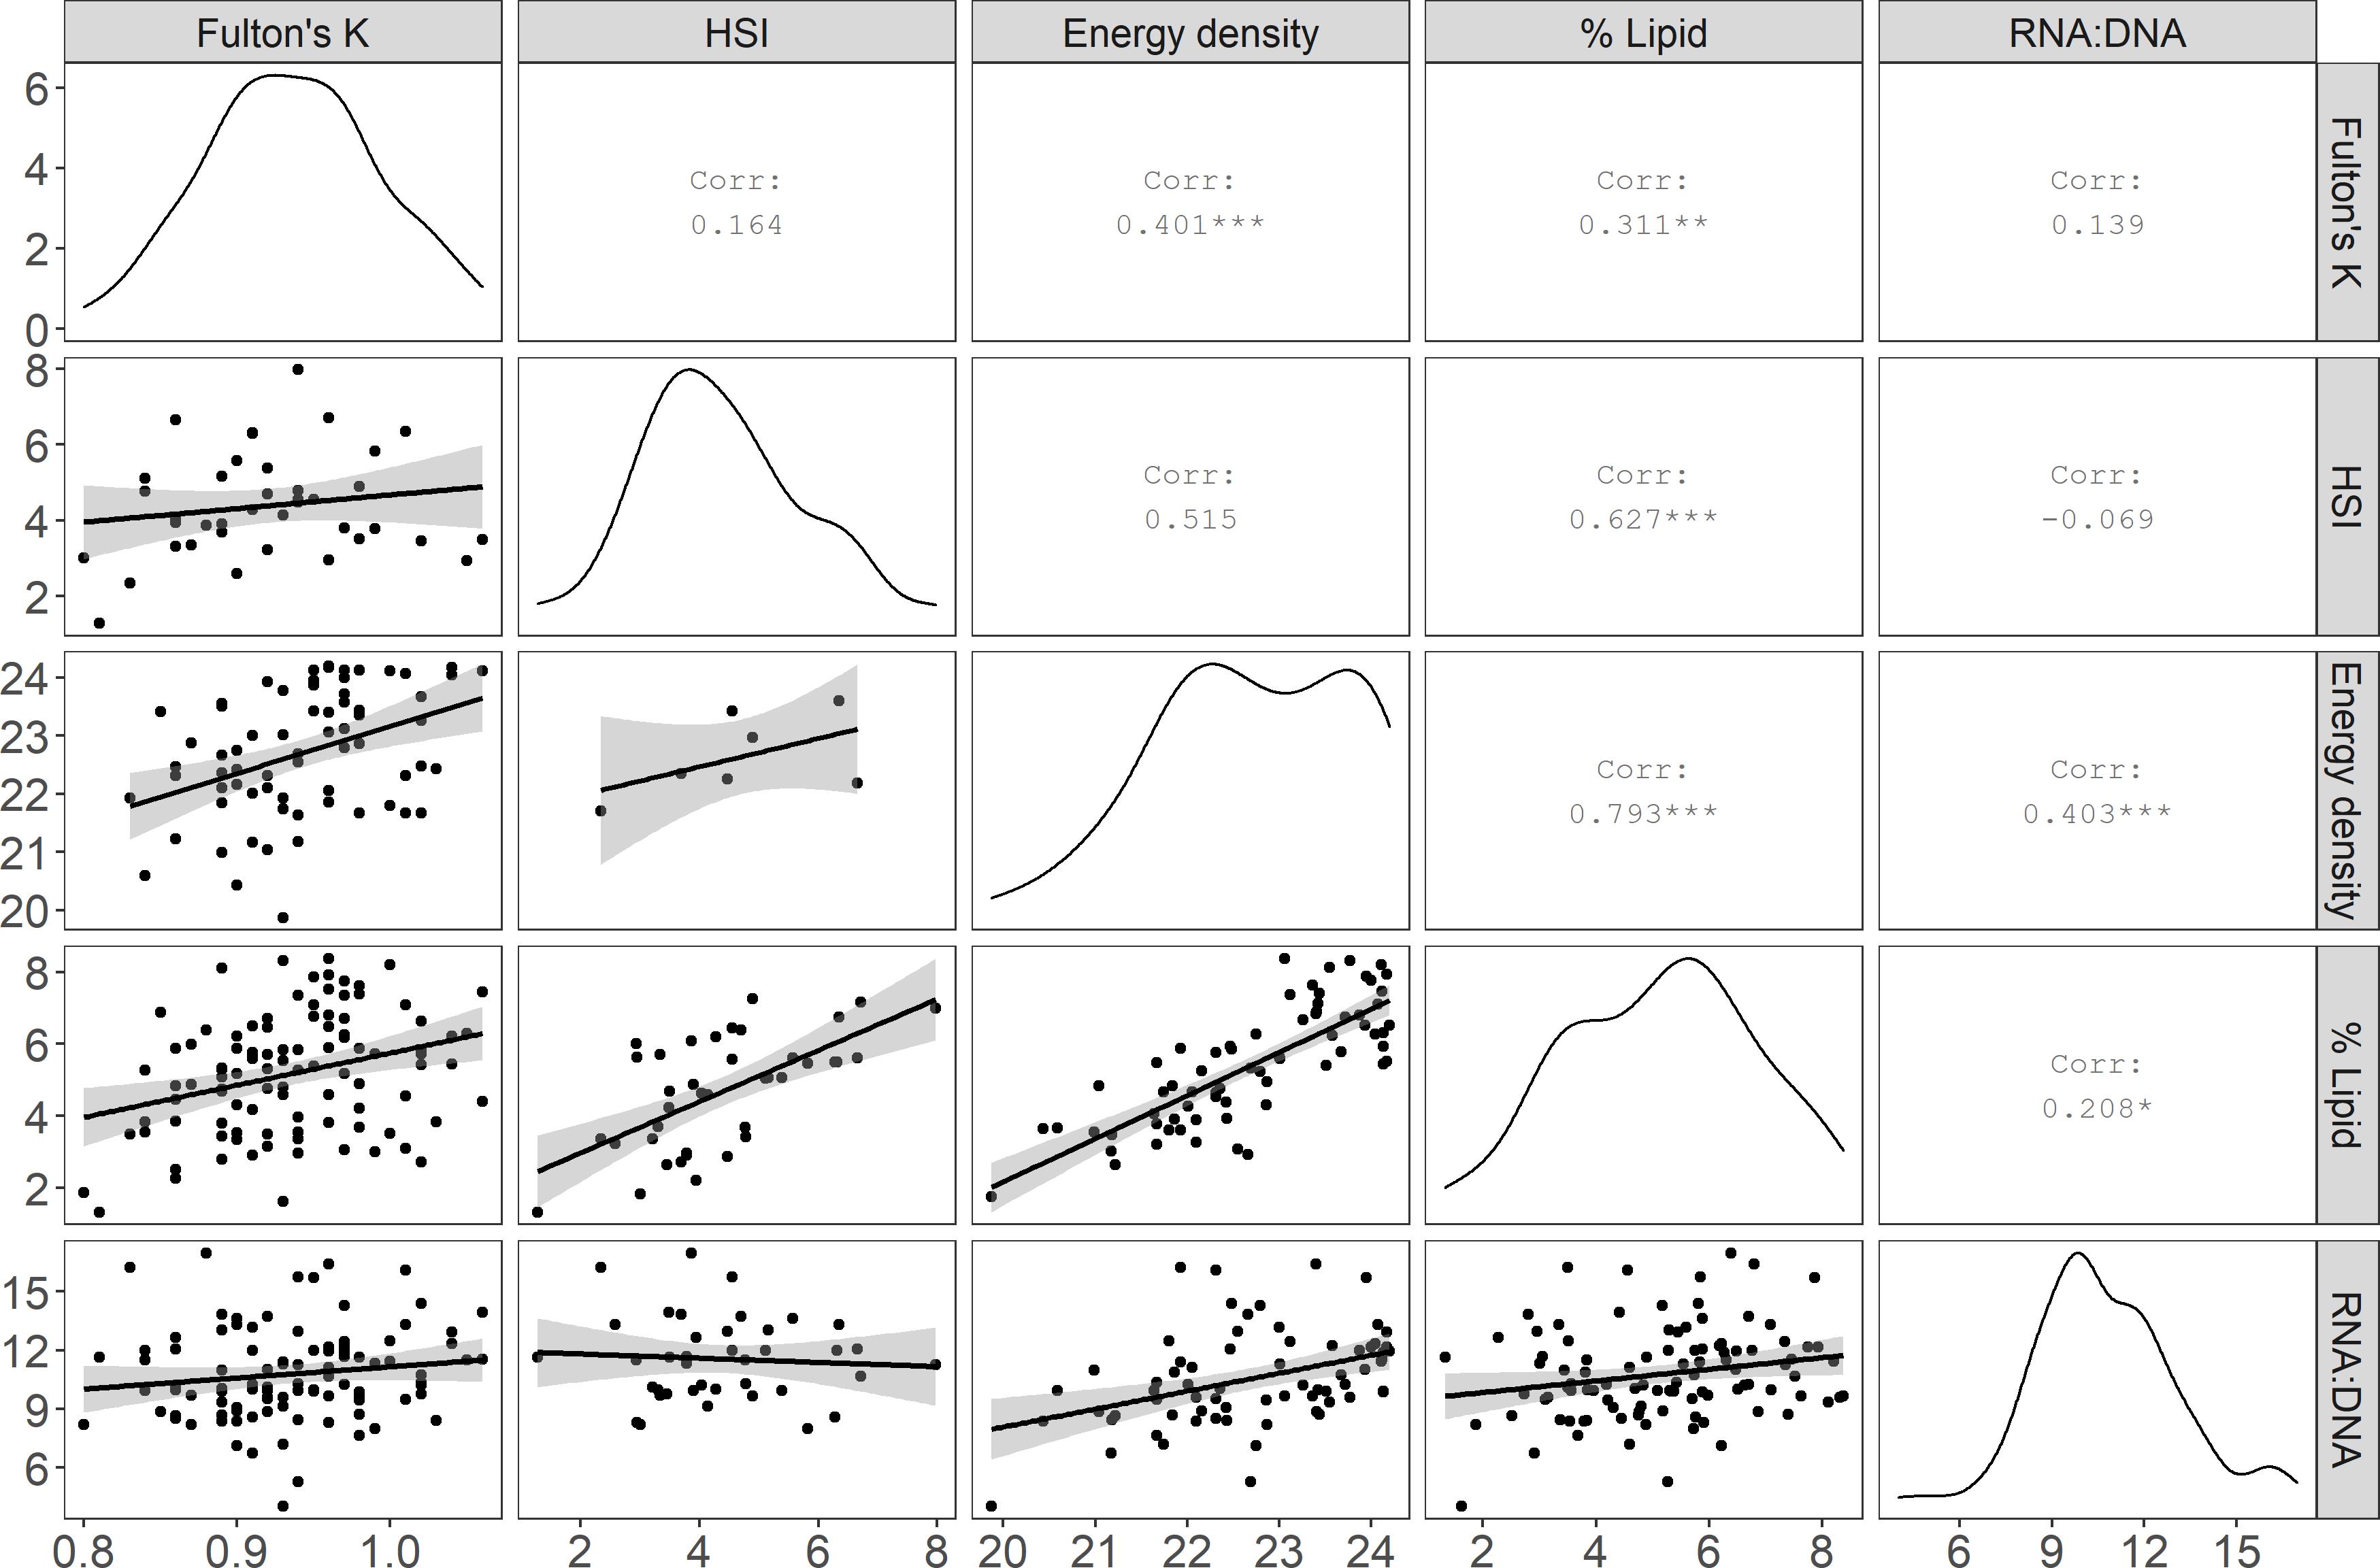
Figure 3. Comparisons among Pacific cod condition indices: Fulton’s K, hepatosomatic index (HSI), energy density (kJ/g dry mass), lipid (% wet mass), and the ratio of RNA to DNA (RNA:DNA). The matrix diagonal shows the distribution of the specimen values (probability density) for each index, and the lower left portion of the matrix shows the pairwise linear regression relationships (gray shading = standard error) among metrics. Corr = Pearson correlation coefficient. Statistical significance: * p ≤ 0.05, **p ≤ 0.01, and ***p ≤ 0.001.
Following outlier exclusion, PLSR calibration models were developed for each index of condition (Figure 1) using randomly divided calibration and test datasets for indices with greater than 40 data points (Table 1). In order to maximize signal to noise ratios, several pre-processing methods were tested for each index: Savitzky-Golay (SG) first derivative, SG second derivative, and multiplicative scatter correction (MSC; Rinnan et al., 2009). Iterations of SG filters with varying polynomial orders and window size were employed for each metric to determine optimal values (details in Supplementary Text 1 using % lipid as an example). Additionally, SG filters were applied to data with and without prior MSC pre-processing for the % lipid models (Baykal et al., 2010). The application of MSC prior to SG filtering did not further improve model performance (Supplementary Table 1) and was therefore not included in model comparisons for other indices of condition.
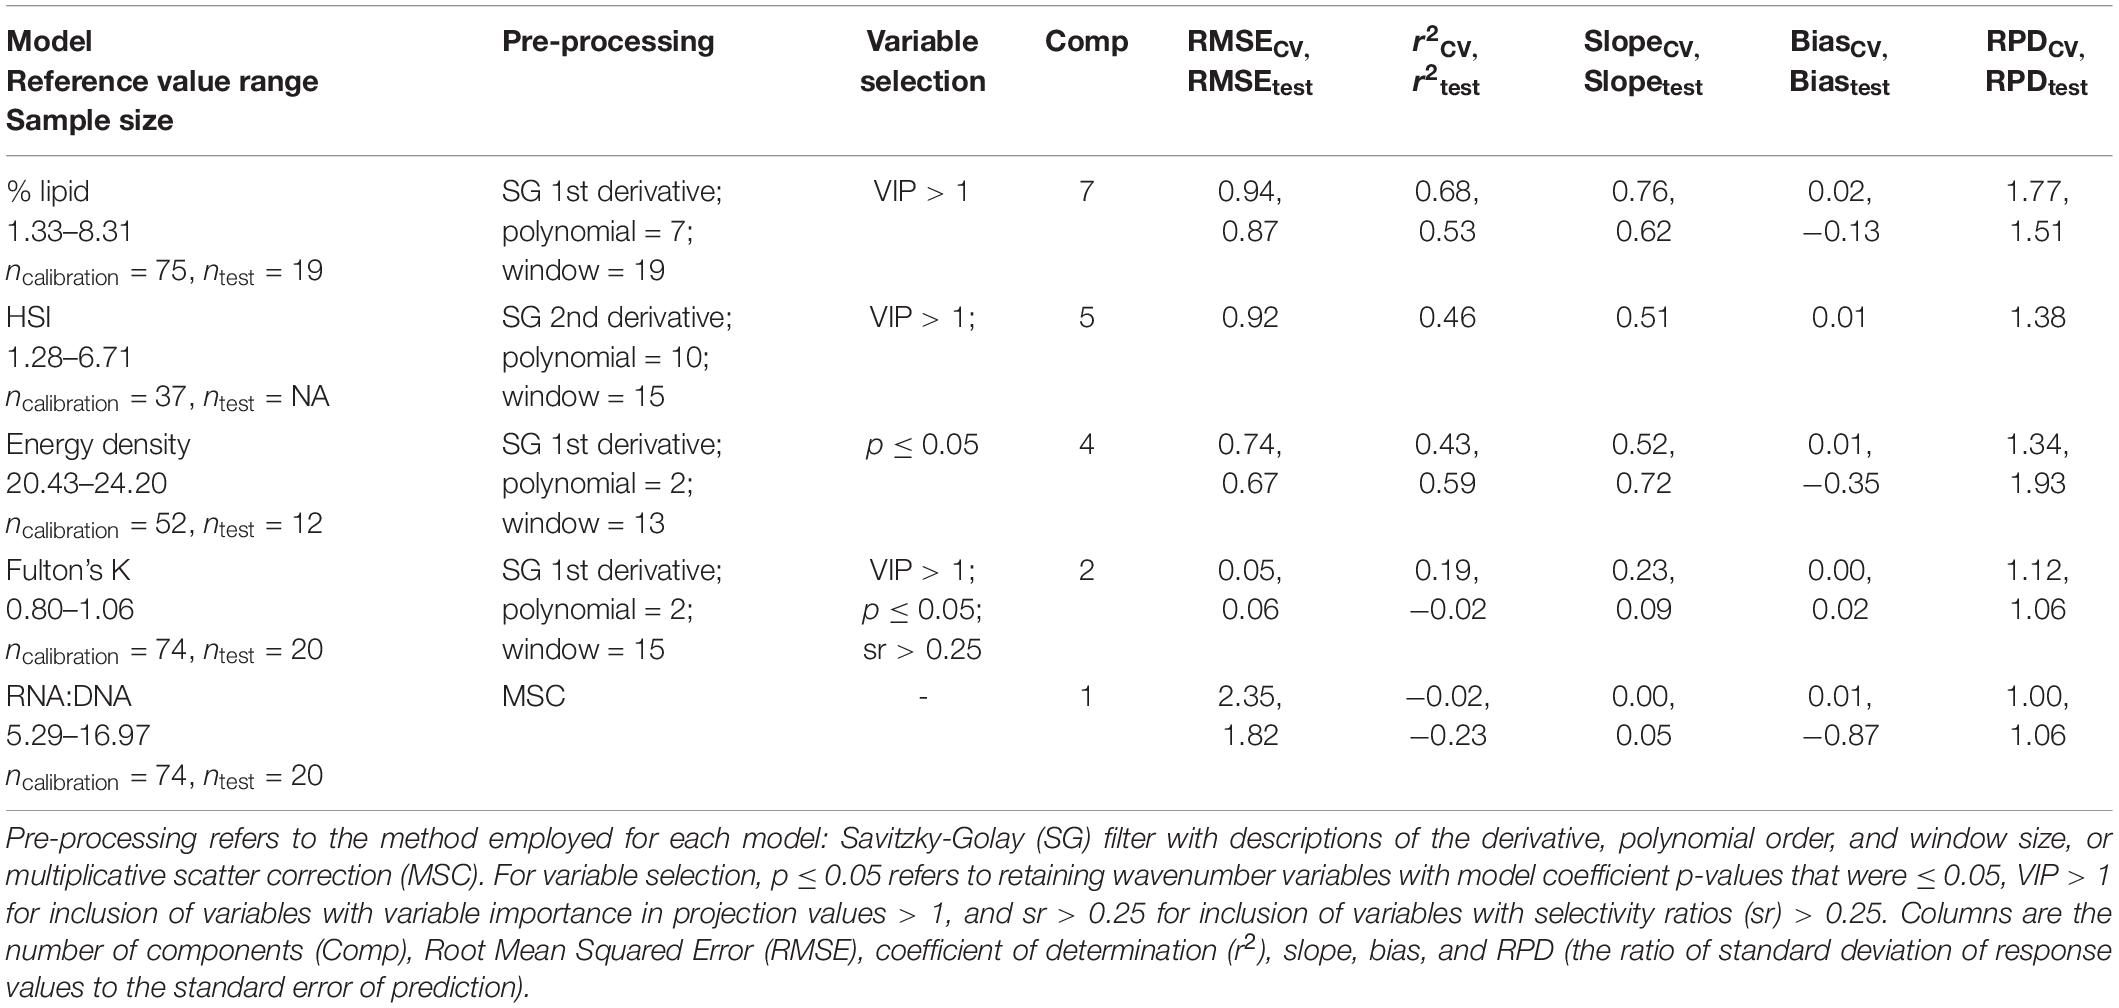
Table 1. Comparison of the best-fit calibration models among condition metrics [% lipid (% wet mass), energy density (kJ/g), hepatosomatic index (HSI), Fulton’s K, and RNA:DNA] as determine by leave-one-out cross-validation (CV) and using the test dataset (test).
Principal component analyses and PLSR calibration models were developed using index-specific pre-processing to examine qualitative and quantitative relationships between indices and spectra. Calibration models were developed using the following process (Figure 1): (1) Full models incorporated mean-centered data for each pre-processing method and candidate models were compared using Root Mean Square Error with leave one out cross-validation (RMSECV) to determine the optimal number of components. (2) The potential to reduce model RMSECV and to develop a more parsimonious model was tested through several variable selection procedures for the top two models with the highest RPDCV (Residual Predictive Deviation from cross-validation), where >1.5 suggests acceptable predictive performance but >2 denotes good predictive ability (Cohen et al., 2007; D’Acqui et al., 2010). Wavenumber variables were excluded if the variable importance in projection (VIP) was <1. Variable inclusion was also explored using two selectivity ratio thresholds (SR; > 0.25 and > 0.05) based on the lack of clear guidelines regarding cut-off points for SR (Farrés et al., 2015). Removal of wavenumbers with non-significant regression coefficients based on jack-knifed p-values (α = 0.05) was also tested. PLSR models were also tested using wavenumber regions that resulted from combinations of the variable selection methods. (3) All models, including before and after variable selection, were compared, and the final model was selected based on the lowest RMSECV, highest r2CV, and highest RPDCV. For the resulting best-fit models, performance was further evaluated using the test dataset. If the best-fit model approached the acceptable RPD criteria (≥ 1.5), predicted values and those measured using traditional metrics were compared (Piñeiro et al., 2008). If the sample size exceeded 40 specimens, then model sensitivity to calibration and test dataset designations was evaluated using 100 randomly partitioned datasets to compare variability in RPD, r2, and RMSE for calibration data, test data, and through cross-validation. Model configuration was constrained to match the best-fit model (i.e., pre-processing, variables after selection, and components) for sensitivity tests. Data analysis was performed using R statistical software (R Core Team, 2020; version 3.6.1) with the vegan, PLSR, and MDAtools packages for multivariate analyses and modeling (Mevik and Wehrens, 2007; Oksanen et al., 2016; Kucheryavskiy, 2020).
Results
Most condition indices were positively, but not always significantly, correlated. The two biochemical methods, energy density and % lipid had the strongest correlation, whereas morphometric methods were not significantly correlated with each other (Figure 3). Additionally, HSI and RNA:DNA were negatively correlated, indicating that these two metrics differed in substantially in their representation of physiological health and condition (Figure 3). Linear regressions between morphometric proxies for condition and biochemical methods indicated a significant relationship between HSI and % lipid (% lipid = 0.76 ∗ HSI + 1.56, p < 0.001, r2 = 0.38, RMSE = 1.28) and a weak but significant relationship between Fulton’s K and energy density (energy density = 8.10 ∗Fulton’s K + 15.06, p < 0.01, r2 = 0.15, RMSE = 0.97). The RMSE associated with predicting % lipid from HSI was approximately ± 18% of the range of % lipid in the dataset (minimum minus maximum % lipid in fish tissue inclusive of specimens with outlier spectra spanned 7.04%), compared to approximately ± 22% for predictions of energy density (4.33 kJ/g range in data inclusive of specimens with outlier spectra) from Fulton’s K.
Qualitative relationships between spectra and indices of fish condition using both generalized and index-specific spectral data pre-processing showed some divergence along the first two PC axes for Fulton’s K, HSI, and % lipid but minimal separation for energy density and RNA:DNA (Figure 2 and Supplementary Figures 4–9). Regardless of the pre-processing method, which impacted the amount of variation and noise in the spectra, the first two PC axes explained a large majority of the variability in the spectra obtained from homogenized tissue (Figure 2 and Supplementary Figures 4–9). Wavenumber regions surrounding ∼5,300 cm–1 and ∼7,300 cm–1 contributed substantially to spectra separation along both PCs (Figure 2 and Supplementary Figures 4–9) indicating that most variability in the spectra among specimens was associated with these regions.
For most metrics of condition, SG pre-processing resulted in the best-fit PLSR calibration models (Table 1 and Supplementary Tables 1–6). Selecting variables for inclusion in the models based on VIP, SR, or coefficient p-values also generally improved correlations (Table 1 and Supplementary Tables 1–6). FT-NIR spectroscopy data were negligibly correlated with RNA:DNA and Fulton’s K compared to HSI and the two biochemical metrics of condition (Table 1). RNA:DNA had the weakest relationship with FT-NIR spectroscopy data, and a negative r2CV indicated that the variability in model residuals was greater than residuals using mean observations as predictors (Table 1; Möckel et al., 2016). Additionally, PLSR models developed using lipid content standardized to dry body weight (lipiddry: % dry mass) had slightly greater error compared to models developed from % lipid standardized to wet weight using the same calibration dataset (Supplementary Tables 1, 2). Water can be detected using FT-NIR spectroscopy and is inversely correlated with lipids in fish tissue (Vollenweider et al., 2011), potentially leading to this small difference in model performance when reference data calculations exclude water (i.e., standardized to dry mass) but FT-NIR spectroscopy data is measured using specimens that contain moisture.
Calibration models for % lipid had the highest predictive ability, followed by HSI and energy density (Table 1). Iterations of calibration and test data partitioning for % lipid and energy density models confirmed that RMSE and r2 from cross validation, the calibration datasets, and test datasets were generally robust to changes in sample partitioning (Figure 4). RPD varied to a greater degree than the other model diagnostic metrics, but primarily remained >1.5 for % lipid and just below <1.5 for energy density. The r2 from test datasets for energy density generally remained near ∼0.5, but did vary to a greater degree than for % lipid, and even resulted in negative values for some iterations. This variability is potentially a result of small sample sizes for both calibration and test datasets compared to % lipid models. The best-fit HSI calibration model indicated model performance nearing acceptable thresholds, but sample sizes were insufficient to divide the dataset for calibration and testing. With the exception of the best-fit model for HSI, most model configurations and variable selection procedures resulted in very poor model fits (Supplementary Table 4). This is in contrast to % lipid and energy density models, where variable selection and pre-processing generally did not result in marked differences in model performance (Supplementary Tables 1, 4, 5). This discrepancy may be due to small sample sizes as well as a large degree of noise and variability in spectra after pre-processing for the best fit HSI model (evident in PC loadings; Supplementary Figure 7). This combination likely resulted in high model sensitivity to variable inclusion or exclusion, as well as the potential for model overfitting and cautious interpretation of the best-fit model diagnostics. Based on commonly employed thresholds for RPD where >2.0–2.5 is generally considered good model performance and 1.5 is acceptable (Cohen et al., 2007; D’Acqui et al., 2010), only % lipid was sufficiently correlated with the spectral data to produce an acceptable calibration model (Table 1 and Figure 4).
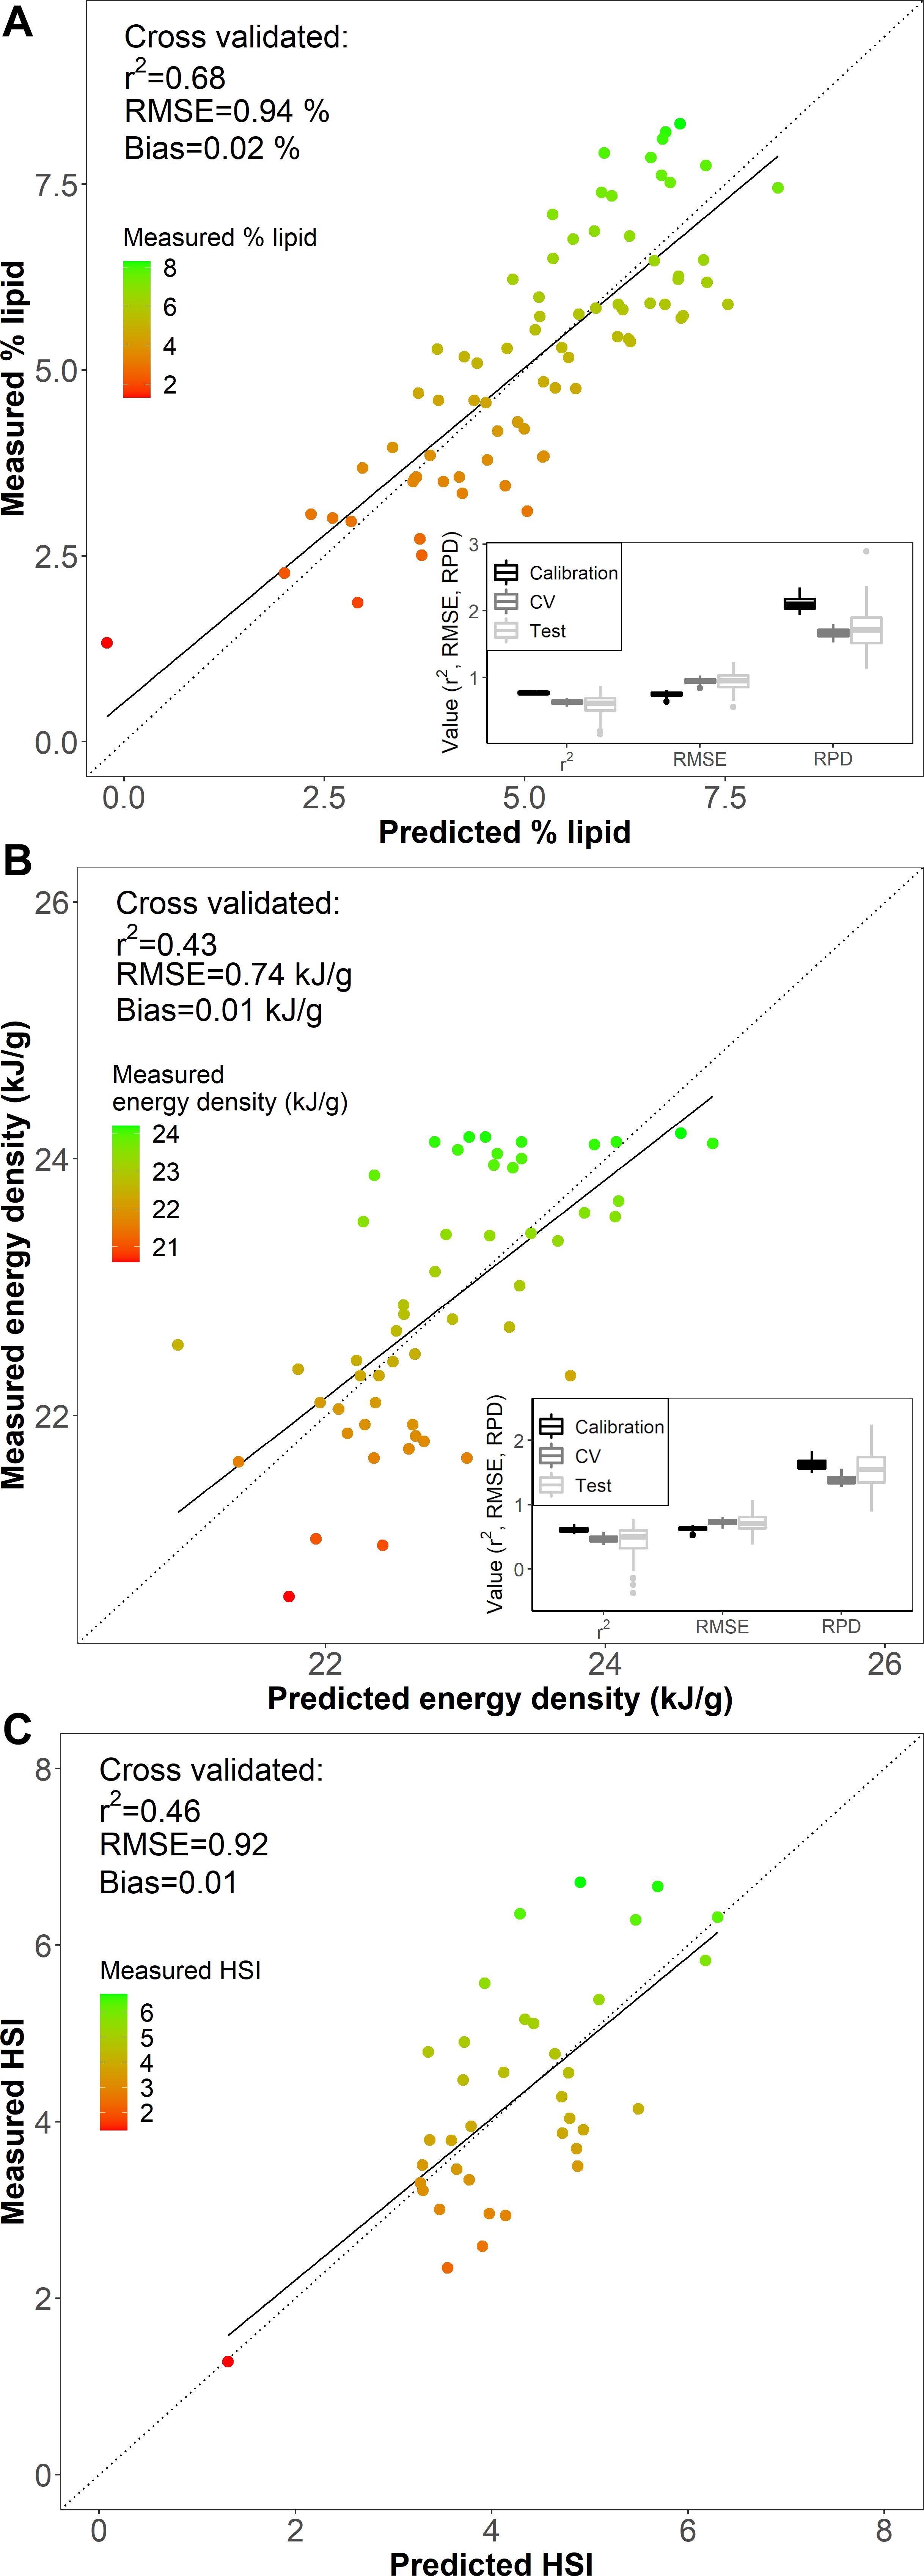
Figure 4. Comparisons of (A) % lipid (% wet mass), (B) energy density (kJ/g), and (C) hepatosomatic index (HSI) measured from reference data (measured) and predicted values based on Fourier transform near-infrared spectroscopy from the best fit models for each metric (see Table 1). The dotted line is the 1:1 measurement and prediction line, and the solid line is the linear fit between predictions and measured data. The boxplot insets (A,B) show the median, first and third quartile (IQR), and 1.5 times the IQR for r2, RMSE, and RPD from 100 iterations of randomly partitioned calibration and test datasets.
The model-based % lipid predictions were accurate within <1% range of lipid values (RMSECV of 0.94 %), where the error encompasses ∼±13 % of the variability (range of 1.33–8.31 %) in the biochemically measured % lipid data. Comparisons of measured and PLSR predicted values for % lipid, energy density, and HSI indicated that specimens with low body condition reference values were limited and generally poorly predicted by the models (Figures 4, 5). Large residual deviations for % lipid were associated with small fish (Figure 5A) and this pattern was supported through outlier detection plots where a few small fish were far from the center scores of the model (higher Hotelling T2, or sum of the normalized squared scores, which is a multivariate extension of a Student’s t-test; Figure 5B). Large model residuals at high % lipid values were primarily associated with large, likely older, fish (Figure 5A); however, there was no clear pattern in body size in association with the magnitude of variation (distance) between the actual sample and the model predictions in projected space (Q residuals) (Figure 5B; Legendre and Legendre, 2012). Despite these patterns, excluding the notable small fish in low condition that was poorly predicted by the model (Figure 5A) did not improve PLSR model performance for % lipid (RMSEcv = 0.96 %, r2cv = 0.64 using for SG first derivative filter, polynomial = 7, window = 19, and VIP variable selection). For energy density and HSI, underprediction for several of the highest condition specimens (measured energy density of ∼24 kJ/g and HSI of ∼6) and overprediction for the lowest condition specimens contributed to reducing model performance (Figure 4).
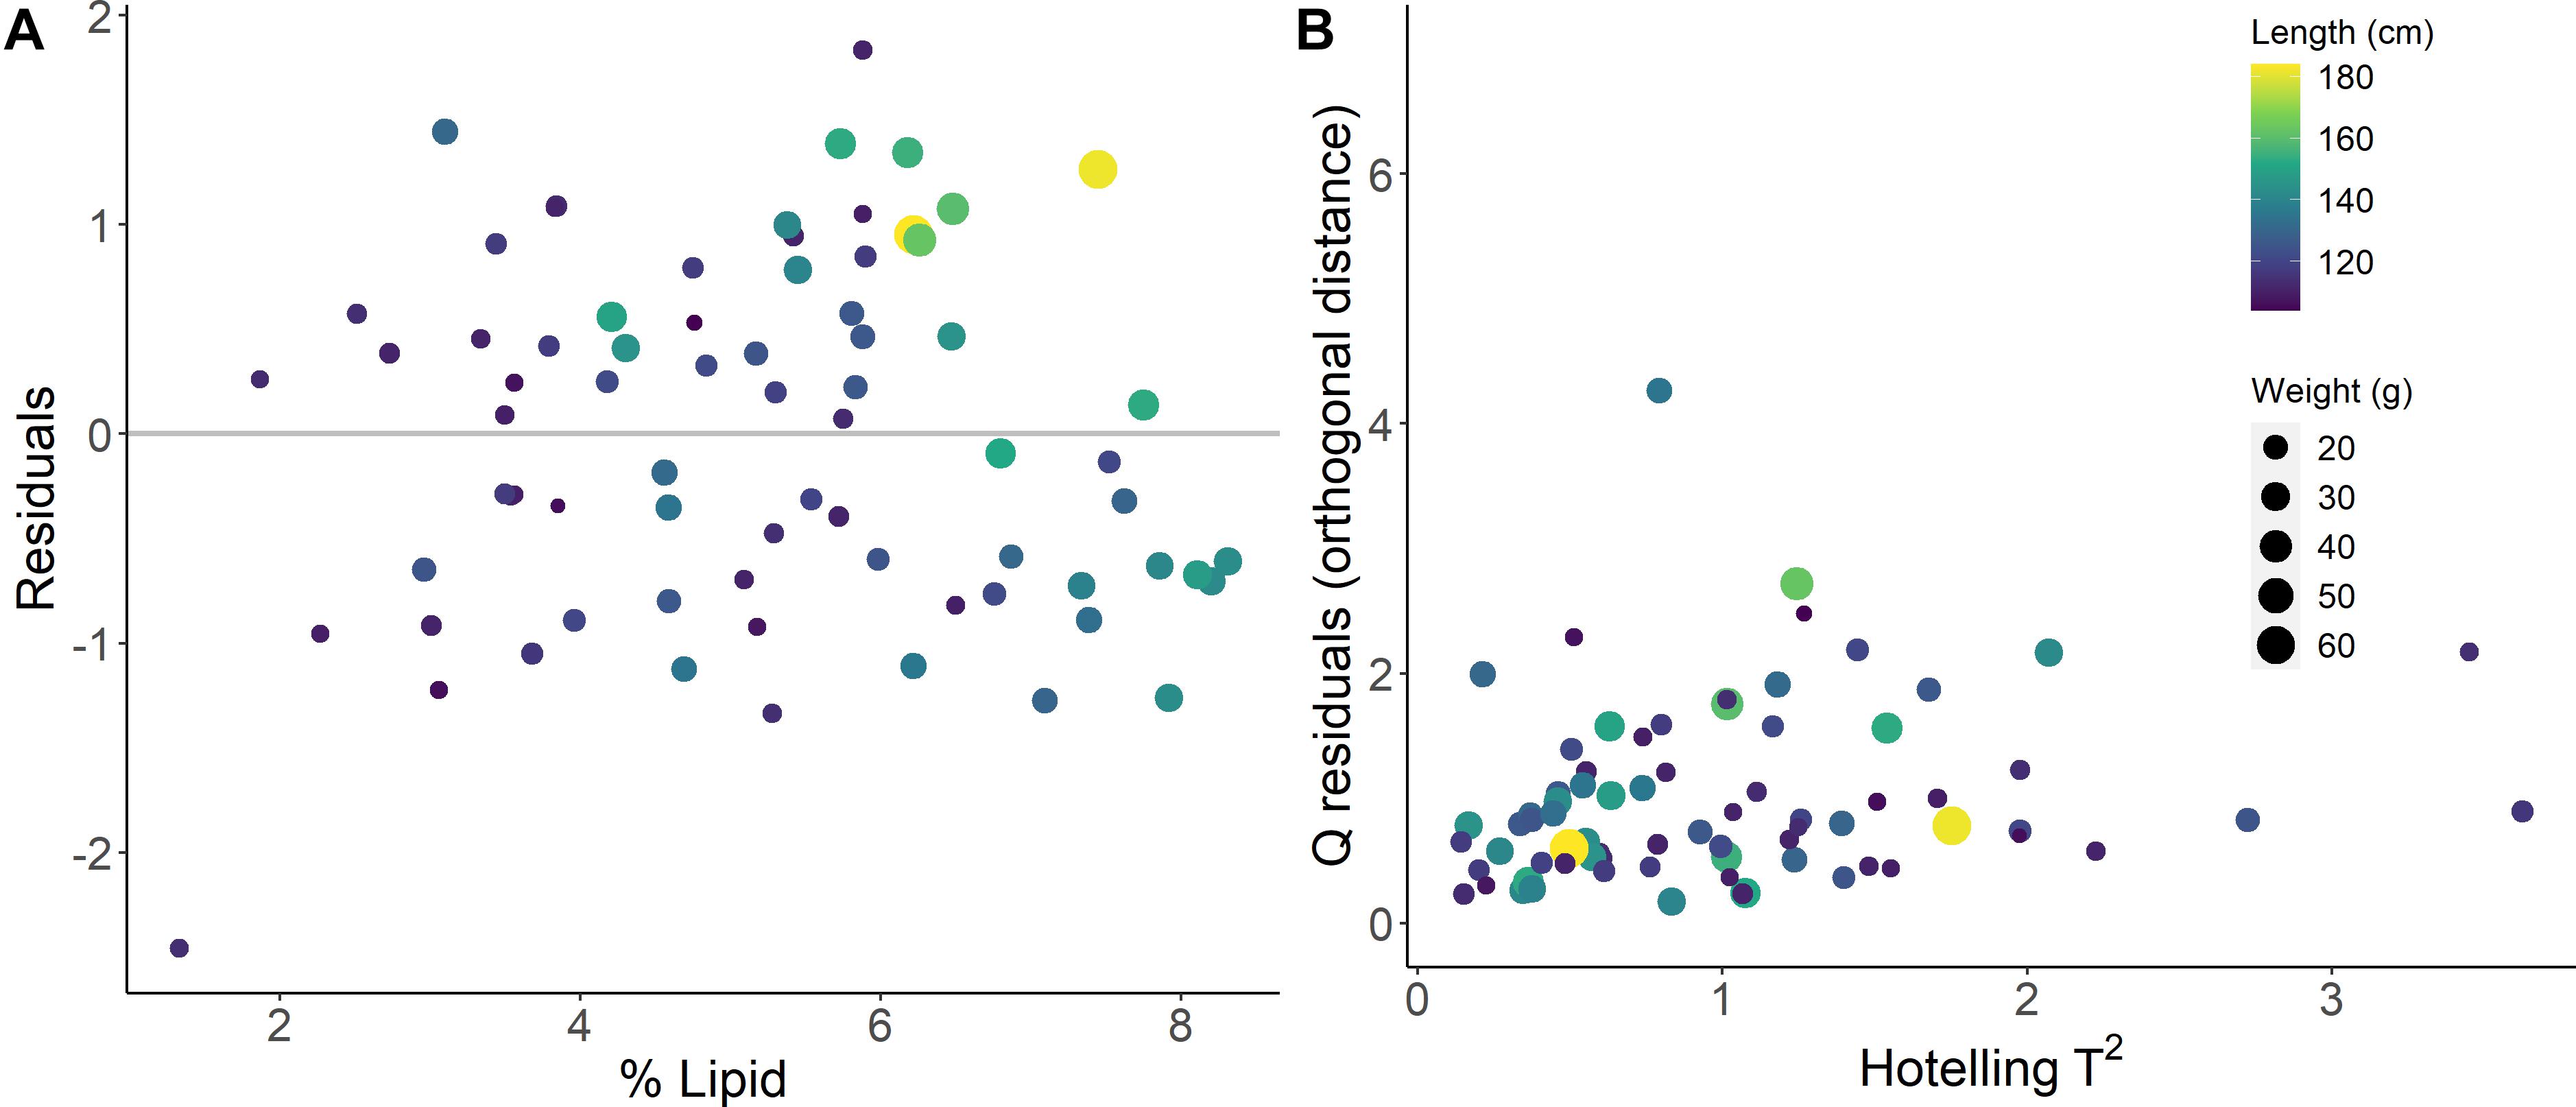
Figure 5. Prediction residuals (A) and outlier detection for explanatory variable projections (B) from the best fit % lipid (% wet mass) calibration model.
Based on the ability to detect lipid content with FT-NIR spectroscopy, detailed inspection of % lipid calibration models and comparisons with energy density and HSI that also neared acceptable thresholds revealed wavenumber regions that were most informative for predictions. Variable selection for the % lipid model (Table 1) excluded much of the spectral data (Figure 6). Wavenumbers that were maintained showed visual separation between high and low % lipid (ex: ∼7,500–7,000 cm–1 and ∼5,950–5,700 cm–1; Figure 6). A combination of regression coefficients and component loadings (primarily component 1) from the best-fit PLSR models highlighted particularly informative wavenumber regions at values near 4,500–4,100 cm–1, 5,450–5,000 cm–1, 5,950–5,750 cm–1, ∼7,300–7,050 cm–1 (Figure 7). These regions were similar to the informative wavenumbers for energy density as well as HSI (Figure 7). For HSI, the region from ∼5,400–5,000 was prominent with respect to regression coefficients and components (Figures 7A,B). Informative regions for energy density included additional wavenumbers in the ∼6,500–6,000 cm–1 range. Regression coefficient and loading patterns were less strongly associated with prominent wavenumbers in comparison to % lipid and HSI (Figure 7), potentially as a result of low polynomial order in SG pre-processing for the best-fit model that smoothed variability in the spectra (Table 1).
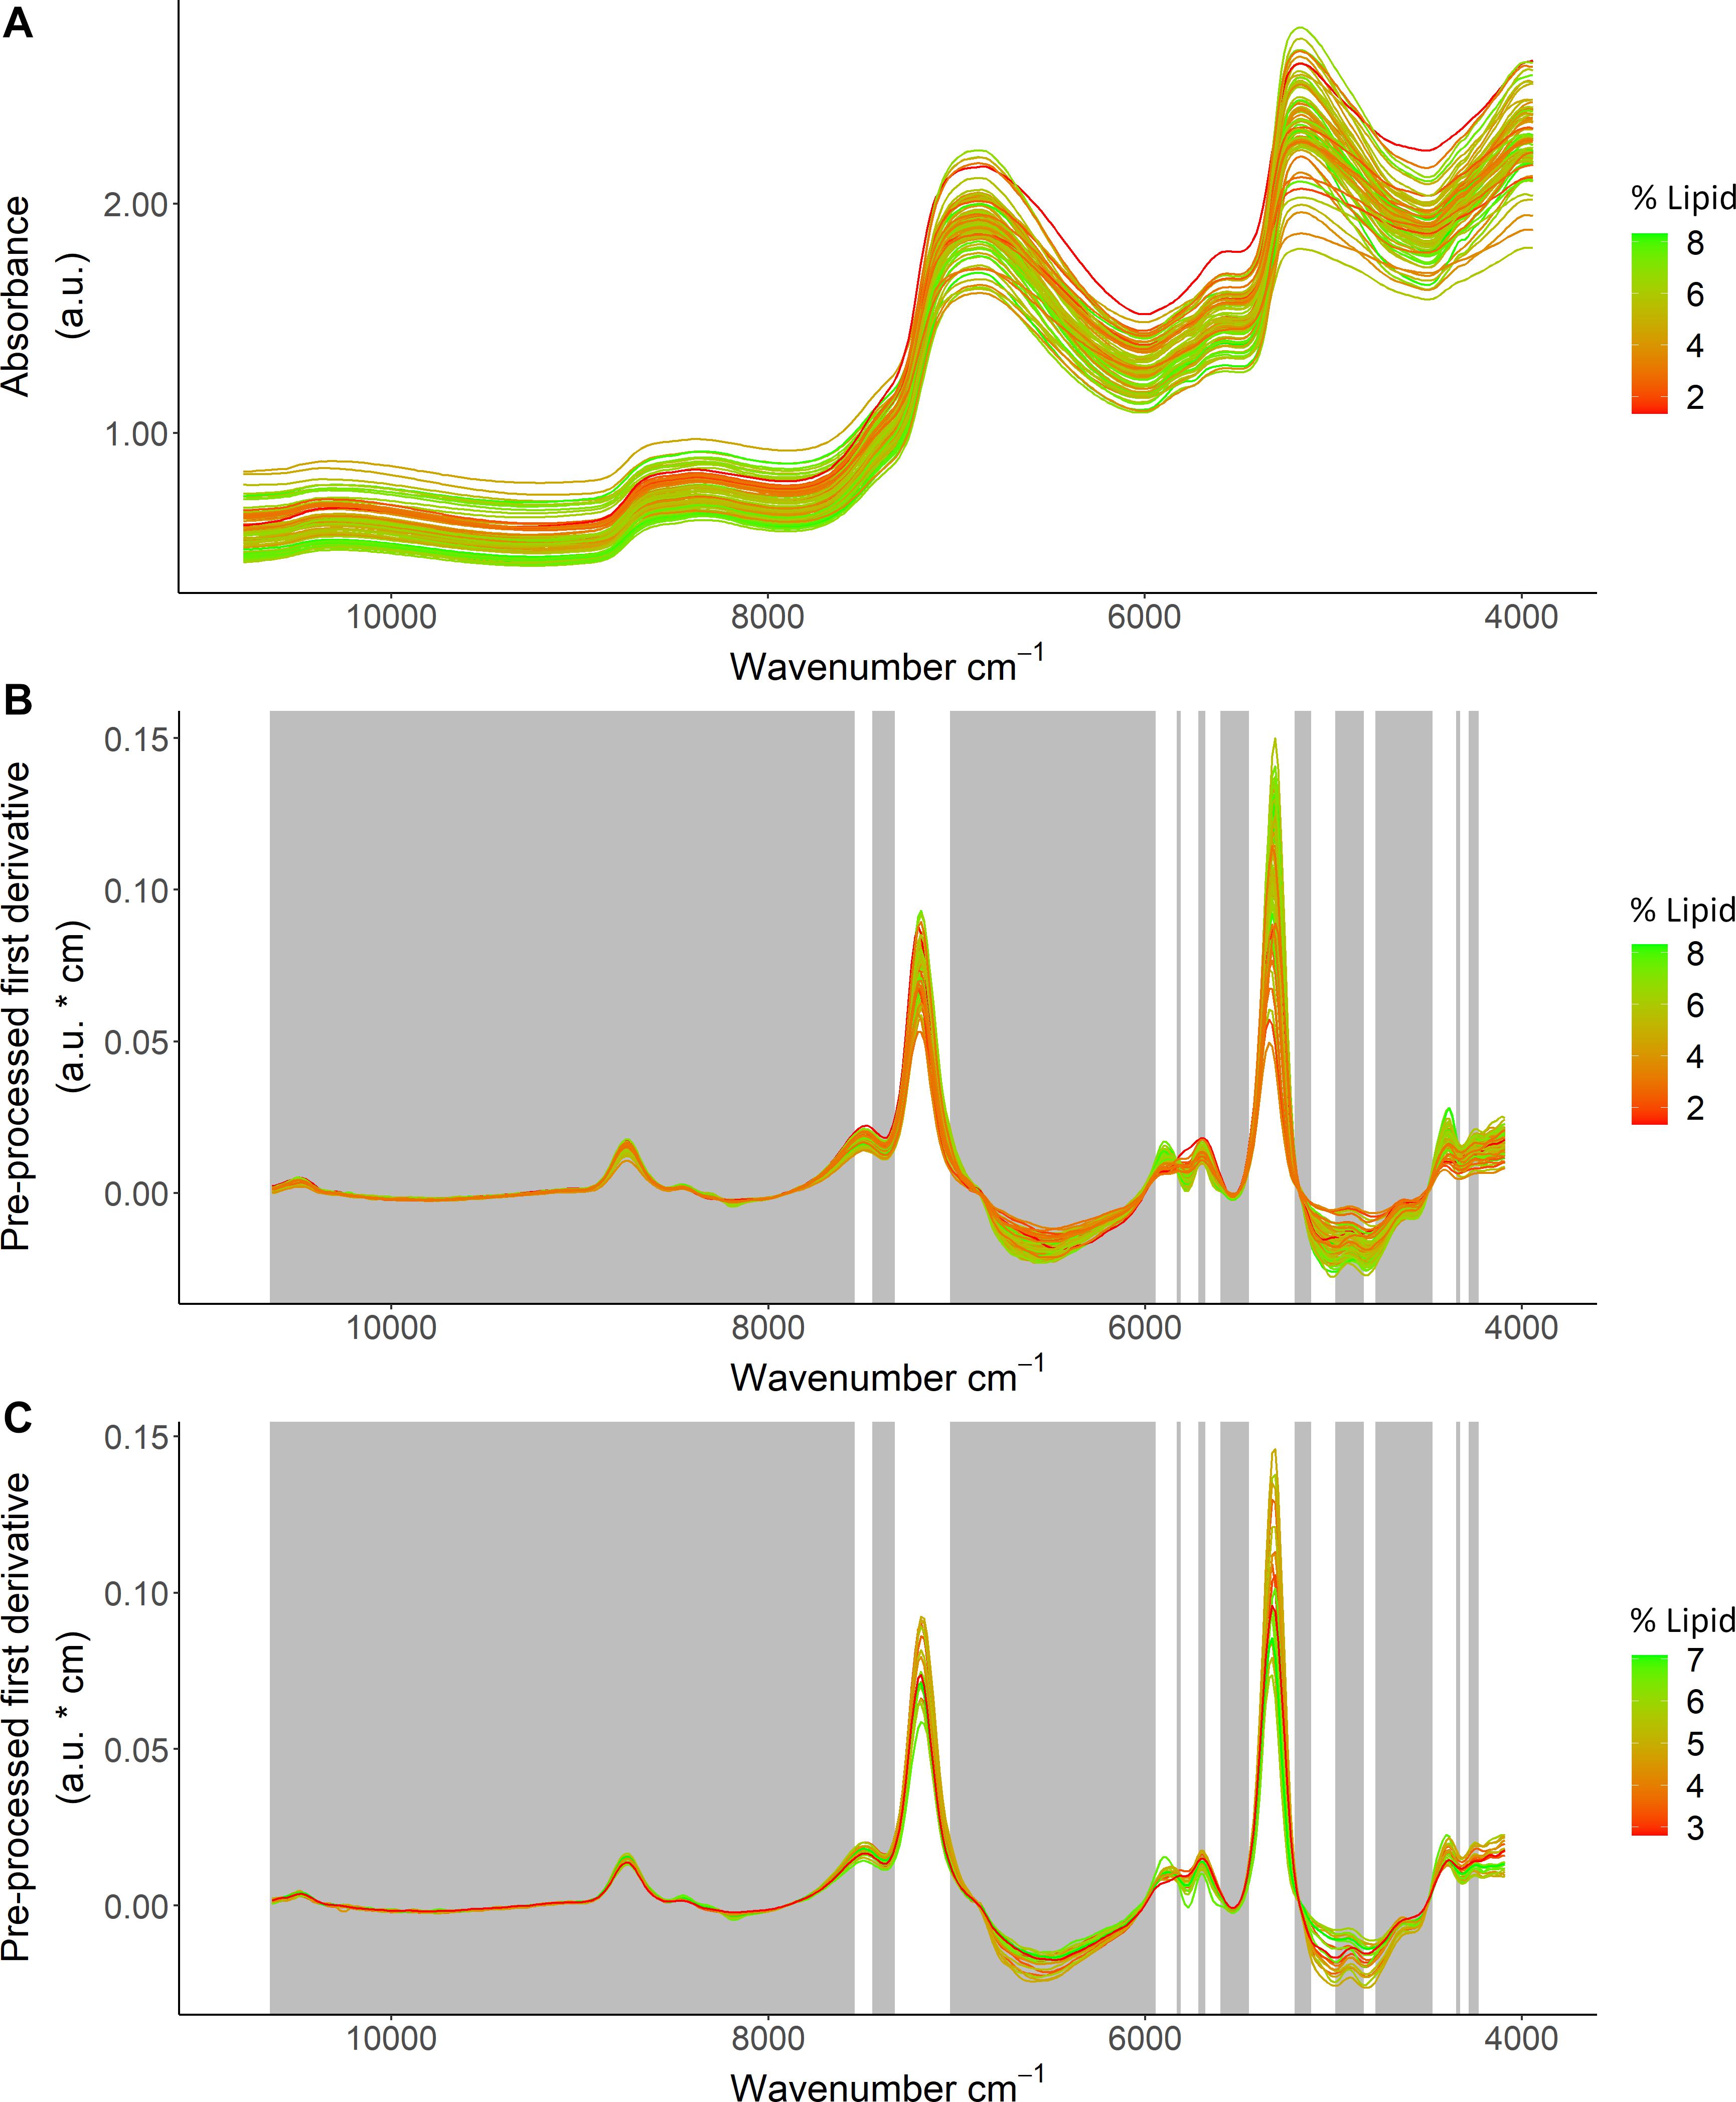
Figure 6. Spectral data from Pacific cod thawed tissue homogenate samples in relation to lipid (% wet mass) showing (A) model calibration data before pre-processing, (B) the calibration dataset, and (C) the test dataset for the best fit calibration model. The calibration and test datasets show absorbance units (a.u.) after applying a Savitzky-Golay filter (first derivative, window size = 19, polynomial order = 7), and the gray regions show variables that were excluded based on variable selection. Color scale indicates lipid (% wet mass) for each specimen.
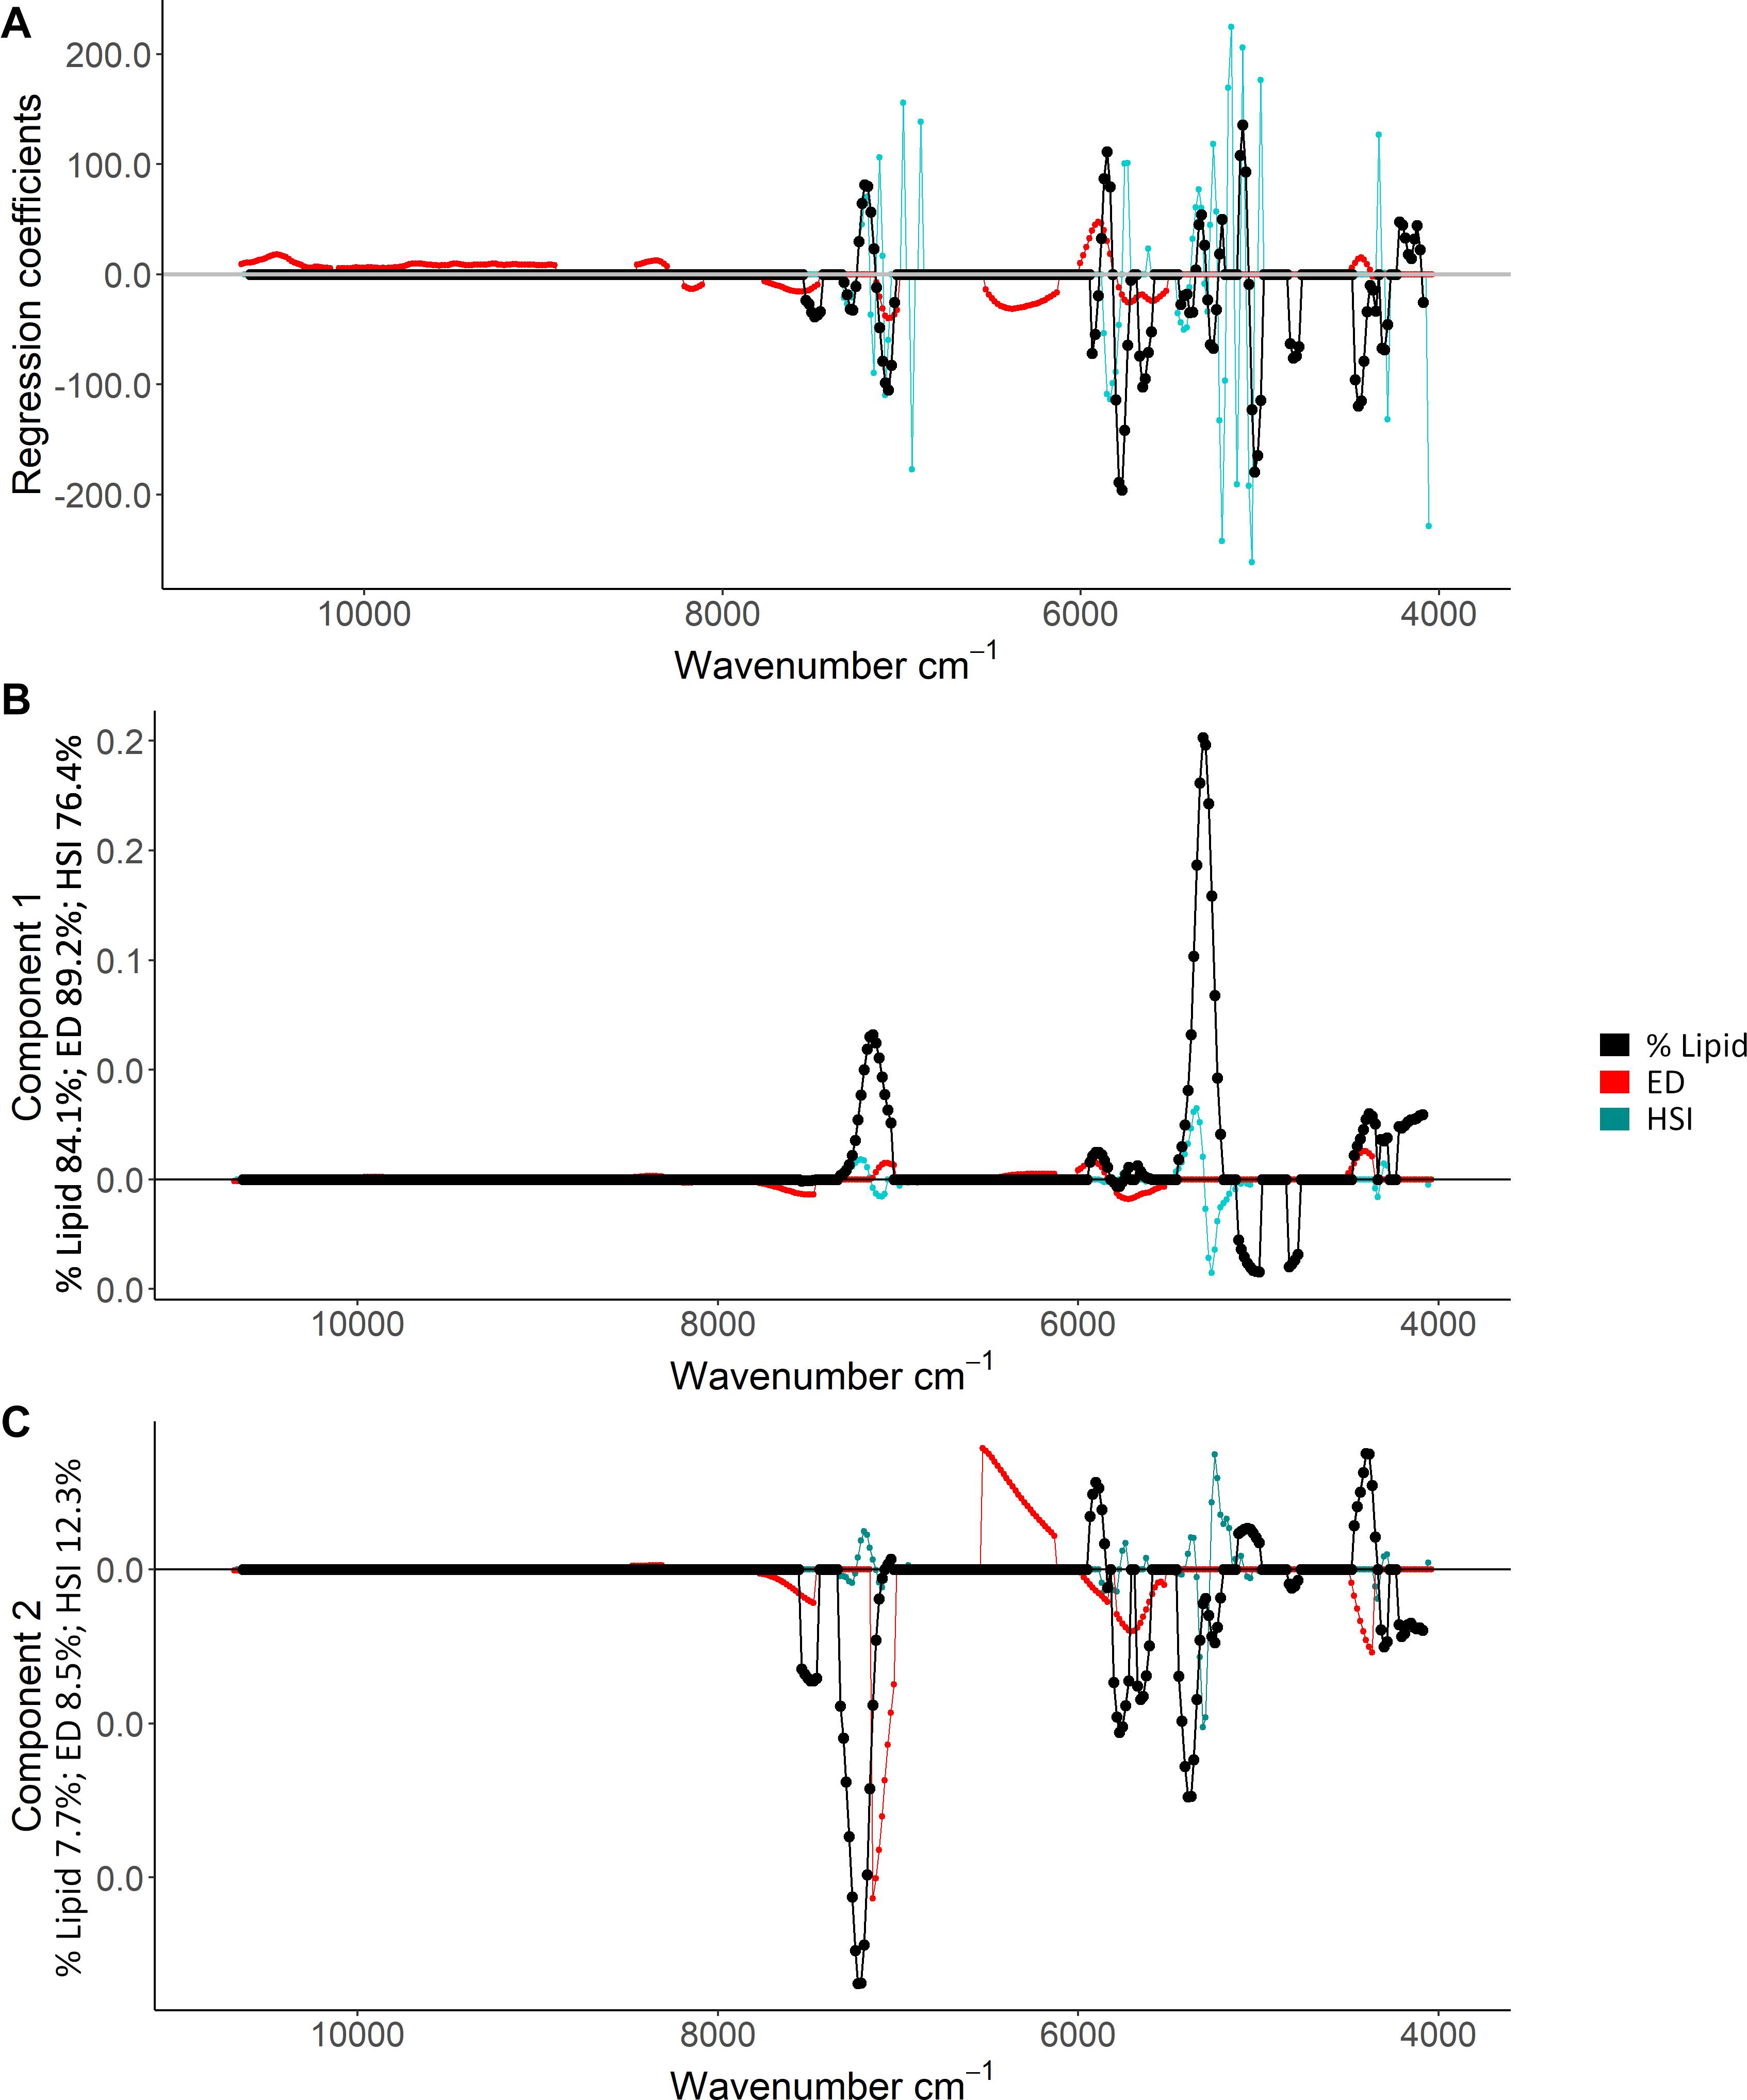
Figure 7. Regression coefficients (A) and component loadings for the first (B) and second (C) components of the best-fit percent (%) lipid (% wet mass), energy density (ED; kJ/g), and hepatosomatic index (HSI) partial least squares regression models. Points show the regression coefficient and loadings, and lines are included to facilitate interpretation. Values of 0 refer to variables that were not included in the models. Index-specific percentage values (%) indicate the percentage of the variability explained by each component.
Discussion
Fourier transform near-infrared spectroscopy provides a new tool for ecological research and fisheries management to rapidly measure fish condition, a key physiological parameter that influences survival and a potential early warning indicator of ecosystem change (Levin and Mollmann, 2014). In contrast to morphometric methods that can be influenced by individual variation in allometry, FT-NIR spectroscopy measures molecular composition of a material that is more comparable to analytical chemistry-based metrics of condition. Indeed, FT-NIR absorbance data were most strongly correlated with lipid content measured from proximate composition, followed by HSI that is also highly correlated with % lipid, and energy density derived from biochemical measurements. Biochemical indices are more informative than morphometrics (Wuenschel et al., 2018), and the reduced error associated with predictions of lipid content from spectral data compared to Fulton’s K and HSI indicates that FT-NIR spectroscopy provides a valuable alternative rapid method to measure condition.
The ability to measure tissue composition using FT-NIR spectroscopy relies on molecular bond vibrations, stretching, and bending to identify signature peaks in the spectra that are most informative for identifying molecules such as lipids (Azizian and Kramer, 2005). Without a priori knowledge of wavenumbers associated with lipids or other molecules that are correlated with body condition in juvenile Pacific cod tissue, calibration model development relied on variable selection to capture regions that are most correlated with the condition indices (Zhao et al., 2015). Spectral regions that were most informative in predicting % lipid, HSI, and energy density in fish corresponded with wavenumbers that have been identified from other materials and non-aquatic organisms to differentiate lipids from non-lipids, as well as details among lipid molecules. For example, spectral peaks from ∼4,372 to 4,236 cm–1 that were prominent for % lipid, HSI, and energy density to a lesser degree and are indicative of C-H stretching and bending modes of lipids (Bik et al., 2020). Similarly, ∼7,375 to 7,150 cm–1 is a second overtone region for C-H bonds and exhibits combination bands for lipids and carbohydrates (Beć et al., 2020). Wavenumbers between 6,000 and 5,600 cm–1 that were informative for calibration models for all three indices are a first overtone region for CH3 and CH = CH found in lipids (Hourant et al., 2000). This region can also be useful for differentiating triacylglycerols (TAGs; Azizian and Kramer, 2005); storage lipids that provide energy during costly life history processes such as life-stage transitions, overwintering, or reproduction (Fraser, 1989; Copeman et al., 2008). Agreement between informative regions for estimating juvenile Pacific cod lipid content and wavenumbers associated with lipids from disparate biological and non-biological materials suggests that FT-NIR methodologies should be successful in measuring lipid content for other fish species and marine organisms, and that further development of the methodology in fisheries has the potential to differentiate between biologically important lipid classes.
Differentiation and similarities among informative spectral regions for calibration models suggest that FT-NIR spectroscopy approaches measured aspects of tissue composition related to biochemical reference data. Wavenumbers between ∼5,400 and 5,000 cm–1 that were prominent in PC analyses as regions of high spectra variability were also informative for % lipid and HSI. These wavenumbers encompass signals from carbohydrates (Beć et al., 2020) and often strong signals from water (Bik et al., 2020). Values between ∼6,500 and 6,000 cm–1 that were retained for only energy density are associated with carbohydrates and lipids (∼6,200–5,800 cm–1), as well as proteins (∼6,400 cm–1; Beć et al., 2020; Bik et al., 2020). These discrepancies concur with differences in tissue components measured by each method. Energy density included energy derived from protein, lipid, and scant carbohydrates in fish tissues. Lipid content (% wet mass) reference data were measures of extracted lipids, and HSI is a measure of lipid rich liver tissue compared to body mass (also wet weight) that was strongly correlated with % lipid reference values. Correspondingly, wavenumbers that were informative for % lipid and HSI primarily reflected lipid-associated regions of the spectra with potential additional information obtained from inverse correlations between lipid and water content in fish tissue (Vollenweider et al., 2011).
In contrast to the other biochemical metrics that are influenced by the amount of lipid in tissue, RNA:DNA reflects recent protein synthesis (Buckley et al., 1999) and was inadequately measured by FT-NIR spectroscopy. Although FT-NIR spectroscopy has been used for DNA detection, DNA extraction steps may be necessary (Ku et al., 2015). Additionally, RNA:DNA is a ratio of nucleic acids and thus may be difficult to resolve with spectral data. Model performance differences among indices and comparisons of molecular signatures retained in the best-fit models indicate that FT-NIR methodologies were most successful at measuring lipid-based indices, suggesting that focusing on a precise group of molecules may improve the efficacy of FT-NIR spectroscopy for physiological and biochemical measurements.
Body condition was correlated with spectral data, but the fish with the highest and lowest condition measurements were often poorly predicted by the calibration models. For % lipid this pattern was evident for a small individual with low lipid content. For energy density a large degree of prediction error was also due to large body size, high condition specimens. This pattern suggests that physiological changes associated with growth and body size may impact relationships among spectra and tissue composition. Total lipid content and lipid allocation among tissue types (liver and muscle) are affected by temperature and potentially by ontogenetic changes in energy storage in Pacific cod and other gadid species (Copeman et al., 2017). Such variability in lipid allocation among tissues could impact calibration models that were developed using homogenized tissues, particularly as fish grow and the ratio of tissue types and energy allocation may both change. For example, if muscle comprises a greater proportion of body tissue and sample volume than liver, this could potentially lead to an underrepresentation of lipids that are stored in the liver when obtaining spectral data. Ontogenetic changes in energy allocation, or the allocation or density of specific lipid classes (ex: TAG, phospholipid, and sterols) that are more readily measured by FT-NIR spectroscopy (Azizian and Kramer, 2005), could also amplify or alter relationships. While homogenized samples were sufficient for developing indices of % lipid in fish tissue, future steps could help to augment the information obtained from spectral data: (1) Measurements from muscle and liver tissue rather than homogenized samples could provide information regarding energy storage while simultaneously improving predictive relationships. (2) Reference data lacked an equitable representation of the smallest and largest specimens that were also poorly predicted by calibration models. A more comprehensive and balanced reference dataset could be used to develop more robust models, or help to identify whether unique calibration models for size or age groups (ex: larval, juvenile, adult), piecewise regressions, or non-linear modeling methods could improve calibration models. Thus, reference data methodology and breadth as well as specimen presentation for scanning are important considerations for maximizing the information from spectral data for new applications of FT-NIR spectroscopy.
Conclusion
Estimates of lipid content in fish tissue from FT-NIR spectroscopy were comparable to analytical chemistry-based metrics and can thus provide rapid, informative data for research, ecosystem-based management, and fisheries stock assessments. Applications of FT-NIR spectroscopy require the development of models for designated measurements. However, this tool has been applied in aquaculture, food quality, medicine, and commercial applications (Liu et al., 2013; Sakudo, 2016; Miller et al., 2019) and is ideally suited for time-series and large scale research efforts for select ecologically or economically important species. Spectroscopy-derived lipid information could provide early warning signs of ecosystem change almost immediately upon disembarking from a vessel, and timely information regarding prey quality, juvenile condition, spawning condition, and other factors that can potentially influence year-class strength and abundance. Promising results with mininimally processed samples and improvements in condition measurements compared to other rapid methods that are often utilized for fisheries monitoring suggest that FT-NIR spectroscopy could complement existing indices of condition to improve the quality and currency of data available to fisheries researchers and managers.
Building from this study, future research should explore the specificity of calibration models among fish species and life stages, the potential to collect data from intact fish or live specimens (Tsai and Wang, 2001; Simon et al., 2016), and further exploration of wavenumber regions associated with lipid classes and fatty acids (Azizian and Kramer, 2005; Liu et al., 2015) that are linked with survival (Copeman et al., 2008). Model accuracy, predictive performance, and the potential for model overfitting can be improved through efforts to reduce noise in the spectral data such as comprehensive reference datasets and refined sample preparation (Helser et al., 2019; Passerotti et al., 2020). Future impactful developments of FT-NIR spectroscopy for ecological and fisheries research can range from biological questions related to material composition (Kleinebecker et al., 2009; Ishigaki et al., 2016), age composition (Helser et al., 2019), or broader ecosystem indices that are affected by changing environmental conditions. The ability to rapidly measure fish lipid content using FT-NIR spectroscopy demonstrates a valuable physiological application for fisheries research and management that will increase data availability and quality, and facilitate long-term monitoring of informative biochemical measurements of body condition.
Data Availability Statement
The raw data supporting the conclusions of this article will be made available by the authors, without undue reservation.
Ethics Statement
The animal study was reviewed and approved by NOAA Alaska Fisheries Science Center.
Author Contributions
TH and EG conceived of the ideas. TH, EG, JV, and AS designed the methodology. JV, AS, FS, and EG collected the data. EG analyzed the data and led the writing of the manuscript. All authors contributed critically to the drafts and gave final approval for publication.
Funding
This research was funded through the North Pacific Research Board Project #1806.
Conflict of Interest
The authors declare that the research was conducted in the absence of any commercial or financial relationships that could be construed as a potential conflict of interest.
Acknowledgments
We would like to thank the scientists at the National Oceanic and Atmospheric Administration’s Alaska Fisheries Science Center for their contributions to this research. We would also like to thank Darcie Neff for her field contributions and expertise; Brenna Groom and Irina Benson for their spectroscopy guidance and expertise; Bryan Cormack for analysis of lipid and RNA:DNA; Sydney King, Tayler Jarvis, and Spencer Lunda for bomb calorimetry; and Matthew Rogers and Andy Whitehouse for their insightful comments on earlier manuscript drafts. The scientific results and conclusions, as well as any views or opinions expressed herein, are those of the authors and do not necessarily reflect those of NOAA or the United States Department of Commerce. Any use of trade, firm, or product names is for descriptive purposes only and does not imply endorsement by the U. S. Government.
Supplementary Material
The Supplementary Material for this article can be found online at: https://www.frontiersin.org/articles/10.3389/fmars.2021.690934/full#supplementary-material
References
Azizian, H., and Kramer, J. K. G. (2005). A rapid method for the quantification of fatty acids in fats and oils with emphasis on trans fatty acids using fourier transform near infrared spectroscopy (FT-NIR). Lipids 40, 855–867. doi: 10.1007/s11745-005-1448-3
Barbeaux, S. J., Holsman, K., and Zador, S. (2020). Marine heatwave stress rest of ecosystem-based fisheries management in the Gulf of Alaska Pacific cod fishery. Front. Mar. Sci. 7:00703. doi: 10.3389/fmars.2020.00703
Baykal, D., Irrechukwu, O., Lin, P.-C., Fritton, K., Spencer, R. G., and Pleshko, N. (2010). Nondestructive assessment of engineered cartilage constructs using near-infrared spectroscopy. Appl. Spectrosc. 64, 1160–1166. doi: 10.1366/000370210792973604
Beć, K. B., and Huck, C. W. (2019). Breakthrough potential in near-infrared spectroscopy: spectra simulation. A review of recent developments. Front. Chem. 7:00048. doi: 10.3389/fchem.2019.00048
Beć, K. B., Grabska, J., and Huck, C. W. (2020). Near-infrared spectroscopy in bio-applications. Molecules 25:2948. doi: 10.3390/molecules25122948
Bik, E., Ishigaki, M., Blat, A., Jasztal, A., Ozaki, Y., Malek, K., et al. (2020). Lipid droplet composition varies based on medaka fish eggs development as revealed by NIR-, MIR-, and Raman imaging. Molecules 25:817. doi: 10.3390/molecules25040817
Buckley, L., Caldarone, E., and Ong, T.-L. (1999). RNA–DNA ratio and other nucleic acid-based indicators for growth and condition of marine fishes. Hydrobiologia 401, 265–277. doi: 10.1023/A:1003798613241
Caldarone, E., Wagner, M., St. Onge-Burns, J., and Buckley, L. J. (2001). Protocol and guide for estimating nucleic acids in larval fish using a fluorescence microplate reader. Woods Hole, MA: Northeast Fisheries Science Center, 22.
Chícharo, M. A., and Chícharo, L. (2008). RNA:DNA ratio and other nucleic acid derived indices in marine ecology. Int. J. Mol. Sci. 9, 1453–1471. doi: 10.3390/ijms9081453
Cohen, M., Mylavarapu, R. S., Bogrekci, I., Lee, W. S., and Clark, M. W. (2007). Reflectance spectroscopy for routine agronomic soil analyses. Soil Sci. 172, 469–485. doi: 10.1097/ss.0b013e31804fa202
Copeman, L. A., Parrish, C. C., Gregory, R. S., and Wells, J. S. (2008). Decreased lipid storage in juvenile Atlantic cod (Gadus morhua) during settlement in cold-water eelgrass habitat. Mar. Biol. 154, 823–832. doi: 10.1007/s00227-008-0975-2
Copeman, L., Laurel, B., Spencer, M., and Sremba, A. (2017). Temperature impacts on lipid allocation among juvenile gadid species at the Pacific Arctic-Boreal interface: an experimental laboratory approach. Mar. Ecol. Prog. Ser. 566, 183–198. doi: 10.3354/meps12040
D’Acqui, L. P., Pucci, A., and Janik, L. J. (2010). Soil properties prediction of western Mediterranean islands with similar climatic environments by means of mid-infrared diffuse reflectance spectroscopy. Eur. J. Soil Sci. 61, 865–876. doi: 10.1111/j.1365-2389.2010.01301.x
Farrés, M., Platikanov, S., Tsakovski, S., and Tauler, R. (2015). Comparison of the variable importance in projection (VIP) and of the selectivity ratio (SR) methods for variable selection and interpretation. J. Chemom. 29, 528–536. doi: 10.1002/cem.2736
Fraser, A. J. (1989). Triacylglycerol content as a condition index for fish, bivalve, and crustacean larvae. Can. J. Fish. Aquat. Sci. 46, 1868–1873. doi: 10.1139/f89-235
Haenlein, M., and Kaplan, A. M. (2004). A beginner’s guide to partial least squares analysis. Underst. Stat. 3, 283–297. doi: 10.1207/s15328031us0304_4
Helser, T. E., Benson, I., Erickson, J., Healy, J., Kastelle, C., and Short, J. A. (2019). A transformative approach to ageing fish otoliths using Fourier transform near infrared spectroscopy: a case study of eastern Bering Sea walleye pollock (Gadus chalcogrammus). Can. J. Fish. Aquat. Sci. 76, 780–789. doi: 10.1139/cjfas-2018-0112
Hourant, P., Baeten, V., Morales, M. T., Meurens, M., and Aparicio, R. (2000). Oil and fat classification by selected bands of near-infrared spectroscopy. Appl. Spectrosc. 54, 1168–1174. doi: 10.1366/0003702001950733
Ishigaki, M., Kawasaki, S., Ishikawa, D., and Ozaki, Y. (2016). Near-infrared spectroscopy and imaging studies of fertilized fish eggs: in vivo monitoring of egg growth at the molecular level. Sci. Rep. 6:20066. doi: 10.1038/srep20066
Kleinebecker, T., Schmidt, S. R., Fritz, C., Smolders, A. J. P., and Hölzel, N. (2009). Prediction of δ13C and δ15N in plant tissues with near-infrared reflectance spectroscopy. New Phytol. 184, 732–739. doi: 10.1111/j.1469-8137.2009.02995.x
Ku, T., Liu, Y. F., Gao, J. L., and Li, S. H. (2015). Near-infrared Spectroscopy applications in the quantitative determination of bovine genomic DNA content from milk. FST 3, 49–55. doi: 10.13189/fst.2015.030401
Kucheryavskiy, S. (2020). mdatools – R package for chemometrics. Chemom. Intell. Lab. Syst. 198:103937. doi: 10.1016/j.chemolab.2020.103937
Levin, P. S., and Mollmann, C. (2014). Marine ecosystem regime shifts: challenges and opportunities for ecosystem-based management. Philos. Trans. R. Soc. B Biol. Sci. 370, 20130275–20130275. doi: 10.1098/rstb.2013.0275
Liu, B., Liu, J., Chen, T., Yang, B., Jiang, Y., Wei, D., et al. (2015). Rapid Characterization of Fatty Acids in Oleaginous Microalgae by Near-Infrared Spectroscopy. Int. J. Mol. Sci. 16, 7045–7056. doi: 10.3390/ijms16047045
Liu, D., Zeng, X.-A., and Sun, D.-W. (2013). NIR Spectroscopy and Imaging Techniques for Evaluation of Fish Quality—A Review. Appl. Spectrosc. Rev. 48:775579. doi: 10.1080/05704928.2013.775579
Lu, X., Webb, M., Talbott, M., Van Eenennaam, J., Palumbo, A., Linares-Casenave, J., et al. (2010). Distinguishing ovarian maturity of farmed white sturgeon (Acipenser transmontanus) by Fourier transform infrared spectroscopy: a potential tool for caviar production management. J. Agric. Food Chem. 58, 4056–4064. doi: 10.1021/jf9038502
Marteinsdottir, G., and Begg, G. (2002). Essential relationships incorporating the influence of age, size and condition on variables required for estimation of reproductive potential in Atlantic cod Gadus morhua. Mar. Ecol. Prog. Ser. 235, 235–256. doi: 10.3354/meps235235
Mevik, B.-H., and Wehrens, R. (2007). The pls Package: principal component and partial least squares regression. R. J. Stat. Softw. 18:i02. doi: 10.18637/jss.v018.i02
Miller, M. R., Puddick, J., Symonds, J. E., Walker, S. P., and Tian, H. (2019). Application of a Fourier transform—near infrared reflectance spectroscopy method for the rapid proximate analysis of the greenshell mussel (Perna canaliculus) and king (Chinook) salmon (Oncorhynchus tshawytscha). Aquacult. Res. 50, 1668–1677. doi: 10.1111/are.14049
Möckel, T., Dalmayne, J., Schmid, B. C., Prentice, H. C., and Hall, K. (2016). Airborne Hyperspectral Data Predict Fine-Scale Plant Species Diversity in Grazed Dry Grasslands. Remote Sens. 8:133. doi: 10.3390/rs8020133
Oksanen, J., Blanchet, F. G., Friendly, M., Kindt, R., Legendre, P., McGlinn, D., et al. (2016). vegan: Community Ecology Package. R package version 2.4-3. Vienna: R Foundation for Statistical Computing.
Passerotti, M. S., Helser, T. E., Benson, I. M., Barnett, B. K., Ballenger, J. C., Bubley, W. J., et al. (2020). Age estimation of red snapper (Lutjanus campechanus) using FT-NIR spectroscopy: feasibility of application to production ageing for management. ICES J. Mar. Sci. 2020:fsaa131. doi: 10.1093/icesjms/fsaa131
Piñeiro, G., Perelman, S., Guerschman, J. P., and Paruelo, J. M. (2008). How to evaluate models: Observed vs. predicted or predicted vs. observed? Ecol. Model. 216, 316–322. doi: 10.1016/j.ecolmodel.2008.05.006
R Core Team (2020). R: A Language and Environment for Statistical Computing. Vienna: R Foundation for Statistical Computing.
Rinnan, Å, Berg, F., and Engelsen, S. B. (2009). Review of the most common pre-processing techniques for near-infrared spectra. TrAC Trends Anal. Chem. 28, 1201–1222. doi: 10.1016/j.trac.2009.07.007
Sakudo, A. (2016). Near-infrared spectroscopy for medical applications: Current status and future perspectives. Clin. Chim. Acta 455, 181–188. doi: 10.1016/j.cca.2016.02.009
Simon, C. J., Rodemann, T., and Carter, C. G. (2016). Near-Infrared Spectroscopy as a Novel Non-Invasive Tool to Assess Spiny Lobster Nutritional Condition. PLoS One 11:0159671. doi: 10.1371/journal.pone.0159671
Simpson, S. C., Eagleton, M. P., Olson, J. V., Harrington, G. A., and Kelly, S. R. (2017). Final Essential Fish Habitat (EFH) 5-year Review, Summary Report: 2010 through 2015. U S Dep. Commer. NOAA Tech. Memo NMFS-FAKR 15:115. doi: 10.7289/V5/TM-F/AKR-15
Sreenivasan, A. (2011). Nucleic Acid Ratios as an Index of Growth and Nutritional Ecology in Pacific Cod (Gadus macrocephalus), Walleye Pollock (Theragra chalcogramma), and Pacific Herring (Clupea pallasii). Alaska: University of Alaska Fairbanks.
Townsend, H., Harvey, C. J., deReynier, Y., Davis, D., Zador, S. G., Gaichas, S., et al. (2019). Progress on implementing ecosystem-based fisheries management in the United States through the use of ecosystem models and analysis. Front. Mar. Sci. 6:00641. doi: 10.3389/fmars.2019.00641
Tsai, C.-L., and Wang, J.-C. C. W.-J. (2001). Near-infrared absorption property of biological soft tissue constituents. J. Med. Biol. Eng. 21:7.
Van Handel, E. (1985). Rapid determination of glycogen and sugars in mosquitoes. J. Am. Mosq. Control Assoc. 1, 302–304.
Vollenweider, J. J., Heintz, R. A., Schaufler, L., and Bradshaw, R. (2011). Seasonal cycles in whole-body proximate composition and energy content of forage fish vary with water depth. Mar. Biol. 158, 413–427. doi: 10.1007/s00227-010-1569-3
Wedding, B. B., Forrest, A. J., Wright, C., Grauf, S., Exley, P., and Poole, S. E. (2014). A novel method for the age estimation of Saddletail snapper (Lutjanus malabaricus) using Fourier transform-near infrared (FT-NIR) spectroscopy. Mar. Freshw. Res. 65:894. doi: 10.1071/MF13244
Wold, J. P., and Isaksson, T. (1997). Non-destructive determination of fat and moisture in whole Atlantic salmon by near-infrared diffuse spectroscopy. J. Food Sci. 62, 734–736. doi: 10.1111/j.1365-2621.1997.tb15446.x
Wuenschel, M. J., McElroy, W. D., Oliveira, K., and McBride, R. S. (2018). Measuring fish condition: an evaluation of new and old metrics for three species with contrasting life histories. Can. J. Fish. Aquat. Sci. 2018:0076. doi: 10.1139/cjfas-2018-0076
Zador, S. G., Holsman, K. K., Aydin, K. Y., and Gaichas, S. K. (2017). Ecosystem considerations in Alaska: the value of qualitative assessments. ICES J. Mar. Sci. 74, 421–430. doi: 10.1093/icesjms/fsw144
Keywords: energetics, fish body condition, fisheries management, Fourier transform near-infrared spectroscopy, lipid, Pacific cod
Citation: Goldstein ED, Helser TE, Vollenweider JJ, Sreenivasan A and Sewall FF (2021) Rapid and Reliable Assessment of Fish Physiological Condition for Fisheries Research and Management Using Fourier Transform Near-Infrared Spectroscopy. Front. Mar. Sci. 8:690934. doi: 10.3389/fmars.2021.690934
Received: 06 April 2021; Accepted: 25 June 2021;
Published: 15 July 2021.
Edited by:
Carlo C. Lazado, Norwegian Institute of Food, Fisheries and Aquaculture Research (Nofima), NorwayReviewed by:
Panmanas Sirisomboon, King Mongkut’s Institute of Technology Ladkrabang, ThailandUlrike Böcker, Norwegian Institute of Food, Fisheries and Aquaculture Research (Nofima), Norway
Carrie Kim Vance, Mississippi State University, United States
Mariana Santos-Rivera, Mississippi State University, United States
Copyright © 2021 Goldstein, Helser, Vollenweider, Sreenivasan and Sewall. This is an open-access article distributed under the terms of the Creative Commons Attribution License (CC BY). The use, distribution or reproduction in other forums is permitted, provided the original author(s) and the copyright owner(s) are credited and that the original publication in this journal is cited, in accordance with accepted academic practice. No use, distribution or reproduction is permitted which does not comply with these terms.
*Correspondence: Esther D. Goldstein, RXN0aGVyLkdvbGRzdGVpbkBub2FhLmdvdg==