
95% of researchers rate our articles as excellent or good
Learn more about the work of our research integrity team to safeguard the quality of each article we publish.
Find out more
ORIGINAL RESEARCH article
Front. Mar. Sci. , 01 July 2021
Sec. Marine Ecosystem Ecology
Volume 8 - 2021 | https://doi.org/10.3389/fmars.2021.689860
This article is part of the Research Topic Before-After Control-Impact (BACI) Studies in the Ocean View all 17 articles
Anthropogenic underwater noise has been identified as one of the main pressures on the marine environment. Considerable research efforts have been made to quantify acoustic soundscapes on different spatial and temporal scales in order to identify trends and investigate how this may impact the marine environment. Measures to reduce noise input into the seas from anthropogenic sources are under discussion, including the reduction of vessel speed or re-routing of shipping lanes. The decline in maritime transport as a consequence of the Covid-19 pandemic provides an opportunity to examine the associated extent of noise reduction. Here, we present the results of a “Before-After-Control-Impact” study where we analyzed acoustic data sets from two monitoring stations in the German Baltic Sea. Data were collected between 2013 and 2020. As part of an international initiative, coordinated by the International Quiet Ocean Experiment, monthly statistics (20 average sound pressure levels per 1/3 octave bands) were calculated from acoustic data collected during the pre-pandemic period (2013–2019), and were compared with data from the year 2020, during the Covid-19 pandemic. To account for varying natural conditions the measurements were sorted into categories of same prevailing sea state. Through this approach, measurements with equivalent natural noise impact are compared and any resulting differences are likely due to the variability in the anthropogenic noise. A decline in sound pressure of 13% (1.2 dB) for low frequencies (10 Hz–1 kHz) was observed at both stations, which corresponds to the reduced level of shipping activity.
Since its global onset in 2020, the Covid-19 pandemic has led to exceptional developments around the world. Efforts, taken to slow down the outbreak have led to shutdowns in public life and economic activity and a reduction in human mobility (Gibney, 2020). This change in anthropogenic activities provides a rare opportunity to study man-made stressors on the environment on a global scale. Maritime shipping, one of the stressors on the marine environment, was directly affected by the pandemic due to travel restrictions and the decline of commercial shipping. The sharpest decline in maritime mobility was observed from March to June 2020, when severe restrictions were in place globally (Millefiori et al., 2020). Vessel traffic decreased in nearly 44.3% of the global ocean and in 77.5% of national waters during April 2020 (March et al., 2020). Consequently, the pressures associated with shipping, such as greenhouse gas emissions and underwater noise, were widely expected to decrease (Leaper, 2019).
Anthropogenic underwater noise has long been identified as one of the main pressures on the marine environment, with shipping noise mainly contributing to the ambient soundscape at lower frequencies; up to 500 Hz (Hildebrand, 2009) or up to 1 kHz (Merchant et al., 2012). Sounds in this frequency range experience little transmission loss due to a low absorption rate and can thus propagate over long distances, potentially affecting marine life over a wide area (Urick, 1983).
We show that the maritime mobility has also decreased in the Baltic German coastal waters. Further, we investigate whether the soundscape has changed correspondingly and thus sound pressure levels (SPLs) have decreased in lower frequency bands (<1 kHz).
Recordings from two underwater sound monitoring stations were used to assess the acoustic effects resulting from the economic impact of Covid-19. Both stations were initially set up as part of the Baltic Sea Information on the Acoustic Soundscape (BIAS) project from December 2013 to spring 2015. From 2017 to 2018, measurements were resumed as part of the BSH (Bundesamt für Seeschifffahrt und Hydrographie) project PIMO (“Pilot-Monitoring von Unterwasserschalleinträgen in die deutschen Meere”) funded by the Federal Environmental Agency (UBA). Within the PIMO project, the concept of a long-term acoustic monitoring of the German EEZ in the context of the implementation of the Marine Strategy Framework Directive (MSFD) was developed (Fischer et al., 2019).
Since 2018, both stations have been are operated as part of the German national monitoring of underwater noise, required by the MSFD and conducted by the BSH.
As one of the MSFD’s descriptors of Good Environmental State (GES), Descriptor 11 (D11) considers the energy introduced into the marine environment, which includes underwater sound. This sound shall not be at levels, that adversely affect the marine environment (European Commission (EC), 2008). The Technical Sub-Group on Underwater Noise (TSG Noise) has provided guidance on how the underwater sound should be monitored, indicating, that at least the two one-Third-Octave Bands (TOB) with center frequencies at 63and at 125 Hz need to be recorded (Dekeling et al., 2014). The two TOBs were chosen as a good proxies for the low-frequency sound generated by shipping activities, although this decision has led to disputes in the past (e.g., Hermannsen et al., 2014).
Fehmarnbelt (FEB), one of 36 monitoring stations contributing to the BIAS project, was the station which experienced the heaviest shipping traffic. It recorded the highest SPLs of all stations in 2014. Although Arkona (ARK) recorded substantially lower SPLs, it also lies in an area influenced by intense shipping pressure (Mustonen et al., 2019).
Due to changing responsibilities, funding opportunities and challenges of underwater sound monitoring, the data time series at both stations is interrupted. Nevertheless, the available acoustic data sets, collected between2013 and 2020, present an opportunity for a Before-After-Control-Impact (BACI) study on how the Covid-19 pandemic has affected the soundscape in the German Baltic Sea. It is conceivable that the averaged low-frequency SPLs at these two stations, which are dominated by vessel noise, may show decreases as the prevalence of shipping decreased during the pandemic.
In spring 2020 the International Quiet Ocean Experiment (IQOE) commenced an initiative to convene all underwater acoustic measuring institutions around the globe to contribute to a coordinated research effort on the effects of Covid-19 on the soundscape of the global ocean (Tyack et al., 2021). The study presented here is a contribution to this overall research effort.
Here, we examine whether maritime mobility decreased in the Baltic German coastal waters following the onset of the pandemic in 2020. Then, we used acoustic recordings from two underwater sound monitoring stations, recorded before and after March 1, 2020 to investigate whether the soundscape changed correspondingly and whether SPLs have decreased in lower frequency bands (<1 kHz) resulting from the economic impact of Covid-19.
We discuss how our findings relate to the results of an earlier BACI study, which investigated the change of the soundscape during the first weeks of the Covid pandemic at the Pacific coast of Canada (Thomson and Barclay, 2020) with a BACI study on the impact of Covid-19 on the soundscape at Montery Bay National Marine Sanctuary (Ryan et al., 2021); and with a BACI study that analyzed the acoustic effects of a voluntary commercial vessel slowdown trial in the Haro Strait (Joy et al., 2019).
Data were collected at two locations in the German Baltic Sea: The FEB station and the ARK station. Figure 1A shows the position of the measurement stations and typical traffic conditions for this part of the Baltic Sea (AIS data provided by EMODnet Human Activities (EHA), 2019). The FEB station is located in a coastal area, only 6 km north of the island of Fehmarn in the center of the busy traffic separation scheme “Fehmarnbelt.” The ARK station is located northeast of the island of Rügen—an area with less shipping activity. Both stations belong to the MARNET measuring network, managed by BSH, that measures temperature, salinity and surface currents in the German Bight and the western Baltic Sea (BSH, 2021). The Baltic Sea is a semi-enclosed basin, separated from the North Sea and the wider North Atlantic Ocean by the Kattegat and Skagerrak and the islands of Denmark (or Danish Straits). There is little tide, and wave action is limited, which tends to result in highly stratified physical oceanographic conditions with strong vertical salinity and temperature gradients (Dargahi et al., 2017). In summer stratification is strongest. Due to stronger solar radiation, warmer air temperatures and less wind-induced mixing a thermocline develops, separating the warm upper layer from the colder lower layers (Elken and Matthäus, 2008). In winter, the thermocline vanishes due to mixing processes induced by stronger winds, buoyancy loss from heat exchange with colder air temperatures and less solar radiation. The stratification in summer leads to stronger refraction and reflection of sound waves. Sound travels further during winter periods, when the water column is homogeneously mixed.
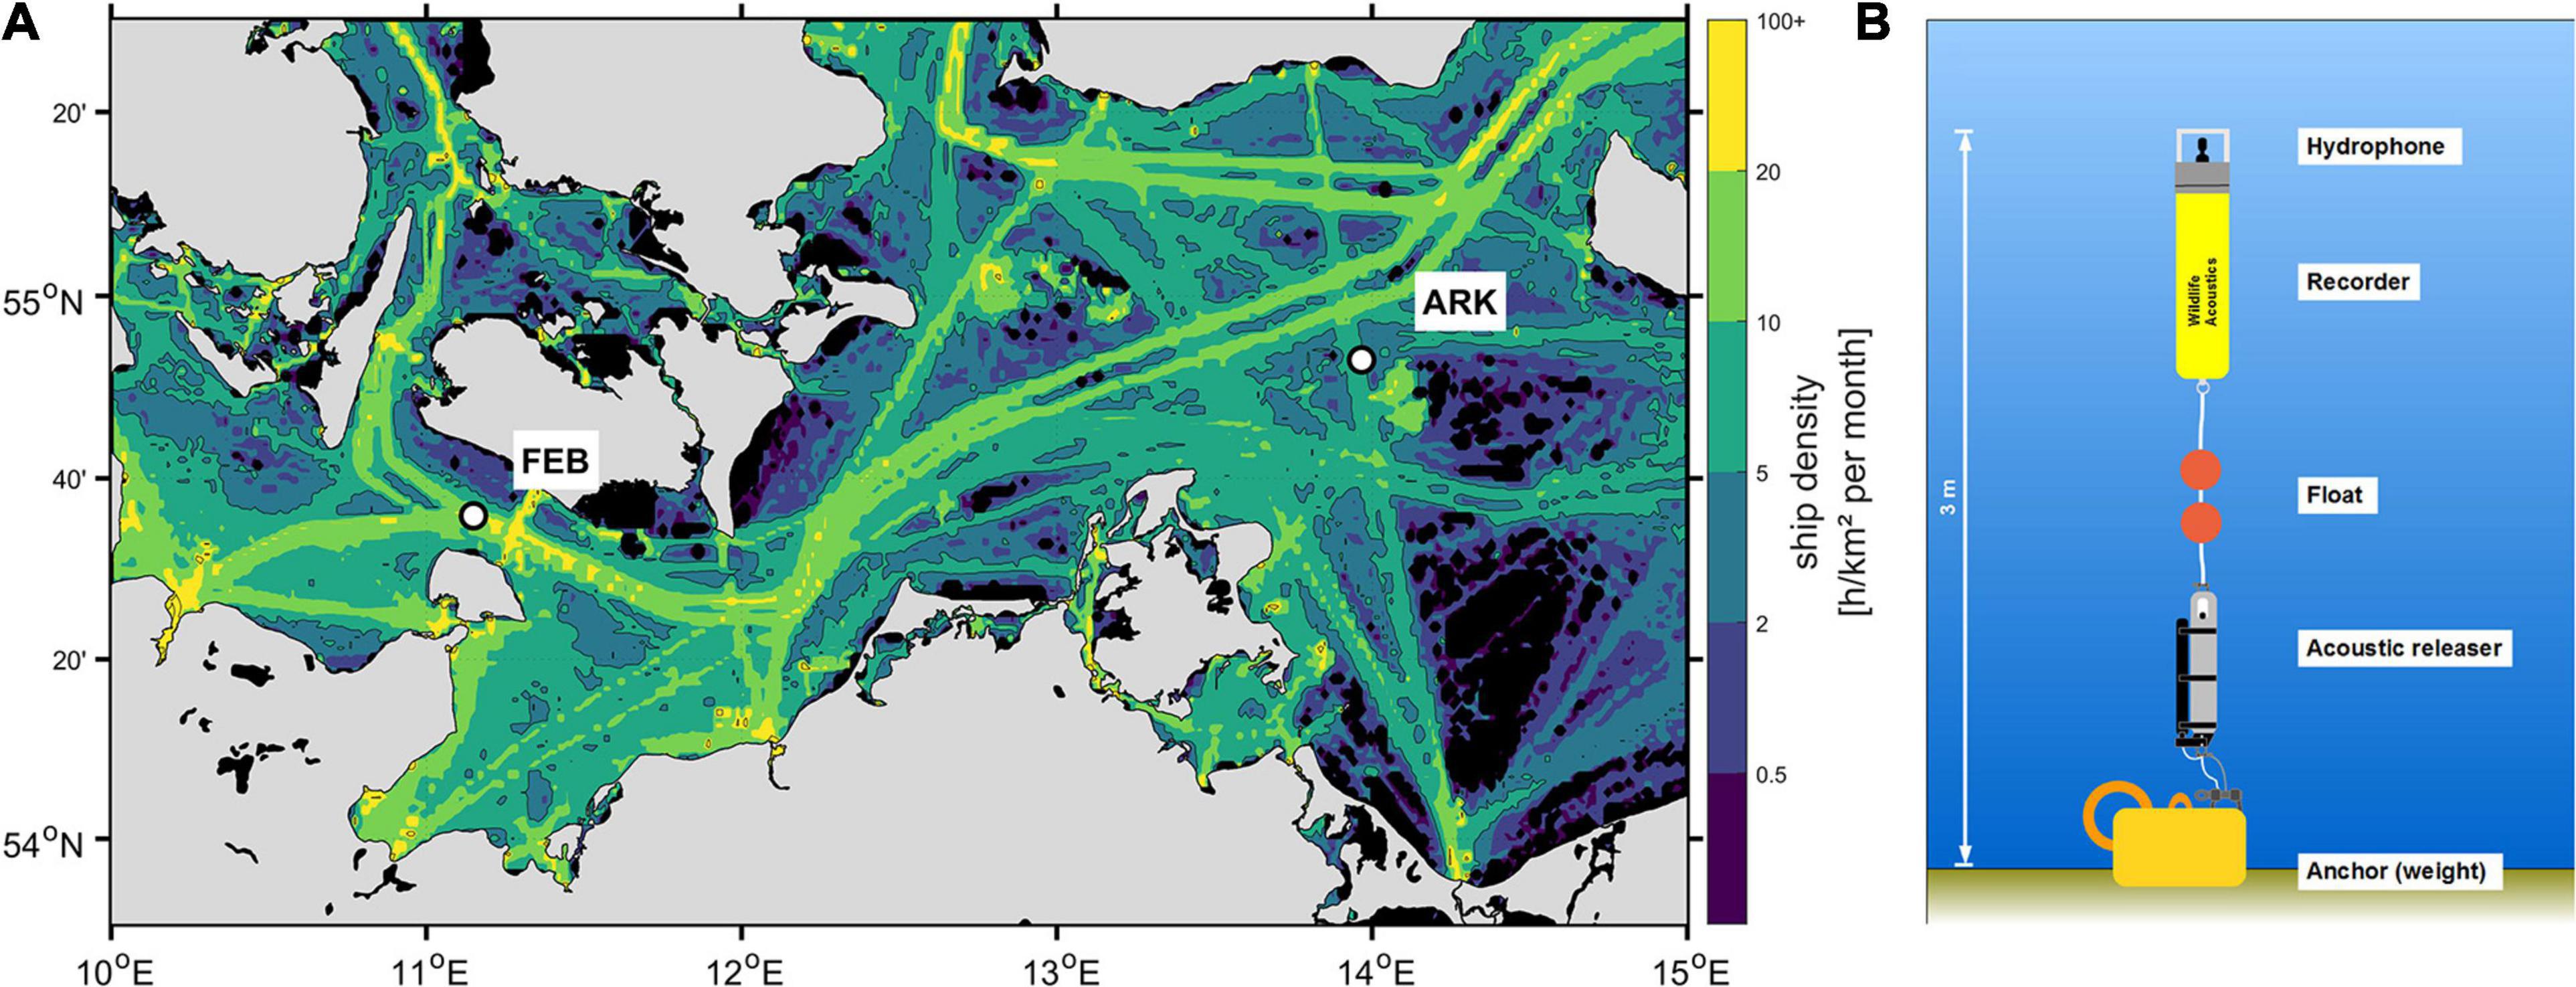
Figure 1. Position (A) and station design (B) of FEB and ARK Measurement Station with AIS total density for May 2020 (A). Ship density is expressed as time (in h) that ships have spent per km2-grid cell per month (AIS data provided by EMODnet Human Activities (EHA), 2019). Black areas indicate no data availability.
The autonomous recorder at FEB is installed ca. 100 m from the MARNET oceanographic buoy, which is also one of the navigational buoys marking the “Fehmarnbelt” traffic separation scheme. The ferry connection from Puttgarden to Rødby is ca. 14 km away, with usually three to four operating ferries and departures from both harbors every 30 min. The recorder, together with the hydrophone, is positioned 3 m above the seafloor in approximately 25 m depth. The mooring is attached to an achor weight and orientated vertically in the water column using appropriate buoyancy (Figure 1B). Typical measurement durations for these stations are 3–6 months, after which the device needs to be recovered for data download. In the BIAS project it was found that, on average, two vessels were present in a 5 km radius at any given time and more than eleven vessels (including ferries) were present in a 20 km radius (Mustonen et al., 2019). Due to the narrow Danish straits connecting the Baltic Sea and the North Sea the tidal influence is negligible. Although wind-driven surface currents can reach current speeds above 1.2 m/s, currents near the seabed rarely exceed 0.4 m/s (Brøker et al., 2014). This can cause significant flow noise impact on very low frequency bands up to 50 Hz, but was not further taken into account in this study (e.g., Haxel et al., 2013).
Arkona station is located between the Danish island of Bornholm and the German island of Rügen. Although compared to FEB, this station is located in a rather low-traffic location, it was still among the noisiest stations monitored during the BIAS project, and data at this site were clearly influenced by ship noise. ARK’s station setup is identical to the setup at FEB (Figure 1B). Water depth at this station is about 45 m. Compared with FEB, the ARK monitoring location represents a more remote location of the open Baltic Sea. Open sea conditions occur more prevalently here, including higher sea states and stronger winds. During the monitoring in 2014, at least one vessel was found to be within a 10 km radius at all times (Mustonen et al., 2019). The construction and operation of offshore wind farms as well as the construction of gas pipelines are additional anthropogenic contributions to the ambient soundscape in this area. Flow noise is not considered to strongly influence sound recordings at ARK. Currents near the seafloor rarely exceed 0.1 m/s (Outzen, 2021).
Seasonal variations in SPLs are expected at both stations due to variability in physical oceanography and meteorology.
The acoustic data were collected using SM2M recorders (Wildlife Acoustics) fitted with “Low-Noise” hydrophones (HTI) from 2013 to 2015, and SM3M recorders (Wildlife Acoustics) fitted with “Standard” hydrophones (HTI) after 2016. The choice for low-noise hydrophones (from 2013 to 2015) instead of standard hydrophones (since 2016) had a considerable effect on the measurements, as the noise floor of low-noise hydrophones is substantially lower for high frequencies.
The difference in sensitivity can be up to 10 dB for frequencies higher than 1 kHz (Wildlife Acoustics (WA), 2017). Therefore, in this study, the comparison at high frequencies is associated with increased uncertainties. Far lower SPLs are measured at high frequencies using low-noise hydrophones instead of standard hydrophones. Since high frequencies are less relevant for ship noise comparisons, in this study the focus is on lower frequencies (<1 kHz). A comparison of the low frequencies (dominated by ship noise) remains possible, as these are less affected by the choice of hydrophone.
All data were recorded using duty cycles of 15/45 min on/off and the sample rate was set at 32,000 samples per second, covering the frequency range up to 12.5 kHz. The hydrophones were mounted directly on the recorder body, so the system sensitivity was prone to effects such as body resonance and scattering from the flat surface (Crawford et al., 2020). However, since the housing of the instrument is only 91 cm long and has a diameter of 16.8 cm, these effects are not expected to significantly influence the beam pattern below 1 kHz (wavelength of 1.5 m). Instead, bottom reflections and scattering should have much larger effects.
Before each deployment, the systems were calibrated using an acoustic calibrator at 125 Hz (IEC, 2019). A laboratory calibration of the full spectrum could not be performed, although this would have been preferred since the frequency response curves of both the low-noise and the standard hydrophone are not flat (Wildlife Acoustics (WA), 2017). Given the strong roll-off in the sensitivity curve below 100 Hz SPLs in this frequency range are likely to be higher than those presented in this study, for both hydrophone types.
All recordings were processed to mean-square SPLs for TOBs—1/3-octave levels (TOLs)— using the tool “BSoundH” developed by Fraunhofer IDMT during the BSH project “Sound Mapping.” The TOLs were computed with an integrated filter bank over time windows of 20 seconds.
To make the comparison more independent of natural changes due to seasonal variations, we compared the same calendar months from the pre-Covid (before March 2020) and during-Covid (March 2020 onward) period. If fewer than 14 days of data were available for a particular month, that month was not considered to be representative and was excluded from the analysis.
As a consequence, fewer months were available for comparison at the two stations (due to the lack of completeness of monthly data), but the resulting statistics are more robust. In total 13,329 individual recordings are available for FEB and 15,257 recordings are available for ARK (see Table 1).

Table 1. Available recordings before/and after the onset of the Covid-19 pandemic per calendar month and station; N/A indicates months, where no comparison was possible due to lack of data (2013–2020).
To analyze the possible changes in the ship noise levels, two broadband levels—one below (10 Hz–1 kHz) and one above 1 kHz (1–12.5 kHz) are compared within the defined time periods before and after the Covid-19 onset. This frequency separation is based on the premise that vessel-emitted noise dominates in the lower frequency range. The limit for frequency bands, dominated by vessel noise, was set to 1 kHz in accordance with (Merchant et al., 2012). All frequencies from 1 to 12.5 kHz are expected to be mostly dominated by natural wind-driven noise (Hildebrand, 2009). To obtain these two broadband levels, the TOLs are computed for 20-s blocks and summed up in the respective frequency range, using quantities as described in Merchant et al. (2014). The monthly median broadband levels are compared in the following.
For a more detailed analysis in the frequency and time domain, the TOLs and the percentiles of the lower frequency band (10 Hz–1 kHz) for each month after March 2020 were compared with previous years.
To minimize the wind noise effects on our comparisons we additionally compared noise levels of the same sea state in the same calendar month across years. In this way only periods with the same natural conditions were compared with each other.
While comparing the same calendar months has the effect of removing some artifacts of seasonal variability, sea conditions during calendar months from different years may still differ due to finer scale variability in natural conditions. To consider this, the study compared periods of identical sea states within the same calendar month, before and after the Covid-19 onset. Wave height information for both stations was extracted from the European Wave Model (EWAM; WAMDI Group, 1988). This is an ocean wave forecast model for Europe based on the atmospheric model Icosahedral Non-hydrostatic Weather and Climate Model (ICON; Reinert et al., 2021). Data from both EWAM and ICON, were provided by the German Meteorological Service (DWD). The EWAM model was chosen as it provides comprehensive and continuous data coverage from 2013 to 2020. All hourly wave heights were sorted into sea state categories according to the Beaufort Sea State Code, ranging from 0 to 12 (The National Meteorological Library and Archive (NMLA), 2010). Periods with the same sea state were compared per calendar month, to compare equivalent levels of natural background noise and to identify changes in the anthropogenic noise levels. Due to small sample size, periods of sea state 5 or higher (significant wave height higher than 2 m) were excluded from the comparisons. For each sea state (0–4) the same calendar months before and during Covid-19 were compared.
To verify the assumption that the Covid-19 outbreak led to a decrease in marine traffic, we compiled and examined monthly statistics of unique Maritime Mobile Service Identity (MMSI) numbers and International Maritime Organization (IMO) numbers within a 50 km radius around each respective measurement station. These data were sourced from the vessel tracking service provider (VesselFinder®, 2020). These simple statistics are not an accurate measure of total traffic in an area; nevertheless, they provide a low-cost proxy for the relative trend in traffic levels. It remains impossible to separate individual ship types or ship passages solely from these data.
Unique MMSI numbers are assigned to all Automatic Identification System (AIS) on board ships. AIS systems have become more accessible during recent years and are not constrained to commercial shipping, but also are widely used among recreational vessels.
In contrast, IMO numbers are assigned to all propelled, sea-going, commercial vessels with a minimum of 100 GT (gross tonnage) and minimum length of 12 m—excluding most recreational vessels (IMO, 2014).
Consequently, unique MMSI numbers per area include all vessels carrying IMO numbers, but the IMO number statistics provide a focused overview of commercial shipping activities. Differences between MMSI numbers and IMO numbers per time period and area can be conditionally interpreted as a measure of recreational boating (although not all recreational vessels have AIS systems).
To determine the effect of the pandemic on the levels of shipping activity at the two measurement stations, data on marine traffic were examined. For each year 2013–2020, monthly mean values of unique MMSI numbers (Figure 2) and unique IMO numbers (Figure 3) were compared and evaluated.
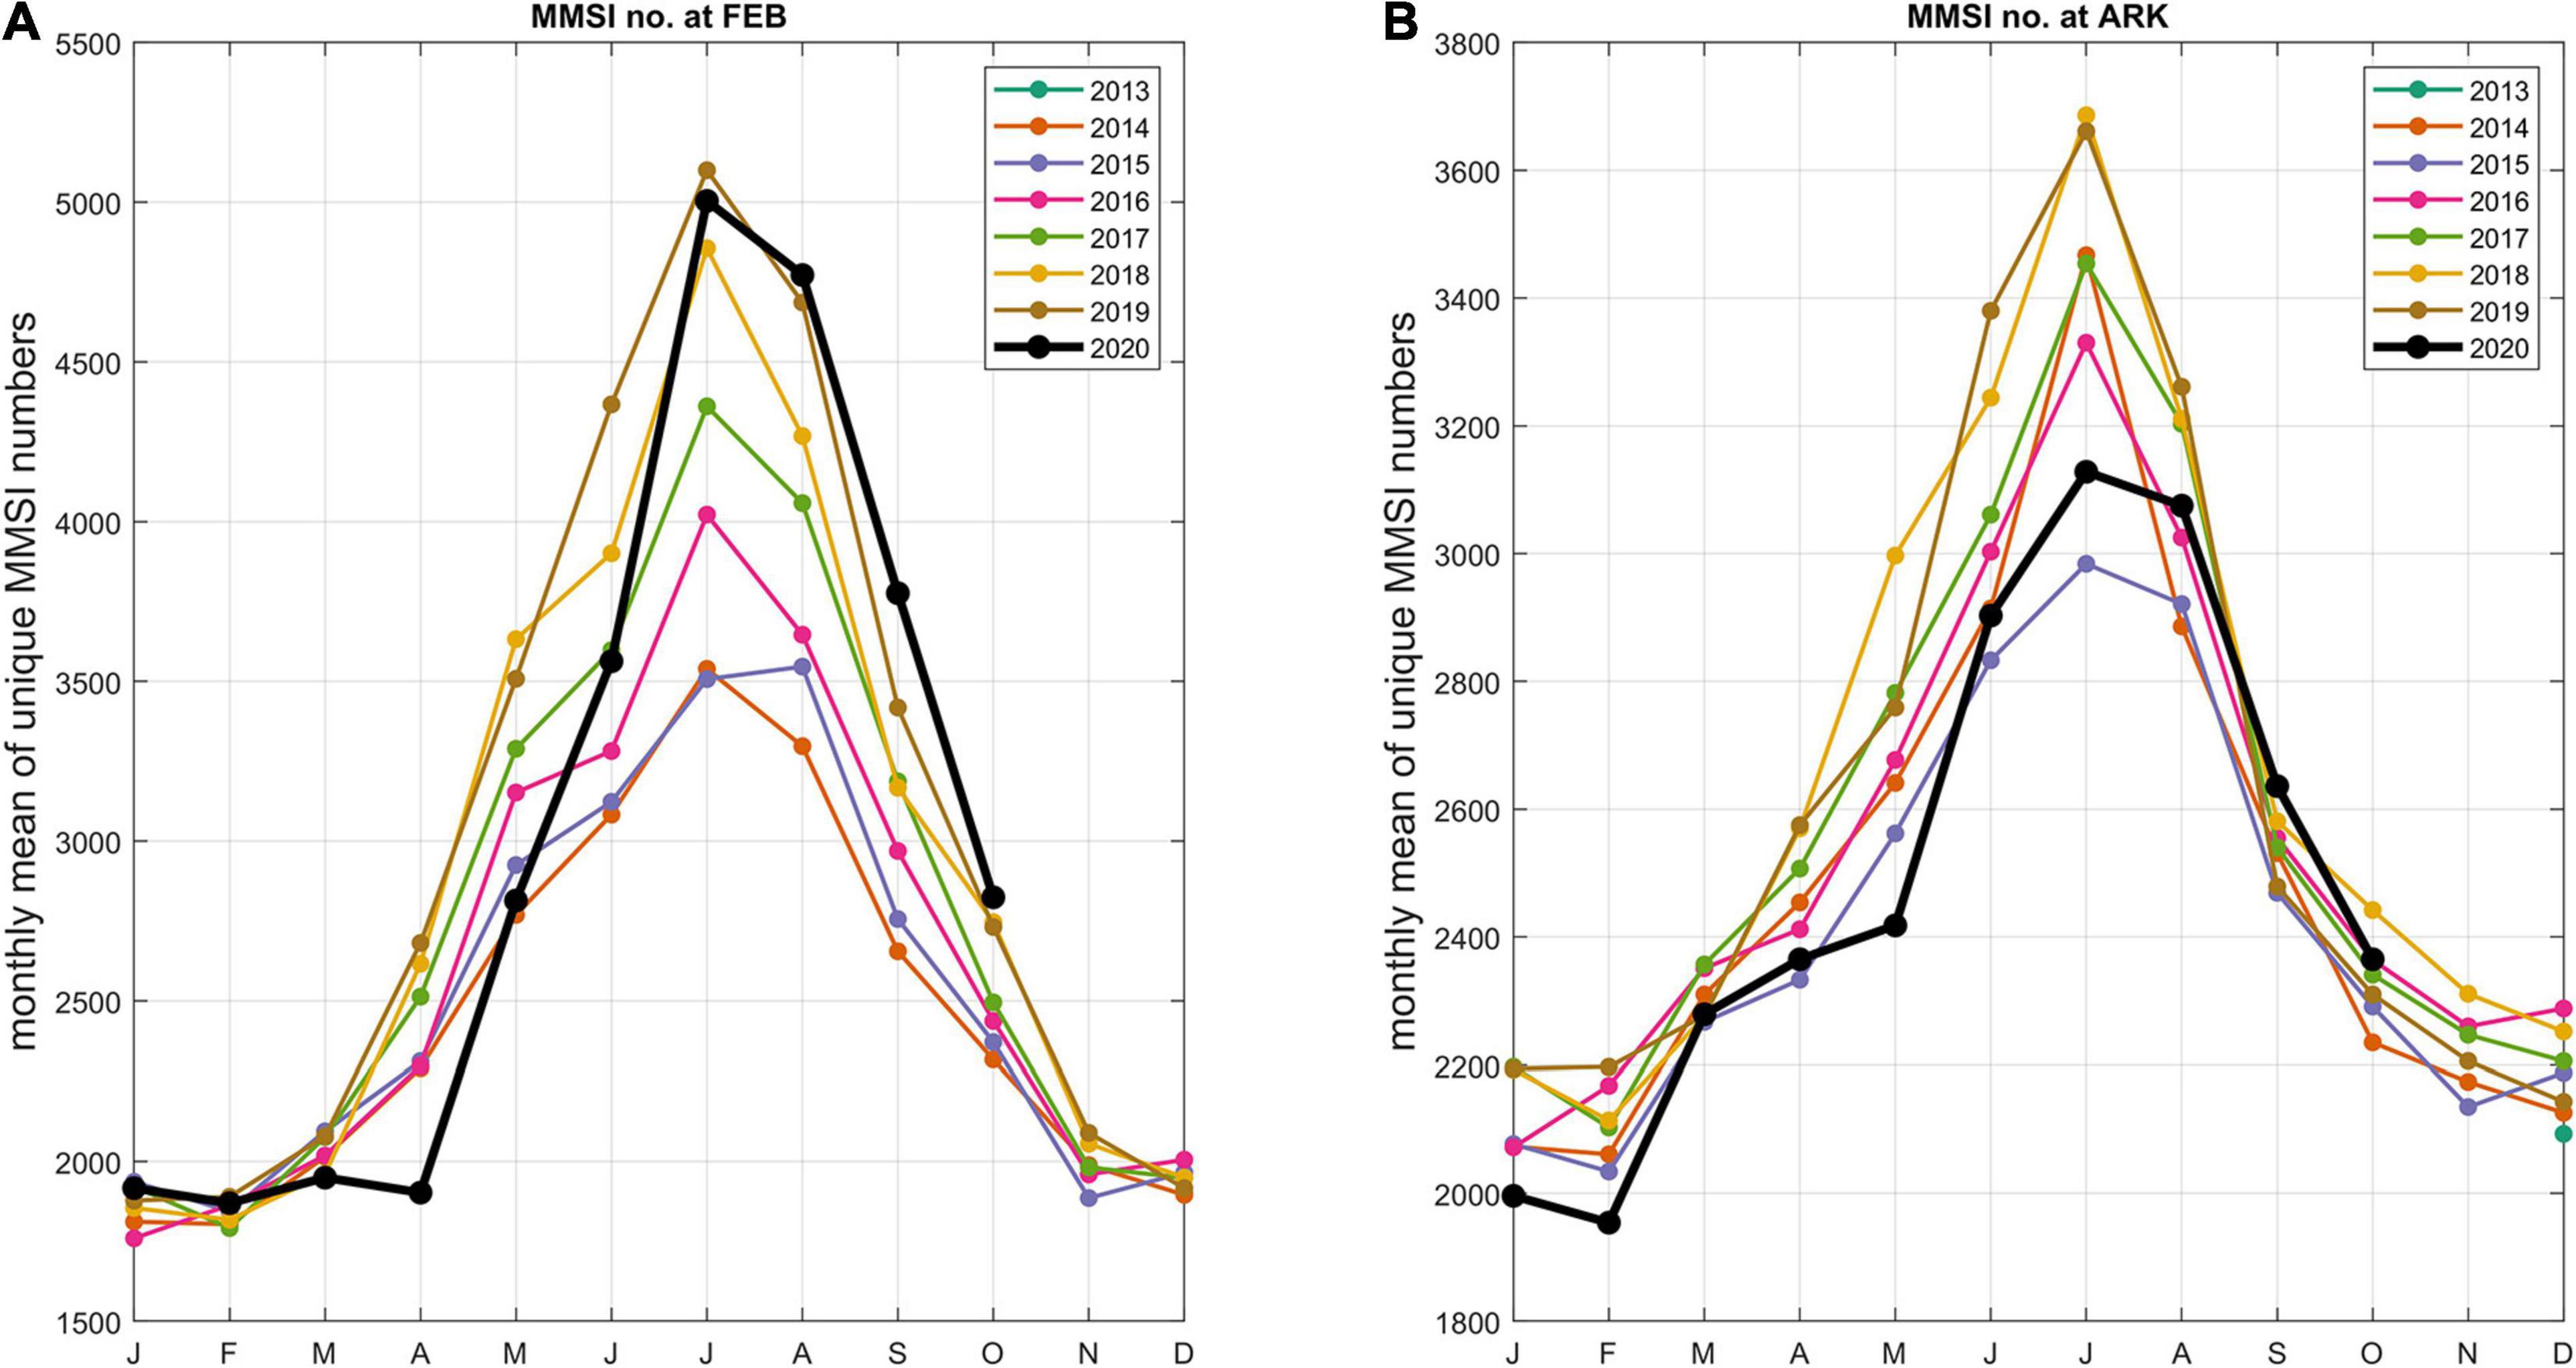
Figure 2. Monthly mean of unique MMSI numbers per year within a 50 km radius around FEB-station (A) and ARK-station (B), note the different scales in panels (A) and (B).
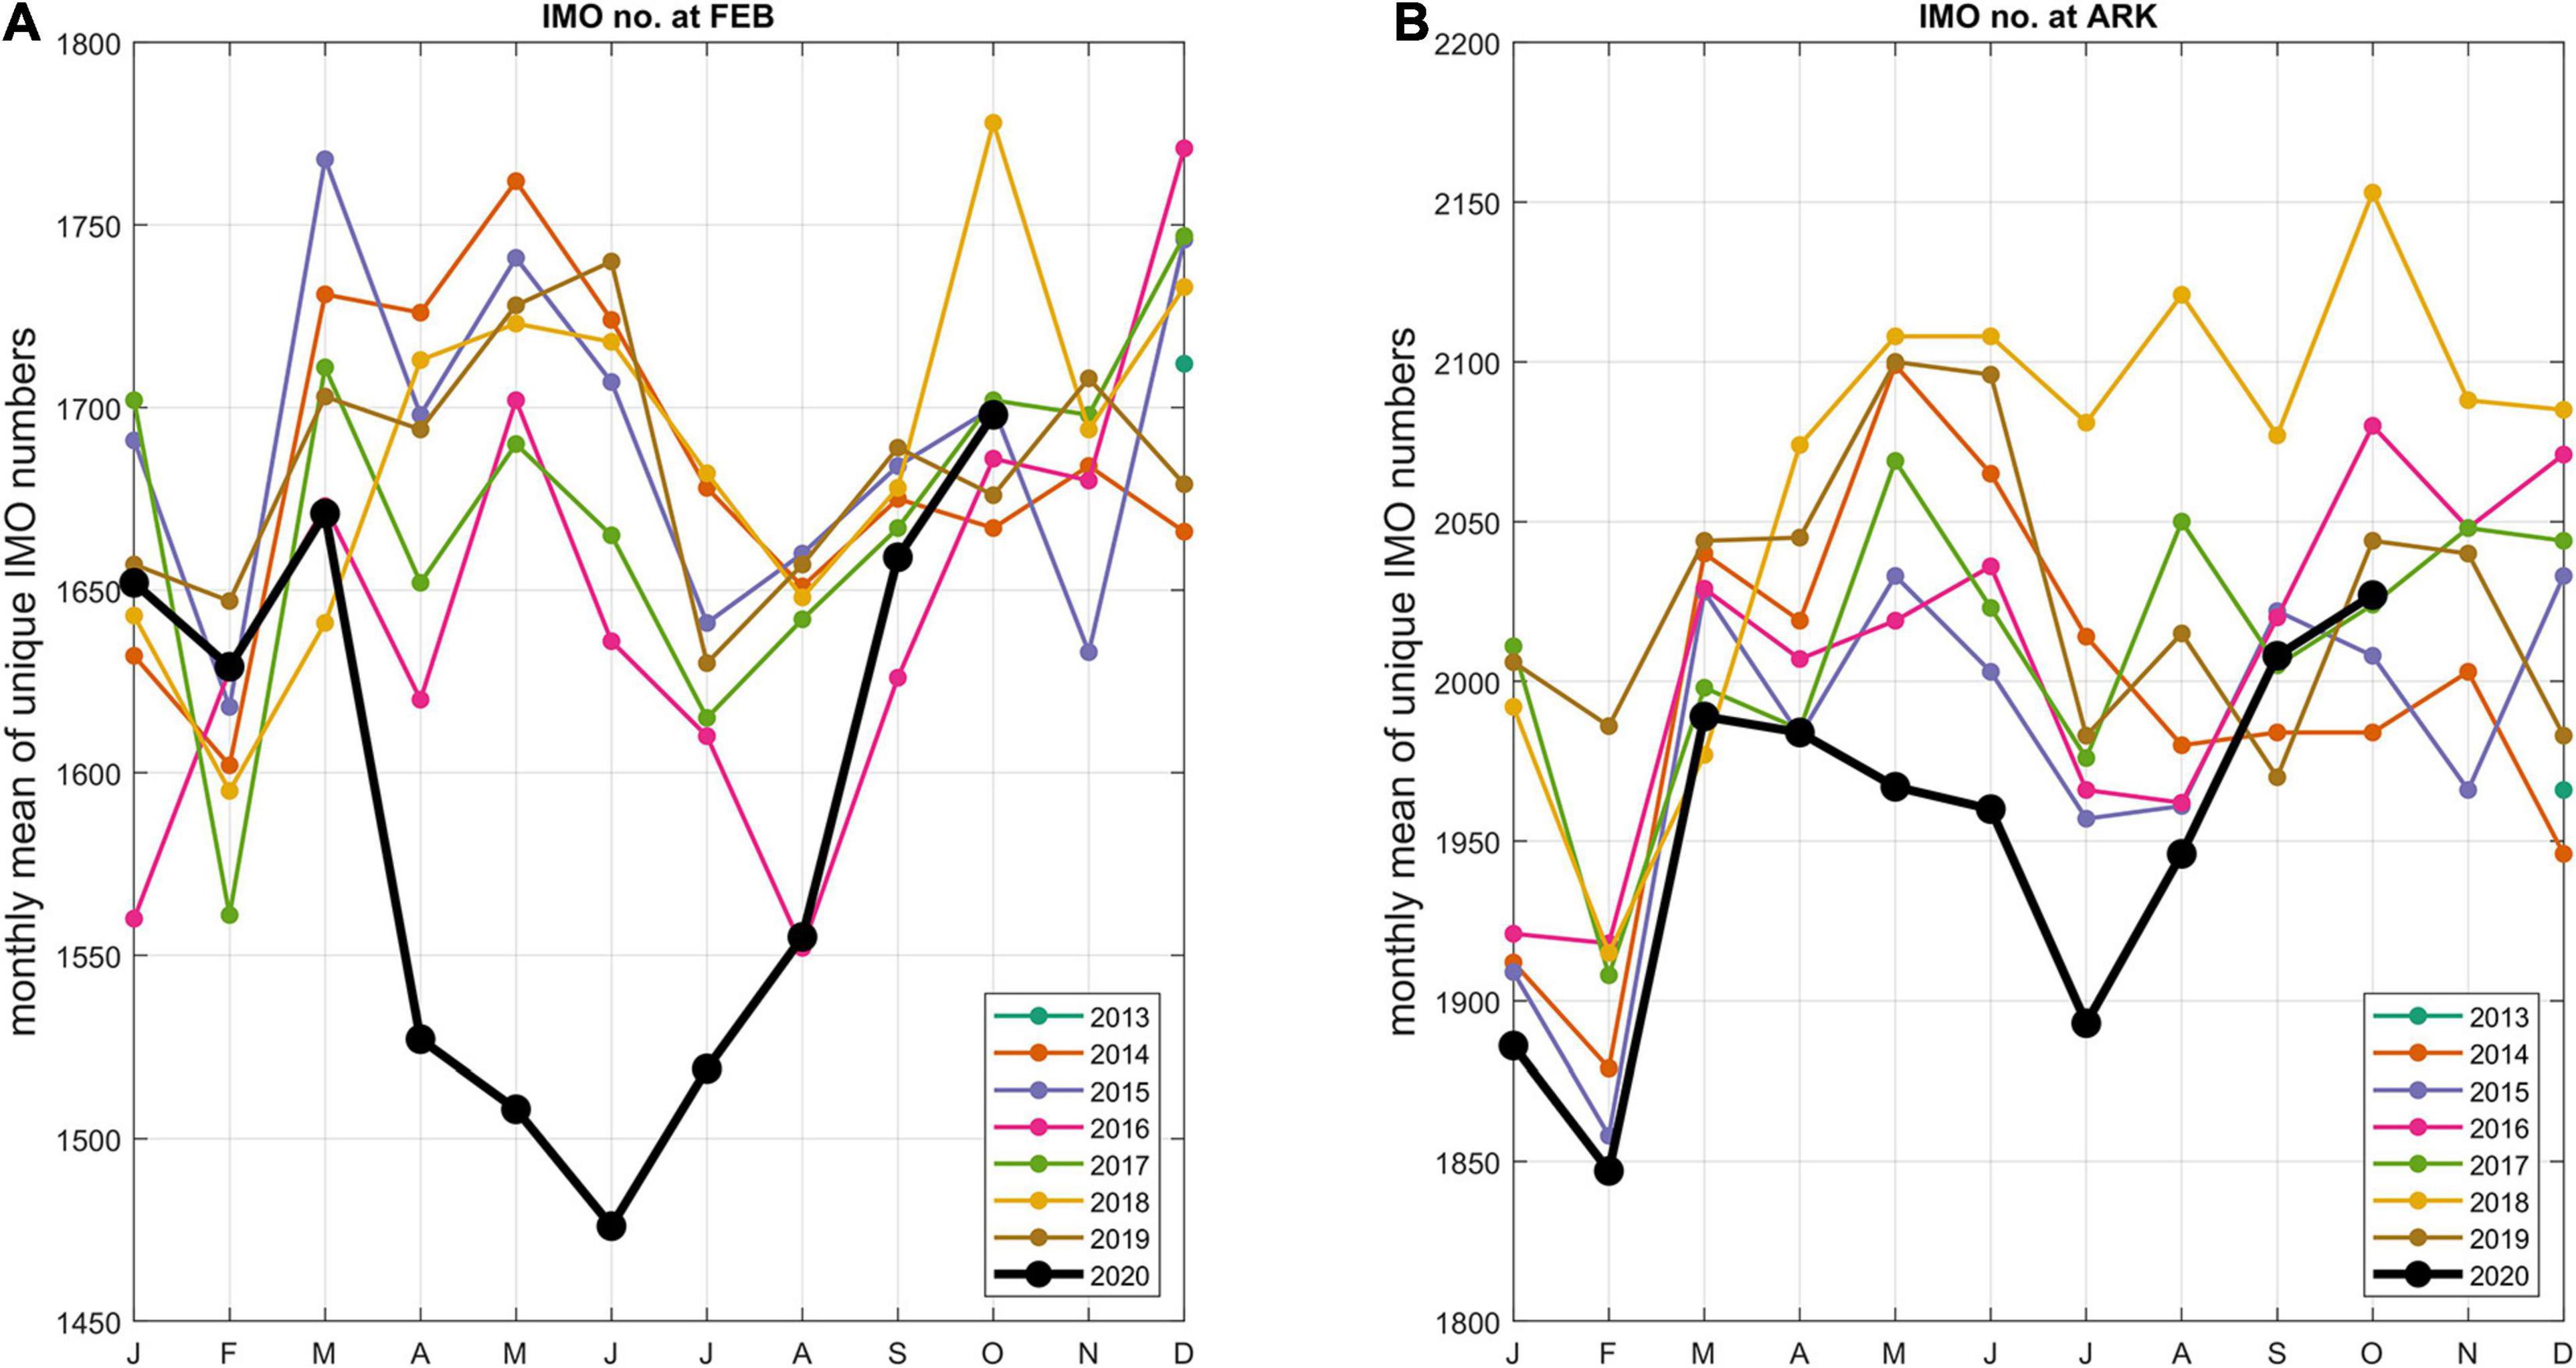
Figure 3. Monthly mean of unique IMO numbers per year within a 50 km radius around FEB-station (A) and ARK-station (B), note the different scales in panels (A) and (B).
There was an observed reduction in marine traffic in 2020 (Figure 3). In the Fehmarnbelt, fewer unique MMSI numbers were registered between March and May 2020 than on average during the previous years (up to 21% fewer in April 2020), while more MMSI numbers than on average were registered from June to October (up to 21% more in August 2020). In the same area, the count of unique IMO numbers was below the average of the previous years during all months from March until October (up to 12% less commercial shipping during June 2020). From these data, a large-scale reduction in marine traffic could be observed between March and May 2020. Whilst the commercial shipping only slowly recovered to average levels during the second half of the year, more recreational boating (MMSI-IMO) than ever before was recorded in late 2020 at FEB. This effect can be explained by international travel restrictions that may have led to more national recreational boating than during previous years. Notably, the reduction of commercial traffic (from March to October 2020) coincides with the onset of the Covid-19 pandemic, followed by an increase in recreational boating from July to October 2020.
This observed pattern can only partially be seen in the vicinity of the ARK station. The lowest monthly mean of unique IMO numbers occurred during March to October 2020 (maximum difference of 12% compared to the average of previous years). The count of MMSI numbers was lower in 2020 than in previous years during the months March to August (up to 11% fewer in May compared to previous years), and a small increase (4% more compared to previous years) was observed during the autumn months. ARK is located further from the coast and is probably less attractive to recreational boating than the FEB; however, more commercial vessels are operating in this area. The data suggest an overall decrease in commercial shipping, but illustrate an increase in number of unique MMSI numbers for September and October. This increase in recreational boating might again be a reaction to international travel restrictions during summer and autumn 2020.
Model results from months with available acoustic data show a long-term mean significant wave height of 0.7 ± 0.2 m at FEB and 1.1 ± 0.4 m at ARK. In comparison with previous years, the 2020 mean significant wave heights at ARK and FEB follow a similar seasonal pattern (Figure 4). During May and July 2020, exceptionally high sea states were modeled at both stations compared to previous years. The sea states during August and September 2020 were the lowest during the whole investigation period, also at both stations.
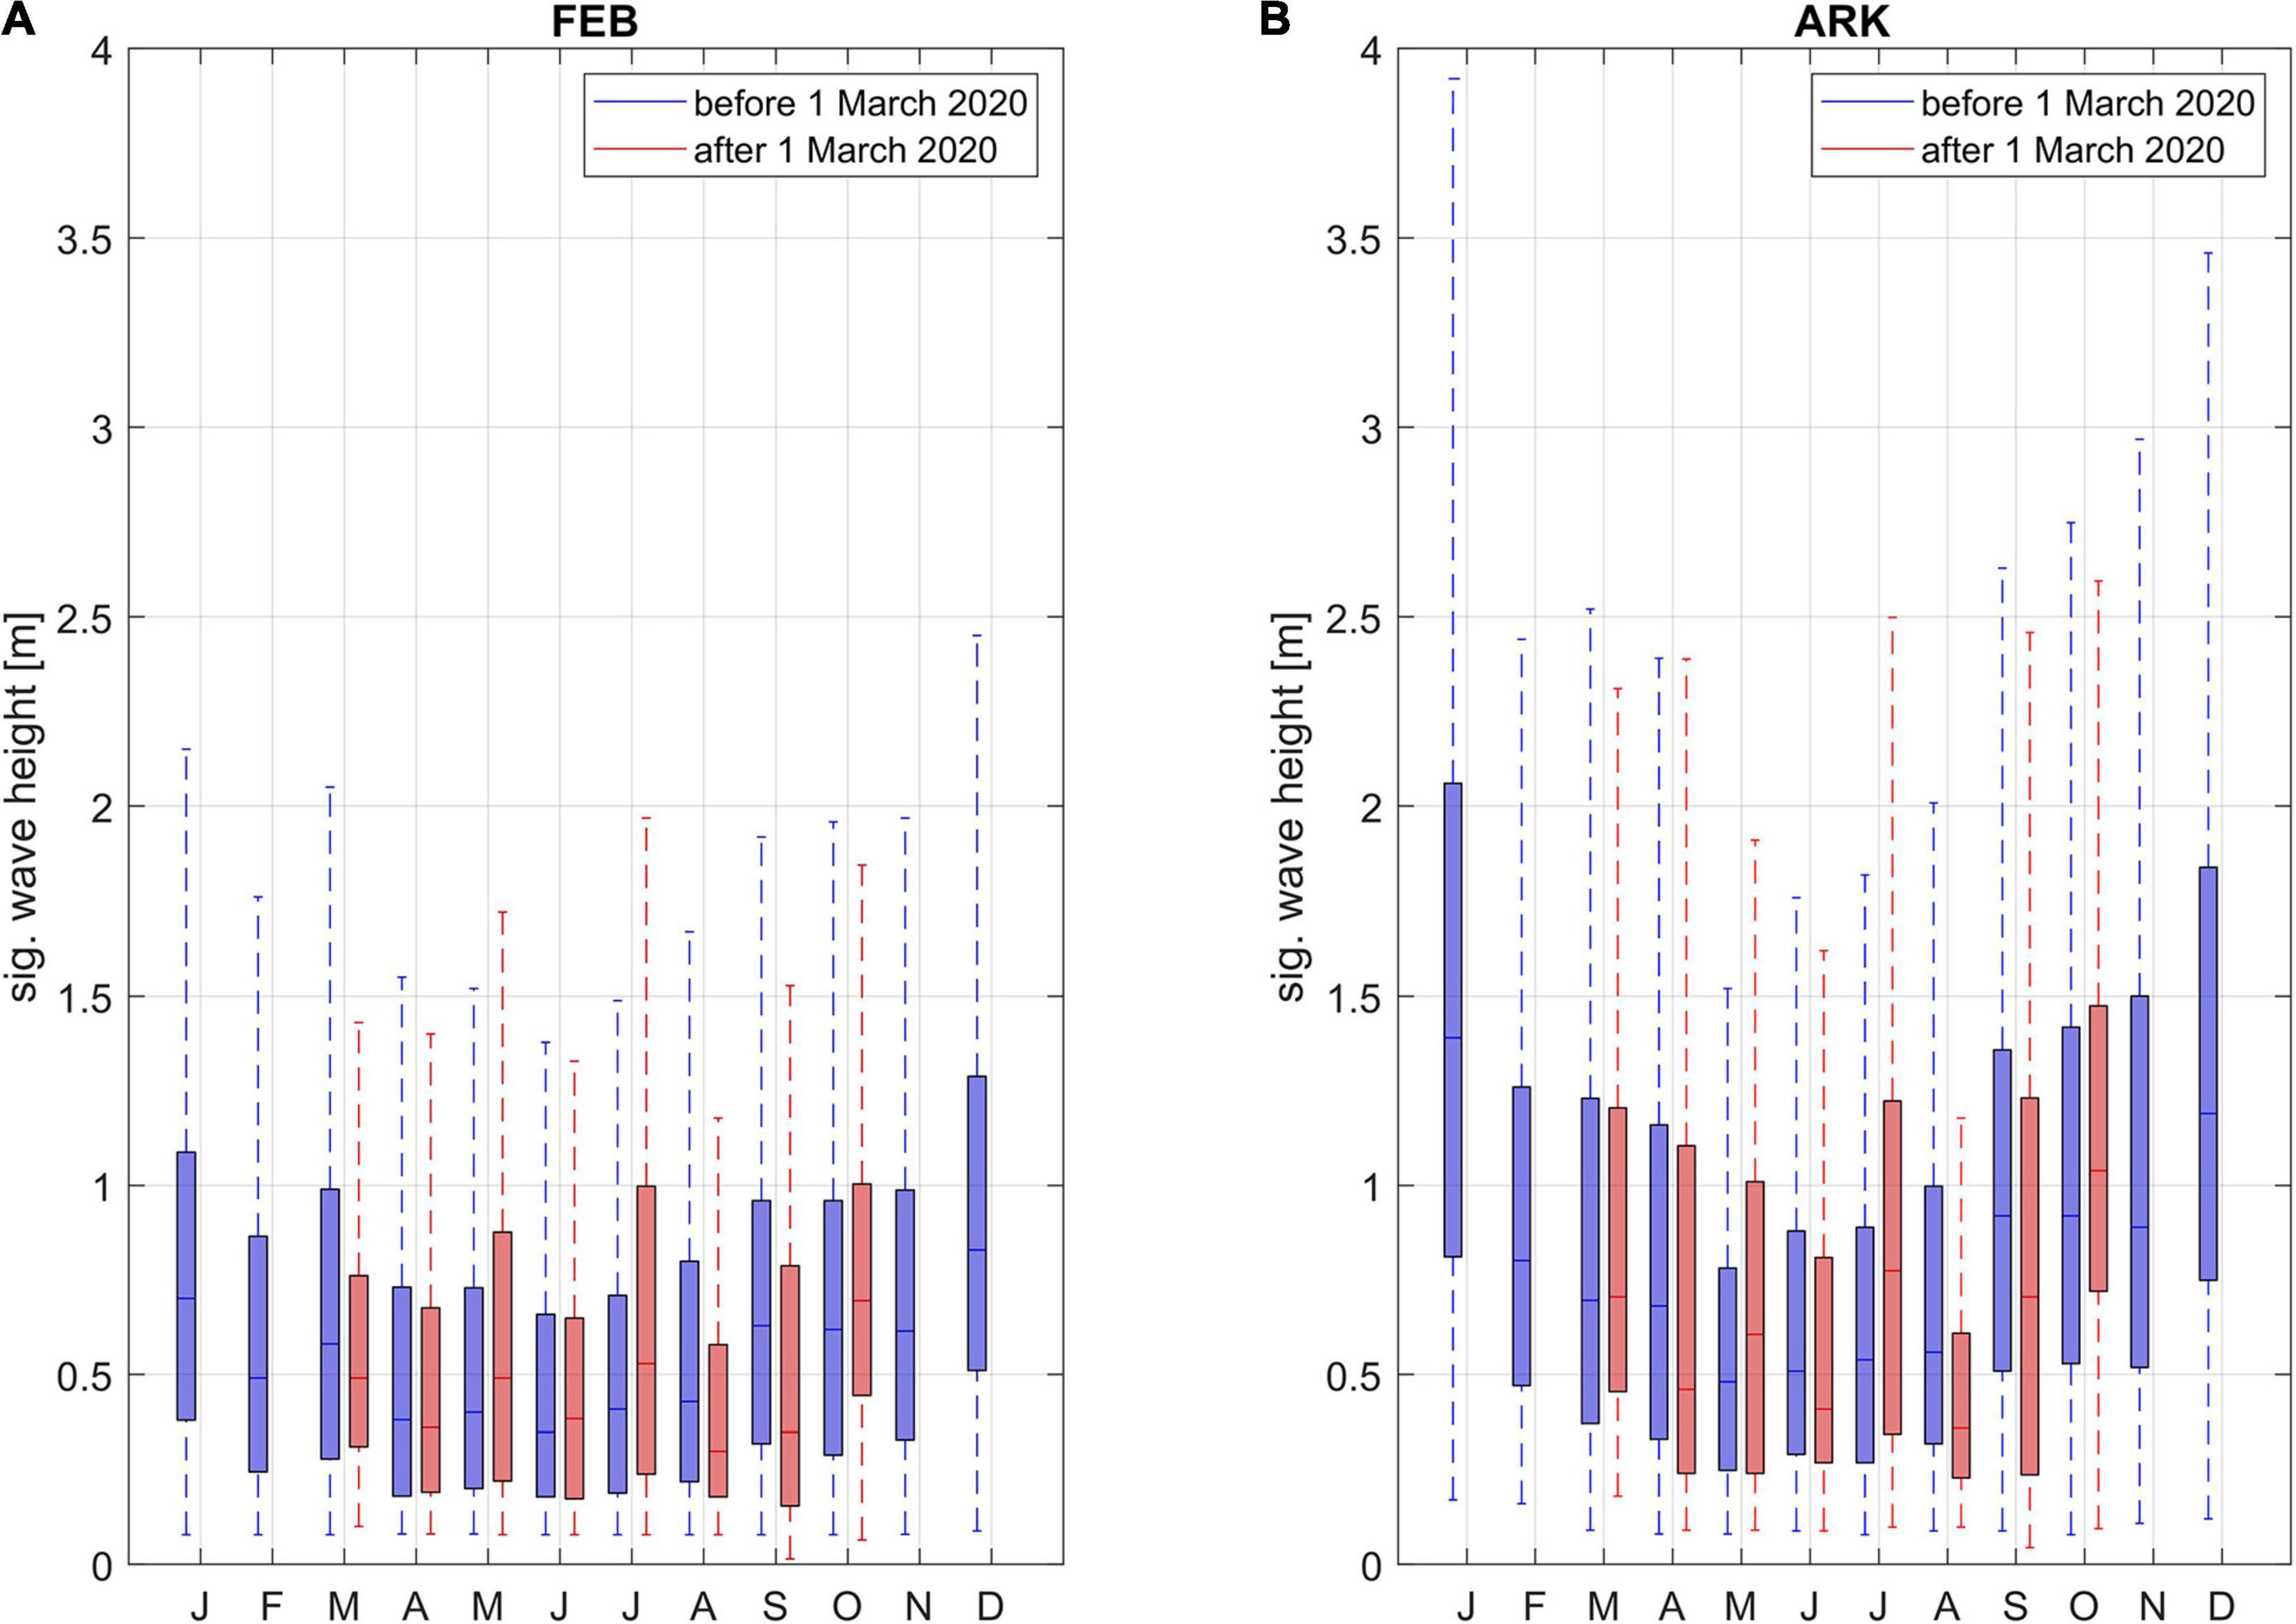
Figure 4. Boxplots of significant wave height per month before (2013–2019; blue) and during (2020; red) Covid-19 pandemic at the CWAM’s nearest grid points to FEB-station (A) and ARK-station (B). Only months with available acoustic data were represented at both stations.
As anticipated, due to its proximity to shore, the sea states at FEB are considerably lower than at the ARK station. Thus, high-frequency SPLs (above 1 kHz) were observed to be higher at the ARK station.
Since the start of the measurements at FEB in 2013, the lowest low-frequency SPLs were recorded in 2020, with an absolute minimum in July 2020 (Figure 5A). Although the number of unique MMSI numbers in July was 17% above the average, the number of unique IMO numbers was still 7% below the average of previous years. In August 2020, the decrease in the low-frequency band levels was not as pronounced as in previous months and at the same time an increase in marine traffic (both MMSI and IMO numbers) is evident. Low-frequency band levels (10 Hz–1 kHz) from January to March 2020 were in the range of previous measurements, but this period was before the most stringent measures against the spread of the pandemic came into effect. From April to August the low-frequency band levels were on average 1.2 dB below the mean of previous years—indicating a general decrease in low-frequency noise. This decrease corresponds to a decrease in sound pressure of 13%. For high-frequency band levels (1–12.5 kHz) such a clear decrease compared to previous years cannot be identified (Figure 5B). This meets our expectations, since a decrease in traffic should mainly affect the lower frequencies. In fact, the measurements from 2013 to 2015 show much lower high-frequency SPLs than all other years. The reason for this is most likely the different instrumentation that was being used during the BIAS project.
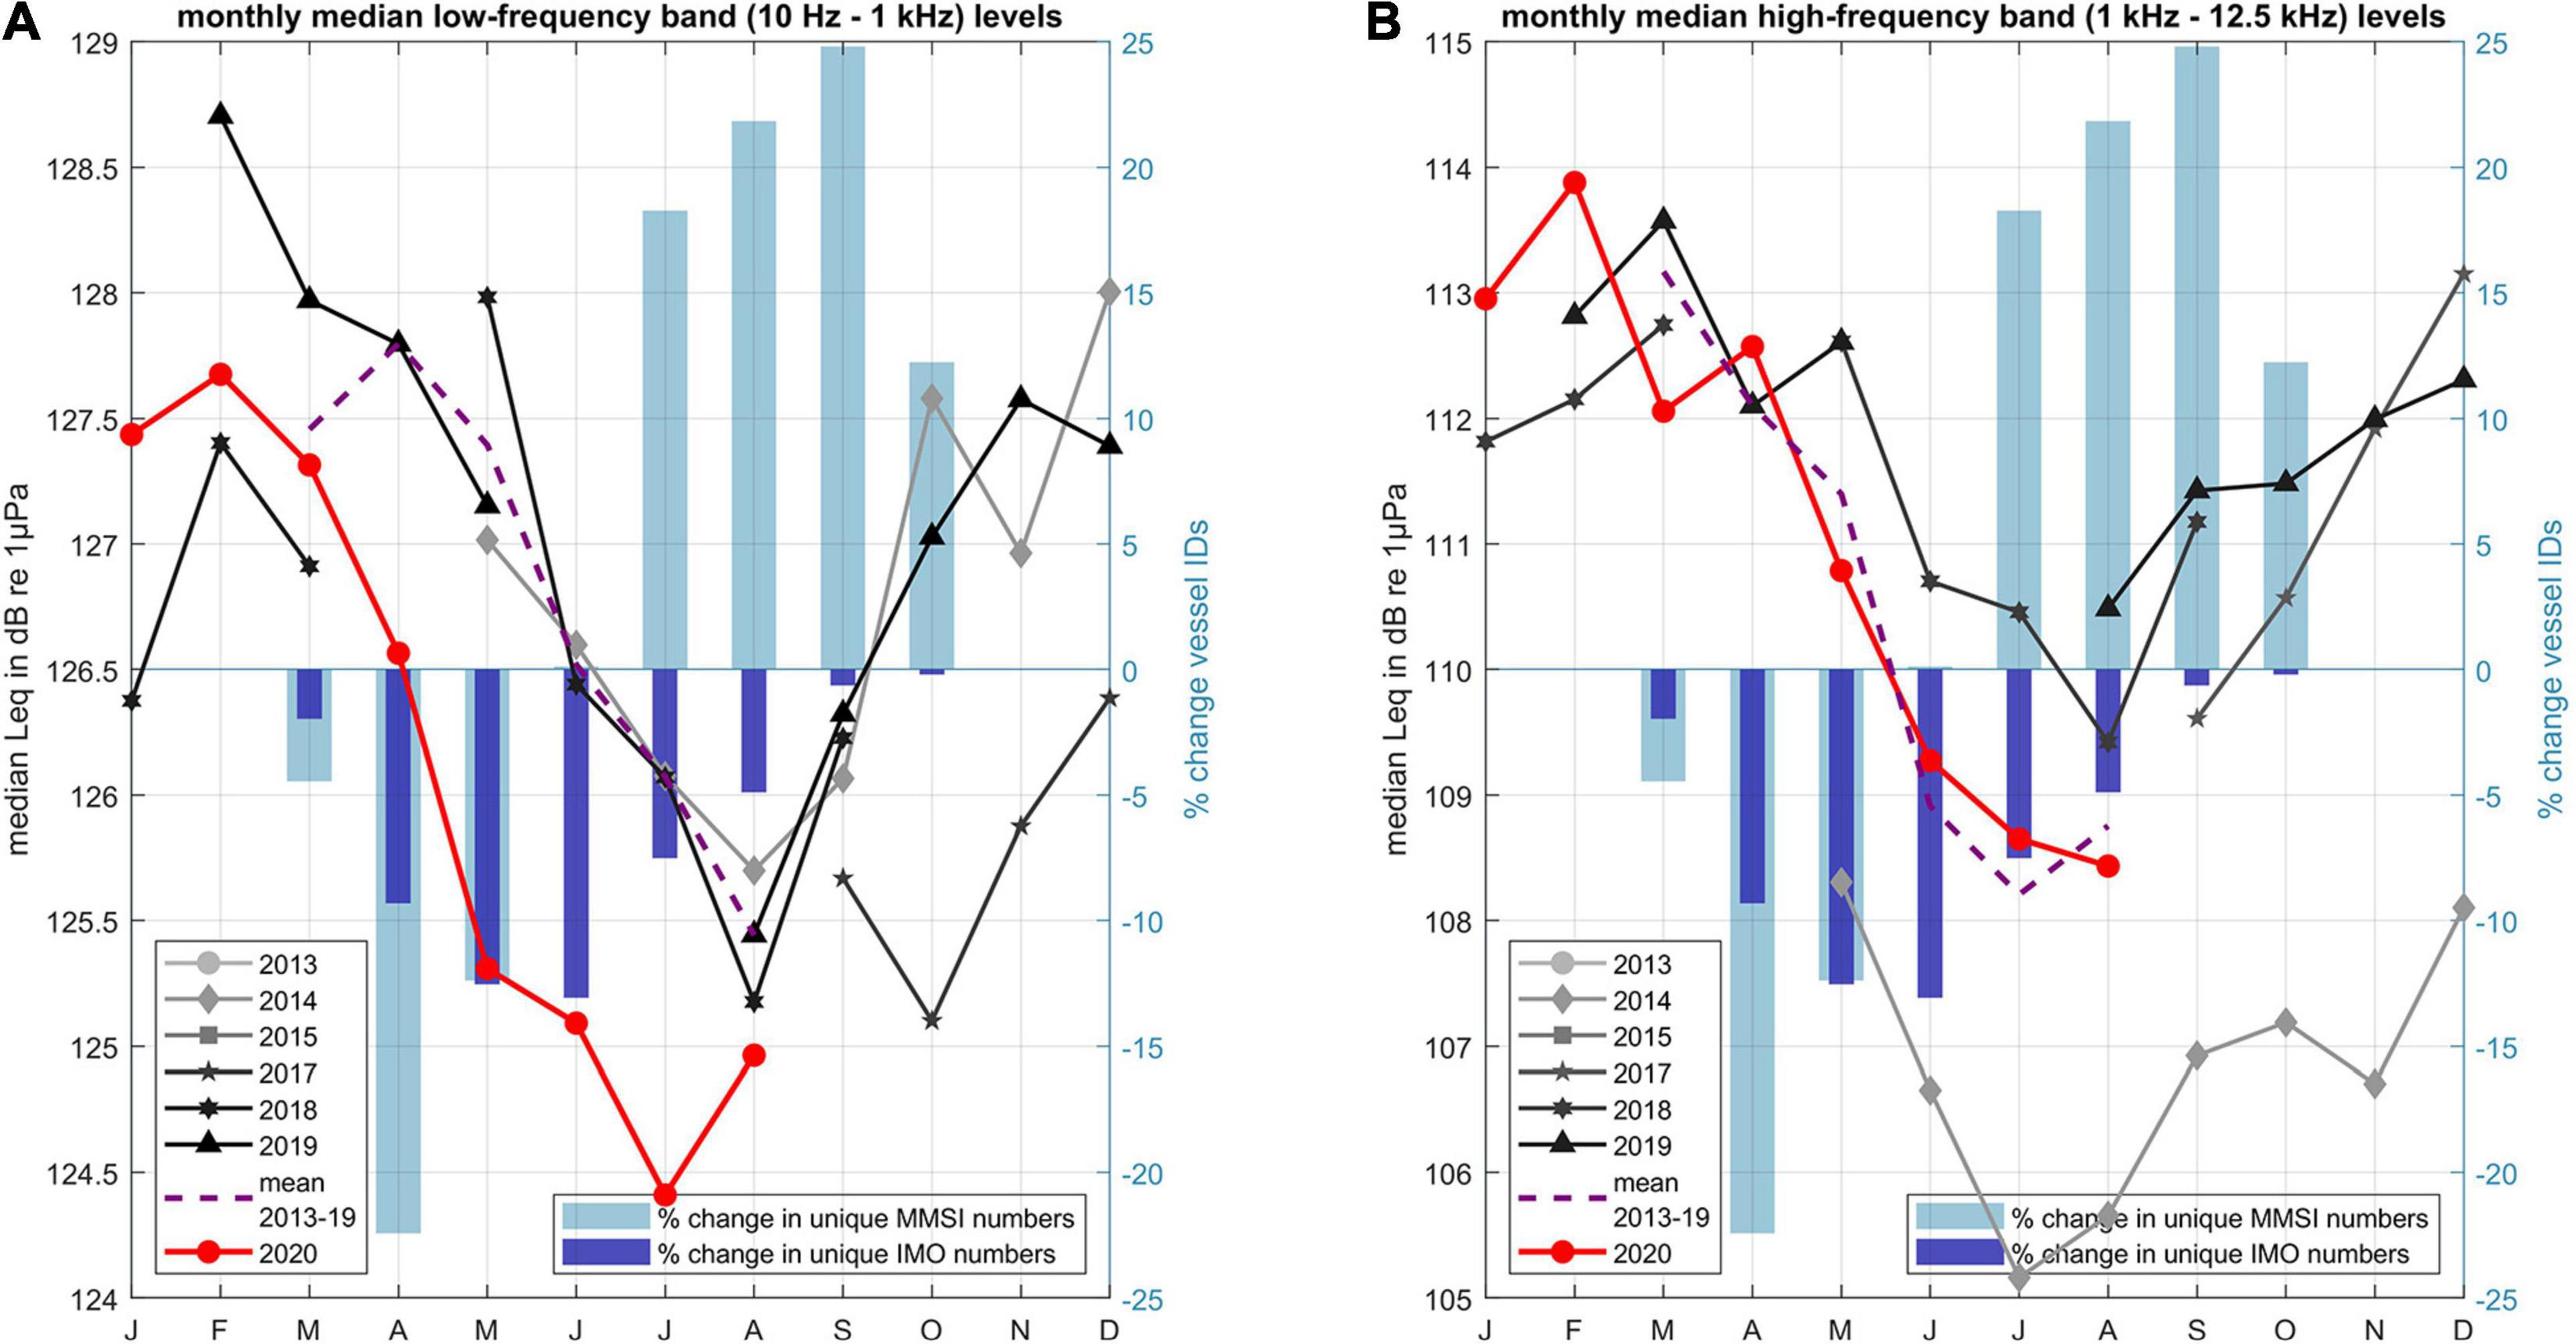
Figure 5. Available monthly median broadband levels per year at FEB, medians of low frequency bands (10 Hz–1 kHz) (A); Medians of high frequency bands (1–12.5 kHz) (B); bars indicate percentage of marine traffic reduction after Covid-19 outbreak (mean 2013–2019 vs 2020), % reduction of unique MMSI numbers (light blue) and% reduction of unique IMO numbers (dark blue); average broadband levels of years before Covid-19 (dashed purple line), note the different scales for the broadband levels in panels (A) and (B).
Similar effects could be identified at the ARK station. In contrast to the FEB station, the mean of unique MMSI numbers only increases to 4% above the pre-Covid-19 average in September and the mean of unique IMO numbers remains below pre-Covid-19 conditions until October 2020 (Figure 6). In the second half of the year commercial shipping recovered. Similar to the FEB station the low-frequency band noise after March 2020 was lower than during all previous years at ARK—indicating lowest received SPLs since the begin of recordings (Figure 6A). On average, the low-frequency noise was also 1.2 dB below the mean of the previous years, which corresponds to a reduction of sound pressure of 13%. Investigating the high-frequency band level (1 kHz to 12.5 kHz) (Figure 6B), the high SPLs in July and relatively low SPLs in August are obvious. This corresponds well with the high sea states modeled in July 2020 and the low sea states modeled in August 2020 (Figure 2). No divergent pattern for the period during Covid-19 from previous years can be identified. The high-frequency band levels are within the same range. Again, the high-frequency band levels from 2013 to 2015 were substantially lower compared to all years, probably due to the usage of Low-Noise hydrophones during the BIAS project.
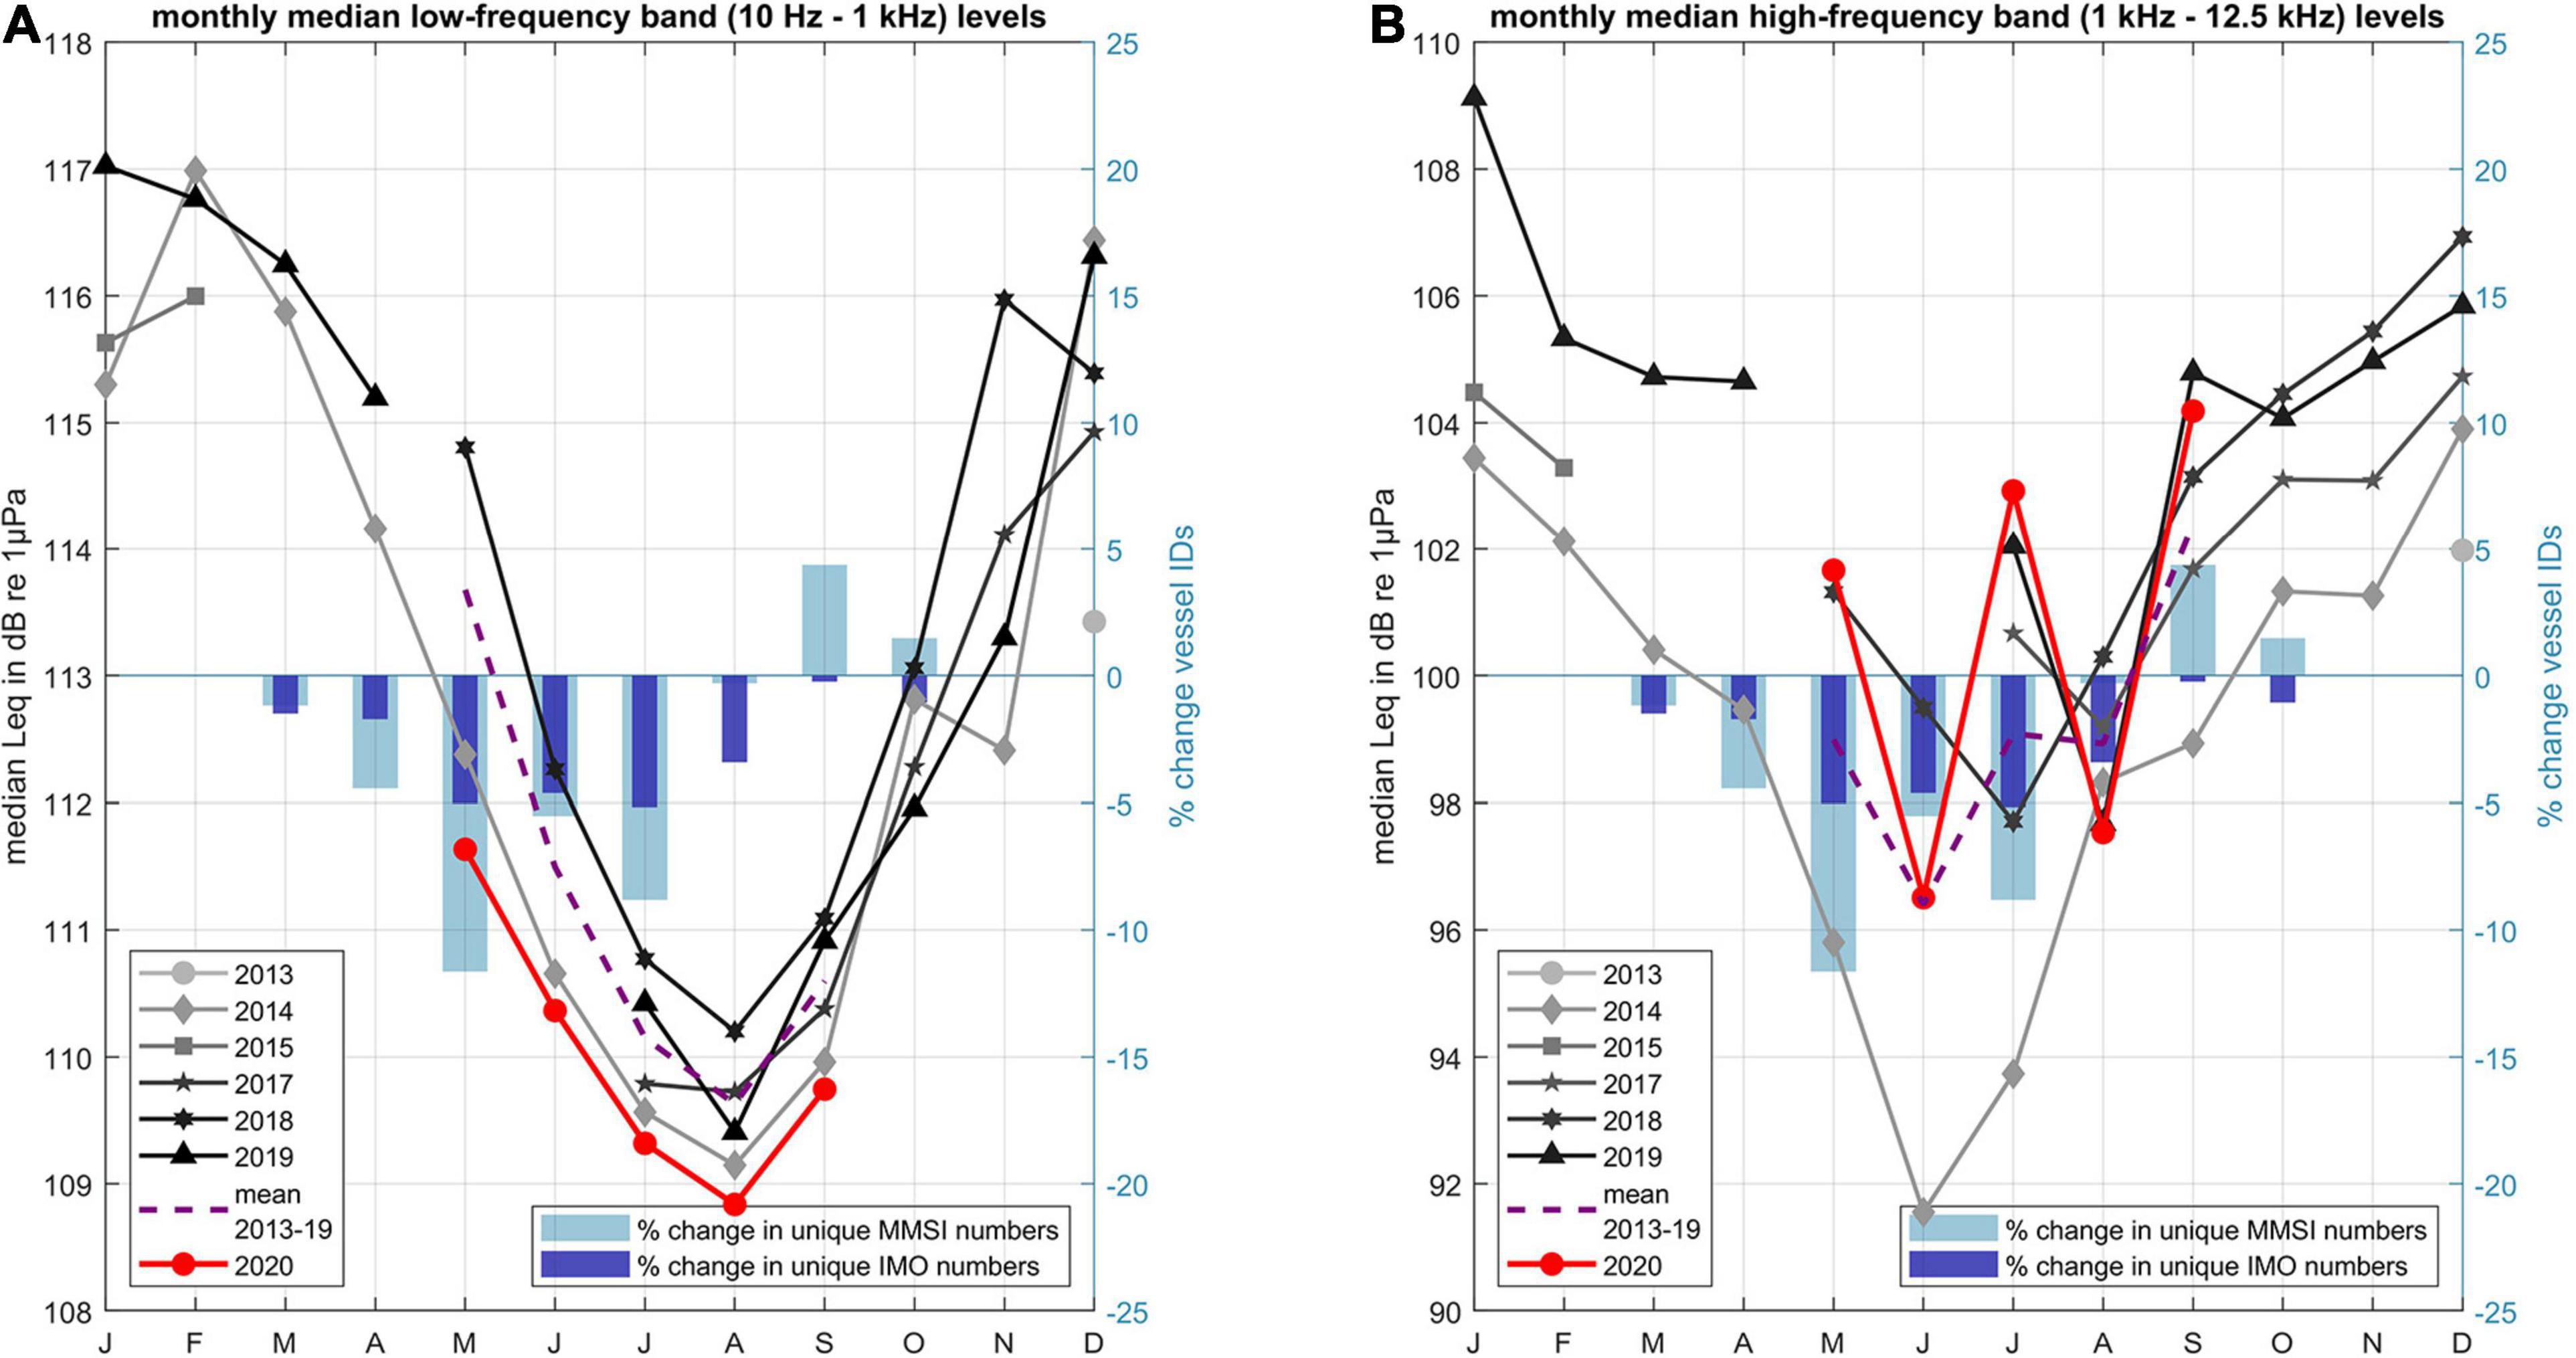
Figure 6. Available monthly median broadband levels per year at ARK, medians of low frequency bands (10 Hz–1 kHz) (A); Medians of high frequency bands (1–12.5 kHz) (B); bars indicate percentage of marine traffic reduction after Covid-19 outbreak (mean 2013–2019 vs 2020), % reduction of unique MMSI numbers (light blue) and% reduction of unique IMO numbers (dark blue); average broadband levels of years before Covid-19 (dashed purple line), note the different scales for the broadband levels in panels (A) and (B).
A Wilcoxon rank sum test was used to test if the differences of the monthly medians are significant. The test was chosen because none of the sets of recordings (for each month before and after the pandemic’s onset) were distributed normally. Shapiro–Wilk tests were used to test for normality. At a 95% confidence level, it was found that all compared medians of SPLs differ significantly.
Monthly medians per TOB were compared before and after the Covid-19 outbreak (Figure 7). For data before Covid-19 the medians per TOB were calculated for concatenated same calendar months. Comparisons for TOBs higher than 1 kHz do not consider data from 2014, since the instruments’ sensitivities differ significantly in this frequency range and comparisons would not be meaningful. This leads to a sparser data coverage for the period before the pandemic for high frequencies. Excluding data from 2013 to 2015 data mainly affects high-frequency TOBs, reducing the positive deviation of 2020 data compared to data from previous years.
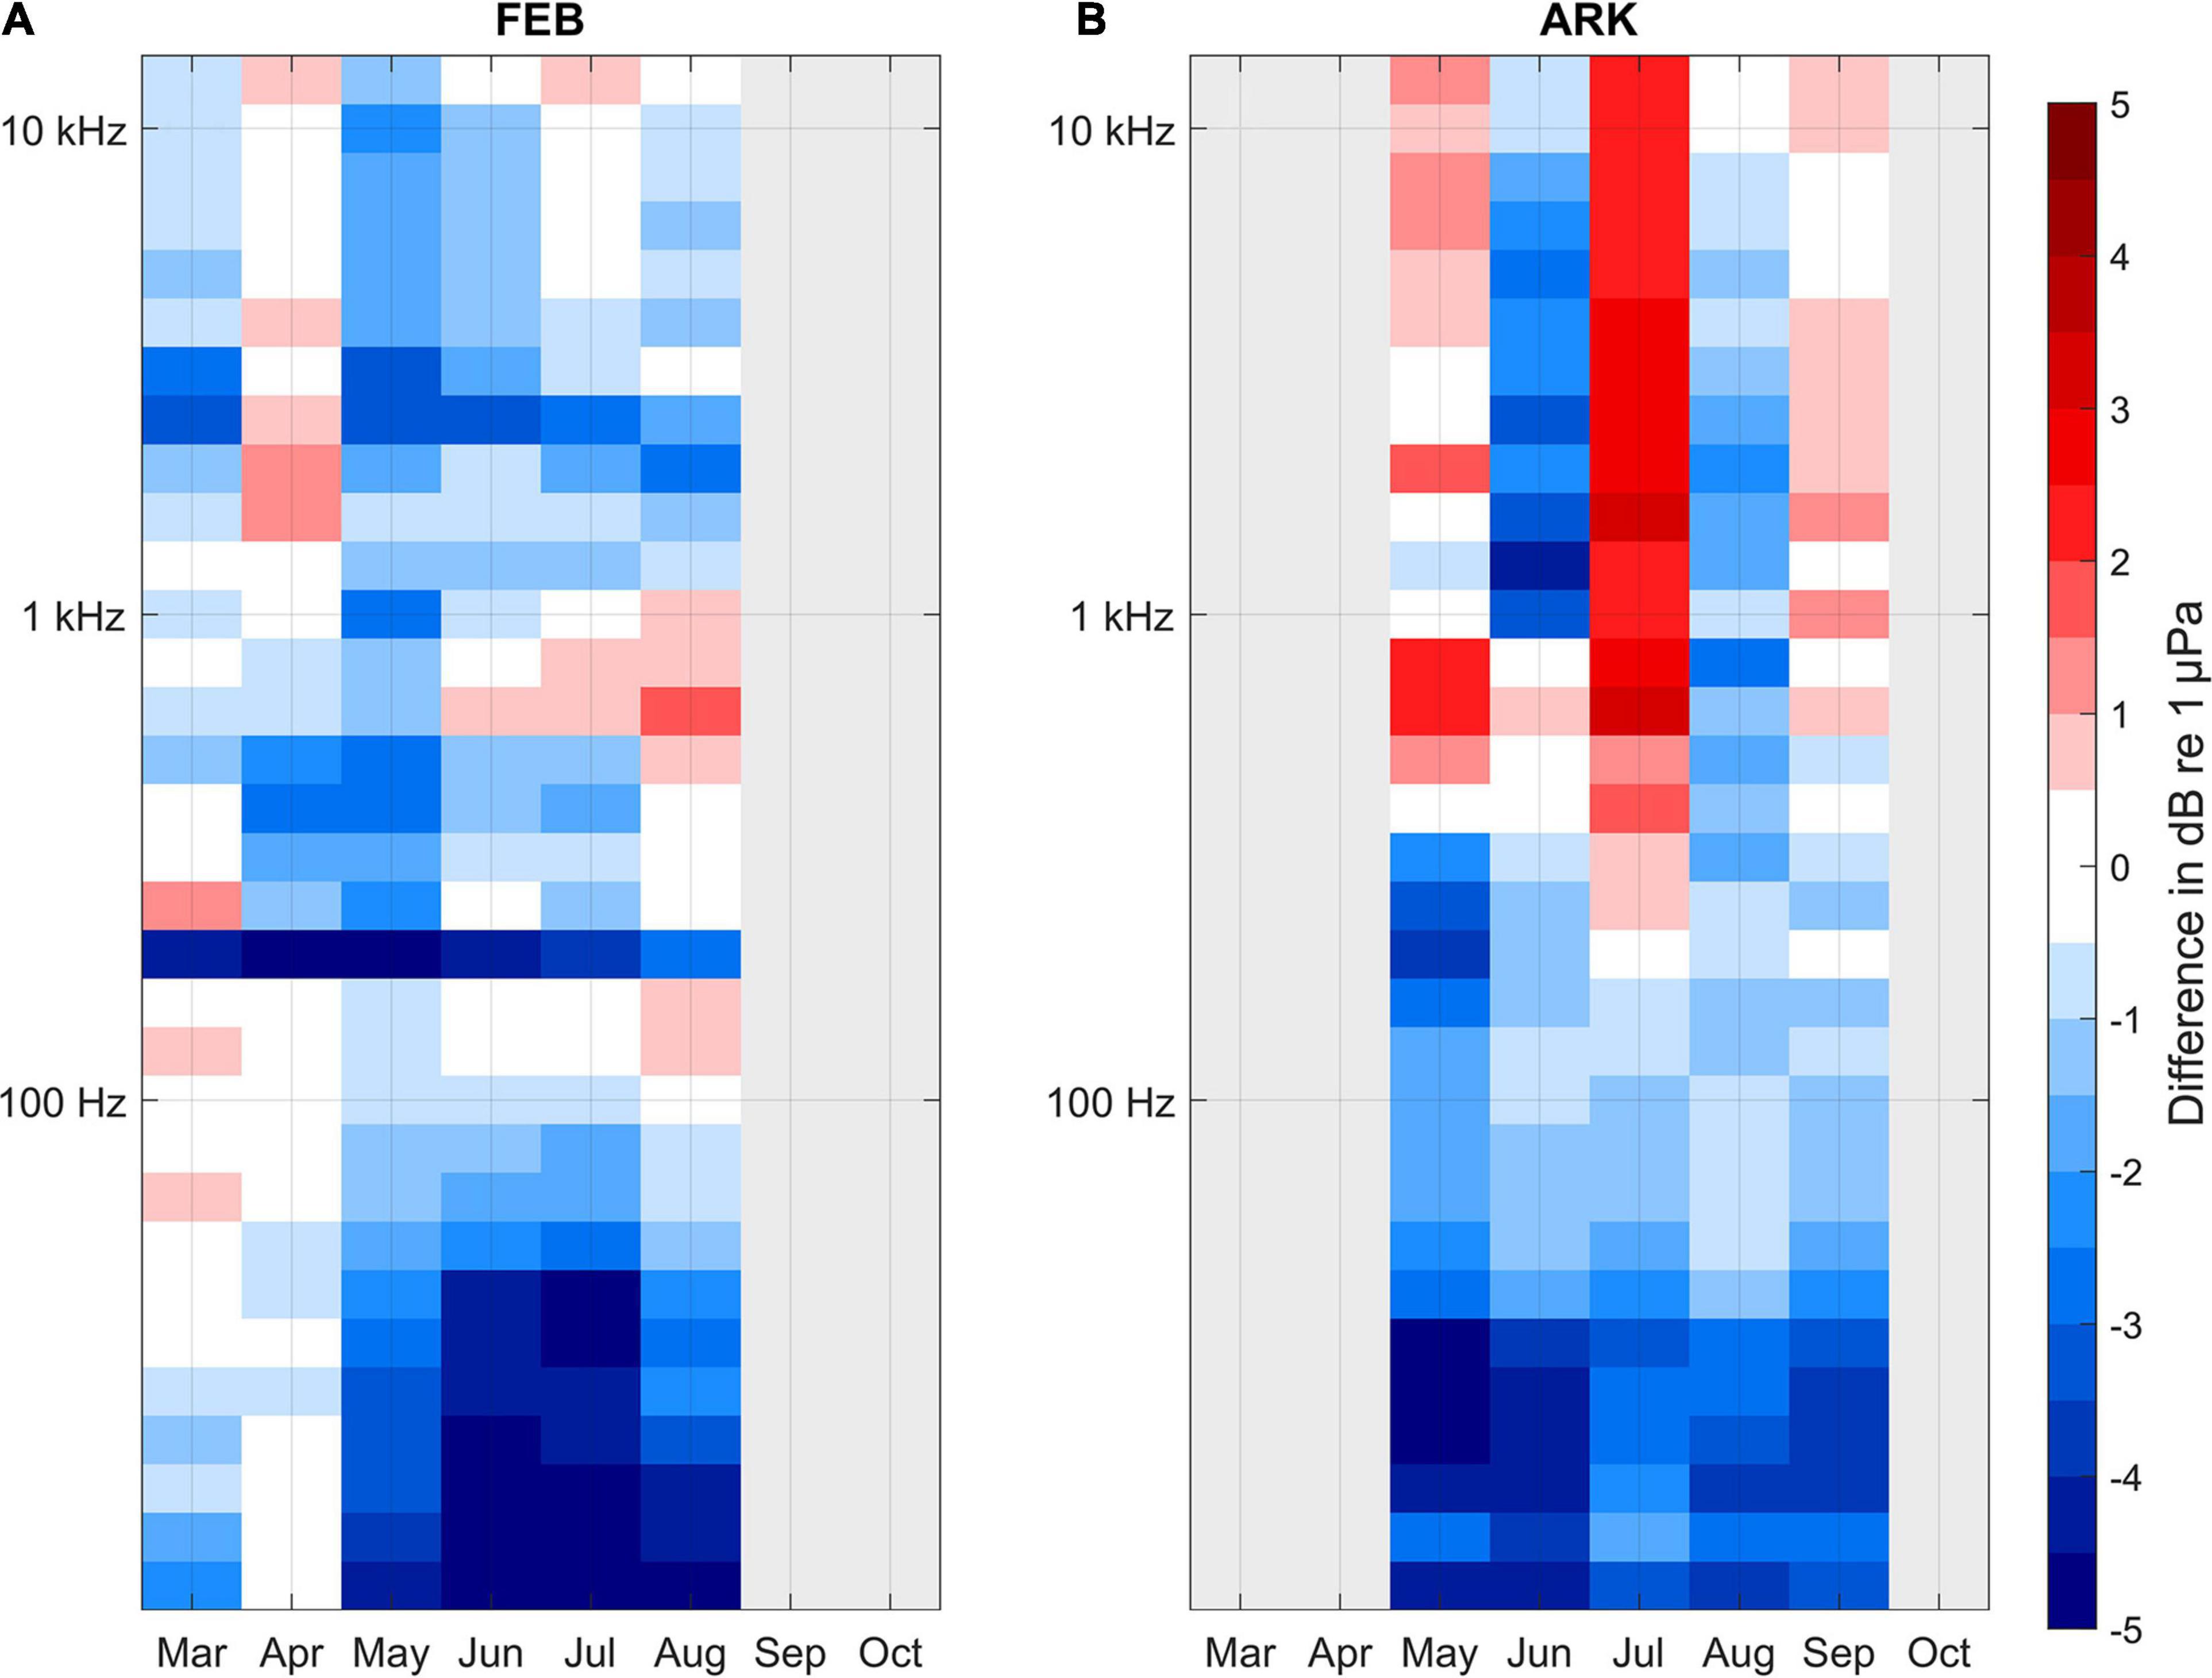
Figure 7. Change of monthly median TOLs after outbreak of Covid-19 pandemic compared with previous years at FEB (A) and at ARK (B). Light gray area indicates no data availability.
At FEB (Figure 7A) TOBs up to 100 Hz are distinctly lower than the median of previous years (up to 5 dB). The obvious decrease at the 200 Hz TOB of 4–5 dB can be explained by the installation of solar panels on the nearby FEB buoy, which made the use of a generator on the buoy almost redundant during 2020. TOLs for TOBs above 1 kHz from the years 2013 to 2015 were substantially lower than during other years. From April to August 2020 all low-frequency median TOLs (<100 Hz) as well as most high-frequency median TOLs (>100 Hz) are lower than before the pandemic. Reduction generally increases gradually with decreasing TOBs, except for the 200 Hz TOB. Highest reduction of up to 5.6 dB can be found in the 10 Hz TOB in July 2020.
The monthly TOL comparison for ARK (Figure 7B) indicates a distinct reduction in low-frequency SPLs. In contrast to FEB, a reduction is obvious for all TOBs up to 160 Hz. The highest reduction of SPL can be found for the 20 Hz band in May (-5.4 dB). The July measurements show higher TOLs (max. +3 dB at 1.6 kHz), which agrees well with the higher sea states during this month (Figure 4B). The smaller positive deviations in May and September cannot be explained by exceptional weather conditions or different instrumentation (deviations are present when including or excluding data from 2013 to 2015). As before, a Wilcoxon rank sum test was applied to test if observed differences in medians per TOB and month are significant. Only the difference at the 630 Hz TOB for May at ARK was found to be not statistically significant (at 95% confidence level).
Since a noise reduction is most evident for low frequencies, we further analyzed the temporal distribution of noise level changes in the low-frequency band (10 Hz–1 kHz). Therefore, the monthly differences of percentiles were compared (see Figure 8). Both stations show a general reduction of noise levels for the observed months. At FEB the strongest noise reductions are apparent in April and May 2020 (up to 5 dB) for low percentiles—indicating a reduction of background noise. The percentage of time with decreased noise levels increased from March to July to almost 90% and reduces to less than 50% in August (see Figure 8A). At ARK the strongest noise reduction is also observed in May (up to 2 dB) for low percentiles. The percentage of time with reduced noise levels decreases in July, but stays above 70% during the whole assessment period. Small increases in noise levels at high percentiles can be observed in April at FEB and from May to August at ARK, indicating an increase of intermittent noise during these periods in 2020 compared with previous years.
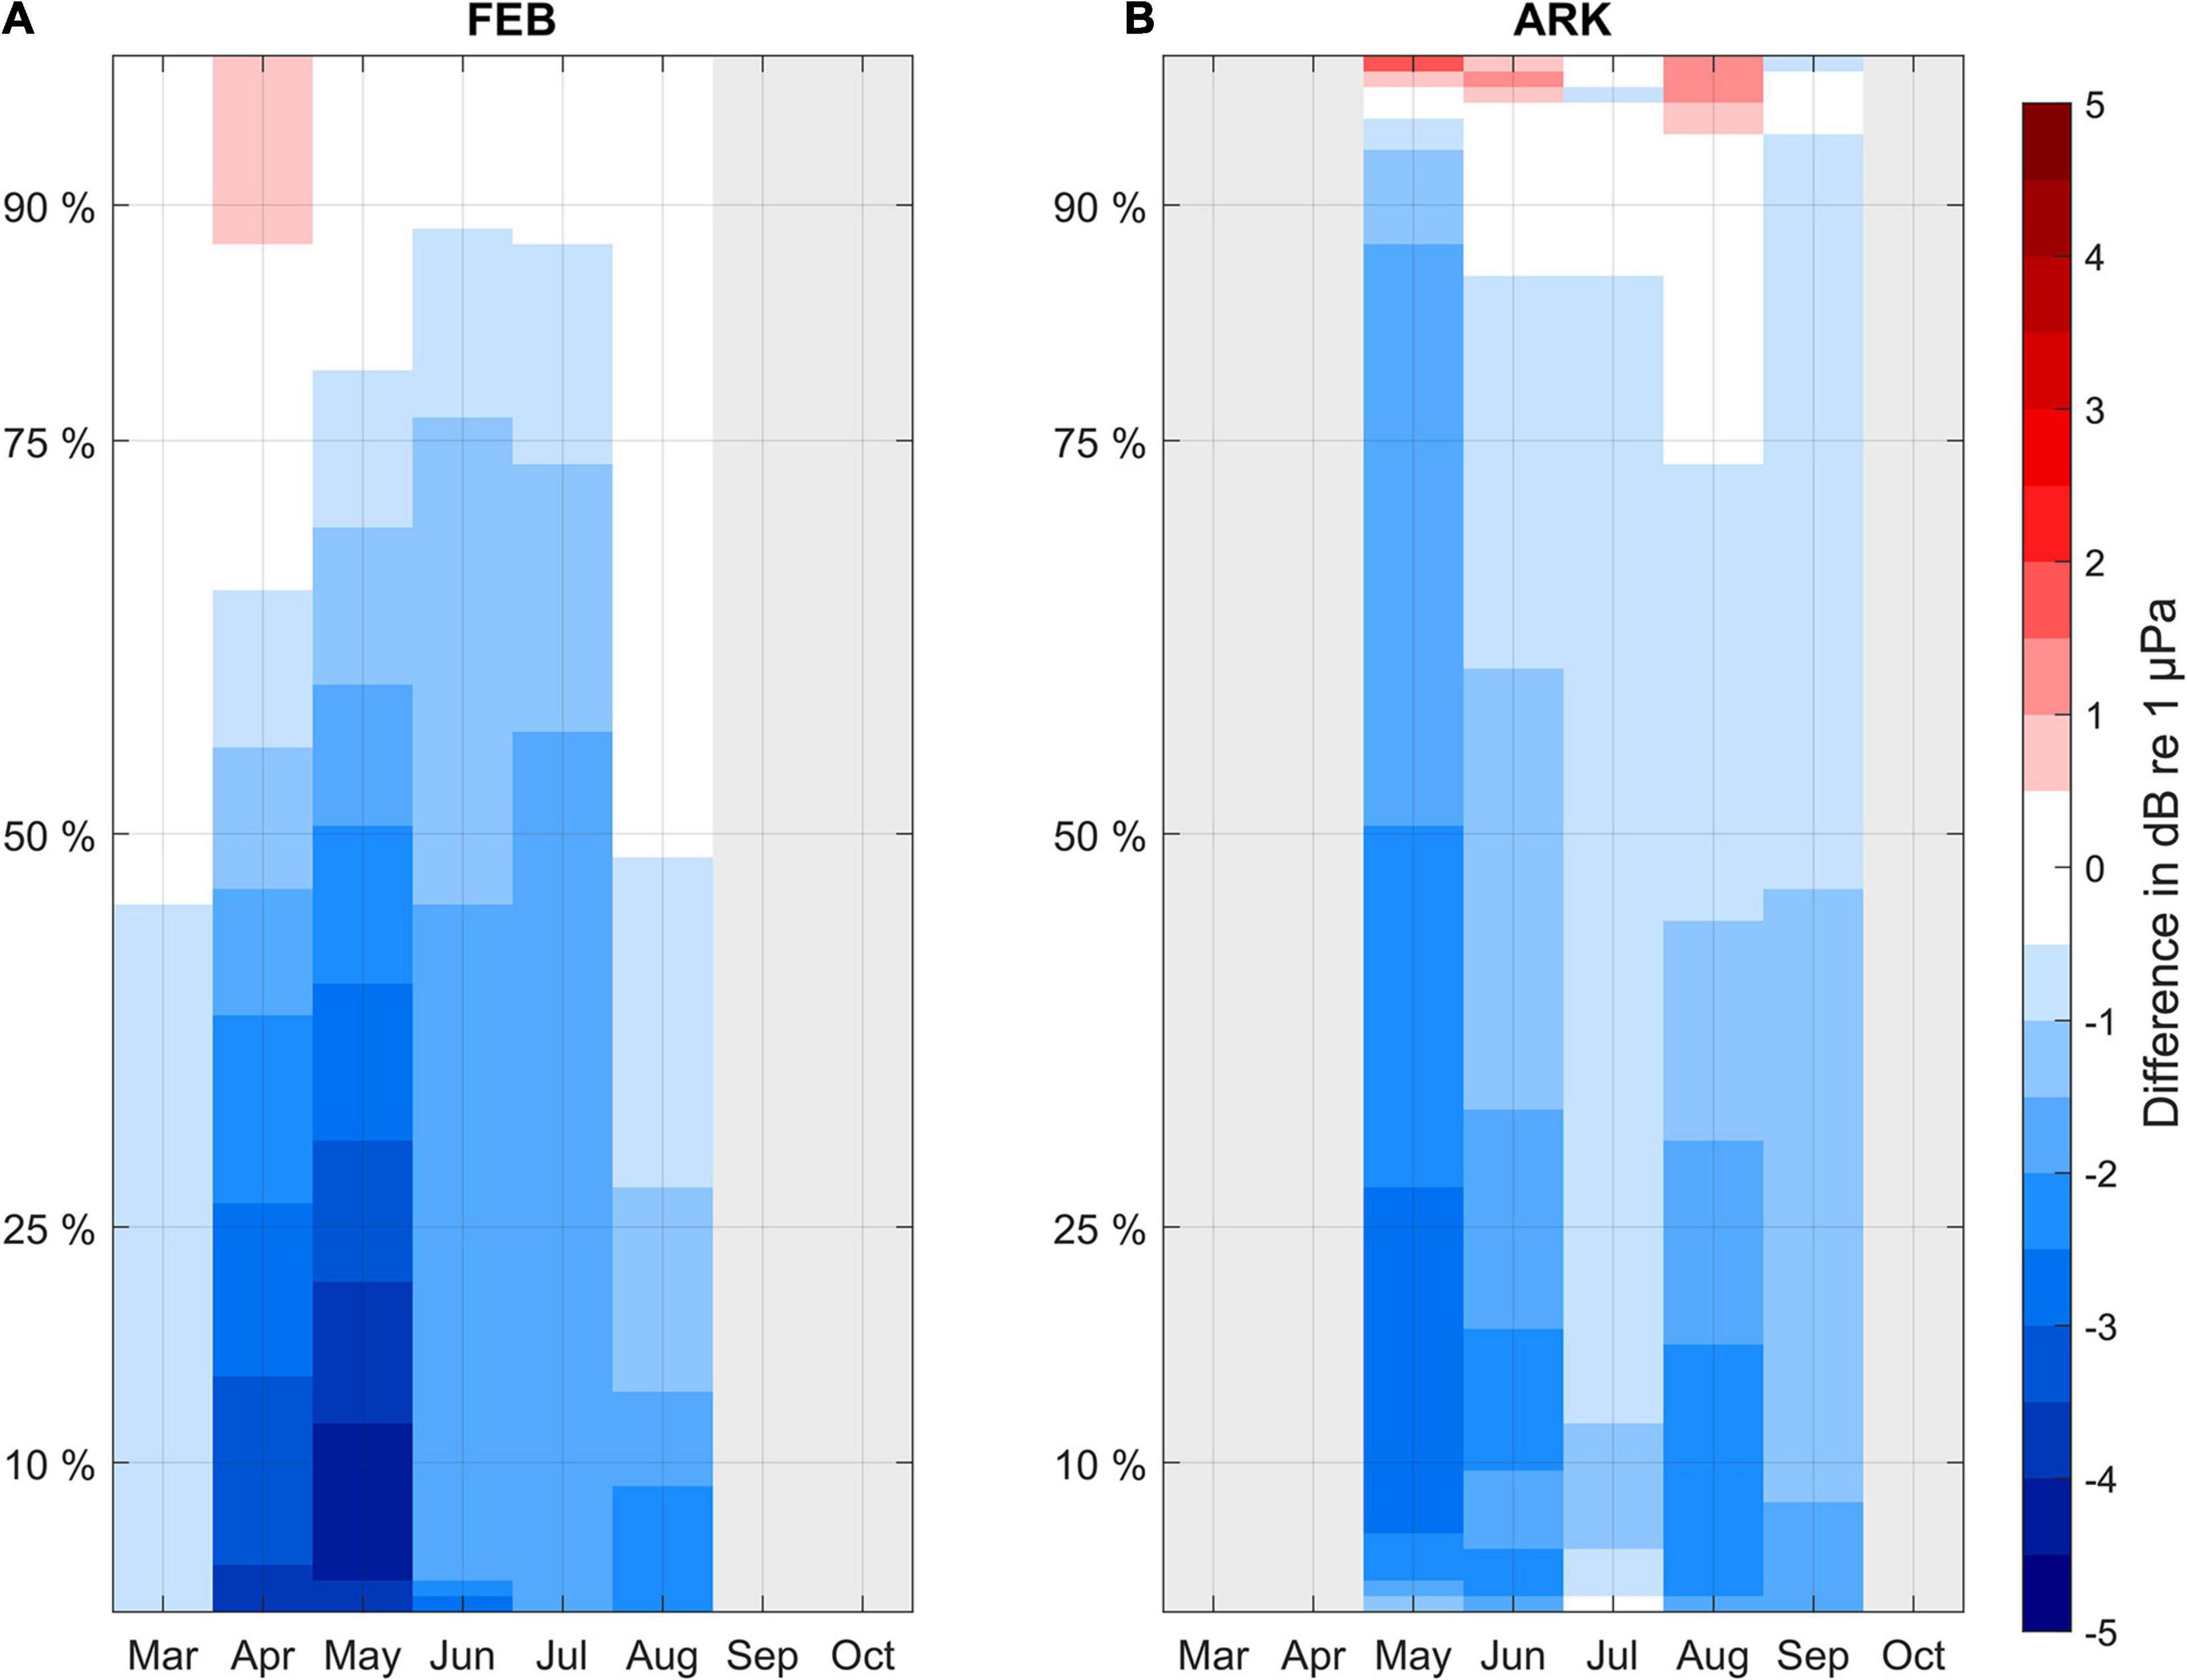
Figure 8. Monthly differences of percentiles in the low-frequency band (10 Hz–1 kHz) for acoustic data measured before (2013–2019) and during Covid-19 pandemic (2020) at FEB (A) and at ARK (B). Light gray area indicates no data availability.
Comparing noise levels of same sea state in same calendar months across years altered the observed noise reductions. At FEB, the mean difference (before and during Covid-19) in the low-frequency band is 1.1 dB and at ARK it is 1.9 dB. It appears, that including the sea state had a greater impact on the comparison at ARK, than it did for the comparison at FEB. The count of individual recordings, which have been compared per sea state and calendar month is summarized in Tables 2, 3. For each calendar month and sea state a Wilcoxon rank sum test was performed in order to test whether the medians of the low-frequency band levels (before and after the pandemic’s onset) are equal. The Wilcoxon rank sum test was chosen because none of the compared noise level sets were distributed normally. This was checked by performing a Shapiro-Wilk test for each set of noise levels per calendar month and sea state. At a 95% confidence level only the compared medians in March at FEB for sea state 4 did not differ significantly. For all other calendar months and sea states the differences between the medians are statistically significant. In Figure 9, the averages of the comparisons per sea state are shown for each calendar month (purple). Additionally, as a reference the monthly noise reductions as explained in section “Monthly Comparison for Low Frequency Bands and High Frequency Bands.” are shown (green).

Table 2. Available recordings at FEB before/and after the onset of the Covid-19 pandemic per calendar month and sea state; N/A indicates months, where no comparison was possible due to lack of data (2013–2020).

Table 3. Available recordings at ARK before/and after the onset of the Covid-19 pandemic per calendar month and sea state; N/A indicates months, where no comparison was possible due to lack of data (2013–2020).
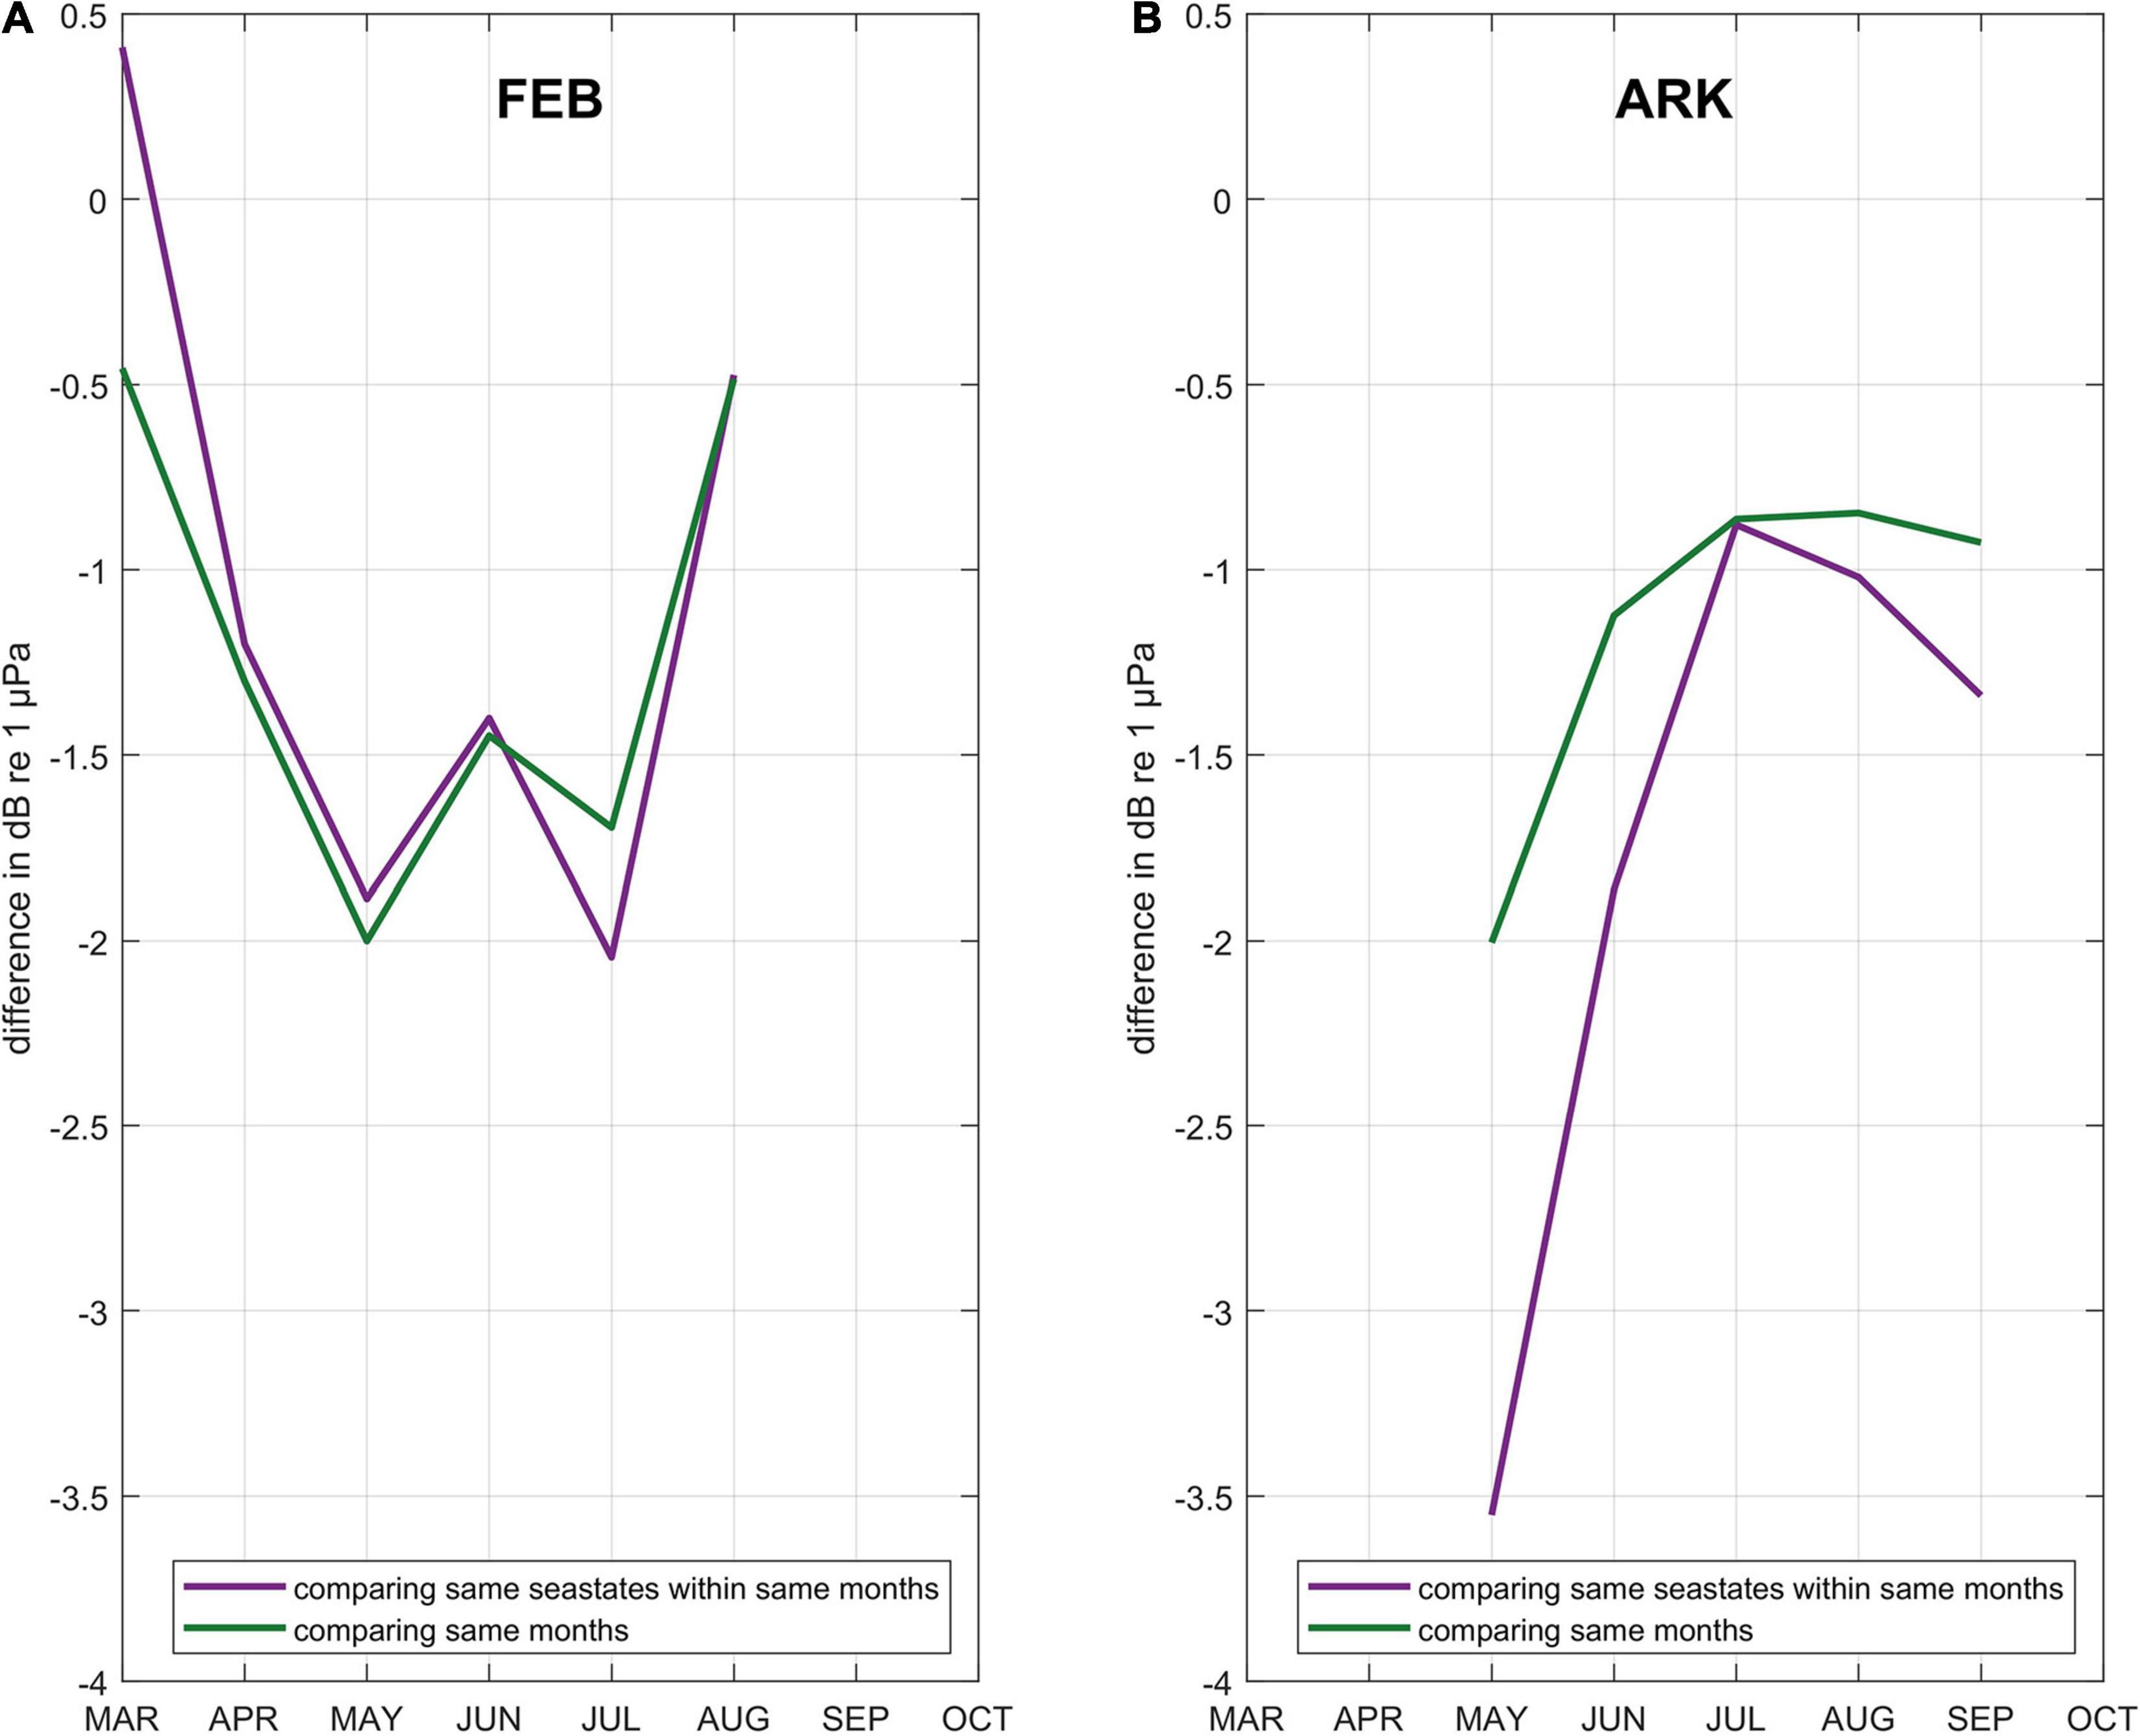
Figure 9. Differences of medians of low frequency (10 Hz–1 kHz) sound pressure levels per calendar month (before and after March 1, 2020) at FEB (A) and at ARK (B); all recordings per calendar month are compared (green); only periods of same sea state within same calendar month are compared with each other (purple).
At FEB, considering the different sea states only altered the observed noise reduction in the low-frequency band by 0.1 dB. The pattern of the monthly differences is also not changed much when the sea states are included in the comparisons. The greatest difference between both methods is visible in March. The low sea states in March 2020 (see Figure 4) may have led to an overestimation of the observed noise reduction. In contrast to that the sea states in July 2020 were lower than during previous years, which might have led to an underestimation of the noise reduction. Although one would expect to also see an overestimation of noise reduction in August (very low sea states in 2020 compared with previous years), such a relation cannot be observed.
Comparing only time periods of equal sea states had a profound effect on the observed noise reduction at ARK increasing the median noise reduction (in the low-frequency band) by another 0.7–1.9 dB. For May, the noise reduction even increased by 1.5–3.5 dB, which corresponds well with observed high sea states during May 2020 (see Figure 4) and the low point of maritime traffic in 2020 (see Figure 6). For the other months no clear relations are apparent between the differences of sea states (between 2020 and previous years) and the differences of noise. It is notable, that differences between the two methods of comparison (considering sea states or not) are greatest during spring and autumn and smaller during summer months.
Monthly median TOLs for low frequencies (up to 1 kHz) were the lowest in 2020 since the start of the recordings in 2013 for both measurement stations. This coincides well with the onset of measures against the spread of the Covid-19 pandemic and the related decrease in commercial shipping. Analysis of our data has shown, that recreational boating also decreased during the first months of the pandemic, but increased significantly during the summer months at both stations. This increase might be associated with international travel restrictions and may have inhibited an even greater reduction of low frequency noise.
At the FEB station, the monthly SPLs for the low-frequency band (10 Hz–1 kHz) were on average 1.2 dB below the median levels of previous years of measurement. This corresponds to a reduction of the sound pressure of 13%. At the ARK station, a decrease of 1.2 dB in the low-frequency band was also observed, which is again equivalent to a decrease of 13% in sound pressure.
This is slightly less than the 1.5 dB reduction at 100 Hz (weekly power spectral density), which Thomson and Barclay (2020) described for the Pacific coast of Canada during the first weeks of the Covid-19 pandemic. Obviously, the observed metrics differ regarding their bandwidth and observation period so reductions are not directly comparable.
Ryan et al. (2021) have analysed the decrease in sound pressure in the 63 Hz TOB in the Monterey Bay National Marine Sanctuary following the Covid-19 pandemic onset. They report, that the mean TOL reduced by 1.9 dB re 1 μPa2 Hz–1 in June 2020. The highest reductions of median 63 Hz -TOLs at FEB and ARK are similar (up to 1.9 dB in July at FEB and in May at ARK). Although not the same quantities were compared (medians instead of geometric means), the levels of reduction are of same magnitude.
To further put the observed reduction into perspective, it is worth mentioning the broadband (10 Hz–100 kHz) noise reduction of 1.2 dB, that Joy et al. (2019) measured during a voluntary commercial vessel slowdown trial at the Lime Kiln listening station in the Haro Strait. Their decade band analysis even showed a 3.1 dB reduction in the 10–100 Hz band and a 2.3 dB reduction in the 100–1,000 Hz band. Although the given frequency ranges are again different, complicating direct comparisons, it is still noteworthy that similar or even higher rates of noise reduction were observed during the voluntary slowdown trial than during the extensive decrease in commercial shipping, that we have observed.
The reduction in sound pressure at FEB and ARK for some low TOBs was much higher than the average reduction at both stations. Considering all available data, at FEB a maximum reduction of 5.6 dB was recorded in July (at 10 Hz TOB). At ARK a maximum reduction of 5.4 dB in May (at 20 Hz TOB) was observed. Reductions of this magnitude correspond to a reduction of sound pressure of almost 50% for the respective TOB and month.
During the pandemic in 2020 the high-frequency band (1–12.5 kHz) at FEB was the lowest for all measurements taken after 2016. But this was not observed for the ARK station. The high-frequency band levels at ARK are within the range of the previous years. Data from before 2016 shows considerable low TOLs for high frequencies, which was associated with the lower noise floor at high frequencies of the used instrumentation. All measurements after 2016 were performed with the Standard hydrophone type, which has higher self-noise levels at high frequencies (up to 10 dB).
The analysis of the percentiles of the low-frequency band levels showed a noise reduction during most of the time after the onset of the Covid-19 pandemic at both stations. At FEB, the percentage of time with reduced noise levels increased from March to June and decreased thereafter, which corresponds with the increase of unique MMSI numbers in July. Whereas such a clear relation between traffic and noise reduction is not apparent at ARK, noise level reductions are evident during most of the time (up to 95% of the time).
To properly compare anthropogenic effects on the soundscape, it is necessary to ensure that time periods of same natural ambient noise were compared with each other. Monthly medians were compared to consider seasonal variations. To further consider variations within the same calendar months, periods of same sea state were compared. It was shown that this approach mainly altered results at the ARK station. The greatest effects of comparing only periods of same sea state could be observed during the windier autumn and spring months at ARK. At ARK, high sea states prevail more frequently compared to FEB. Therefore, it is concluded, that considering same sea states only is a method that is of less importance when analyzing coastal stations (like FEB), but becomes more relevant for offshore locations where higher sea states and stronger winds prevail.
The comparison of same sea states within same calendar months yielded a decrease in the low frequency band (10 Hz–1 kHz) of 1.1 dB at FEB and 1.9 dB at ARK (11 and 20% reduction of sound pressure, respectively). However, this method cannot be considered as more reliable than comparing only same calendar months. Although comparing periods of equal sea state may be a good proxy for identifying comparable natural conditions, this method does not necessarily contrast periods of comparable anthropogenic activity. Particularly with regard to the stations’ proximity to the coast ferry passages, wind farm servicing, recreational boating or other activities may occur more often during the day than during the night.
Both presented methods are subject to uncertainties. Either it cannot be ensured, that periods of comparable natural conditions are compared (when comparing same calendar months only) or it cannot be ensured, that periods of same anthropogenic activity are compared (when considering only periods of same sea states). However, both methods yield results that indicate a comparable reduction of low-frequency noise levels during the first months of the Covid-19 pandemic.
Both stations continue to be operated by BSH as part of national underwater noise monitoring. As such, future measurements will further help to interpret and classify the results in terms of the relation of low frequency noise and shipping and countermeasures tackling anthropogenic noise can be evaluated. This study might further serve as a starting point to investigate ecological effects of the decrease in shipping noise due to the Covid-19 pandemic. Seizing the opportunity, BACI -studies on the distribution of noise sensitive species (e.g., the critically endangered harbor porpoise) before and during the pandemic could potentially complement studies like ours.
The raw data supporting the conclusions of this article will be made available by the authors, without undue reservation.
FB processed the measured data, performed the analysis, and designed the figures, and took the lead in writing the manuscript. J-GF supervised the project. DK and J-GF verified the results and were in charge of overall direction and planning. All authors designed and performed the measurements, discussed the results, and contributed to the final manuscript.
The authors declare that the research was conducted in the absence of any commercial or financial relationships that could be construed as a potential conflict of interest.
We are immensely grateful to Ewan Edwards from Marine Scotland for his edits and comments that improved our manuscript significantly. We also thank our colleagues Martin Moritz, Kerstin Jochumsen, Kai Herklotz, Carina Juretzek, and Helmut Schmid from BSH, who provided insight and expertise that greatly assisted our research. We also owe gratitude to the Crew of the BSH research vessel DENEB, who enabled the data collection at both measurement sites. We further like to acknowledge the BSH project Sound Mapping (order number: 10044386), in which the tool BSoundH was developed, which was used for data processing in this study. In this regard we especially like to thank Stephanus Volke from Fraunhofer IDMT.
AIS, Automatic Identification System; ARK, Arkona station; BACI, Before-After-Control-Impact; BIAS, Baltic Sea Information on the Acoustic Soundscape; BSH, Federal Maritime and Hydrographic Agency of Germany; DWD, German Weather Service; EEZ, Exclusive Economic Zone; EWAM, European Wave Model; FEB, Fehmarnbelt station; Fraunhofer IDMT, Fraunhofer Institute for Digital Media Technology; GES, Good Environmental Status; GT, Gross Tonnage; ICES, International Council for the Exploration of the Sea; ICON, Icosahedral Non-hydrostatic Weather and Climate Model; IMO, International Maritime Organization; IQOE, International Quiet Ocean Experiment; MarinEARS, Marine Explorer And Registry of Sound; MMSI, Maritime Mobile Service Identity; MSFD, Marine Strategy Framework Directive; PIMO, Pilot Monitoring of Continuous Sound in German Waters; SM2M/SM3M, Song Meter 2 Marine/Song Meter 3 Marine; SPL, Sound Pressure Level; TOB, Third-Octave-Band; TOL, Third-Octave-Level; TSG Noise, Technical Sub-Group on Underwater Noise; UBA, German Environment Agency.
Brøker, I., Hansen, I., and Middelboe, A. (2014). Eia for the fehmarnbelt crossing – the world’s longest immersed tunnel. Coast. Eng. Proc. 1:47. doi: 10.9753/icce.v34.management.47
BSH. (2021). Das Überwachungsmessnetz des BSH. Available online at: https://www.bsh.de/DE/THEMEN/Beobachtungssysteme/Messnetz-MARNET/messnetz-marnet_node.html
Crawford, N., Robinson, S., and Wang, L. (2020). Standard Procedure for Equipment Performance, Calibration and Deployment. Belgium: European Union.
Dargahi, B., Kolluru, V., and Cvetkovic, V. (2017). Multi-Layered Stratification in the Baltic Sea: insight from a Modeling Study with Reference to Environmental Conditions. J. Marine Sci. Eng. 5:2. doi: 10.3390/jmse5010002
Dekeling, R., Tasker, M., Sandra, V. D. G., Ainslie, M., Andersson, M., André, M., et al. (2014). Monitoring Guidance for Underwater Noise in European Seas, Part I: Executive Summary. Luxembourg: Publications Office of the European Union.
Elken, J., and Matthäus, W. (2008). Baltic Sea oceanography. Assessment of Climate Change for the Baltic Sea Basin. Unite Kingdon: BALTEX.
EMODnet Human Activities (EHA). (2019). Vessel ensity Map. Available online at: https://www.emodnet-humanactivities.eu/search-results.php?dataname=Vessel+Density+(accessed March 23, 2021).
European Commission (EC). (2008). Directive 2008/56/EC of the European Parliament and of the Council Establishing a Framework for Community Action in the Field of Marine Environmental Policy. (Marine Strategy Framework Directive). Belgium: European Union.
Fischer, J., Kühnel, D., Basan, F., and Herklotz, K. (2019). Pilot-Monitoring der Impulshaften und kontinuierlichen Unterwasserschalleinträge in Dem Deutschen Meere Unter der EU-Meeresstrategie-Rahmenrichtlinie (PIMO). Germany: Umweltbundesamt.
Gibney, E. (2020). Coronavirus lockdowns have changed the way Earth moves. Nature 580, 176–177. doi: 10.1038/d41586-020-00965-x
Haxel, J., Dziak, B., and Matsumoto, H. (2013). Observations of shallow water marine ambient sound: the low frequency underwater soundscape of the central Oregon coast. J. Acoust. Soc. Am. 05, 2586–2596. doi: 10.1121/1.4796132
Hermannsen, L., Beedholm, K., Tougaard, J., and Madsen, P. (2014). High frequency components of ship noise in shallow water with a discussion of implications for harbor porpoises (Phocoena phocoena). J. Acoust. Soc. Am. 136:1640. doi: 10.1121/1.4893908
Hildebrand, J. (2009). Anthropogenic and natural sources of ambient noise in the ocean. Mar. Ecol. Progr. Ser. 395, 5–20. doi: 10.3354/meps08353
IEC. (2019). Underwater acoustics - IEC 60565-2:2019; Hydrophones - Calibration of hydrophones - Part 2: procedures for low frequency pressure calibration. Switzerland: International Electrotechnical Commission.
IMO. (2014). Available online at: https://wwwcdn.imo.org/localresources/en/OurWork/IIIS/Documents/CL.2554-Rev-3_IMO%20Unique%20Company%20Identification%20Number%20Scheme.pdf (accessed February 11, 2021).
Joy, R., Tollit, D., Wood, J., MacGillivray, A., Li, Z., Trounce, K., et al. (2019). Potential Benefits of Vessel Slowdowns on Endangered Southern Resident Killer Whales. Front. Mar. Sci. 06:344. doi: 10.3389/fmars.2019.00344
Leaper, R. (2019). The Role of Slower Vessel Speeds in Reducing Greenhouse Gas Emissions, Underwater Noise and Collision Risk to Whales. Front. Mar. Sci. 6:505. doi: 10.3389/fmars.2019.00505
March, D., Metcalfe, K., Tintoré, J., and Godley, B. J. (2020). Tracking the global reduction of marine traffic during the COVID-19 pandemic. Nat. Commun. 12:2415.
Merchant, N., Fristrup, K. M., Johnson, M. P., Tyack, P. L., Witt, M. J., Blondel, P., et al. (2014). Measuring acoustic habitats. Methods Ecol. Evol. 6, 257–265.
Merchant, N. D., Witt, M. J., Blondel, P., Godley, B. J., and Smith, G. H. (2012). Assessing sound exposure from shipping in coastal waters using a single hydrophone and Automatic Identification System (AIS) data. Mar. Poll. Bull. 64, 1320–1329. doi: 10.1016/j.marpolbul.2012.05.004
Millefiori, L. M., Braca, P., Zissis, D., Spiliopoulos, G., Marano, S., Willett, P. K., et al. (2020). COVID-19 Impact on Global Maritime Mobility. arXiv 09.
Mustonen, M., Klauson, A., Andersson, M., Clorennec, D., Folegot, T., Koza, R., et al. (2019). Spatial and Temporal Variability of Ambient Underwater Sound in the Baltic Sea. Sci. Rep. 9:13237.
Outzen, O. (2021). Report on the Oceanographic Conditions of Site O-1.3. Available online at: https://pinta.bsh.de/2021/O-1.3 (accessed May 28, 2021).
Reinert, D., Prill, F., Frank, H., Denhard, M., Baldauf, M., Schraff, C., et al. (2021). DWD Database Reference for the Global and Regional ICON and ICON-EPSForecasting System. Germany: Deutscher Wetterdienst.
Ryan, J. et al. (2021). Reduction of Low-Frequency Vessel Noise in Monterey Bay National Marine Sanctuary During the COVID-19 Pandemic. Frontiers in Marine Science, 06, Issue 8.
The National Meteorological Library and Archive (NMLA). (2010). Fact sheet 6 - The Beaufort Scale. Avaialble online at: https://www.metoffice.gov.uk/binaries/content/assets/metofficegovuk/pdf/research/library-and-archive/library/publications/factsheets/factsheet_6-the-beaufort-scale.pdf (accessed 17 June, 2021).
Thomson, D., and Barclay, D. (2020). Real-time observations of the impact of COVID-19 on underwater noise. J. Acoust. Soc. Am. 147:3390. doi: 10.1121/10.0001271
Tyack, P. L., Miksis-Olds, J., Ausubel, J., and Urban, E. R. JR. (2021). Measuring ambient ocean sound during the COVID-19 pandemic. Eos 102. doi: 10.1029/2021EO155447
VesselFinder® (2020). Available online at: https://www.vesselfinder.com/historical-ais-data.
WAMDI Group. (1988). The WAM model - a third generation ocean wave prediction model. J. Phys. Oceanogr. 18, 1775–1810. doi: 10.1175/1520-0485(1988)018<1775:twmtgo>2.0.co;2
Keywords: Baltic Sea, BACI, underwater acoustics, soundscapes, Covid-19
Citation: Basan F, Fischer J-G and Kühnel D (2021) Soundscapes in the German Baltic Sea Before and During the Covid-19 Pandemic. Front. Mar. Sci. 8:689860. doi: 10.3389/fmars.2021.689860
Received: 01 April 2021; Accepted: 08 June 2021;
Published: 01 July 2021.
Edited by:
Edward Urban, Scientific Committee on Oceanic Research, United StatesReviewed by:
Tetyana Margolina, Naval Postgraduate School, United StatesCopyright © 2021 Basan, Fischer and Kühnel. This is an open-access article distributed under the terms of the Creative Commons Attribution License (CC BY). The use, distribution or reproduction in other forums is permitted, provided the original author(s) and the copyright owner(s) are credited and that the original publication in this journal is cited, in accordance with accepted academic practice. No use, distribution or reproduction is permitted which does not comply with these terms.
*Correspondence: Fritjof Basan, ZnJpdGpvZi5iYXNhbkBic2guZGU=
Disclaimer: All claims expressed in this article are solely those of the authors and do not necessarily represent those of their affiliated organizations, or those of the publisher, the editors and the reviewers. Any product that may be evaluated in this article or claim that may be made by its manufacturer is not guaranteed or endorsed by the publisher.
Research integrity at Frontiers

Learn more about the work of our research integrity team to safeguard the quality of each article we publish.