
94% of researchers rate our articles as excellent or good
Learn more about the work of our research integrity team to safeguard the quality of each article we publish.
Find out more
ORIGINAL RESEARCH article
Front. Mar. Sci., 14 July 2021
Sec. Marine Biogeochemistry
Volume 8 - 2021 | https://doi.org/10.3389/fmars.2021.688008
This article is part of the Research TopicAcidification and Hypoxia in Marginal SeasView all 36 articles
 Jean-Philippe Gac1
 Pierre Marrec2
 Thierry Cariou1Emilie Grosstefan3Éric Macé1Peggy Rimmelin-Maury3Marc Vernet1
 Yann Bozec1*
Weekly and bi-monthly carbonate system parameters and ancillary data were collected from 2008 to 2020 in three coastal ecosystems of the southern Western English Channel (sWEC) (SOMLIT-pier and SOMLIT-offshore) and Bay of Brest (SOMLIT-Brest) located in the North East Atlantic Ocean. The main drivers of seasonal and interannual partial pressure of CO2 (pCO2) and dissolved inorganic carbon (DIC) variabilities were the net ecosystem production (NEP) and thermodynamics. Differences were observed between stations, with a higher biological influence on pCO2 and DIC in the near-shore ecosystems, driven by both benthic and pelagic communities. The impact of riverine inputs on DIC dynamics was more pronounced at SOMLIT-Brest (7%) than at SOMLIT-pier (3%) and SOMLIT-offshore (<1%). These three ecosystems acted as a weak source of CO2 to the atmosphere of 0.18 ± 0.10, 0.11 ± 0.12, and 0.39 ± 0.08 mol m–2 year–1, respectively. Interannually, air-sea CO2 fluxes (FCO2) variability was low at SOMLIT-offshore and SOMLIT-pier, whereas SOMLIT-Brest occasionally switched to weak annual sinks of atmospheric CO2, driven by enhanced spring NEP compared to annual means. Over the 2008–2018 period, monthly total alkalinity (TA) and DIC anomalies were characterized by significant positive trends (p-values < 0.001), from 0.49 ± 0.20 to 2.21 ± 0.39 μmol kg−1 year−1 for TA, and from 1.93 ± 0.28 to 2.98 ± 0.39 μmol kg–1 year–1 for DIC. These trends were associated with significant increases of calculated seawater pCO2, ranging from +2.95 ± 1.04 to 3.52 ± 0.47 μatm year–1, and strong reductions of calculated pHin situ, with a mean pHin situ decrease of 0.0028 year–1. This ocean acidification (OA) was driven by atmospheric CO2 forcing (57–66%), Sea surface temperature (SST) increase (31–37%), and changes in salinity (2–5%). Additional pHin situ data extended these observed trends to the 2008–2020 period and indicated an acceleration of OA, reflected by a mean pHin situ decrease of 0.0046 year–1 in the sWEC for that period. Further observations over the 1998–2020 period revealed that the climatic indices North Atlantic Oscillation (NAO) and Atlantic Multidecadal Variability (AMV) were linked to trends of SST, with cooling during 1998–2010 and warming during 2010–2020, which might have impacted OA trends at our coastal stations. These results suggested large temporal variability of OA in coastal ecosystems of the sWEC and underlined the necessity to maintain high-resolution and long-term observations of carbonate parameters in coastal ecosystems.
Coastal ecosystems are often associated with important and variable inputs of nutrients (phosphates, nitrates, nitrites, and silicates) via river discharge, which induce large seasonal and interannual variability of the carbonate system (Gypens et al., 2009, 2011). High nutrient concentrations increase carbon absorption by promoting biological production (Elser et al., 2007). Up to 30% of primary production [and organic matter (OM) remineralization] is concentrated in coastal shelf zones (Walsh et al., 1988; de Haas et al., 2002; Bauer et al., 2013), leading to high uptake (and release) of dissolved inorganic carbon (DIC) and partial pressure of CO2 (pCO2) (Thomas et al., 2005). In addition, natural riverine carbon originating from the lithosphere and organic matter of the terrestrial biosphere (Ludwig et al., 1998) are partly exported to coastal ecosystems (Hartmann et al., 2014). Finally, depending on the nature of the soil, weathering processes can either increase or decrease DIC and total alkalinity (TA) (Hartmann et al., 2009; McGrath et al., 2019) in surface waters. All of these intricate interactions make it difficult to assess the drivers of the carbonate system in the diverse coastal ecosystems.
Continental margins represent only 4.5% of the global ocean uptake of anthropogenic carbon (Bourgeois et al., 2016), estimated at 2.6 ± 0.3 PgC year–1 of CO2 (31 ± 4% of anthropogenic CO2 emissions) (Gruber et al., 2019), yet they are particularly vulnerable to anthropogenic forcing, such as urban development, atmospheric deposition, from fossil fuel combustion and agricultural activities. All of these anthropogenic stressors can have compensatory or additive effects on the CO2 system (Doney, 2010; Sunda and Cai, 2012; Da et al., 2018), and consequently on potential coastal seawater acidification (Borges et al., 2010; Borges and Gypsens, 2010; Wallace et al., 2014; Carstensen and Duarte, 2019). Ocean acidification (OA) has been ongoing over the last 250 years, with a pH decrease of 0.11 units in the global ocean, equivalent to a hydrogen ion concentration increase of 28% (Gattuso et al., 2015). Coastal acidification can be far more dramatic relative to the open ocean as a result of multiple stressor interactions (Duarte et al., 2013; Osborne et al., 2020). OA has major consequences, particularly for organisms with shells or skeletons composed of calcium carbonate (CaCO3) (Doney et al., 2020). Coastal ecosystems can experience extreme OA hotspots due to the intrusion of acidified water with low aragonite saturation states (ΩArag, Feely et al., 2010, 2016; Chan et al., 2017; Fennel et al., 2019) or conversely constitute refuges with more stable pH (Chan et al., 2017). Carbon and pH variability affect algal physiology, impacting phytoplankton inorganic carbon fixation (Raven et al., 2017), and may contribute to increased harmful algal blooms (Fu et al., 2012; Flynn et al., 2015; Raven et al., 2020).
Monitoring of physical and biogeochemical processes in seawater is essential to understand the evolution of oceans, especially in the context of increasing temperature and atmospheric CO2 (IPCC, 2013). Recent decades have seen the emergence of a large number of CO2 monitoring programs in the open ocean (Bates et al., 2014; Sutton et al., 2017). Monitoring stations are distributed around the Pacific (e.g., Munida, Currie et al., 2011; Bates et al., 2014; WHOTS, ALOHA, Sutton et al., 2017) and the Atlantic (e.g., ESTOC, González-Dávila et al., 2010; BATS, Bates et al., 2014), and cover a wide range of latitudes, from sub-polar waters (Iceland/Iriminger seas, Olafsson et al., 2009, 2010; Bates et al., 2014) to tropical waters (CARIACO, Caribbean Sea, Astor et al., 2013; Taylor et al., 2012; Bates et al., 2014; Muller-Karger et al., 2019). The SOOP-CO2 provided pCO2 data acquired from ships of opportunity1, while the growing BGC-Argo array (Claustre et al., 2020) will provide open ocean pH observations, in addition to salinity-derived TA. SOCAT (Bakker et al., 2016) and LDEO Global Surface Database (Takahashi et al., 2020) contribute to these international efforts by compiling quality CO2 observations from the scientific community, while GLODAP (Lauvset et al., 2016) and OceanSODA-ETHZ (Gregor and Gruber, 2021) databases provide global gridded data of the open ocean carbonate system. The limited CO2 system variability in the oceanic environment, compared to coastal ecosystems, favors observations of the alterations associated to climate change such as carbon accumulation or OA. Global estimates of OA in the open ocean were estimated at −0.0018 ± 0.0004 year–1 for the period 1991–2011 (Lauvset et al., 2015) and relate to pCO2 increase of 1.2 ± 0.5 μatm year–1 to 2.1 ± 0.5 μatm year–1 in different ocean basins (Takahashi et al., 2009, 2014). These trends are highly linked to the studied periods and can vary regionally and seasonally (Leseurre et al., 2020). Long-term monitoring in nearshore ecosystems is particularly relevant since these ecosystems host large stocks of shellfish species sensitive to ongoing OA (Doney et al., 2020), yet remain scarce. Coastal margins present additional challenges because of the intense daily, seasonal, and interannual variability associated to these environments (riverine inputs, climatic, and anthropogenic drivers), which make it more challenging to observe trends related to climate change (Kapsenberg et al., 2017; Reimer et al., 2017a; Chen and Hu, 2019).
In the North East Atlantic Ocean, a recent initiative by the Global Ocean Acidification Network (GOA-ON2) has aimed to coordinate, encourage, and maintain long-term observations of the CO2 system at local and national scales. In this context, we report on three time series of carbonate parameters in the southern Western English Channel off Roscoff (SOMLIT-pier and SOMLIT-offshore) and in the Bay of Brest (SOMLIT-Brest), initiated within the French network for the monitoring of coastal environments (SOMLIT3). From 2008 to 2020, we performed weekly to bimonthly observations of carbonate system and ancillary physical and biogeochemical parameters at these northeast Atlantic Ocean coastal stations. The present study, which builds on the work of Salt et al. (2016) and Gac et al. (2020), aims to decipher, for the first time, trends and drivers of OA in NE Atlantic coastal waters based on long-term time series. In light of the relatively long duration of the study, we attempt to identify the main factors influencing the variability of the carbonate system from local [rivers, Net Ecosystem Production (NEP)] to large-scale [North Atlantic Oscillation (NAO) and Atlantic Multidecadal Variability (AMV)] processes.
This study focused on coastal waters of the English Channel and the Iroise Sea, located in one of the world’s largest temperate continental margins, the North West European shelf. As part of SOMLIT, two sites (Roscoff and Brest, Figure 1) are sampled bimonthly since 2008 to monitor physical, chemical, and biological parameters, including carbonate system parameters. The region is characterized by low temperature ranges between winter and summer, by sustained wind throughout the year with frequent storms from fall to spring, and by heavy rainfall, with a maximum monthly mean rainfall during December (140 mm at Brest and 125 mm at Roscoff), causing significant discharges of fresh water from many rivers and estuaries (Tréguer et al., 2014). Large-scale hydro-climatic indices such as the NAO (Hurrell, 1995) and the AMV can significantly influence the climate regimes in the area. AMV has been linked for example with decadal variations in temperature and rainfall patterns (Sutton et al., 2018). The NAO produces large changes in surface air temperatures, storm-track position, and precipitation over the North Atlantic and is strongly related to changes in sea surface temperature (SST) at the Brest and Roscoff sites (Tréguer et al., 2014 and reference therein). Freshwater inputs release important nutrient stocks into the aquatic environment (Meybeck et al., 2006; Dürr et al., 2011; Tréguer and De La Rocha, 2013), fueling phytoplankton blooms (e.g., Del Amo et al., 1997; Beucher et al., 2004). In these ecosystems, nutrient inputs maintain sustained phytoplankton biomass during the summer.
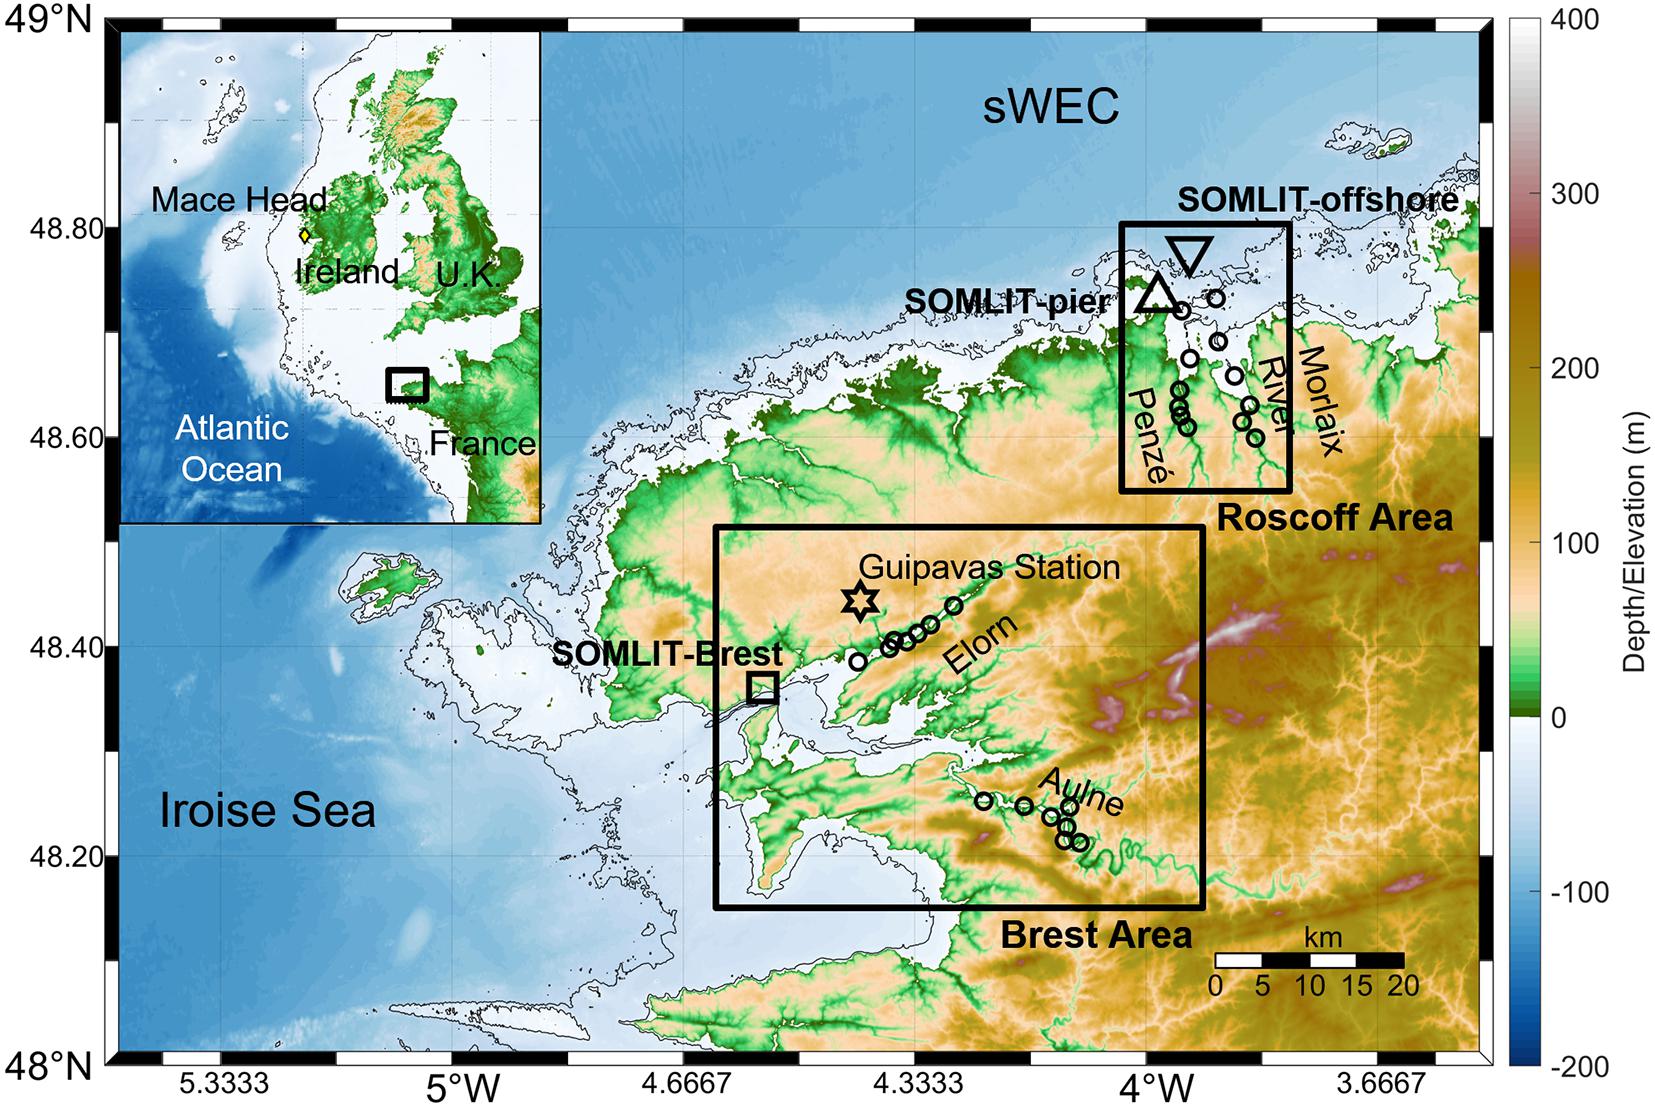
Figure 1. Map, bathymetry, and topography of the study area in the southern Western English Channel (sWEC), with the two regions of study: the Brest region, with the SOMLIT-Brest station (black square), the Aulne and Elorn rivers; and the Roscoff region, with SOMLIT-pier (upward black triangle) and SOMLIT-offshore (downward black triangle) stations and the Penzé and Morlaix rivers. Black circles indicate the locations of sampling in the rivers and the black star the location of the Meteo France station (“Guipavas station”) for wind speed data. Bathymetry contours show 20 and 50-m isobaths. (Top left) Map and bathymetry (200-m isobath) of the North Atlantic Ocean with the location of the Mace Head atmospheric station (yellow diamond); the black frame represents the zoom on the study area. Note that the color map (–6000 to 2000 m) is different from the main map.
SOMLIT-Brest is located in the Bay of Brest, a macrotidal estuary located in a semi-enclosed bay covering 180 km2. The hydrology is controlled by exchanges of high salinity and relatively warm waters from the Atlantic Ocean and freshwater inputs from two main estuaries: the Aulne (annual mean discharge during the study period of Qmean = 24.0 ± 24.4 m3 s–1) and the Elorn (Qmean = 5.9 ± 5.0 m3 s–1). Samples were taken at a station near the coast (48°21′32″N; 4°33′07″W) characterized by a shallow water column (∼10 m), not sufficient to observe seasonal stratification due to intense semi-diurnal tidal streams, with a maximum tidal amplitude of 8 m.
The Roscoff stations are located about 55 km north east of Brest in the south of the Western English Channel (WEC), which is a pathway between the North Atlantic Drift and the North Sea. Two stations (a near-shore station SOMLIT-pier, 48°43′59″N; 3°58′58″W, and an offshore station SOMLIT-offshore, 48°46′49″N; 3°58′14″W) were sampled along the coastal gradient in the Roscoff area, which has freshwater inputs from two small rivers, the Penzé (Qmean = 2.8 ± 2.7 m3 s–1) and the Morlaix river (Qmean = 4.3 ± 3.9 m3 s–1). SOMLIT-pier is located near the coast (∼500 m) with a shallow water column (∼10 m), influenced by continental freshwater inputs and by a strong semi-diurnal tidal cycle, with a maximum tidal amplitude of 8 m. SOMLIT-offshore has a deeper water column (∼60 m), representative of the permanently well-mixed waters of the south of the WEC (Pingree and Griffiths, 1978). The distance between this station and the coast (3.5 km) limits the impact of rainwater and river inflow compared to the SOMLIT-pier station.
Environmental data were collected from 1998 to 2020, whereas carbonate parameters were sampled from July 2008 to December 2020 (see details below). At SOMLIT-Brest (January 1998–2020), sampling took place on a weekly basis at high tide slack. The two Roscoff stations, SOMLIT-offshore (January 1998–2020) and SOMLIT-pier (January 2000–2020), were sampled bimonthly during neap tides and at high tide slack. Sampling in Brest was carried out from the observation pier of Sainte-Anne-du-Portzic, while sampling in Roscoff took place aboard the R/V Neomysis research vessel. During each sampling event, SST measurements were obtained using a Seabird SBE19+, with a temperature accuracy of 0.005°C. Surface seawater (2 m depth at the Brest station and 1 m depth at the Roscoff station) was sampled using a 10-L Niskin bottle. Discrete sea surface salinity (SSS) was measured by storing seawater samples in glass bottles with a rubber seal with analysis conducted in the following months in a temperature-regulated room with a portasal Guidline Salinometer at the SHOM (Service Hydrologique et Océanographique de la Marine) with a precision of 0.002. Samples for dissolved oxygen (DO) measurements were stored in 280-ml brown glass bottles, analyzed after addition of 1.7 ml of Winkler reagent I and II, and kept in the dark in a water bath. DO concentrations were determined by the Winkler method using a potentiometric end-point determination with a Metrohm titrator. The estimated accuracy of this method is 0.2 μM (Carpenter, 1965). To evaluate the impact of non-thermodynamic processes on DO variations, the dissolved oxygen saturation (DO%) was calculated using the equations of Garcia and Gordon (1992) from SST, SSS, and DO values. Chlorophyll-a (Chl a) concentrations were obtained by filtration of 500 ml of seawater through glass-fiber filters (Whatman GF/F) under 0.2 bar vacuum. After storage in plastic tubes at −20°C, Chl a was extracted using the EPA method (1997) with a 90% acetone solution for a few hours at 4°C. Chl a concentrations were determined using a Turner AU10 fluorometer. Nitrate, nitrite, dissolved silicate (DSi), and soluble reactive phosphate (SRP) concentrations were determined following the method of Aminot and Kérouel (2007) using an AA3 auto-analyzer (AXEFLOW) with accuracies of 0.05 μmol L–1 for nitrate and DSi and 0.01 μmol L–1 for SRP and nitrite concentrations.
For carbonate system parameters, TA and DIC measurements were performed from July 2008 to December 2017 at SOMLIT-Brest, from May 2009 to December 2017 at SOMLIT-offshore, and from July 2010 to December 2017 at SOMLIT-pier. Water samples were immediately poisoned with 50 μl of saturated HgCl2. TA and DIC were determined at the SNAPO (Service National d’Analyse des Paramètres Océaniques) using potentiometric analysis following the method of Edmond (1970) and DOE (1994) with accuracies of 2.5 μmol kg–1 for both parameters (see Marrec et al., 2013 for details). A total of 412, 162, and 189 measurements of each parameter were obtained from samples from SOMLIT-Brest, SOMLIT-pier, and SOMLIT-offshore, respectively.
Dissolved inorganic carbon data for 2018–2020 were excluded since unexplained noise appeared among replicates, potentially linked to an extended period of conservations of the samples prior to analysis. Consequently, the SOMLIT-Brest dataset was completed with 72 weekly measurements of pHin situ performed from July 2019 to December 2020. The SOMLIT-pier and SOMLIT-offshore datasets were completed from January 2018 to December 2019 with 48 bi-monthly measurements of TA combined with 72 bi-monthly measurements of pHin situ from January 2018 to December 2020. For these specific periods, TA and pH were collected in 500-ml borosilicate glass bottles and poisoned with 50 μl of saturated HgCl2. TA at SOMLIT-offshore was determined from approximately 51 g of weighed sample at 25°C using a potentiometric titration with 0.1 M HCl using a Titrino 847 plus Metrohm. The balance point was determined by the Gran method (Gran, 1952) according to the method of Haraldsson et al. (1997). The accuracy of this method is ± 2.1 μmol kg–1 (Millero, 2007) and was verified by Certified Reference Material (CRM 131) provided by A. Dickson (Scripps Institute of Oceanography, University of South California, San Diego, United States). pH was determined with an accuracy of 0.002 by spectrophotometry (Perin-Elmer Lambda 11) at a controlled temperature of 25°C with the method of Clayton and Byrne (1993) and corrected by Chierici et al. (1999), using the sulfonephthaleindiprotic indicator meta-CresolPurple (mCP).
The combination of SST, SSS, DIC, TA, DSi, and SRP was used as input parameters for the CO2 chemical speciation model in the CO2sys program (Matlab version by van Heuven et al., 2011, based on calculation of Lewis and Wallace, 1998) to calculate the carbonate system before 2018. For calculation after 2018, SST, SSS, pH, and TA were used as input parameters. K1 and K2 constants were defined based on the last calculations of Waters et al. (2014) on the total pH scale, and the KSO4 dissociation constant was based on Dickson (1990) and Uppstrom (1974). The calculated uncertainties were estimated at 0.6% for pH, 0.5% for DIC, and 14% for aragonite (Millero et al., 2007; McLaughlin et al., 2015). The average of pCO2 uncertainties was close to the uncertainties estimated in Gac et al. (2020), with 18 μatm based on TA/DIC and 11 μatm based on TA/pH. In 2017, three carbonate parameters (pH, DIC, and TA) were collected at the same time at SOMLIT-offshore. Computed pCO2(DIC/TA) and pCO2(TA/pH) showed a robust relationship (1:1 slope, r2 = 0.90; n = 14; p < < 0.001, RMSE = 8). Similarly, pHin situ and pH(TA/DIC) showed robust consistency (1:1 slope; r2 = 0.89, n = 14; p < < 0.001, RMSE = 0.008) during that period, which would indicate that the time-series trends (Section “Analysis of Trends”) were not affected by the change in variables.
Four seasonal cruises were performed in the Brest rivers (Aulne and Elorn) in February 2009 (winter), May 2009 (spring), July 2009 (summer), and November 2010 (winter). Surface seawater was sampled using a 10-L Niskin bottle, and SST, SSS, nutrient concentration, TA, and DIC were measured using the methods outlined above and detailed in Bozec et al. (2011). The Roscoff rivers (Penzé and Morlaix river) were sampled from the R/V Neomysis and R/V Aurelia on a monthly basis from February 2011 to November 2011 in the Penzé, completed with seven monthly cruises in the Penzé and Morlaix rivers from January 2019 to July 2019, and from two cruises in January and February 2020, using the same analytical methods. Six stations were sampled along the salinity gradient in the Morlaix and Penzé rivers, and seven stations were sampled in the Aulne and Elorn rivers (Figure 1). The upper stations in the Roscoff estuary presented salinity values below 5, and down to 0 in the Brest rivers. A total of 55 and 230 measurements of each parameter were obtained from Brest and Roscoff rivers, respectively.
Atmospheric pCO2 (pCO2air) was calculated from the atmospheric molar fraction of CO2 (xCO2) recorded at the Mace Head site (53°33′N 9°00′W, southern Ireland) of the RAMCES network (Observatory Network for Greenhouse gasses) and from the water vapor pressure (pH2O) using the equations of Weiss and Price (1980). Atmospheric pressure and wind data were obtained from the Guipavas meteorological station (48°26′36′N, 4°24′42″W, Météo France) and fitted to the dataset using the monthly averages. Air–sea CO2 fluxes (FCO2, in mmol C m–2 day–1, Equation 1) were determined from the difference of pCO2 between surface seawater and air (δpCO2 = pCO2 − pCO2air), SST, SSS, wind speed, and atmospheric pressure.
Where k represents the gas transfer velocity (m s–1) and α represents the solubility coefficient of CO2 (mol atm–1 m–3) calculated as in Weiss (1970). The exchange coefficient k (Equation 2) was calculated from the wind speeds with the updated algorithm of Wanninkhof (2014) appropriate for both regional and global flux estimates:
Where u10 represents the wind speed at 10 m height (m s–1) and Sc denotes the Schmidt number at in situ SST.
The variability of sea surface pCO2 induced by thermal and non-thermal processes was estimated using the equations of Takahashi et al. (1993, 2002), based on the well-constrained temperature dependence of pCO2 (4.23% °C–1) (Takahashi et al., 1993; Millero, 1995). The thermal (pCO2therm) and non-thermal (pCO2non–therm) influence on pCO2 was determined as:
with annual mean values calculated from January 2008 to December 2017 at SOMLIT-Brest (Tmean = 13.3 ± 2.9°C, n = 493; pCO2,mean = 400 ± 56 μatm, n = 412), SOMLIT-pier (Tmean = 13.0 ± 2.45 °C, n = 245; pCO2,mean = 390 ± 68 μatm, n = 162), and SOMLIT-offshore (Tmean = 12.9 ± 2.2°C, n = 245; pCO2,mean = 412 ± 39 μatm, n = 189).
The influence of temperature, air–sea exchange, mixing, and biological activity on carbonate parameters was investigated based on the calculations developed in Xue et al. (2016) and adapted to our data as described in detail below. The calculations were based on the difference of SST, SSS, TA, DIC, pCO2, SRP, and DSi at time n and time n + 1 during 8 annual cycles from January 2010 to December 2017 with a time increment at all sites based on monthly averages. The total pCO2 and DIC changes from time n and n + 1 were induced by the combination of different processes explained in Equations 6, 7, and 8 and developed in the following subsections.
The variability induced by thermal processes was estimated using the coefficient proposed by Takahashi et al. (1993) and verified by Millero (1995).
The effect of air–sea CO2 (gas) exchange was first estimated on DIC, and subsequently on pCO2 from DIC, TA, SSS, SST, SRP, and DSi using the CO2SYS program (Section “Weekly and Bimonthly Measurements of the Long-term Time-Series”):
where FCO2 is the air–sea CO2 flux (see Section “Air-sea CO2 exchanges”), t(n+1) – tn is the number of days between two measurements, ρ is the seawater density (kg m–3) calculated from the TEOS-10 calculations (McDougall et al., 2012), and d is the depth fixed at 10 m for comparable computations at the three stations.
Mixing was attributed to the horizontal mixing (or lateral advection) induced by river inputs and Atlantic Ocean waters, while other processes such as evaporation and precipitation were neglected. The effect of mixing on TA and DIC was estimated based on the relationship between DIC and SSS, and between TA and SSS from the seasonal sampling in Brest and Roscoff rivers and coastal stations (Figure 2). These seasonal samplings were performed during typical years in terms of freshwater inputs and then SSS variability (Figure 3). The following equations were used to compute ΔDICmix and ΔTAmix and then and , the predicted DIC and TA values at time n + 1 due to the mixing:
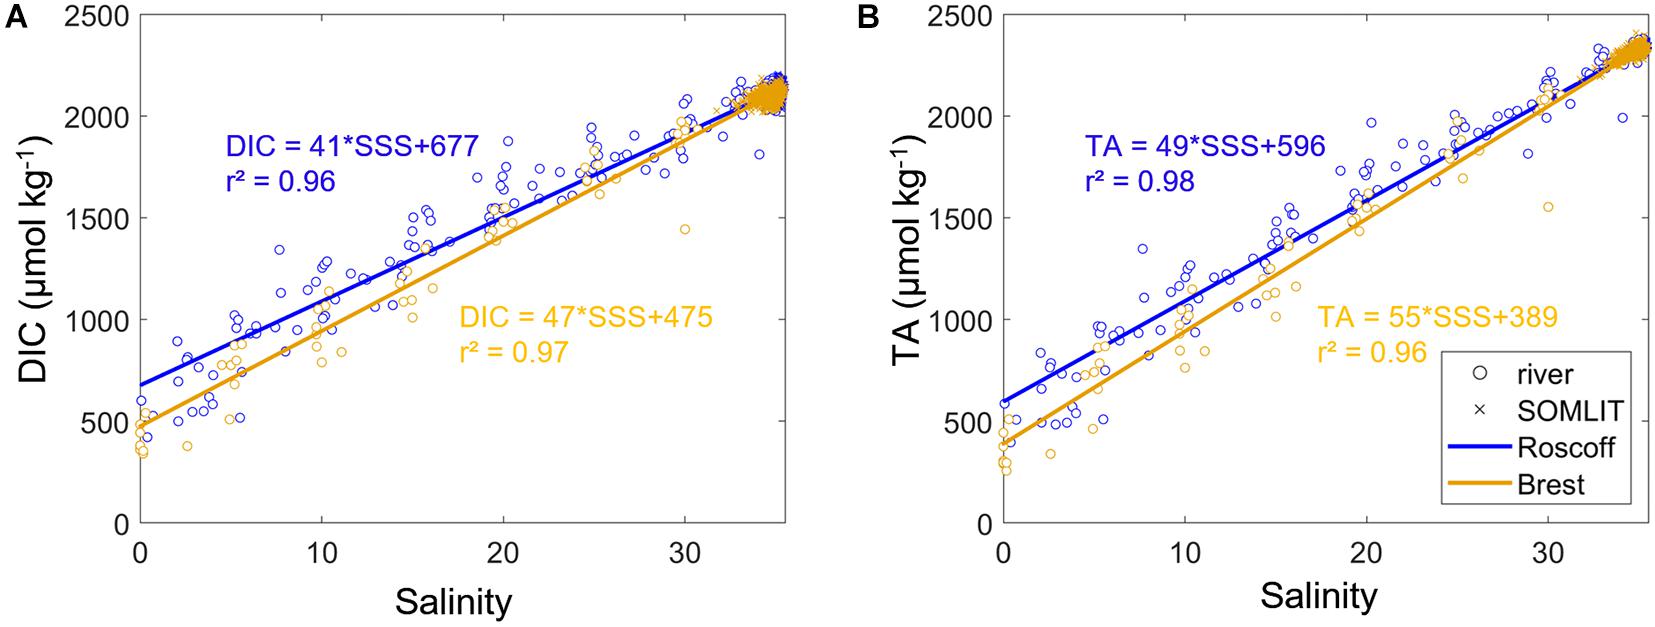
Figure 2. Linear regressions between (A) dissolved inorganic carbon concentration (DIC, μmol kg– 1) and sea surface salinity (SSS), and (B) total alkalinity (TA, μmol kg– 1) vs. SSS based on the data collected at Penze/Morlaix rivers (blue circles) in 2010–2011 and 2019–2020 and Roscoff stations (SOMLIT-pier and SOMLIT-offshore, blue asterisks) from 2008 to 2019 and Elorn and Aulne rivers (orange circles) in 2009–2010 and SOMLIT-Brest (orange asterisks) from 2008 to 2019.
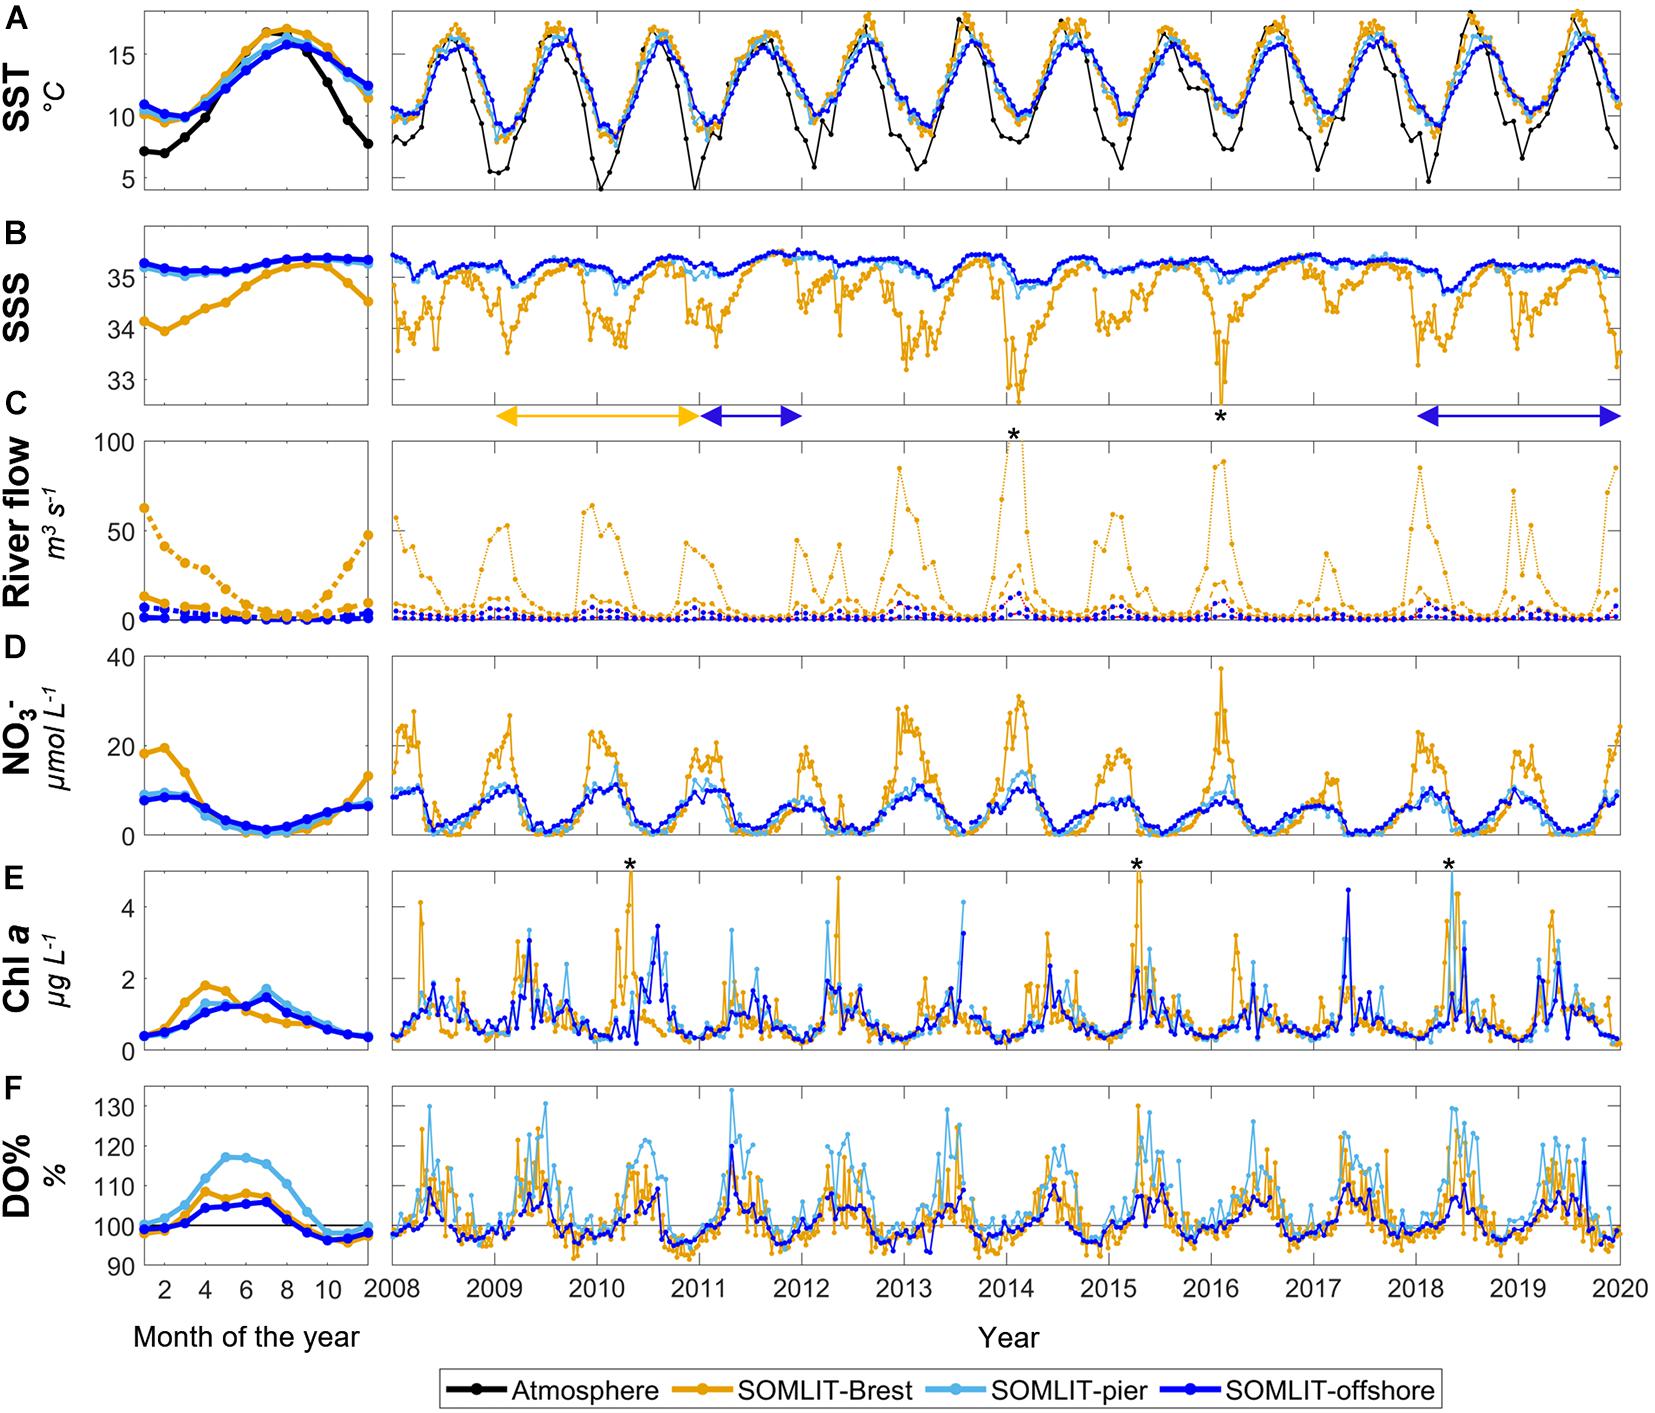
Figure 3. Monthly mean climatology for (A) sea surface temperature (SST, °C), (B) sea surface salinity (SSS), (C) river flow (m3 s–1), (D) nitrate (μmol L–1), (E) Chl a (μg L–1), and (F) oxygen saturation (DO%, %) at SOMLIT-Brest (orange), SOMLIT-pier (light blue), and SOMLIT-offshore (dark blue), from January 2010 to December 2017, and the associated time series of weekly/bimonthly data from January 2008 to January 2020. (C) Brest river flow is shown in orange and Roscoff river flow is shown in blue. The black line represents the atmospheric temperature (°C). The monthly mean climatologies were computed based on complete years acquired from January 2010 to December 2017. Salinity values down to 32.5 and 31.7 (out of the figure range and indicated by black asterisks) were observed in February 2014 and February 2016, respectively. In February 2014, river flow values up to 130 m3 s–1 were observed in the Aulne river (indicated by a black asterisk). Chl a concentrations of 5.9, 6.3, and 5.2 μg L–1 were observed in May 2010, April 2015, and May 2018 (indicated by a black asterisk), respectively. Blue double-arrows below the SSS plot represent the period of sampling in the Roscoff rivers, and the orange double-arrow represents the period of sampling of the Brest rivers.
SlopeDIC/SSS was estimated from the linear regression (r2 = 0.99, n = 585 for Brest rivers and r2 = 0.96, n = 683 for Roscoff rivers) between DIC and SSS (Figure 2A, 46.8 μmol kg–1 uSSS–1 for Brest rivers and 41.3 μmol kg–1 uSSS–1 for Roscoff rivers). SlopeTA/SSS was estimated from the linear regression (r2 = 0.98, n = 660 for Brest rivers and r2 = 0.98, n = 660 for Roscoff rivers) between DIC and SSS (Figure 2B, 55.3 μmol kg–1 uSSS–1 for Brest rivers and 49.5 μmol kg–1 uSSS–1 for Roscoff rivers).
Based on these values, the effect of mixing on pCO2 was computed using the following equation:
The mixing term at SOMLIT-offshore was considered negligible because sampling always occurred at high tide slack when the influence of rivers did not modify SSS throughout the year.
The remainder of DIC changes were assigned to biological processes, such as the effect of photosynthesis, respiration, degradation of organic matter, or calcification/dissolution of CaCO3.
is a non-linear term calculated from the difference between ΔpCO2 and the sum of pCO2 due to each process detailed above, considering that pCO2 responses to SST or DIC changes were not linear [see Xue et al. (2016) for more details].
Net ecosystem production represents the difference between gross primary production (GPP) and ecosystem respiration (R). Positive NEP values indicate that the ecosystem is predominantly autotrophic; i.e., the production of organic matter is larger than its consumption. Negative NEP values indicate that the ecosystem is heterotrophic, with higher organic matter remineralization than production. NEP calculations are derived from the biological effect on ΔDIC following the equation:
Climatologies were computed based on monthly means over the entire period of study. Data were detrended for seasonality by subtracting the respective monthly mean climatology computed for the study period to the time series (hereafter “monthly means”). The resulting residuals were analyzed using linear regressions to compute anomaly trends, called “monthly anomaly trend.” This approach follows methods from Niu (2013) applied on seawater parameters by Tréguer et al. (2014) and Bates et al. (2014) to allow for comparisons of trends observed at different time-series stations. All analyses were performed with Matlab 2020a.
The relative contributions of various drivers on carbonate system trends at Brest and Roscoff were identified based on the deconvolution of pHin situ and pCO2 time series following the methods described in García-Ibáñez et al. (2016) and applied by Kapsenberg et al. (2017) on coastal time series. Equations 12 and 13 represent the changes in pH and pCO2 linked to SST, SSS, TA, and DIC over time (t).
Here, and represent the slope contribution of a changing “variable” to the estimated change in pHin – situ or pCO2, respectively. The contribution of each “variable” corresponding to SST, SSS, TA, and DIC. The sensitivity of pHin – situ and pCO2 to “variable” ( and ) was estimated by calculating pHin – situ and pCO2 using true values of the “variable” and holding the other three variables constant (mean values of the 2008–2017 time series) and regressing to the “variable.” Sensitivities ( and ) were then multiplied by the monthly anomaly trend of the “variable.”
The impact of two main large-scale hydroclimatic indices, the NAO and AMV, on environmental parameters recorded in the study area was investigated to evaluate the climatic context of our observations.
The NAO was calculated by and retrieved from the National Weather Service (NOAA4). NAO is defined as the distribution of atmospheric mass between the Arctic and the subtropical Atlantic and swings from positive (NAO+) to negative (NAO−), producing large changes in surface air temperatures, storm-track position, and precipitation over the North Atlantic and western Europe. Seasonal variations of NAO are controlled by non-linear processes: wave-mean flux intensities and air–sea interactions (Peng et al., 2003). In this study, we compared the winter period to the measured parameters (December–January–February, called here wNAO), when the amplitude was the highest.
The AMV, also known as the Atlantic Multidecadal Oscillation (AMO), was calculated by and retrieved from the Physical Science Laboratory (NOAA5). The AMV describes the pattern of SST in the North Atlantic (Kerr, 2000; Enfield et al., 2001), which can either represent decades of warm or cool anomalies at the basin scale, relative to the global mean.
Sea surface temperature seasonality at the three sampling sites was characterized by a limited amplitude between winter minimum and summer maximum values (Figure 3A), a typical feature for temperate oceanic regions. The seasonal SST signal was more pronounced in Brest (7.8°C) than in Roscoff (6–6.6°C), with mean minimum values of 9.5°C in Brest and 9.8°C in Roscoff in winter, and mean maximum values in summer of 17.1°C, 16.4°C, and 15.8°C, in SOMLIT-Brest, SOMLIT-pier, and SOMLIT-offshore, respectively. SST increased from February in Brest, one month earlier than in Roscoff. A similar pattern was observed for SST lowering in late summer, with an earlier decrease observed in Brest than in Roscoff. Mean temperatures at SOMLIT-pier were slightly lower during winter than at SOMLIT-offshore and slightly higher during summer.
The seasonal variability of SSS was much more pronounced in Brest than in Roscoff (Figure 3B), highlighting the stronger influence of freshwater inputs in the Bay of Brest than in the coastal sWEC. The lowest SSS values (down to 33.1) were observed in winter in Brest, while in Roscoff, SSS reached minimum values (<35.1) in spring. The highest SSS values were observed in summer at both sites, with mean values of 34.9 in Brest and 35.2 in Roscoff. Salinity at SOMLIT-pier was 0.1 lower than at SOMLIT-offshore along the year because of the proximity of the SOMLIT-pier station to the coast. The impact of riverine freshwater inputs on SSS was evident for Aulne and Elorn river flows (Figure 3C). During the winters of 2013/2014 and 2015/2016, Aulne and Elorn river flows were particularly high, with values > 80 m3 s–1 and > 20 m3 s–1, when the lowest SSS values were recorded at the Brest site. In Roscoff, the two major rivers flowing into the area were characterized by much lower flows (<15 m3 s–1), with limited effects on SSS.
The higher influence of riverine freshwater inputs in Brest than in Roscoff led to higher maximum winter values of nitrate concentration. Winter nitrate concentrations in Brest reached values higher than 20 μmol L–1, two times higher than in Roscoff (Figure 3D). Nitrate concentrations started to decrease from February in Brest, 1 month earlier than in Roscoff. Most of the winter nitrate stock was consumed from April in Brest, characterized by a sharp decrease. From April to August, nitrate concentrations remained below 3 μmol L–1 and were depleted in summer in the Bay of Brest. Slightly higher nitrate concentrations were observed at SOMLIT-pier than at SOMLIT-offshore during winter. In Roscoff, the winter stock of nitrate decreased more slowly than in Brest, and surface waters were never nitrate depleted during summer at SOMLIT-offshore. Undetectable nitrate concentration were recorded at SOMLIT-pier in some years.
Brest and Roscoff were characterized by a different seasonality in terms of phytoplankton production, as represented by Chl a concentrations (Figure 3E). Spring phytoplankton blooms occurred in April in Brest, with mean Chl a concentration > 1.5 μg L–1. In Roscoff, Chl a concentrations started to increase in spring and reached their highest values (∼1.5 μg L–1) from May to July. In fall and winter, Chl a concentrations remained < 0.4 μg L–1. Chl a concentrations at SOMLIT-pier and SOMLIT-offshore followed a similar dynamic with similar values. Important interannual variability in terms of bloom timing and intensity was observed at both sites. In 2010, an intense spring phytoplankton bloom (Chl a up to 6 μg L–1) was observed in early spring in Brest, but not in Roscoff, where Chl a concentrations remained abnormally high (>2 μg L–1) all summer in that year. On the contrary, intense spring blooms were observed at both Brest and Roscoff in 2015, with values > 2.0 μg L–1 during most of the productive period.
Surface waters were oversaturated in O2 from March to August–September at all study sites (Figure 3F), while O2 undersaturation down to 95% was observed in fall. Winter values were close to atmospheric equilibrium. The highest DO% values (up to 120%) were recorded at SOMLIT-pier. The spring increase of DO% was observed from March in Brest and at SOMLIT-pier, while at SOMLIT-offshore, DO% increased 1 month after with lower maximum DO% values. The end of summer decrease in DO% occurred in August in Brest and at SOMLIT-offshore. At SOMLIT-pier, DO% values > 100% were recorded up to September. Chl a concentrations and DO% followed similar trends for SOMILT-Brest and SOMLIT-offshore. The overall seasonal variability in terms of Chl a concentrations was similar at SOMLIT-offshore and SOMLIT-pier, but the signal in terms of DO% was different, with higher DO% and longer DO% values > 100% at SOMLIT-pier than at SOMLIT-offshore.
Total alkalinity did not exhibit marked seasonality at the Roscoff stations, remaining constant all year at around 2335 μmol kg–1 (Figure 4A). At SOMLIT-Brest, TA was < 2300 μmol kg–1 during the winter and was in a similar range to the Roscoff values during the summer. The lowest TA values in Brest were observed during the winters of 2013/2014 and 2015/2016, periods characterized by high riverine freshwater input and low SSS. As shown on Figure 2B, the rivers flowing in the vicinity of the study sites were characterized by low TA end-member values (400–600 μmol kg–1). The lower TA values observed in Brest than in Roscoff were related to the stronger influence of riverine freshwater inputs, which was confirmed by the SSS-normalization of TA (Figure 4E).
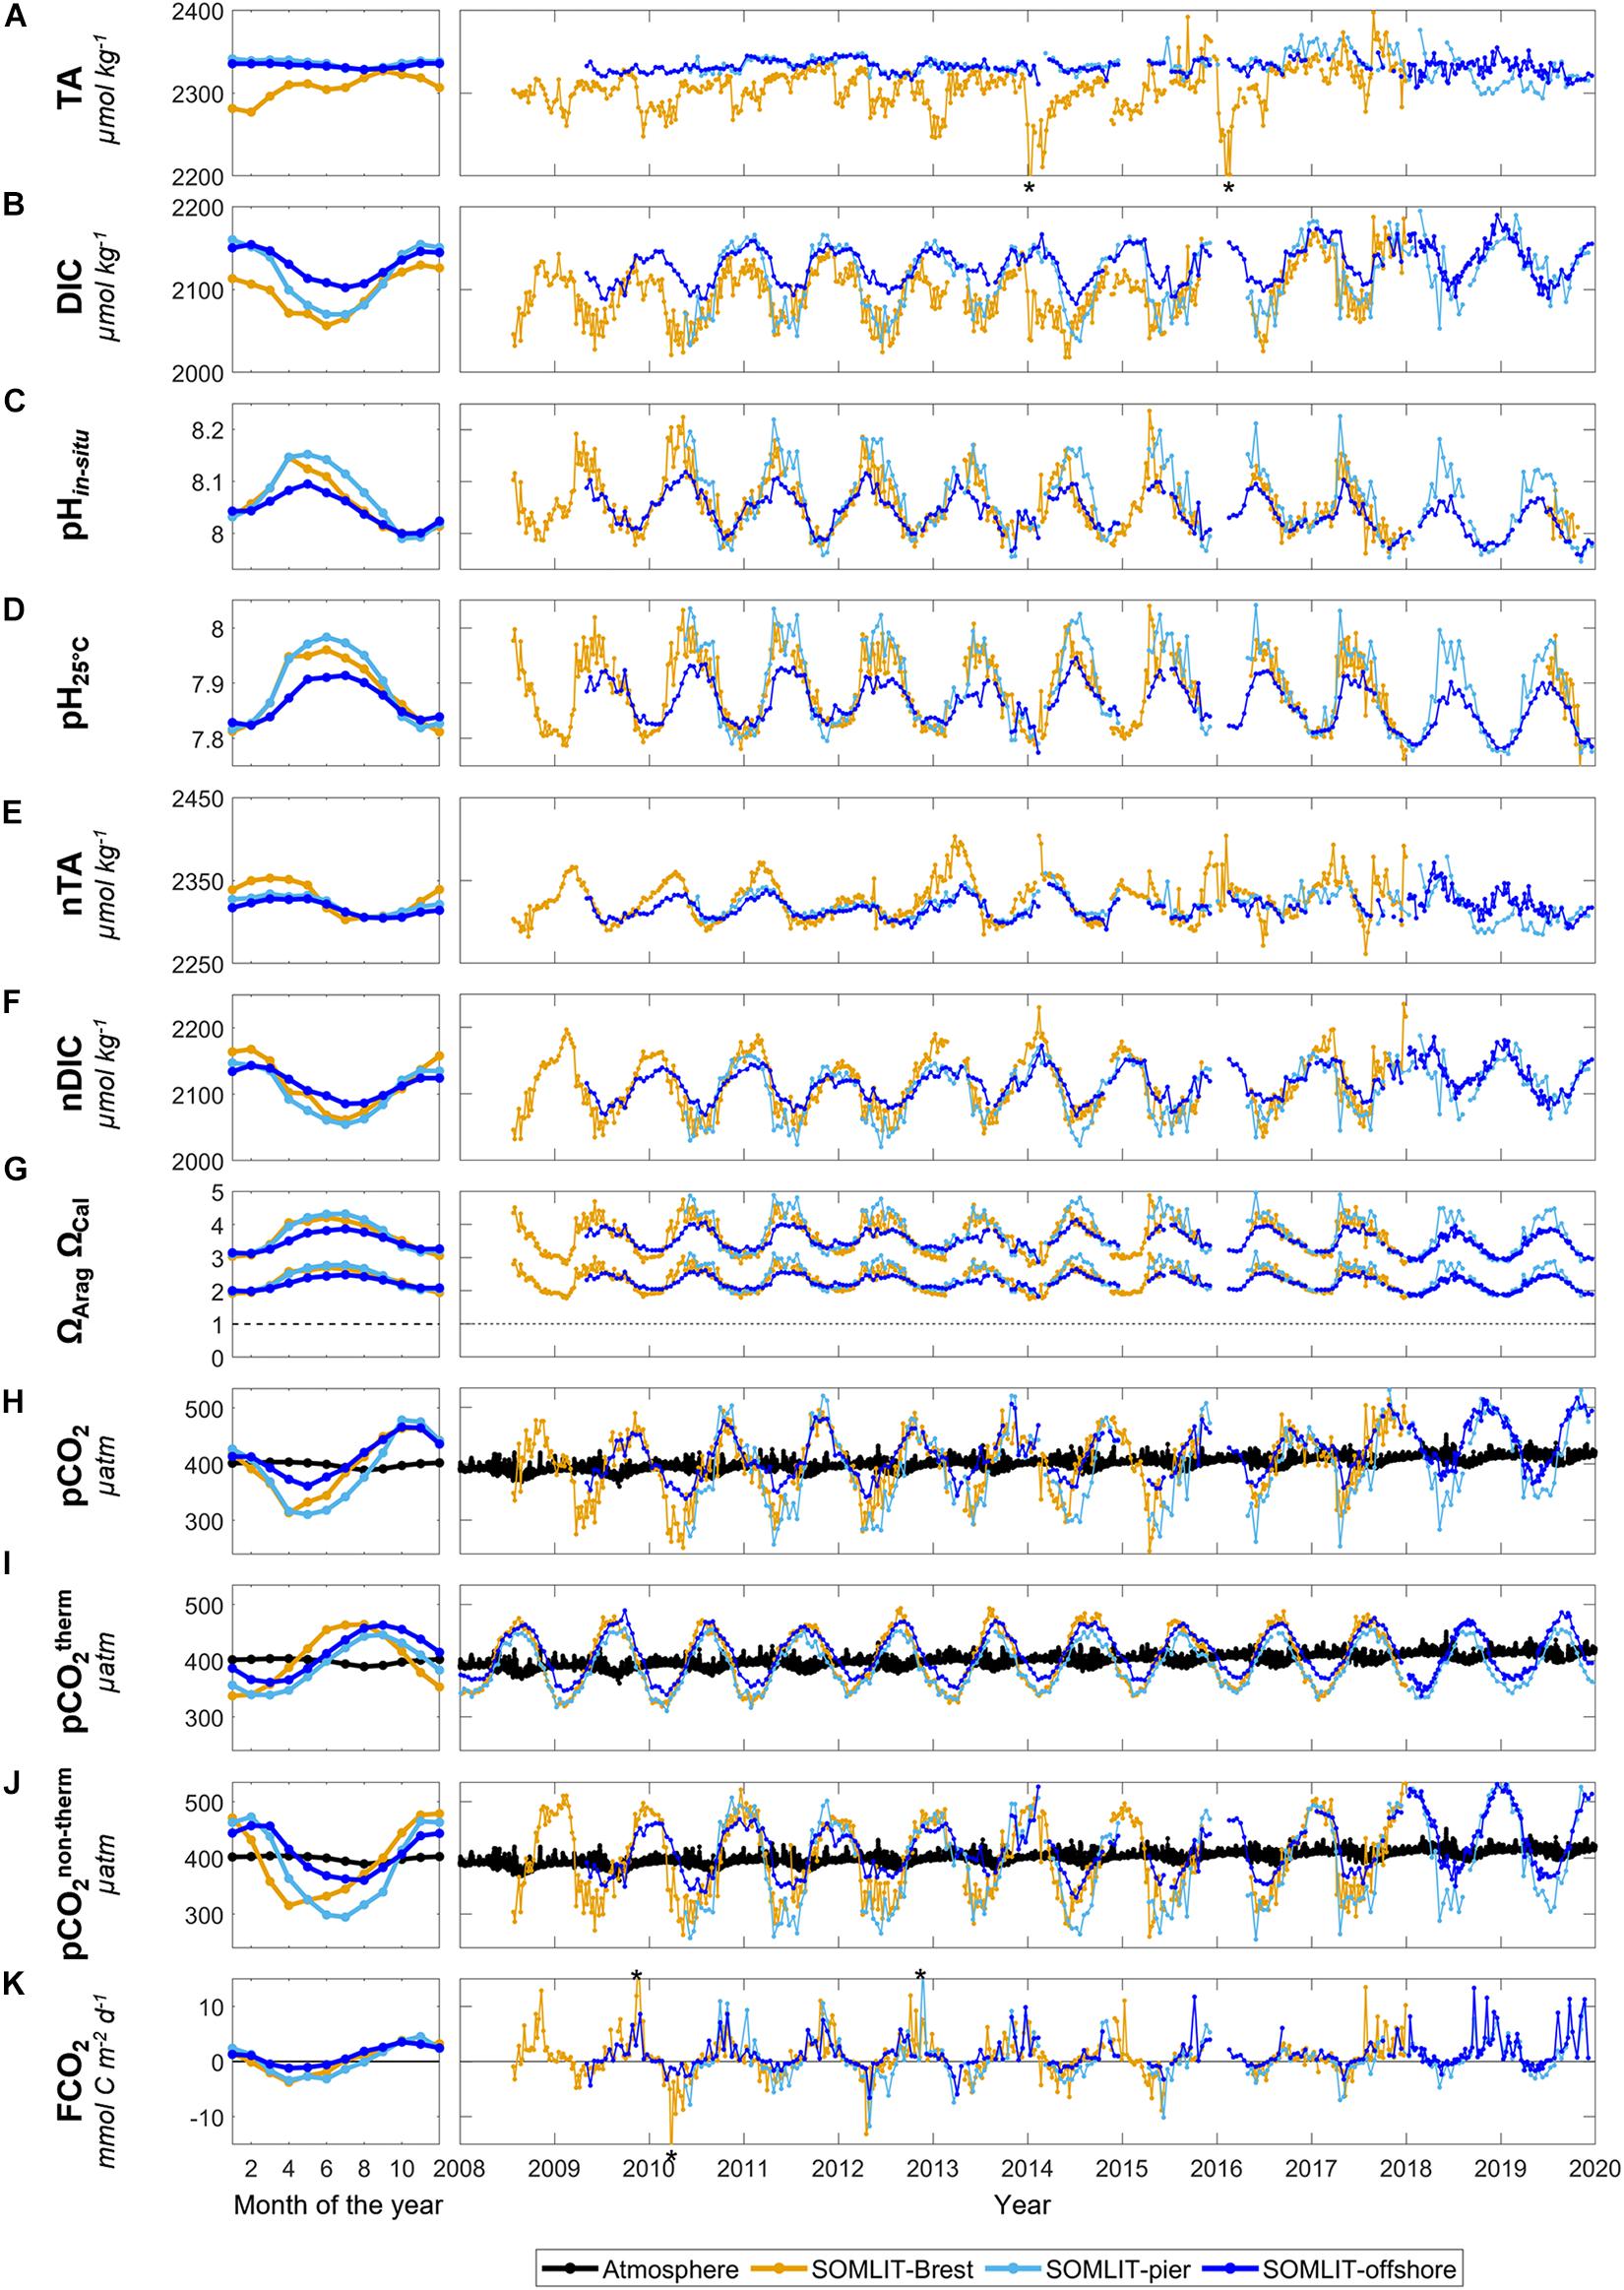
Figure 4. Monthly mean climatology for (A) total alkalinity (TA, μmol kg–1), (B) dissolved inorganic carbon (DIC, μmol kg–1), (C) pHin situ, (D) pH25°C, (E) SSS normalized TA (nTA, μmol kg–1), (F) SSS normalized DIC (nDIC, μmol kg–1), (G) ΩArag and ΩCal, (H) pCO2 (μatm), (I) pCO2therm (μatm), (J) pCO2non–therm (μatm), and (K) FCO2 (mmol C m– 2 day–1) at SOMLIT-Brest (orange), SOMLIT-pier (light blue), and SOMLIT-offshore (dark blue), from January 2010 to December 2017, and the associated time series of weekly/bimonthly data from January 2008 to January 2020. The black line represents atmospheric pCO2 (μatm). TA values down to 2194 and 2181 μmol kg–1 (out of figure range and indicated by black asterisks) were observed in January 2014 and February 2016, respectively. FCO2 values of 18.9, –20.82, and 17.3 mmol C m– 2 day–1 were recorded in November 2009, March 2010, and November 2012 (indicated by a black asterisk), respectively. nTA and nDIC computations were based on Friis et al. (2003) and the SSS vs. TA/DIC relationships from Figure 2.
Dissolved inorganic carbon concentrations showed a clear seasonality at the three stations (Figure 4B) with maximum values observed in fall in Brest (>2100 μmol kg–1) and in winter in Roscoff (>2150 μmol kg–1). In Brest, minimum DIC values down to 2050 μmol kg–1 were observed during spring, while DIC reached minimum values during summer in Roscoff. DIC values at SOMLIT-offshore and SOMLIT-pier were in a similar range during winter. From early spring to the end of summer, lower DIC concentrations were recorded at SOMLIT-pier than at SOMLIT-offshore. As for TA, the rivers in the study area were characterized by low DIC values (Figure 2A). The stronger influence of riverine inputs in Brest than in Roscoff might be the cause of low winter DIC values observed in Brest, which were confirmed when the effect of SSS on DIC was accounted for (Figure 4F).
The seasonal variability of pH was more pronounced at SOMLIT-pier and SOMLIT-Brest, with amplitudes > 0.15, than at SOMLIT-offshore, where the pH amplitude was < 0.10 (Figure 4C). Maximum pH values were observed during the spring (>8.10), while values < 8.00 were recorded during winter. Like for Chl a concentrations, pH values reached their maximum spring values 1 month earlier in Brest than in Roscoff. Maximum pH values were attained in April in Brest and in May in Roscoff. After reaching their spring maxima, pH values decreased during the summer down to their minimum fall values for each site. pH25°C was < 0.2 units (Figure 4D) compared to the pHin situ. pH25°C followed a different seasonality close to that of SST, with values > 7.9 during summer and close to 7.8 during winter.
ΩCal and ΩArag were always > 1 and followed a pronounced seasonal variability with higher values during spring and summer than during fall and winter (Figure 4G). In spring, the maximum values of ΩCal at SOMLIT-Brest and SOMLIT-pier were > 4, and ∼3.8 in SOMLIT-offshore. Maximum ΩArag values observed in SOMLIT-Brest and SOMLIT-pier were > 2.5 and ∼2.5 in SOMLIT-offshore. The ΩCal and ΩArag were ∼3.2 and ∼2 during the winter for each station.
The seasonal pCO2 signal in the near-shore stations SOMLIT-Brest and SOMLIT-pier were characterized by a similar mean amplitude of ∼170 μatm (Figure 4H). Seasonality was less pronounced at SOMLIT-offshore, where, on an annual scale, the mean pCO2 signal varied from 350 to 480 μatm. Maximum pCO2 values were observed during fall, in October in Brest and in November in Roscoff. During winter, surface water pCO2 decreased down to the atmospheric equilibrium, from January in Brest and in March–April in Roscoff. pCO2 values were minimal in April in Brest (∼310 μatm), in May at SOMLIT-offshore (∼360 μatm), and in June at SOMLIT-pier (∼310 μatm). Sea surface pCO2 remained below the atmospheric equilibrium for 6 months at SOMLIT-pier (up to August), 5 months in Brest (up to June), and only 4 months at SOMLIT-offshore (up to July). On a seasonal scale, pCO2 and pH exhibited clear opposite trends at each site, in terms of both timing and intensity.
The influence of the SST on pCO2 variability is represented by the pCO2therm signal (Figure 4I). Minimum pCO2therm values were observed during winter when low SST favored CO2 solubility in surface waters. Lower pCO2therm values were observed in the nearshore stations at SOMLIT-Brest and at SOMLIT-pier, than at SOMLIT-offshore. The seasonality of the pCO2therm signal was similar between sites in terms of timing, with pCO2therm values below the atmospheric equilibrium from January to April, and above the atmospheric equilibrium from May to November.
The influence of non-thermodynamic processes on pCO2 variability is represented by the pCO2non–therm signal (Figure 4J). pCO2non–therm values were high and above atmospheric pCO2 during fall and winter, with higher values at SOMLIT-Brest and SOMLIT-pier than at SOMLIT-offshore. The seasonal variability was similar at SOMLIT-Brest and SOMLIT-pier, with a higher amplitude (∼200 μatm) than at SOMLIT-offshore (<100 μatm). The seasonality of pCO2non–therm followed an opposite dynamic to DO% and Chl a, with low values observed during the biologically productive period (spring and summer) when DO% and Chl a were high. The overall features of pCO2therm and pCO2non–term seasonality indicated that non-thermal processes counteracted the effect of thermal processes on surface water pCO2 during winter and summer.
The seasonal dynamic of FCO2 at the three sites was characterized by a net sink of atmospheric CO2 in spring and a net source of CO2 to the atmosphere in fall (Figure 4J). FCO2 varied between −20 mmol C m–2 day–1 and +18 mmol C m–2 day–1 during the year. SOMLIT-Brest acted as a sink of atmospheric CO2 from February, while in Roscoff, negative FCO2 values were observed 1 month later. The average seasonal amplitudes were similar at SOMLIT-Brest and SOMLIT-pier, but lower at SOMLIT-offshore due to less pronounced atmospheric CO2 sinks during spring. SOMLIT-offshore acted as a sink of atmospheric CO2 for 4 months (March–June), SOMLIT-Brest was an atmospheric CO2 sink for 5 months (February–June), and at SOMLIT-pier surface waters were a sink of CO2 for 6 months (March–August). Annually, all sites were weak sources of CO2 to the atmosphere except for 2010 and 2015 at SOMLIT-Brest (Table 1) (see Section “Comparison Between Ecosystems of the Processes Controlling the Carbonate System” for details).
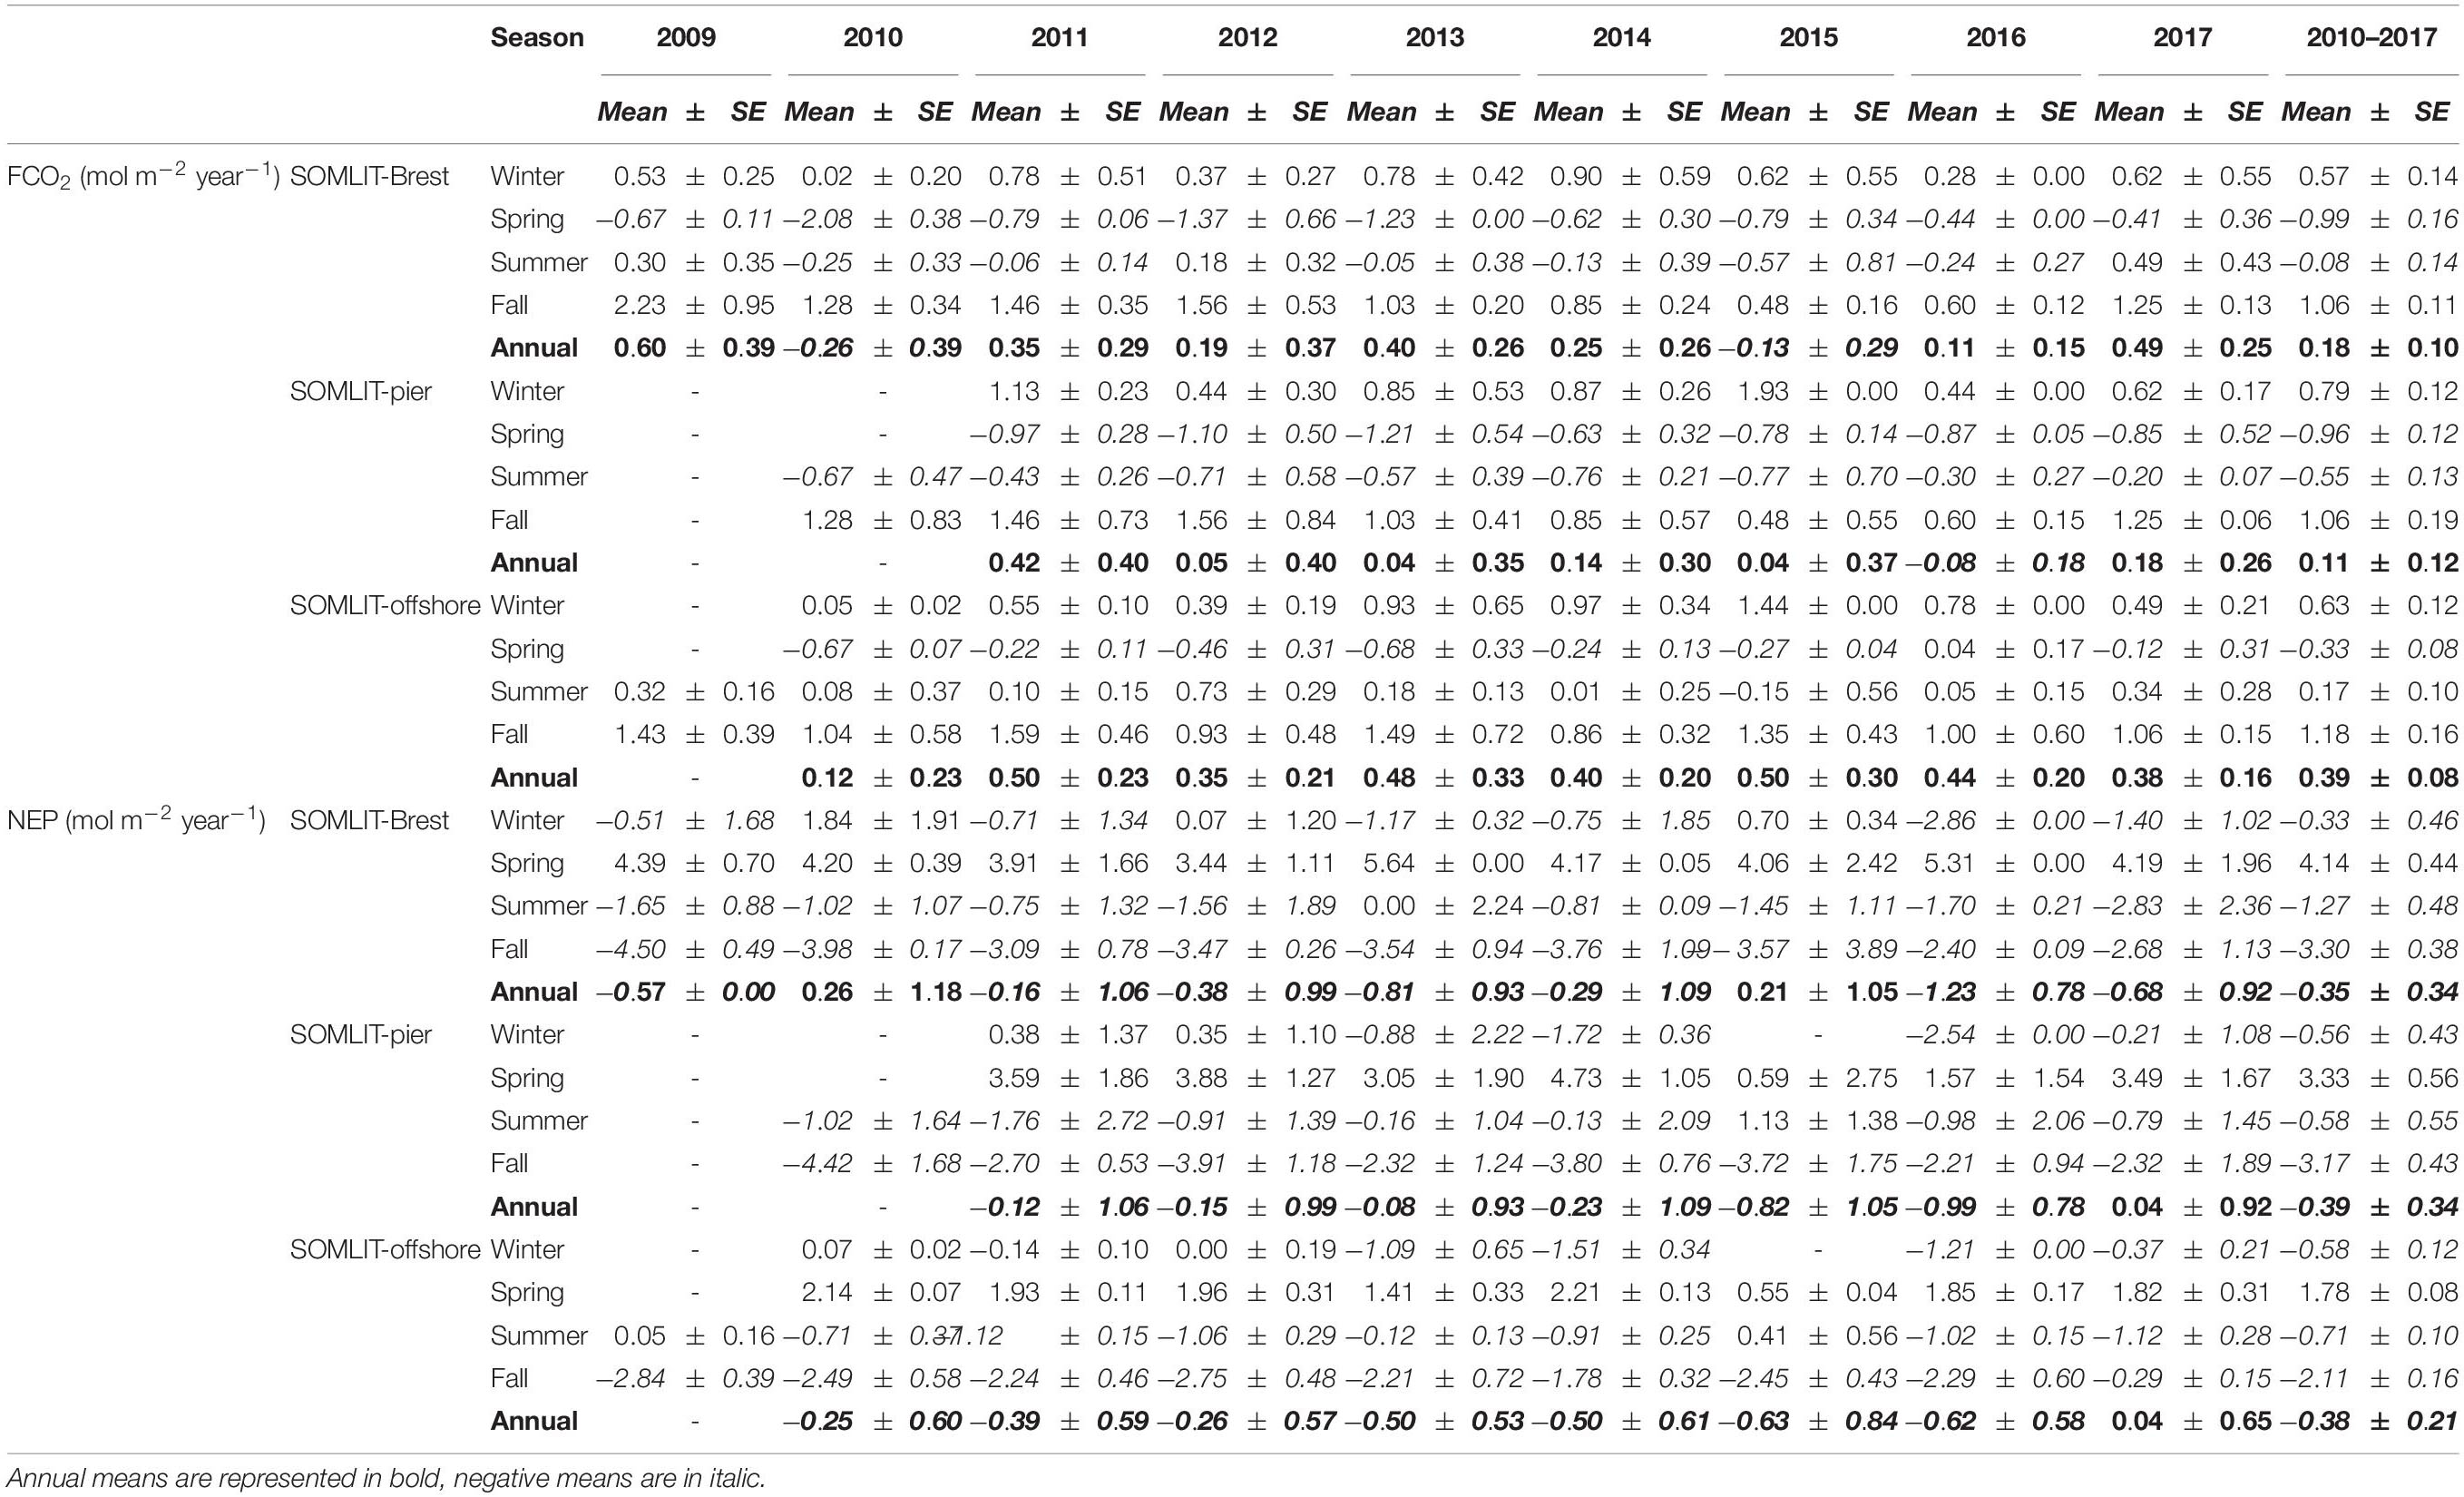
Table 1. Seasonal and annual means ± standard error (SE) of FCO2 and NEP (in mol C m–2 year–1) at SOMLIT-Brest, SOMLIT-pier, and SOMLIT-offshore from 2009 to 2017.
Trends were studied over the 2008–2017 period during which time the DIC/TA and ancillary datasets were robust enough to separate the main drivers of pCO2 and pH. From the first day of sampling to December 2017, SST increased significantly (p-values < 0.001) with observed positive trends of +0.08 ± 0.01°C year–1 at SOMLIT-Brest, +0.06 ± 0.02°C year–1 at SOMLIT-pier, and +0.07 ± 0.01°C year–1 at SOMLIT-offshore (Figures 5A, 6). SST increased at a similar rate as the atmospheric temperature (+0.07 ± 0.04°C year–1, p-value < 0.05). No significant trends were observed for SSS (Figures 5B, 6) or for river flow (data not shown).
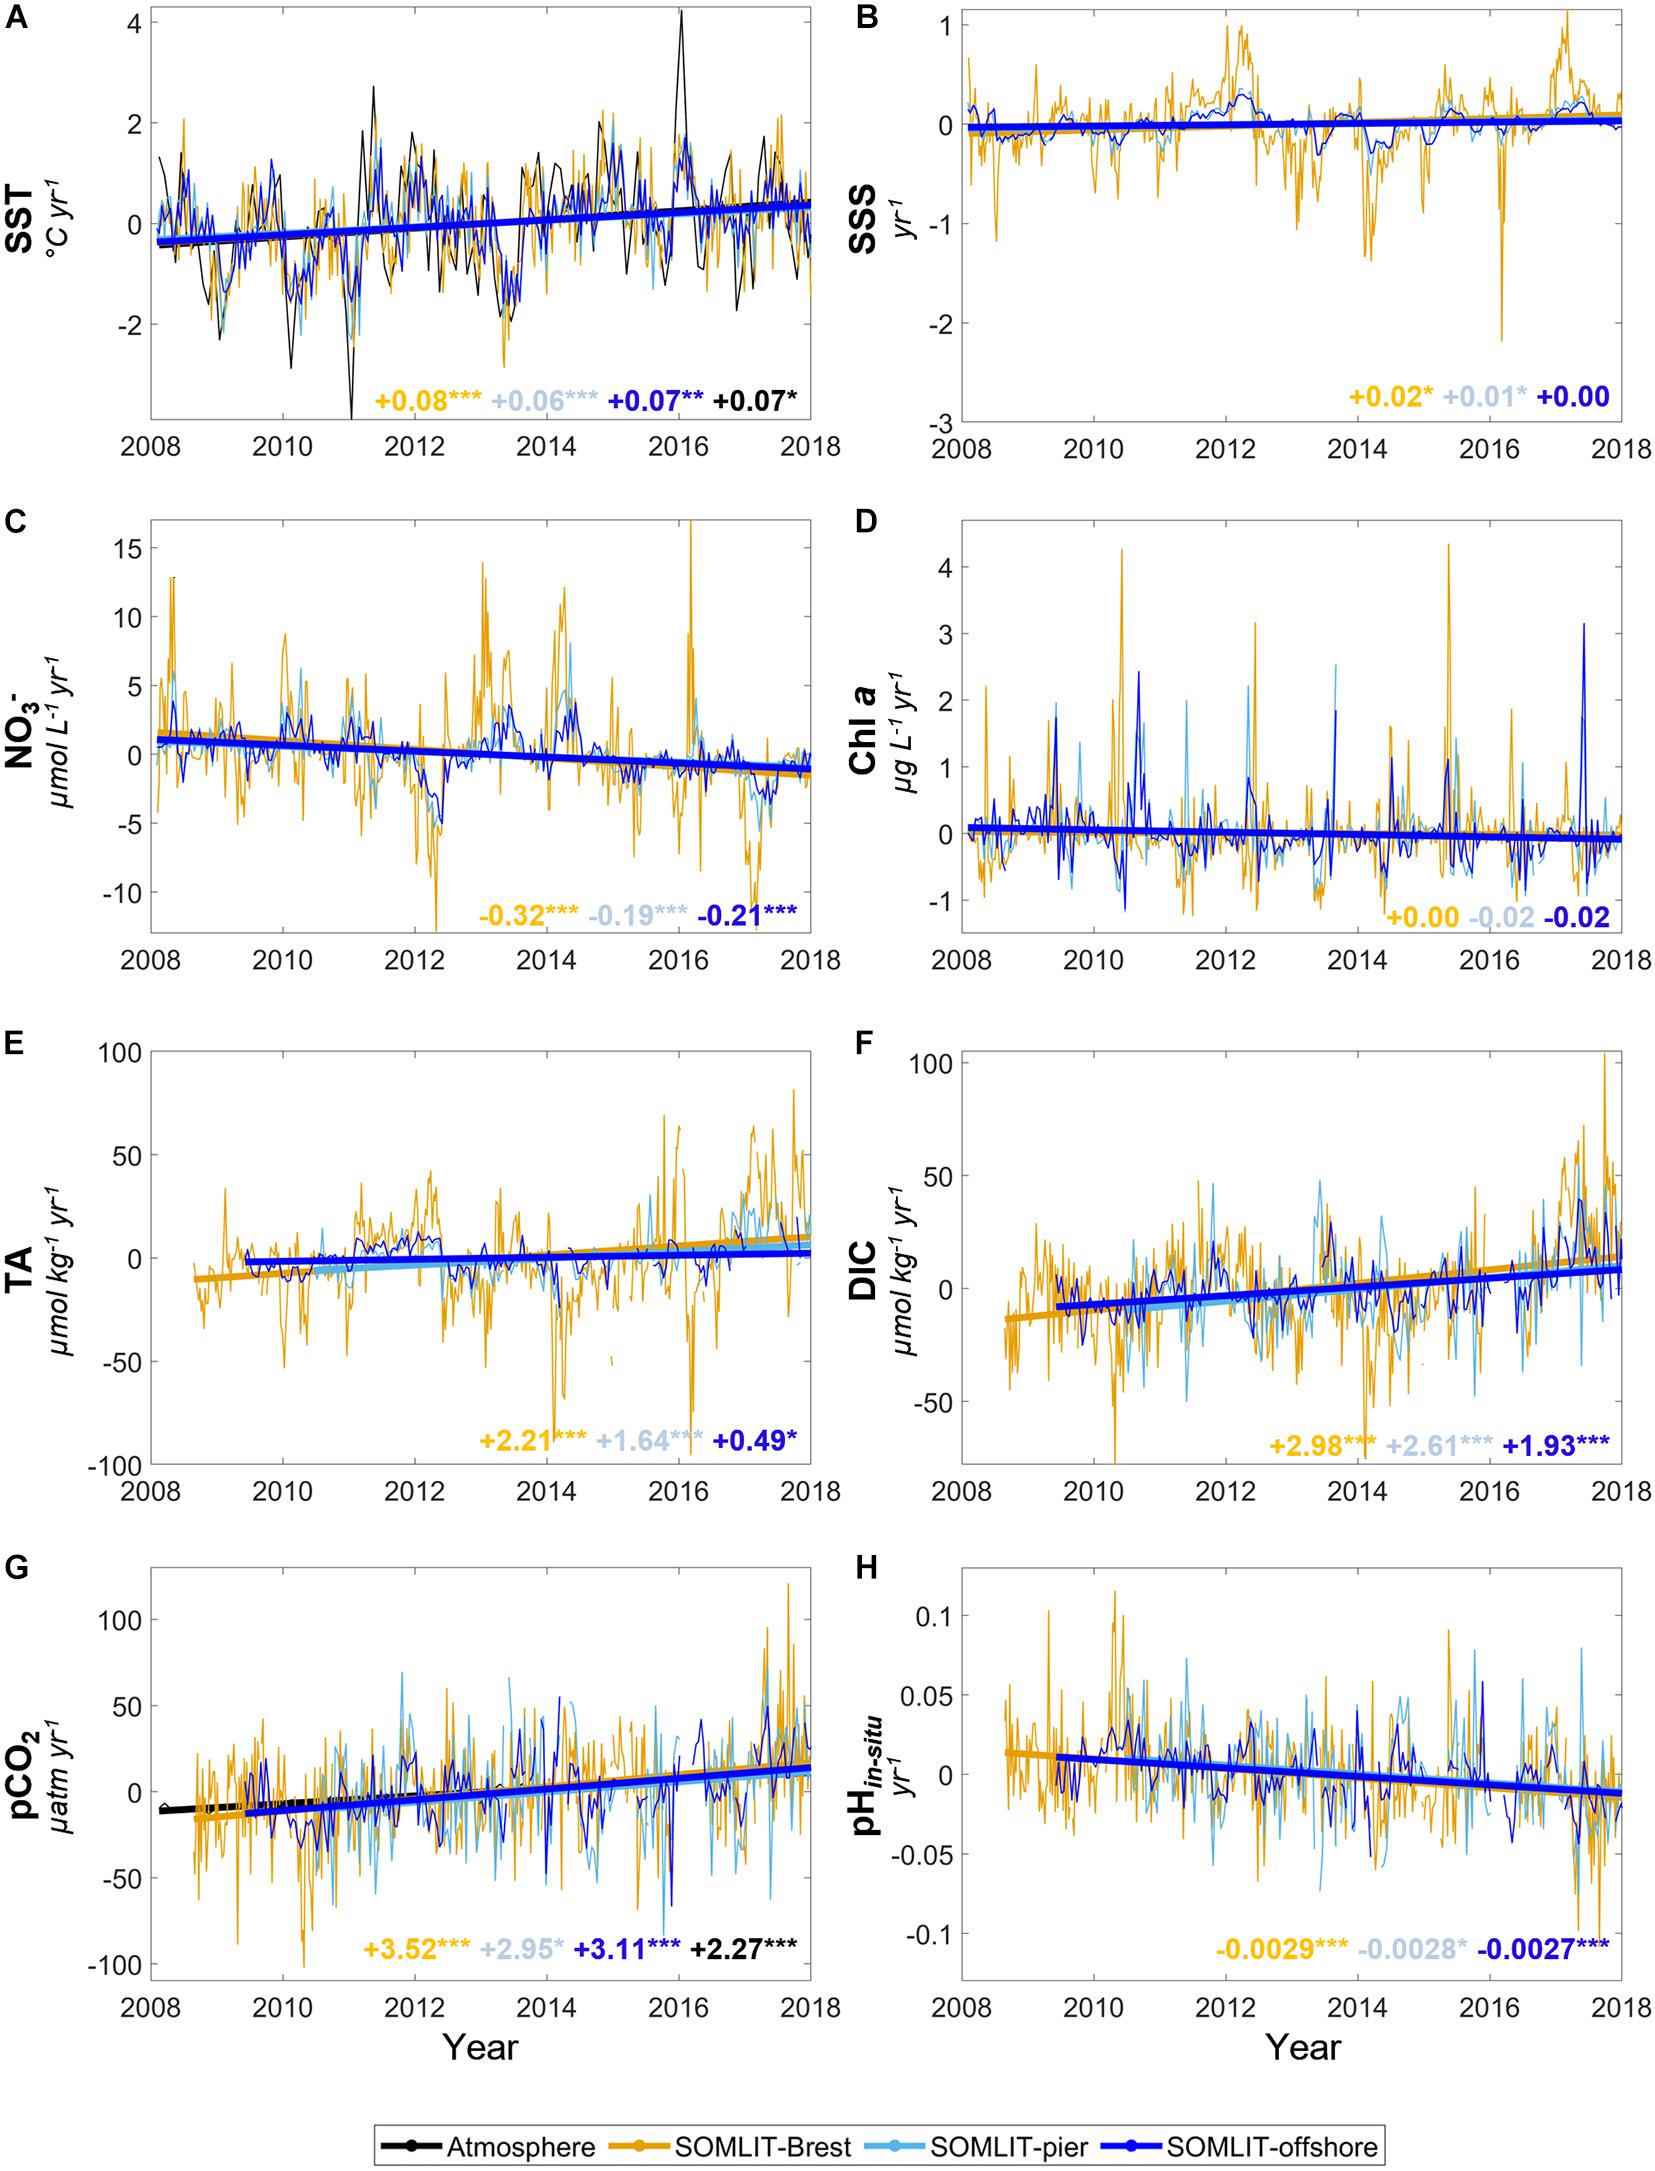
Figure 5. Trends of monthly anomalies of (A) SST (°C year–1), (B) SSS (year–1), (C) nitrate (μmol L–1 year–1), (D) Chl a (μg L–1 year–1), (E) TA (μmol kg–1 year–1), (F) DIC (μmol kg–1 year–1), (G) pCO2 (μatm year–1), and (H) pHin situ (year–1) at SOMLIT-Brest (orange), SOMLIT-pier (light blue), and SOMLIT-offshore (dark blue) for January 2008 to December 2017 (see Section “Weekly and Bimonthly Measurements of the Long-term Time-Series” for details on starting dates of sampling). The black lines (A,G) represent the monthly anomaly of atmospheric temperature (°C year–1) and pCO2atm (μatm year–1). The asterisks represent the p-values: ***p-value < 0.001, **p-value < 0.01, *p-value < 0.05, and no asterisk indicates non-significant trends.
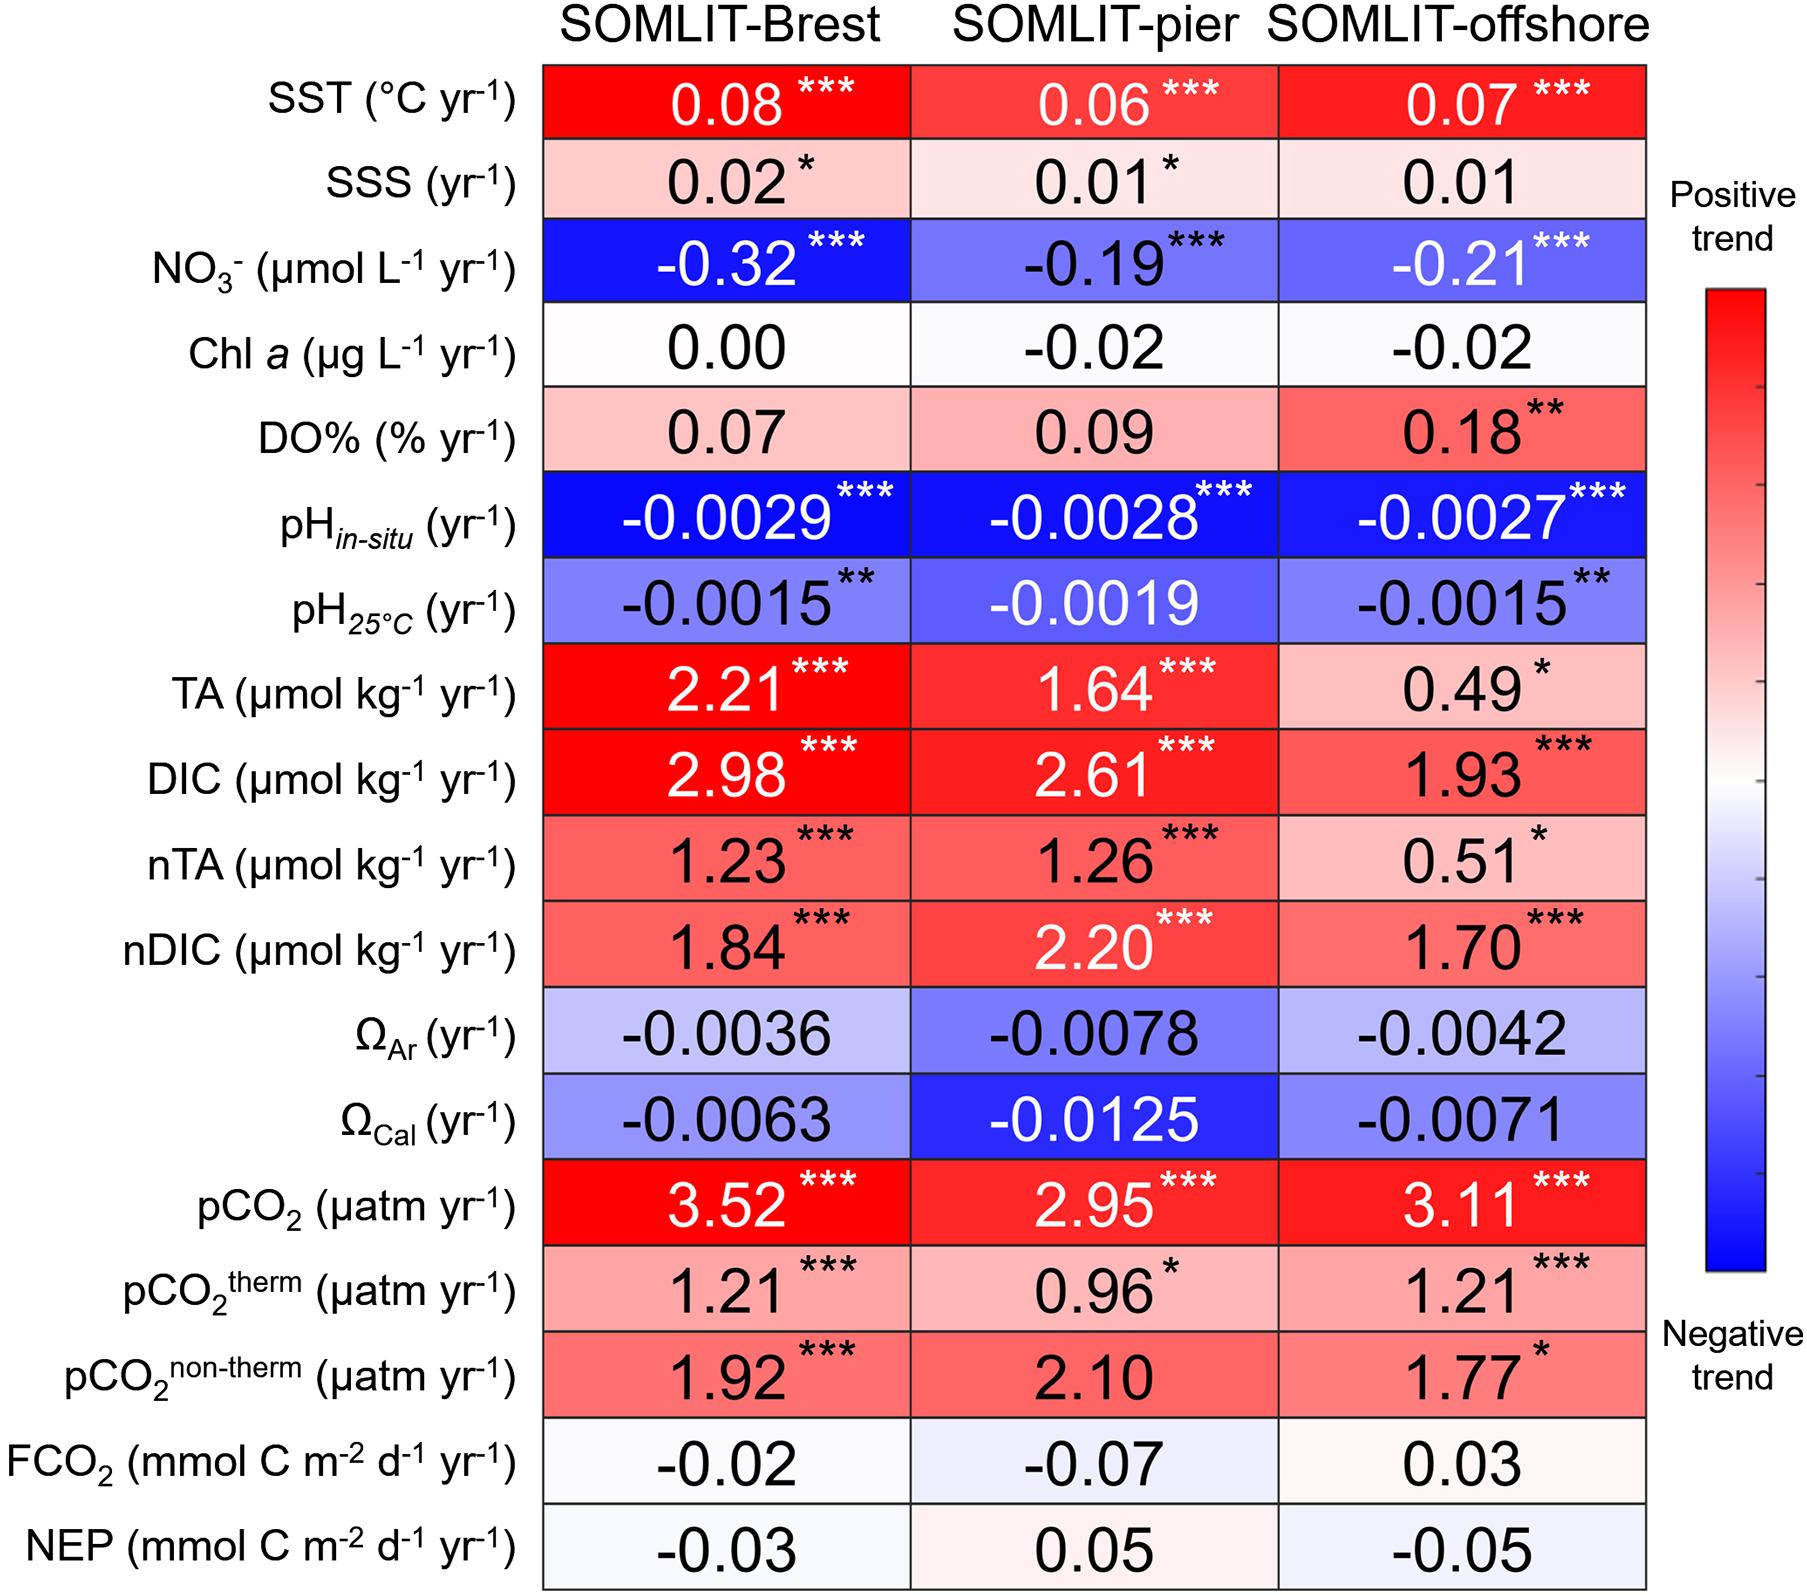
Figure 6. Heatmap of the trends of monthly anomalies of the parameters collected at the three SOMLIT stations for the January 2008 to December 2017 period (see Section “Weekly and Bimonthly Measurements of the Long-term Time-Series” for details on sampling dates). Red represents a positive trend, blue denotes a negative trend, and white indicates no trend, with the maximum and minimum attributed based on the maximum and the minimum of the trends of each parameter. The color bar values of pH25°C, nTA, nDIC, pCO2therm, and pCO2non–therm were attributed by the color bar of pHin situ, TA, DIC, and pCO2, respectively. Asterisks represent p-values: ***p-value < 0.001, **p-value < 0.01, *p-value < 0.05, and missing asterisk indicates non-significant trends.
Significant reductions in nitrate concentration were recorded at all sites with rates of −0.19 ± 0.04, −0.21 ± 0.03, and −0.32 ± 0.06 μmol L–1 year–1 at SOMLIT-pier, SOMLIT-offshore, and SOMLIT-Brest, respectively (Figures 5C, 6). Monthly Chl a anomalies remained stable over these 10 years (Figures 5D, 6). DO% significantly (p-values < 0.01) increased (0.18 ± 0.05 % year–1) at SOMLIT-offshore, but not at SOMLIT-pier and SOMLIT-Brest (Figure 6).
Monthly TA and DIC anomalies were characterized by significant positive trends (p-values < 0.001). TA increased by 0.49 ± 0.20 and 1.64 ± 0.32 μmol kg–1 year–1 at SOMLIT-offshore and at SOMLIT-pier, respectively, and by 2.21 ± 0.39 μmol kg–1 year–1 at SOMLIT-Brest (Figures 5E, 6). DIC increased by 1.93 ± 0.28 and 2.61 ± 0.62 μmol kg–1 year–1 at SOMLIT-offshore and at SOMLIT-pier, respectively, and by 2.98 ± 0.39 μmol kg–1 year–1 at SOMLIT-Brest (Figures 5F, 6). Positive TA and DIC trends were associated with significant increases (p-values < 0.001) of seawater pCO2 ranging from +2.95 ± 1.04 to +3.52 ± 0.7 μatm year–1 (Figures 5G, 6), higher than the rise of atmospheric pCO2 (+2.27 ± 0.08 μatm year–1). The highest pCO2 positive trend was observed in Brest. pCO2therm increased at all stations with values similar at SOMLIT-Brest and at SOMLIT-offshore (1.21 μatm year–1) and 0.96 ± 0.26 μatm year–1 at SOMLIT-pier. Reduction of surface seawater pH was observed at all three sites with significant pH decrease of 0.0029 ± 0.0005, 0.0028 ± 0.0010, and 0.0027 ± 0.0004 year–1 (p-values < 0.001) at SOMLIT-Brest, SOMLIT-Pier, and SOMLIT-offshore (Figures 5H, 6).
The seasonal patterns of pCO2 and air–sea CO2 fluxes in the WEC have been extensively investigated (Borges and Frankignoulle, 2003; Padin et al., 2007; Dumousseaud et al., 2010; Litt et al., 2010; Kitidis et al., 2012; Marrec et al., 2013, 2014) but never based on large carbonate system datasets such as in the present study, with almost a decade of discrete DIC/TA data at three contrasted coastal sites. The seasonal pCO2 signal has conventionally been divided into “thermal” (pCO2therm) and “non-thermal” (pCO2non–therm) signals to disentangle thermal from biological (OM production/remineralization) processes impacting the pCO2 seasonal dynamics in the WEC (Marrec et al., 2013, 2014, Gac et al., 2020) or in the Bay of Brest (Bozec et al., 2011). However, in such nearshore ecosystems, the carbonate system can be affected by various other processes, such as estuarine inputs, mixing, air–sea CO2 fluxes, calcification/dissolution of CaCO3, or pelagic/benthic coupling (Salt et al., 2016; Chen and Hu, 2019; Figure 7). The unprecedented TA/DIC dataset collected in this study over a relatively long period, and concomitantly at three different sites, allowed further evaluation of the drivers of spatial and interannual variability of the carbonate system. A simple comparison of the DIC/TA relationship at the three sites over the 2010–2017 period revealed a high heterogeneity of the carbonate system between nearshore and offshore waters within a limited geographical region (Figure 7). These background concentrations condition the control on FCO2 (Humphreys et al., 2018) and the response or buffering of the ecosystem to various biogeochemical processes (Middelburg et al., 2020). Figure 7 also shows the influence of the dominant drivers and stoichiometry on DIC and TA, indicating complex interactions in these coastal ecosystems. A straightforward SSS-normalization of DIC and TA (Figures 4, 7) revealed a stronger impact of mixing on DIC and TA in the Bay of Brest than in WEC ecosystems. We adapted the study of Xue et al. (2016) (Section “Determination of Processes Controlling DIC/pCO2 Based on a 1-D Mass Budget Model”) to construct a 1-D DIC/pCO2 model to quantify the physical (mixing, air–sea exchange) and biological (NEP) drivers of the carbonate system. This model is well suited for considering freshwater inputs in addition to thermal and non-thermal drivers. Factors driving monthly DIC and pCO2 variability at the three study sites are represented in Figure 8. While the conclusions derived from the 1-D model are in general agreement with those derived from the simple pCO2therm/pCO2non–therm separation, they also illustrate how various processes enhance or cancel each other out. Note that the impact of each factor is represented by monthly ΔDIC and ΔpCO2.
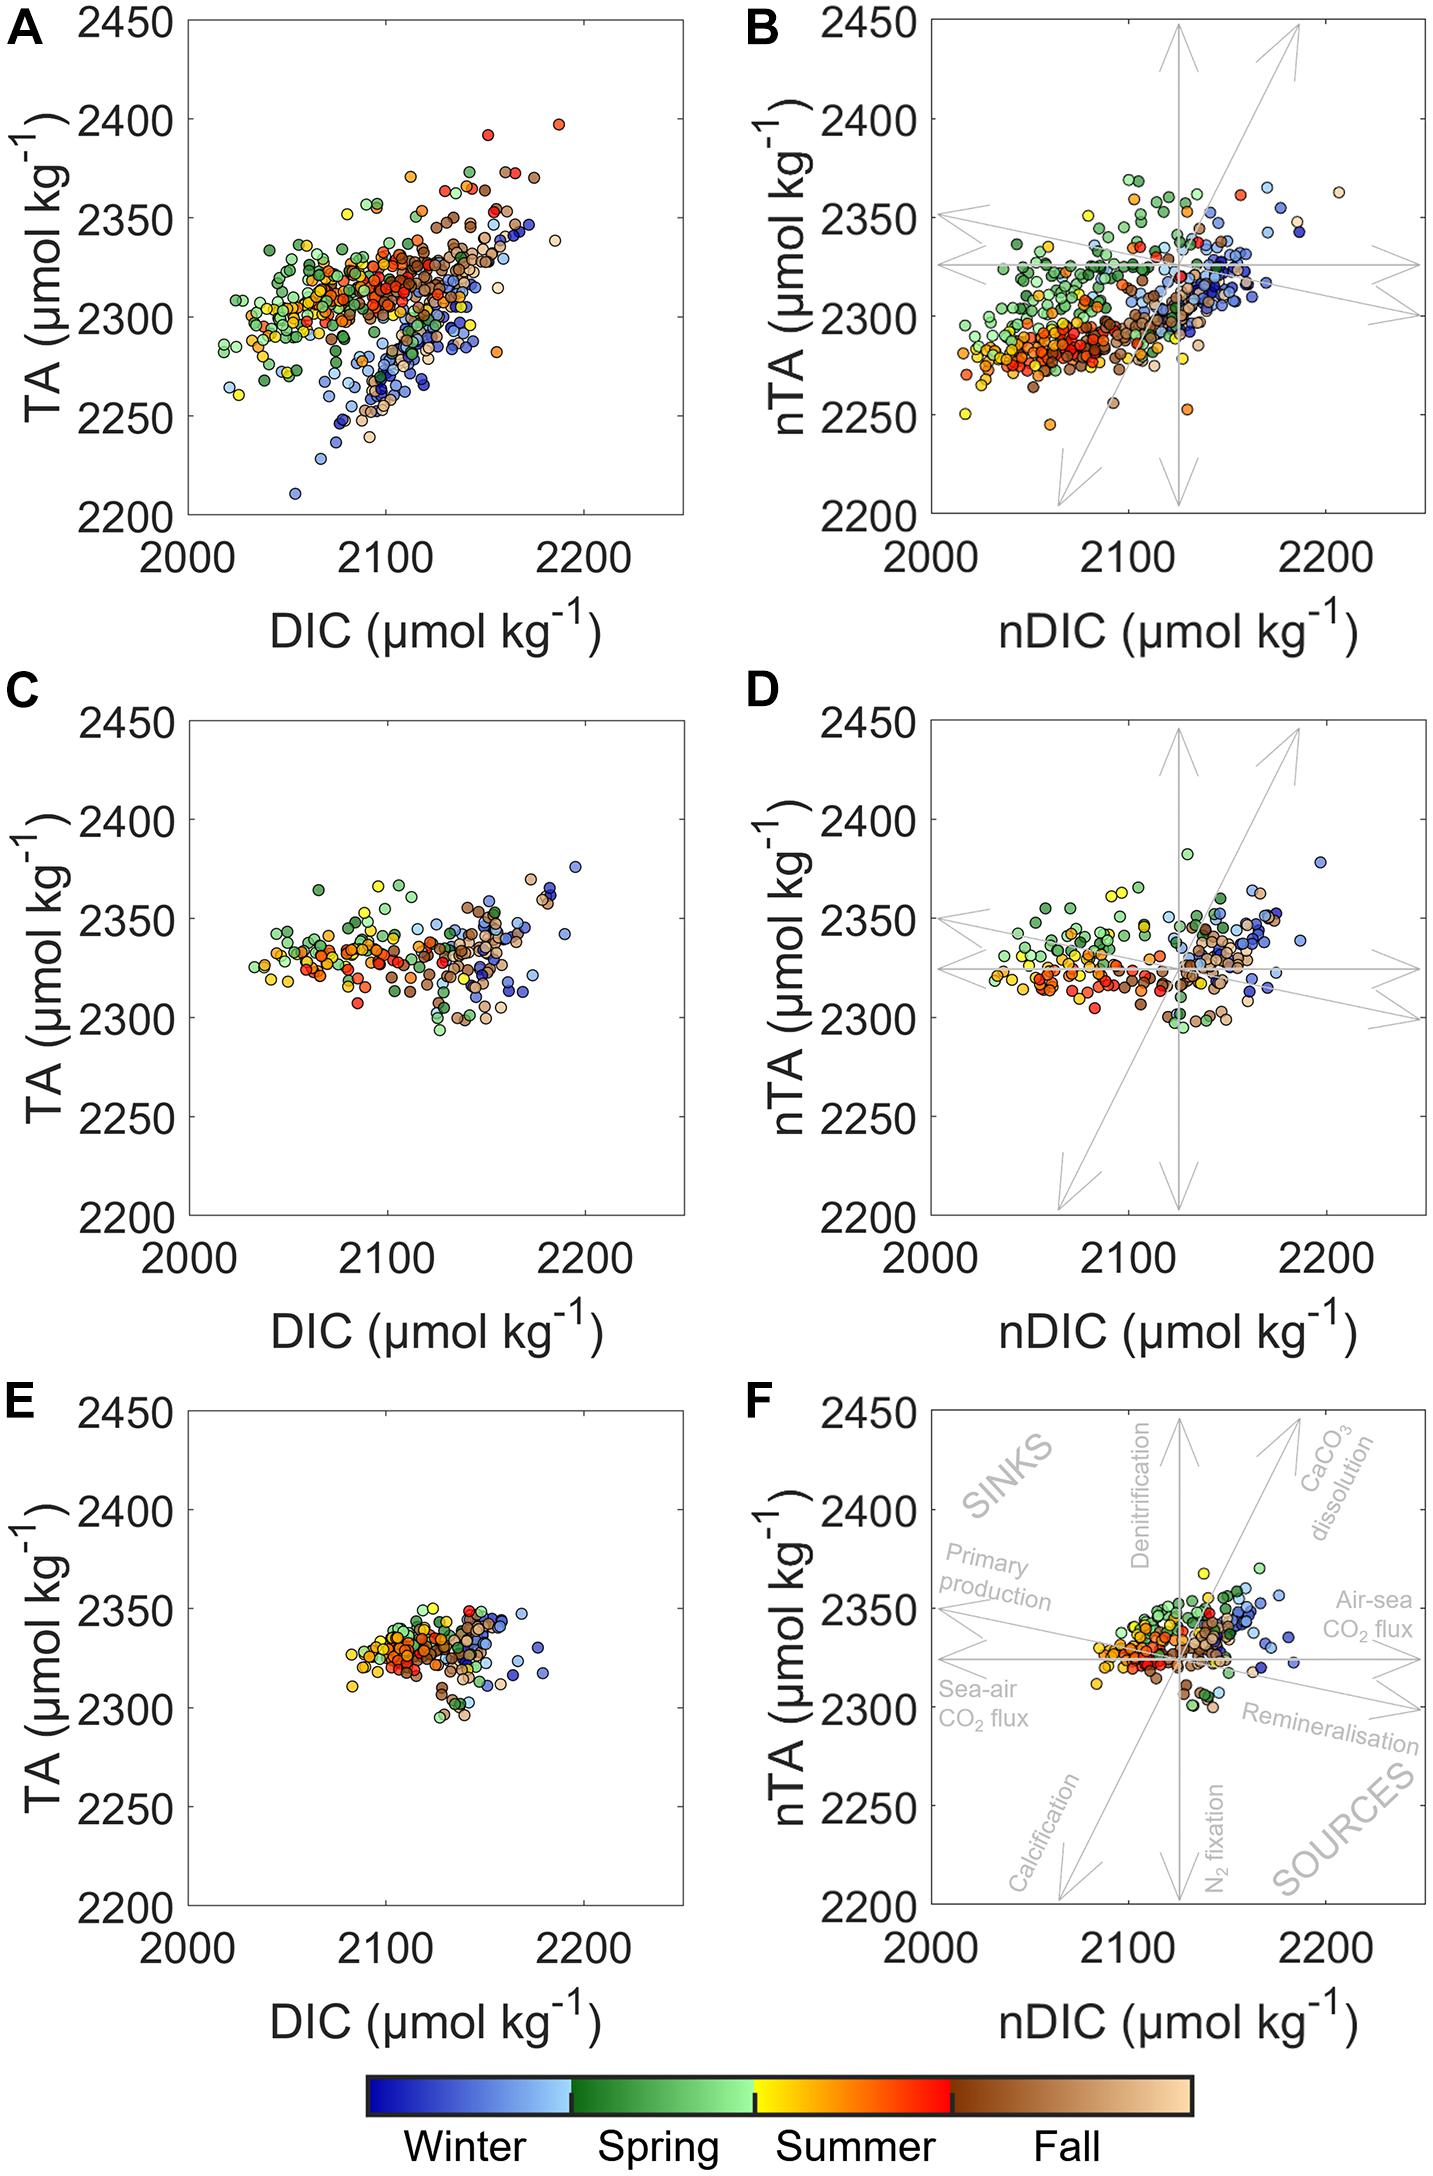
Figure 7. DIC (μmol kg–1) vs. TA (μmol kg–1) and nDIC (μmol kg–1) vs. nTA (μmol kg–1) at (A,B) SOMLIT-Brest, (C,D) SOMLIT-pier, and (E,F) SOMLIT-offshore with the (F) dominant annual processes affecting the carbonate system and their stoichiometric influence on nDIC and nTA.
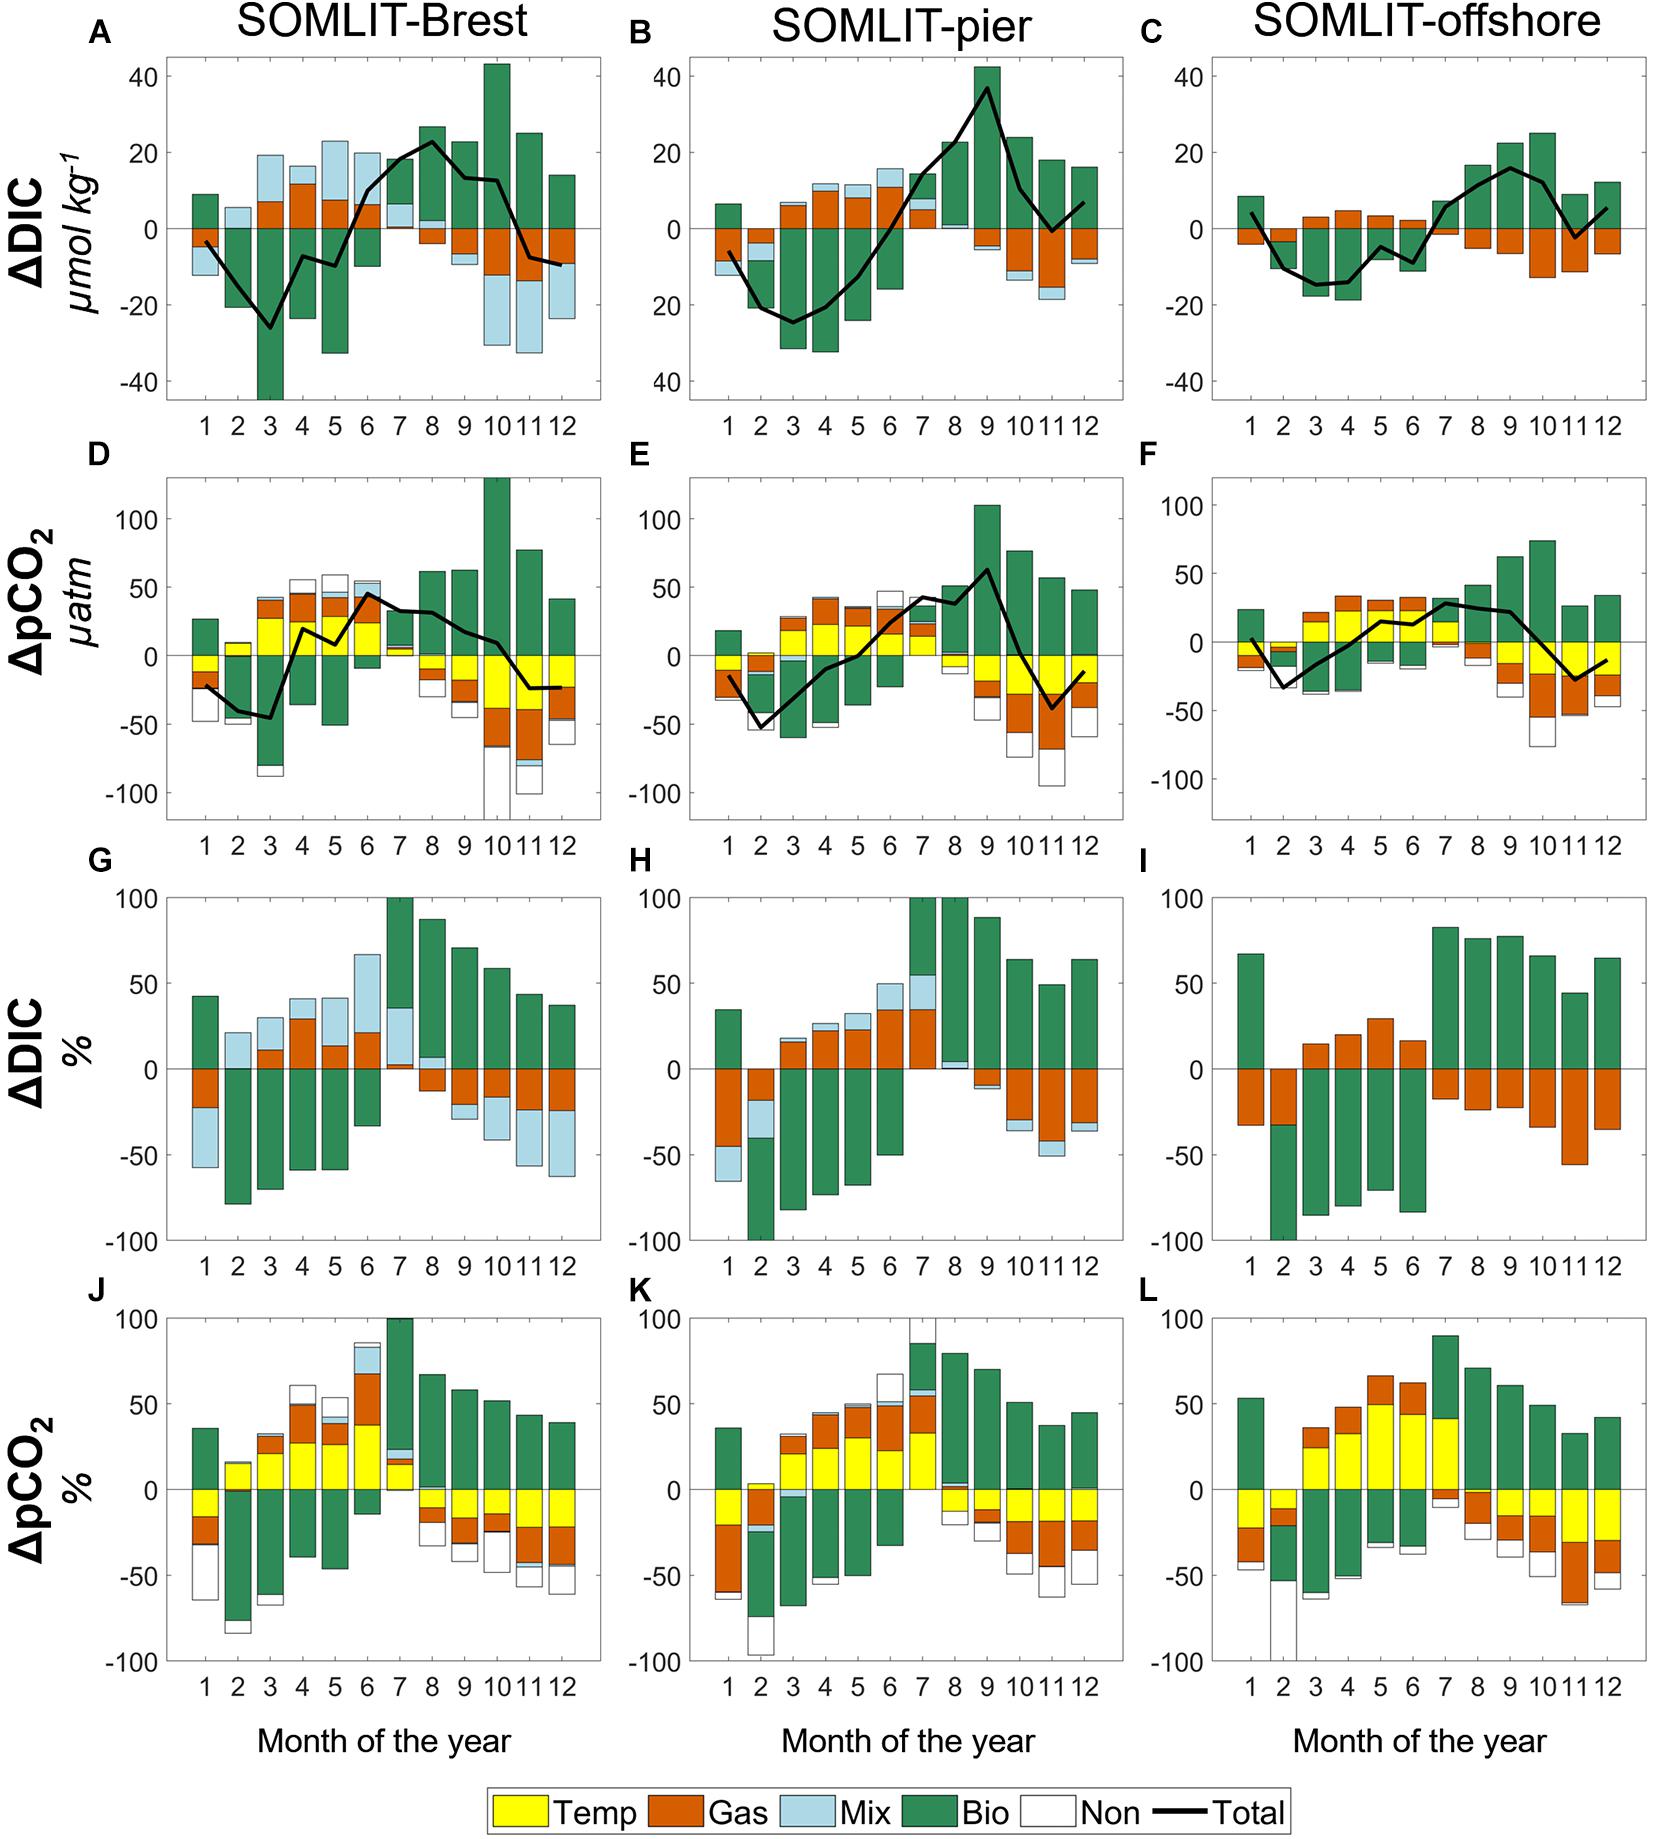
Figure 8. (Top) Monthly means and (bottom) relative importance (%) of DIC (μmol kg–1) and pCO2 (μatm) changes due to thermodynamics (Δxtem, in yellow), air–sea exchanges (Δxgas, in vermillion), mixing (Δxmix, in light blue), and biological activity (Δxbio, in sea green) at (A,D,G,J) SOMLIT-Brest, (B,E,H,K) SOMLIT-pier, and (C,F,I,L) SOMLIT-offshore. Δx is the difference of pCO2 or DIC between two consecutive months over the January 2010 to December 2017 period. Positive (or negative) values denote the increase (or decrease) between two consecutive months (see Section “Determination of Processes Controlling DIC/pCO2 Based on a 1-D Mass Budget Model” for details on calculations).
Over a full annual cycle, mixing processes had a relatively larger contribution in the Bay of Brest compared to SOMLIT-pier and SOMLIT-offshore. Riverine inputs were characteristic of non-limestone watersheds, with low DIC and low TA end-members, as also observed in coastal and shelf waters around Ireland (McGrath et al., 2016) and in Liverpool Bay (Hydes and Hartman, 2012). These riverine inputs induced decreases of DIC and pCO2 in fall and winter with maxima of 19 μmol kg–1 and 5 μatm, respectively, at SOMLIT-Brest. As mentioned in Sections “Hydrographical Properties” and “Seasonality of the Carbonate System,” the winters of 2013/2014 and 2015/2016 were characterized by large freshwater input responsible for large drawdowns of TA in the bay. Computation based on our model estimated that the contribution of the mixing term on DIC was three to four times higher in November 2013 compared to the annual average, highlighting the strong interannual variability driven by freshwater inputs. It is worth noting that for the same period, the mixing term on DIC at SOMLIT-pier was also four times stronger, reaching −14 μmol kg–1 compared to the standard mean of −3 μmol kg–1 observed over the period (data not shown). Mixing effects were still substantial in the Bay of Brest during early spring, with increased DIC/TA due to the larger contribution of Atlantic surface waters with higher DIC/TA and reduced riverine inputs. Similar observations were made at SOMLIT-pier and SOMLIT-offshore with increasing SSS during spring.
During spring, biological processes controlled the DIC/pCO2 signal at all three sites as previously observed (Marrec, 2014; Salt et al., 2016; Gac et al., 2020). This period was characterized by DO% > 100%, high Chl a (Figure 3E), and DIC/TA ratios following the OM production stoichiometric ratio (Figure 7). We estimated mean DIC uptakes of 30–45 μmol kg–1 in nearshore ecosystems and 15–20 μmol kg–1 offshore with concomitant uptake of pCO2 of 60–80 and 36 μatm, respectively. This biological uptake was counterbalanced by mixing in the Bay of Brest, but more significantly by air-to-sea fluxes for DIC/pCO2 and thermodynamic effect for pCO2 at all three sites. In March 2010 and 2015, exceptional phytoplankton blooms were responsible for an extra DIC uptake 20% to 25% higher than mean annual uptake rates. The competing importance of biological vs. thermodynamics on pCO2 continued during early summer with both signals representing 40% of the variability, while air-to-sea fluxes closed the budget (Figure 8). Starting in July, OM remineralization overtook OM production processes, as revealed by the increase of DIC and pCO2non–therm at all three sites, while DO% decreased. At the same time, thermodynamic effects (for pCO2) and sea-to-air fluxes (for DIC and pCO2) tended to compensate the release of inorganic carbon due to OM remineralization, representing 20% to 30% of the pCO2 signal, respectively (Figure 8).
An enhanced contribution of mixing occurred in early fall in the bay of Brest as mentioned above. Freshwater inputs with low DIC, combined with sea-to-air CO2 fluxes and cooling of surface seawater, all acted to decrease pCO2 in the same proportion as the pCO2 and DIC releases by OM remineralization processes. Similar observations for the fall period were made in the Roscoff ecosystems and continued in early winter, with January marking the transition to another annual cycle. Full characterization and quantification of processes controlling the carbonate system in highly dynamic and contrasted coastal ecosystems relies on long-term time series (Borges et al., 2008; Bauer et al., 2013; Fennel et al., 2019). Without taking into consideration the inherent interannual variability at each site, such characterization can be incomplete (Borges et al., 2008). Extreme values recorded in this study, together with the long duration, strengthen our understanding of the physical and biogeochemical processes driving the carbonate system at these coastal sites.
As mentioned in Section “Study Area,” the water column was well-mixed throughout the year at the three coastal stations with an average depth of 10 m for SOMLIT-pier and SOMLIT-Brest and 60 m for SOMLIT-offshore. For the latter, the relatively deep water column and the limited amount of light reaching the seafloor might limit the contribution of the benthic compartment to the pelagic signal observed at the surface. Conversely, in the two shallow nearshore ecosystems, the benthic compartment may exert a strong control on the carbonate signal with high OM production/remineralization and/or CaCO3 dissolution/precipitation characteristic of benthic communities in various coastal environments (Hammond et al., 1999; Cai et al., 2000; Forja et al., 2004; Martin et al., 2007; Waldbusser and Salisbury, 2014; Oliveira et al., 2018). These two nearshore stations were characterized by different benthic communities with maerl (coralline red algae) beds in the bay of Brest (e.g., Martin et al., 2007; Longphuirt et al., 2007; Lejart and Hily, 2011) and seagrass and macroalgae beds at SOMLIT-pier (Ouisse et al., 2011; Bordeyne et al., 2017). The latter sustained large production/remineralization of OM (Migné et al., 2005; Golléty et al., 2008) with a limited impact of calcification processes, whereas Martin et al. (2006, 2007) showed that intense benthic calcification occurred in the bay of Brest during spring and summer, with dissolution the rest of the year, which exert a control on the carbonate system. Our model did not take into account the impact of the CaCO3 precipitation/dissolution. Salt et al. (2016) estimated that 10% of DIC/TA signals during spring and fall were due to CaCO3 precipitation and dissolution, respectively. During summer, OM production is sufficiently high to mask the effect of calcification, while during winter, sustained freshwater input with low DIC/TA tend to mask dissolution of CaCO3 (Salt et al., 2016). Our model potentially resulted in a minor overestimation of DIC uptake by OM production in spring and an underestimation of the contribution of OM degradation during fall. However, the 1-D model remained robust for identifying the main drivers throughout the year. At SOMLIT-pier, the production/dissolution of CaCO3 was likely negligible, with biological signals on DIC/pCO2 most likely due to the combined effect of benthic and pelagic OM production/remineralization (Gac et al., 2020), both of which are included in the model.
Seasonal and annual NEP (Table 1 and Figure 9) estimates were computed based on modeled DIC budgets with FCO2 correction, providing reliable estimates of the metabolic rates of ecosystems (Borges et al., 2008; Staeher et al., 2012). In the nearshore ecosystems, both benthic and pelagic compartments contributed to NEP estimates, while pelagic processes can reasonably be considered as the major NEP drivers at the SOMLIT-offshore station. Over the study period, the amplitude of NEP per surface area was two times higher in nearshore shallow waters (10 mol C m–2 year–1) than in offshore deeper waters (5 mol C m–2 year–1) (Figure 9) as previously observed in estuarine plumes (Borges et al., 2008) or tidal wetlands (Herrmann et al., 2015; Najiar et al., 2018) vs. shelf waters. From summer to winter, all of the study sites were characterized by negative NEP values; i.e., the ecosystems were heterotrophic. During early spring, positive NEP values indicate that all ecosystems were autotrophic. NEP mirrored monthly FCO2 (Figure 9), except during the transition from spring to summer in nearshore ecosystems when OM remineralization in the benthic compartment could overturn the system to heterotrophic, while pCO2 values of the water column were still below CO2 atmospheric equilibrium (Salt et al., 2016). This transition occurred 1 month earlier in the Bay of Brest than at SOMLIT-Pier. At SOMLIT-offshore, the seasonal trophic state of the ecosystem correlated with the direction of the fluxes. Table 1 shows that all three ecosystems were very close to trophic and atmospheric equilibrium on an annual scale, which led to interannual variability in terms of ecosystem trophic status and sink/source of CO2 from year to year.
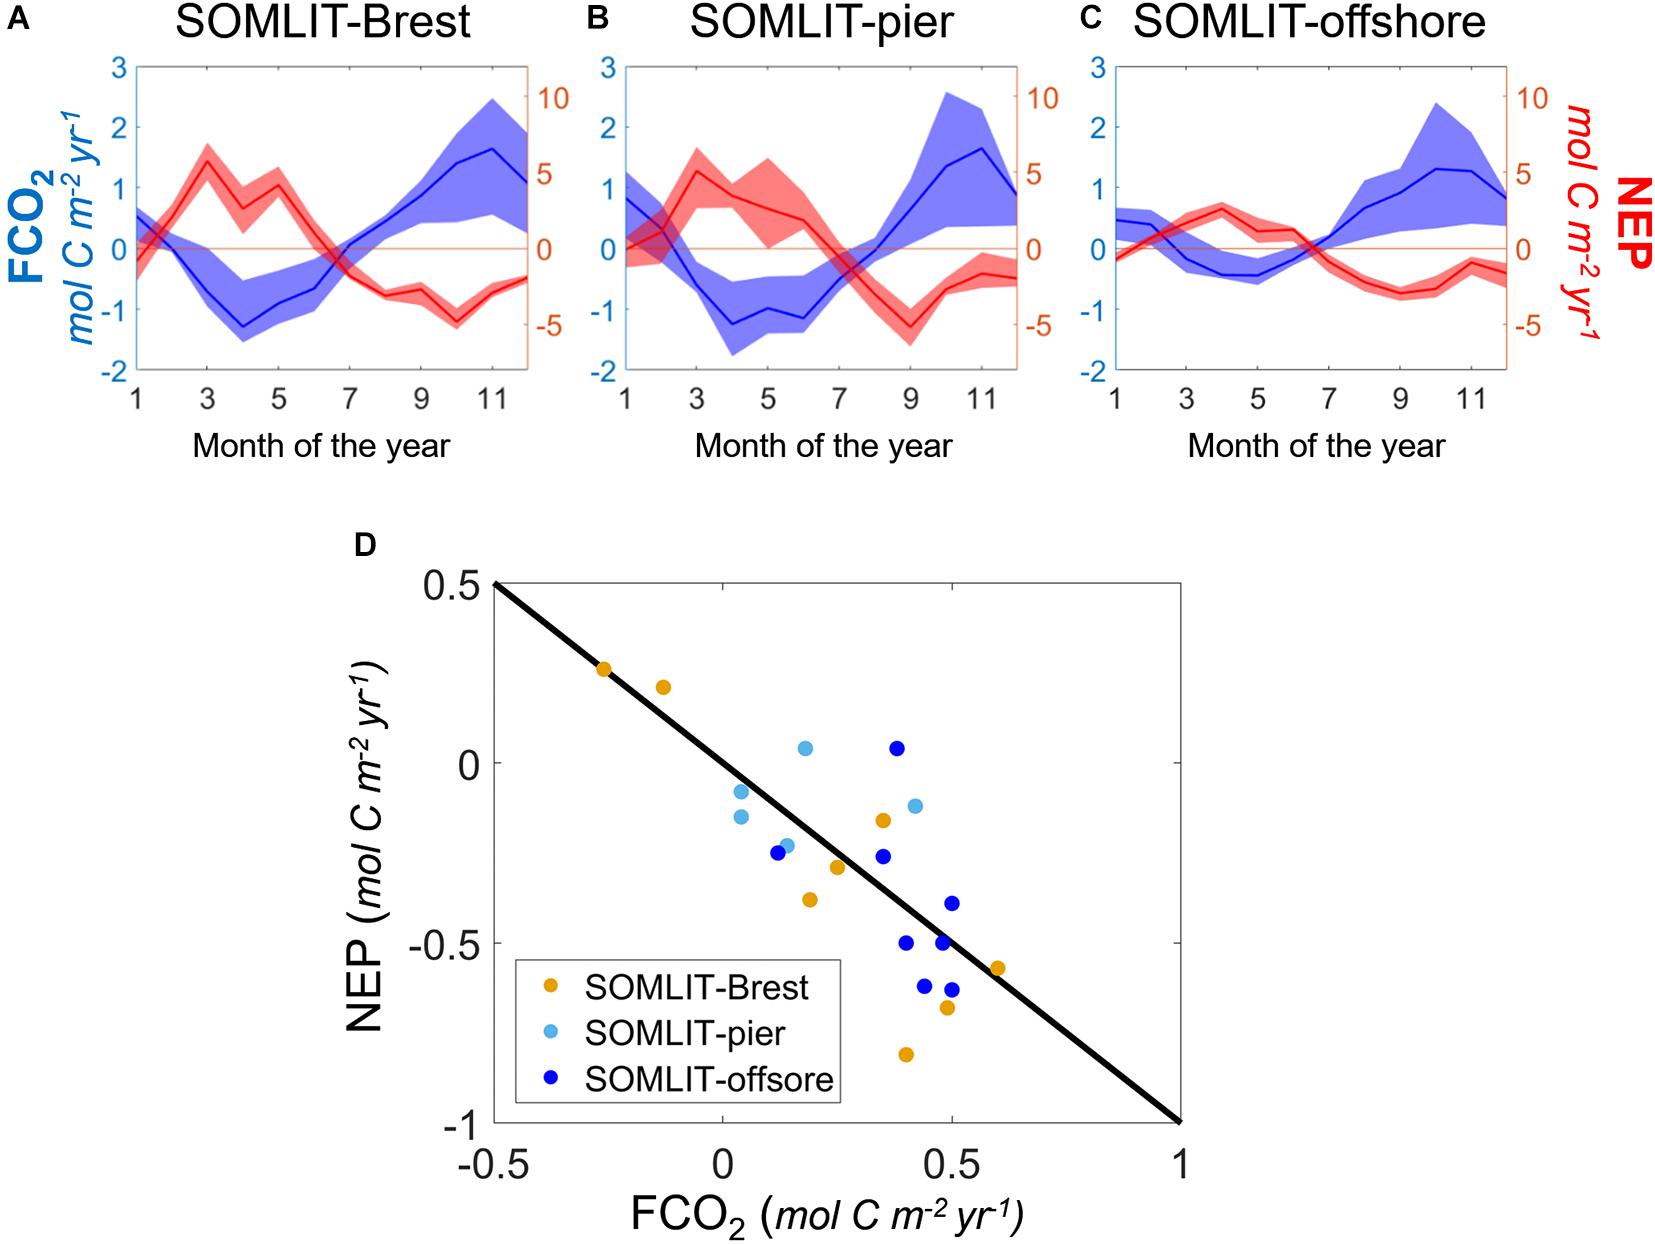
Figure 9. Monthly average of FCO2 (blue, mol C m– 2 year–1) and NEP (red, mol C m– 2 year–1) at (A) SOMLIT-Brest, (B) SOMLIT-pier, and (C) SOMLIT-offshore. Shaded areas represent the quartiles of the annual means. (D) NEP vs. FCO2 annual means at SOMLIT-Brest (orange), SOMLIT-pier (light blue), and SOMLIT-offshore (dark blue), from January 2010 to December 2017. The black line represents the 1:1 relationship.
On an annual scale, SOMLIT-Brest waters could either be weakly heterotrophic or autotrophic depending on the year. The close relationship found between NEP and FCO2 (Figure 9D) suggested that amid the numerous drivers of the carbonate system described above, NEP, and more particularly spring NEP, controlled the direction of FCO2. The massive blooms recorded in spring 2010 and 2015, characterized by high Chl a values (Figure 3), were sufficient to turn the ecosystem into an annual sink of atmospheric CO2 (−0.26 and −0.13 mol C m–2 year–1, respectively) compared to the average value of +0.18 ± 0.10 mol C m–2 year–1 over the 2010–2017 period. The latter estimate was similar to recent estimations for the 2008–2015 period of +0.14 ± 0.2 mol C m–2 year–1 (Salt et al., 2016). Similar interannual variability in carbonate system dynamics and FCO2 directions was observed in the South Atlantic Bight (SAB) by Reimer et al. (2017a) and amplified by continental and riverine inputs in the Gulf of Maine (Vandemark et al., 2011) or off the coast of Georgia, United States (Xue et al., 2016).
More pronounced and constant heterotrophic features were observed at SOMLIT-pier and SOMLIT-offshore with mean negative (or close to zero) NEP values with an average value of −0.39 mol C m–2 year–1 from 2010 to 2017. As suggested by the significant correlation (r2 = 0.66, p-value < < 0.05, n = 36 at SOMLIT-Brest; r2 = 0.57, p-value < < 0.05, n = 29 at SOMLIT-pier; and r2 = 0.73 p-value < < 0.05, n = 33 at SOMLIT-offshore, based on the seasonal means of Table 1) between NEP and FCO2, SOMLIT-pier and SOMLIT-offshore were weak sources of CO2 to the atmosphere of +0.11 ± 0.12 mol m–2 year–1 and of +0.40 ± 0.08 mol m–2 year–1 over the 8-year period, respectively. These FCO2 estimations confirmed the near-shore/offshore gradient observed for the 2015–2019 period with values of +0.37 mol C m–2 year–1 and +0.65 mol C m–2 year–1 based on HF data (Gac et al., 2020) and were within the range of larger scale estimations for the sWEC of +0.53 mol C m–2 year–1 (Marrec, 2014).
Long-term time series of carbonate parameters in coastal ecosystems remain scarce but are essential to assess their evolution under climate change. Time-series based on at least two parameters of the carbonate system are essential to fully understand the processes driving the observed trends. In this study, the DIC/TA dataset revealed a significant increase in DIC concomitant with a somewhat unexpected increase of TA at the two nearshore stations and relatively stable TA at SOMLIT-offshore during the study period (Figure 5). Recent observations based on similar DIC/TA datasets also revealed an increase in TA for the 2007–2015 period, albeit in very different ecosystems at the coastal Point B site in the Mediterranean Sea (Kapsenberg et al., 2017) and in the North Atlantic Subpolar Gyre (Leseurre et al., 2020). In our study, similarly, to the observations made at point B and contrary to the North Atlantic Subpolar Gyre, the increase in TA was concomitant with a significant increase in pCO2 of 3.52 ± 0.47, 2.95 ± 1.04, and 3.11 ± 0.49 μatm year–1 and decrease in pH of −0.0029 ± 0.0005, −0.0028 ± 0.0010, and −0.0027 ± 0.0004 year–1 at SOMLIT-Brest, SOMLIT-pier, and SOMLIT-offshore, respectively (Figure 5).
The deconvolution model (Section “Analysis of Trends”) made it possible to approximate the effect of increasing atmospheric temperature, as well as the increase in DIC exerted by the forcing of atmospheric CO2, on pCO2/pH trends. The observed variations in DIC/TA were associated with sea surface warming of 0.08 ± 0.01°C year–1, 0.06 ± 0.02°C year–1, and 0.07 ± 0.01°C year–1 at SOMLIT-Brest, SOMLIT-pier, and SOMLIT-offshore, respectively. Based on the theoretical relationship between SST and pCO2 of 0.0423% °C–1 (Takahashi et al., 1993), these SST increases resulted in a pCO2 increase of 1.21 ± 0.21, 0.96 ± 0.26, and 1.21 ± 0.24 μatm year–1 over the study period, respectively (Figure 6). These pCO2therm trends were consistent with the slopes related to SST obtained from the deconvolution model for these three stations (Table 2). Similarly, the differences between the trends of pHin situ and pH25°C (Figure 6) were close to the values obtained for the contribution of SST to pHin situ trends based on the deconvolution model. These observations confirmed that the deconvolution model correctly estimated the impact of warming surface waters on the increase of pCO2 and the decrease of pHin situ observed during the study period. The contributions of SST to the observed trends of both pCO2 and pHin situ varied from 26 to 31% at the Roscoff stations and was 35%–37% at SOMLIT-Brest. These contributions related to the increase in temperature were similar to the observations made by Kapsenberg et al. (2017) in the Mediterranean Sea for pCO2therm (+1.19 μatm year–1 for surface waters) with similar trends of SST (+0.07°C year–1, period 2007–2015).
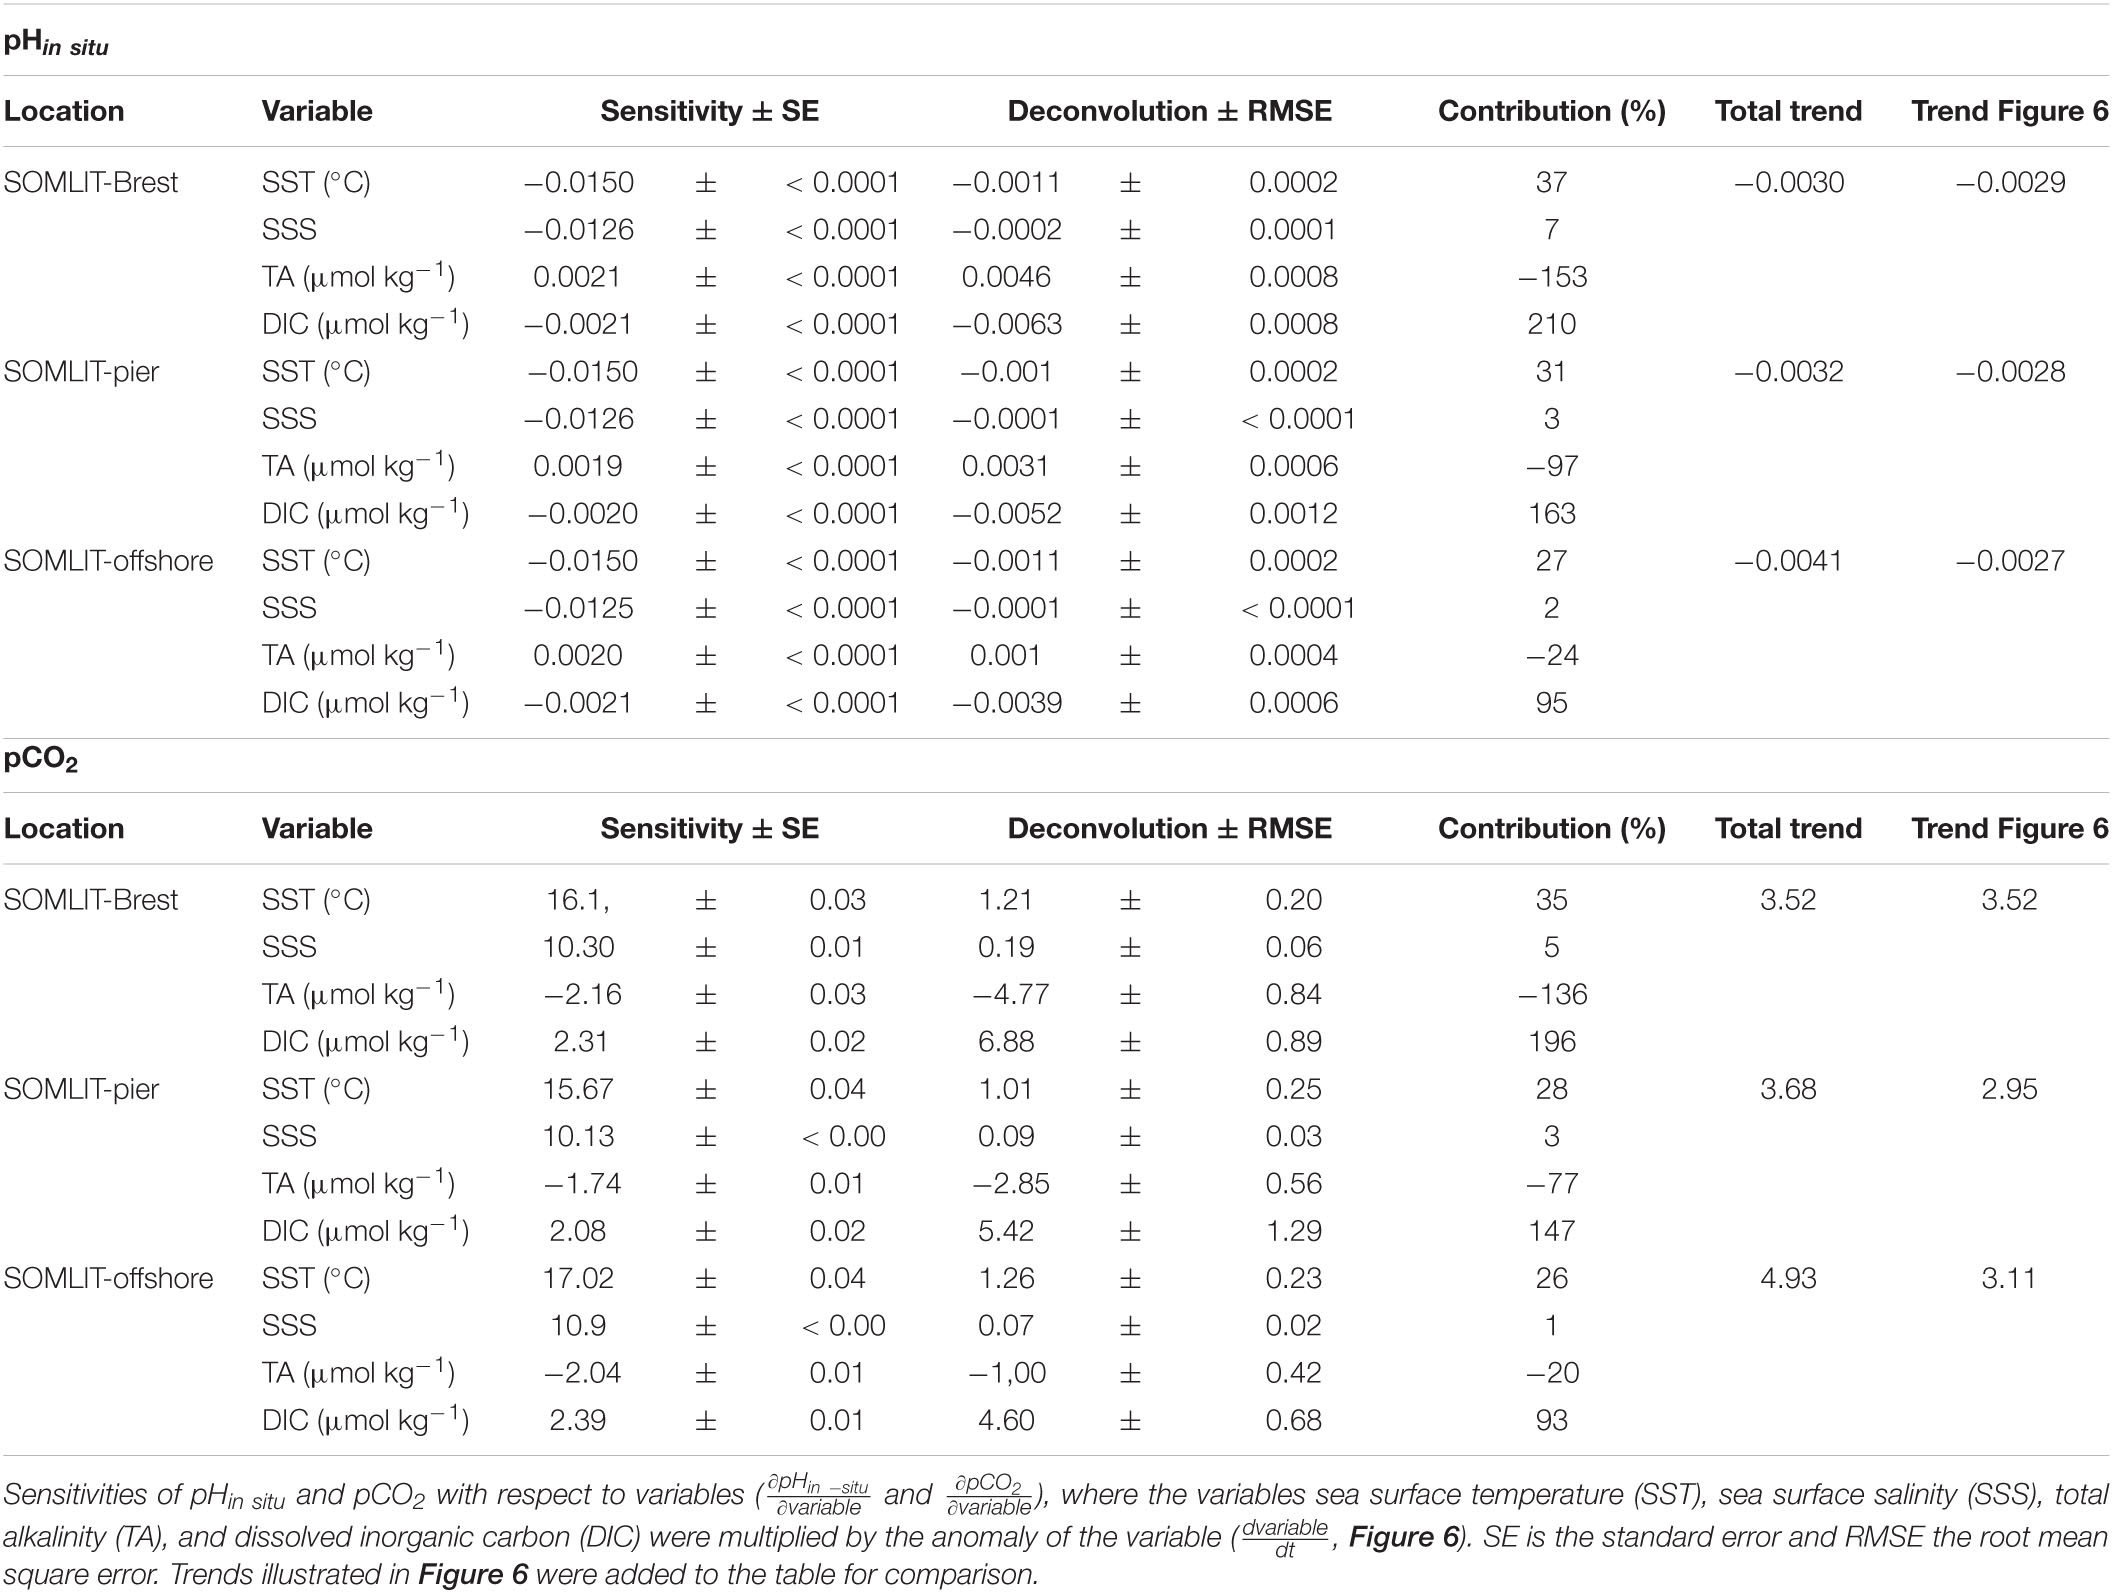
Table 2. Deconvolution of pHin situ anomalies (, year–1) and pCO2 anomalies (, μatm year–1) at SOMLIT-Brest, SOMLIT-pier, and SOMLIT-offshore.
The sum of the contributions of SST, SSS, TA, and DIC to the trends of pCO2 and pHin situ based on the deconvolution model was similar to the observed trends of these parameters at the nearshore stations, which further confirmed the robustness of the method for these stations (Table 2). At SOMLIT-offshore, the aggregated trends were slightly overestimated but still near the range of error of the method. The increase in DIC exerted by the forcing of atmospheric CO2 was partly compensated by the increase in TA (which has a buffering effect on OA and is not directly impacted by addition of anthropogenic CO2 to seawater). Using the pCO2 deconvolution model, we can sum the contribution of TA and DIC to pCO2 to assess the relative contribution of ΔDIC to ΔpCO2 that is unrelated to changes in DIC due to TA increase (Kapsenberg et al., 2017). The remaining increase of 2.11 and 2.57 μatm pCO2 year–1 due to increasing DIC at the nearshore stations closely matched the magnitude of atmospheric pCO2 increase during the observation period (2.27 μatm year–1 at Mace Head, Ireland). Since surface waters at the nearshore stations were a weak source of CO2 over annual cycles (Section “Comparison Between Ecosystems of the Processes Controlling the Carbonate System”), we can assume that OA in these coastal sites was mainly driven by this atmospheric CO2 increase. Applying this simple model to pHin situ, assuming changes in DIC are due to both increasing TA (a neutralizing effect) and atmospheric CO2 forcing, the surface OA trend at SOMLIT-Brest can be attributed primarily to atmospheric CO2 forcing (57%), secondarily to warming (37%) and finally to changes in SSS (7%). At SOMLIT-pier, OA can be attributed primarily to atmospheric CO2 forcing (66%), secondarily to warming (31%) and finally to changes in SSS (3%). At SOMLIT-offshore, the model was not as robust as for the other sites, possibly due to limited SSS and/or TA variations. In addition, the annual emission of CO2 to the atmosphere was higher than at nearshore sites, which might have induced a bias in the computation. The OA trend nevertheless seemed to be primarily driven by atmospheric CO2 forcing (71%) and secondarily by warming (27%).
While the trends in atmospheric CO2 and temperature were the main drivers of OA at all three sites, the increase in TA and DIC, beyond what can be attributed to changes in atmospheric CO2, were unexpected. Considering the variability associated with the deconvolution of pCO2 due to DIC increase at the three sites, the atmospheric CO2 increase should represent 33%–49% of the total DIC contribution to dpCO2/dt (Table 2). This leaves 51%–67% of the total DIC contribution to pCO2 trends unaccounted for. The buffering effect of TA partly compensated this DIC contribution in the model for the two nearshore ecosystems. Estimating the additional source of DIC and TA to the surface waters of these ecosystems would require several hypotheses. Assuming that the same processes were responsible for both the increase in DIC and TA, numerous drivers can modify the buffering capacity of the ecosystem (Middelburg et al., 2020). For a complete consideration of each process, we refer to Wolf-Gladrow et al. (2007), and simply consider here the dominant processes driving the carbonate systems described in Section “Comparison Between Ecosystems of the Processes Controlling the Carbonate System” (Figure 7). A decrease in NEP (i.e., increase in OM remineralization) based on DICbio corrected from FCO2 (Section “Determination of Processes Controlling DIC/pCO2 Based on a 1-D Mass Budget Model”) could increase both DIC and TA, but neither NEP nor DO% showed significant trends during the study period (Figures 5, 6). An increase in CaCO3 dissolution in the benthic compartment at both nearshore sites could also result in simultaneous increase in DIC and TA. As mentioned in Section “Comparison Between Ecosystems of the Processes Controlling the Carbonate System,” SOMLIT-Brest and SOMLIT-pier have very different benthic populations with non-calcifying species dominating at SOMLIT-pier. Given the simultaneous increase in DIC/TA at both sites, it is unlikely that CaCO3 dissolution was the additional source of DIC/TA. Long-term variability in river discharge has been linked to intensified drought in Europe (Caloiero et al., 2018) and/or to AMV fluctuations (Tréguer et al., 2014; Sutton et al., 2018). Variations in river discharge can modify both DIC and TA in nearshore ecosystems, but SSS did not exhibit any significant trends during the study period (Figure 5). Increasing TA of the freshwater end-member could be a conceivable mechanism causing the unexpected TA and DIC trends. Positive trends in river TA have been documented in North America and occur via various processes. Stets et al. (2014) observed TA increases in North American rivers together with decrease in nitrate due to modified agricultural practice. Similar modifications in agricultural practice have been encouraged in Brittany and confirmed by the decreasing trends in nitrate concentration in nearshore ecosystems for the past two decades (Figures 3, 10 and Section “Comparison of OA Trends and Climatic Context Over the 1997–2020 Period” below). Changes in end-member DIC/TA could be linked to limestone addition used to enhance agricultural soil pH to counteract acidifying effects of fertilizer usage and nitrogen-fixing plants (Oh and Raymond, 2006; Hamilton et al., 2007). However, given the complexity of TA/DIC control in these agricultural watersheds, this hypothesis cannot be confirmed and would require further evaluation. Maintaining time series of at least two carbonate system parameters in coastal ecosystem is challenging but provides key information on the potential drivers of OA. Given the complexity of these ecosystems, combining these time series with additional regular sampling in adjacent rivers and estuaries might improve our understanding of interacting anthropogenic drivers.
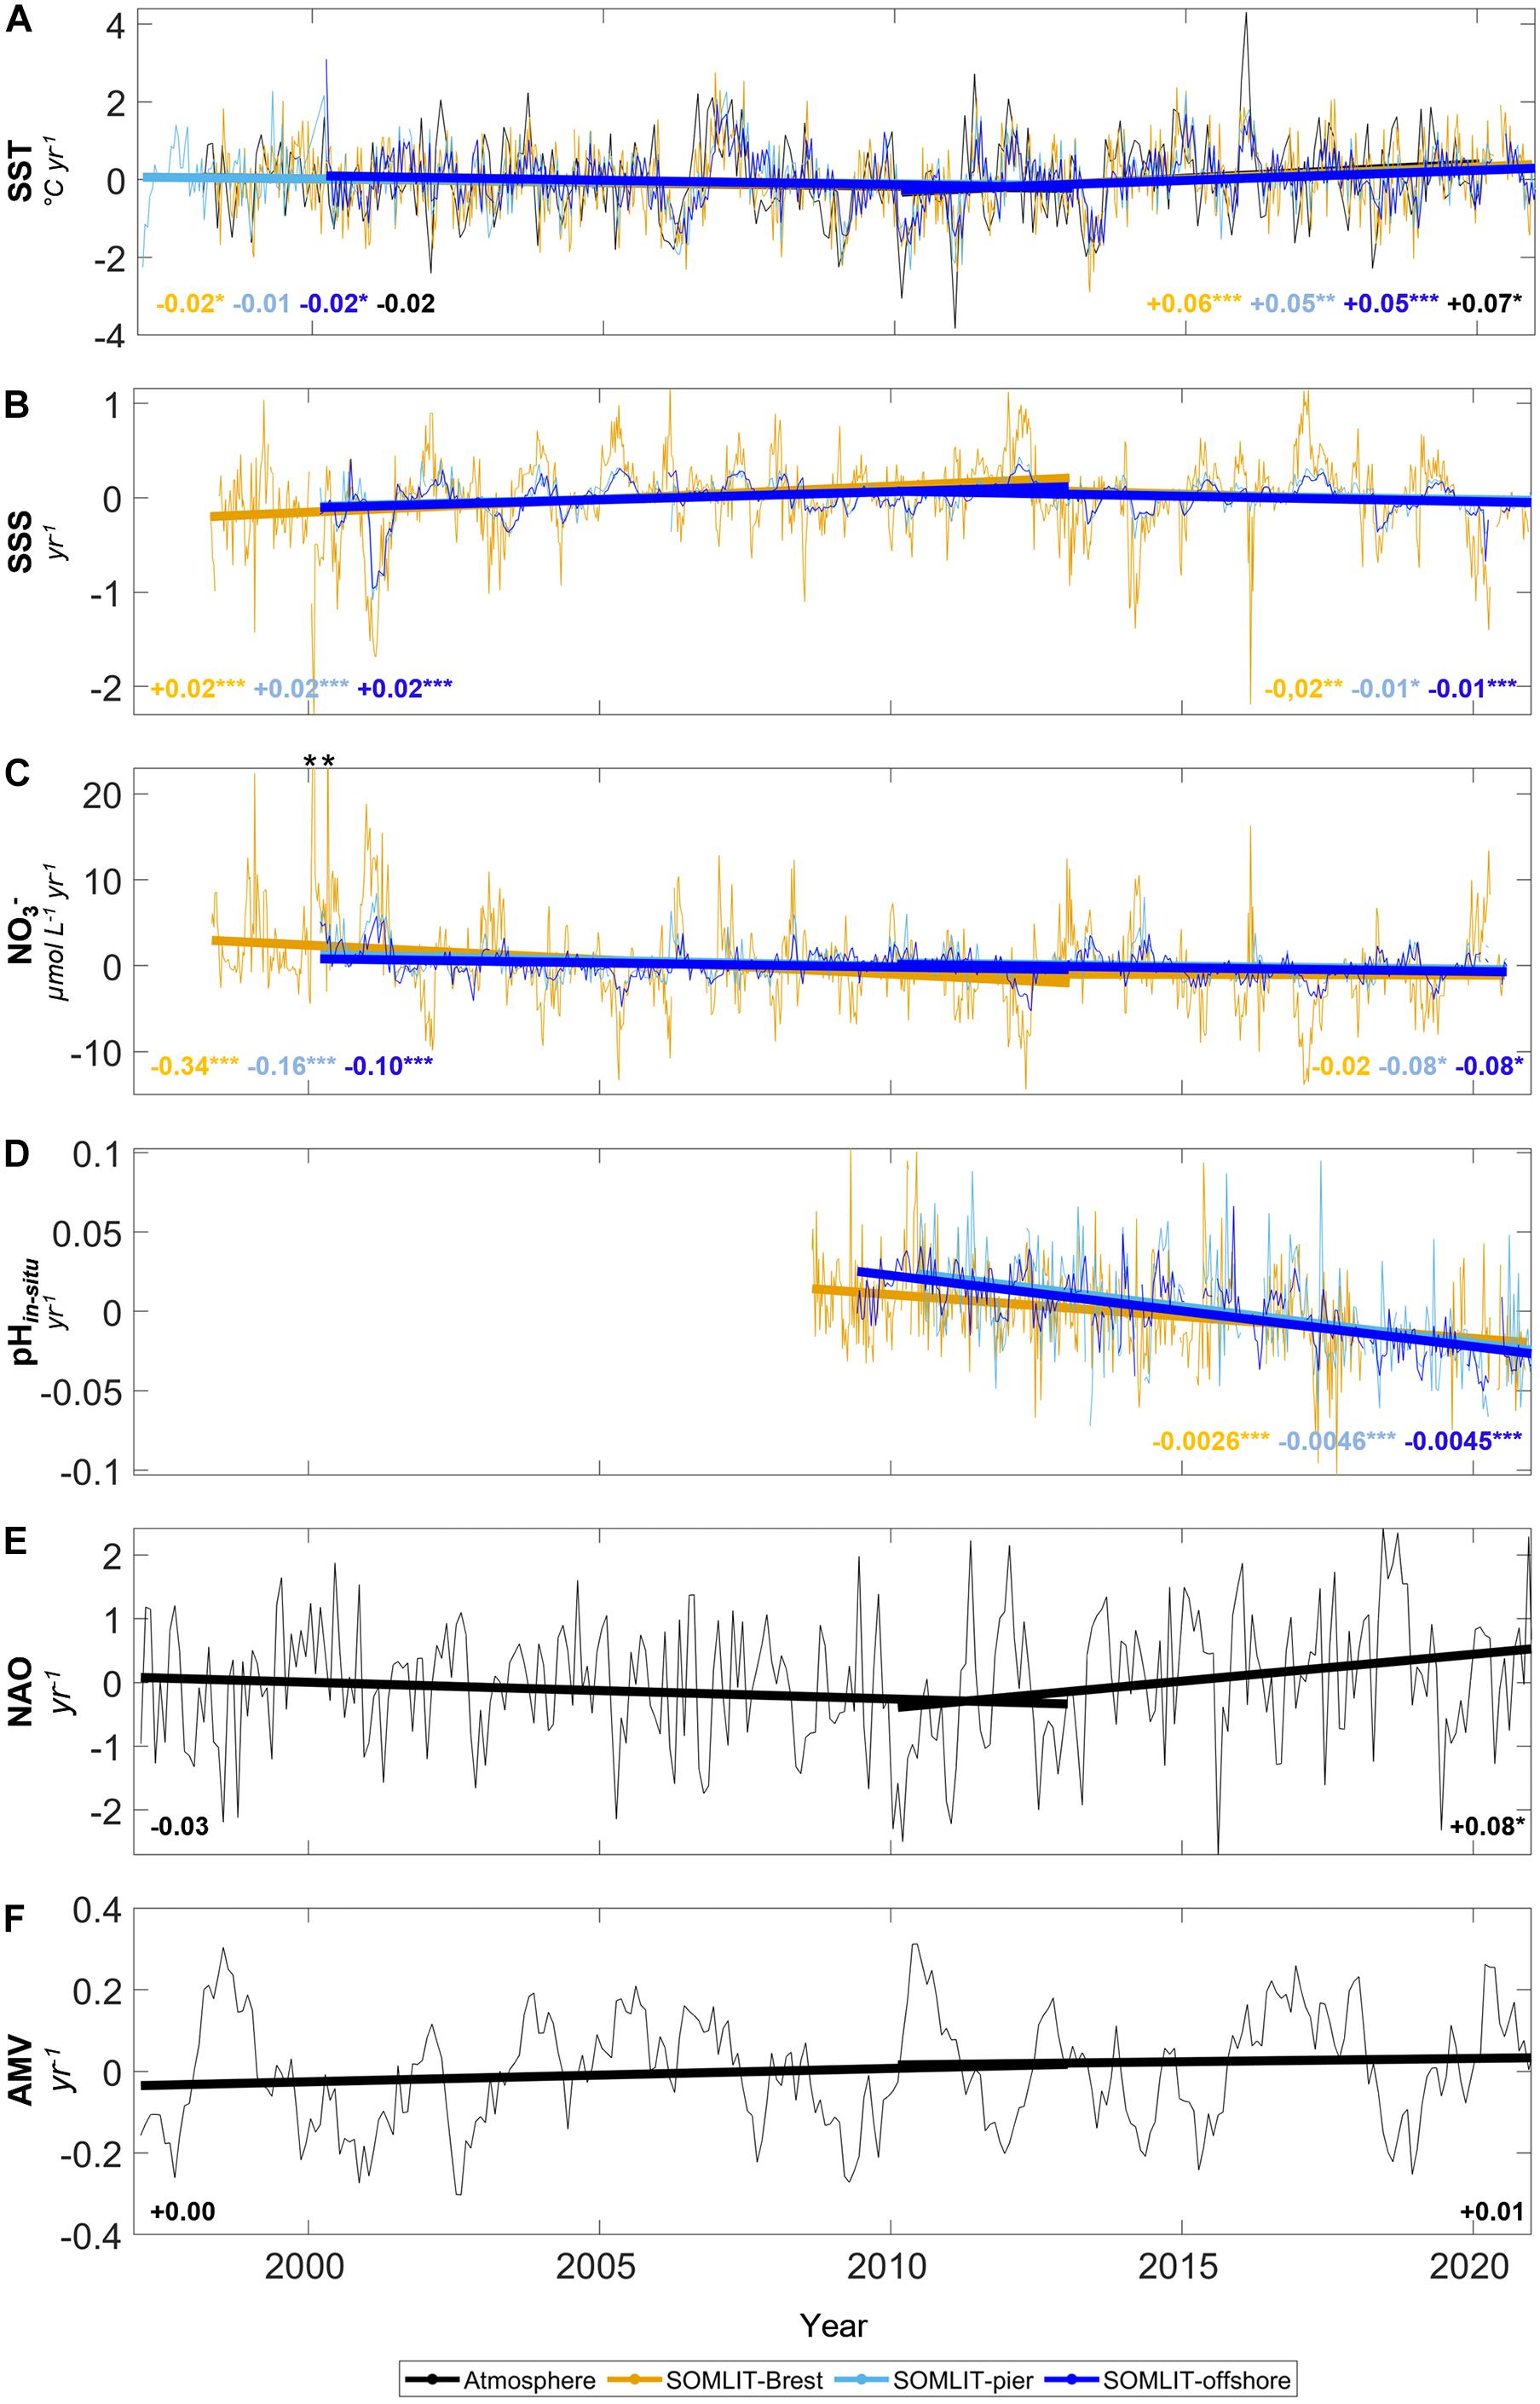
Figure 10. Trends of monthly anomalies of (A) SST (°C year–1), (B) SSS (year–1), (C) nitrate (μmol L–1 year–1), and (D) pHin situ (year–1) at (orange) SOMLIT-Brest, (light blue) SOMLIT-pier, and (dark blue) SOMLIT-offshore, and monthly values of (E) NAO and (F) AMV climatic indices. Trends were divided into two periods separated by the slope break detected around 2009–2011 with the STL (Cleveland et al., 1990) applied to the SST time series over the 1998–2020 period (see Section “Comparison of OA Trends and Climatic Context Over the 1997–2020 Period” for details). Asterisks represent p-values: ***p-value < 0.001, **p-value < 0.01, *p-value < 0.05, and no asterisk indicates non-significant trends.
In this study, the additional pH data collected (Section “Weekly and Bimonthly Measurements of the Long-term Time-Series”) at the three sites allowed us to extend the pH trends until December 2020 and to consider the trends previously established for the 2008–2017 period in a larger climatic context covering the period 1997–2020 (Figure 10). With additional pHin situ measurements, we extended the pHin situ trends at SOMLIT-Brest, SOMLIT-pier, and SOMLIT-offshore from 9.5, 8.5, and 7.5 years to 12.5, 11.5, and 10.5 years, respectively. Trends were established with missing data in the time series: The trend at SOMLIT-Brest was established without data in 2018, whereas at the two other sites, sampling was interrupted for the first time in 20 years due to the COVID-19 pandemic from March to June 2020. The OA trends extended until December 2020 remained relatively constant at −0.0026 ± 0.0004 year–1 at SOMLIT-Brest, whereas OA was −0.0046 ± 0.0006 and −0.0045 ± 0.0003 year–1 at SOMLIT-pier and SOMLIT-offshore, respectively. It is worth noticing that the seasonal amplitudes of pH were > 0.15 at the nearshore stations and > 0.10 at the SOMLIT-offshore station and that daily pH variability, linked to the diel biological cycle in the Bay of Brest (Bozec et al., 2011) and to the tidal cycle in Roscoff (Gac et al., 2020), was in the same order of magnitude as seasonal variability. These daily and seasonal amplitudes represented 6 to 10 times the regional OA trend over a decade, respectively. The superimposition of decadal, seasonal, and daily dynamics in coastal ecosystems represents a challenge to quantify pH trends in coastal ecosystems. Keller et al. (2014) estimated time of emergence (ToE), that is, the point in time when a signal finally emerges from the background noise of natural variability, around 12 years for pCO2 and pH and between 10 and 30 years for DIC depending on the study sites. Based on a more recent study by Turk et al. (2019), we estimated a ToE of 11 to 20 years from our dataset. Our study period corresponds to the minimal time period allowing long-term climate trends to emerge from coastal variability and maintaining such time series will be critical to confirm these observed trends.
Previous studies in coastal seas of NW Europe estimated OA either based on seasonal cruises or on voluntary observing ship surveys (Clargo et al., 2015; Ostle et al., 2016; Omar et al., 2019). OA in North Sea surface waters ranged from −0.0022 year–1 (period 2001–2011; Clargo et al., 2015) to −0.0035 year–1 (period 1984–2014; Ostle et al., 2016), with a recent estimate of −0.0024 year–1 in the northern North Sea (Omar et al., 2019). The 2008–2017 trends observed in this study were of the same order of magnitude as those reported in these surrounding coastal margins. These trends were also close to values previously reported at several coastal observatories, such as in the Irminger Sea (−0.0026 ± 0.0006 year–1), in the Cariaco Basin (−0.0025 ± 0.0004 year–1) (see review of Bates et al., 2014), or in the Mediterranean Sea at Point B (−0.0028 ± 0.0003 year–1) (Kapsenberg et al., 2017), although care must be taken when comparing such diverse ecosystems. The North Atlantic trends ranged from −0.0013 ± 0.0009 year–1 (period 1995–2013, Kitidis et al., 2017) to −0.0017 year–1 (period 1993–2017, Leseurre et al., 2020). In open ocean regions of the northern hemisphere, pH trends have been observed concomitantly with sea surface pCO2 increases close to the atmospheric CO2 forcing (Kitidis et al., 2017; Wang et al., 2017; Leseurre et al., 2020). Deviations from these atmospheric trends have been reported for specific periods or regions and may reflect local changes in oceanic buffering capacity as discussed in Section “Deconvolution of Carbonate System Trends During the 2008–2017 Period” and elsewhere (Lauvset and Gruber, 2014; Lauvset et al., 2015; Leseurre et al., 2020). These deviations can be even more significant in coastal margins, as reported in the Mediterranean Sea (Kapsenberg et al., 2017) or in the SAB, with decrease in pH reaching 0.004 year–1 based on multidecadal observations (Reimer et al., 2017b). Our results indicated similar deviations, but these remained relatively limited over the long term, especially for such dynamic coastal ecosystems. As mentioned above, adding 3 years of data increased the trends at SOMLIT-Pier and SOMLIT-offshore to values similar to those observed in the SAB (Reimer et al., 2017b). It is worth noting that independent high-frequency measurement of pCO2 combined with discrete TA sampling at the adjacent ASTAN cardinal buoy (Gac et al., 2020) confirmed a higher increase in pCO2 associated with decrease in pHin situ over the 2017–2020 period. This period was too short to establish any significant trends, but confirmed that for carbonate parameters, especially in coastal ecosystems, values can vary significantly. Decadal-scale observations, which facilitate the understanding of the changes occurring in these ecosystems, remain rather limited.
To further evaluate in which climatic context our observations took place, we relied on concomitant data collected since 1997/2000 at the three sites. Tréguer et al. (2014) reported a decrease of SST of −0.01°C year–1 at SOMLIT-Brest and SOMLIT-pier, and −0.02°C year–1 at SOMLIT-offshore, for the 1997–2013 period. Recently, Charria et al. (2020) extended the 15-year study of Tréguer et al. (2014) to a 20-year period concomitant with our observation of carbonate parameters. During the 1998–2018 period, Charria et al. (2020) reported an increase in SST (+0.008°C year–1 at SOMLIT-Brest and +0.003°C year–1 at SOMLIT-pier). Only a slope break in terms of slope directions could explain such contrasting values between these studies. We applied a seasonal-trend decomposition procedure based on Loess (STL, Cleveland et al., 1990) on the SST time series over the 1997–2020 period. A slope break in the SST time-series clearly appeared around 2009–2011. The STL applied to the SSS time series showed a slope break during the same period (Figure 10). We therefore established trends for these parameters for the 1997–2013 period as in Tréguer et al. (2014), and after the slope break for the 2010–2020 period. We obtained significant SST trends of −0.02°C year–1, p-value < 0.05 and +0.05°C year–1, p-value < 0.001, as well as significant SSS trends around +0.02 year–1, p-value < 0.001 and −0.01 year–1, p-value < 0.001 for the first and second periods at SOMLIT-Brest and SOMLIT-pier, respectively.
Previous studies have shown a significant connection between hydro-climatic indices such as AMV/NAO and SST/SSS variations in the coastal waters of NW Europe (Tréguer et al., 2014; Sutton et al., 2018). A slope break around 2009/2011 (Figure 10D) clearly appeared when the STL was applied to the wNAO. The wNAO (+0.08 ± 0.05 year–1, n = 721, r = 0.48, p < 0.05) increased during 2010–2020 and was related to warming in European surface waters (Sutton et al., 2018; Charria et al., 2020; Figure 10), which, on a longer time scale, was correlated with positive AMV (Sutton et al., 2018). At the SOMLIT stations, as previously reported by Tréguer et al. (2014), regressions between SST and wNAO showed significant correlations (r = 0.59, p-value < 0.01 at SOMLIT-Brest; r = 0.64, p-value < 0.001 at SOMLIT-pier; and r = 0.56, p-value < 0.01 at SOMLIT-offshore, Table 3). Several studies have previously linked the NAO and AMV to pCO2 variability during short study periods (Breeden and McKinley, 2016; Landschützer et al., 2019). Recently, a 100-year time series of proxy-reconstructed carbonate chemistry noted a significant modulation and relationship between OA and climate modes; both positive and negative forcing on the state of the carbonate system were observed (Osborne et al., 2020). Here, the impact of wNAO on SST was apparent on pCO2therm, with a Pearson correlation r value of 0.56, but was not correlated with pCO2non–therm at these coastal stations. Similar significant trends were observed year-round between the AMV index and SST (r ∼ 0.50) and pCO2therm (r ∼ 0.55) (Table 3). These observations indicate a certain link between the AMV index and pCO2therm. As mentioned in Section “Deconvolution of Carbonate System Trends During the 2008–2017 Period,” the increase in SST was responsible for 25%–30% of the pCO2 increase driving OA in our coastal ecosystems. Since no significant warming trend was recorded for the 1997–2013 period, which was associated with a different NAO regime, the pCO2 and pH trends might differ from those observed in this study. Datasets covering periods over 20–30 years are necessary to define trends of OA and to make the distinction between local and global drivers. Different, even opposite, trends have been observed on limited spatial and temporal scales, which highlights that necessity to operate and maintain as dense as possible a network of observation sites to assess the intensity and impact of OA on the coastal environment.
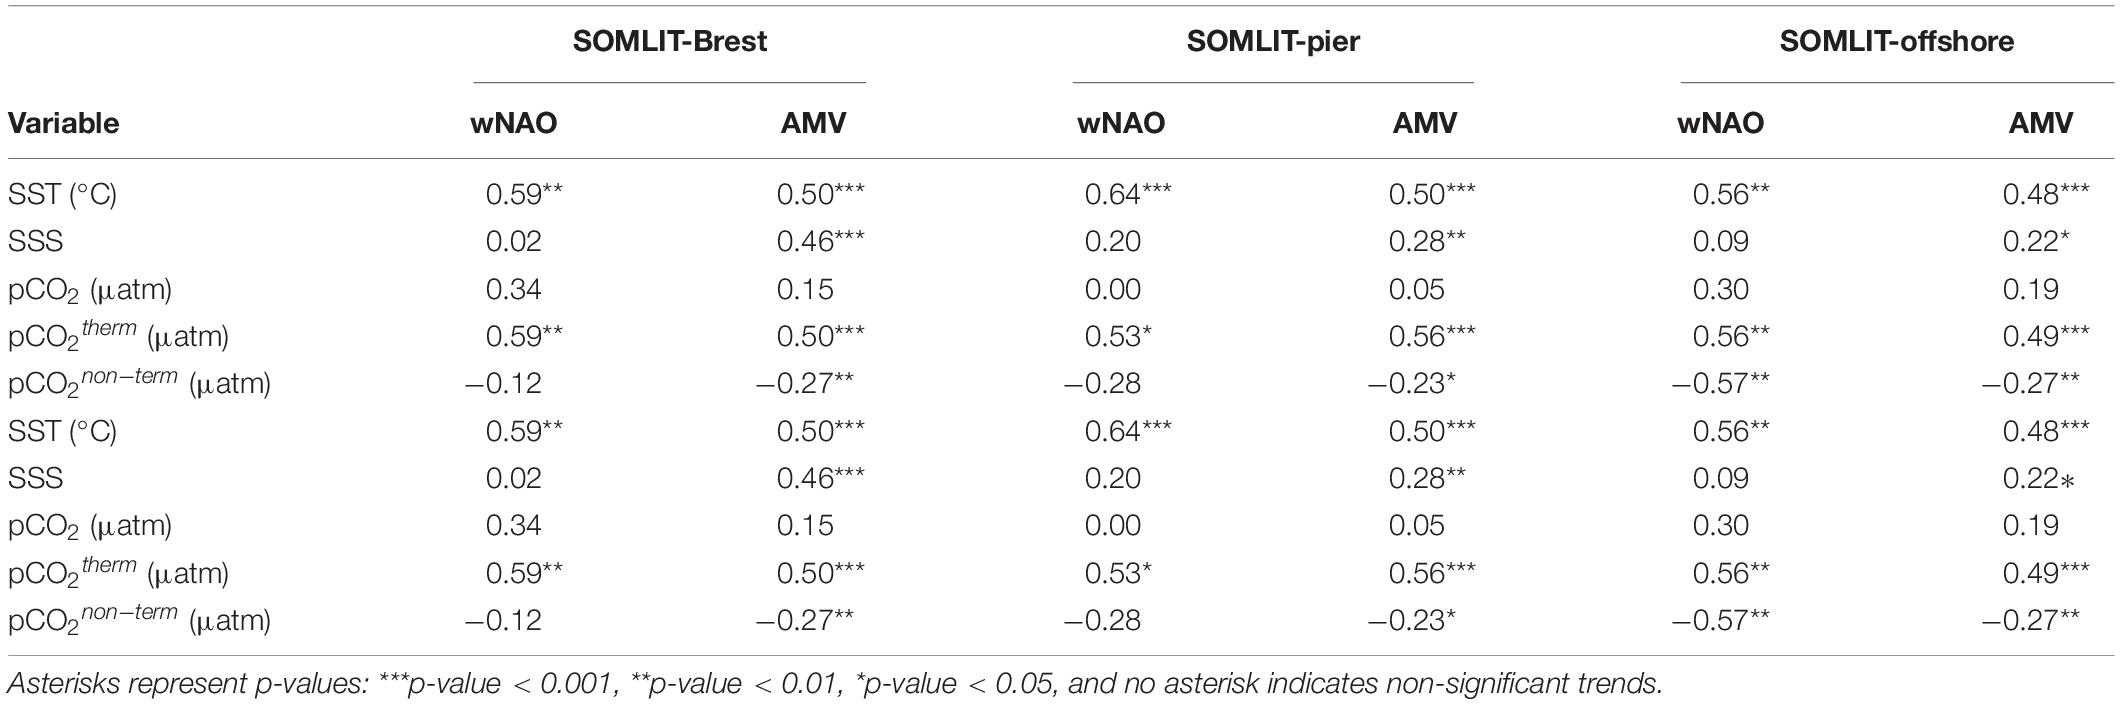
Table 3. Coefficient of determination (r) of the Pierson correlations between the monthly anomalies of the winter North Atlantic Oscillation (wNAO) and the Atlantic Multidecadal Variability (AMV), and monthly anomalies of SST (°C), SSS, pCO2, pCO2therm, and pCO2non–therm (all in μatm) from 2008 to 2017 at SOMLIT-Brest, SOMLIT-pier, and SOMLIT-offshore.
Based on data collected from 2008 to 2020 in three coastal ecosystems located in the North East Atlantic Ocean, this study provides for the first time a decadal overview of the interannual dynamics of the carbonate system chemistry in three nearshore ecosystems. We demonstrated that interannual variability can reverse the metabolic state and regional air–sea CO2 fluxes of a given ecosystem, which emphasized the importance of long-term monitoring. We showed that OA has potentially been ongoing at all three coastal sites for the past decade, primarily driven by atmospheric CO2 forcing, secondarily by warming, and additionally by changes in salinity. This is particularly relevant since nearshore ecosystems are not included in current global climate models and host large stocks of calcifying shellfish species sensitive to OA. Further observations over the 1998–2020 period revealed that the climatic indices NAO and AMV were linked to trends of SST, with cooling during 1998–2010 and warming during 2010–2020, which might have impacted OA trends at our coastal stations.
Our study period corresponded to the minimal time period allowing long-term climate trends to emerge from coastal variability, but demonstrated that different trends can be observed on limited spatial and temporal scales. Maintaining time series of at least two carbonate system parameters in coastal ecosystem is challenging but will provide key information on the potential drivers of OA and will be critical to confirm the observed trends over extended time periods.
Raw data supporting the conclusion of this article are available at https://www.somlit.fr/en/.
J-PG collected, analyzed, processed, and interpreted the data and wrote the first version of the manuscript. PM provided scientific discussion and new ideas on interpretation of the results and contributed to writing the manuscript. TC, EG, PR-M, ÉM, and MV collected all data in the field, analyzed discrete samples in the laboratory, processed the data, and implemented the databases. YB designed and led the study, managed the project, and wrote the manuscript. All authors contributed to the article and approved the submitted version.
This work was funded by the CNRS through INSU [SOMLIT, project CHANNEL (LEFE/CYBER)] and INEE, by the “Conseil Général du Finistère” (CD29), and by the “Region Bretagne” (program ARED, project Hi-Tech). Part of this work was supported by the JERICO-NEXT project from the European Union’s Horizon 2020 Research and Innovation Program under grant agreement no. 654410 and by the ANR CO2COAST 2021–2025. YB is PI of the CHANNEL and Hi-Tech projects and associate researcher (CRCN) at the CNRS. J-PG holds a Ph.D. grant from the Region Bretagne and Sorbonne University (ED129).
The authors declare that the research was conducted in the absence of any commercial or financial relationships that could be construed as a potential conflict of interest.
We thank the successive teams from the “Service Mer” of the SBR and IUEM for their long-term and valuable support during sampling at sea in all kinds of weather conditions. We also thank all of the technicians, engineers, master’s students, and researchers who helped to collect, analyze, and qualify the data over more than 20 years within the SOMLIT (Service d’Obervation du Milieu LIToral) network. We are grateful to the SNAPOCO2 for DIC/TA analysis and M. Ramonet for providing the atmospheric CO2 data from the RAMCES network (Observatory Network for Greenhouse gasses). We thank A. Durand and E. Collin for their help during field campaigns in the Penzé river. We are grateful to the Menden-Deuer Lab (URI-GSO), A. C. Baudoux, and I. Probert for constructive collaboration, scientific discussions, and correction during finalization of the manuscript. We also thank both reviewers for their constructive comments on a previous version of the manuscript.
Aminot, A., and Kérouel, R. (2007). Dosage Automatique des Nutriments Dans Les Eaux Marines: Méthodes en Flux Continu. Brest: Ifremer.
Astor, Y. M., Lorenzoni, L., Thunell, R., Varela, R., Muller-Karger, F., Troccoli, L., et al. (2013). Interannual variability in sea surface temperature and fCO2 changes in the Cariaco Basin. Deep Sea Res. Part II Top. Stud. Oceanogr. 93, 33–43. doi: 10.1016/j.dsr2.2013.01.002
Bakker, D. C., Pfeil, B., Landa, C. S., Metzl, N., O’brien, K. M., Olsen, A., et al. (2016). A multi-decade record of high-quality fCO2 data in version 3 of the Surface Ocean CO2 Atlas (SOCAT). Earth Syst. Sci. Data 8, 383–413. doi: 10.5194/essd-8-383-2016
Bates, N. R., Astor, Y. M., Church, M. J., Currie, K., Dore, J. E., González-Dávila, M., et al. (2014). A time-series view of changing surface ocean chemistry due to ocean uptake of anthropogenic CO2 and ocean acidification. Oceanography 27, 126–141. doi: 10.5670/oceanog.2014.16
Bauer, J. E., Cai, W. J., Raymond, P. A., Bianchi, T. S., Hopkinson, C. S., and Regnier, P. A. (2013). The changing carbon cycle of the coastal ocean. Nature 504, 61–70. doi: 10.1038/nature12857
Beucher, C., Treguer, P., Corvaisier, R., Hapette, A. M., and Elskens, M. (2004). Production and dissolution of biosilica, and changing microphytoplankton dominance in the Bay of Brest (France). Mar. Ecol. Prog. Ser. 267, 57–69. doi: 10.3354/meps267057
Bordeyne, F., Migné, A., and Davoult, D. (2017). Variation of fucoid community metabolism during the tidal cycle: insights from in situ measurements of seasonal carbon fluxes during emersion and immersion. Limnol. Oceanogr. 62, 2418–2430. doi: 10.1002/lno.10574
Borges, A. V., Alin, S. R., Chavez, F. P., Vlahos, P., Johnson, K. S., Holt, J. T., et al. (2010). “A global sea surface carbon observing system: inorganic and organic carbon dynamics in coastal oceans,” in Proceedings of the OceanObs’09: Sustained Ocean Observations and Information for Society, Vol. 2, (Paris: European Space Agency), 67–88. doi: 10.5270/OceanObs09.cwp.07
Borges, A. V., and Frankignoulle, M. (2003). Distribution of surface carbon dioxide and air sea exchange in the english channel and adjacent areas. J. Geophys. Res. Oceans 108:3140. doi: 10.1029/2000JC000571
Borges, A. V., and Gypsens, N. (2010). Carbonate chemistry in the coastal zone responds more strongly to eutrophication than ocean acidification. Limnol. Oceanogr. 55, 346–353. doi: 10.4319/lo.2010.55.1.0346
Borges, A. V., Ruddick, K., Schiettecatte, L.-S., and Delille, B. (2008). Net ecosystem production and carbon dioxide fluxes in the Scheldt estuarine plume. BMC Ecol. 8:15. doi: 10.1186/1472-6785-8-15
Bourgeois, T., Orr, J. C., Resplandy, L., Terhaar, J., Ethé, C., Gehlen, M., et al. (2016). Coastal-ocean uptake of anthropogenic carbon. Biogeosciences 13, 4167–4185. doi: 10.5194/bg-13-4167-2016
Bozec, Y., Merlivat, L., Baudoux, A. C., Beaumont, L., Blain, S., Bucciarelli, E., et al. (2011). Diurnal to inter-annual dynamics of pCO2 recorded by a CARIOCA sensor in a temperate coastal ecosystem (2003–2009). Mar. Chem. 126, 13–26. doi: 10.1016/j.marchem.2011.03.003
Breeden, M. L., and McKinley, G. A. (2016). Climate impacts on multidecadal pCO2 variability in the North Atlantic: 1948–2009. Biogeosciences 13:3387. doi: 10.5194/bg-13-3387-2016
Cai, W. J., Wiebe, W. J., Wang, Y., and Sheldon, J. E. (2000). Intertidal marsh as a source of dissolved inorganic carbon and a sink of nitrate in the Satilla River-estuarine complex in the southeastern US. Limnol. Oceanogr. 45, 1743–1752. doi: 10.4319/lo.2000.45.8.1743
Caloiero, T., Veltri, S., Caloiero, P., and Frustaci, F. (2018). Drought analysis in Europe and in the Mediterranean basin using the standardized precipitation index. Water 10:1043. doi: 10.3390/w10081043
Carpenter, J. H. (1965). The accuracy of the winkler method for dissolved oxygen analyisis. Limnol. Oceanogr. 10, 135–140.
Carstensen, J., and Duarte, C. M. (2019). Drivers of pH variability in coastal ecosystems. Environ. Sci. Technol. 53, 4020–4029. doi: 10.1021/acs.est.8b03655
Chan, F., Barth, J. A., Blanchette, C. A., Byrne, R. H., Chavez, F., Cheriton, O., et al. (2017). Persistent spatial structuring of coastal ocean acidification in the California Current System. Sci. Rep. 7:2526. doi: 10.1038/s41598-017-02777-y
Charria, G., Rimmelin-Maury, P., Goberville, E., L’Helguen, S., Barrier, N., David-Beausire, C., et al. (2020). “Temperature and salinity changes in coastal waters of western europe: variability, trends and extreme events,” in Evolution of Marine Coastal Ecosystems under the Pressure of Global Changes, eds H. J. Ceccaldi, Y. Hénocque, T. Komatsu, P. Prouzet, B. Sautour, and J. Yoshida (Cham: Springer), 207–226. doi: 10.1007/978-3-030-43484-7_15
Chen, S., and Hu, C. (2019). Environmental controls of surface water pCO2 in different coastal environments: observations from marine buoys. Continental Shelf Res. 183, 73–86. doi: 10.1016/j.csr.2019.06.007
Chierici, M., Fransson, A., and Anderson, L. G. (1999). Influence of m-cresol purple indicator additions on the pH of seawater samples: correction factors evaluated from a chemical speciation model. Mar. Chem. 65, 281–290. doi: 10.1016/S0304-4203(99)00020-1
Clargo, N. M., Salt, L. A., Thomas, H., and de Baar, H. J. (2015). Rapid increase of observed DIC and pCO2 in the surface waters of the North Sea in the 2001-2011 decade ascribed to climate change superimposed by biological processes. Mari. Chem. 177, 566–581.1.
Claustre, H., Johnson, K. S., and Takeshita, Y. (2020). Observing the global ocean with biogeochemical-Argo. Ann. Rev. Mari. Sci. 12, 23–48. doi: 10.1146/annurev-marine-010419-010956
Clayton, T. D., and Byrne, R. H. (1993). Spectrophotometric seawater pH measurements: total hydrogen ion concentration scale calibration of m-cresol purple and at-sea results. Deep Sea Res. Part I Oceanogr. Res. Pap. 40, 2115–2129. doi: 10.1016/0967-0637(93)90048-8
Cleveland, R. B., Cleveland, W. S., McRae, J. E., and Terpenning, I. (1990). STL: a seasonal-trend decomposition. J. Offi. Statist. 6, 3–73.
Currie, K. I., Reid, M. R., and Hunter, K. A. (2011). Interannual variability of carbon dioxide drawdown by subantarctic surface water near New Zealand. Biogeochemistry 104, 23–34. doi: 10.1007/s10533-009-9355-3
Da, F., Friedrichs, M. A. M., and St-Laurent, P. (2018). Impacts of atmospheric nitrogen deposition and coastal nitrogen fluxes on oxygen concentrations in Chesapeake Bay. J. Geophys. Res. Oceans 123, 5004–5025. doi: 10.1029/2018JC014009
de Haas, H., van Weering, T. C., and de Stigter, H. (2002). Organic carbon in shelf seas: sinks or sources, processes and products. Continental Shelf Res. 22, 691–717. doi: 10.1016/S0278-4343(01)00093-0
Del Amo, Y., Quéguiner, B., Tréguer, P., Breton, H., and Lampert, L. (1997). Impacts of high-nitrate freshwater inputs on macrotidal ecosystems. II. specific role of the silicic acid pump in the year-round dominance of diatoms in the bay of brest (France). Mar. Ecol. Prog. Ser. 161, 225–237. doi: 10.3354/meps161225
Dickson, A. G. (1990). Standard potential of the reaction: AgCl (s)+ 12H2 (g)= Ag (s)+ HCl (aq), and the standard acidity constant of the ion HSO4- in synthetic sea water from 273.15 to 318.15 K. J. Chem. Thermody. 22, 113–127.
DOE (1994). Handbook of Methods for Analysis of the Various Parameters of the Carbon Dioxide System in Sea Water, Version 2. Available online at: https://core.ac.uk/download/pdf/98639593.pdf (accessed July 17, 2020).
Doney, S. C. (2010). The growing human footprint on coastal and open-ocean biogeochemistry. Science 328, 1512–1516. doi: 10.1126/science.1185198
Doney, S. C., Busch, D. S., Cooley, S. R., and Kroeker, K. J. (2020). The impacts of ocean acidification on marine ecosystems and reliant human communities. Ann. Rev. Environ. Res. 45, 83–112. doi: 10.1146/annurev-environ-012320-083019
Duarte, C. M., Hendriks, I. E., Moore, T. S., Olsen, Y. S., Steckbauer, A., Ramajo, L., et al. (2013). Is ocean acidification an open-ocean syndrome? Understanding anthropogenic impacts on seawater pH. Estuar. Coasts 36, 221–236. doi: 10.1007/s12237-013-9594-3
Dumousseaud, C., Achterberg, E. P., Tyrrell, T., Charalampopoulou, A., Schuster, U., Hartman, M., et al. (2010). Contrasting effects of temperature and winter mixing on the seasonal and inter-annual variability of the carbonate system in the Northeast Atlantic Ocean. Biogeosciences (BG) 7, 1481–1492. doi: 10.5194/bg-7-1481-2010
Dürr, H. H., Meybeck, M., Hartmann, J., Laruelle, G. G., and Roubeix, V. (2011). Global spatial distribution of natural riverine silica inputs to the coastal zone. Biogeosciences 8, 597–620. doi: 10.5194/bg-8-597-2011
Edmond, J. M. (1970). High precision determination of titration alkalinity and total carbon dioxide content of sea water by potentiometric titration. Deep Sea Res. Oceanogr. Abstr. 17, 737–750. doi: 10.1016/0011-7471(70)90038-0
Elser, J. J., Bracken, M. E., Cleland, E. E., Gruner, D. S., Harpole, W. S., Hillebrand, H., et al. (2007). Global analysis of nitrogen and phosphorus limitation of primary producers in freshwater, marine and terrestrial ecosystems. Ecol. Lett. 10, 1135–1142. doi: 10.1111/j.1461-0248.2007.01113.x
Enfield, D. B., Mestas-Nuñez, A. M., and Trimble, P. J. (2001). The Atlantic multidecadal oscillation and its relation to rainfall and river flows in the continental US. Geophy. Res. Lett. 28, 2077–2080. doi: 10.1029/2000GL012745
Feely, R. A., Alin, S. R., Newton, J., Sabine, C. L., Warner, M., Devol, A., et al. (2010). The combined effects of ocean acidification, mixing, and respiration on pH and carbonate saturation in an urbanized estuary. Estuar. Coast. Shelf Sci. 88, 442–449. doi: 10.1016/j.ecss.2010.05.004
Feely, R. A., Alin, S., Carter, B., Bednaršek, N., Hales, B., Chan, F., et al. (2016). Chemical and biological impacts of ocean acidification along the west coast of North America. Estuar. Coast. Shelf Sci. 183, 260–270. doi: 10.1016/j.ecss.2016.08.043
Fennel, K., Alin, S., Barbero, L., Evans, W., Bourgeois, T., Cooley, S., et al. (2019). Carbon cycling in the North American coastal ocean: a synthesis. Biogeosciences 16, 1281–1304. doi: 10.5194/bg-16-1281-2019
Flynn, K. J., Clark, D. R., Mitra, A., Fabian, H., Hansen, P. J., Glibert, P. M., et al. (2015). Ocean acidification with (de) eutrophication will alter future phytoplankton growth and succession. Proc. R. Soc. B Biol. Sci. 282:20142604. doi: 10.1098/rspb.2014.2604
Forja, J. M., Ortega, T., DelValls, T. A., and Gómez-Parra, A. (2004). Benthic fluxes of inorganic carbon in shallow coastal ecosystems of the Iberian Peninsula. Mar. Chem. 85, 141–156. doi: 10.1016/j.marchem.2003.09.007
Friis, K., Körtzinger, A., and Wallace, D. W. (2003). The salinity normalization of marine inorganic carbon chemistry data. Geophys. Res. Lett. 30:57. doi: 10.1029/2002GL015898
Fu, F. X., Tatters, A. O., and Hutchins, D. A. (2012). Global change and the future of harmful algal blooms in the ocean. Mari. Ecol. Progr. Series 470, 207–233. doi: 10.3354/meps10047
Gac, J. P., Marrec, P., Cariou, T., Guillerm, C., Macé, É, Vernet, M., et al. (2020). Cardinal buoys: an opportunity for the study of air-sea CO2 fluxes in coastal ecosystems. Front. Mari. Sci. 9:20153. doi: 10.3389/fmars.2020.00712
Garcia, H. E., and Gordon, L. I. (1992). Oxygen solubility in seawater: better fitting equations. Limnol. Oceanogr. 37, 1307–1312.
García-Ibáñez, M. I., Zunino, P., Fröb, F., Carracedo, L. I., Ríos, A. F., Mercier, H., et al. (2016). Ocean acidification in the subpolar North Atlantic: rates and mechanisms controlling pH changes. Biogeosciences 13, 3701–3715. doi: 10.5194/bg-13-3701-2016
Gattuso, J. P., Magnan, A., Billé, R., Cheung, W. W., Howes, E. L., Joos, F., et al. (2015). OCEANOGRAPHY Contrasting futures for ocean and society from different anthropogenic CO2 emissions scenarios. Science 349:aac4722. doi: 10.1126/science.aac4722
Golléty, C., Migne, A., and Davoult, D. (2008). Benthic metabolism on a sheltered rocky shore: role of the canopy in the carbon budget. J. Phycol. 44, 1146–1153. doi: 10.1111/j.1529-8817.2008.00569.x
González-Dávila, M., Santana-Casiano, J. M., Rueda, M. J., and Llinás, O. (2010). The water column distribution of carbonate system variables at the ESTOC site from 1995 to 2004. Biogeosciences 7, 3067–3081. doi: 10.5194/bg-7-3067-2010
Gran, G. (1952). Determination of the equivalence point in potentiometric titrations. Part II. Anal. 77, 661–671.
Gregor, L., and Gruber, N. (2021). OceanSODA-ETHZ: a global gridded data set of the surface ocean carbonate system for seasonal to decadal studies of ocean acidification. Earth Syst. Sci. Data 13, 777–808. doi: 10.5194/essd-13-777-2021
Gruber, N., Clement, D., Carter, B. R., Feely, R. A., Van Heuven, S., Hoppema, M., et al. (2019). The oceanic sink for anthropogenic CO2 from 1994 to 2007. Science 363, 1193–1199. doi: 10.1126/science.aau5153
Gypens, N., Borges, A. V., and Lancelot, C. (2009). Effect of eutrophication on air–sea CO2 fluxes in the coastal Southern North sea: a model study of the past 50 years. Global Chan. Biol. 15, 1040–1056. doi: 10.1111/j.1365-2486.2008.01773.x
Gypens, N., Lacroix, G., Lancelot, C., and Borges, A. V. (2011). Seasonal and inter-annual variability of air–sea CO2 fluxes and seawater carbonate chemistry in the Southern North sea. Progr. Oceanogr. 88, 59–77. doi: 10.1016/j.pocean.2010.11.004
Hamilton, S. K., Kurzman, A. L., Arango, C., Jin, L., and Robertson, G. P. (2007). Evidence for carbon sequestration by agricultural liming. Global Biogeochem. Cycl. 21. doi: 10.1029/2006GB002738
Hammond, D. E., Giordani, P., Berelson, W. M., and Poletti, R. (1999). Diagenesis of carbon and nutrients and benthic exchange in sediments of the Northern Adriatic sea. Mar. Chem. 66, 53–79. doi: 10.1016/S0304-4203(99)00024-9
Haraldsson, C., Anderson, L. G., Hassellöv, M., Hulth, S., and Olsson, K. (1997). Rapid, high-precision potentiometric titration of alkalinity in ocean and sediment pore waters. Deep Sea Res. Part I Oceanogr. Res. Pap. 44, 2031–2044. doi: 10.1016/S0967-0637(97)00088-5
Hartmann, J., Jansen, N., Dürr, H. H., Kempe, S., and Köhler, P. (2009). Global CO2-consumption by chemical weathering: what is the contribution of highly active weathering regions? Glob. Planet. Change 69, 185–194. doi: 10.1016/j.gloplacha.2009.07.007
Hartmann, J., Moosdorf, N., Lauerwald, R., Hinderer, M., and West, A. J. (2014). Global chemical weathering and associated P-releasethe role of lithology, temperature and soil properties. Chem. Geol. 363, 145–163. doi: 10.1016/j.chemgeo.2013.10.025
Herrmann, M., Najjar, R. G., Kemp, W. M., Alexander, R. B., Boyer, E. W., Cai, W. J., et al. (2015). Net ecosystem production and organic carbon balance of US East Coast estuaries: a synthesis approach. Global Biogeochem. Cycl. 29, 96–111. doi: 10.1002/2013GB004736
Humphreys, M. P., Daniels, C. J., Wolf-Gladrow, D. A., Tyrrell, T., and Achterberg, E. P. (2018). On the influence of marine biogeochemical processes over CO2 exchange between the atmosphere and ocean. Mari. Chem. 199, 1–11. doi: 10.1016/j.marchem.2017.12.006
Hurrell, J. W. (1995). Decadal trends in the North Atlantic Oscillation: regional temperatures and precipitation. Science 269, 676–679.
Hydes, D. J., and Hartman, S. E. (2012). Seasonal and inter-annual variability in alkalinity in Liverpool Bay (53.5 N, 3.5 W) and in major river inputs to the North sea. Ocean Dynam. 62, 321–333. doi: 10.1007/s10236-011-0503-7
IPCC. (2013). “Carbon and other biogeochemical cycles,” in Climate Change 2013 – The Physical Science Basis: Working Group I Contribution to the Fifth Assessment Report of the Intergovernmental Panel on Climate Change, (Cambridge: Cambridge University Press), 465–570.
Kapsenberg, L., Alliouane, S., Gazeau, F., Mousseau, L., and Gattuso, J.-P. (2017). Coastal ocean acidification and increasing total alkalinity in the northwestern Mediterranean sea. Ocean Sci. 13, 411–426. doi: 10.5194/os-13-411-2017
Keller, K. M., Joos, F., and Raible, C. C. (2014). Time of emergence of trends in ocean biogeochemistry. Biogeosciences 11, 3647–3659. doi: 10.5194/bg-11-3647-2014
Kerr, R. A. (2000). A North atlantic climate pacemaker for the centuries. Science 288, 1984–1985. doi: 10.1126/science.288.5473.1984
Kitidis, V., Brown, I., Hardman-Mountford, N., and Lefèvre, N. (2017). Surface ocean carbon dioxide during the Atlantic Meridional Transect (1995–2013); evidence of ocean acidification. Prog. Oceanogr. 158, 65–75. doi: 10.1016/j.pocean.2016.08.005
Kitidis, V., Hardman-Mountford, N. J., Litt, E., Brown, I., Cummings, D., Hartman, S., et al. (2012). Seasonal dynamics of the carbonate system in the Western English Channel. Cont. Shelf Res. 42, 30–40. doi: 10.1016/j.csr.2012.04.012
Landschützer, P., Ilyina, T., and Lovenduski, N. S. (2019). Detecting regional modes of variability in observation−based surface ocean pCO2. Geophys. Res. Lett. 46, 2670–2679. doi: 10.1029/2018GL081756
Lauvset, S. K., and Gruber, N. (2014). Long-term trends in surface ocean pH in the North Atlantic. Mari. Chem. 162, 71–76. doi: 10.1016/j.marchem.2014.03.009
Lauvset, S. K., Gruber, N., Landschützer, P., Olsen, A., and Tjiputra, J. F. (2015). Trends and drivers in global surface ocean pH over the past 3 decades. Biogeosciences 12, 1285–1298. doi: 10.5194/bg-12-1285-2015
Lauvset, S. K., Key, R. M., Olsen, A., Heuven, S. V., Velo, A., Lin, X., et al. (2016). A new global interior ocean mapped climatology: The 1× 1 GLODAP version 2. Earth Syst. Sci. Data 8, 325–340. doi: 10.5194/essd-8-325-2016
Lejart, M., and Hily, C. (2011). Differential response of benthic macrofauna to the formation of novel oyster reefs (Crassostrea gigas, Thunberg) on soft and rocky substrate in the intertidal of the Bay of Brest, France. J. Sea Res. 65, 84–93. doi: 10.1016/j.seares.2010.07.004
Leseurre, C., Monaco, C. L., Reverdin, G., Metzl, N., Fin, J., Olafsdottir, S., et al. (2020). Ocean carbonate system variability in the North Atlantic Subpolar surface water (1993-2017). Biogeosciences 17, 2553–2577. doi: 10.5194/bg-17-2553-2020
Lewis, E. R., and Wallace, D. W. R. (1998). Program developed for CO2 system calculations (No. cdiac: CDIAC-105). Environ. Syst. Sci. Data Infrastr. Virt. Ecosyst. doi: 10.15485/1464255
Litt, E. J., Hardman-Mountford, N. J., Blackford, J. C., Mitchelson-Jacob, G., Goodman, A., Moore, G. F., et al. (2010). Biological control of pCO2 at station L4 in the Western english channel over 3 years. J. Plankton Res. 32, 621–629. doi: 10.1093/plankt/fbp133
Longphuirt, S. N., Clavier, J., Grall, J., Chauvaud, L., Le Loc’h, F., Le Berre, I., et al. (2007). Primary production and spatial distribution of subtidal microphytobenthos in a temperate coastal system, the Bay of Brest, France. Estuar. Coastal Shelf Sci. 74, 367–380. doi: 10.1016/j.ecss.2007.04.025
Ludwig, W., Amiotte Suchet, P., Munhoven, G., and Probst, J.-L. (1998). Atmospheric CO2 consumption by continental erosion: presentday controls and implications for the last glacial maximum, Glob. Planet. Change 16/17, 107–120.
Marrec, P. (2014). Dynamics of the Carbonate System and Air-Sea CO2 Fluxes in Western European Shelf Waters: A Multi-Scale Approach. Paris: Sorbonnes Université.
Marrec, P., Cariou, T., Collin, E., Durand, A., Latimier, M., Macé, E., et al. (2013). Seasonal and latitudinal variability of the CO2 system in the Western english channel based on voluntary observing ship (VOS) measurements. Mar. Chem. 155, 29–41. doi: 10.1016/j.marchem.2013.05.014
Marrec, P., Cariou, T., Latimier, M., Macé, E., Morin, P., Vernet, M., et al. (2014). Spatio-temporal dynamics of biogeochemical processes and air–sea CO2 fluxes in the Western english channel based on two years of ferry box deployment. J. Mar. Syst. 140, 26–38. doi: 10.1016/j.jmarsys.2014.05.010
Martin, S., Thouzeau, G., Chauvaud, L., Jean, F., Guérin, L., and Clavier, J. (2006). Respiration, calcification, and excretion of the invasive slipper limpet, Crepidula fornicata L.: implications for carbon, carbonate, and nitrogen fluxes in affected areas. Limnol. Oceanogr. 51, 1996–2007. doi: 10.4319/lo.2006.51.5.1996
Martin, S., Thouzeau, G., Richard, M., Chauvaud, L., Jean, F., and Clavier, J. (2007). Benthic community respiration in areas impacted by the invasive mollusk Crepidula fornicata. Mari. Ecol. Progr. Series 347, 51–60. doi: 10.3354/meps07000
McDougall, T. J., Jackett, D. R., Millero, F. J., Pawlowicz, R., and Barker, P. M. (2012). A global algorithm for estimating Absolute Salinity. Ocean Sci. 8, 1123–1134. doi: 10.5194/os-8-1123-2012
McGrath, T., McGovern, E., Cave, R. R., and Kivimäe, C. (2016). The inorganic carbon chemistry in coastal and shelf waters around Ireland. Estuar. Coasts 39, 27–39. doi: 10.1007/s12237-015-9950-6
McGrath, T., McGovern, E., Gregory, C., and Cave, R. R. (2019). Local drivers of the seasonal carbonate cycle across four contrasting coastal systems. Reg. Stud. Mar. Sci. 30:100733. doi: 10.1016/j.rsma.2019.100733
McLaughlin, K., Weisberg, S. B., Dickson, A. G., Hofmann, G. E., Newton, J. A., Aseltine-Neilson, D., et al. (2015). Core principles of the California current acidification network: linking chemistry, physics, and ecological effects. Oceanography 28, 160–169.
Meybeck, M., Dürr, H. H., and Vörösmarty, C. J. (2006). Global coastal segmentation and its river catchment contributors: a new look at land-ocean linkage. Glob. Biogeochem. Cycles 20:W07517. doi: 10.1029/2005GB002540
Middelburg, J. J., Soetaert, K., and Hagens, M. (2020). Ocean alkalinity, buffering and biogeochemical processes. Rev. Geophys. 58:e2019RG000681. doi: 10.1029/2019RG000681
Migné, A., Davoult, D., Bourrand, J. J., and Boucher, G. (2005). Benthic primary production, respiration and remineralisation: in situ measurements in the soft-bottom Abra alba community of the western English Channel (North Brittany). J. Sea Res. 53, 223–229. doi: 10.1016/j.seares.2004.12.002
Millero, F. J. (1995). Thermodynamics of the carbon dioxide in the oceans. Geochimica et Cosmochimica Acta 59, 661–677. doi: 10.1016/0016-7037(94)00354-O
Millero, F. J. (2007). The marine inorganic carbon cycle. Chem. Rev. 107, 308–341. doi: 10.1021/cr0503557
Muller-Karger, F. E., Astor, Y. M., Benitez-Nelson, C. R., Buck, K. N., Fanning, K. A., Lorenzoni, L., et al. (2019). The scientific legacy of the CARIACO ocean time-series program. Ann. Rev. Mari. Sci. 11, 413–437. doi: 10.1146/annurev-marine-010318-095150
Najiar, R. G., Herrmann, M., Alexander, R., Boyer, E. W., Burdige, D. J., Butman, D., et al. (2018). Carbon budget of tidal wetlands, estuaries, and shelf waters of eastern North America. Global Biogeochem. Cycl. 32, 389–416. doi: 10.1002/2017GB005790
Niu, J. (2013). Precipitation in the pearl river basin, South China: scaling, regional patterns, and influence of large-scale climate anomalies. Stochastic Environ. Res. Risk Assess. 27, 1253–1268. doi: 10.1007/s00477-012-0661-2
Oh, N. H., and Raymond, P. A. (2006). Contribution of agricultural liming to riverine bicarbonate export and CO2 sequestration in the Ohio River basin. Global Biogeochem. Cycl. 20:3. doi: 10.1029/2005GB002565
Olafsson, J., Olafsdottir, S. R., Benoit-Cattin, A., and Takahashi, T. (2010). The irminger sea and the iceland sea time series measurements of sea water carbon and nutrient chemistry 1983-2008. Earth Syst. Sci. Data 2:99. doi: 10.5194/essd-2-99-2010
Olafsson, J., Olafsdottir, S. R., Benoit-Cattin, A., Danielsen, M., Arnarson, T. S., and Takahashi, T. (2009). Rate of iceland sea acidification from time series measurements. Biogeosciences 6, 2661–2668. doi: 10.5194/bg-6-2661-2009
Oliveira, A. P., Pilar-Fonseca, T., Cabeçadas, G., and Mateus, M. (2018). Local variability of CO2 partial pressure in a mid-latitude mesotidal estuarine system (Tagus Estuary, Portugal). Geosciences 8:460. doi: 10.3390/geosciences8120460
Omar, A. M., Thomas, H., Olsen, A., Becker, M., Skjelvan, I., and Reverdin, G. (2019). Trends of ocean acidification and pCO2 in the northern North Sea, 2003–2015. J. Geophys. Res. Biogeosci. 124, 3088–3103. doi: 10.1029/2018JG004992
Osborne, E. B., Thunell, R. C., Gruber, N., Feely, R. A., and Benitez-Nelson, C. R. (2020). Decadal variability in twentieth-century ocean acidification in the California current ecosystem. Nat. Geosci. 13, 43–49. doi: 10.1038/s41561-019-0499-z
Ostle, C., Willliamson, P., Artioli, Y., Bakker, D. C., Birchenough, S. N. R., Davis, C. E., et al. (2016). Carbon Dioxide and Ocean Acidification Observations in UK Waters: Synthesis Report With a Focus On 2010–2015. Available online at: www.researchgate.net/publication/304324178_Carbon_dioxide_and_ocean_acidification_observations_in_UK_waters_Synthesis_report_with_a_focus_on_2010_-_2015?channel=doiandlinkId=576be75d08aead4e3add04a1andshowFulltext=true (accessed July 17, 2020)
Ouisse, V., Migné, A., and Davoult, D. (2011). Community-level carbon flux variability over a tidal cycle in Zostera marina and Z. noltii beds. Mari. Ecol. Progr. Series 437, 79–87. doi: 10.3354/meps09274
Padin, X. A., Vázquez-Rodríquez, M., Ríos, A. F., and Pérez, F. F. (2007). Surface CO2 measurements in the english channel and southern bight of North Sea using voluntary observing ships. J. Mar. Syst. 66, 297–308. doi: 10.1016/j.jmarsys.2006.05.011
Peng, S., Robinson, W. A., and Li, S. (2003). Mechanisms for the NAO responses to the North Atlantic SST tripole. J. Clim. 16, 1987–2004. doi: 10.1175/1520-04422003016<1987:MFTNRT<2.0.CO;2
Pingree, R. D., and Griffiths, D. K. (1978). Tidal fronts on the shelf seas around the British Isles. J. Geophys. Res. Oceans 83, 4615–4622. doi: 10.1029/JC083iC09p04615
Raven, J. A., Beardall, J., and Sánchez-Baracaldo, P. (2017). The possible evolution and future of CO2-concentrating mechanisms. J. Exp. Bot. 68, 3701–3716. doi: 10.1093/jxb/erx110
Raven, J. A., Gobler, C. J., and Hansen, P. J. (2020). Dynamic CO2 and pH levels in coastal, estuarine, and inland waters: theoretical and observed effects on harmful algal blooms. Harmful Algae 91:101594. doi: 10.1016/j.hal.2019.03.012
Reimer, J. J., Cai, W.-J., Xue, L., Vargas, R., Noakes, S., Hu, X., et al. (2017a). Time series pCO2 at a coastal mooring: internal consistency, seasonal cycles, and interannual variability. Cont. Shelf Res. 145, 95–108. doi: 10.1016/j.csr.2017.06.022
Reimer, J. J., Wang, H., Vargas, R., and Cai, W.-J. (2017b). Multidecadal fCO2 increase along the United States southeast coastal margin. J. Geophys. Res. Oceans 122, 10,061–10,072. doi: 10.1002/2017JC013170
Salt, L. A., Beaumont, L., Blain, S., Bucciarelli, E., Grossteffan, E., Guillot, A., et al. (2016). The annual and seasonal variability of the carbonate system in the bay of brest (Northwest Atlantic Shelf, 2008–2014). Mar. Chem. 187, 1–15. doi: 10.1016/j.marchem.2016.09.003
Staeher, P. A., Baastrup-Spohr, L., Sand-Jensen, K., and Stedmon, C. (2012). Lake metabolism scales with lake morphometry and catchment conditions. Aquatic Sci. 74, 155–169. doi: 10.1007/s00027-011-0207-6
Stets, E. G., Kelly, V. J., and Crawford, C. G. (2014). Long-term trends in alkalinity in large rivers of the conterminous US in relation to acidification, agriculture, and hydrologic modification. Sci. Total Environ. 488, 280–289. doi: 10.1016/j.scitotenv.2014.04.054
Sunda, W. G., and Cai, W. J. (2012). Eutrophication induced CO2-acidification of subsurface coastal Waters: interactive effects of temperature, salinity, and atmospheric pCO2. Environ. Sci. Technol. 46, 10651–10659. doi: 10.1021/es300626f
Sutton, A. J., Wanninkhof, R., Sabine, C. L., Feely, R. A., Cronin, M. F., and Weller, R. A. (2017). Variability and trends in surface seawater pCO2 and CO2 flux in the Pacific Ocean. Geophys. Res. Lett. 44, 5627–5636. doi: 10.1002/2017GL073814
Sutton, R. T., McCarthy, G. D., Robson, J., Sinha, B., Archibald, A. T., and Gray, L. J. (2018). Atlantic multidecadal variability and the UK ACSIS program. Bull. Am. Meteorol. Soc. 99, 415–425. doi: 10.1175/BAMS-D-16-0266.1
Takahashi, T., Olafsson, J., Goddard, J. G., Chipman, D. W., and Sutherland, S. C. (1993). Seasonal variation of CO2 and nutrients in the high-latitude surface oceans: a comparative study. Glob. Biogeochem. Cycles 7, 843–878. doi: 10.1029/93GB02263
Takahashi, T., Sutherland, S. C., and Kozyr, A. (2020). Global Ocean Surface Water Partial Pressure of CO2 Database: Measurements Performed During 1957-2019 (LDEO Database Version 2019) (NCEI Accession 0160492). Version 9.9. doi: 10.3334/CDIAC/OTG.NDP088(V2015.
Takahashi, T., Sutherland, S. C., Chipman, D. W., Goddard, J. G., Ho, C., Newberger, T., et al. (2014). Climatological distributions of pH, pCO2, total CO2, alkalinity, and CaCO3 saturation in the global surface ocean, and temporal changes at selected locations. Mari. Chem. 164, 95–125. doi: 10.1016/j.marchem.2014.06.004
Takahashi, T., Sutherland, S. C., Sweeney, C., Poisson, A., Metzl, N., Tilbrook, B., et al. (2002). Global sea–air CO2 flux based on climatological surface ocean pCO2, and seasonal biological and temperature effects. Deep Sea Res. Part II Top. Stud. Oceanogr. 49, 1601–1622. doi: 10.1016/S0967-0645(02)00003-6
Takahashi, T., Sutherland, S. C., Wanninkhof, R., Sweeney, C., Feely, R. A., Chipman, D. W., et al. (2009). Climatological mean and decadal change in surface ocean pCO2, and net sea–air CO2 flux over the global oceans. Deep Sea Res. Part II Top. Stud. Oceanogr. 56, 554–577. doi: 10.1016/j.dsr2.2008.12.009
Taylor, G. T., Muller-Karger, F. E., Thunell, R. C., Scranton, M. I., Astor, Y., Varela, R., et al. (2012). Ecosystem responses in the southern Caribbean Sea to global climate change. Proc. Natl. Acad. Sci. 109, 19315–19320. doi: 10.1073/pnas.1207514109
Thomas, H., Bozec, Y., de Baar, H. J., Borges, A., and Schiettecatte, L. S. (2005). Controls of the surface water partial pressure of CO2 in the North Sea. Biogeosciences 2, 323–334. doi: 10.5194/bg-2-323-2005
Tréguer, P. J., and De La Rocha, C. L. (2013). The world ocean silica cycle. Annu. Rev. Mar. Sci. 5, 477–501. doi: 10.1146/annurev-marine-121211-172346
Tréguer, P., Goberville, E., Barrier, N., l’ Helguen, S., Morin, P., Bozec, Y., et al. (2014). Large and local-scale influences on physical and chemical characteristics of coastal waters of Western Europe during winter. J. Mar. Syst. 139, 79–90. doi: 10.1016/j.jmarsys.2014.05.019
Turk, D., Wang, H., Hu, X., Gledhill, D. K., Wang, Z. A., Jiang, L., et al. (2019). Time of emergence of surface ocean carbon dioxide trends in the North American coastal margins in support of ocean acidification observing system design. Front. Mari. Sci. 6:91. doi: 10.3389/fmars.2019.00091
Uppstrom, L. R. (1974). The boron/chlorinity ratio of deep-sea water from the Pacific Ocean. Deep Sea Res. 21, 161–162.
van Heuven, S. M. A. C., Pierrot, D., Rae, J. W. B., Lewis, E., and Wallace, D. W. R. (2011). MATLAB Program Developed for CO2 System Calculations. ORNL/CDIAC-105b. Tennessee: Oak Ridge National Laboratory, US Department of Energy, 530.
Vandemark, D., Salisbury, J. E., Hunt, C. W., Shellito, S. M., Irish, J. D., McGillis, W. R., et al. (2011). Temporal and spatial dynamics of CO2 air−sea flux in the gulf of maine. J. Geophys. Res. Oceans 116. doi: 10.1029/2010JC006408
Waldbusser, G. G., and Salisbury, J. E. (2014). Ocean acidification in the coastal zone from an organism’s perspective: multiple system parameters, frequency domains, and habitats. Annu. Rev. Mar. Sci. 6, 221–247. doi: 10.1146/annurev-marine-121211-172238
Wallace, R. B., Baumann, H., Grear, J. S., Aller, R. C., and Gobler, C. J. (2014). Coastal ocean acidification: the other eutrophication problem. Estuar. Coastal Shelf Sci. 148, 1–13. doi: 10.1016/j.ecss.2014.05.027
Walsh, J. J., Biscaye, P. E., and Csanady, G. T. (1988). The 1983–1984 shelf edge exchange processes (SEEP)I experiment: hypotheses and highlights. Cont. Shelf Res. 8, 435–456. doi: 10.1016/0278-4343(88)90063-5
Wang, H., Hu, X., Cai, W. −J., and Sterba−Boatwright, B. (2017). Decadal fCO2 trends in global ocean margins and adjacent boundary current−influenced areas. Geophys. Res. Lett. 44, 8962–8970. doi: 10.1002/2017GL074724
Wanninkhof, R. (2014). Relationship between wind speed and gas exchange over the ocean revisited. Limnol. Oceanogr. Methods 12, 351–362. doi: 10.4319/lom.2014.12.351
Waters, J., Millero, F. J., and Woosley, R. J. (2014). Corrigendum to “the free proton concentration scale for seawater pH”,[MARCHE: 149 (2013) 8-22]. Mari. Chem. 165, 66–67. doi: 10.1016/j.marchem.2014.07.004
Weiss, R. F. (1970). The solubility of nitrogen, oxygen and argon in water and seawater. Deep Sea Res. Oceanogr. Abstr. 17, 721–735. doi: 10.1016/0011-7471(70)90037-9
Weiss, R. F., and Price, B. A. (1980). Nitrous oxide solubility in water and seawater. Mar. Chem. 8, 347–359. doi: 10.1016/0304-4203(80)90024-9
Wolf-Gladrow, D. A., Zeebe, R. E., Klaas, C., Körtzinger, A., and Dickson, A. G. (2007). Total alkalinity: the explicit conservative expression and its application to biogeochemical proÎsses. Mari. Chem. 106, 287–300. doi: 10.1016/j.marchem.2007.01.006
Keywords: ocean acidification, coastal ecosystem, long-term monitoring, NE Atlantic, carbonate system dynamics
Citation: Gac J-P, Marrec P, Cariou T, Grosstefan E, Macé É, Rimmelin-Maury P, Vernet M and Bozec Y (2021) Decadal Dynamics of the CO2 System and Associated Ocean Acidification in Coastal Ecosystems of the North East Atlantic Ocean. Front. Mar. Sci. 8:688008. doi: 10.3389/fmars.2021.688008
Received: 30 March 2021; Accepted: 28 May 2021;
Published: 14 July 2021.
Edited by:
Hongjie Wang, National Oceanic and Atmospheric Administration (NOAA), United StatesReviewed by:
Emily Osborne, National Oceanic and Atmospheric Administration (NOAA), United StatesCopyright © 2021 Gac, Marrec, Cariou, Grosstefan, Macé, Rimmelin-Maury, Vernet and Bozec. This is an open-access article distributed under the terms of the Creative Commons Attribution License (CC BY). The use, distribution or reproduction in other forums is permitted, provided the original author(s) and the copyright owner(s) are credited and that the original publication in this journal is cited, in accordance with accepted academic practice. No use, distribution or reproduction is permitted which does not comply with these terms.
*Correspondence: Yann Bozec, Ym96ZWNAc2Itcm9zY29mZi5mcg==
Disclaimer: All claims expressed in this article are solely those of the authors and do not necessarily represent those of their affiliated organizations, or those of the publisher, the editors and the reviewers. Any product that may be evaluated in this article or claim that may be made by its manufacturer is not guaranteed or endorsed by the publisher.
Research integrity at Frontiers
Learn more about the work of our research integrity team to safeguard the quality of each article we publish.