 Ying Pang
 Xiaojun Zhang
 Jianbo Yuan
 Xiaoxi Zhang1,2
 Fuhua Li
- 1CAS and Shandong Province Key Laboratory of Experimental Marine Biology, Center for Ocean Mega-Science, Institute of Oceanology, Chinese Academy of Sciences, Qingdao, China
- 2Laboratory for Marine Biology and Biotechnology, Qingdao National Laboratory for Marine Science and Technology, Qingdao, China
- 3College of Earth Science, University of Chinese Academy of Sciences, Beijing, China
Glycogen synthase kinase 3 (GSK3) is a vital multifunctional molecule that is widely distributed in invertebrates and vertebrates. GSK3 is a highly conserved serine/threonine (Ser/Thr) protein kinase, which plays an important role in insulin, Wnt, and various signaling pathways. In this study, a GSK3 gene were identified in the genome of the Pacific white shrimp, Litopenaeus vannamei, and analyzed its gene structure, phylogeny, and expression profiles. The deduced LvGSK3 protein contains a highly conserved Ser/Thr protein kinase catalytic (S_TKc) domain, the LvGSK3 gene exhibited high expression in different early developmental stages, most adult tissues, and premolting stages. RNA interference of LvGSK3 significantly retarded the increment of body weight and affected the expressions of molting-related genes compared with control groups. These results will improve our understanding of the conserved structure and functions of the LvGSK3 gene and show potential applications of shrimp growth.
Introduction
Glycogen synthase kinase 3 (GSK3), a cytoplasmic Ser/Thr kinase family member, is a major mediator in the insulin and Wnt signaling pathways (McManus et al., 2005). At the same time, GSK3 is also at the center of many other signaling pathways, including those that are activated by hedgehog, growth factors, cytokines, and G protein-coupled ligands (Wu and Pan, 2010). In addition, GSK3 was first described in a metabolic pathway of glycogen synthesis regulation, so GSK3 could serve as a key regulator in glucose metabolism (Woodgett and Cohen, 1984; Wang and Roach, 1993; Hur and Zhou, 2010), and it is sensitive to insulin-mediated inhibitors (Plyte et al., 1992; Kim and Kimmel, 2000). Additionally, GSK3 can also regulate cellular division, proliferation, motility, and survival in organisms ranging from yeast to mammals (Frame and Cohen, 2001; Li and Nam, 2002; Rayasam et al., 2009).
There are two subtypes of GSK3 in vertebrates, namely GSK3α (51 kDa) and GSK3β (47 kDa); their catalytic domains share 97% amino acid sequence identity (Wu and Pan, 2010). Although GSK3α and GSK3β may have similar functions in some signaling pathways, they perform distinct functions in other signaling pathways. Genetic analyses found that there is a homolog of GSK3 in Drosophila, named Shaggy or Zeste-white3, which is a well-known repressor of the Wingless (Wg) signaling pathway (Frame and Cohen, 2001). In Drosophila, Shaggy not only regulates development by controlling Wnt/β-catenin signaling (Rubinfeld et al., 1996) but also acts as a kinase, which is essential for determining cell fates during early development (Frame and Cohen, 2001). Knockout of shaggy in Drosophila could be rescued by overexpression of human GSK3β rather than GSK3α, which suggests that GSK3α and GSK3β may have different physiological functions (Ruel et al., 1993). Insulin could trigger the phosphorylation of GSK3 by turning the N-terminus into a pseudosubstrate inhibitor, thus lead to inactivation of GSK3, while Wnt proteins could inhibit GSK3 in a completely different way, by disrupting a multiprotein complex comprising GSK3 (Frame and Cohen, 2001).
In Drosophila, Shaggy inhibits the growth of motor neuron neuromuscular joints, regulates microtubule dynamics and actin cytoskeleton, forms chitin shell, regulates biorhythm, and changes epidermal cell morphology (Dierick and Bejsovec, 1999). Therefore, Shaggy may have a positive effect on growth and molting. In the fresh-water sponge (Ephydatia muelleri), GSK3 is involved in the formation of its oscula and aquiferous system (Windsor Reid et al., 2018). In the Portuguese oyster (Crassostrea angulata), high glycogen content in the gonads and adductor muscles is associated with reproduction and growth. After the maturation stage, the glycogen content and the expression of Ca-GSK3β decreased simultaneously. This indicates that Ca-GSK3β can reflect the stages of glycogen metabolism and reproduction (Zeng et al., 2013). In the Chinese mitten crab (Eriocheir sinensis), GSK3 regulates the innate immune responses by promoting TNF-α transcription and inhibiting hemocyte phagocytosis (Li et al., 2017). However, further research on the effect of GSK3 on the growth of marine invertebrates is still very scarce.
The Pacific white shrimp, Litopenaeus vannamei, is one of the most economically important marine aquaculture species in the world. So far, there is limited research on GSK3 in penaeid shrimp species. In this study, we identified the GSK3 gene from L. vannamei genome and transcriptome database. Subsequently, the gene structure and expression profile of the GSK3 gene were comprehensively explored. Through RNA interference, we found that GSK3 could affect the growth rate of shrimp and play an important role in regulating molting. This study will clarify the structure and function of the GSK3 gene and help understand the growth mechanism of shrimp.
Materials and Methods
Experimental Animals
The experimental shrimp were cultured in seawater at the laboratory of the Institute of Oceanology, Chinese Academy of Sciences (Qingdao, Shandong, China), at a temperature of 25 ± 1°C, a salinity of 30‰, and a pH of 7.5 ± 0.1. The aquaculture seawater was filtered, sterilized, and continuously oxygenated. All shrimp were fed three times a day at 9:00 a.m., 2:00 p.m., and 7:00 p.m. with equally commercial food pellets (Dale Feed Company, Yantai, China). The average initial weight of the shrimp was 3.2 ± 0.7 g. The animal study was reviewed and approved by the ethics committee of the Institute of Oceanology, Chinese Academy of Sciences. We declare that all animal experiments in this study were conducted in accordance with the guidelines of UK Animals Act, 1986 and EU Directive 2010/63/EU. In these experiments, we did not use any endangered or protected species.
Sequence Analyses
In order to identify the GSK3 gene, the sequences which were annotated as GSK3 from the L. vannamei genome and transcriptome data from our previous studies were extracted (Wei et al., 2014; Gao et al., 2015; Zhang et al., 2019; Sun et al., 2020). The GSK3 gene was screened by running a local blast of the L. vannamei genome against the giant tiger shrimp (Penaeus monodon) GSK3β sequence. BioEdit1 was used to compare these GSK3 gene sequences, and CAP3 program was used to remove the redundant sequences (Huang and Madan, 1999). The amino acid sequences were deduced by submitting the GSK3 sequences to the ORF Finder2 and the ExPASy translate tool3. To confirm the conserved domains of GSK3, its amino acid sequence was analyzed by SMART4. Then, the 3D structure of the GSK3 protein was predicted by SWISS-MODEL5 and SAVES v5.0 was used to assess the quality of the final result6. Finally, the putative shrimp GSK3 gene was named LvGSK3, and its phylogeny and gene expression profiles were analyzed.
Phylogenetic Analyses
A phylogenetic tree was constructed for multiple invertebrate and vertebrate GSK3 proteins. These orthologous and paralogous sequences were obtained from the NCBI protein database (Supplementary Table 1): the sequences of four vertebrates (Homo sapiens and Danio rerio); the rest of the sequences were from invertebrates, including Malacostraca (P. monodon, Euphausia superba, E. sinensis, Procambarus clarkii, Macrobrachium nipponense, and Armadillidium nasatum), Branchiopoda (Artemia sinica, Daphnia magna, Daphnia pulex, and Eurytemora affinis), Insecta (Drosophila melanogaster, Cotesia chilonis, Colaphellus bowringi, Aedes aegypti, and Anopheles darlingi), Lamellibranchia (C. angulata and Mizuhopecten yessoensis), Gastropoda (Aplysia californica and Pomacea canaliculate), Chromadorea (Caenorhabditis elegans), Hydrozoa (Hydra vulgaris), and Demospongiae (Amphimedon queenslandica and Suberites domuncula). MEGA X7 was used to build the GSK3 phylogenetic tree. All GSK3 protein sequences were aligned with default settings using the Muscle algorithm. Next, the phylogenetic tree was constructed by the Maximum likelihood (ML) distance algorithm with a default model and the Interactive Tree of Life (iTOL)8 online tool was applied for the final visualization and ornament.
Transcription Factor Prediction
The transcription factor binding site (TFBS) was predicted using the AnimalTFDB 3.0 program9 for a 10-kb sequence corresponding to the 5’ flanking region of the shrimp GSK3 gene. The p-value <10–7 was set as a restricted condition for selecting the transcription factor binding sites. Finally, the results were visualized using the OriginPro 2019b10.
Gene Expression Profiles
In previous studies, we had accomplished digital gene expression (DGE) profiling sequencing of 20 early development stages (zygote, 2-cell, 4-cell, 32-cell, blastula, gastrula, limb bud embryo I–II, larva in membrane I–II, nauplius I, nauplius III, nauplius VI, zoea I–III, mysis I–III, and postlarvae 1), eight molting stages [intermolting (C), premolting (D0, D1, D2, D3, and D4), and postmolting (P1 and P2)], and RNA-Seq sequencing of 16 types of adult tissues (hemocyte, antenna, muscle, intestines, ovary, stomach, lymphoid organ, gill, hepatopancreas, testis, eye-stalk, brain, thoracic ganglion, ventral nerve, epidermis, and heart) in L. vannamei (Wei et al., 2014; Gao et al., 2015; Zhang et al., 2019; Sun et al., 2020). Through using the RSEM program (version 1.3.0), the fragments per kilo bases per million read (FPKM) values of LvGSK3 were calculated by mapping clean reads to unigenes from the transcriptome data. Then, the FPKM values were used to compare the gene expression differences. Genes with p ≤ 0.01 and absolute value of log2(fold change) ≥ 1 were identified as differentially expressed genes (DEGs). The data was normalized by log2 conversion, and TBtools11 was used to draw column charts.
In vivo RNA Interference
Primer3Plus12 was used to design a pair of specific primers, GSK3-F/R, and added the T7 promoter sequence to GSK3-F/R to form dsGSK3-F and dsGSK3-R. Using the dsGSK3-F/R primer pairs, a 437-bp cDNA fragment of the LvGSK3 was amplified. The specific steps of PCR are as below: one cycle of predegeneration at 95°C for 4 min, 40 cycles of amplification (94°C for 30 s, 65°C for 30 s, 72°C for 30 s), and one cycle of extension at 72°C for 10 min. The same procedure was used to amplify a 289-bp enhanced green fluorescent protein (EGFP) cDNA fragment, but the annealing temperature was 60°C. The final PCR products were purified by using a MiniBEST DNA fragment purification kit (TaKaRa, Maebashi, Gunma, Japan). Then, the purified product was used as a template to synthesize the double-stranded RNA (dsRNA) by using the Transcript Aid T7 High Yield kit (Thermo Fisher Scientific, Waltham, MA, United States) according to the instruction from the manufacturer. Finally, 1.5% agarose gel electrophoresis and NanoDrop 2000 (Thermo Fisher Scientific, United States) were used to detect the quality and concentration of dsRNAs, respectively. The qualified dsRNAs were stored at -80°C until use.
To obtain the optimal dsRNA interference dosage, 84 juvenile shrimp individuals (∼2–3 g each, in the premolt D1–D2 stage) were selected for preliminary experiment. These individuals were randomly divided into seven groups, each containing 12 shrimp, including three experimental groups (dsGSK3 groups), three dsEGFP groups, and one phosphate buffer saline (PBS) group. Each group consisted of three replicate samples, with four individuals in each sample. Then, we set three different interference dosages, 2, 6, and 10 μg. Specifically, the dsGSK3 groups and the EGFP groups were separately injected with 2, 6, and 10 μg of dsRNA (dissolved in 10 μl PBS) into the last abdominal segment of each shrimp; whereas, individuals in the PBS group were only injected with 10 μl PBS (solvent). After 48 h, the dsRNA interference efficiency of each preliminary experiment group was detected. Concretely, the muscle tissues of shrimp were sampled, then RNA isolation and cDNA synthesis were conducted, and the final products were used for qPCR experiment. By calculating and comparing the interference efficiency, 10 μg was regarded as the final interference dosage.
In the formal RNAi experiment, 108 individuals (3.2 ± 0.7 g each, in the premolt D1–D2 stage) were divided into three groups, including the dsGSK3 group and control groups (EGFP and PBS groups), and then injected with 10 μg dsGSK3, 10 μg dsEGFP, and 10 μl PBS, respectively. Each group includes three biological replicates. The same injection was repeated every 4 days. The experiment lasted for 2 weeks. Before the first injection, the body weight and body length of each shrimp were measured using an analytical balance and a ruler with an accuracy of 0.1 cm. After the experiment, the same method was used to measure the body weight and body length again. Then, the muscles and ventral nerves were sampled and frozen in liquid nitrogen, and then stored at −80°C.
RNA Isolation and cDNA Synthesis
According to the manufacturer’s instructions, RNAiso Plus (TaKaRa, Japan) reagent was used to isolate total RNA from muscles and ventral nerves. Then, 1% agarose gel electrophoresis and Nanodrop 2000 (Thermo Fisher Scientific, United States) were used to detect the quality and the concentration of RNA. Using 1.5 μg RNA as template, the first-strand cDNA was synthesized with the PrimeScript First Strand cDNA Synthesis Kit (TaKaRa, Japan). The specific cDNA synthesis steps were as follows: the first step was to remove genomic DNA, 5 × genomic DNA eraser buffer was added to the template at 42°C for 5 min, and then moving on to step 2 immediately, at 37°C for 1 h and 85°C for 5 s. Finally, the cDNA was stored at −80°C until use.
Real-Time Quantitative PCR
After RNAi treatments, SYBR Green-based quantitative real-time PCR (qPCR) were utilized to detect the relative expression level of the LvGSK3 gene. The 18S rRNA was selected as the internal reference gene. Primer3Plus (see text footnote 12) was used to design two pairs of primers, rtGSK3-F/R and rt18S-F/R. Then, an Eppendorf Mastercycler ep realplex (Eppendorf, Hamburg, Germany) equipment was used to perform the qPCR. The SuperReal PreMix Plus (SYBR Green) (Tiangen, Beijing, China), template, primers, and DEPC water were mixed in a certain proportion (Supplementary Table 2); each sample includes four technical replicates. The qPCR steps were as follows: 94°C for 2 min, 40 cycles of 94°C for 20 s, 62°C or 55°C for 20 s (the annealing temperature of rtGSK3-F/R and rt18S-F/R were 62 and 55°C, respectively), and 72°C for 20 s. Eventually, the comparative quantification cycle (Cq) method with the 2–ΔΔCq equation were used to calculate the relative expression level of LvGSK3 gene (Livak and Schmittgen, 2001).
All primer sequences used in this paper are shown in Supplementary Table 3. The standard curve required to determine efficiency is shown in Supplementary Figure 1. In addition, the melt curve reflecting primer specificity is shown in Supplementary Figure 2.
Statistical Analyses
The statistical significance between the control and different treatment groups were subjected to one-way ANOVA tests using SPSS (version 20)13.
Results
Characteristics of the GSK3 Sequence
A putative GSK3 gene named LvGSK3 (XM_027372807.1) was identified from the L. vannamei genome and transcriptome database. The open reading frame (ORF) length of LvGSK3 is 1,233 nt in length, which encode 410 aa. The deduced LvGSK3 protein has a molecular weight of 46 kDa, and an isoelectric point (pI) of 8.88. It is noteworthy that LvGSK3 protein has a highly conserved Ser/Thr protein kinases (S_TKc) domain, which could be served as a catalytic domain.
By analyzing the structure of GSK3 proteins in different species, they were found to share the typical S_TKc domain (Figure 1) and a high degree of homology among invertebrates and vertebrates. The SMART prediction results also showed that most of GSK3s have the S_TKc domain.
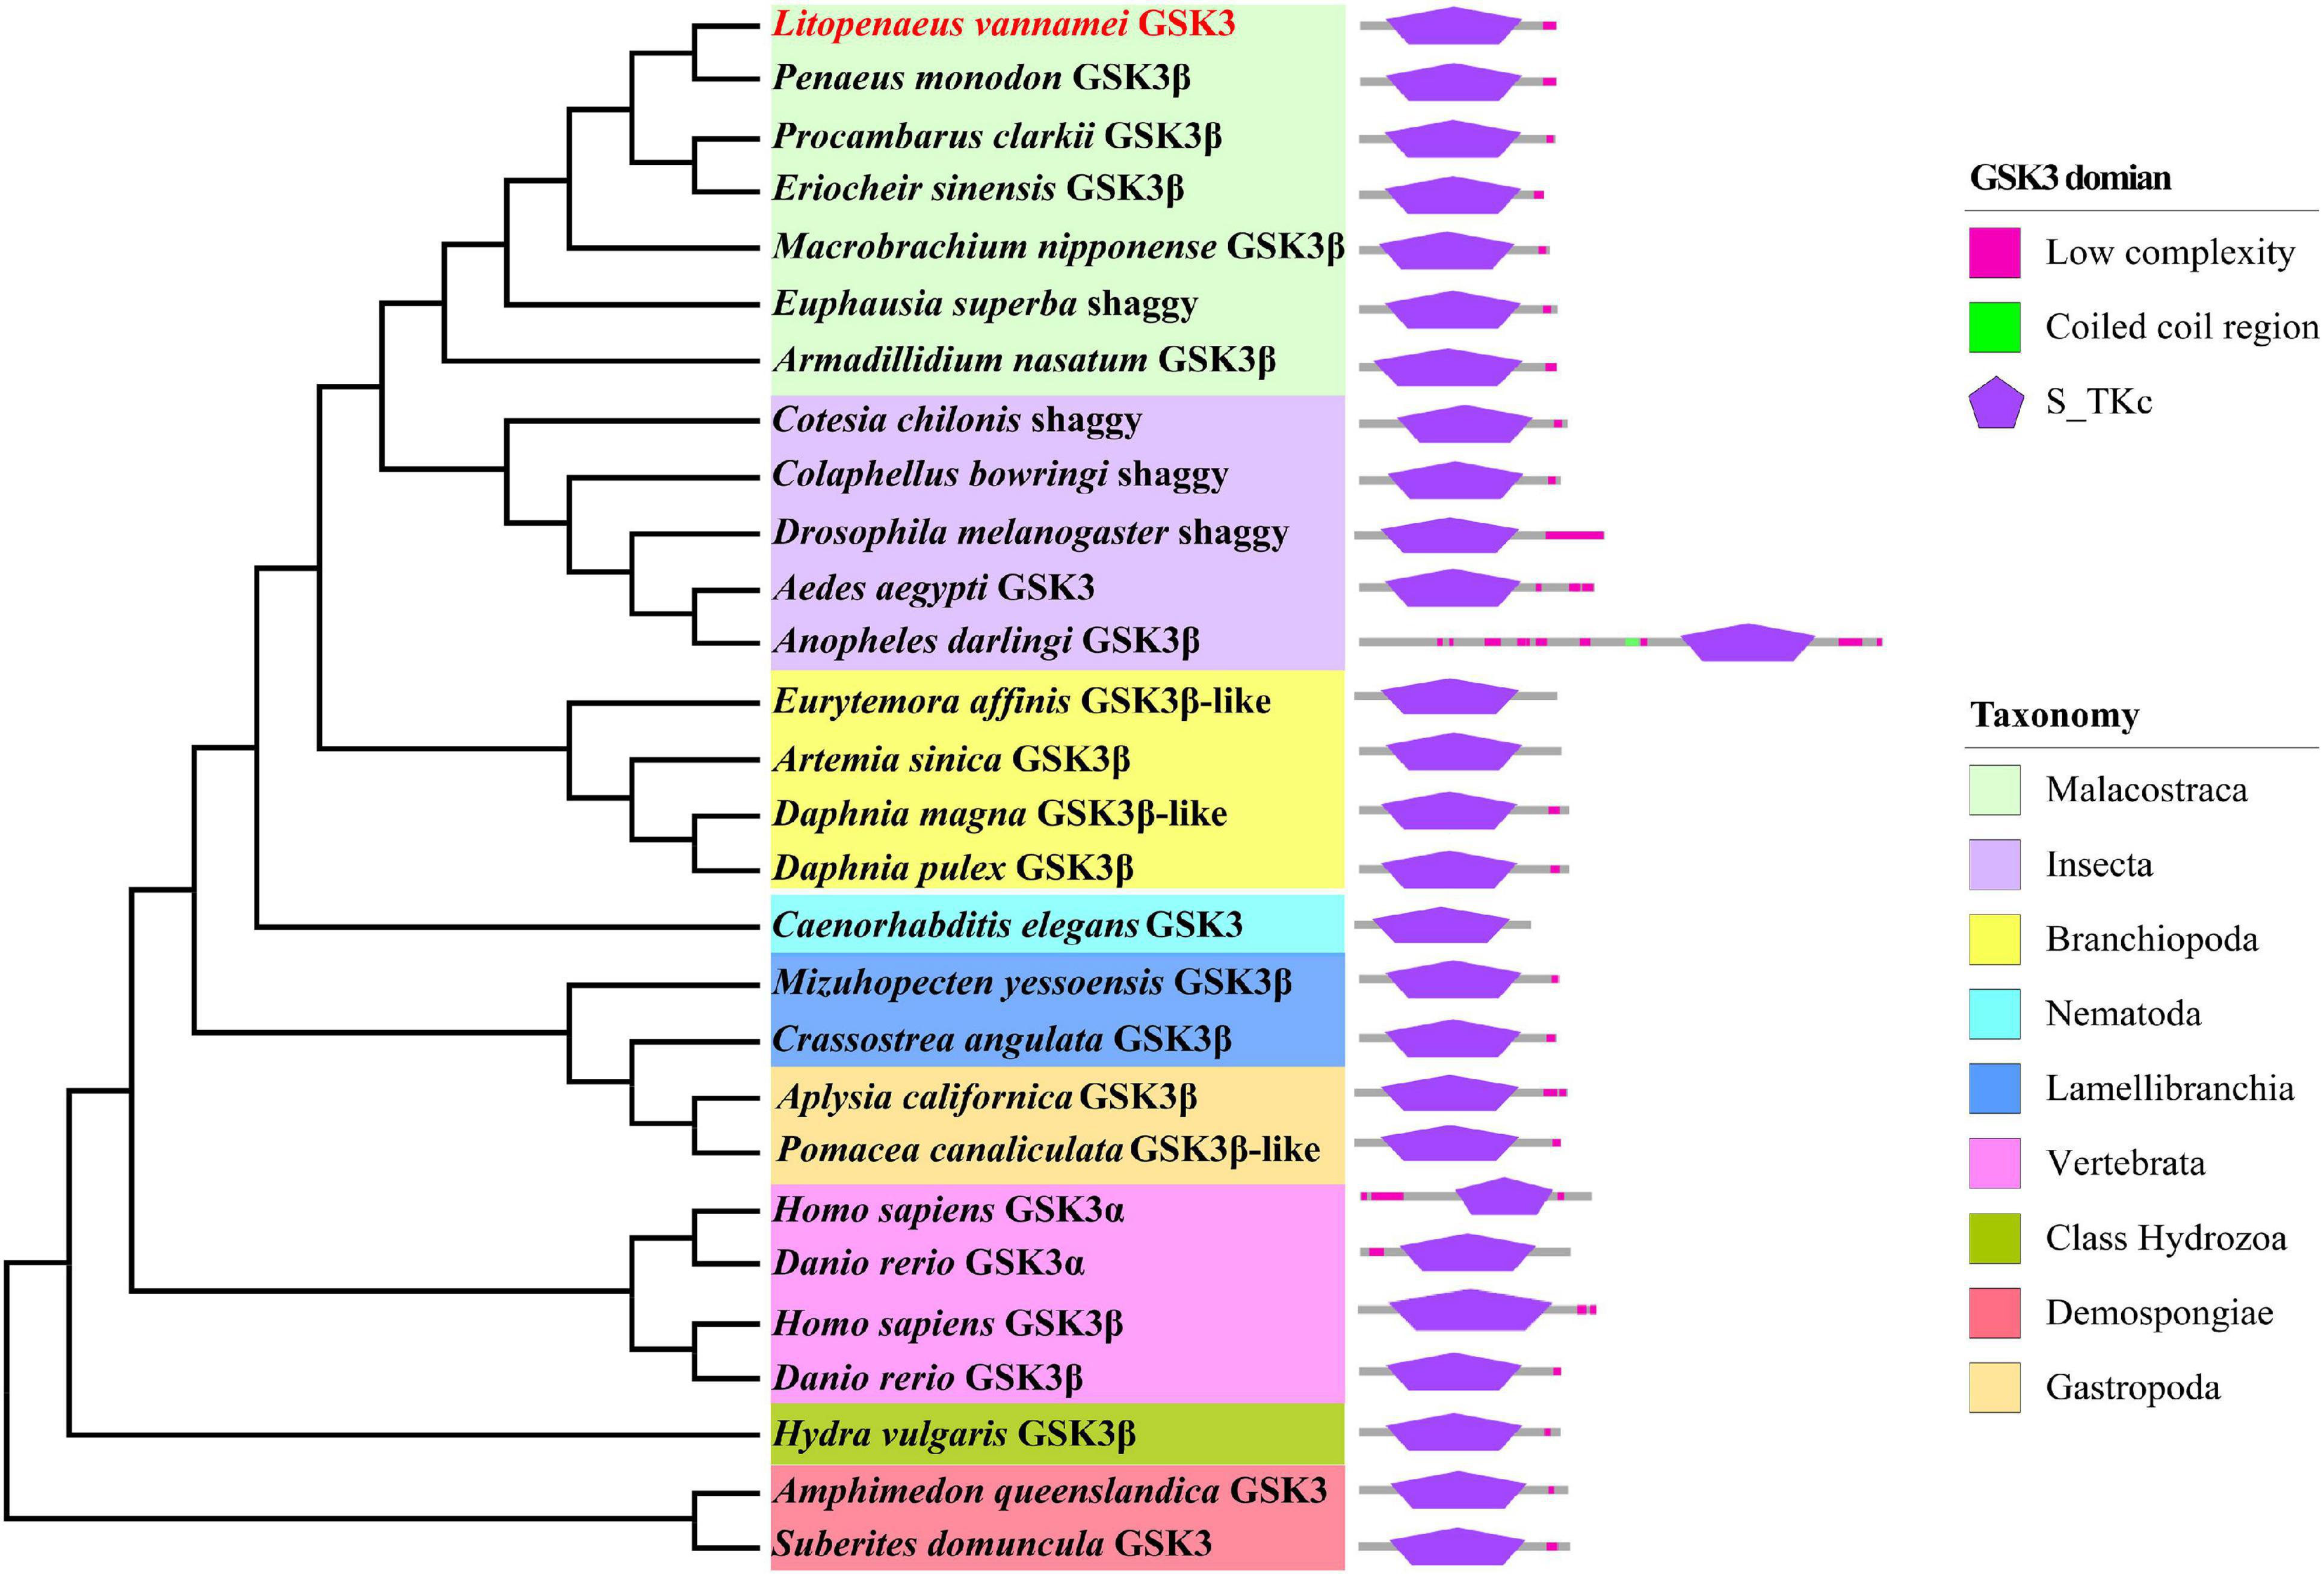
Figure 1. GSK3s’ phylogenetic tree and their structures.
Phylogenetic Analysis of the GSK3s
The 28 GSK3 superfamily sequences obtained from the NCBI database and the LvGSK3 sequence were used to construct a phylogenetic tree. Phylogenetic analysis showed that LvGSK3 clustered with six GSK3β sequences from malacostracans, P. monodon, P. clarkii, E. sinensis, M. nipponense, E. superba, and A. nasatum. This branch clusters together with the GSK3 sequences from other arthropods, including insects and branchiopods, followed by Nematoda, Mollusca, Chordata, Cnidaria, and Porifera. Among these GSK3 sequences from different species, insect GSK3s have the closest relationship with that of malacostracans (Figure 1).
Multiple Sequence Alignment Analysis
Multiple sequence alignments were performed to detect the conserved elements of LvGSK3 and other GSK3 proteins (Figure 2). The results showed that LvGSK3 was highly homologous with these sequences, the Lys83, Asn184, and Asp198 residues in the ATP-binding socket were conserved in the enzyme (Figure 2). Besides, Gly58 only exists at the N-terminus of decapods instead of other invertebrates, which is a specific difference between crustaceans and other invertebrates (such as insects and molluscs) (Figure 2). When it comes to the special difference between vertebrates and invertebrates, Pro57 only exists at the N-terminus of vertebrates instead of invertebrates (Figure 2). These differences may help us discuss the adaptive changes of invertebrates.
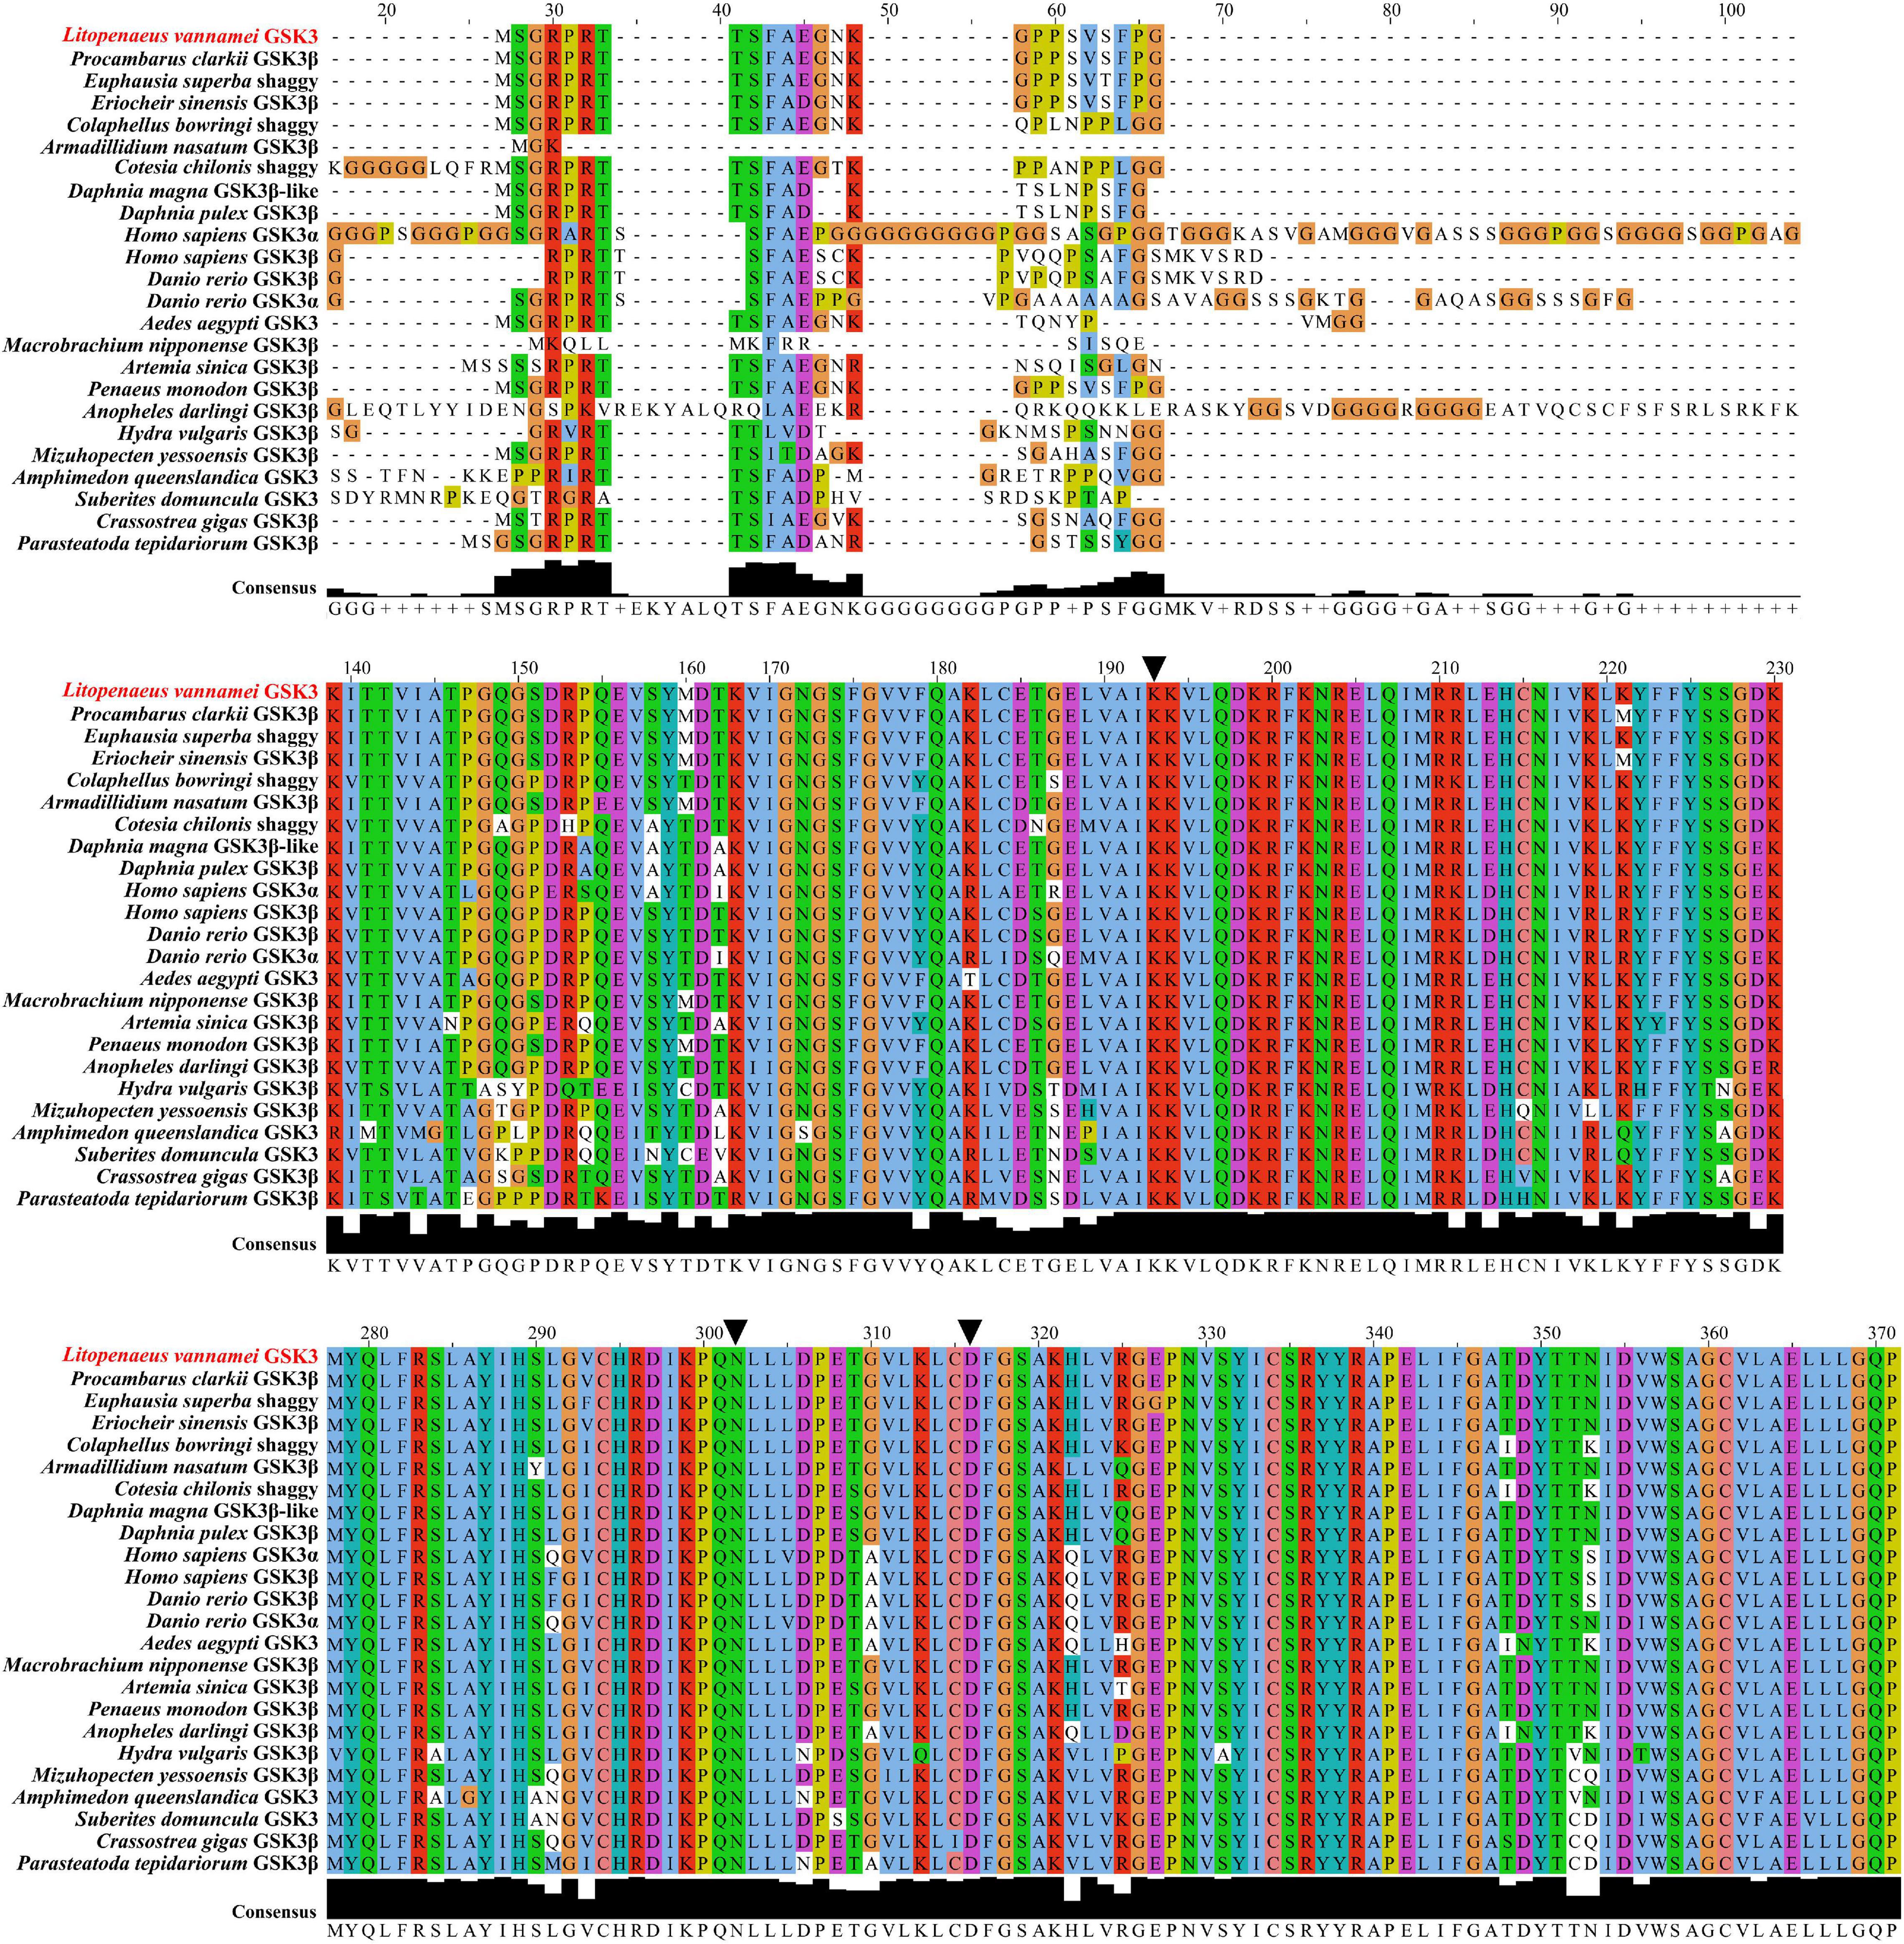
Figure 2. Multiple sequence alignment of the GSK3 protein sequences. The results of multiple sequence alignment were visualized and ornamented by the Jalview. The black triangles (▼) represent those sites in the ATP-binding pocket.
Predicted 3D Structure of LvGSK3
The 3D structure analysis of LvGSK3 showed that there are seven reverse parallel β-sheets and one α-helix at the N-terminus, some α-helices exist at the C-terminus, and the active center, T-loop structure, connects the N-terminus and the C-terminus. At the N-terminus, the second to sixth β-sheets form a “barrel” structure, and the α-helix is located between the fifth and sixth β-sheets (Figure 3A). Tyr214 is an important phosphorylation regulatory site in T-loop region. The T-loop region of the LvGSK3 protein also has three positively charged amino acids, namely Arg94, Arg178, and Lys203, which look like a pocket, also known as a “phosphoprotein-binding pocket” (Figure 3B). The binding pocket has an activation loop and a β-sheet-loop-α-helix supersecondary structure which consists Lys83 residue in the β-sheet, 85-VLQDKRFKN-93 in the loop, and Glu95-Leu96 in the α-helix. The activation loop consists in a 58-KVIGNGSFGVVFQ-70 sequence.
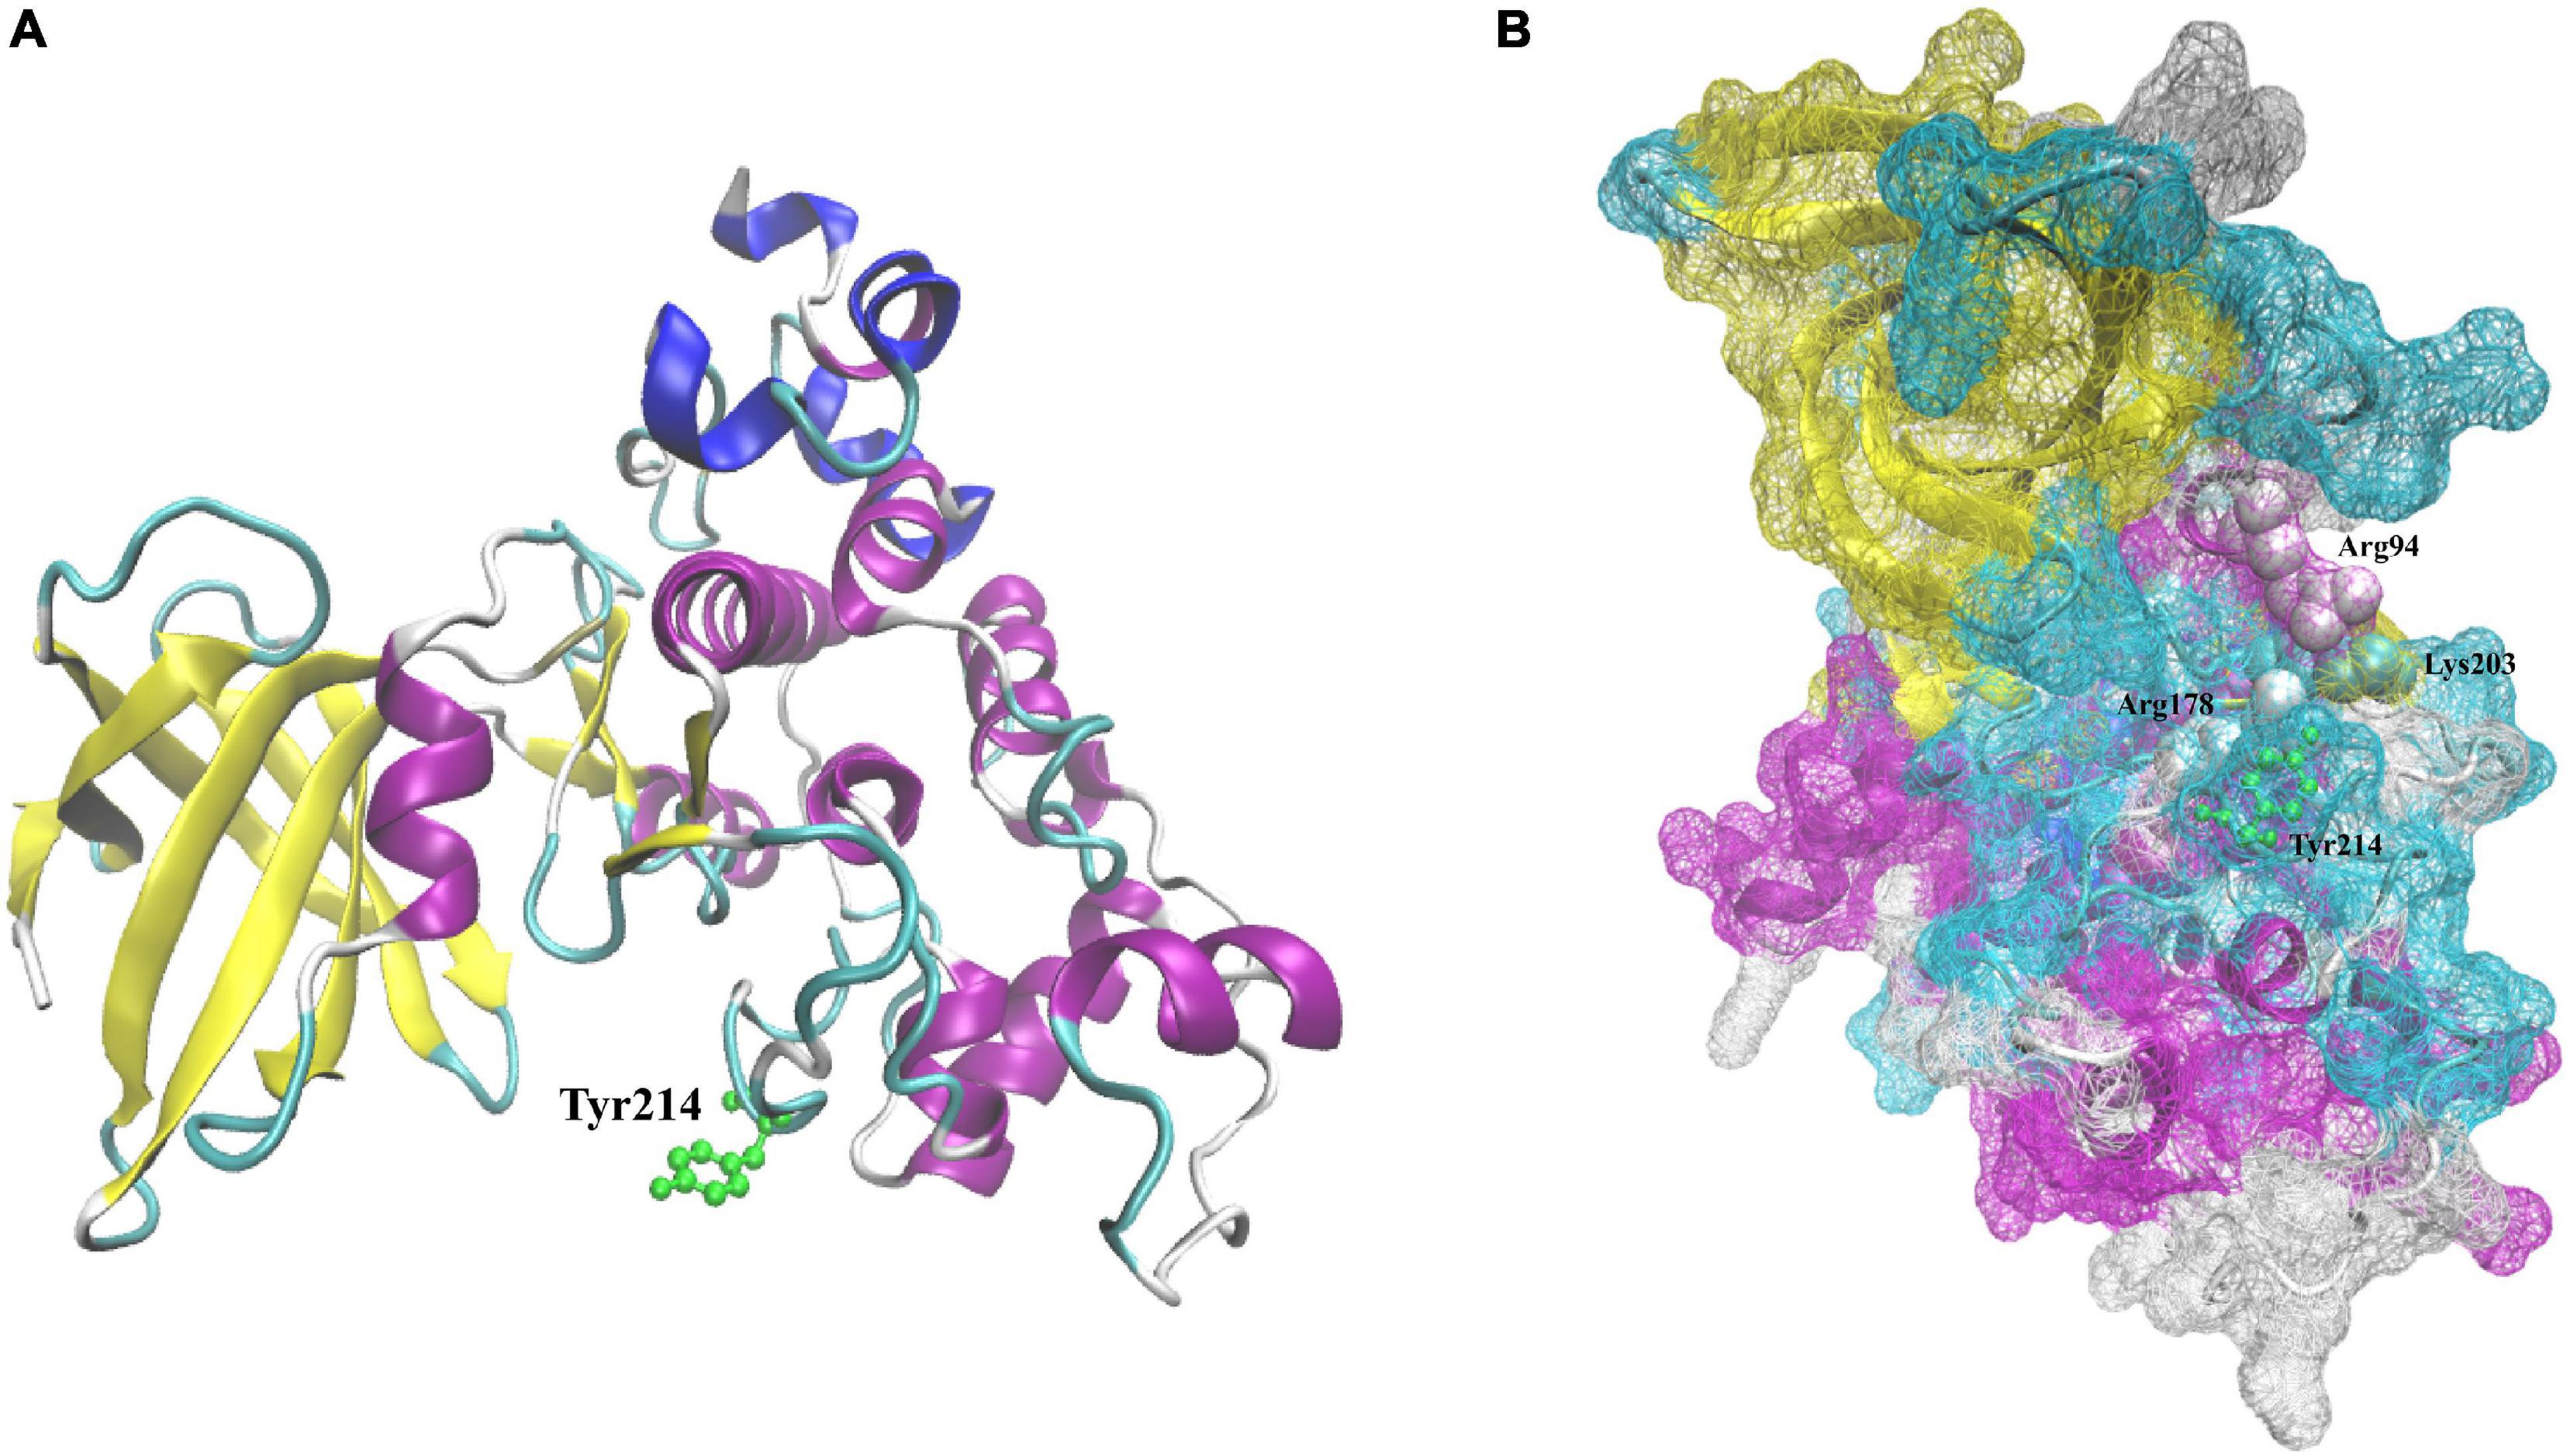
Figure 3. Predicted 3D structure of LvGSK3. (A) Predicted 3D structure of LvGSK3. Green represents tyrosine 214 residues. (B) Predicted 3D structure of LvGSK3. White represents arginine 94 and 178 residues; green represents lysine 203 residues. β-Sheet is in yellow, helix is in blue, β-turn is in cyan, and random coil is in white.
Transcription Factors for LvGSK3
More than 40 transcription factors (TFs) were predicted under a restricted condition (p-value <10–7) (Figure 4). Among these transcription factors, the major transcription factor-binding site is CTCF (CCCTC-binding factor), which has four main functions: transcription regulator, chromatin organization, response to ecdysone, and segment specification14. Myogenic differentiation 1 (MYOD1) may be one of the most important transcription factors in the LvGKS3, which is closely related to muscle development (Zammit, 2017). Retinoid X receptor alpha (RXRA) is an important member of the nuclear receptor superfamily and regulates various transcriptions including molting (Nakagawa and Henrich, 2009). The prediction result indicated that LvGSK3 has multiple functions. The first group of transcription factors focuses on the aspect of regulating transcription; the second group of TFs belongs to cell differentiation, cell proliferation, cell division, segment specification, and muscle development or regeneration, which are all related to the growth and development of organisms; the third group of TFs focuses on ecdysis, such as the regulation of ecdysis and ecdysone response; the forth group of TFs is about the immune systems.
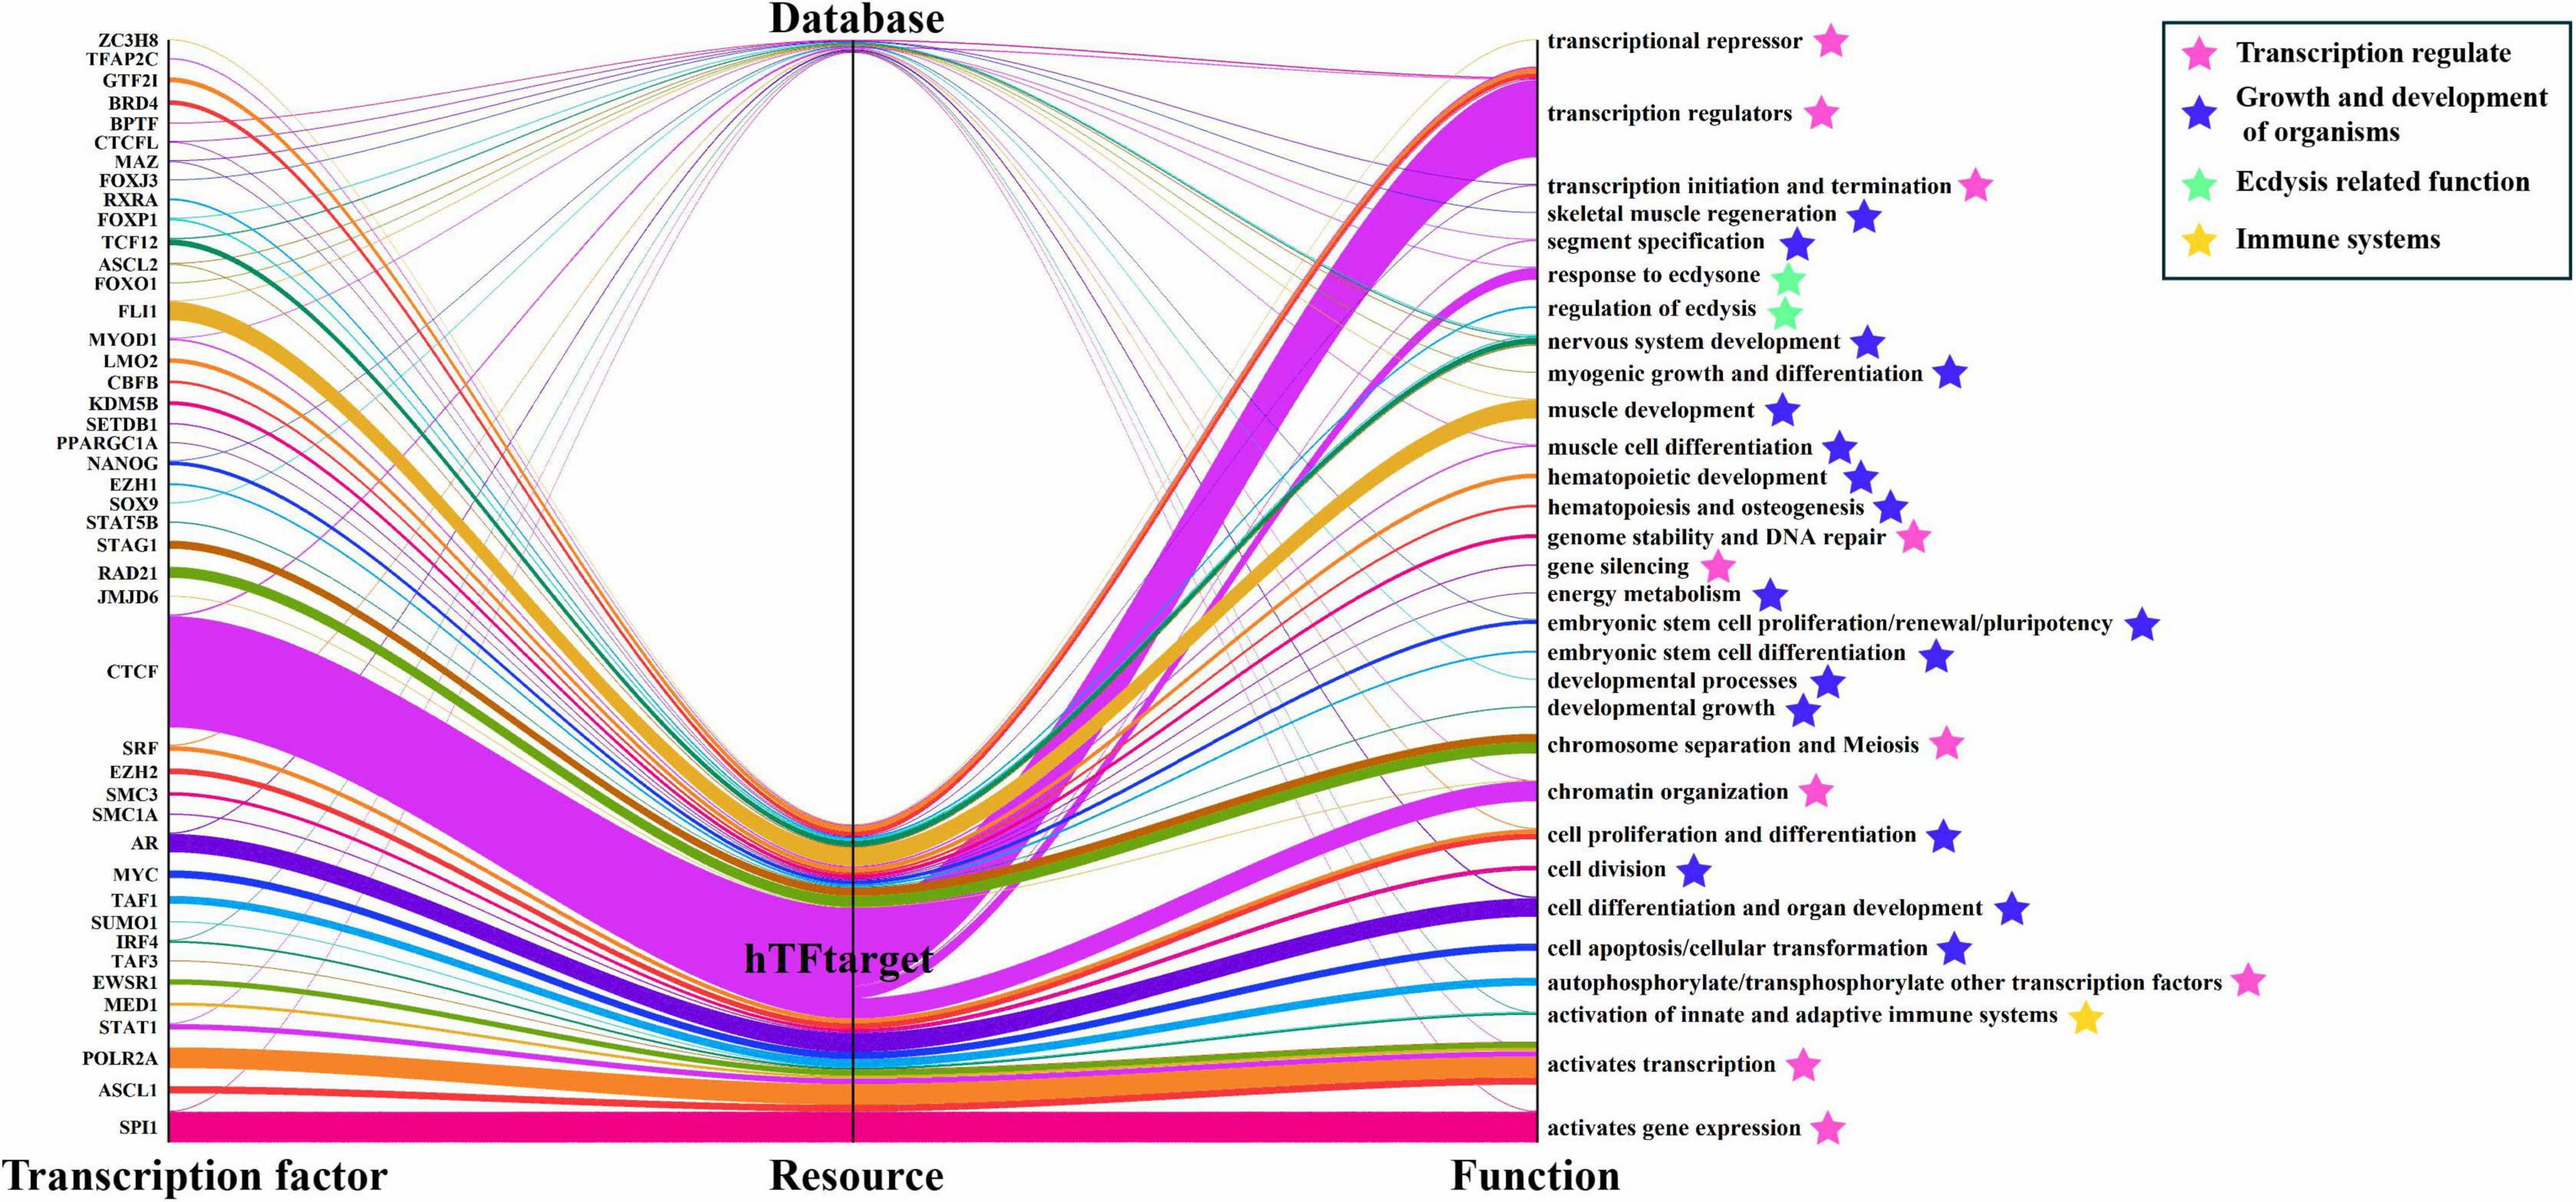
Figure 4. LvGSK3 transcription factors’ resource and their main functions. The results of transcription factor stem from Ensembl and hTFtarget database. hTFtarget: a comprehensive database for regulations of human transcription factors and their targets.
Expression Profile of LvGSK3
In different early development stages of L. vannamei, LvGSK3 initially appeared in zygote, its expression gradually increased from C2 to the gastrula stage, and reached a peak. Then, after the zoea I stage, the LvGSK3 expression gradually decreased and finally reached a steady state (Figure 5A). Generally, the molting cycle of shrimp can be divided into eight recurrent stages, including intermolting (C), premolting (D0, D1, D2, D3, and D4), and postmolting (P1 and P2) stages. Throughout the molting process, LvGSK3 was highly expressed and reached its maximum value at the D3 stage (Figure 5B). By analyzing the transcriptional profiles in 16 different adult tissues, the spatial expression of LvGSK3 was determined. The relative expression of LvGSK3 was at a high level in most tissues, except for the gonads (ovary and testis). Among these tissues with high expression level, the eye stalks, hearts, and muscles were the tissues with the highest expression (Figure 5C).
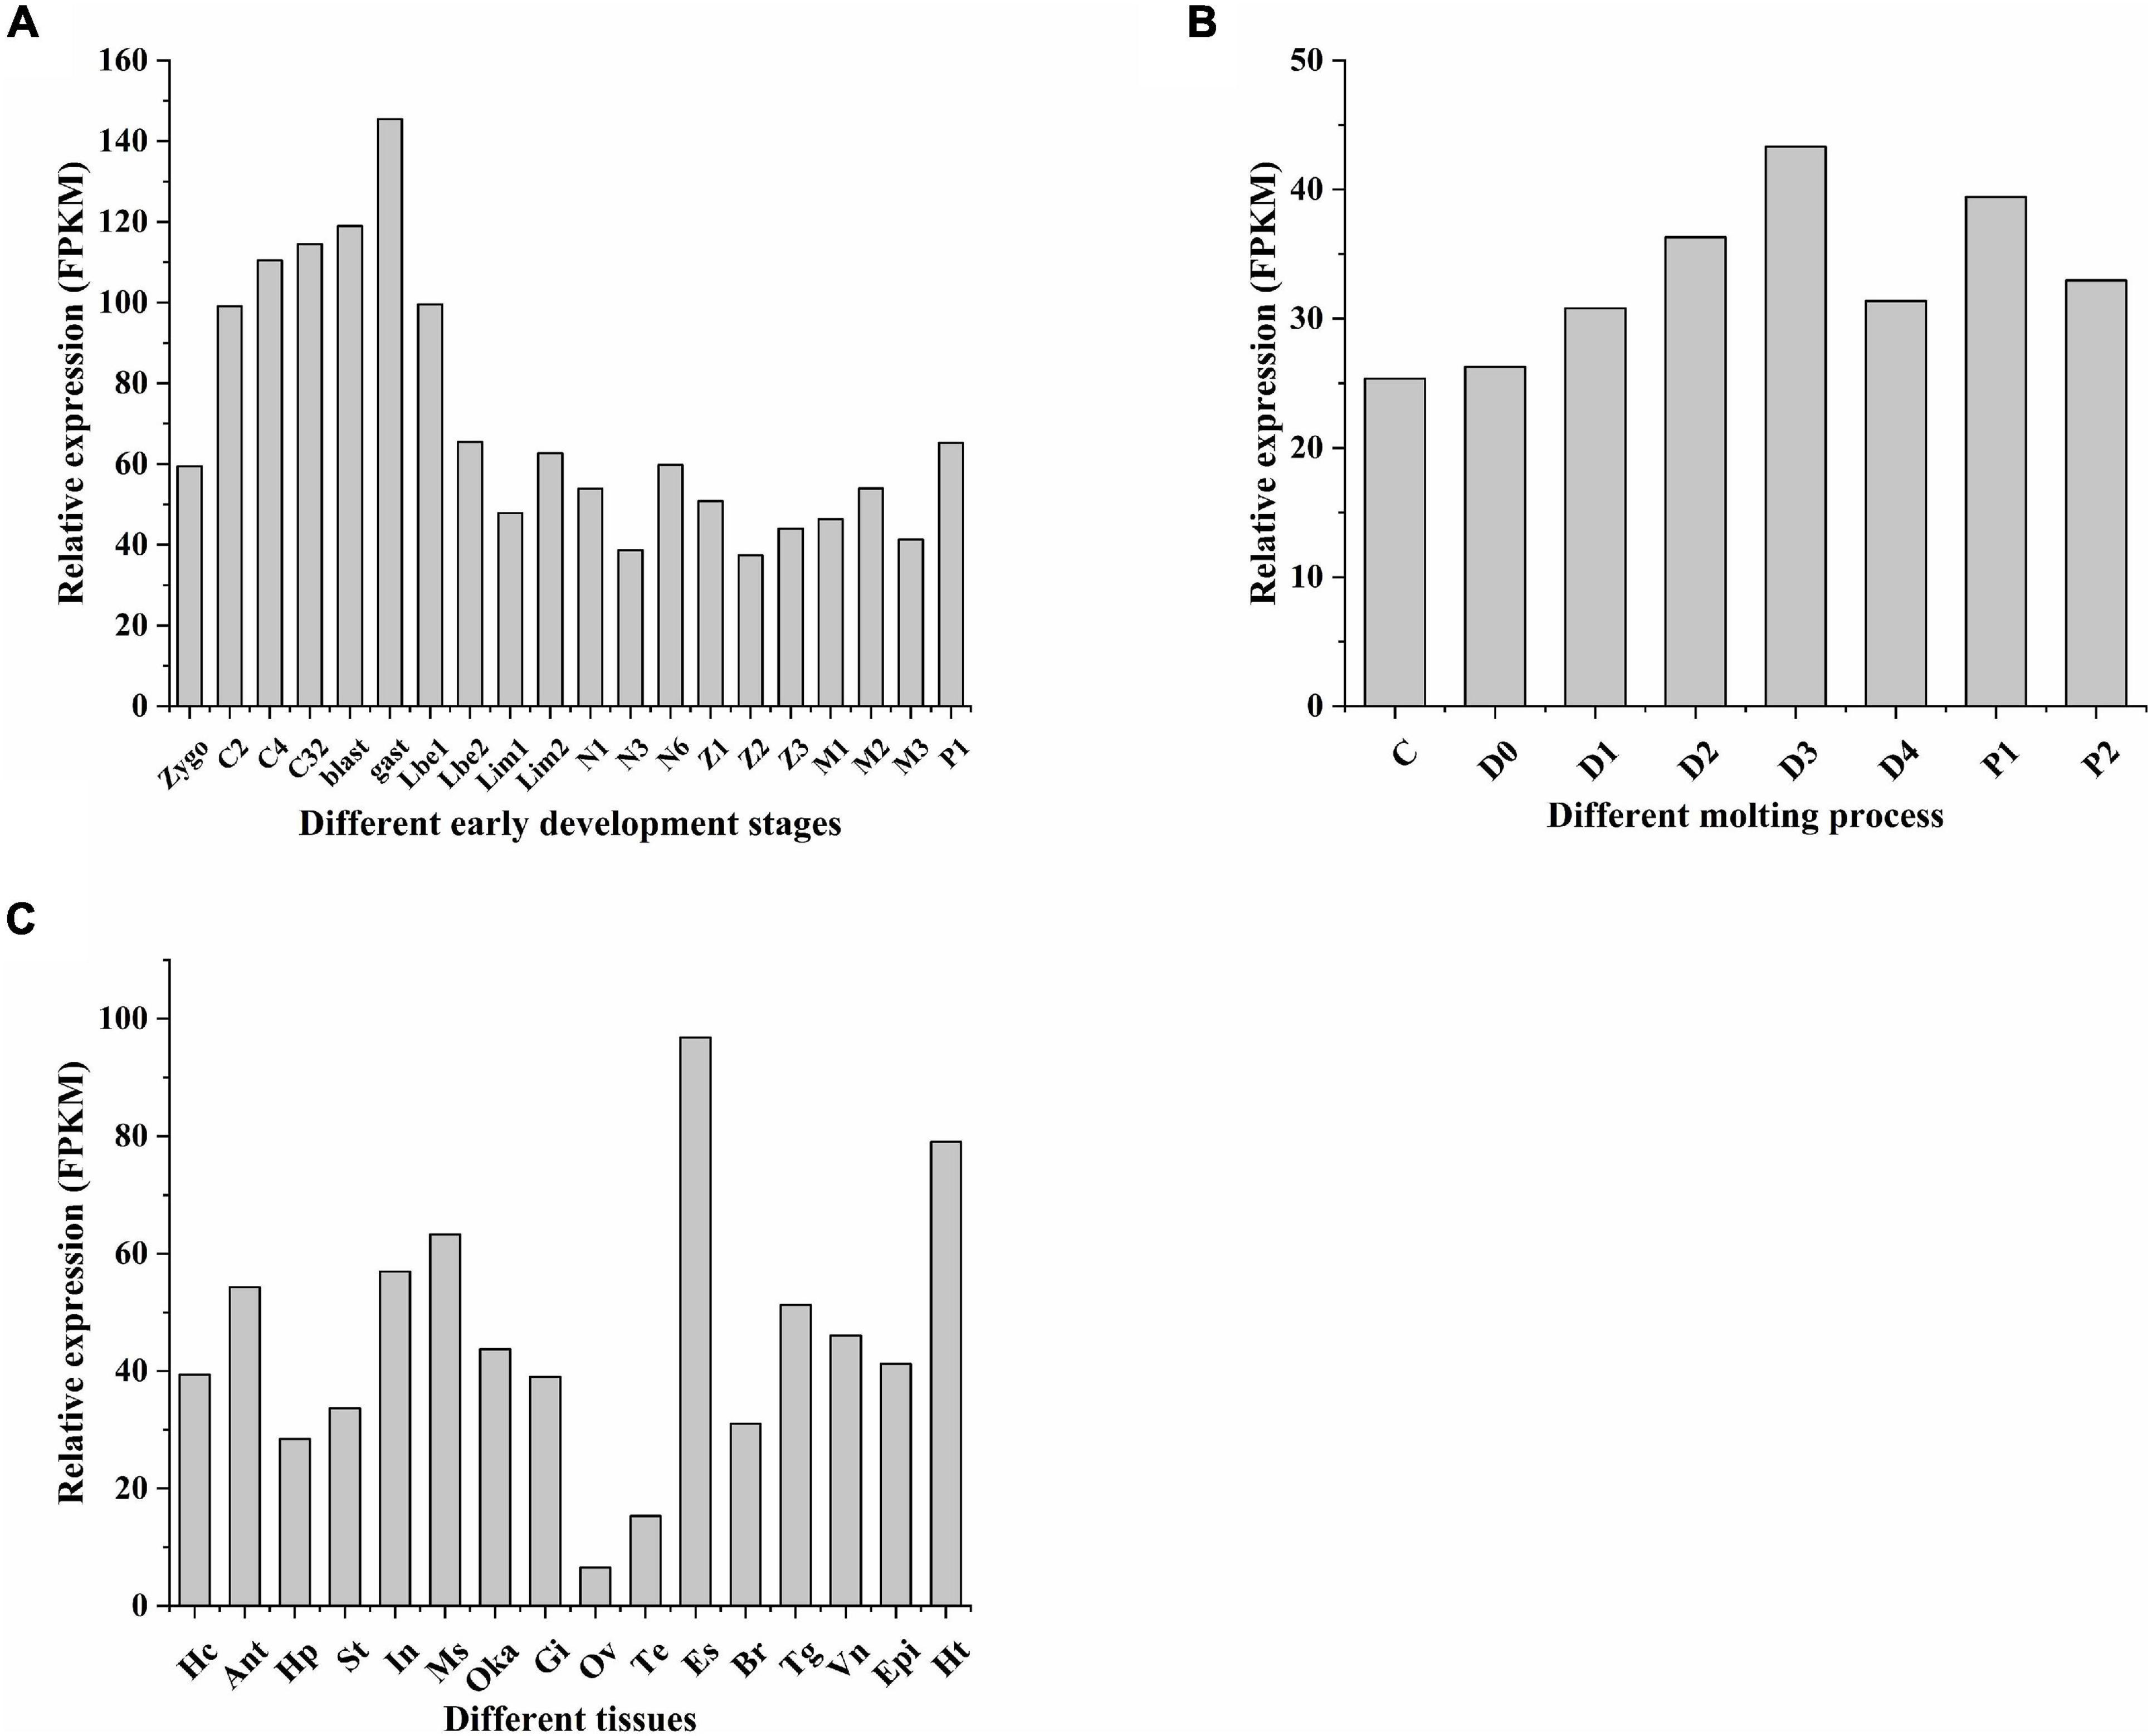
Figure 5. The expression profiles of LvGSK3 gene. (A) Early development stages: zygote (zygo), 2 cells (C2), 4 cells (C4), 32 cells (C32), blastula (blast), gastrula (gast), limb bud embryo I (Lbe1), limb bud embryo II (Lbe2), larva in membrane I (Lim1), larva in membrane II (Lim2), nauplius I (N1), nauplius III (N3), nauplius VI (N6), zoea I (Z1), zoea II (Z2), zoea III (Z3), mysis I (M1), mysis II (M2), mysis III (M3), and postlarvae 1 (P1); (B) molting stages: intermolting (C), premolting (D0, D1, D2, D3, and D4), and postmolting (P1 and P2) stages; and (C) adult tissues: Hc, hemocyte; Ant, antenna; Ms, muscle; In, intestines; Ov, ovary; St, stomach; Oka, lymphoid organ; Gi, gill; Hp, hepatopancreas; Te, testis; Es, eye stalk; Br, brain; Tg, thoracic ganglion; Vn, ventral nerve; Epi, epidermis; and Ht, heart. These experiments and data are from previous studies, respectively (Wei et al., 2014; Gao et al., 2015; Zhang et al., 2018).
In order to verify the accuracy of the expression profile data of different tissues, the relative expression levels of LvGSK3 in 14 tissues of adult shrimp were detected. Comparing the expression profiles obtained by RNA-seq with that of qPCR, the expression levels of the eye stalk, heart, and muscle were higher, while the expression levels of the ovary were the lowest. However, there were some inconsistencies between them, the relative expression levels of lymphoid organs and brains obtained by qPCR were significantly higher than that of RNA-seq, and the relative expression level of thoracic ganglion was opposite (Supplementary Figure 3). In general, the expression levels of most tissues were consistent, and some tissue differences might be caused by individual differences, so the RNA-seq results were basically accurate.
RNA Interference of LvGSK3
In the pre-experiment of RNA interference, compared with the control groups, the relative expression level of LvGSK3 was significantly decreased when 10 μg dsRNA was injected into individuals of the dsGSK3 group (Figure 6A). Therefore, 10 μg was used as the optimal interference dosage. This RNA interference experiment lasted for 2 weeks. After the experiment, the relative expression levels of LvGSK3 in the muscles and ventral nerves were significantly inhibited by dsGSK3 (Figures 6B,C).
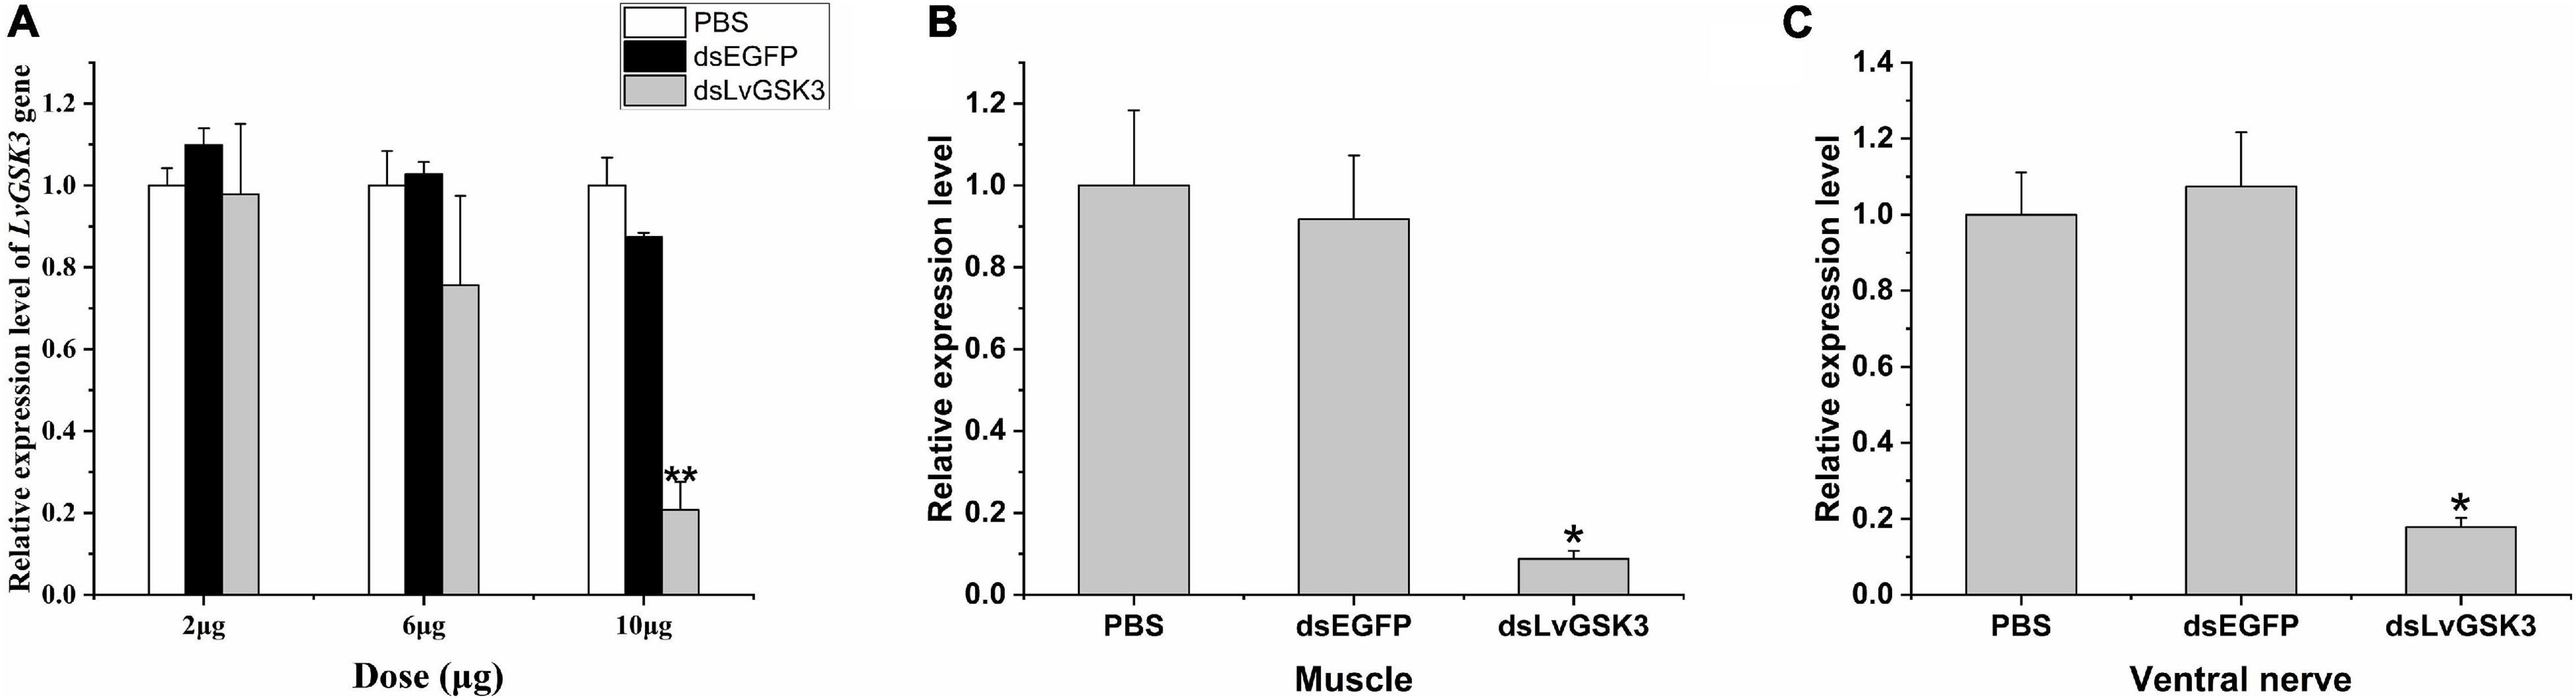
Figure 6. The relative expression levels of different treatments. (A) The silencing efficiency of LvGSK3 injected with different dosages of dsRNA. (B) Relative expression level of LvGSK3 after RNAi in muscle. (C) Relative expression level of LvGSK3 after RNAi in ventral nerve. The expression of target gene was detected by real-time PCR and normalized to the 18S rRNA as the internal reference. The results were based on three independent biological replications and showed at mean values ± SD. Significant differences of the gene expression levels between three treatments are shown as **p < 0.01 and *p < 0.05.
When it comes to the growth trait of L. vannamei, the body weight gain of the dsGSK3 group was significantly lower than that of two control groups (PBS and dsEGFP groups, p < 0.05) (Figures 7A,C). However, the increment of body length of the dsGSK3 group was slightly lower than that of the two control groups but not significantly (p > 0.05) (Figures 7B,D).
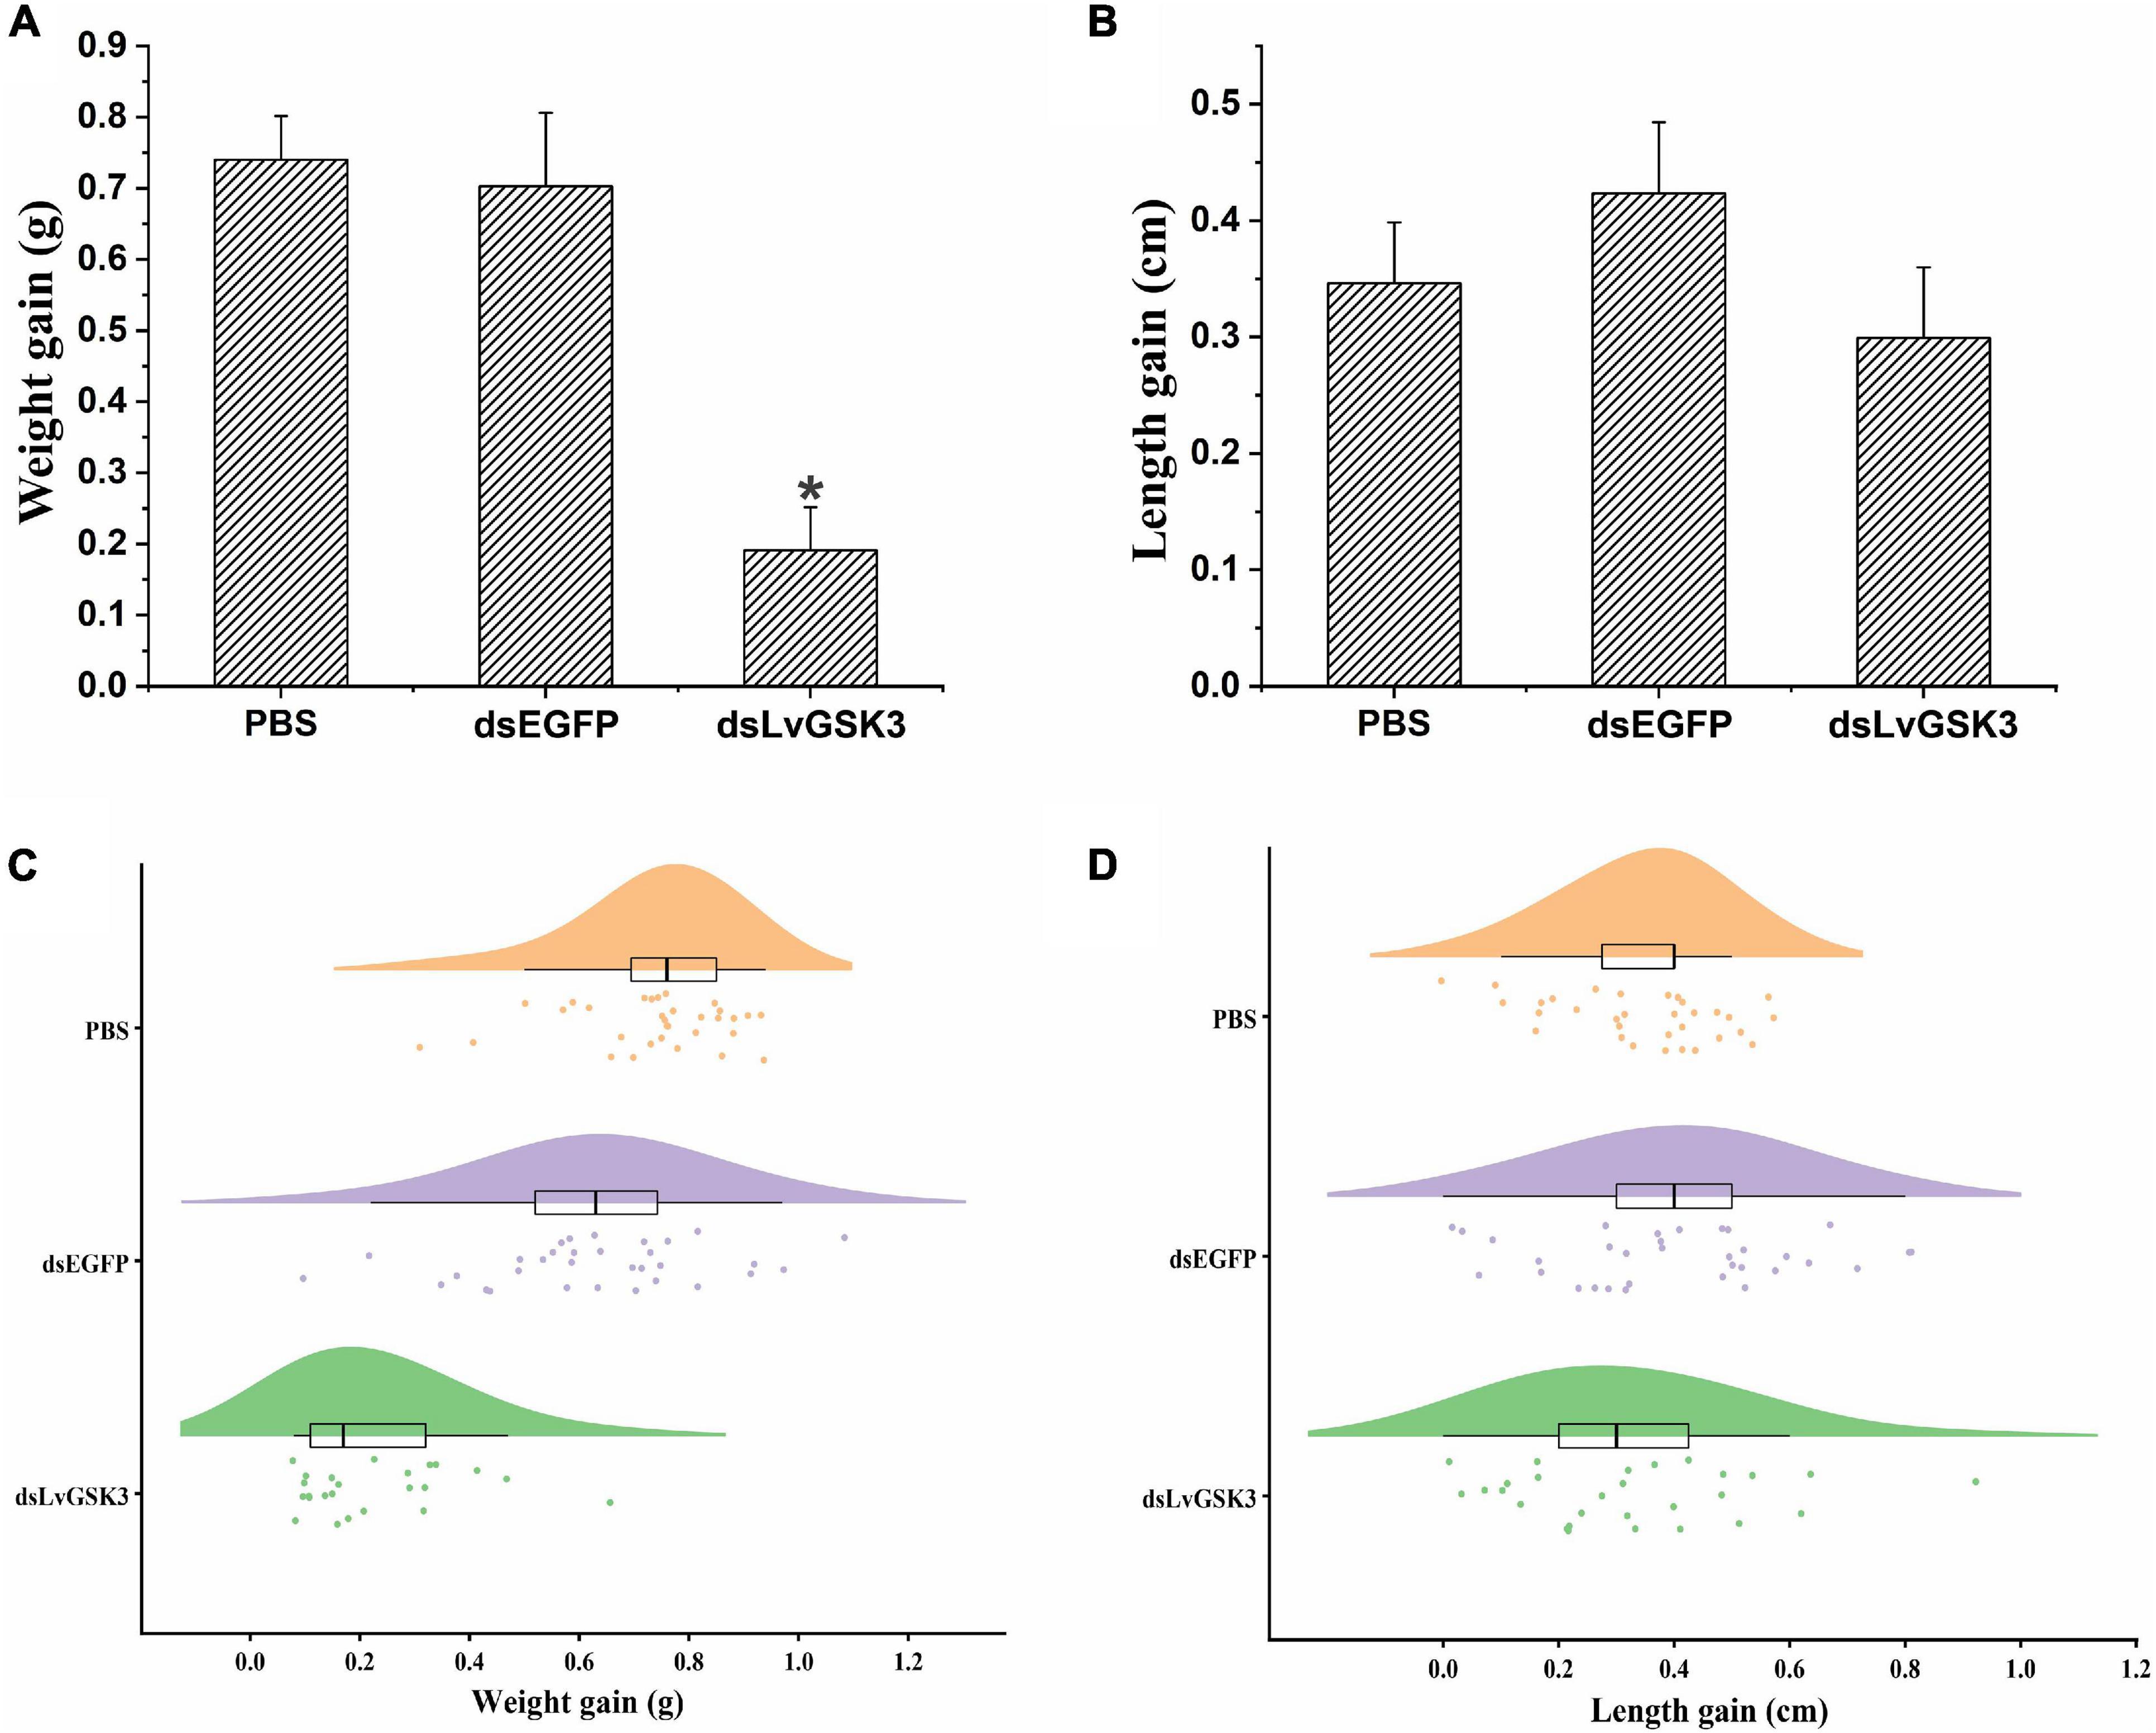
Figure 7. The growth of L. vannamei after LvGSK3 RNAi. (A) The increase in body weight after LvGSK3 RNAi. (B) The increase in body length after LvGSK3 RNAi. (C) The raincloud figure reflected the increase in body weight after LvGSK3 RNAi. (D) The raincloud figure reflected the increase in body length after LvGSK3 RNAi. The results were based on three independent biological replicates and are shown as mean values ± SD. Significant differences of the gene expression levels between three treatments are shown as *p < 0.05.
Subsequently, the relative expression levels of muscle-related genes (actin and myosin) and ecdysis-related genes (EcR, RXR, LvE75, Br-C, and Ftz-F1) were detected. The results showed that the relative expression levels of actin and myosin were both significantly lower than the EGFP and PBS groups (Figure 8A). The expression of molting-related genes was more complicated; EcR and RXR belong to the upstream of ecdysone pathway, which regulate the ecdysone response genes such as Br-C, E75, and Ftz-F1 (Song et al., 2017). The relative expression levels of EcR and Br-C of LvGSK3 interference group are significantly lower than that of two control groups; while that of RXR and Ftz-F1 both have a little bit raised expression but not significant; and the relative expression level of E75 in the LvGSK3 interference group is approximately equal to that of the PBS group and significantly higher than EGFP group (Figure 8B).
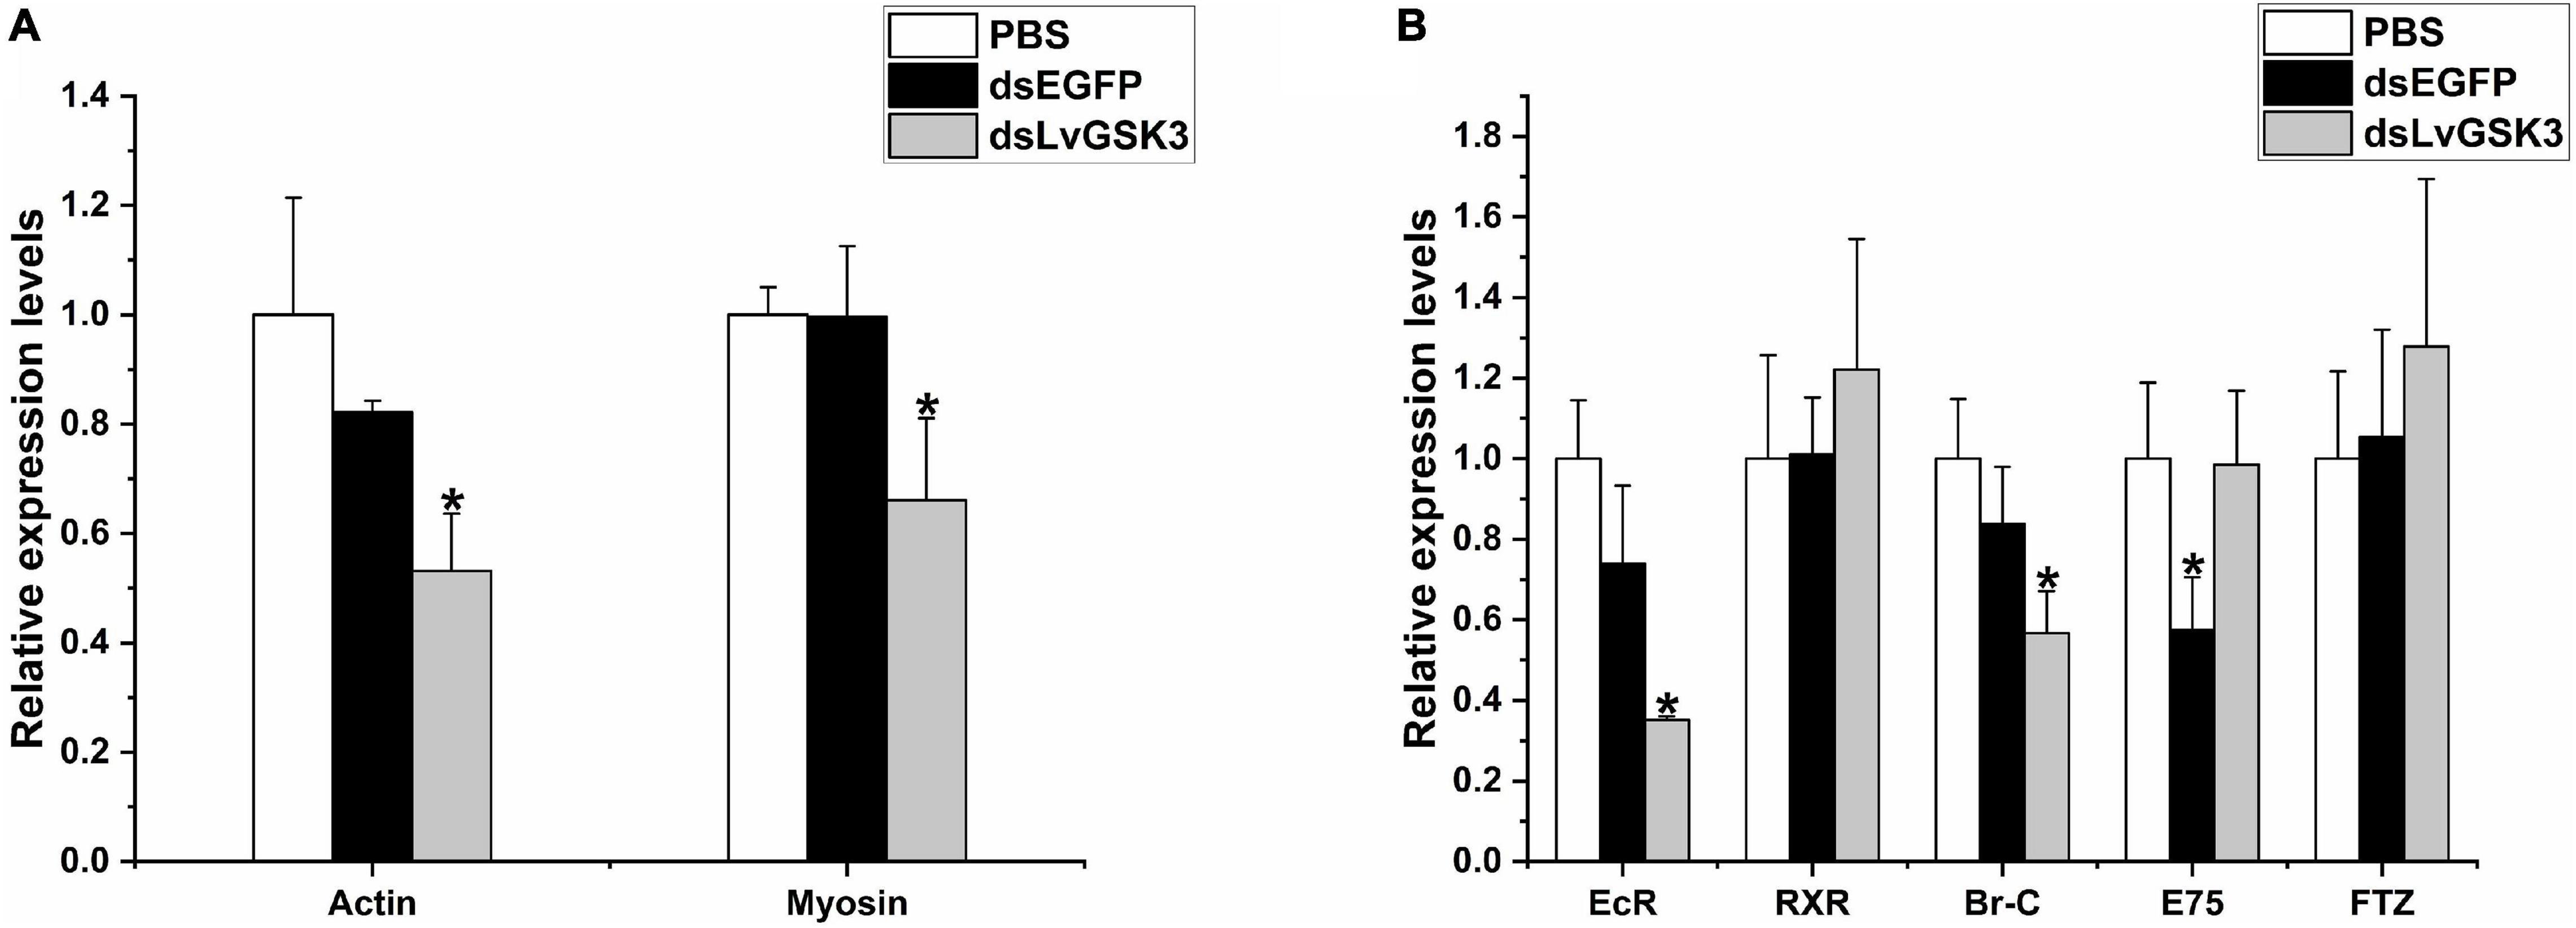
Figure 8. The expression level of growth- and molting-related genes in LvGSK3 RNAi samples. (A) The relative expression level of growth-related genes. (B) The relative expression level of molting-related genes. The results were based on three independent biological replications and showed at mean values ± SD. Significant differences of the gene expression levels between three treatments are shown as *p < 0.05.
Discussion
Structure Characteristics of LvGSK3
In the present study, the gene structure and expression characteristics of LvGSK3 identified from the L. vannamei genome were analyzed. The pI of deduced LvGSK3 protein is 8.88, so LvGSK3 is an alkaline protein, like most species. Lys83, Asn184, and Asp198 are highly conserved, which indicates that these residues play a key role in enzyme catalysis (Pierce and Kimelman, 1995).
GSK3 is a unique kinase, the inactivation of GSK3 is caused by the phosphorylation of its substrates, which is different from other kinases (Harwood, 2001; Doble and Woodgett, 2003; Rayasam et al., 2009). Additionally, it has a unique substrate specificity, many of them require phosphorylated Ser/Thr residues, called “priming phosphate.” This priming phosphate is located at the C-terminal four amino acids of the phosphorylation site (Frame et al., 2001; Harwood, 2001; Doble and Woodgett, 2003). In terms of the 3D structure of LvGSK3, there is a short α-helix between the fifth and sixth strands of the barrel topologically (Knighton et al., 1991; Dajani et al., 2001). Besides, the α-helix contains only two turns, which is shorter than that of other kinases. The α-helix at the end of the seventh strand acts as a bridge between the N-terminal domain and the rest of the domain (Zhang et al., 1994; Wang et al., 1997; Dajani et al., 2001). The α-helix structures are the mainly component of the C-terminus of the polypeptide. In the LvGSK3, a phosphorylation site (Tyr214) exists in the activation segment (208-GEPNVSYICSR-218). This residue is equivalent to Tyr185 in the activation segment of MAP kinases (180-GFLTEYVATR-188) (Robbins et al., 1993) and Tyr216 in the activation segment of H. sapiens GSK3β (Hughes et al., 1993). Compared with GSK3β, a comparable conformation for a pTyr214 would be possible in LvGSK3, with the tyrosyl phosphate group interacting with Arg218 and Arg221, and the topological equivalent of Arg220 and Arg 192 in GSK3β, which allows full access to the P+4-binding site (Dajani et al., 2001). Combined with the analysis of GSK3β, we can infer that LvGSK3 Tyr214 phosphorylation is generally considered to be an intramolecular autophosphorylation mechanism. Phosphorylated Tyr214 would facilitate improving the activity of the phosphorylated substrate and make it easier for the substrate to bind to the active pocket. However, Tyr214 of unphosphorylated GSK3 does not block the entry of the substrate into the conformation, suggesting that Tyr214 could only assist substrate phosphorylation, which is not a prerequisite for kinase activity. Meanwhile, further studies have shown that phosphorylated Tyr216 could increase the activity of GSK3 by five times. On the contrary, when Tyr216 becomes Phe216, the activity of GSK3β will be reduced by 5–10 times (Hughes et al., 1993; Dajani et al., 2001). Therefore, the phosphorylated Tyr214 is also deduced to have a positive effect on LvGSK3 activity.
As for the phosphoprotein-binding pocket, it is a T-loop region composed of three positive charge residues, Arg94, Arg178, and Lys203 (Figure 3B). Since the shape of the region like a pocket, it was named “phosphoprotein-binding pocket.” The three residues (Arg94, Arg178, and Lys203) are conserved in all GSK3 homologs identified so far, which indicated that the phosphate-binding domain and the substrate specificity of GSK3 are conserved in all organisms (Frame et al., 2001). This region contains the conformational sites that bind to primed phosphorylation substrates and an important phosphorylation regulatory site, Tyr214 in LvGSK3 (Figure 3A). The structure of LvGSK3 is very similar to that of vertebrate GSK3β, thus we could deduce that there is a certain correlation between their functions.
Phylogeny of LvGSK3
Through phylogenetic analysis, LvGSK3 first clusters with the GSK3β/shaggy of malacostracans. This cluster combines with five GSK3β/shaggy sequences from insects and four GSK3β sequences from branchiopods to form a large branch. Next, this branch is closely related to GSK3β of mollusks and vertebrates (human and zebrafish) and is the furthest related to spongia. According to the phylogenetic tree, GSK3β isoform presents in most invertebrate. In vertebrates, GSK3α has a large number of highly conserved Gly residues at the N-terminus, which is a unique feature compared with the GSK3β and GSK3s of invertebrate species (Kannoji et al., 2008). In this study, LvGSK3 has no glycine-rich extension at its N-terminus (Figure 2). These characteristics indicate that LvGSK3 is relatively close to GSK3β. Additionally, GSK3β isoform (XP_013780561.1) exists in the horseshoe crab, Limulus polyphemus, which is one of the most ancient arthropods. So, GSK3β may be an ancient form, and the differentiation of GSK3α and GSK3β in vertebrates should have occurred later. The SMART analysis showed that the S_TKc domain was highly conserved in L. polyphemus. In rat, some researches have shown that GSK3β can also substitute for several shaggy functions, suggesting its conservation (Siegfried et al., 1992; Ruel et al., 1993; Welsh et al., 1996).
Interestingly, GSK3 sequences of malacostracans in Figure 1 are shown in a separate cluster from branchiopods, which are also crustaceans. In the Pancrustacea taxon (von Reumont et al., 2012; Rota-Stabelli et al., 2013), Malacostraca and Branchiopoda are two large Class/Subclass of Crustacea (Subphylum), although branchiopods were usually considered the sister group to the remaining crustaceans, it has been widely accepted that crustaceans are paraphyletic group, and Branchiopoda are thought to be the sister clade of Xenocarida (Remipedia and Cephalocarida) and Hexapoda (insects and their relatives) (Andrew, 2011; Rota-Stabelli et al., 2013). Thus, GSK3 genes of malacostracans and a cirripedia were shown in a separate cluster from branchiopods in this study.
Possible Functions of LvGSK3
GSK3s (GSK3α/β) have diverse functions via acting on a variety of substrates, these substrates usually follow a simple pattern: substrates negatively regulated by GSK3-mediated phosphorylation promote a proliferative/survival status, whereas substrates positively regulated by GSK3 favor a more differentiated functional state (Cole, 2012). Low GSK3 activity not only promotes proliferation but also prevents differentiation (Doble et al., 2007). Additionally, GSK3 plays an important role in cell survival. When GSK3 activity is low, many apoptosis-related GSK3 substrates are activated, and promoted the cell survival by reducing phosphorylation of substrates and protect them against ubiquitin/proteasome-mediated degradation (Cole, 2012).
Through the prediction of transcription factors, we suppose that the functions of LvGSK3 may be divided into four main aspects, including transcription regulation, muscle growth and development, ecdysis process, and immunity (Figure 4). In this study, that the relative expression levels of actin and myosin were both significantly decreased in GSK3 interference group. Actin and myosin are the main muscle constituent proteins. Decreased expression levels of actin and myosin suggested the reduction of muscle protein synthesis or the occurrence of muscle atrophy (Qian et al., 2014). Combining the results above, we believe that LvGSK3 might be a key factor in growth, and the inactivation of LvGSK3 can inhibit the growth of L. vannamei.
Molting is an important physiological process in the growth and development of crustaceans. By analyzing the expression levels of molting-related genes in LvGSK3 RNA interference group, it can be found that GSK3 could significantly affect the expression of EcR and Br-C in shrimp. For the phenotypic, the body length increment of LvGSK3 RNAi group was lower than EGFP and PBS groups (Figure 7B), which indicated that EcR and Br-C were inhibited when LvGSK3 was knockdown, and the molting rate was reduced, so the body length increment of shrimp was lower than those of two control groups. However, the decline trend of body length increment was not significant, and the expression levels of RXR and Ftz-F1 were increased slightly, which indicated that LvGSK3 might work in the downstream of RXR and Ftz-F1 transcriptional regulation and give negative feedback to some molting-related genes.
Molting Stage Selection and Sampling
In this study, it is particularly noteworthy that molting stage is important data since LvGSK3 might conduct negative feedback on some molting-related genes. The premolt phase (generally subdivided into D0, D1, D2, D3, and D4) is the longest period. During early premolt phase, shrimp lose the connection between living tissue and extracellular cuticles. Through a series of physiological activities, such as somatic muscle atrophy, resorption of the old exoskeleton, and formation of a new exoskeleton under molting fluid then occur in preparation for ecdysis (Gao et al., 2015). The shrimp in the premolt D1–D2 stage were chose to conduct the first RNAi injection experiment. First, the D1–D2 stage is early premolt phase, so, interfering LvGSK3 at this stage might contribute to study the effect of this gene on molting. Second, the premolt phase is the longest period and comprises up to two-thirds of the molting cycle, shrimp in the D1–D2 stage are more readily available. Third, after D1–D2 stage, the shrimp form a new exoskeleton under molting fluid and are about to molt, which can heal the wound left by the injection and prevent them from getting infected by pathogens.
In order to study the effect of GSK gene on shrimp growth, muscle and ventral nerve were selected as samples for interference efficiency detection. The ventral nerve receives and processes descending signals from the brain to produce a variety of coordinated motorial outputs (Allen et al., 2020). It controls muscles in unique ways. Because there is a close connection between the ventral nerve and the muscle, detection of GSK3 expression in the ventral nerve could more fully reflect the effect of GSK3 on the muscle (Bidaye et al., 2014; Chen et al., 2018; Mamiya et al., 2018). On the other hand, the expression profile of different tissues showed that the ventral nerve expression was higher, combined with its good availability, the ventral nerve determination was important and considered in the study.
Conclusion
In this study, LvGSK3 gene were identified and characterized using the data obtained from genome and transcriptome of L. vannamei. LvGSK3 present the same highly conserved domain observed in all GSK3 family members, and may belong to the GSK3β family as most invertebrates. RNA interference experiment showed that LvGSK3 was definitively involved in L. vannamei growth and molting, and LvGSK3 could promote the growth of shrimp. Finally, our findings provide a valuable basis for studying the role of GSK3 gene in the growth and molting of crustacean.
Data Availability Statement
The datasets presented in this study can be found in online repositories. The names of the repository/repositories and accession number(s) can be found in the article/Supplementary Material.
Ethics Statement
This animal study was reviewed and approved by the Institute of Oceanology, Chinese Academy of Sciences of Ethics Committee.
Author Contributions
XJZ and FL conceived and designed the study. YP, XJZ, and MS conducted all experiments, collected the data, and conducted the bioinformatics analyses. YP and XJZ wrote the manuscript. XXZ and JY revised the manuscript. All authors have read and agreed to the published version of the manuscript.
Funding
This work was supported by the National Key R&D Program of China (2018YFD0900404 and 2018YFD0900103), the National Natural Sciences Foundation of China (31972782, 41876167, and 31672632), and the Strategic Priority Research Program of the Chinese Academy of Sciences (Grant No. XDA24030105).
Conflict of Interest
The authors declare that the research was conducted in the absence of any commercial or financial relationships that could be construed as a potential conflict of interest.
Acknowledgments
We thank Yue Jin and Mingzhe Sun for their help in the RNA interference experiment and language editing.
Supplementary Material
The Supplementary Material for this article can be found online at: https://www.frontiersin.org/articles/10.3389/fmars.2021.681966/full#supplementary-material
Footnotes
- ^ https://bioedit.software.informer.com/7.2/
- ^ https://www.ncbi.nlm.nih.gov/orffinder/
- ^ http://web.expasy.org/translate/
- ^ http://smart.embl-heidelberg.de/
- ^ https://swissmodel.expasy.org/
- ^ https://servicesn.mbi.ucla.edu/SAVES/
- ^ https://www.megasoftware.net/
- ^ https://itol.embl.de/
- ^ http://bioinfo.life.hust.edu.cn/AnimalTFDB/
- ^ https://www.originlab.com/
- ^ https://github.com/CJ-Chen/TBtools
- ^ http://primer3plus.com/
- ^ https://www.ibm.com/cn-zh/analytics/spss-statistics-software
- ^ https://www.uniprot.org/
References
Allen, A. M., Neville, M. C., Birtles, S., Croset, V., Treiber, C. D., Waddell, S., et al. (2020). A single-cell transcriptomic atlas of the adult Drosophila ventral nerve cord. Elife 9:e54074. doi: 10.7554/eLife.54074
Andrew, D. R. (2011). A new view of insect-crustacean relationships II. Inferences from expressed sequence tags and comparisons with neural cladistics. Arthropod Struct. Dev. 40, 289–302. doi: 10.1016/j.asd.2011.02.001
Bidaye, S. S., Machacek, C., Wu, Y., and Dickson, B. J. (2014). Neuronal control of Drosophila walking direction. Science 344, 97–101. doi: 10.1126/science.1249964
Chen, C. L., Hermans, L., Viswanathan, M. C., Fortun, D., Aymanns, F., Unser, M., et al. (2018). Imaging neural activity in the ventral nerve cord of behaving adult Drosophila. Nat. Commun. 9:4390. doi: 10.1038/s41467-018-06857-z
Cole, A. R. (2012). GSK3 as a sensor determining cell fate in the brain. Front. Mol. Neurosci. 5:4. doi: 10.3389/fnmol.2012.00004
Dajani, R., Fraser, E., Roe, S. M., Young, N., Good, V., Dale, T. C., et al. (2001). Crystal structure of glycogen synthase kinase 3 beta: structural basis for phosphate-primed substrate specificity and autoinhibition. Cell 105, 721–732. doi: 10.1016/s0092-8674(01)00374-9
Dierick, H., and Bejsovec, A. (1999). Cellular mechanisms of wingless/Wnt signal transduction. Curr. Top. Dev. Biol. 43, 153–190. doi: 10.1016/s0070-2153(08)60381-6
Doble, B. W., and Woodgett, J. R. (2003). GSK-3: tricks of the trade for a multi-tasking kinase. J. Cell Sci. 116(Pt 7), 1175–1186. doi: 10.1242/jcs.00384
Doble, B. W., Patel, S., Wood, G. A., Kockeritz, L. K., and Woodgett, J. R. (2007). Functional redundancy of GSK-3alpha and GSK-3beta in Wnt/beta-catenin signaling shown by using an allelic series of embryonic stem cell lines. Dev. Cell 12, 957–971. doi: 10.1016/j.devcel.2007.04.001
Frame, S., and Cohen, P. (2001). GSK3 takes centre stage more than 20 years after its discovery. Biochem. J. 359(Pt 1), 1–16. doi: 10.1042/0264-6021:3590001
Frame, S., Cohen, P., and Biondi, R. M. (2001). A common phosphate binding site explains the unique substrate specificity of GSK3 and its inactivation by phosphorylation. Mol. Cell 7, 1321–1327. doi: 10.1016/s1097-2765(01)00253-2
Gao, Y., Zhang, X., Wei, J., Sun, X., Yuan, J., Li, F., et al. (2015). Whole transcriptome analysis provides insights into molecular mechanisms for molting in Litopenaeus vannamei. PLoS One 10:e0144350. doi: 10.1371/journal.pone.0144350
Harwood, A. J. (2001). Regulation of GSK-3: a cellular multiprocessor. Cell 105, 821–824. doi: 10.1016/s0092-8674(01)00412-3
Huang, X., and Madan, A. (1999). CAP3: a DNA sequence assembly program. Genome Res. 9, 868–877. doi: 10.1101/gr.9.9.868
Hughes, K., Nikolakaki, E., Plyte, S. E., Totty, N. F., and Woodgett, J. R. (1993). Modulation of the glycogen synthase kinase-3 family by tyrosine phosphorylation. Embo. J. 12, 803–808.
Hur, E. M., and Zhou, F. Q. (2010). GSK3 signalling in neural development. Nat. Rev. Neurosci. 11, 539–551. doi: 10.1038/nrn2870
Kannoji, A., Phukan, S., Sudher Babu, V., and Balaji, V. N. (2008). GSK3beta: a master switch and a promising target. Expert Opin. Ther. Targets 12, 1443–1455. doi: 10.1517/14728222.12.11.1443
Kim, L., and Kimmel, A. R. (2000). GSK3, a master switch regulating cell-fate specification and tumorigenesis. Curr. Opin. Genet. Dev. 10, 508–514. doi: 10.1016/s0959-437x(00)00120-9
Knighton, D. R., Zheng, J. H., Ten Eyck, L. F., Ashford, V. A., Xuong, N. H., Taylor, S. S., et al. (1991). Crystal structure of the catalytic subunit of cyclic adenosine monophosphate-dependent protein kinase. Science 253, 407–414. doi: 10.1126/science.1862342
Li, J., and Nam, K. H. (2002). Regulation of brassinosteroid signaling by a GSK3/SHAGGY-like kinase. Science 295, 1299–1301. doi: 10.1126/science.1065769
Li, X., Jia, Z., Wang, W., Wang, L., Liu, Z., Yang, B., et al. (2017). Glycogen synthase kinase-3 (GSK3) regulates TNF production and haemocyte phagocytosis in the immune response of Chinese mitten crab Eriocheir sinensis. Dev. Comp. Immunol. 73, 144–155. doi: 10.1016/j.dci.2017.03.022
Livak, K. J., and Schmittgen, T. D. (2001). Analysis of relative gene expression data using real-time quantitative PCR and the 2(-Delta Delta C(T)) Method. Methods 25, 402–408. doi: 10.1006/meth.2001.1262
Mamiya, A., Gurung, P., and Tuthill, J. C. (2018). Neural coding of leg proprioception in Drosophila. Neuron 100, 636–650.e6. doi: 10.1016/j.neuron.2018.09.009
McManus, E. J., Sakamoto, K., Armit, L. J., Ronaldson, L., Shpiro, N., Marquez, R., et al. (2005). Role that phosphorylation of GSK3 plays in insulin and Wnt signalling defined by knockin analysis. Embo. J. 24, 1571–1583. doi: 10.1038/sj.emboj.7600633
Nakagawa, Y., and Henrich, V. C. (2009). Arthropod nuclear receptors and their role in molting. FEBS J. 276, 6128–6157. doi: 10.1111/j.1742-4658.2009.07347.x
Pierce, S. B., and Kimelman, D. (1995). Regulation of Spemann organizer formation by the intracellular kinase Xgsk-3. Development 121, 755–765.
Plyte, S. E., Hughes, K., Nikolakaki, E., Pulverer, B. J., and Woodgett, J. R. (1992). Glycogen synthase kinase-3: functions in oncogenesis and development. Biochim. Biophys. Acta 1114, 147–162. doi: 10.1016/0304-419x(92)90012-n
Qian, Z., He, S., Liu, T., Liu, Y., Hou, F., Liu, Q., et al. (2014). Identification of ecdysteroid signaling late-response genes from different tissues of the Pacific white shrimp, Litopenaeus vannamei. Comp. Biochem. Physiol. A Mol. Integr. Physiol. 172, 10–30. doi: 10.1016/j.cbpa.2014.02.011
Rayasam, G. V., Tulasi, V. K., Sodhi, R., Davis, J. A., and Ray, A. (2009). Glycogen synthase kinase 3: more than a namesake. Br. J. Pharmacol. 156, 885–898. doi: 10.1111/j.1476-5381.2008.00085.x
Robbins, D. J., Zhen, E., Cheng, M., Xu, S., Vanderbilt, C. A., Ebert, D., et al. (1993). Regulation and properties of extracellular signal-regulated protein kinases 1, 2, and 3. J. Am. Soc. Nephrol. 4, 1104–1110.
Rota-Stabelli, O., Lartillot, N., Philippe, H., and Pisani, D. (2013). Serine codon-usage bias in deep phylogenomics: pancrustacean relationships as a case study. Syst. Biol. 62, 121–133. doi: 10.1093/sysbio/sys077
Rubinfeld, B., Albert, I., Porfiri, E., Fiol, C., Munemitsu, S., and Polakis, P. (1996). Binding of GSK3beta to the APC-beta-catenin complex and regulation of complex assembly. Science 272, 1023–1026. doi: 10.1126/science.272.5264.1023
Ruel, L., Bourouis, M., Heitzler, P., Pantesco, V., and Simpson, P. (1993). Drosophila shaggy kinase and rat glycogen synthase kinase-3 have conserved activities and act downstream of Notch. Nature 362, 557–560. doi: 10.1038/362557a0
Siegfried, E., Chou, T. B., and Perrimon, N. (1992). wingless signaling acts through zeste-white 3, the Drosophila homolog of glycogen synthase kinase-3, to regulate engrailed and establish cell fate. Cell 71, 1167–1179. doi: 10.1016/s0092-8674(05)80065-0
Song, Y., Villeneuve, D. L., Toyota, K., Iguchi, T., and Tollefsen, K. E. (2017). Ecdysone receptor agonism leading to lethal molting disruption in arthropods: review and adverse outcome pathway development. Environ. Sci. Technol. 51, 4142–4157. doi: 10.1021/acs.est.7b00480
Sun, M., Li, S., Zhang, X., Xiang, J., and Li, F. (2020). Isolation and transcriptome analysis of three subpopulations of shrimp hemocytes reveals the underlying mechanism of their immune functions. Dev. Comp. Immunol. 108:103689. doi: 10.1016/j.dci.2020.103689
von Reumont, B. M., Jenner, R. A., Wills, M. A., Dell’ampio, E., Pass, G., Ebersberger, I., et al. (2012). Pancrustacean phylogeny in the light of new phylogenomic data: support for Remipedia as the possible sister group of Hexapoda. Mol. Biol. Evol. 29, 1031–1045. doi: 10.1093/molbev/msr270
Wang, Y., and Roach, P. J. (1993). Inactivation of rabbit muscle glycogen synthase by glycogen synthase kinase-3. Dominant role of the phosphorylation of Ser-640 (site-3a). J. Biol. Chem. 268, 23876–23880.
Wang, Z., Harkins, P. C., Ulevitch, R. J., Han, J., Cobb, M. H., and Goldsmith, E. J. (1997). The structure of mitogen-activated protein kinase p38 at 2.1-A resolution. Proc. Natl. Acad. Sci. U.S.A. 94, 2327–2332. doi: 10.1073/pnas.94.6.2327
Wei, J., Zhang, X., Yu, Y., Huang, H., Li, F., and Xiang, J. (2014). Comparative transcriptomic characterization of the early development in Pacific white shrimp Litopenaeus vannamei. PLoS One 9:e106201. doi: 10.1371/journal.pone.0106201
Welsh, G. I., Wilson, C., and Proud, C. G. (1996). GSK3: a SHAGGY frog story. Trends Cell Biol. 6, 274–279. doi: 10.1016/0962-8924(96)10023-4
Windsor Reid, P. J., Matveev, E., McClymont, A., Posfai, D., Hill, A. L., and Leys, S. P. (2018). Wnt signaling and polarity in freshwater sponges. BMC Evol. Biol. 18:12. doi: 10.1186/s12862-018-1118-0
Woodgett, J. R., and Cohen, P. (1984). Multisite phosphorylation of glycogen synthase. Molecular basis for the substrate specificity of glycogen synthase kinase-3 and casein kinase-II (glycogen synthase kinase-5). Biochim. Biophys. Acta 788, 339–347. doi: 10.1016/0167-4838(84)90047-5
Wu, D., and Pan, W. (2010). GSK3: a multifaceted kinase in Wnt signaling. Trends Biochem. Sci. 35, 161–168. doi: 10.1016/j.tibs.2009.10.002
Zammit, P. S. (2017). Function of the myogenic regulatory factors Myf5, MyoD, Myogenin and MRF4 in skeletal muscle, satellite cells and regenerative myogenesis. Semin. Cell Dev. Biol. 72, 19–32. doi: 10.1016/j.semcdb.2017.11.011
Zeng, Z., Ni, J., and Ke, C. (2013). Expression of glycogen synthase (GYS) and glycogen synthase kinase 3β (GSK3β) of the Fujian oyster, Crassostrea angulata, in relation to glycogen content in gonad development. Comp. Biochem. Physiol. B Biochem. Mol. Biol. 166, 203–214. doi: 10.1016/j.cbpb.2013.09.003
Zhang, F., Strand, A., Robbins, D., Cobb, M. H., and Goldsmith, E. J. (1994). Atomic structure of the MAP kinase ERK2 at 2.3 A resolution. Nature 367, 704–711. doi: 10.1038/367704a0
Zhang, X., Yuan, J., Sun, Y., Li, S., Gao, Y., Yu, Y., et al. (2019). Penaeid shrimp genome provides insights into benthic adaptation and frequent molting. Nat. Commun. 10:356. doi: 10.1038/s41467-018-08197-4
Keywords: glycogen synthase kinase 3, Litopenaeus vannamei, growth, molting, structure and function
Citation: Pang Y, Zhang X, Yuan J, Zhang X, Su M and Li F (2021) Glycogen Synthase Kinase 3 Gene Is Important in Growth and Molting of the Pacific White Shrimp Litopenaeus vannamei. Front. Mar. Sci. 8:681966. doi: 10.3389/fmars.2021.681966
Received: 17 March 2021; Accepted: 24 May 2021;
Published: 24 June 2021.
Edited by:
Yong Wang, Institute of Deep-Sea Science and Engineering (CAS), ChinaReviewed by:
Winton Cheng, National Pingtung University of Science and Technology, TaiwanRodrigo Maggioni, Federal University of Ceara, Brazil
Adriana Mulhia, Consejo Nacional de Ciencia y Tecnología (CONACYT), Mexico
Copyright © 2021 Pang, Zhang, Yuan, Zhang, Su and Li. This is an open-access article distributed under the terms of the Creative Commons Attribution License (CC BY). The use, distribution or reproduction in other forums is permitted, provided the original author(s) and the copyright owner(s) are credited and that the original publication in this journal is cited, in accordance with accepted academic practice. No use, distribution or reproduction is permitted which does not comply with these terms.
*Correspondence: Xiaojun Zhang, eGp6aGFuZ0BxZGlvLmFjLmNu