 Chanhyung Jeon1,2
 Jae-Hun Park3*
 Maureen Kennelly4
 Erran Sousa4D. Randolph Watts4
 Eun-Joo Lee3Taewook Park5Thomas Peacock1
- 1Department of Mechanical Engineering, Massachusetts Institute of Technology, Cambridge, MA, United States
- 2Department of Oceanography, Pusan National University, Busan, South Korea
- 3Department of Ocean Sciences, Inha University, Incheon, South Korea
- 4Graduate School of Oceanography, University of Rhode Island, Narragansett, RI, United States
- 5Korea Polar Research Institute, Incheon, South Korea
A current- and pressure-recording inverted echo sounder (CPIES) placed on the sea floor monitors aspects of the physical ocean environment for periods of months to years. Until recently, acoustic telemetry of daily-processed data was the existing method for data acquisition from CPIES without full instrument recovery. However, this approach, which requires positioning a ship at the mooring site and operator time, is expensive and time-consuming. Here, we introduce a new method of obtaining data remotely from CPIES using a popup-data-shuttle (PDS), which enables straightforward data acquisition without a ship. The PDS data subsampled from CPIES has 30–60 min temporal resolution. The PDS has a scheduled pop-up-type release system, so each data pod floats to the sea surface at a user-specified date and relays the recorded data via the Iridium satellite system. We demonstrated the capability of an array of PDS-CPIES via two successful field experiments in the Arctic Ocean. The data acquired through the PDS were in agreement with the fully recovered datasets. An example of the data retrieved from the PDS shows that time-varying signals of tides and high-frequency internal waves were well captured. GPS-tracked trajectories of the PDS floating free at the sea surface can provide insights into ice drift or ocean surface currents. This PDS technology provides an alternative method for remote deep-ocean mooring data acquisition.
Introduction
Deep-sea mooring, an Eulerian method, is typically used to measure oceanic variables at a fixed location. A pressure-recording inverted echo sounder (PIES) or PIES with a current sensor (CPIES), installed on the sea floor, is a well-established and highly reliable tool for long-term monitoring of large-scale ocean flows and has been successfully used in the world’s oceans (Sun and Watts, 2001; Watts et al., 2001b; Book et al., 2002; Zhu et al., 2003; Park et al., 2005; Andres et al., 2008, 2015; Donohue et al., 2010). The CPIES measures the current 50 m above the bottom, as well as bottom pressure and round-trip acoustic travel time from the sea floor to the sea surface (τ).
The PIES or CPIES-measured variables have been used to investigate oceanic barotropic and baroclinic variabilities. For example, in low- and mid-latitude oceans, acoustic travel time has been used to estimate, with remarkable accuracy, time-varying vertical profiles of temperature (Watts and Rossby, 1977; Watts et al., 2001a; Park et al., 2005) and geopotential height (Chiswell et al., 1988; Baker-Yeboah et al., 2009; Park et al., 2012; Behnisch et al., 2013; Donohue et al., 2016; Jeon et al., 2018; Andres et al., 2020). Moreover, a recent field experiment in Sermilik Fjord in Greenland showed the possibility of detecting ice thickness variations using τ (Andres et al., 2015). Observations of bottom pressure conveys a variety of information such as tides, barotropic responses to wind forcing (Park and Watts, 2005b, 2006a; Na et al., 2012, 2016; Zhao et al., 2017; Zheng et al., 2020), and gravity anomalies at the sea bottom (Park et al., 2008). A two-dimensional array of appropriately spaced CPIES can enable the visualization of two- or three-dimensional structures of geostrophic currents and eddies (Tracey et al., 1997; Meinen, 2001; Mitchell et al., 2005; Park et al., 2005; Donohue et al., 2010; Na et al., 2014; Zhao et al., 2020) as well as linear and nonlinear internal wave fields (Park and Watts, 2005a, 2006b; Alford et al., 2015; Zhao et al., 2018; Ramp et al., 2019). Current records allow the investigation of abyssal currents and waves in the deep ocean (Watts et al., 2001b; Park and Watts, 2005a; Park et al., 2010), and bottom pressures and deep currents can both provide referencing to make velocity profiles absolute.
The PIES or CPIES can carry out measurements in the range of approximately 500–6,700 m water depths from periods of months up to 5 years, depending on the measurement schedule and the depth (Donohue et al., 2010). For data acquisition without full instrument recovery, an existing method is acoustic telemetry of in situ processed data, which involves onsite ship surveys (e.g., Chaplin, 1990). That approach requires ship and operator times, skilled techniques, laborious tasks, and substantial costs and thus is costly and time-consuming. As an alternative approach, the University of Rhode Island (URI) has newly developed a cost- and time-effective advanced remote data acquisition method using pop-up data shuttle (PDS) capability (Figure 1). Here, we introduce this PDS system and present its performance through two field experiments conducted in 2017 and 2018 in the western Arctic Ocean. The methodology and economic benefits of the PDS data acquisition system are described, and illustrations are given of the scientific data and broadened applications.
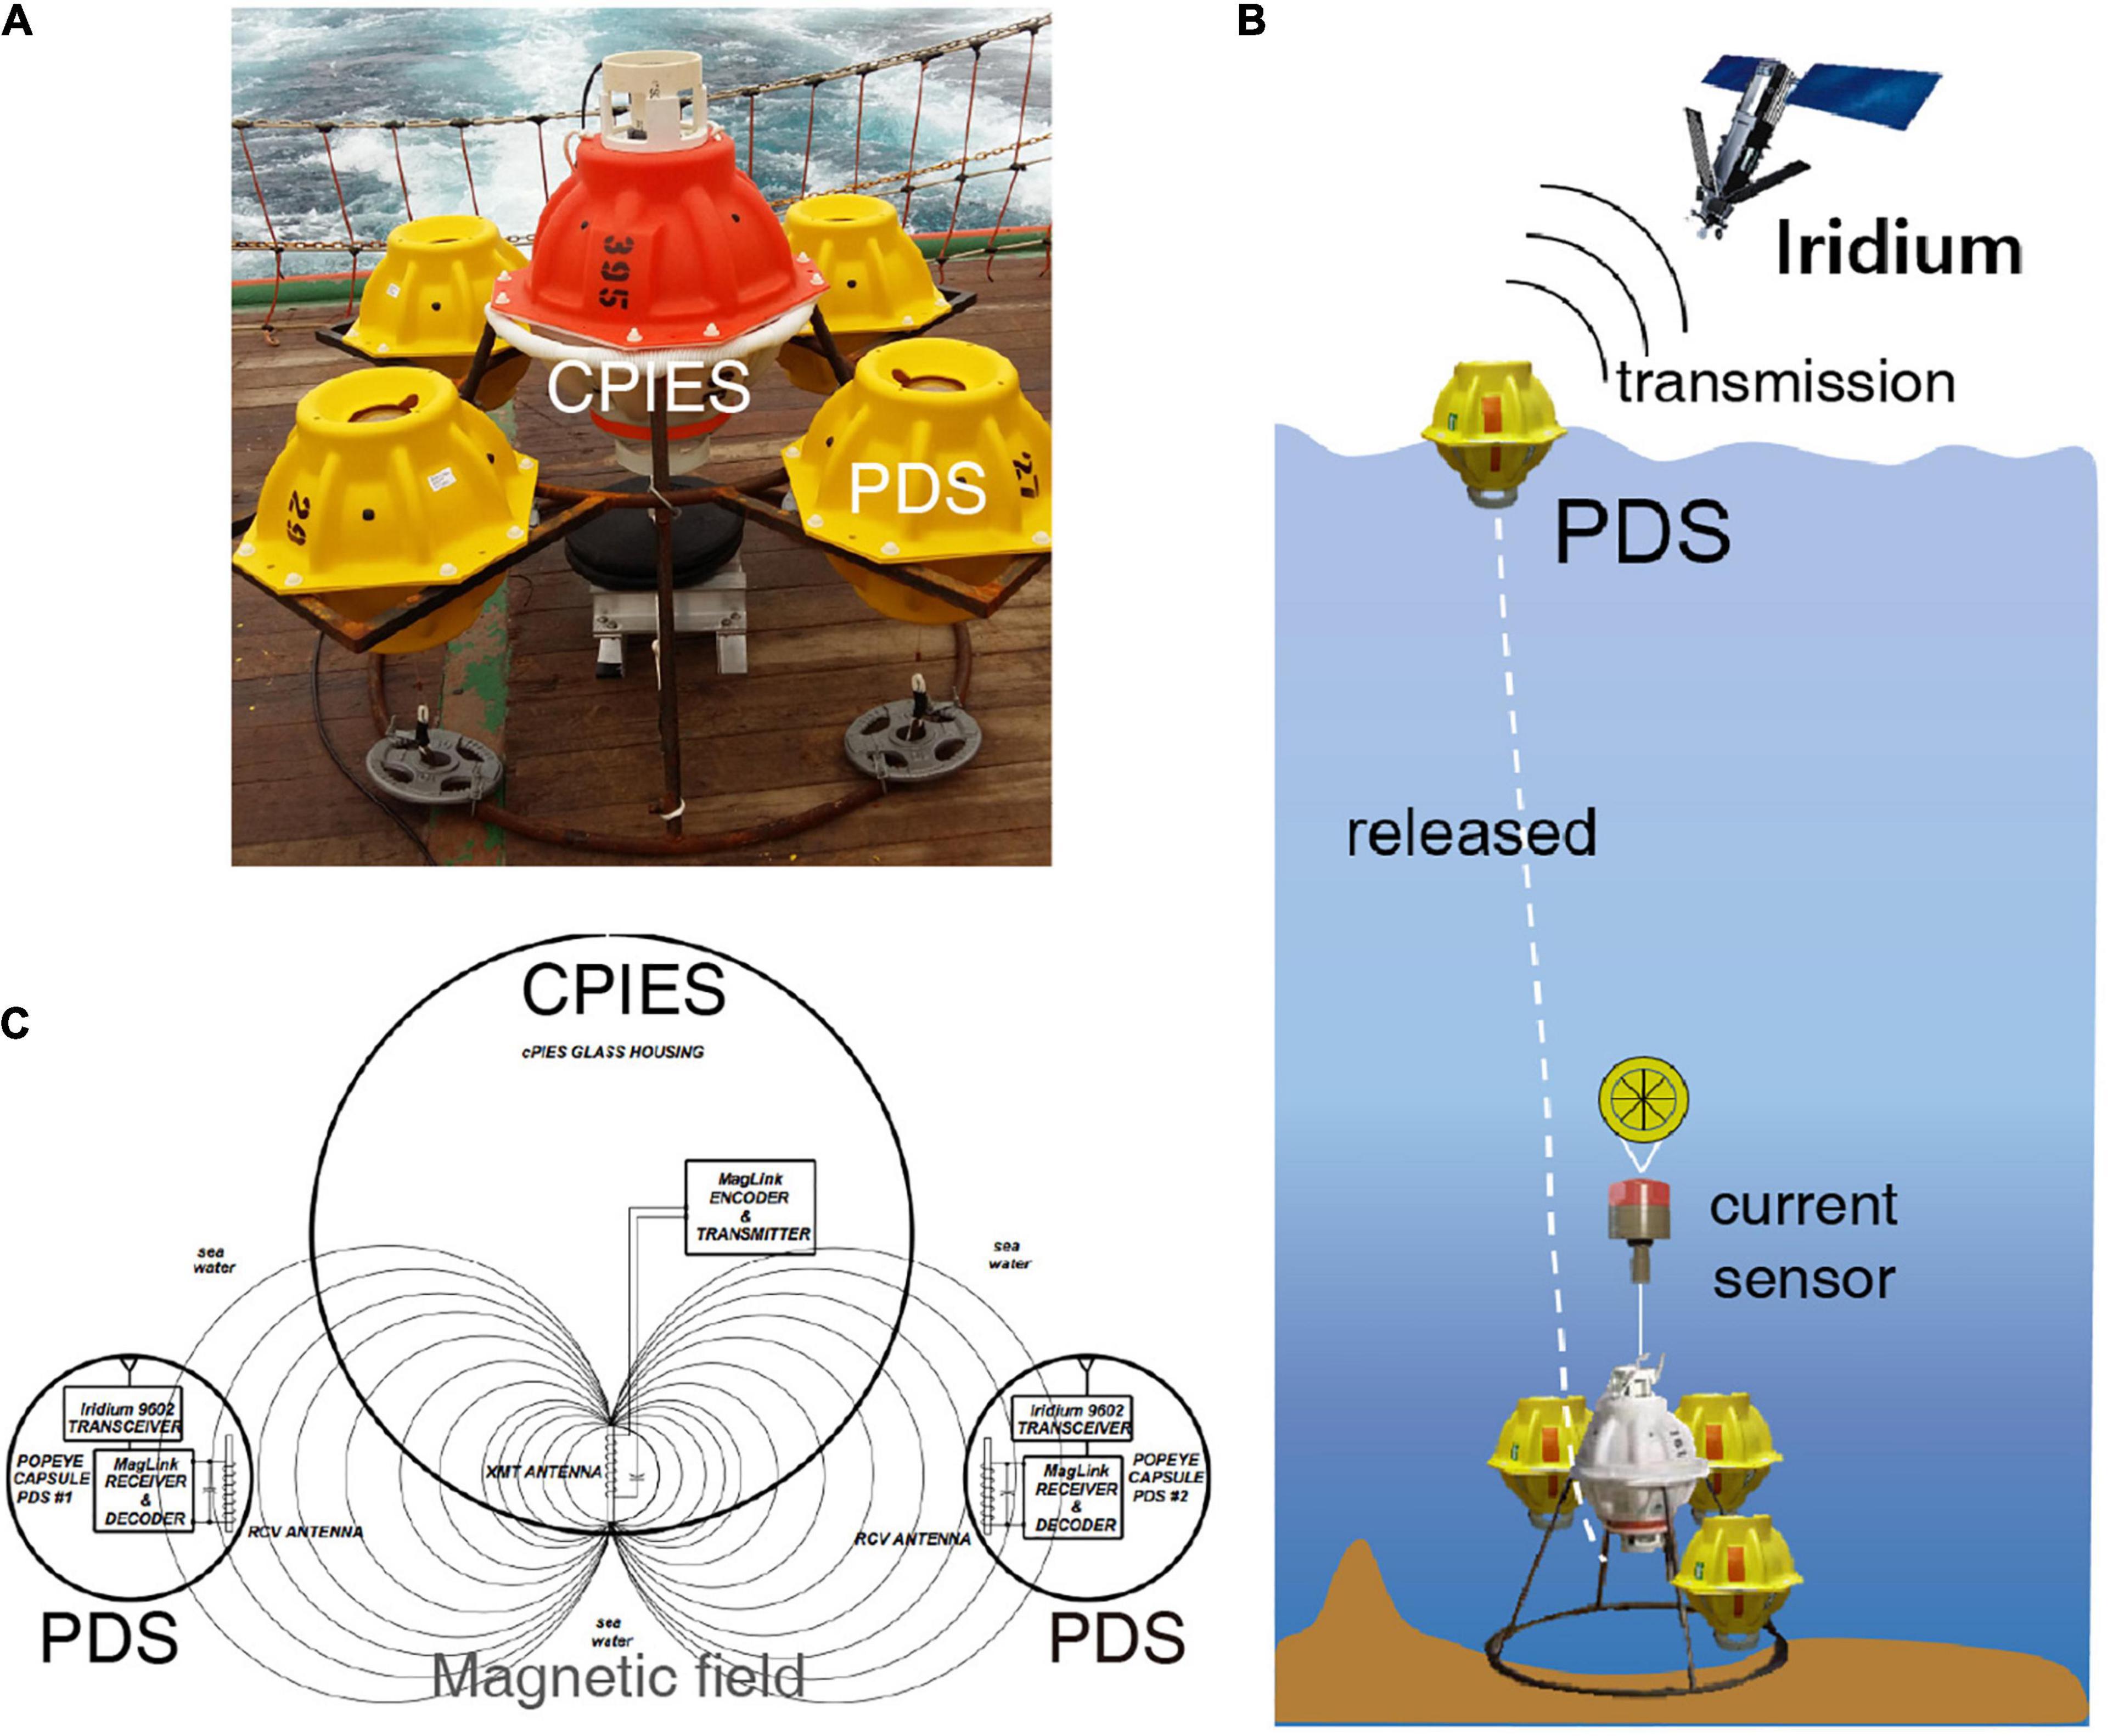
Figure 1. (A) Assembled PDS-CPIES on RV Araon. (B) Concept of PDS operation. (C) Concept of subsea wireless link using magnetic field between CPIES and PDS (selected from PDS manual). PDS, pop-up data shuttle; CPIES, current- and pressure-recording inverted echo sounder.
Pop-Up Data Shuttle Current- and Pressure-Recording Inverted Echo Sounder (PDS-CPIES) Field Experiments in the Arctic Ocean
PDS
The PDS is an add-on device designed for use with PIES or CPIES to retrieve the data remotely (Figure 1A) with a deployment capability of 7,000 m in depth and 4 years in maximum time (deployment capability of PIES or CPIES is 6,700 m in depth and 5 years in maximum time). The PDS using alkaline batteries has no measurement sensors of its own but receives the hourly data broadcast from the PIES or CPIES and floats to the sea surface at a time programmed by the user. Once on the surface, the PDS transmits the recorded data via the Iridium satellite constellation to an email server ashore (Figure 1B). At the sea floor, the PIES or CPIES and a cluster of PDS capsules within a short-range (<2 m) are linked wirelessly through a magnetic field (Figure 1C, copied from the Popeye Data Shuttle User’s Manual, 2021). Data are broadcast from the PIES or CPIES to all PDS capsules within range as time-delay encoded amplitude modulations of the magnetic field. The PIES or CPIES generates a magnetic field by driving a series-tuned ferrite-coil antenna that is mounted inside the PIES or CPIES glass housing. Each PDS capsule is equipped with a magnetic field detector to convert the amplitude modulations of the field into digital signals. For high-quality response, broadcast and receiving antennas are designed as narrow-band pairs, optimizing error-free reception. The received signals at each PDS are decoded and logged to a memory card. For robust performance in ocean environments, the communication is one-way (from PIES or CPIES to PDS) that includes checksum error detection. If an error is detected by the PDS, the received data will still be logged but flagged as failing the checksum validation. This allows the PDS system, which includes the broadcast hardware in the PIES or CPIES and the PDS itself, to be simple (inexpensive and expendable) yet highly reliable. Each PDS has a burn-wire release system that is activated when PDS system time matches the user programmed release time. In addition, the PDS has an Iridium Short Burst Data (SBD) modem to transmit the data to the Iridium satellite constellation and a GPS receiver. Once on the surface, the PDS can be commanded via the Iridium connection to acquire and transmit GPS positions at selected intervals ranging from several minutes up to a week.
Field Experiments
Two field experiments using PDS-CPIES were conducted from 2017/2018 through 2020 in the western Arctic Ocean to monitor heat content changes over the water column, sea-ice thickness, and internal wave activity. These experiments facilitated scientific data capture and PDS performance analysis in extreme circumstances. A total of six sets of PDS-CPIES were deployed in the Arctic Ocean: AES1–AES3 in the Northwind Abyssal Plain (NAP) in August 2017 and AES4–AES6 on the Chukchi shelf slope of the Canada Basin in September 2018 (Figure 2A). All CPIES were deployed with either 3 or 4 PDS. The earliest scheduled release of PDS was ∼1 month after the deployment to confirm the capability of PDS and CPIES operation and to be free from the interference of freezing sea-ice in October. Other PDSs were programmed to release after 1 or 2 years to obtain long-term data. The PDS release schedules are indicated in Figure 2B with gray triangles. One recovery cruise with the icebreaker RV Araon occurred in late August 2020, during which all six CPIES were successfully recovered, along with full data records.
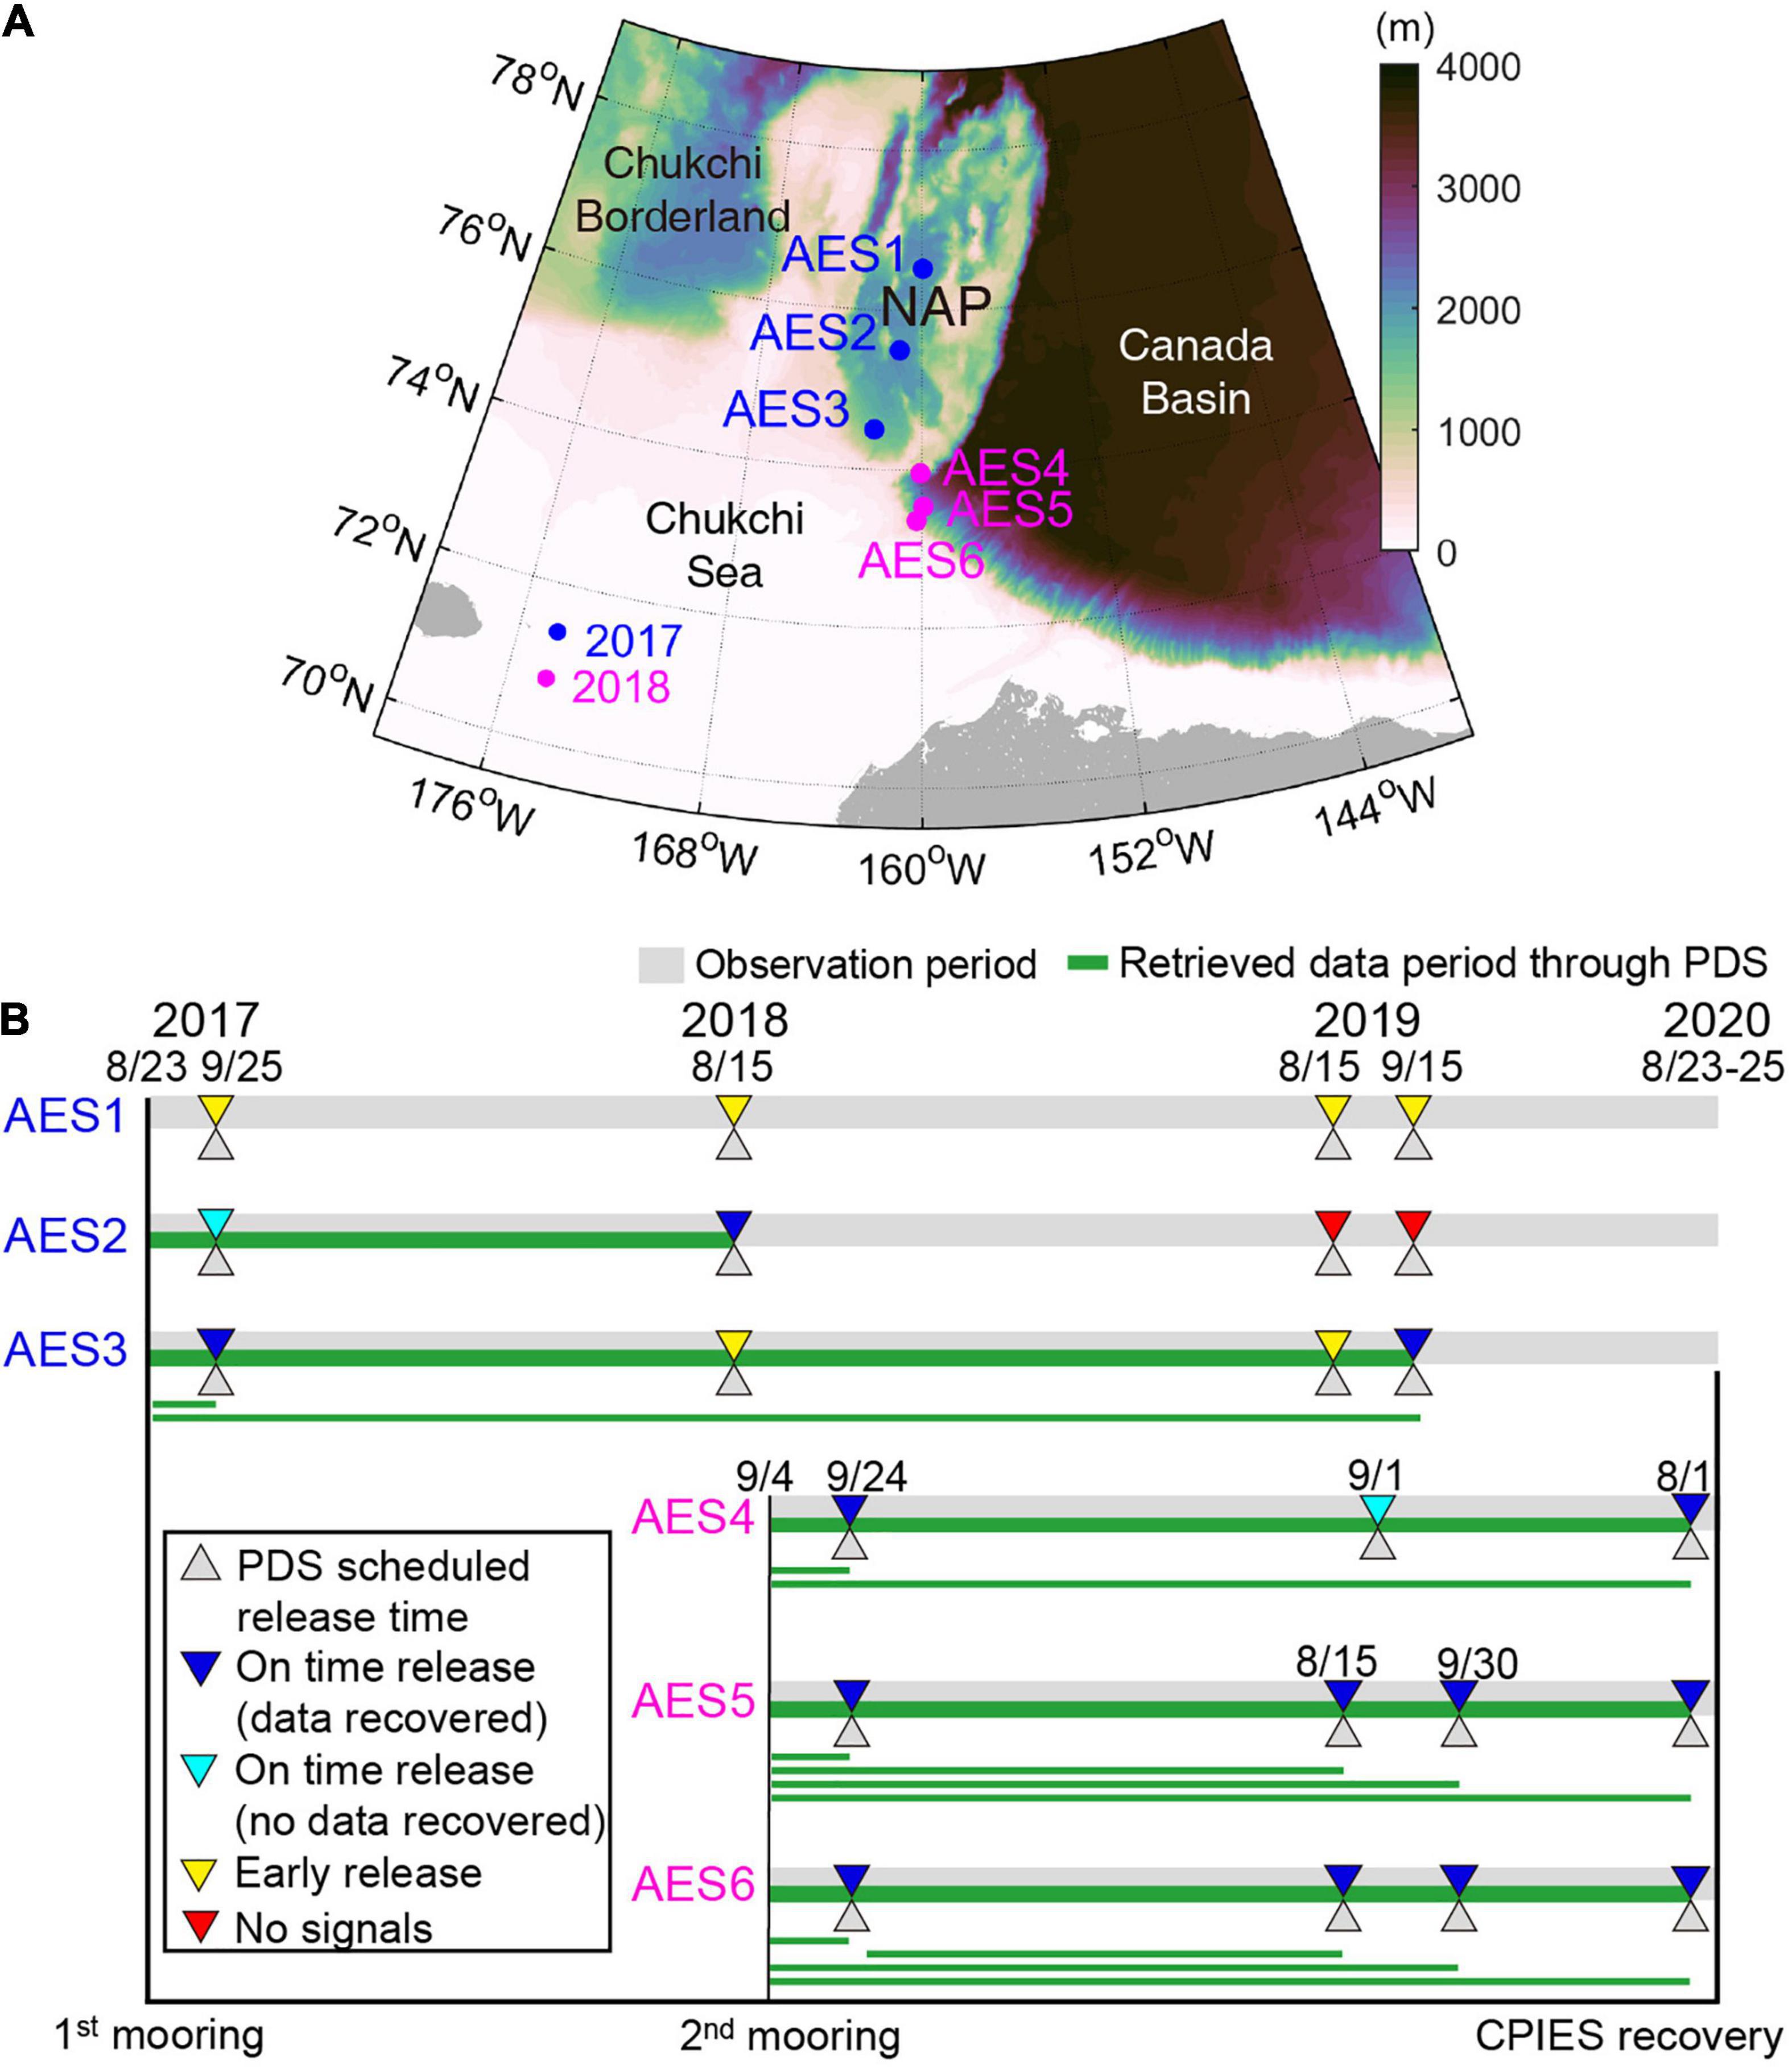
Figure 2. (A) Location of PDS-CPIES deployment in the western Arctic Ocean. Blue and magenta circles indicate locations in 2017 and 2018, respectively. Background colors indicate bathymetry every 100 m. NAP: Northwind Abyssal Plain. (B) Timeline of CPIES observation and PDS operation time. Gray and green lines indicate the duration of CPIES observation and retrieved data period through PDS, respectively. Thin green lines indicate the retrieved data period through individual PDSs. Triangles indicate PDS-related information; gray triangles are the scheduled PDS release time, whereas inverted blue (and cyan) triangles indicate on-time PDS release with success (and failure) of remote data retrieval. Inverted yellow (and red) triangles indicate the failure of on-time release of PDS with early release (and no signals). Substantial system-upgrades addressed problems observed with the 2017 deployment, producing much better performance in 2018.
The measurement settings of the deployed CPIES are as follows: τ measured 96 pings per hour with an accuracy of 0.05 ms, whereas the current and bottom pressure values were measured every 30 min. The Aanderaa Doppler current-meter (ZPulse model 4930 DW; Aanderaa Data Instruments, Bergen, Norway) has a speed range of 0–300 cm s–1 in a detected direction. The pressure sensor was a Paroscientific Digiquartz model 410K-101 with an accuracy of ±0.01% FS and 0.001 dbar (Paroscientific, Inc., Redmond Washington). The obtained PDS data consisted of hourly τ (1st quartile value after windowing outliers) and 30-min-interval current and bottom pressure readings.
Performance of the PDS System
PDS Release System
First Deployments in 2017
A total of 12 Model 3F PDSs were deployed during the first (i.e., 2017) experiment (Figure 2B) after successful prelaunch tests. The PDS includes a feature that it will start the release process if it does not receive valid data from the host CPIES for six successive hours. This feature affected 6 of the 2017 deployed PDSs (inverted yellow triangles in Figure 2B): four popped up within 3 days of the deployment and two additional PDSs were released within 30 days of deployment, hence 6 of 12 were much earlier than programmed. In addition, two PDSs on AES2 did not send any signals even after the time of the CPIES recovery (inverted red triangles). Four PDSs released on time (inverted blue and cyan triangles), and we remotely acquired the CPIES-transmitted data from three of those. The fourth PDS had system reset issues on the surface and no useful data were recovered. The data are transmitted Last In First Out (LIFO). When the PDS resets, the file pointer is lost and the PDS repeats data previously transmitted. A command was transmitted to the PDS via Iridium to stop further data transmission. Due to the problems of communication between the CPIES and PDSs at depth and subsequent early release in the first (i.e., 2017) experiment, technical issues were identified and addressed by upgrading firmware and hardware on both the PDS and the transmitting hardware mounted inside of the CPIES.
Second Deployments in 2018
After the firmware and hardware modifications of the PDS-CPIES, an array of three PDS-CPIES with a total of 11 Model 3G PDSs were deployed during the second (i.e., 2018) experiment (Figure 2B). All PDSs released as scheduled, although one PDS did not successfully send its data due to repeated resets on the sea surface. Based on the results of the two experiments, the PDS system has been further improved for robustness and reliability.
Data Transmission and Acquisition
To examine the data transmission performance from CPIES to the email server ashore, we calculated the data acquisition rate through comparison of the internally saved data in CPIES (after recovery and processed as described in Kennelly et al., 2007) and the remotely retrieved data (via PDS). Bottom pressure and current time series were used for this comparison, because although τ was properly recorded in the CPIES, the internal processing of τ for transmittal to the PDS was only done correctly in the 2018 experiment. Figure 3A presents the averaged data acquisition rates in the first and second experiments. For this calculation, we selected the PDSs that released as programmed and for which data were recovered (blue triangles in Figure 2); thus, 3 and 10 sets of PDS datasets were used in the first and second experiments, respectively. The acquisition rates were higher than 99.9% (99.94 and 99.98% in the first and second experiments, respectively). Prior to CPIES recovery, users also can confirm the success or failure of data transmission from CPIES to PDS using the recorded checksum flag. Figure 3B shows the average percentage of good versus bad data in the PDS time series. The percentage good data was 99.7% (99.4% in minimum) and 99.9% in first and second experiments, respectively. The acquisition rate and percentage of suitable τ data reached 99.9% in the 2018 experiment as in the pressure and current data. These demonstrate that the process of data transmission from CPIES to the email server ashore worked well.
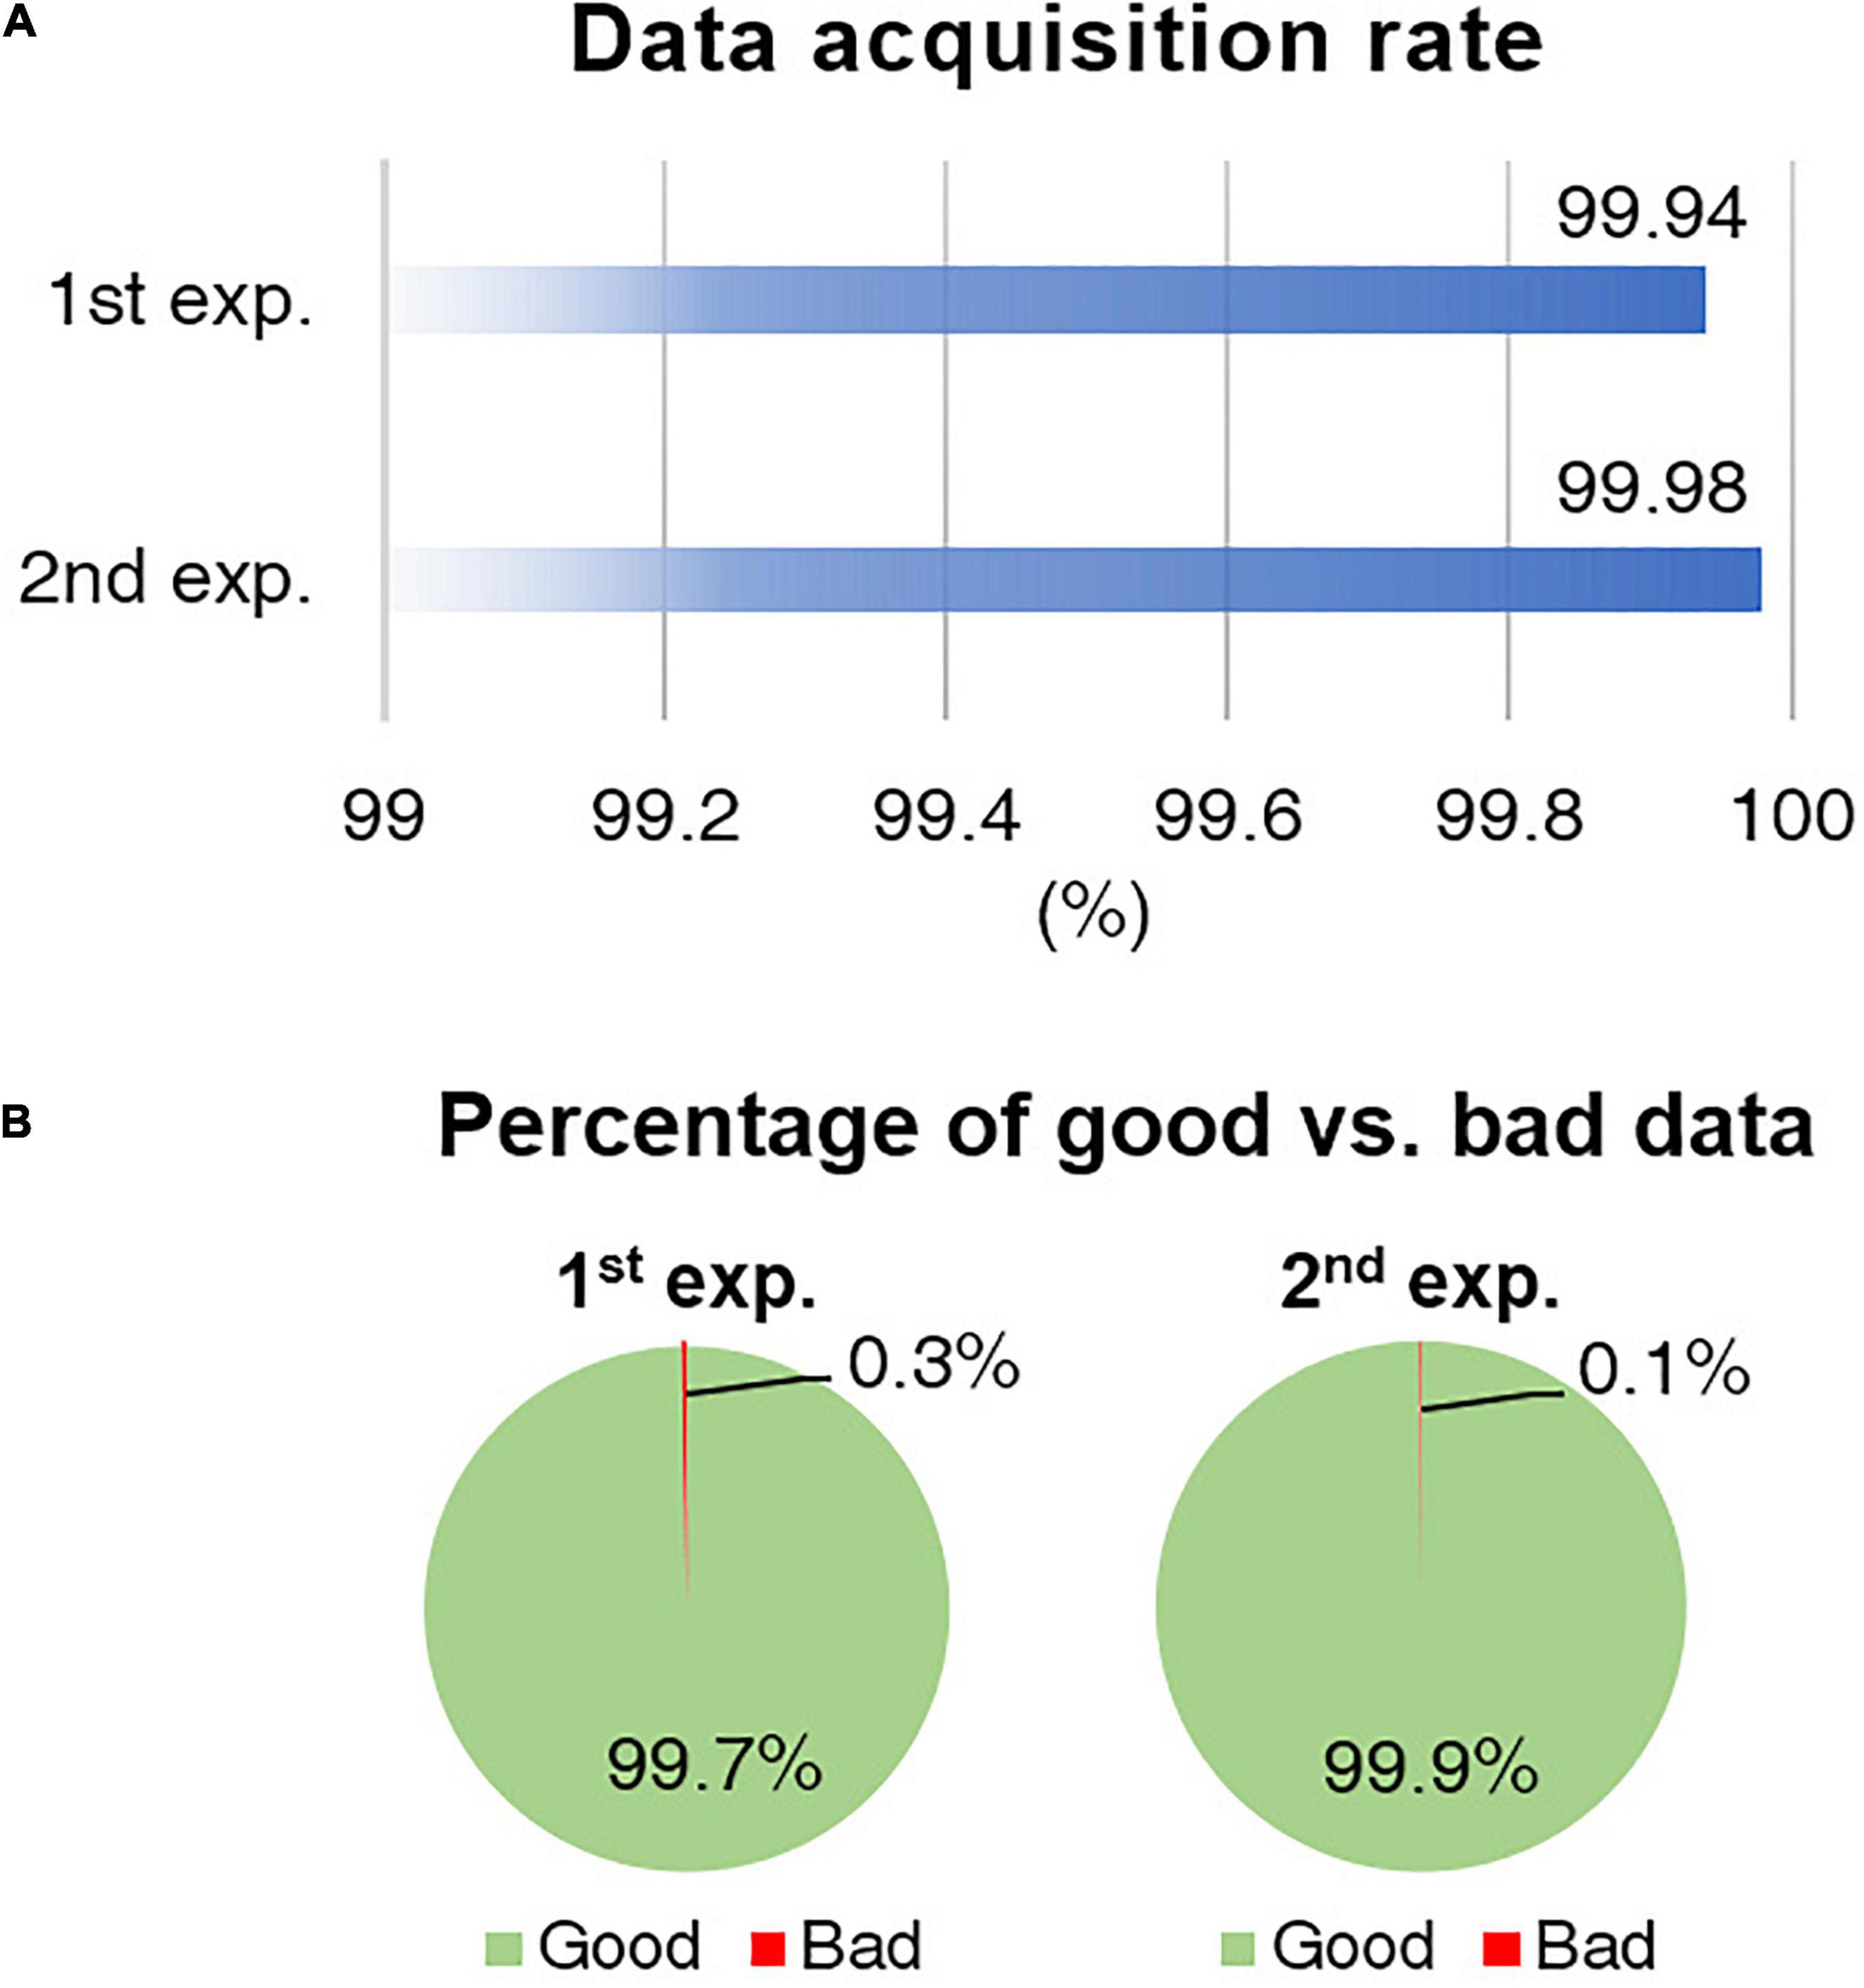
Figure 3. (A) Data acquisition rate calculated through the comparison of internally saved and remotely retrieved data. (B) Percentage of good versus bad data in remotely retrieved dataset.
Example of Remotely Acquired Data Using PDS
The existing method in the PIES or CPIES using in situ shipboard acoustic pulse delay telemetry (PDT) provides processed daily values; however, data acquired from the PDS consist of hourly τ and 30-min-interval single-depth current and bottom pressure values. Figure 4 shows an example time series of all variables at the AES4 site of second experiment for the period of October 9–22, 2019 (14 days). The 14-day-long example highlights the hour-to-day variabilities which would be averaged out using daily processed data in the previously existing shipboard PDT method.
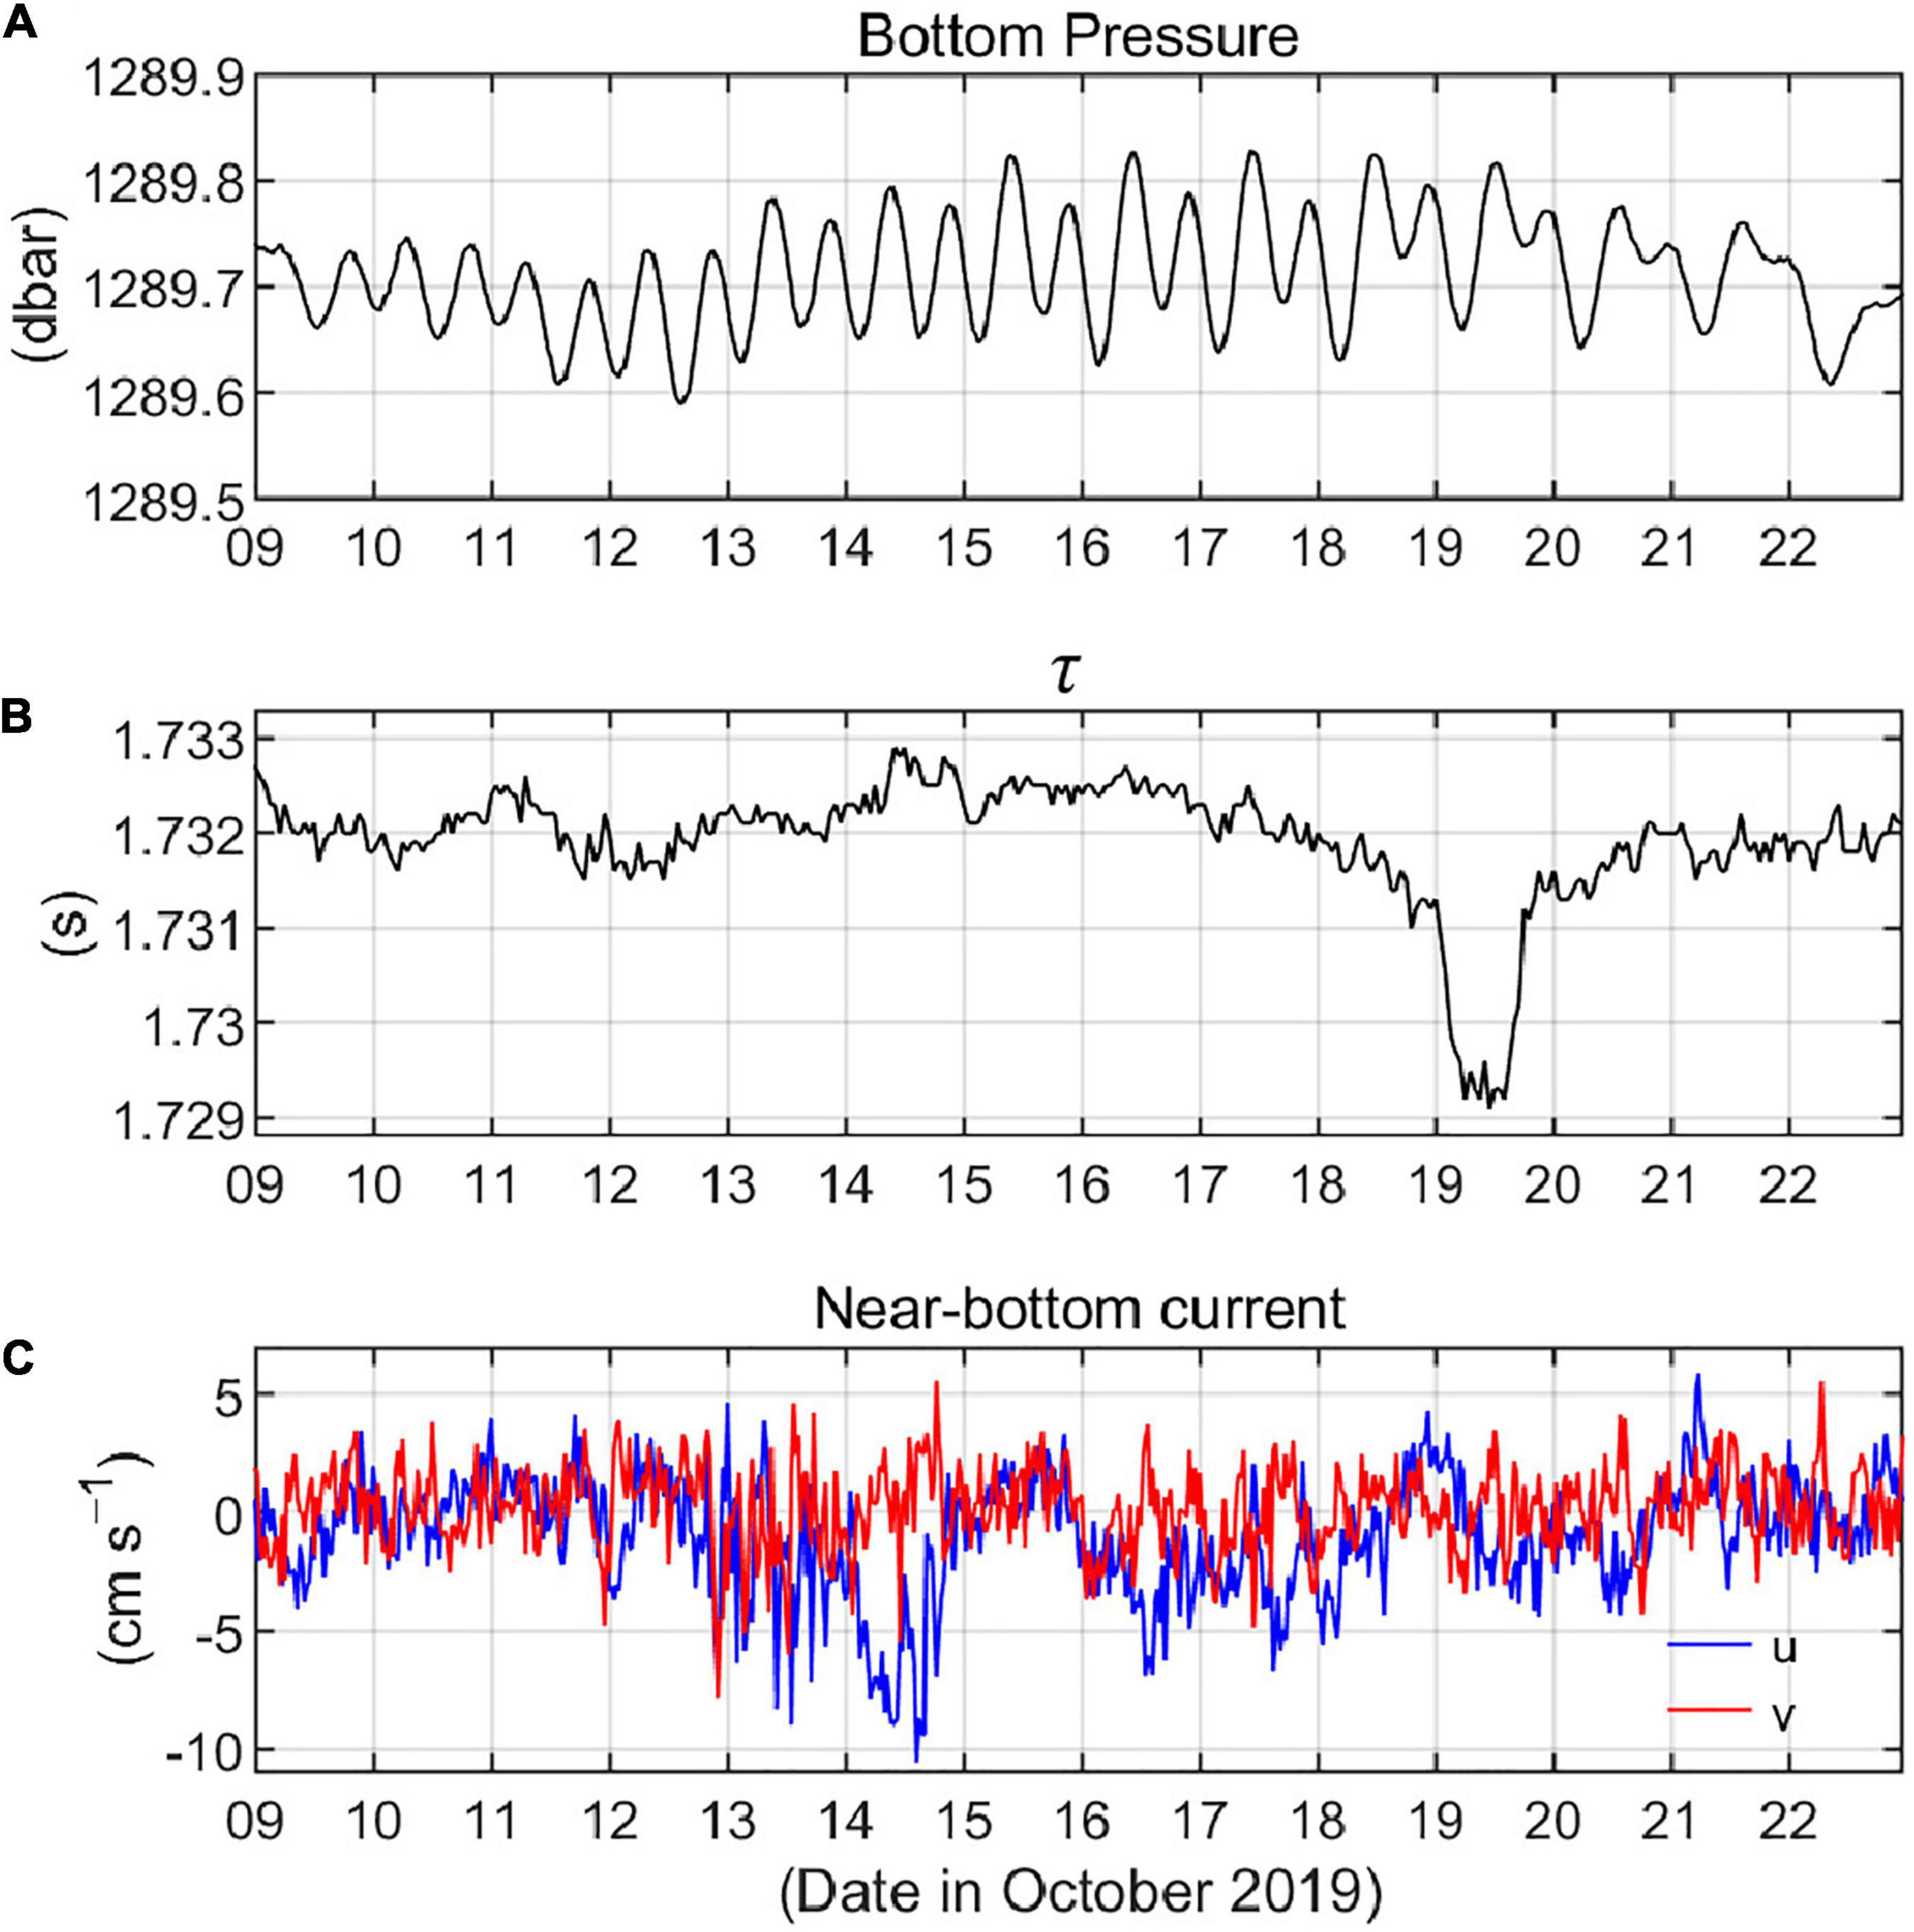
Figure 4. Example of time series acquired from PDS at site AES4. (A) Bottom pressure, (B) τ, and (C) zonal and meridional velocities for the 14-day period of October 9–22, 2019.
Tide-induced variation was predominant in the bottom pressure time series (Figure 4A). Semidiurnal and diurnal tides were dominant; hence, mixed tidal cycle and diurnal inequality were seen in the time series. The τ in polar oceans can be affected by changes in temperature, salinity, sea surface height, and sea-ice thickness; hence, the obtained τ values showed many fluctuations at various time scales (Figure 4B). Overall, changes larger than 0.0015 s were rare in the τ records, yet a notable ∼0.002 s early echo was observed on October 19, probably due to the ∼1.5-m thickness of sea-ice, in that, 0.75-m sea-ice thickness is known to cause a 1-ms early echo time in τ. We may guess the size of sea-ice with the early echo signal under following simple assumptions. If the sea-ice moves with a speed of 0.05–0.1 m s–1 on average in the same direction for 16 h and the shape is close to a circle, the diameter reaches roughly 2.9–5.8 km; and thus, this floating ice is indeed hard to be resolved in current satellite-based products such as daily sea-ice products with 25-km (e.g., Cavalieri et al., 1996; Brodzik and Stewart, 2016) and 4-km (Fetterer et al., 2015) spatial resolutions. The near-bottom zonal and meridional velocities showed highly fluctuating patterns (Figure 4C). The average current speed was 0.027 m s–1, although sometimes it reached ∼0.1 m s–1. Another notable feature is a periodicity of the current from October 13 through 20, i.e., a 30–50-h period. This motion may have been caused by bottom-trapped topographic Rossby waves that existed in regions of abrupt bathymetric change at these latitudes of the Arctic Ocean (Ku et al., 2020).
Location Reporting System
The PDS, once adrift on the sea surface, transmitted its location regularly. The initial setting of the location reporting was once per day. Two PDS trajectories released at AES4 are plotted in Figure 5; one for September 24, 2018 (1st PDS) and the other for August 1, 2020 (3rd PDS). The 2nd PDS from site AES4 failed to report location. Based on the reported locations, including the error range of the longitude and latitude, we omitted erroneous values (∼5% in total).
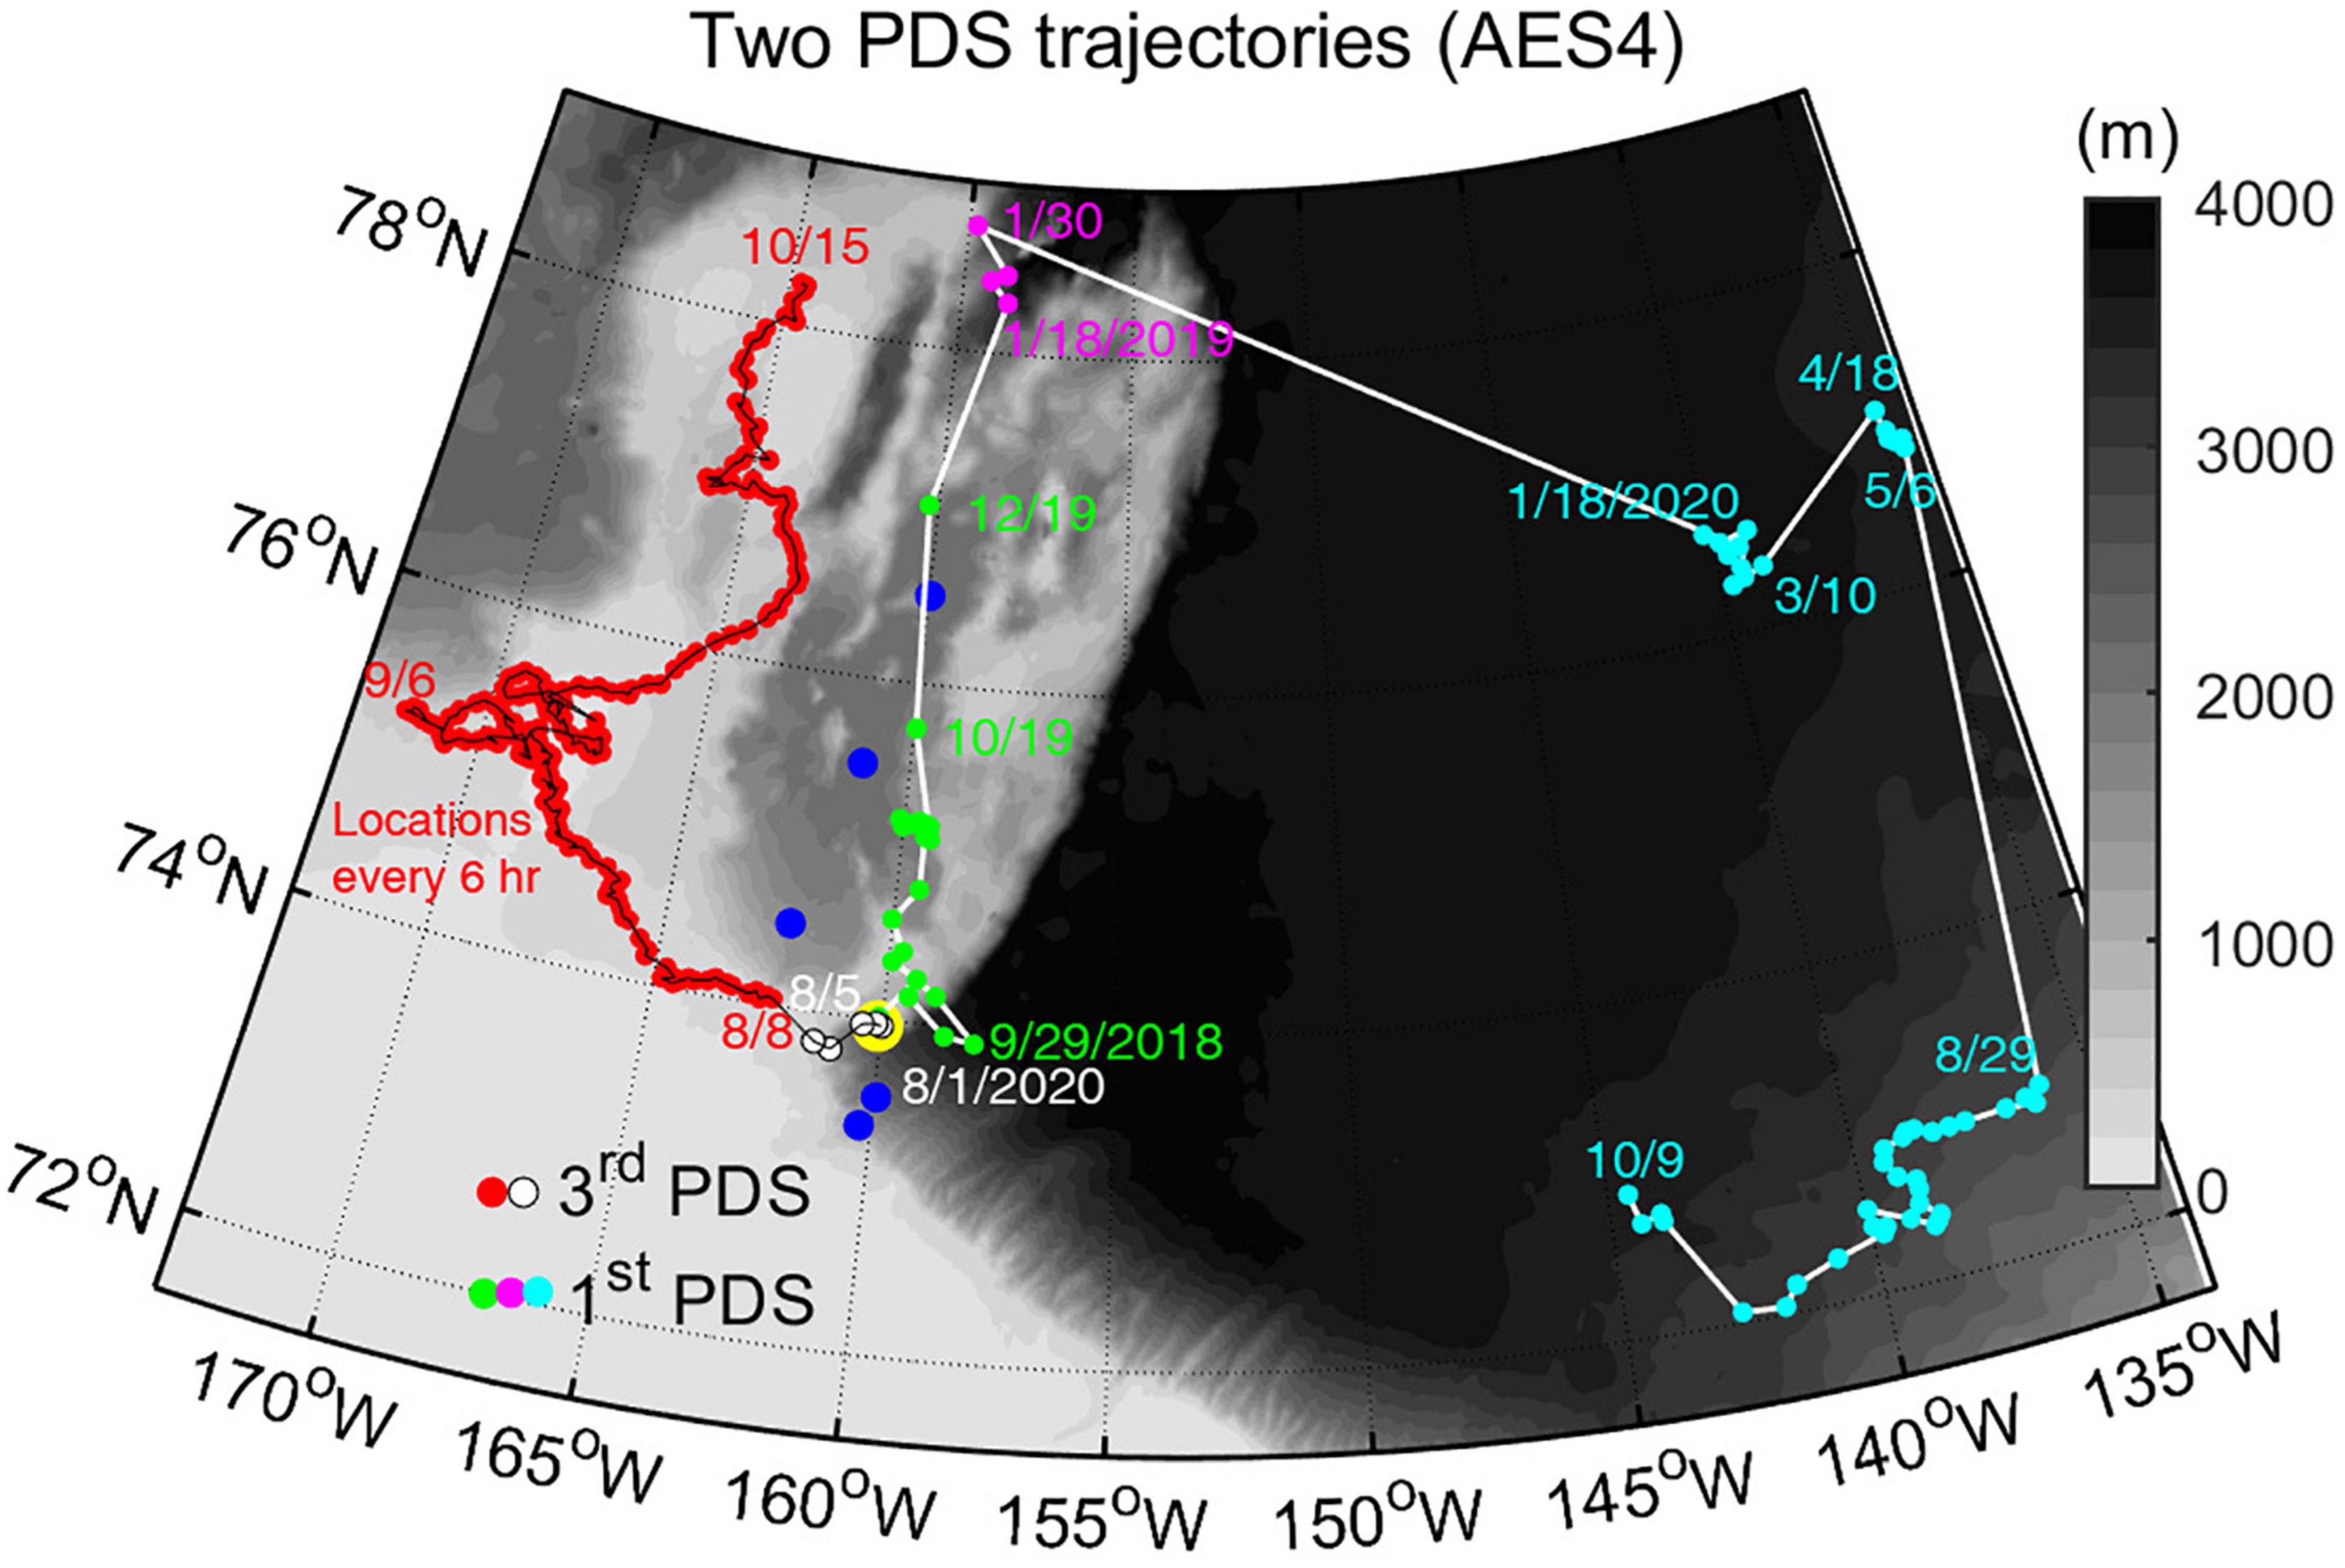
Figure 5. Two PDS trajectories released at AES4 site on September 24, 2018 (1st PDS) and August 1, 2020 (3rd PDS). White line indicates the 1st PDS trajectory with the green, magenta, and cyan dots along the line denoting daily locations in the years 2018–2020, respectively. Black line indicates the 3rd PDS trajectory with the white and red dots along the line denoting locations every day and 6 h, respectively. Note that bad locations (∼5%) are not shown. Yellow (AES4) and blue (AES 1–3, 5, 6) dots indicate CPIES sites as in Figure 2. Dots at certain locations with mm/dd or mm/dd/yyyy date designations mark the PDS positions at 00 h GMT on those dates.
The 1st PDS moved to the east initially and switched its direction to the north on September 29, 2018. It drifted to the north continuously, and the last signal of 2018 was reported on December 19. It resumed its location reporting on January 18, 2019 but was lost again on January 30 and had no more reports in 2019. The PDS resumed its location reporting on January 18, 2020, in the Canada Basin, and the final signal was on October 9, 2020. The location signals were intermittent between October 19, 2018 and August 29, 2020, presumably due to interference or confinement by the sea-ice. Nevertheless, the 1st PDS endured longer than 2 years in the extreme circumstances of the Arctic Ocean, thus demonstrating its durability and usability.
The 3rd PDS drifted to the northwest for ∼30 days and then moved north/northeastward after wandering. The PDS has an antenna enabling two-way communication with the Iridium satellite; hence, we could control the data transmission and the time interval of location reporting. We switched the time interval to 6 h on August 8, 2020 as indicated by red dots along the black solid line in Figure 5. The temporally high-resolution PDS trajectory, to a certain extent, can provide some insights into ice drift or ocean surface current.
Economic Benefits of PDS System
Here we compare the economic costs for remote data acquisition between the new (PDS) and the existing (acoustic telemetry) methods (Figure 6). The existing method requires approximately 14,500 USD for one-site ship operation for navigation from one site to another and for data recovery using acoustic telemetry. Note that this is a minimal assumption that the ship is already operating in the area, avoiding long transit costs to and from the site. The ship cost estimation is based on the Korean icebreaker RV Araon (50,000 USD per day) that conducted the first deployment and CPIES recovery cruise. Additionally, the existing method demanded skilled technicians, equipment, and ship operations, accompanied by travel and shipping costs (at least 4,500 USD). The new method using the PDS requires a budget of 5,000 USD for one PDS capsule and 400 USD for one antenna embedded inside PIES or CPIES glass-housing to transmit the measured data. A year’s worth of CPIES data costs 460.5 USD due to Iridium service, as the 1-year-long data payload is 307 kilobytes (Popeye Data Shuttle User’s Manual, 2021). This method requires no ship operation. Therefore, the new method saves ∼70% of the cost compared to the previous shipboard PDT method.
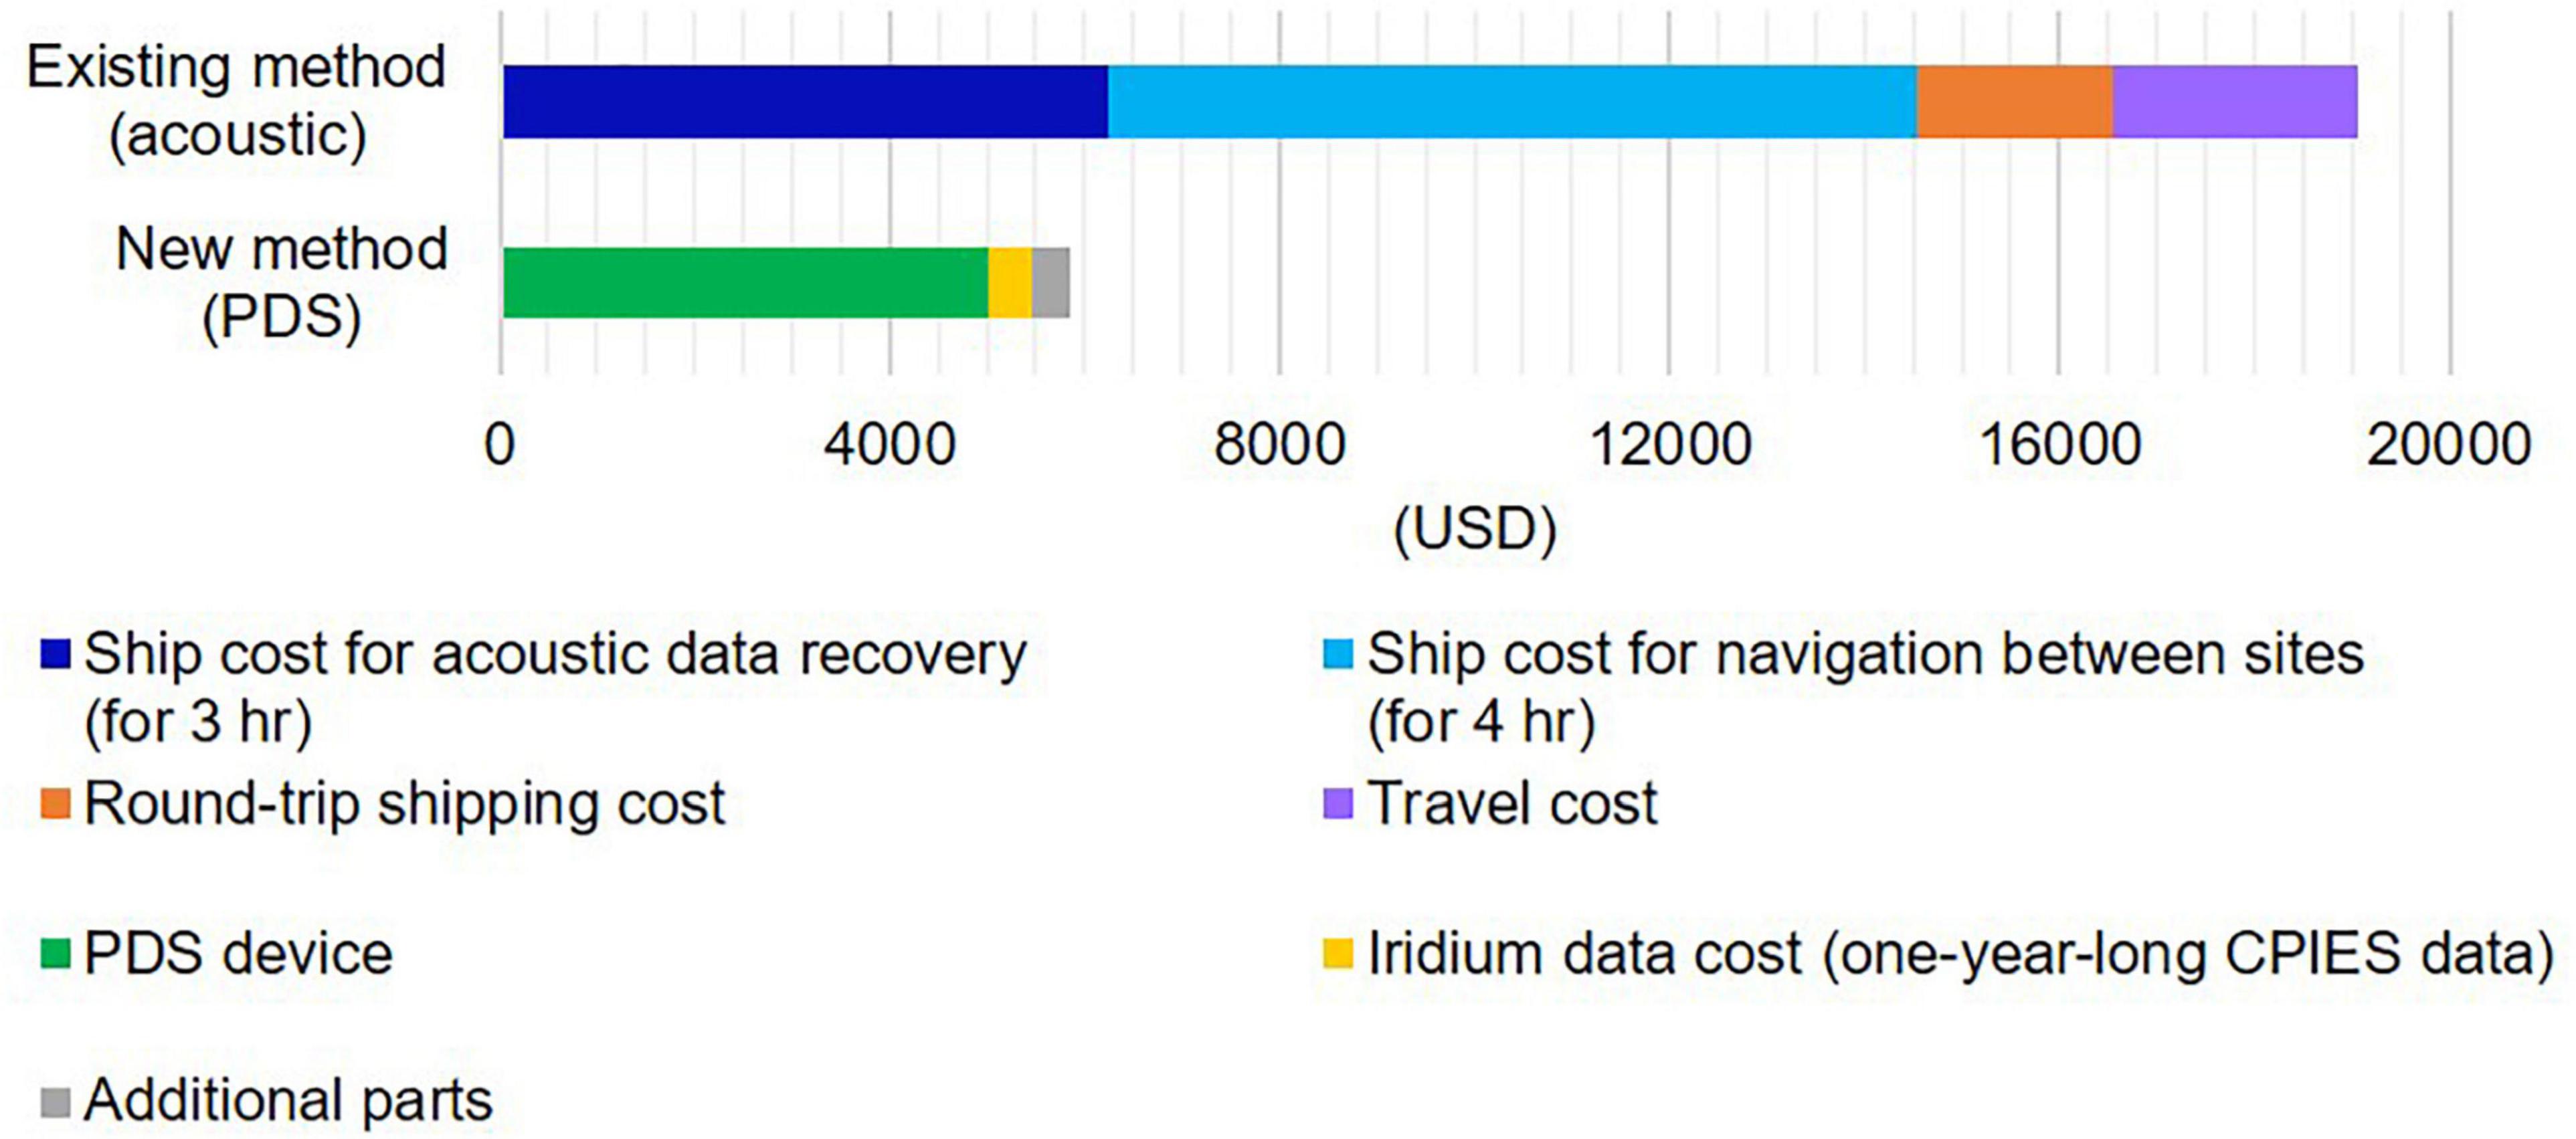
Figure 6. Cost comparison for data acquisition between the existing and the new methods. Note that the ship cost estimation is based on the Korean icebreaker RV Araon (50,000 USD per day) used in the first deployment and CPIES recovery cruises.
Conclusion and Summary
We introduce a newly developed remote data acquisition method using PDS to support CPIES, a type of deep-sea mooring instrument to measure barotropic and baroclinic oceanic variabilities. Prior to this development, for data acquisition prior to recovery, the PIES or CPIES used acoustic telemetry, which involves positioning a ship at the mooring site; thus, that method requires ship and operator times which are both costly. In contrast, the new method utilizing PDS capability enables a more straightforward data acquisition without ship operation.
Scientific benefits arise because the PDS transmits high temporal-resolution data, and logistical benefits arise from its scheduled pop-up-type release system—the data pod floats to the surface at a user-chosen time to transmit the recorded data via the Iridium constellation of satellites to an email server ashore. The high temporal-resolution PDS data, well representing time-varying signals from hour timescale, enable rapid resolution of scientific questions.
The performance of the PDS system was verified in two field experiments conducted in the western Arctic Ocean. Substantial system hardware and firmware upgrades were made prior to the second deployment to address problems that were discovered in the first deployment. This produced great reliability in the PDS release system, data transmission and acquisition, and data quality. Further, the PDS system can save valuable cost and time and represents a secure and reliable method of advanced remote data acquisition. Hence, this novel method provides a robust capability for remote deep-ocean mooring data acquisition, which has not been readily feasible with autonomous data relay technologies.
Data Availability Statement
The original contributions presented in the study are publicly available. This data can be found here: https://github.com/PADOLab1/PDS_Paper_Data.git.
Author Contributions
CJ: primary writing, in situ moorings, and calculations. J-HP and TPe: in situ moorings, overall coordination, and discussion. MK, ES, and DW: writing, discussion, and development of PDS-CPIES. E-JL and TPa: data collection, processing, and discussion. All authors modify the manuscript.
Funding
This study was supported by ONR “Stratified Ocean Dynamics of the Arctic” Grant number N000141612450 and the ONR Global grant (N62909-17-1-2041). Supports for this research were also provided by “Test of long-term monitoring system installation for oceanic environmental changes caused by accelerated sea-ice melting in the Chukchi Sea (20210540)” funded by the MOF, and Basic Science Research Program through the National Research Foundation of Korea (NRF) funded by the Ministry of Education (2021R1I1A305799311).
Conflict of Interest
The authors declare that the research was conducted in the absence of any commercial or financial relationships that could be construed as a potential conflict of interest.
Acknowledgments
An array of six PDS-CPIES deployments and CTD hydrocasts were conducted by RV Araon and RV Sikuliaq; we would like to express our deepest gratitude to the crew and scientists for their dedicated help. We wish to acknowledge and give highest thanks to Mr. Gerard Chaplin, who prior to his retirement from URI was Project Engineer and led in the conceptualization and initial development of the PDS system for PIES.
References
Alford, M. H., Peacock, T., Mackinnon, J. A., Nash, J. D., Buijsman, M. C., Centuroni, L. R., et al. (2015). The formation and fate of internal waves in the South China Sea. Nature 521, 65–69. doi: 10.1038/nature14399
Andres, M., Musgrave, R. C., Rudnick, D. L., Zeiden, K. L., Peacock, T., and Park, J.-H. (2020). On the predictability of sea surface height around Palau. J. Phys. Oceanogr. 50, 1–76. doi: 10.1175/jpo-d-19-0310.1
Andres, M., Silvano, A., Straneo, F., and Watts, D. R. (2015). Icebergs and sea ice detected with inverted echo sounders. J. Atmospheric Oceanic Technol. 32, 1042–1057. doi: 10.1175/JTECH-D-14-00161.1
Andres, M., Wimbush, M., Park, J.-H., Chang, K.-I., Lim, B.-H., Watts, D. R., et al. (2008). Observations of Kuroshio flow variations in the East China Sea. J. Geophys. Res. 113:C05013. doi: 10.1029/2007JC004200
Baker-Yeboah, S., Watts, D. R., and Byrne, D. A. (2009). Measurements of sea surface height variability in the eastern South Atlantic from pressure sensor-equipped inverted echo sounders: Baroclinic and barotropic components. J. Atmospheric Oceanic Technol. 26, 2593–2609. doi: 10.1175/2009JTECHO659.1
Behnisch, M., Macrander, A., Boebel, O., Wolff, J. O., and Schröter, J. (2013). Barotropic and deep-referenced baroclinic SSH variability derived from Pressure Inverted Echo Sounders (PIES) south of Africa. J. Geophys. Res. Oceans 118, 3046–3058. doi: 10.1002/jgrc.20195
Book, J. W., Wimbush, M., Imawaki, S., Ichikawa, H., Uchida, H., and Kinoshita, H. (2002). Kuroshio temporal and spatial variations South of Japan determined from inverted echo sounder measurements. J. Geophys. Res. Oceans 107, 4.1–4.12. doi: 10.1029/2001jc000795
Brodzik, M. J., and Stewart, J. S. (2016). Near-Real-Time SSM/I-SSMIS EASE-Grid Daily Global Ice Concentration and Snow Extent, Version 5. Boulder, Colorado: NASA National Snow and Ice Data Center Distributed Active Archive Center.
Cavalieri, D. J., Parkinson, C. L., Gloersen, P., and Zwally, H. J. (1996). Sea Ice Concentrations from Nimbus-7 SMMR and DMSP SSM/I-SSMIS Passive Microwave Data, Version 1. Boulder, Colorado: NASA National Snow and Ice Data Center Distributed Active Archive Center.
Chaplin, G. F. (1990). Acoustic telemetry system for real-time monitoring of the Gulf Stream path. Washington, DC: IEEE, 46–51.
Chiswell, S. M., Wimbush, M., and Lukas, R. (1988). Comparison of dynamic height measurements from an inverted echo sounder and an island tide gauge in the central Pacific. J. Geophys. Res. 93:2277. doi: 10.1029/jc093ic03p02277
Donohue, K. A., Kennelly, M. A., and Cutting, A. (2016). Sea surface height variability in drake passage. J. Atmos. Ocean. Technol. 33, 669–683. doi: 10.1175/JTECH-D-15-0249.1
Donohue, K. A., Watts, D. R., Tracey, K. L., Greene, A. D., and Kennelly, M. (2010). Mapping circulation in the Kuroshio Extension with an array of current and pressure recording inverted echo sounders. J. Atmospheric Oceanic Technol. 27, 507–527. doi: 10.1175/2009JTECHO686.1
Fetterer, F., Stewart, J. S., and Meier, W. N. (2015). MASAM2: Daily 4 km Arctic Sea Ice Concentration, Version 1. Boulder, Colorado: National Snow and Ice Data Center.
Jeon, C., Park, J.-H., Kim, D. G., Kim, E., and Jeon, D. (2018). Comparison of measurements from pressure-recording inverted echo sounders and satellite altimetry in the north equatorial current region of the Western Pacific. Ocean Sci. J. 53, 207–213. doi: 10.1007/s12601-018-0012-4
Ku, A., Seung, Y. H., Jeon, C., Choi, Y., Yoshizawa, E., Shimada, K., et al. (2020). Observation of bottom-trapped topographic rossby waves on the shelf break of the Chukchi Sea. J. Geophys. Res. Oceans 125, 1–14. doi: 10.1029/2019JC015436
Meinen, C. S. (2001). Structure of the North Atlantic current in stream-coordinates and the circulation in the Newfoundland basin. Deep-Sea Res. I 48, 1553–1580. doi: 10.1016/S0967-0637(00)00103-5
Mitchell, D. A., Teague, W. J., Wimbush, M., Watts, D. R., and Sutyrin, G. G. (2005). The dok cold Eddy. J. Phys. Oceanogr. 35, 273–288. doi: 10.1175/JPO-2684.1
Na, H., Park, J.-H., Randolph Watts, D., Donohue, K. A., and Lee, H. J. (2012). Near 13 day barotropic ocean response to the atmospheric forcing in the North Pacific. J. Geophys. Res. Oceans 117, 1–12. doi: 10.1029/2012JC008211
Na, H., Watts, D. R., Park, J.-H., Jeon, C., Lee, H. J., Nonaka, M., et al. (2016). Bottom pressure variability in the Kuroshio Extension driven by the atmosphere and ocean instabilities. J. Geophys. Res. Oceans 121, 6507–6519. doi: 10.1002/2016JC012097
Na, H., Wimbush, M., Park, J.-H., Nakamura, H., and Nishina, A. (2014). Observations of flow variability through the Kerama gap between the East China Sea and the Northwestern Pacific. J. Geophys. Res. Oceans 119, 689–703. doi: 10.1002/2013JC008899
Park, J.-H., Donohue, K. A., Watts, D. R., and Rainville, L. (2010). Distribution of deep near-inertial waves observed in the Kuroshio Extension. J. Oceanogr. 66, 709–717. doi: 10.1007/s10872-010-0058-0
Park, J.-H., and Watts, D. R. (2005a). Near-inertial oscillations interacting with mesoscale circulation in the southwestern Japan/East Sea. Geophys. Res. Lett. 32, 1–4. doi: 10.1029/2005GL022936
Park, J.-H., and Watts, D. R. (2005b). Response of the southwestern Japan/East Sea to atmospheric pressure. Deep-Sea Res. II 52, 1671–1683. doi: 10.1016/j.dsr2.2003.08.007
Park, J.-H., and Watts, D. R. (2006a). Near 5-day nonisostatic response of the Atlantic Ocean to atmospheric surface pressure deduced from sub-surface and bottom pressure measurements. Geophys. Res. Lett. 33, 1–5. doi: 10.1029/2006GL026304
Park, J.-H., and Watts, D. R. (2006b). Internal tides in the southwestern Japan/East Sea. J. Phys. Oceanogr. 36, 22–34. doi: 10.1175/JPO2846.1
Park, J.-H., Watts, D. R., Donohue, K. A., and Jayne, S. R. (2008). A comparison of in situ bottom pressure array measurements with GRACE estimates in the Kuroshio Extension. Geophys. Res. Lett. 35, 1–5. doi: 10.1029/2008GL034778
Park, J.-H., Watts, D. R., Donohue, K. A., and Tracey, K. L. (2012). Comparisons of sea surface height variability observed by pressure-recording inverted echo sounders and satellite altimetry in the Kuroshio Extension. J. Oceanogr. 68, 401–416. doi: 10.1007/s10872-012-0108-x
Park, J.-H., Watts, D. R., Tracey, K. L., and Mitchell, D. A. (2005). A multi-index GEM technique and its application to the southwestern Japan/East Sea. J. Atmospheric Oceanic Technol. 22, 1282–1293. doi: 10.1175/JTECH-1668.1
Popeye Data Shuttle User’s Manual. (2021). Graduate School of Oceanography. Narragansett, RI: University of Rhode Island.
Ramp, S. R., Park, J.-H., Yang, Y. J., Bahr, F. L., and Jeon, C. (2019). Latitudinal structure of solitons in the South China Sea. J. Phys. Oceanogr. 49, 1747–1767. doi: 10.1175/jpo-d-18-0071.1
Sun, C., and Watts, D. R. (2001). A circumpolar gravest empirical mode for the Southern Ocean hydrography. J. Geophys. Res. Oceans 106, 2833–2855. doi: 10.1029/2000jc900112
Tracey, K. L., Howden, S. D., and Watts, D. R. (1997). IES calibration and mapping procedures. J. Atmospheric Oceanic Technol. 14, 1483–1493. doi: 10.1175/1520-04261997014<1483:ICAMP<2.0.CO;2
Watts, D. R., and Rossby, H. T. (1977). Measuring dynamic heights with inverted echo sounders: results from MODE. J. Phys. Oceanogr. 7, 345–358. doi: 10.1175/1520-04851977007<0345:MDHWIE<2.0.CO;2
Watts, D. R., Sun, C., and Rintoul, S. (2001a). A two-dimensional gravest empirical mode determined from hydrographic observations in the subantarctic front. J. Phys. Oceanogr. 31, 2186–2209. doi: 10.1175/1520-04852001031<2186:ATDGEM<2.0.CO;2
Watts, D. R., Qian, X., and Tracey, K. L. (2001b). Mapping abyssal current and pressure fields under the meandering gulf stream. J. Atmospheric Oceanic Technol. 18, 1052–1067. doi: 10.1175/1520-04262001018<1052:MACAPF<2.0.CO;2
Zhao, R., Nakamura, H., Zhu, X. H., Park, J.-H., Nishina, A., Zhang, C., et al. (2020). Tempo-spatial variations of the Ryukyu current southeast of Miyakojima Island determined from mooring observations. Sci. Rep. 10, 1–10. doi: 10.1038/s41598-020-63836-5
Zhao, R., Zhu, X.-H., and Park, J.-H. (2017). Near 5-Day nonisostatic response to atmospheric surface pressure and coastal-trapped waves observed in the Northern South China Sea. J. Phys. Oceanogr. 47, 2291–2303. doi: 10.1175/JPO-D-17-0013.1
Zhao, R., Zhu, X. H., Park, J.-H., and Li, Q. (2018). Internal tides in the northwestern South China Sea observed by pressure-recording inverted echo sounders. Prog. Oceanogr. 168, 112–122. doi: 10.1016/j.pocean.2018.09.019
Zheng, H., Zhu, X. H., Nakamura, H., Park, J.-H., Jeon, C., Zhao, R., et al. (2020). Generation and propagation of 21-day bottom pressure variability driven by wind stress curl in the East China Sea. Acta Oceanol. Sinica 39, 91–106. doi: 10.1007/s13131-020-1603-3
Keywords: pop-up data shuttle, remote data acquisition, advanced technology, temporal high-resolution data, deep-ocean mooring
Citation: Jeon C, Park J-H, Kennelly M, Sousa E, Watts DR, Lee E-J, Park T and Peacock T (2021) Advanced Remote Data Acquisition Using a Pop-Up Data Shuttle (PDS) to Report Data From Current- and Pressure-Recording Inverted Echo Sounders (CPIES). Front. Mar. Sci. 8:679534. doi: 10.3389/fmars.2021.679534
Received: 12 March 2021; Accepted: 23 June 2021;
Published: 21 July 2021.
Edited by:
Alex Nimmo-Smith, University of Plymouth, United KingdomReviewed by:
Antoine De Ramon N’Yeurt, University of the South Pacific, FijiXiao-Hua Zhu, Second Institute of Oceanography, Ministry of Natural Resources, China
Copyright © 2021 Jeon, Park, Kennelly, Sousa, Watts, Lee, Park and Peacock. This is an open-access article distributed under the terms of the Creative Commons Attribution License (CC BY). The use, distribution or reproduction in other forums is permitted, provided the original author(s) and the copyright owner(s) are credited and that the original publication in this journal is cited, in accordance with accepted academic practice. No use, distribution or reproduction is permitted which does not comply with these terms.
*Correspondence: Jae-Hun Park, amFlaHVucGFya0BpbmhhLmFjLmty