 Peter O. Zavialov
- P. P. Shirshov Institute of Oceanology, Russian Academy of Sciences, Moscow, Russia
We analyze high temporal resolution (10 min) sea surface height (SSH) data records from pressure sensors deployed on the inner shelf within the plumes of the Mzymta and the Vulan, two small-to-medium size rivers in the Russian sector of the Black Sea coast. The SSH was recorded in parallel with meteorological parameters, averaged over the same 10 min intervals. While the low-frequency changes of the SSH at periods of 6 h or longer accounted for about 90% of the total variability and were strongly correlated with the wind, superimposed on them there always existed higher frequency oscillations whose characteristic periods ranged from 70 to 230 min, and the amplitudes spanned between 1 and 19 cm, not correlated with either the wind stress or atmospheric pressure. Furthermore, the amplitudes and the periods of these high-frequency oscillations appeared to be proportional to the horizontal scale of the river plume, as well as to each other. A very simple semi-analytical model focused on the interplay between the plume’s mass and the momentum budgets demonstrated that periodic oscillations of the sea surface height should be inherent to river plumes, and also helped to explain the abovementioned dependencies.
Introduction
As important features of the near-shore ocean and major mediators of land-sea interactions, river plumes have long attracted attention and been subject of extensive literature since the 1970s, see, for example, Garvine and Monk (1974), Garvine (1984), Yankovsky and Chapman (1997). Nonetheless, a relatively recent review article by Horner-Devine et al. (2015) described the state-of-the-art knowledge of the fluvial plumes in the sea as follows: “…although studies [accomplished to date] have clarified many individual processes, a holistic description of the interaction and relative importance of different mixing and transport processes in river plumes has not yet been realized”. This is so partly because of the scarcity of observational data at spatial and temporal resolution sufficient to elucidate the internal structure and variability of plumes, especially small and medium-sized. The dynamics of plumes from small rivers and their response to wind forcing are significantly different from those of large ones (Mestres et al., 2007; Osadchiev and Korshenko, 2017; Osadchiev and Sedakov, 2019). Typically, small plumes are characterized by limited near-field area and do not exhibit a recirculating bulge because of rapid deceleration of the inflowing river stream and quick decay of its inertia (Osadchiev and Zavialov, 2019). In this study, we focus on two small-to-medium size rivers at the Russian coat of the Black Sea.
One particularly notable property of river plumes is their ability of generating internal waves (e.g., Nash and Moum, 2005). Mechanisms responsible for this phenomenon are not yet fully understood. Previous publications focused on this issue mainly referred to horizontally propagating (due to either tidal forcing or momentum gained from a river stream in flush flood events) density fronts generating internal waves when transitioning to subcritical flow (e.g., Stashchuk and Vlasenko, 2009; Osadchiev, 2018; Mendes et al., 2021). However, observations have been reported of internal waves triggered by apparently steady plumes in non-tidal regions and in the absence of supercritical river inflow (e.g., Korotkina et al., 2011; Lavrova and Mityagina, 2017).
The initial motivation for the present study was about investigating the proper variability of the sea surface height (SSH) in plumes. The author is not aware of any previously published works reporting on oscillatory motion of the plume’s surface nor elaborating on plausible physical mechanisms of such motion. In a recent study by Branch et al. (2020), the authors obtained analytical and numerical solutions describing the shape of a 2 «plume ridge» assuming its stationary state. They defined the ridge as a result of liftoff process by which buoyant river water separates from the bottom and flows over saltier and denser seawater generating a ridge on the water surface. In what follows, we show that the ridge is subject to vertical oscillations about its mean elevation. To this end, we analyzed high temporal resolution (10 min) data records obtained in field experiments on the inner shelf within the plumes of the Mzymta and the Vulan, two regionally important rivers in the Russian sector of the Black Sea coast. The current meters equipped with pressure sensors were deployed in 3 field experiments in 2008, 2009, and 2011, yielding 3 series of data, about 120 h long each. While the velocity records obtained in these experiments have been analyzed and published before, [see (Korotkina et al., 2011, 2014; Osadchiev and Zavialov, 2013)], the data from the pressure sensors have not.
Study Areas and Data
Although relatively small, the Mzymta River and the Vulan River are important rivers of the Russian coast of the Black Sea. The long-term average discharge rate is 49.6 m3/s (1.6 km3/year) of the former and 6.4 m3/s (0.2 km3/year) of the latter (Dzhaoshvili, 2002). However, the peak runoff during flood events can exceed the mean values by a factor of 10 and more (Alexeevsky et al., 2016). Both rivers are mountainous, with the average altitudes of their catchment basins of 240 m a.s.l. for the Vulan and 1309 m a.s.l. for the Mzymta. The width of the Mzymta estuary at the mouth is about 90 m, and that of the Vulan is approximately 30 m, while the depth at the mouth is about 2 m in both cases. Both rivers form distinct plumes whose typical lengths vary from 0.5 to 2 km for the Vulan and 2 to 5 km for the Mzymta on the long-term average (Zavialov et al., 2014), but much larger values exceeding 15 and even 20 km have also been documented in high discharge periods. Based on available information, the internal Froude number characterizing dynamical behavior of a plume (e.g., Kilcher and Nash, 2010) is below unity for the Vulan indicating subcritical flow, but can be either subcritical or supercritical for the Mzymta depending on discharge conditions. Both study areas are essentially non-tidal, with the maximum tidal amplitude of less than 2 cm (Medvedev and Kulikov, 2016).
The NorTek Aquadopp 300M instruments equipped with a set of sensors including a piezoresistive hydrostatic pressure probe were deployed attached to the bottom in the immediate proximity of the river mouths as shown in Figure 1. The water depth at the deployment sites was 5 m for the Mzymta mooring and 3 m for the Vulan mooring. The instruments sampled pressure once a second, the data were then converted to 10 min averages. The pressure sensor’s precision as specified by the manufacturer was 1.5 10–2 dBar, or about 1.5 cm if expressed as the height of the water column. Such a precision was sufficient to resolve small oscilations of the sea surface we focused on whose range (i.e., the doubled amplitude), spanned between about 2 cm to about 30 cm.
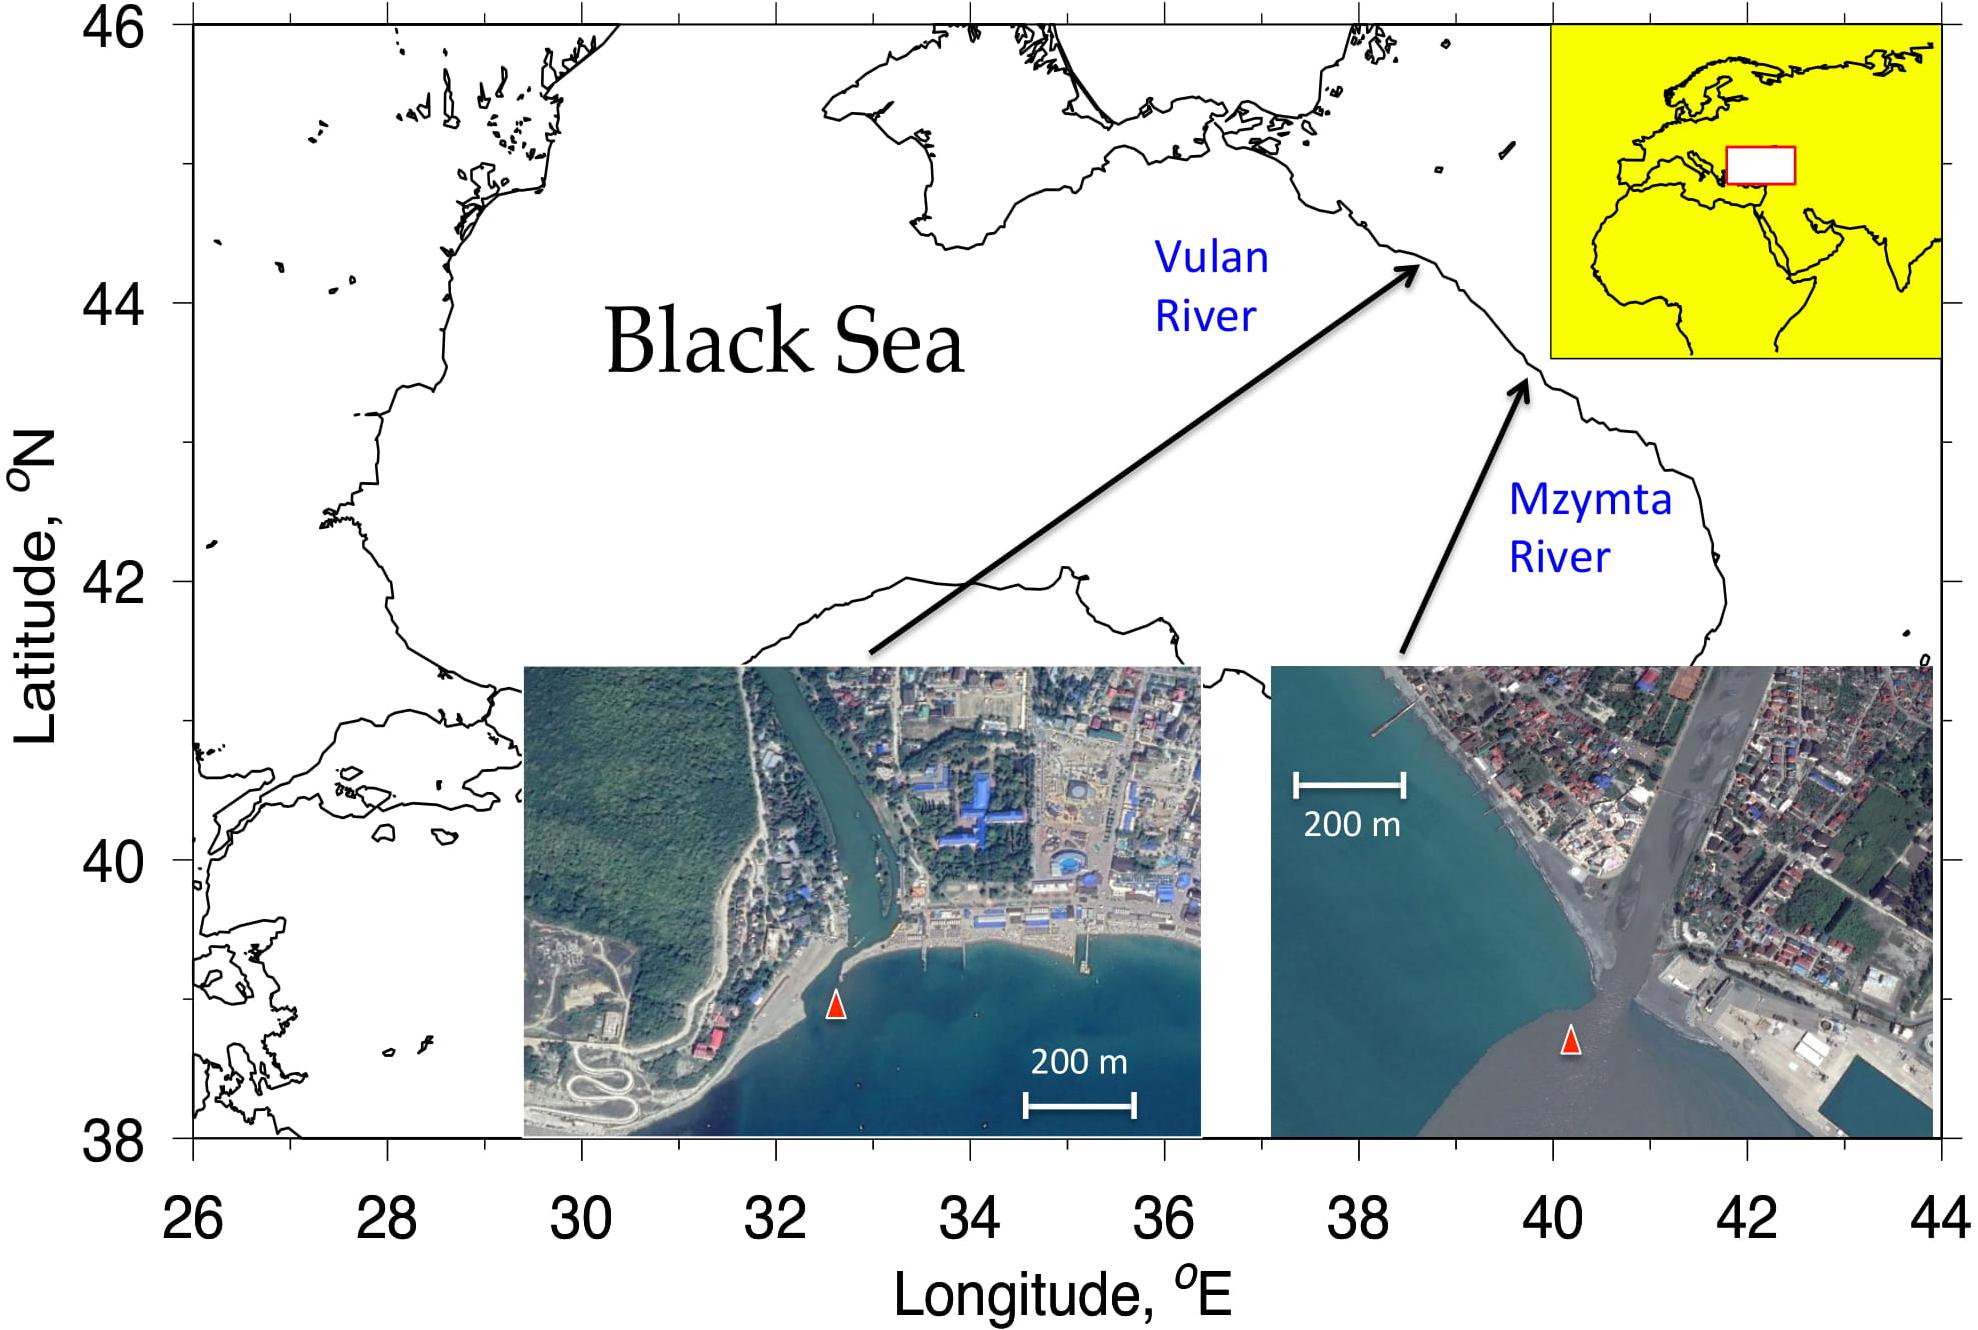
Figure 1. Study areas. The red triangles indicate locations where the moored instruments were deployed.
The mooring near the Mzymta mouth was in operation twice: first from May 22 through May 27, 2009, yielding a total of 698 10-min averaged pressure readings, secondly, from May 26 through May 31, 2011, resulting in 3450 2-min readings later converted to 690 10-min averages for uniformity. The mooring at the Vulan site functioned only once from October 8 to October 13, 2008, and collected 720 pressure samples as 10-min averages. The total length of the series was 116 h 20 min, 115 h 00 min, and 120 h 00 min for 2009, 2011, and 2008, respectively.
Concurrently with these measurements, all meteorological parameters, including the wind speed and direction and atmospheric pressure, were also recorded by a portable meteorological station temporarily installed on the shore near the river mouths. The ConradElectronic 2300-15 meteostation was used in all cases at a 10-min sampling rate. The wind data were later converted to wind stress components using the formulas given in (Smith, 1980).
In parallel with the measurements at the moorings, every day of the experiments we used a motorboat R/V Ashamba to perform detailed CTD mapping of the sea region adjacent to the river mouths. The sampling area encompassed the river plumes and the surrounding areas of the sea. In addition to the surface-to-bottom vertical profiling by the SeaBird 19plus CTD instrument at 15–25 stations daily, we also used a YSI6600 CTD probe placed into a special 8 dm3 container on the ship’s deck while water from the sea surface was continuously pumped through it, which enabled measuring the surface salinity at high spatial resolution along the track. Accordingly, we were able to produce salinity maps and to estimate the spatial extent of the plume for each individual day of the experiments (excluding 4 days for which such data were not available). The results of this daily mapping of the plumes have been published elsewhere (e.g., Osadchiev and Zavialov, 2013; Zavialov et al., 2014) and will not be discussed in detail in the present article; however, we use them here to estimate the characteristic length of the plume for each day. This length was formally determined as the maximum distance from the river mouth to a specific isohaline contour. For the purposes of this study, the latter was selected as 16.8 psu for the Vulan river in October 2008, and 15.0 psu and 14.5 psu for the Mzymta river in May 2009 and May 2011, respectively, because it was found that these contours corresponded to the maximum horizontal gradient of salinity and hence best represented the outer limits of the plumes as distinct areas of relatively low salinity surrounding the estuaries.
Results
The original raw data series are shown in Figure 2 as pressure anomalies (i.e., the instantaneous value minus the average over the entire series) registered by the instruments. It can be seen that absolute pressure records exhibit a combination of energetic variability at relatively low frequency (periods > 6 h) and high amplitude (1dBar) – and much smaller amplitude, higher frequency variability superimposed on it.
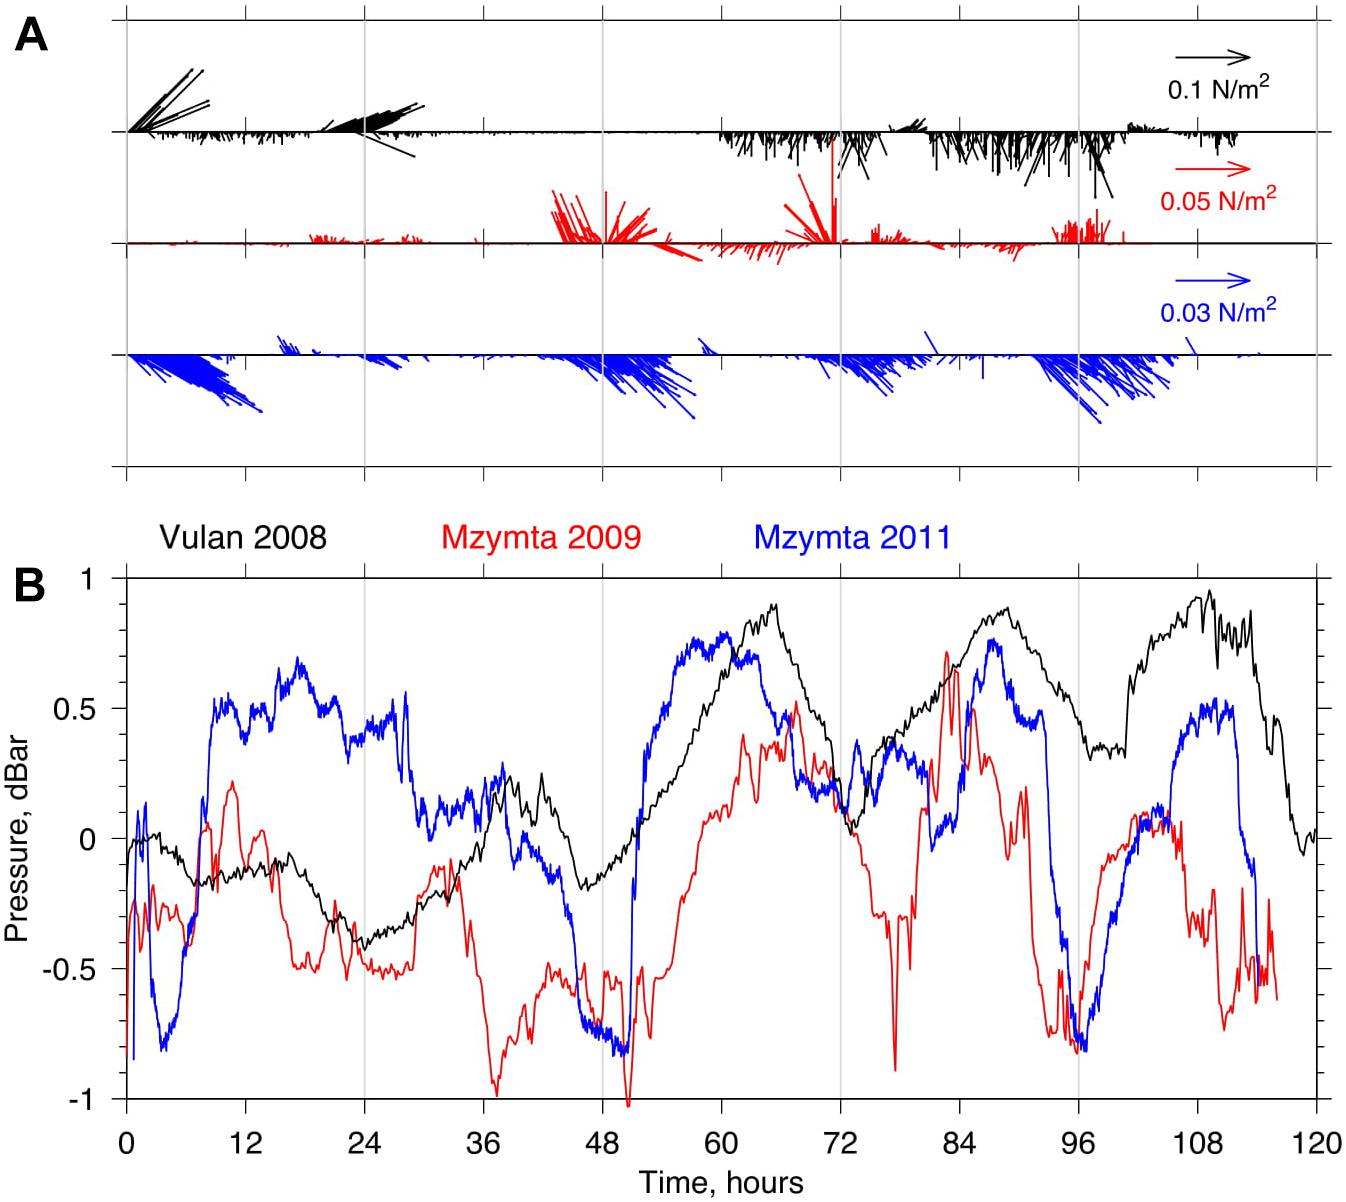
Figure 2. (A) Vector diagrams of wind stress vectors registered by portable meteostation installed near Vulan-2008 (black), Mzymta-2009 (red), and Mzymta-2011 (blue) mooring sites. (B) Raw series of water column pressure anomalies (dBar) collected at Vulan-2008 (black), Mzymta-2009 (red), and Mzymta-2011 (blue) mooring sites.
Figure 3 depicts the same data shown in Figure 2, but high-pass filtered: the series were filtered low-pass with a 6-h-wide moving window, and then the result was subtracted from the original data, thus eliminating the variability at periods longer than 6 h and retaining only higher frequency variability. As it is seen in Figure 3, all series exhibit distinct oscillatory pattern whose range, however, is much smaller than the variability in the original series.
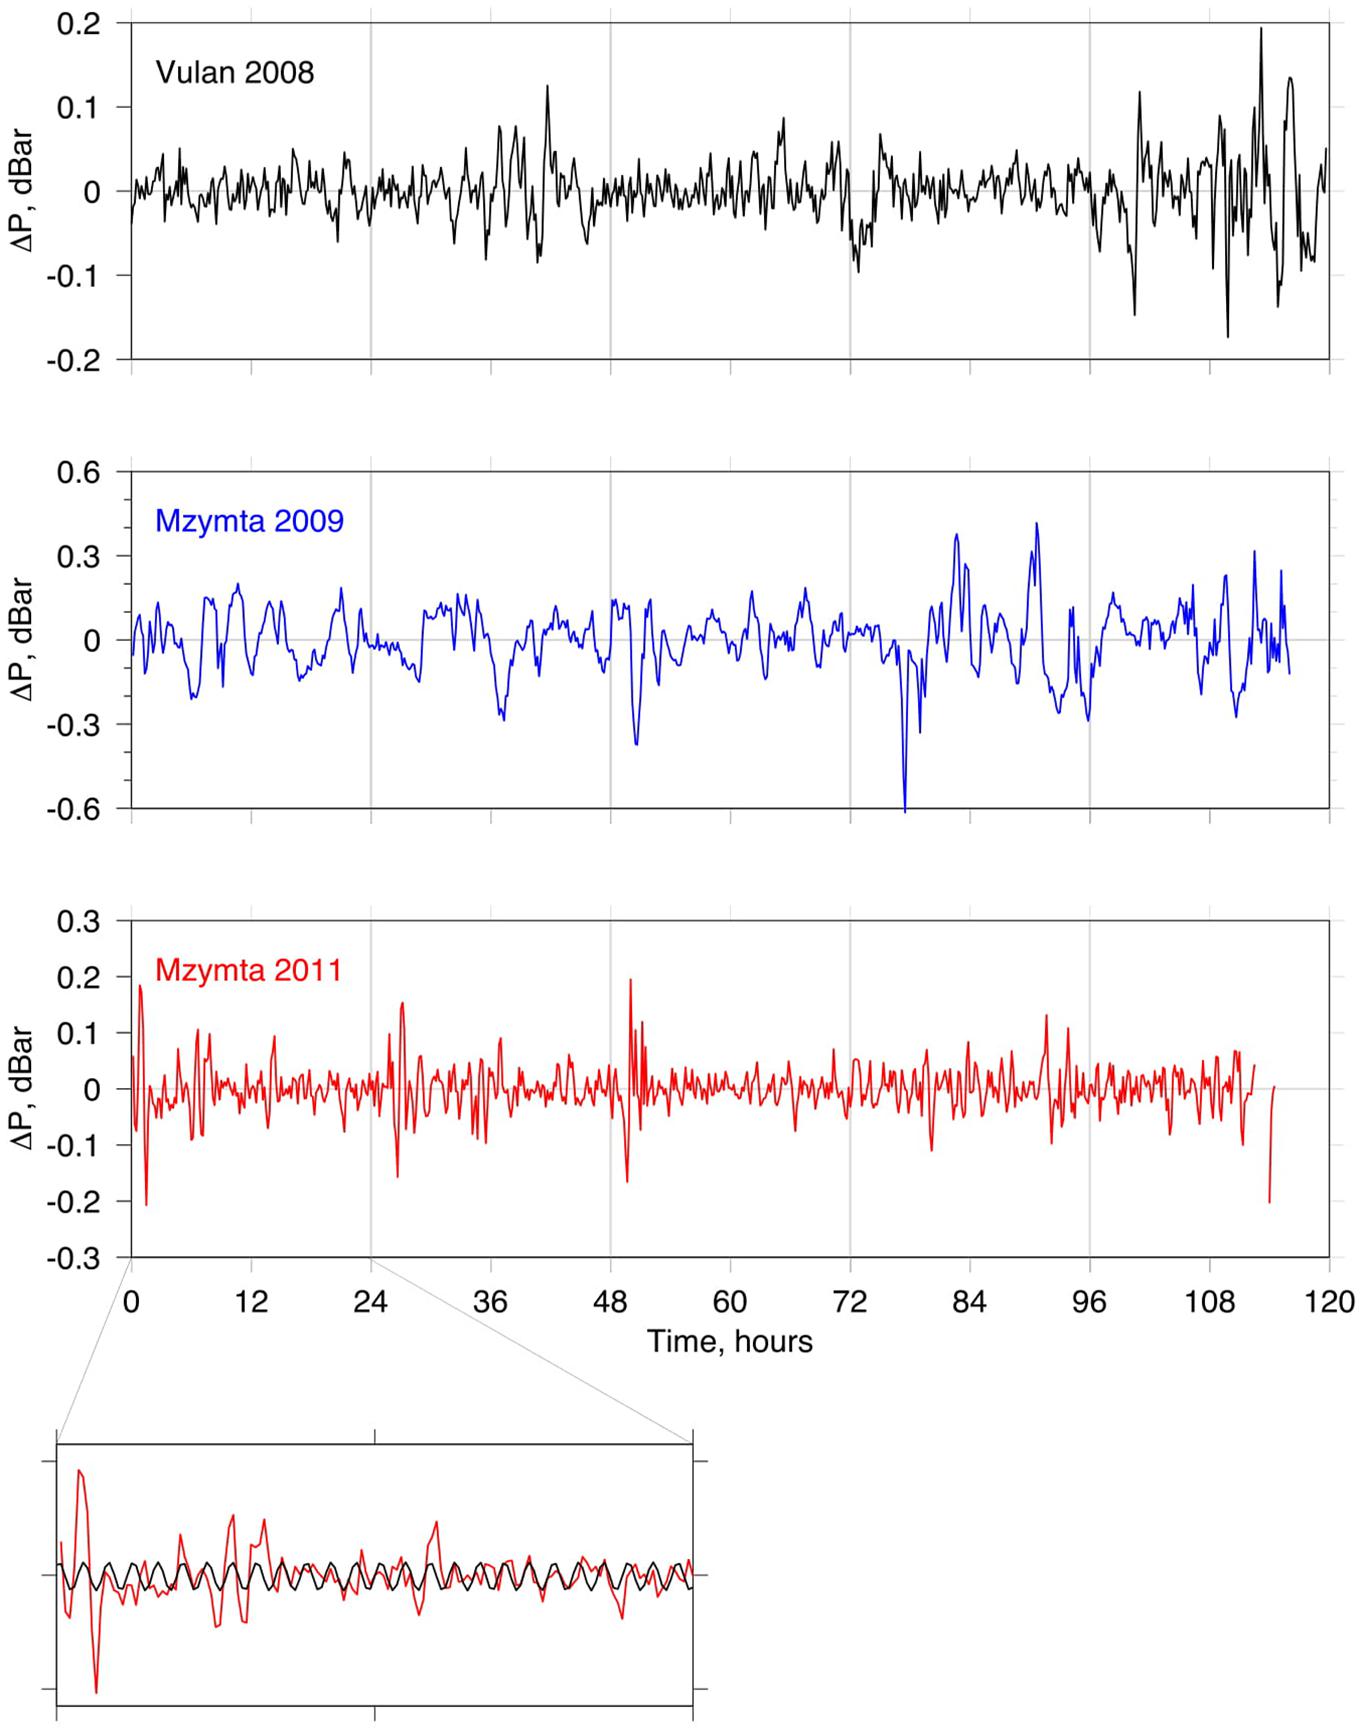
Figure 3. Same data series as in Figure 2, but high-pass filtered with 6 h wide moving window filter. The inset in the lower panel illustrates the procedure of finding the harmonic (black) best fitting the observational data (red) over the selected segment of the series (24 h in this case).
We note that, as demonstrated by the CTD measurements, the water density at the locations of the deployments remained nearly constant throughout the observations and varied only slightly within 0.5 kg m–3, which implies a change of less than 0.1% of hydrostatic pressure (for a fixed height of the water column). On the other hand, the sea surface height (SSH) change of only 2 cm (which we consider the minimum resolvable by the equipment used) for a water column of 5 m will result in pressure change larger by a factor of 4 at least. We, therefore, assume hereinafter that the observed variability of pressure was totally due to the SSH changes, and pass from pressure units to the units of SSH (1 cm = 10–2 dBar).
To get some insights as to the origins of the SSH variability, we computed the lagged correlations between the SSH series (low-passed and high-passed) and the wind stress components with the time lags from 0 to 24 h. An example corresponding to the measurements taken in 2011 is shown in Figure 4. The figure is based on the series of 687 members, hence, a 99% significance level for the correlation coefficient according to the standard t-statistic test is 0.098, as indicated by yellow shading in the plot. It is notable that while the low-passed SSH changes and the components of the wind stress τshow significant synoptic correlation whose shape strongly suggests 24-h periodic breeze forcing, no significant correlation is seen at any time lag for the high-passed SSH series (not even with the high-passed τ, not shown here). We also computed the correlation between the high-passed SSH and the atmospheric pressure (the green curve in Figure 4), which also proved insignificant at any temporal lag. The respective figures illustrating the measurements of 2008 and 2009 are not shown here, but they are generally similar to Figure 4.
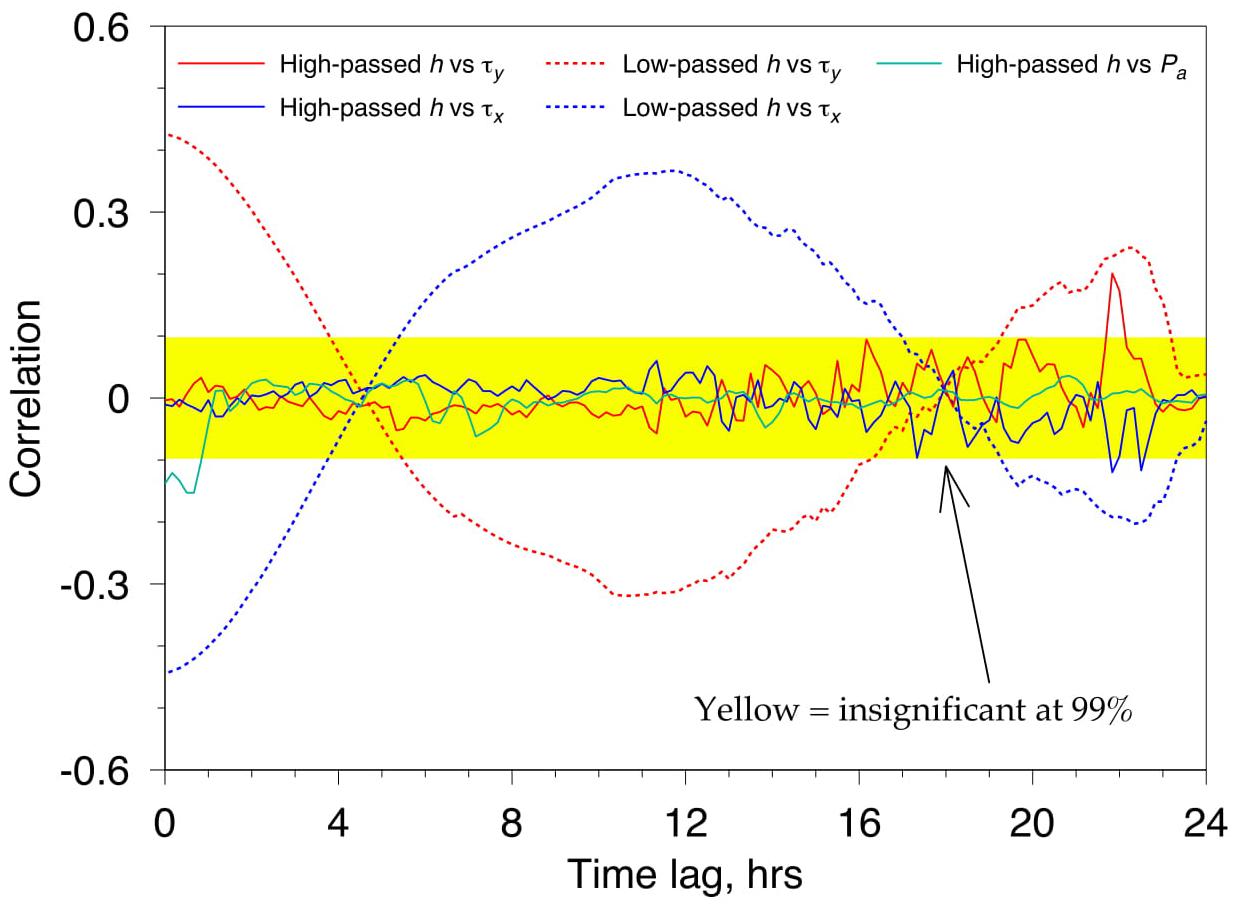
Figure 4. Correlations between high-pass filtered SSH and meridional wind stress series (red, solid); high-pass filtered SSH and zonal wind stress (blue, solid); low-pass filtered SSH and meridional wind stress (red, dotted); low-pass filtered SSH and zonal wind stress (blue, dotted); high-pass filtered SSH and atmospheric pressure (green) as functions of the time lag. Mzymta-2011 experiment. Only values outside the yellow corridor are significant at 99%.
Next, we performed harmonic analysis of the high-passed SSH series using the following approach: we found a harmonic best representing the observational data within a specific time interval by fitting the amplitude C, the period T, and the initial phase φ which would minimize the rms deviation from the data. This procedure is illustrated in Figure 3 (see the best fitting harmonic in the small inset at the lower panel). The time intervals we selected for this analysis were the 12-h intervals from 8 a.m. to 8 p.m. on the days when observational estimation of the plume size was feasible.
The next step of the analysis was aimed at finding any dependencies that could possibly exist between the oscillation period and amplitude and the length scale of the plume. Unfortunately, in situ determination of the plume size required rather extensive CTD mapping, and, consequently, the amount of data we could rely on for this purpose was limited – in total, at our disposal there were only 9 individual days of measurements (see Table 1) for which we could infer the plume size estimated through the procedure described in the «Data» section. However, as shown in Figure 5, the available data suggested that both the period and the amplitude increased with the horizontal size of the plume. While the plume size spanned in a broad interval from 820 to 14750 m, the oscillation periods varied from 72 to 224 min and the ranges from 2.0 to 25.0 cm.
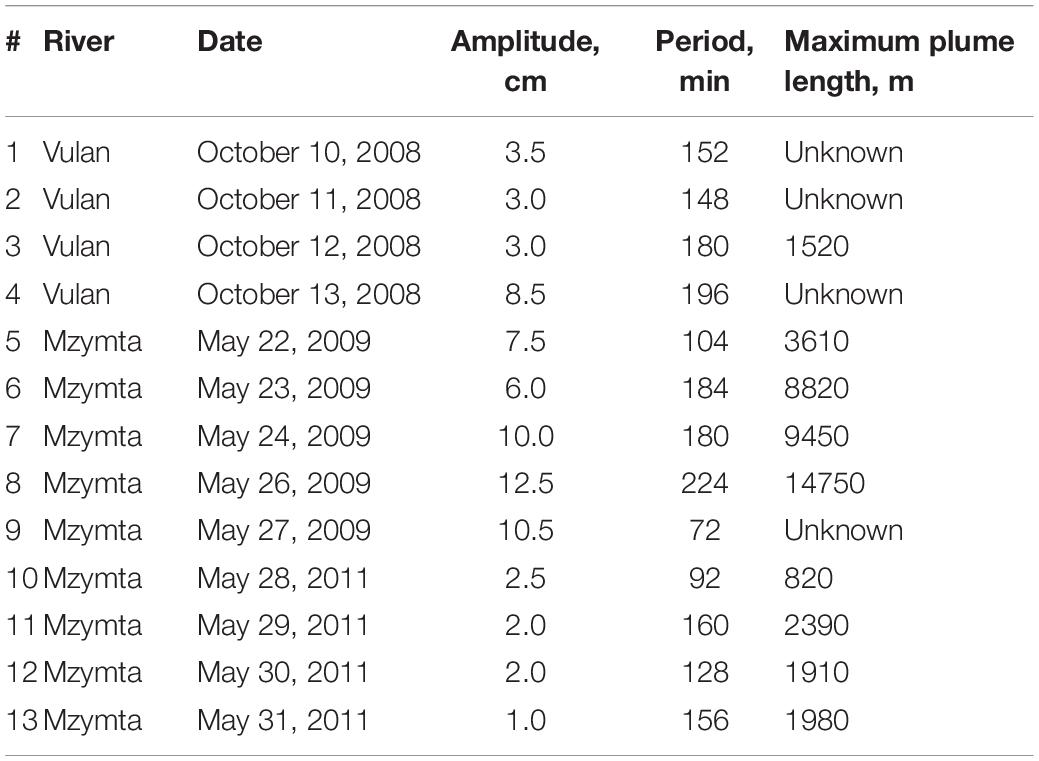
Table 1. Amplitudes and periods of harmonics best fitting the SSH variability data and plume sizes for individual days of observations.
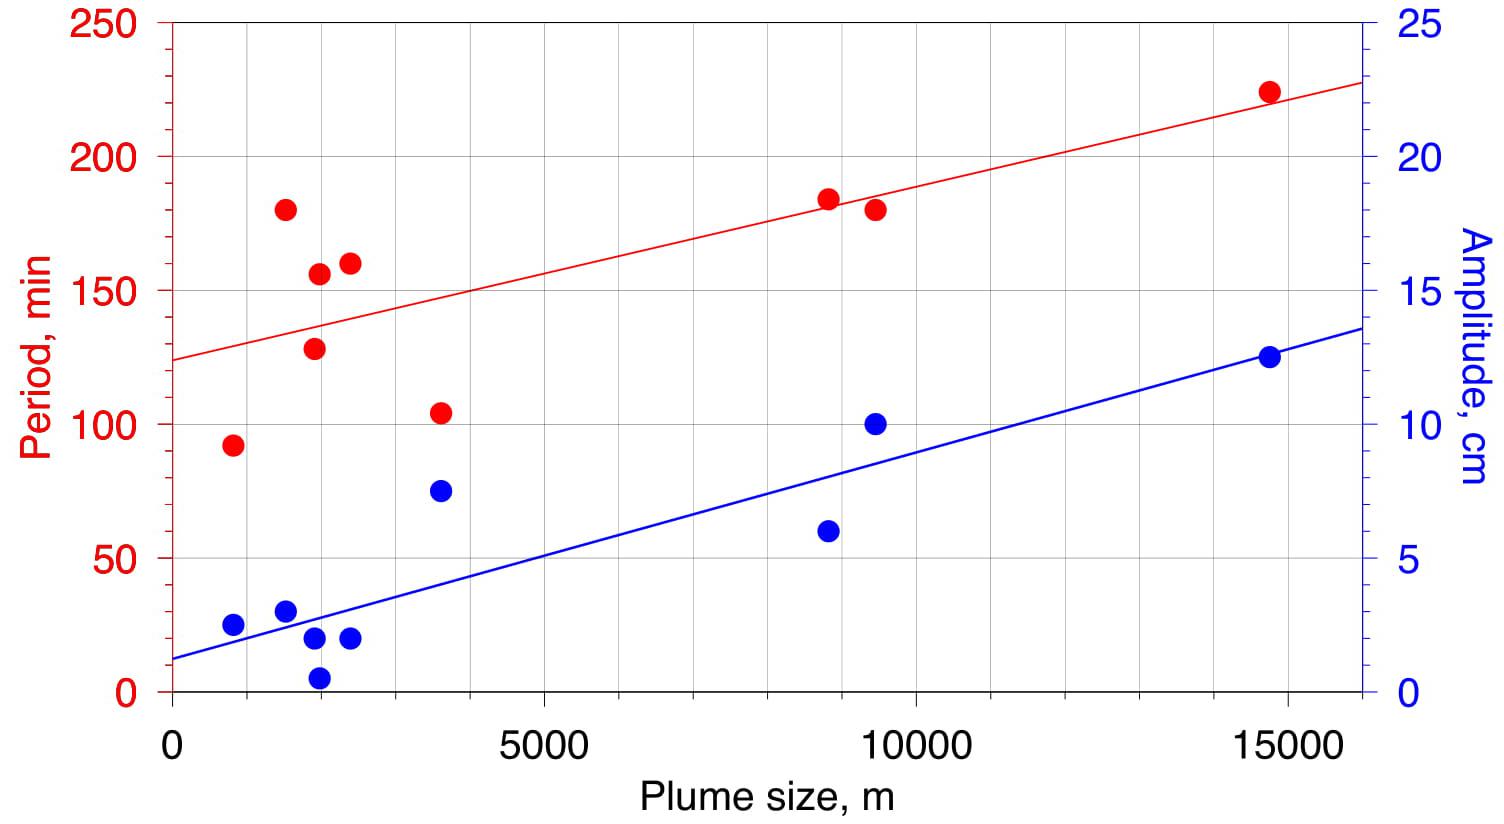
Figure 5. Dependencies of the period (red) and amplitude (blue) of the oscillation harmonic best fitting the data on the plume size for individual days of observations. Straight lines are the respective linear regressions.
A significantly larger amount of observational evidence is available for investigating the mutual relations between the periods and the amplitudes of the SSH oscillation. To this end, we used 352 6-h wide data subsets distributed through the 3 data series with temporal shifts of 1 h between the neighboring subsets. The results of this analysis are summarized in Figure 6. The red bullets in the figure represent averages over 20-min bins of period values, the yellow shading is the respective rms deviation corridor, and the blue crosses are averages over 4-min intervals. As it is evident from Figure 6, the amplitude generally grows with the period.
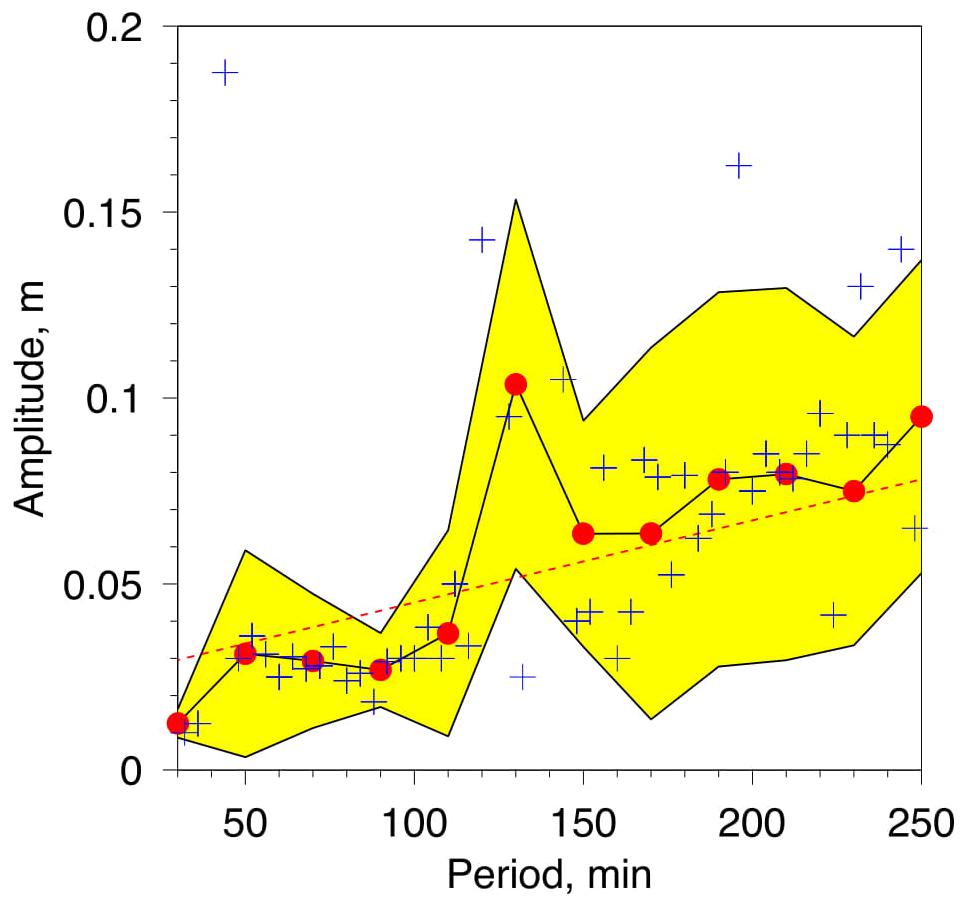
Figure 6. Relation between the period and the amplitude of the oscillation based on 6-h wide subsets of all data series (total of 352 data subsets). Red bullets are the averages over 20-min intervals of period values (dashed line is the respective linear regression, yellow shading indicates the rms deviation corridor), and blue crosses are the averages over 4-min intervals of period values.
Discussion
At this point, let us summarize the main findings that we have obtained from the analysis of the data exposed above.
(i) First: while during the measurements the observed SSH changes in river plumes were dominated by low frequency variability at periods over 6 h, there always existed a smaller amplitude and higher frequency variability at periods 1–4 h superimposed on it.
(ii) Second: while the former was significantly correlated with the wind stress and, hence, likely wind-driven, the latter exhibited no significant correlation with either wind or atmospheric pressure.
(iii) Third: the amplitudes of the SSH oscillations generally increased with the increase of the periods thereof.
(iv) Fourth: both the periods and the amplitudes of these oscillations appeared to increase as the plume size was getting larger.
What dynamical mechanisms could explain these oscillatory patterns? First of all, it is worthy of reminding that the Black Sea is considered a non-tidal basin. Although previous studies revealed that there actually do exist rudimentary tides with the maximum range of 2–3 cm at the diurnal and semi-diurnal frequencies (Hüseyin, 1993; Medvedev and Kulikov, 2016), neither their periods nor the amplitudes fit in the ranges we have encountered. One possible mechanism might be associated with surface seiches. However, the periods of the seiches typical in the northeastern coastal part of the Black Sea investigated rather thoroughly in previous studies were in the range from 5 to 11 h (Hüseyin, 1993; Ivanov et al., 1996; Medvedev and Kulikov, 2016) and, hence, were significantly longer than those observed in the case of our interest. Another candidate mechanism for oscillatory behavior of SSH, the coastal trapped waves, develop mainly at subinertial frequencies (e.g., Dale and Sherwin, 1996), i.e., at periods over 17 h for the region of this study. For example, the spectra of trapped waves off the coast of Crimea as obtained from direct observations by Ivanov and Yankovsky (1995) peaked at about 27 h. Trapped waves at the superinertial domain have also been predicted for the Black Sea by means of numerical modeling, but their periods exceeded 6 h in a majority of cases (Ivanov et al., 2018). Thus, although the attribution of the short-period oscillations we focus on in this article to seiches or coastal trapped waves cannot be completely ruled out, we deem it unlikely.
We, therefore, hypothesize that the oscillations described above were generated by a mechanism related to the internal dynamics of river plumes themselves. To disclose it, we first consider the following deliberately oversimplified model where the plume is thought of as a box of horizontal size b with the upper lid freely moving along the vertical axis. The height of the plume surface H(t) above the mean sea level depends on time t. Let the plume receive the inflowing water from the river at a constant velocity equal to Um at the mouth and volume rate Q (m3s–1), and lose the water through an outlet of the effective cross-section area A with the depth-averaged velocity U(t) which is governed solely by the pressure gradient created by the elevation of the plume surface. Given this, the mass and the momentum budgets read simply
and
where ρ is the water density, P is the pressure, and x is the horizontal coordinate across the plume [hereinafter, we adopt the notation used by Branch et al. (2020)]. Differentiating Eq. (1) by time and using Eq. (2), we immediately obtain:
Obviously, Eq. (3) describes harmonic oscillations with the period equal to:
Furthermore, if we assume that A≃bh, where h is the characteristic depth under the plume, we get:
Note that if we consider h≃ 10 m, the slope of the linear dependence between T and b is equal to 0.63 s m–1, which compares reasonably well with the value obtained in the observations (0.41 s m–1, see red regression line in Figure 5).
Of course, this schematic model is very far from being realistic, as it completely ignores dynamical features that are known to be of great importance for real river plumes, such as friction, as well as advection of momentum (not to mention the Coriollis force, where applicable). It also ignores complex internal structure of a river plume (e.g., Zavialov et al., 2018). Rather than a real plume, the equations above are appropriate for describing the motion of a moving upper lid of a solid tank where water is pumped into at a constant rate from an inbound pipe, and flows out freely through an outbound pipe. Somewhat surprisingly, this representation of the plume, however, oversimplified, does explain (at least, qualitatively) all four properties (i–iv) evident in the observational data. Indeed, harmonic oscillations of the plume surface arise naturally as a solution of Eq. (3); moreover, it follows immediately from Eqs. (4) or (5) that their period increases with the plume size. The amplitude of the oscillations will depend on the initial conditions, i.e., the initial liftoff of the plume “ridge” (Branch et al., 2020) with respect to the mean level. It seems reasonable to assume that this liftoff is proportional to the river discharge rate Q. On the other hand, the plume size is also generally proportional to Q if other parameters are fixed (e.g., Osadchiev and Zavialov, 2013). From this point of view, both the amplitude and the period are likely to be proportional to b and, therefore, to each other.
In short, the suggested physical mechanism can be described verbally as follows. There are two reference values of the plume surface elevation, one corresponding to the equilibrium of the mass budget, and the other one – to the equilibrium of the momentum budget, and these two “equilibria” generally do not coincide. Consider, for example, the situation where the inflow from the river exceeds the outflow from the plume, so that the plume surface height grows, thus boosting the pressure gradient and the outflow rate. At some point of time, equilibrium with respect to the mass budget is achieved when the total mass flux of water coming from the river into the plume is balanced by the outflow from the plume. However, at that moment, the total force applied to the outflowing water particle is not zero, so that the momentum budget is not equilibrated and the instantaneous outflow velocity that would provide for mass conservation at a stationary plume surface height cannot be maintained and keeps increasing, leading to a drop of the surface height. Subsequently, at some point of time the momentum budget attains equilibrium – but the mass budget no longer does, and the plume volume and hence the surface height resume to increase. This cycle repeats over and over again in the form of periodic oscillations.
We believe that the simple physics outlined above may be a driver of vertical oscillations of the surface in real plumes, even though their dynamics is much more complex. If we consider the other terms of the momentum budget, quantitative details do change, but the general mechanism leading to oscillations remains the same. Indeed, with the nonlinear terms and vertical friction taken into account, Eq. (2) now takes the form
The second and the third terms in the right-hand side of Eq. (6) represent the advection of momentum and the vertical friction, respectively, CD is the dimensionless bottom drag coefficient. This form of momentum equation was used in Branch et al. (2020), cf. Eq. (16) therein, except that these authors set the left-hand side to zero to investigate the steady state profile of the plume ridge, while here we retain the temporal derivative in order to describe the ridge oscillations. The dynamics of the plume is fully determined by the momentum Eq. (6) together with the mass conservation Eq. (1).
This system of first-order equations no longer explicitly reduces to the harmonic oscillations Eq. (3), but it can be easily solved numerically. We approximate as and as where S is the cross-sectional area of the inflow at the river mouth. We then start with H = 0 and U = 0 (for example), and at each time step of the integration set to be equal to Δt=1 min first calculate ΔH and the next value of H from Eq. (1), and then ΔU and the next value of U from Eq. (6), continuing this process for 12 h. Examples of numerical solutions obtained thereby are shown in Figure 7. The following settings which roughly correspond to real conditions of the Mzymta plume were used for these particular integrations: b = 7000 m, h = 4 m, Um≡ Q/S = 0.6 m s–1. In Figure 7, the black shaded curve corresponds to the case where the second and the third terms in the right-hand side of Eq. (6) were set to null, i.e., the acceleration of the liquid particle was only balanced by pressure gradient force, and the momentum budget returned to the form of Eq. (2). Not surprisingly, in this case the solution exhibited harmonic oscillations with constant amplitude and the period determined by Eq. (4). Red and green curves in Figure 7 represent solutions for the complete Eq. (6) with different values of the drag coefficient CD: for relatively high CD (red curve), the loss of momentum through bottom friction exceeds the gain of momentum from the river inflow and the amplitude of the oscillation decreases with time – and vise versa, if CD is relatively low (green curve), the advection of momentum exceeds friction and the amplitude grows. However, as it is clearly seen from Figure 7, the inclusion of momentum advection and friction terms into consideration changes neither the oscillatory pattern of vertical displacements of the plume surface, nor the period of these oscillations. The latter is still governed solely by the plume size and the mean depth in the area covered by the plume as prescribed by Eq. (5).
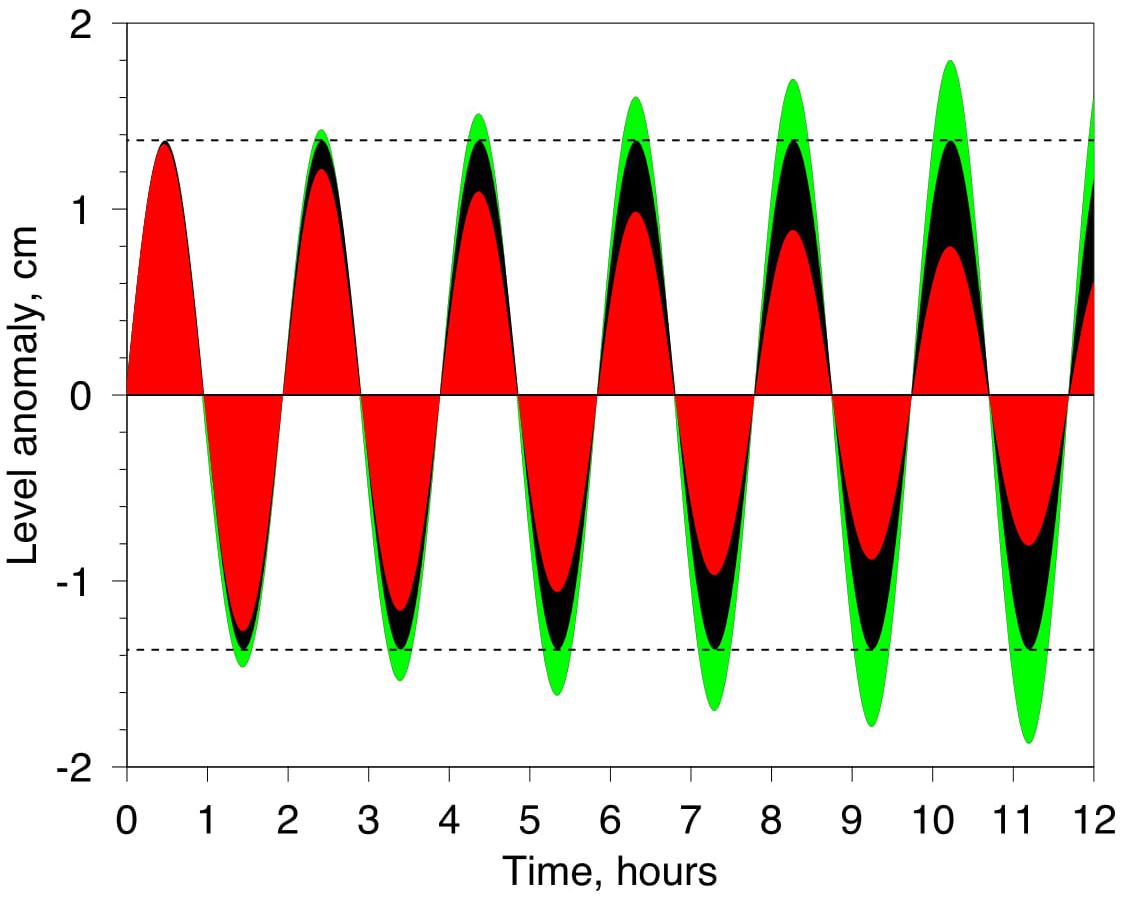
Figure 7. Black: numerical solution of Eqs. (1) and (2); red: numerical solution of Eqs. (1) and (6) for Cd = 10– 2; green: numerical solution of Eqs. (1) and (6) for Cd = 6 10– 3.
For medium size river plumes like that of the Mzymta where b≃ 104 m and h≃ 10 m, formula (5) leads to T≃100 min, which, indeed, agrees reasonably well with the SSH observations reported in this study. This order of magnitude estimate is also consistent with our earlier published data on variability of near-bottom velocity in the area adjacent to the Mzymta mouth that revealed pattern of internal waves propagating from the plume at about 0.7 m/s with periods spanning between 2.8 and 4.8 h, which implies the wavelengths between 7 and 12 km (Korotkina et al., 2014). However, for big rivers with b≥105 m, the SSH oscillation period should be of an order constrained by one or several days. Perhaps, historical records from level gauges deployed near the estuaries of major rivers may help to reveal this signal. This, however, is beyond the scope of the present study. Inversely, for very small rivers (b≃102 m) the expected period could be as short as 1 min or even shorter. Recent drone-borne observations of internal waves from plumes generated by small ducts of the Bzyb River in the northwestern Black Sea seem to be in line with this estimate (Osadchiev et al., 2020).
Conclusion
Data from pressure gauges deployed on the inner shelf of the northeastern Black Sea near the mouths of the Mzymta and the Vulan rivers revealed persistent periodic oscillations of the SSH within the river plumes corresponding to periods from 70 to 230 min and not correlated with either wind stress or atmospheric pressure. Although based on limited data, the available records suggested that both the period and the amplitude of these oscillations increased with the size of the plume. More voluminous observational evidence indicated that the periods and the amplitudes were in direct relation to each other. To interpret the measurements, we devised a simple physical model, which demonstrated that the momentum and the mass budgets of the plume taken together naturally provide for periodic vertical oscillations of the plume surface, and the said oscillations can be deemed an intrinsic property inherent to river plumes. This may have several important implications. In particular, the observed pressure oscillations associated with the SSH variability may represent a forcing mechanism for internal waves generated by river plumes. This, however, requires further investigation.
Data Availability Statement
The original contributions presented in the study are included in the article/supplementary material, further inquiries can be directed to the corresponding author.
Author Contributions
The author confirms being the sole contributor of this work and has approved it for publication.
Funding
This study was supported by the Ministry of Science and Higher Education of Russia, theme 0128-2021-0001, and the Russian Foundation for Basic Research through Grants 20-55-75002 (data analysis) and 19-55-80004 (plume modeling).
Conflict of Interest
The author declares that the research was conducted in the absence of any commercial or financial relationships that could be construed as a potential conflict of interest.
Acknowledgments
The author thank the crew of R/V Ashamba, all participants of the field campaigns, and Dr. A. Subbotin for critical reading of the manuscript.
References
Alexeevsky, N. I., Magritsky, D. V., Koltermann, K. P., Krylenko, I. N., and Toropov, P. A. (2016). Causes and systematics of inundations of the Krasnodar territory on the Russian Black Sea coast. Nat. Hazard. Earth Syst. 16, 1289–1308. doi: 10.5194/nhess-16-1289-2016
Branch, R. A., Horner-Devine, A. R., Kumar, N., and Poggioli, A. R. (2020). River plume liftoff dynamics and surface expressions. Water Resources Research 56e2019WR026475. doi: 10.1029/2019WR026475
Dale, A. C., and Sherwin, T. J. (1996). The extension of baroclinic coastal-trapped wave theory to superinertial frequencies. J. Phys. Oceanogr. 26, 2305–2315. doi: 10.1175/1520-0485(1996)026<2305:teobct>2.0.co;2
Dzhaoshvili, S. H. (2002). Rivers of the Black Sea, Technical Report no. 71. European Environmental Agency, 58. Available online at: www.reports.eea.eu.int/technical-report-2002-71
Garvine, R. W. (1984). Radial spreading of buoyant surface plumes in coastal waters. J. Geophys. Res. 89, 1989. doi: 10.1029/JC089iC02p01989
Garvine, R. W., and Monk, J. D. (1974). Frontal structure of a river plume. J. Geophys. Res. 17, 2251–2259. doi: 10.1029/JC079i015p02251
Horner-Devine, A. R., Hetland, R. D., and MacDonald, D. G. (2015). Mixing and transport in coastal river plumes. Annu. Rev. Fluid Mech. 47569e594.
Hüseyin, Y. (1993). Analysis of the water level variations in the eastern Black Sea. J. Coastal Research 9, 1075–1082.
Ivanov, V. A., and Yankovsky, A. E. (1995). Dynamics of the Crimea shelf waters in summer. Physical Oceanography 6, 201–217. doi: 10.1007/BF02197518
Ivanov, V. A., Manilyuk, Y. V., and Cherkesov, L. V. (1996). Seiches in the Black Sea. Soviet Meteorology and Hydrology 11, 57–63. (in Russian),Google Scholar
Ivanov, V. A., Shul’ga, T. Y., Plastun, T. V., and Svishcheva, I. A. (2018). Spatial and temporal parameters of the trapped waves in the Black Sea shelf areas. Physical Oceanography 25, 280–294. doi: 10.22449/1573-160X-2018-4-280-294
Kilcher, L. F., and Nash, J. D. (2010). Structure and dynamics of the Columbia River tidal plume front. J. Geophys. Res. 115, C05S90. doi: 10.1029/2009JC006066
Korotkina, O. A., Zavialov, P. O., and Osadchiev, A. A. (2011). Submesoscale variability of the current and wind fields in the coastal region of Sochi. Oceanology 51, doi: 10.1134/S0001437011050109
Korotkina, O. A., Zavialov, P. O., and Osadchiev, A. A. (2014). Synoptic variability of currents in the coastal waters of Sochi. Oceanology 54, 545–556. doi: 10.1134/S0001437014040079
Lavrova, O., and Mityagina, M. (2017). Satellite survey of internal waves in the Black and Caspian Seas. Remote Sensing 9, 892. doi: 10.3390/rs9090892
Medvedev, I. P., and Kulikov, E. A. (2016). Spectrum of mesoscale sea level oscillations in the northern Black Sea: Tides, seiches, and inertial oscillations. Oceanology 56, 6–13. doi: 10.1134/S0001437016010094
Mendes, R., da Silva, J. C. B., Magalhaes, J. M., St-Denis, B., Bourgault, D., Pinto, J., et al. (2021). On the generation of internal waves by river plumes in subcritical initial conditions. Scientific Reports 11, 1963. doi: 10.1038/s41598-021-81464-5
Mestres, M., Sánchez-Arcilla, A., and Sierra, J. P. (2007). Modeled dynamics of a small-scale river plume under different forcing conditions. Journal of Coastal Research 2010, 84–96. doi: 10.2112/1551-5036-47.sp1.84
Nash, J. D., and Moum, J. N. (2005). River plumes as a source of large-amplitude internal waves in the coastal ocean. Nature 437, 400–403. doi: 10.1038/nature03936
Osadchiev, A. A. (2018). Small mountainous rivers generate high-frequency internal waves in coastal ocean. Scientific Reports 8, 1–8. doi: 10.1038/s41598-018-35070-7
Osadchiev, A. A., and Korshenko, E. A. (2017). Small river plumes off the north-eastern coast of the Black Sea under average climatic and flooding discharge. Ocean Sci. 13, 465–482. doi: 10.5194/os-13-465-2017
Osadchiev, A. A., and Zavialov, P. O. (2013). Lagrangian model of a surface-advected river plume. Continental Shelf Research 58, 96–106. doi: 10.1016/j.csr.2013.03.010
Osadchiev, A. A., and Zavialov, P. O. (2019). “Structure and dynamics of plumes generated by small rivers,” in Estuaries and Coastal Zones—Dynamics and Response to Environmental Changes, ed. J. Pan (London: IntechOpen).
Osadchiev, A. A., and Sedakov, R. O. (2019). Spreading dynamics of small river plumes off the northeastern coast of the Black Sea observed by Landsat 8 and Sentinel-2. Remote Sensing of Environment 221, 522–533. doi: 10.1016/j.rse.2018.11.043
Osadchiev, A. A., Barymova, A. A., Sedakov, R. O., Zhiba, R. Y., and Dbar, R. S. (2020). Spatial structure, short-temporal variability, and dynamical features of small river plumes as observed by aerial drones: case study of the Kodor and Bzyp river plumes. Remote Sensing 12, 3079. doi: 10.3390/rs12183079
Stashchuk, N., and Vlasenko, V. (2009). Generation of internal waves by a supercritical stratified plume. J. Geophys. Res. 114, C01004. doi: 10.1029/2008JC004851
Smith, S. D. (1980). Wind stress and heat flux over the ocean in gale force winds. J. Phys. Oceanogr. 10, 709–726. doi: 10.1175/1520-0485(1980)010<0709:wsahfo>2.0.co;2
Yankovsky, A. E., and Chapman, D. C. (1997). A simple theory for the fate of buoyant coastal discharges. J. Phys. Oceanogr. 27, 1386–1401. doi: 10.1175/1520-0485(1997)027<1386:astftf>2.0.co;2
Zavialov, P. O., Makkaveev, P. N., Konovalov, B. V., Osadchiev, A. A., Khlebopashev, P. V., Pelevin, V. V., et al. (2014). Hydrophysical and hydrochemical characteristics of the sea areas adjacent to the estuaries of small rivers of the Russian coast of the Black Sea. Oceanology 54, 265–280. doi: 10.1134/S0001437014030151
Zavialov, P. O., Pelevin, V. V., Belyaev, N. A., Izhitskiy, A. S., Konovalov, B. V., Krementskiy, V. V., et al. (2018). High resolution LiDAR measurements reveal fine internal structure and variability of sediment-carrying coastal plume. Estuarine, Coastal and Shelf Science 205, 40–45. doi: 10.1016/j.ecss.2018.01.008
Keywords: river plumes, sea surface height, short term variability, in situ measurements, small rivers
Citation: Zavialov PO (2021) Are Periodic Oscillations of Sea Surface Height Inherent to River Plumes? Front. Mar. Sci. 8:679323. doi: 10.3389/fmars.2021.679323
Received: 11 March 2021; Accepted: 19 April 2021;
Published: 13 May 2021.
Edited by:
Alexander Yankovsky, University of South Carolina, United StatesReviewed by:
Georgia Kakoulaki, Joint Research Centre, ItalyDimitris Stagonas, University of Cyprus, Cyprus
Copyright © 2021 Zavialov. This is an open-access article distributed under the terms of the Creative Commons Attribution License (CC BY). The use, distribution or reproduction in other forums is permitted, provided the original author(s) and the copyright owner(s) are credited and that the original publication in this journal is cited, in accordance with accepted academic practice. No use, distribution or reproduction is permitted which does not comply with these terms.
*Correspondence: Peter O. Zavialov, cGV0ZXJAb2NlYW4ucnU=