 Yuanchao Wang
 Cui Liang
 Weiwei Xian
 Yibang Wang
- 1Key Laboratory of Marine Ecology and Environmental Sciences, Institute of Oceanology, Chinese Academy of Sciences, Qingdao, China
- 2Laboratory for Marine Ecology and Environmental Science, Qingdao National Laboratory for Marine Science and Technology, Qingdao, China
- 3University of Chinese Academy of Sciences, Beijing, China
- 4Center for Ocean Mega-Science, Chinese Academy of Sciences, Qingdao, China
- 5CAS Engineering Laboratory for Marine Ranching, Institute of Oceanology, Chinese Academy of Sciences, Qingdao, China
- 6Qingdao University of Science and Technology, Qingdao, China
The status of fishery resources in the Yangtze estuary and its adjacent waters is still unclear for the effective implementation of fishery management strategies. To help address this gap, a new method especially for data-limited fish stocks (LBB) was applied to assess seven commercially and ecotrophically important fish stocks. Fish specimens were collected in the estuary by bottom trawling quarterly from May 2018 to February 2019. Two historical datasets were collected with the same method in the same area for Indian perch (Jaydia lineata) and sickle pomfret (Pampus echinogaster). To explore the growth features and resilience of fish stocks, auximetric plots and growth performance indices (Φ′) were used. Results showed that common hairfin anchovy (Setipinna tenuifilis) in 2018 and Indian perch in 2018 showed a healthy stock biomass status with complete length structures under a sustainable fishing pressure. The others were outside of safe biological limits or overfished. The Lmean/Lopt < 0.9 in six (67%) of nine LBB models for seven fish stocks suggested that most of the stocks were truncated in length structures. This contribution provides the main fishery reference points regarding stock status that can inform managers and form the basis for various management strategies.
Introduction
Despite the fact that China has the largest capture production worldwide with the insight of the distortion in catches (Watson and Pauly, 2001; Pauly and Le Manach, 2015; FAO, 2019), effective fishery management remains a huge challenge. In fact, there are various fishery management strategies in China, including input control, output control, technical control and management measures, economic instruments, management of aquaculture, distant water fisheries management, and international cooperation mechanisms (Cao et al., 2017; Huang and Tang, 2019). Nevertheless, the effects of these strategies regarding fishery conservation are limited. For example, the fishery licensing system (input control) has been in force since 1979. Numerous acts have amended the Fisheries Law of People’s Republic of China since 1986, continuously reinforcing the fishery licensing system. However, there is a noticeable gap between reality and expectation regarding the licensing system’s implementation process because the prerequisite, namely the status of fishery resources, is often neglected (Huang and Tang, 2019). In China, such a gap along with the lack of fishery reference points and raw data precludes the possibility of optimizing management and conserving fishery resources.
The Yangtze estuary and its adjacent waters (YE), the most representative estuarine fishing ground in China, also faces such a challenge. Traditional fishery resources are experiencing serious depletions. Yellow croaker (Larimichthys polyactis) is an essential commercial fish species in the YE. There could be two populations, namely the northern and the southern in nearshore Chinese waters. In particular, the southern population, which is found in the Southern Yellow Sea and East China Sea, contributes to approximately 70–80% of the total catch of this fish stock. In 2000, this stock reached the highest landing ever (7,059 tonnes) in the YE (Xu and Chen, 2010). Its asymptotic length and age at which the probability of maturing is 95% (years) have been decreasing over time, as shown via biological parameters analysis (Shan et al., 2017). Osbeck’s grenadier anchovy (Coilia mystus) is an amphidromous and neritic fish with three local populations in China, i.e., in the YE, the Minjiang River, and the Pearl River (Zhang, 2001). It is a traditional and commercial fish species, and it is a brackish species in the YE (Yang et al., 2019). Its catch had reached the peak at 5,282 tonnes in the YE in 1974, constituting about 48.6% of the total catch. However, it is unable to form the fishing season in recent years (Zhuang et al., 2018). Common hairfin anchovy (Setipinna tenuifilis) is a bycatch species in the YE. The Latin name of this species was misapplied as Setipinna taty based on the Taiwan Fish Database (Shao, 2021). With severe depletions of traditional targets, common hairfin anchovy accounted for a relatively larger fraction of landings in the early 2000s (Zhuang et al., 2006). Bombay duck (Harpadon nehereus) is a major target of commercial fisheries in the YE in recent years. It was the only all-year-round dominant species in this area from 2012 to 2013 (Sun et al., 2015). The records of the so-called silver pomfret (Pampus argenteus) in the Bohai Sea, Yellow Sea, and East China Sea of China are those of sickle pomfret (Pampus echinogaster) based on morphological and molecular analyses (Li et al., 2017). It has been further utilized since the 1960s and became the main fishing target gradually after the 1970s. The fishing season for sickle pomfret was from late April to early June (He et al., 2006; Zhuang et al., 2006). However, it was severely depleted due to heavy fishing pressure in the 1990s. Previous research showed that the summer fishing moratorium in the East China Sea seemed to benefit this stock (Yan et al., 2019). Kammal thryssa (Thryssa kammalensis) and Indian perch (Jaydia lineata) are essential forage and bycatch species. These small fish species play an important role in the energy flow process of the estuarine ecosystem. Previous studies have often ignored the biological and ecological information for these small species due to their limited economic value and historical data. Apparently, there is an urgent situation in getting the pictures of stocks status of these resources and relative reference points for existing policies and managements.
Sustainable fisheries around the world require science-based management of all exploited fish species (MSA, 2007; CFP, 2013; Melnychuk et al., 2016; Cao et al., 2017; Rudd and Thorson, 2018). This highlights the need for stock assessment methods suitable for data-limited situations. One such method is the length-based Bayesian biomass estimator (LBB), a newly developed method to estimate relative biomass level (B/B0) and other reference points, such as Lmean/Lopt, using length frequency (LF) data (Froese et al., 2018a). The ratio B/B0 is an indicator of current biomass level relative to unexploited stock size, which is also treated as a basic input in other assessment models. The ratio Lmean/Lopt describes whether the age and size composition of an exploited stock is appropriate or not. LBB requires only representative LF data, which is usually easy to measure and collect, while other similar methods require more demanding input [length-based spawning potential ratio model (LB-SPR): Hordyk et al., 2015a, b, 2016; catch-curve stock reduction analysis model (CC-SRA): Thorson and Cope, 2015; length-based, integrated, mixed-effects model (LIME): Rudd and Thorson, 2018]. LBB assumes that mortality, growth, and recruitment should fluctuate around mean values over the range of ages in the respective LF samples, and stocks have typical growth and mortality patterns (Froese et al., 2018a).
In this study, we applied the LBB approach to estimate the status of seven common fish species in the YE. These consist of two forage species (kammal thryssa and Indian perch) and five valuable commercial species (yellow croaker, Osbeck’s grenadier anchovy, common hairfin anchovy, Bombay duck, and sickle pomfret), thus covering the spectrum from forage species to predators and therefore being a more representative dataset/analysis. This paper aims to provide a case study of exploring the stock status as well as essential reference points for these seven fish stocks in the YE. These results make the policy implementations more effective and can also be used as priors for other assessment models.
Materials and Methods
Survey Area
The YE (Figure 1), in the north of the East China Sea, is the biggest estuarine fishing ground in China. It is an essential habitat, supporting approximately 50 brackish and marine exploited fish populations (Zhuang et al., 2018). The sea surface temperature ranges from 7.16 to 30.12°C (Hou et al., 2013). The proportion of diatoms in the YE was declining, while that of pfiesteria was rising especially after the 2000s (Yang and Xu, 2014). Due to anthropogenic activities, the cumulative reduction of sediment discharge to the YE was up to 44.44 × 10⁸ tonnes from 1997 to 2015 (Guo et al., 2019).

Figure 1. The survey area and sampling sites in the Yangtze estuary and its adjacent waters, China.
Sampling Method
The sampling area ranged from 30°30′N to 32°20′N and 122°E to 123°30′E (Figure 1). Fish specimens were collected quarterly in May 2018, August 2018, November 2018, and February 2019 by bottom trawling with a cod end mesh size of 25 mm. Two historical LF datasets had been collected by the same gear of the same selectivity in the same area (Indian perch 1984: collected monthly from June 1984 to November 1984; sickle pomfret 1999: collected in November 1998 and May 1999; sickle pomfret 2012: May 2012). All specimens were identified to the species level and their scientific names were checked according to FishBase (Froese and Pauly, 2019). For each fish stock in question, its entire catch was collected and measured to the nearest 0.1 cm (standard length, SL). The detailed information of the seven stocks covered here are given in Table 1 and Supplementary Table S1. One species was tentatively identified as Kammal thrysssa (T. kammalensis), although it is described by Whitehead et al. (1988) as a strictly tropical species of Southeast Asia (see also Munroe and Nizinski, 1999).
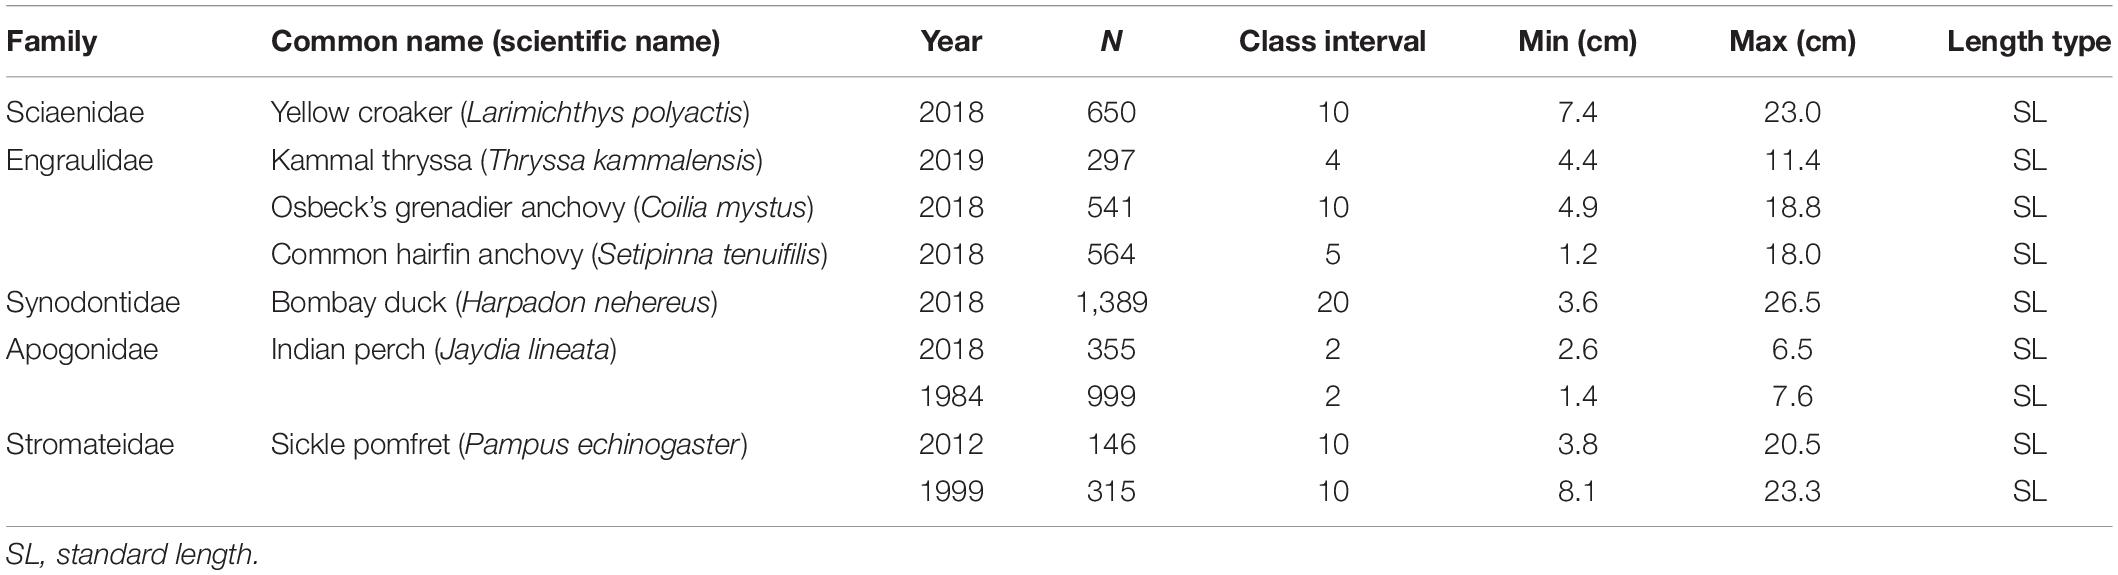
Table 1. Basic information for the seven studied fish stocks.
Growth Pattern
To explore the growth features among respective families and proxies for resilience in this study, auximetric plots and growth performance indices (Φ′) were used (Pauly, 1979, 1981, 1991; Munro and Pauly, 1983; Pauly and Munro, 1984; Murua et al., 2017). This study assumed that a family growth space could be treated as a reasonable range for fluctuations of growth parameters in this family. These seven fish species belong to five families (Table 1), with their growth spaces determined by two von Bertalanffy growth parameters (Linf and K). The records of Φ′ value for each fish species in question were extracted from FishBase. The Linf (SL) estimated by LBB was transferred into Linf′ (TL) according to length–length relationships, and then the KLBB and Φ′LBB for seven fish stocks in this study were estimated by the empirical equation in FishBase. This calculation assumed that a species would grow rapidly toward a small size when it faced with the risk of depletion. Relative parameters can be found in Supplementary Tables S2, S3.
Length-Based Bayesian Biomass Estimation
The LBB method could be used in the assessments of fish stocks, for estimating their relative stock size and other reference points. First of all, LBB approximates asymptotic length Linf, length at first capture Lc, M/K, and F/K over the past years. Reliable “true” values from other independent sources can be used to improve estimations. Taking these parameters as priors, LBB then gives the B/B0 for relative stock size and Lmean/Lopt for current size and age composition of health state (Froese et al., 2018a). The R-code can be found on http://oceanrep.geomar.de/43182/.
The LBB method assumes that growth can be described by the standard von Bertalanffy (von Bertalanffy, 1938; Beverton and Holt, 1957) growth equation, i.e.,
where Lt is the length at age t, Linf is the asymptotic length, K is the rate by which Linf is approached, and t0 is the theoretical age at zero length. The growth parameters Linf and K are used in several equations in this study.
The fully selected part of the commercial catch in numbers-at-length can be described as a function of total mortality rate relative to somatic growth rate (Z/K) (Quinn and Deriso, 1999), i.e.,
where NL is the number of survivors to length L, and NL_start is the number at length Lstart, which indicates the start size of full selection by gears. Z/K could be divided into M/K and F/K, and unfished state could be illustrated by setting F/K as 0 and NL_start as 1 in Eq. 2.
The catch in numbers that is subject to partial selection is a function of gear selectivity (here assumed trawl-like), which could be used as a complement to Eq. 2 and is described by Eq. 3, i.e.,
where SL is the fraction of individuals that are retained by the gear at length L, Lc is the length at first capture, and α describes the steepness of the ogive (Sparre and Venema, 1998; Quinn and Deriso, 1999).
Rearranging and combining Eqs. 2 and 3 leads to Eq. 4 (Froese et al., 2018a), which can be fitted to the whole catch in numbers-at-length and, thus, used to estimate Linf, the ratios M/K and F/K, and the selectivity parameters Lc and α. Eq. 4 has the form,
where NL_i is the number of individuals in length class Li, NL_i–1 is the number in the previous length class, CL_i represents the individuals that are vulnerable to the gear, and all other parameters are as described above. Dividing both sides of Eq. 4 by their respective sums yields the version of the LBB equation that is actually fitted to the catch in numbers curve (Eq. 5) (Froese et al., 2018a):
The following work is mainly about the Bayesian calculation of LBB within the Bayesian Gibbs sampler software JAGS (Plummer, 2003) and its execution using the statistical language R (R Core Team, 2013). Details of start values and priors for the Bayesian estimation are presented in Froese et al. (2018a). A Dirichlet-multinomial distribution is assumed in the fitting process of observed pL_i, and are predicted from Eq. 6:
where is a function of the estimable population dynamic based on Bayesian algorithm which finds the best fitting Linf, M/K, F/K, Lc, and α values in the process of fitting pL_i and . With the estimation of Linf, M/K, and F/K, the value of Lopt maximizing the unexploited cohort biomass can be calculated by Eq. 7 (Holt, 1958) and the Lc_opt value that leads to Lopt could be obtained by Eq. 8 (Froese et al., 2016):
Eq. 9 gives the yield-per-recruit (Beverton and Holt, 1966) formula, which uses the parameters estimated by LBB, i.e., Linf, Lc, F/K, M/K, and F/M:
An index of catch per unit effort (CPUE′/R), representing the relative stock status, is then calculated by dividing Eq. 9 by F/M as a proxy of fishing effort in Eq. 10:
By setting F as 0, the relative biomass level of unexploited state could be obtained in Eq. 11:
where indicated the exploitable fraction (>Lc) of the unfished biomass (B0).
Finally, an index of relative biomass depletion for the exploited part of the population B/B0 is then obtained from Beverton and Holt (1966) via Eq. 12:
The assumption of knife-edge selection in Eqs. 9 and 11 causes the overestimation of yield per recruit when the selection ogive overlaps with most of the life span of short-lived species (Pauly and Soriano, 1986; Pauly and Greenberg, 2013). To deal with this bias, LBB calculates the yield per recruit separately for each length group. The uncertainty in the estimation of B/B0 assumes to be related with that of F/K, M/K, F/M, and Linf (Froese et al., 2018a).
Results
In this contribution, nine LBB models were constructed for seven fish stocks from the YE. LF datasets of each stock from 2018 to 2019 were combined to increase sample size and representativeness. All LF data exhibited good patterns to reflect resource status and met the requirements of LBB (Figures 2, 3). Figure 2 shows the accumulated LF data used to estimate priors. The black curve in Figure 3 shows the fit of the LBB master equation (Eq. 5) for each stock, providing estimates for fishery reference points, i.e., M/K, F/M, B/BMSY, B/B0, Lmean/Lopt, and Lc/Lc_opt, which are given in Table 2, along with their 95% confidence intervals. The Lopt dash lines indicated relatively good stock status or good length structures if they were at the middle or left of the peak of the curves (Figure 3), which implied that only three stocks had relatively good length structures in this study.

Figure 2. Fitness to the fully selected part of the catch in the numbers curve used to obtain Linf (cm), Lc (cm), and Z/K priors for the seven studied fish stocks. Black dots indicated the observed LF data.

Figure 3. Graphical outputs of LBB analyses, showing the fit of the main LBB equation. Black dots indicated the observed LF data. Lopt and Linf were illustrated by two dash lines.
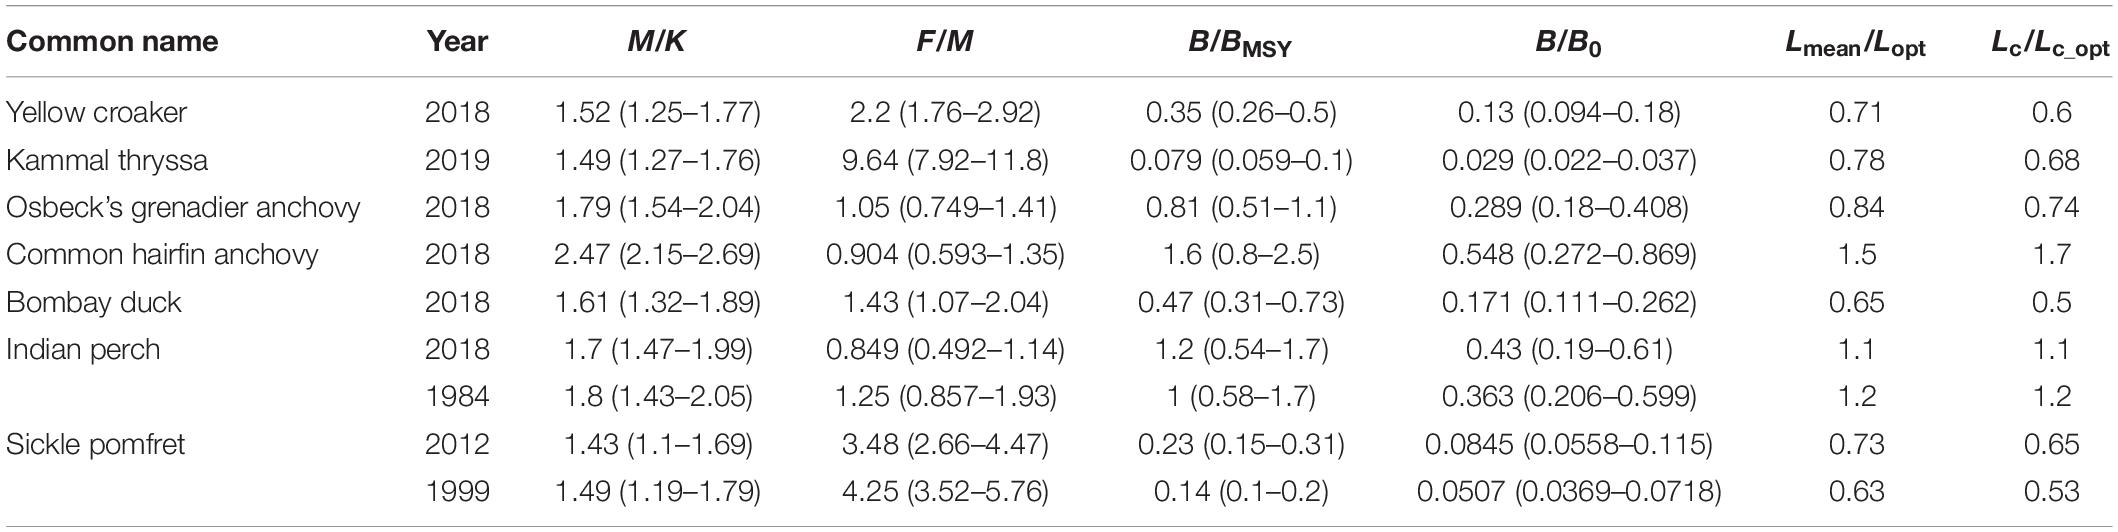
Table 2. Essential reference points from LBB estimates for the fish stocks in question.
Of the nine LBB models for seven fish stocks, only two (22%) had appropriate fishing mortalities with F/M < 1, suggesting an overall overfishing phenomenon. The ratios of Lmean/Lopt and Lc/Lc_opt were lower than 0.9 in six (67%) of these stocks, suggesting truncated length structure and fishing of too small individuals. Figure 4 depicts the narrow confidence intervals of Linf and points out that Kammal thryssa, yellow croaker, and sickle pomfret had severe decreases in biomass. By comparing the results from two distinct periods, the sickle pomfret and Indian perch showed apparently reduced Linf values in recent years; however, their B/B0 values, an indicator of depletion, seemed to increase.
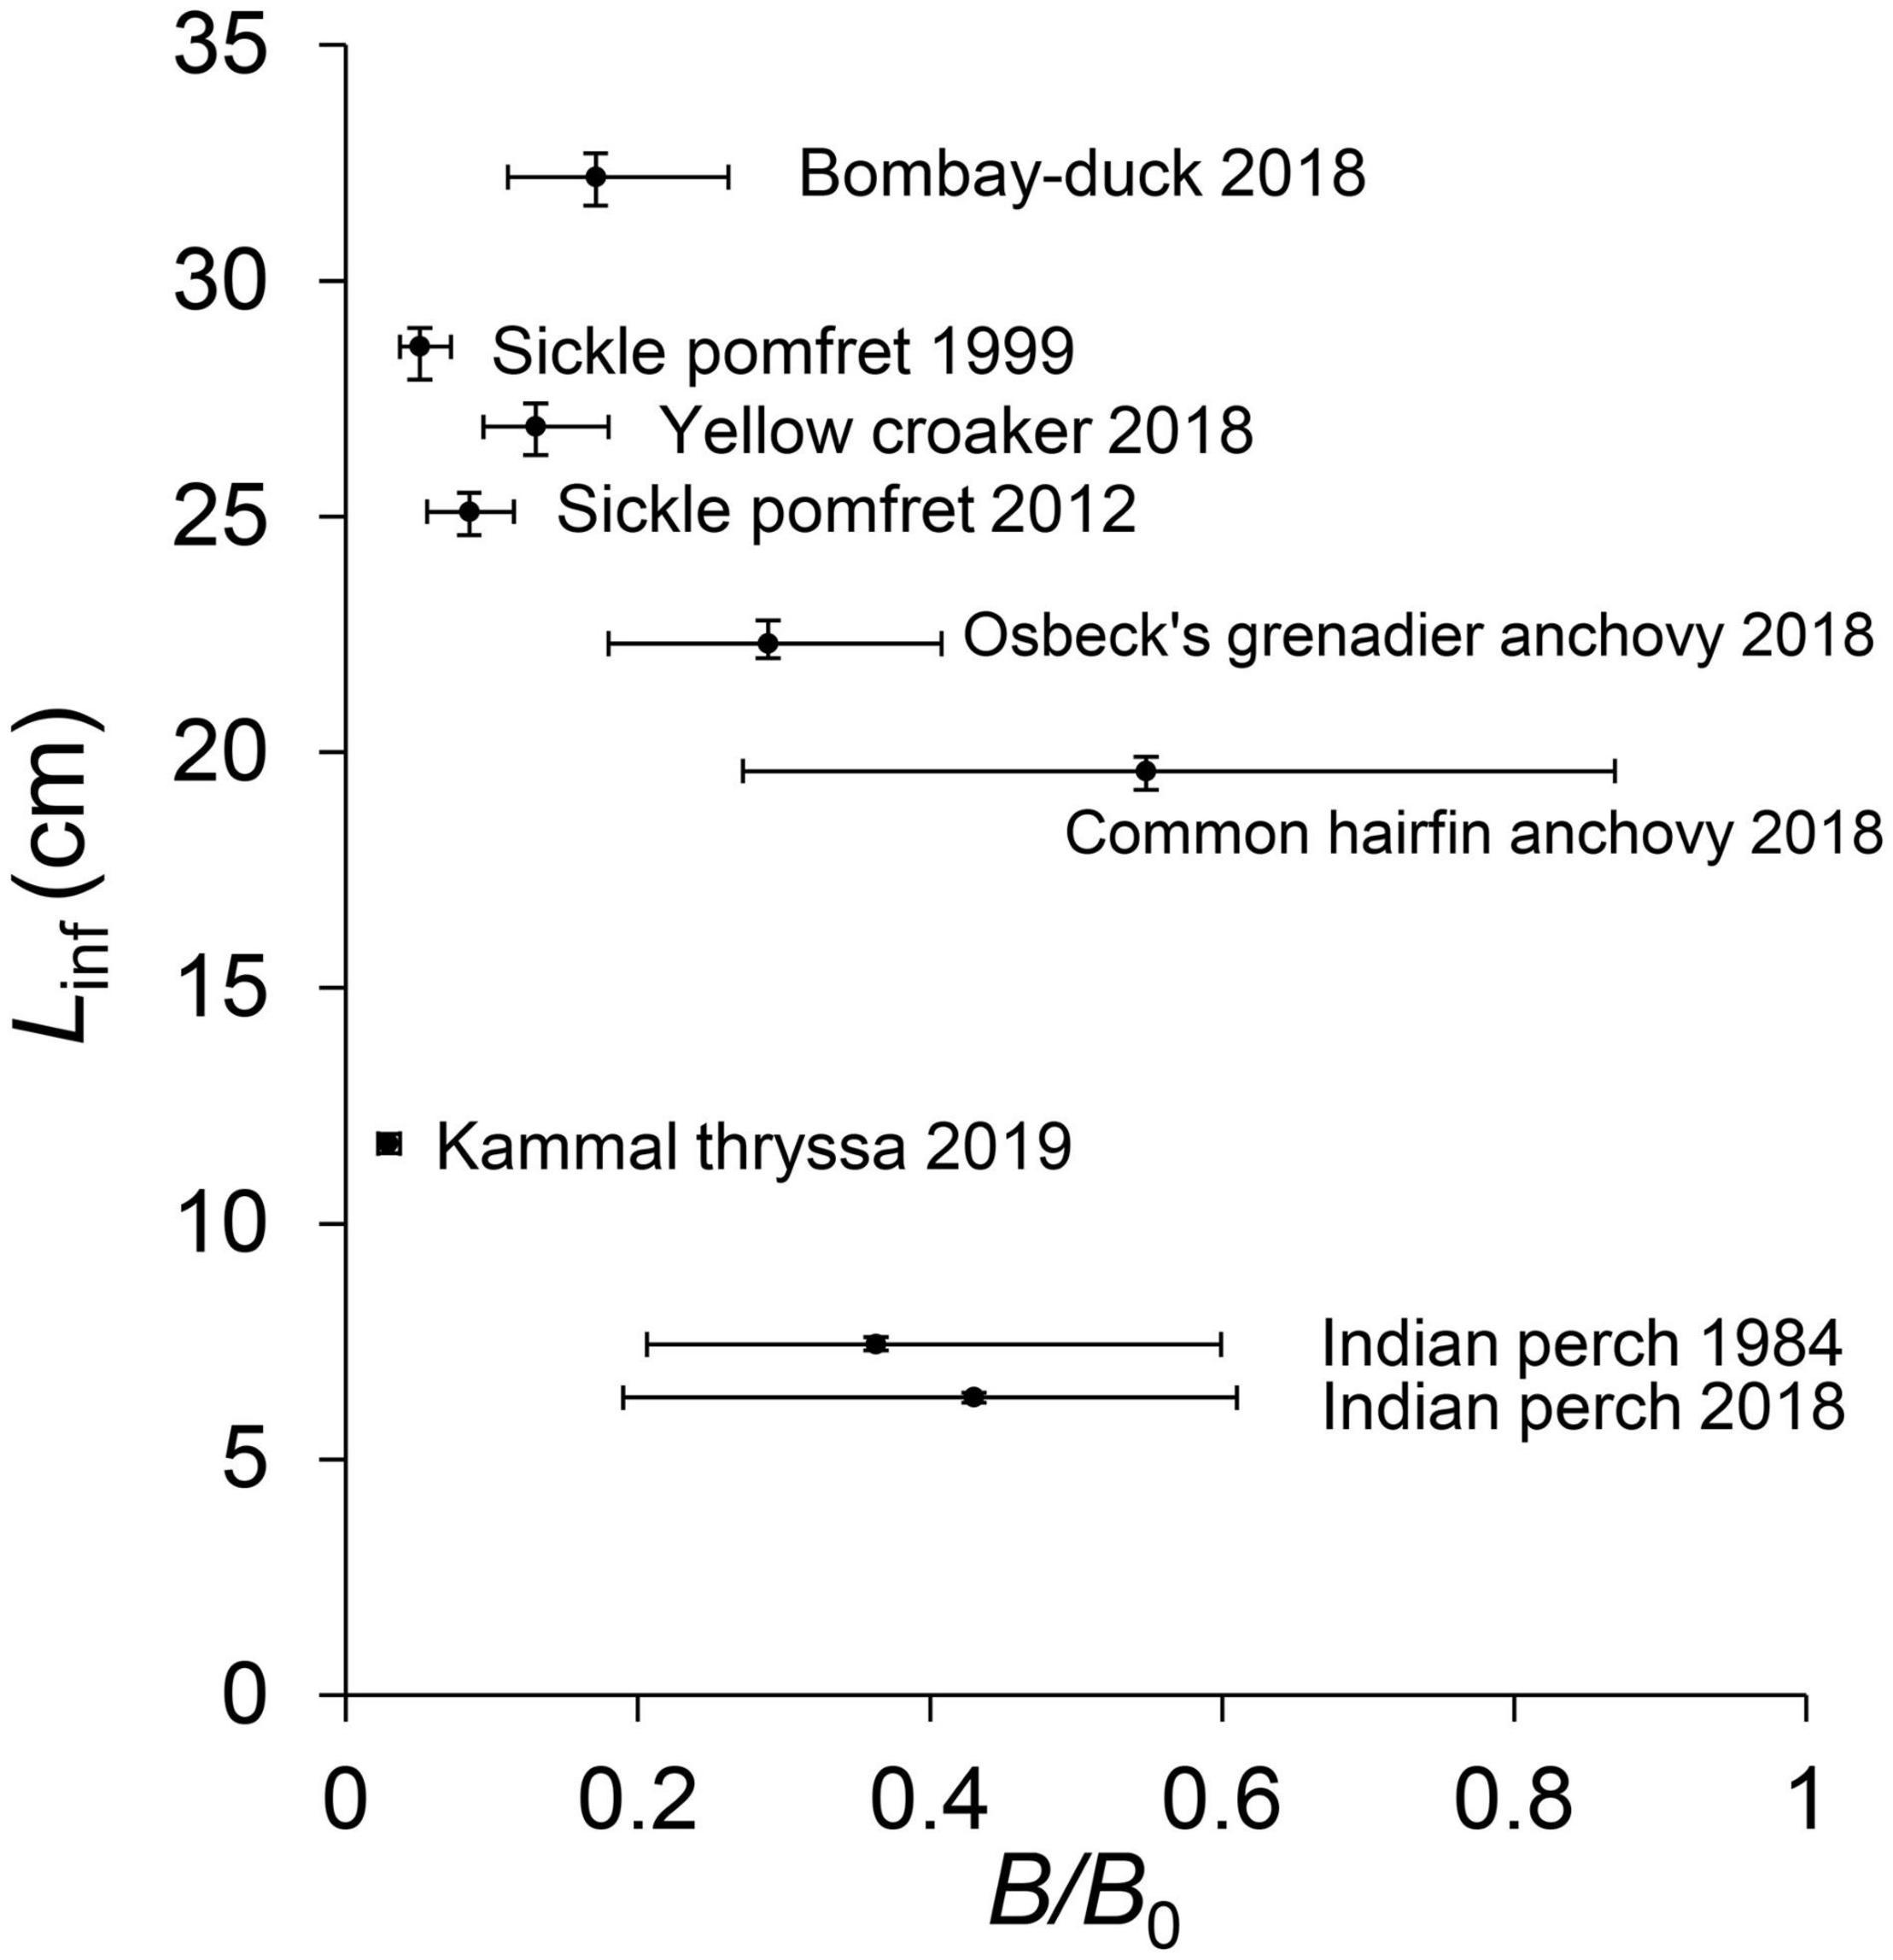
Figure 4. The scatter plot of Linf (cm) and B/B0 estimated from LBB with uncertainties.
Growth spaces of five families formed five distinct ellipsoid clouds in Figure 5. All ellipsoid clouds showed a downward trend, which indicated that in each family, smaller fishes tended to higher K and vice versa. Sciaenidae and Synodontidae tended to bigger size relative to the other three families, and Engraulidae species occupy a larger range of Linf. Apogonidae have relatively smaller body size and higher growth rate. Indian perch and kammal thryssa, as two forage species in this study, tended to faster growth with their smaller Linf and higher K relatively.

Figure 5. The auximetric plot with the growth spaces of five families (filled circles) and the growth position estimates for the seven fish stocks in question (hollow circles).
The Linf values estimated by LBB for Bombay duck and sickle pomfret, illustrated in Figure 6A by a cross, were close to the third quartile of the Linf records from FishBase. The Linf values of two anchovies were bigger than related records from FishBase, while the estimates for the two forage species were close to the respective medians. Figure 6B shows the growth performance indices (Φ′) of seven fish stocks (cross) based on Linf estimates from LBB. The Φ′ value of sickle pomfret was larger than the median of other populations of this same species, while that of Indian perch was lower than the median of relative records. The Lmean/Lopt < 0.9 in six (67%) of nine stocks, suggesting that most of the stocks were truncated in length structures (Figure 7). Only two stocks were subject to sustainable fishing pressure and of a healthy stock biomass. The others were outside of safe biological limits or overfished.

Figure 6. (A) The Linf (cm, total length) estimated by LBB for six fish species [cross; the Linf value of yellow croaker from LBB was not shown because of its unsuitable standard length (SL) and the lack of length–length correlation coefficients]. The box plots depict the records of Linf values collected from FishBase with mean values depicted by tiny squares. (B) The growth performance index (Φ′) of the seven fish species in question estimated by the Linf values from LBB (cross). The box plots show the growth performance index (Φ′) for these fish stocks with data collected from FishBase.

Figure 7. The scatter plot of B/BMSY and F/M for the nine LBB models of seven fish stocks in question. Red area, stocks that are being overfished or are outside of safe biological limits; yellow area, recovering stocks; green area, stocks subject to sustainable fishing pressure and of a healthy stock biomass. White dots mean Lmean/Lopt > 0.9.
Discussion
Stock Status Criteria
Punt et al. (2014) stated that BMSY is generally approximated between 0.35B0 and 0.4B0. Actually, FAO (Ye, 2011: 328) started to use B/B0 < 0.4 as the limit for overfishing since 2011. Based on the FAO definition of stocks status (B/B0 > 0.6: under fished; 0.4 < B/B0 < 0.6: fully fished; B/B0 < 0.4: overfished), Rosenberg et al. (2017) provided the stock status criteria based on B/BMSY with B0 = 2BMSY, suggesting that overfishing occurs when B < 0.8BMSY. Froese et al. (2018b) suggested that stocks were well managed and in good condition when F ≤ FMSY and B ≥ BMSY, and if B < 0.5BMSY, treated as outside of safe biological limits or depleted, corresponding with Opitz et al. (2016).
The biomass level below which a stock may be considered “collapsed” or deep-depleted is used to defining by B0, BMSY, or Max.catch (see Table 1 in Garcia et al., 2018), and there is no general agreement about this limit. The arbitrary B/B0 < 0.2 was widely used in conventional assessments to indicate the delaying depensation phenomena (Petitgas et al., 2010; Garcia et al., 2018). In this study, B/BMSY < 0.2 (i.e., B/B0 < 0.1 with B0 = 2BMSY) was accepted in Table 3. Collapse means the loss of spawning and feeding areas and types of migrants and residents in addition to decreases in biomass and truncated length structure (Petitgas et al., 2010; Garcia et al., 2018). This indicated that B/BMSY < 0.2 in this study was more conservative than the widely used B/B0 < 0.2 and showed more positive expectation of stock resilience in lower biomass level. Even so, it should be kept in mind that this biomass limit was just an approximation, and this positive expectation did not mean a lot. It would be more appropriate to concentrate on the dynamic of fisheries (Garcia et al., 2018).
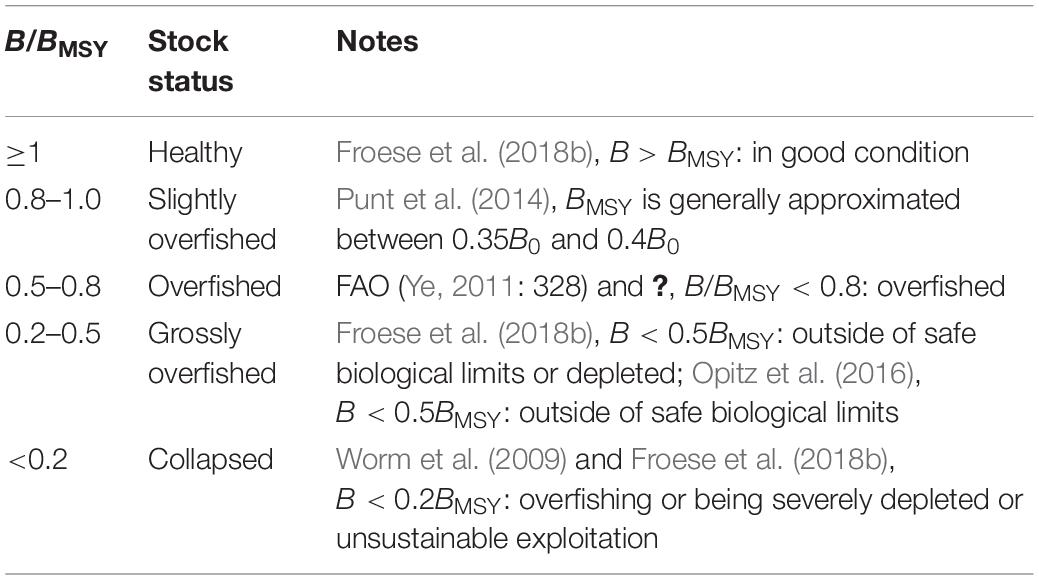
Table 3. Definition of fish stock status, based on B/BMSY.
A scatter diagram of F/FMSY and B/BMSY is usually used to illustrate exploitation status of a relevant fishery stock (such as Figure 3 in Froese et al., 2018b). The LBB model does not estimate F/FMSY but F/M, which represents the average value over the past year (Froese et al., 2018a). F/M can be considered as a proxy of F/FMSY for the related stock in the given year just because the covering duration of every LF dataset in this study was 1 year. F/M > 1.0 was used to imply the unsustainable fishing pressure in this study. Note that nine LBB models for these seven fish species used NA for M/K priors, assuming a normally distributed prior for M/K with mean = 1.5 and SD = 0.15 (Froese et al., 2018a). This assumption may bring deviations into F/M values, considering that M/K is not an LHI (life history invariants) and not conserved across species (Thorson et al., 2017). It would be noteworthy and necessary to use species-specific priors of natural mortalities for future LBB applications if available.
Forage Species
Kammal Thryssa (T. kammalensis)
The species we tentatively identified as T. kammalensis is a common, pelagic-neritic and brackish fish species along Chinese coastal waters (Zhang et al., 2019). As a forage species in the YE, Kammal thryssa plays an important role in the estuarine food web (Yu and Xian, 2009). Kammal thryssa belongs to Engraulidae (Froese and Pauly, 2019). The low estimate of B/BMSY and its high F/M indicated that the stock was outside of safe biological limits in 2019 (Figure 7). The Lc/Lc_opt (<0.9) and F/M (>1) suggested that high fishing pressure contributed to its deep-depleted state. The stock in this study was in the bottom left corner of the green space in Figure 5, and its K value was similar to two anchovies in question and even lower than that of sickle pomfret, which indicated that this forage stock was hard to recover from severe depletion relatively. A high Φ′ implies that a species grows fast to a large body size, something that corresponds to a “high growth performance” and has implications for population productivity and resilience (Murua et al., 2017). The Φ′ value of this species was similar with its record in FishBase (Figure 6B) and belonged to the cohort of low Φ′ values, i.e., “low growth performance” or with low resilience. Oscillations tended to be important for generating a high risk of a collapse for shorter-lived species just like this species with lower resilience (Garcia et al., 2018).
Indian Perch (J. lineata)
Indian perch is a small-sized demersal forage species of Apogonidae (yellow space in Figure 5; Li et al., 2013). It is abundant on sandy and muddy bottoms from coastal inlets to deeper waters (Zhuang et al., 2006). The stock in this study was located at the bottom left corner of the yellow space, and it became smaller in size and faster in growth in 2018 (Figure 5). To a certain extent, this implies its adaptation to environmental factors (such as seasonal variation, Jin et al., 2012) by growing rapidly toward a small size and which may contribute to the bigger B/B0 value in 2018 than that in 1984 (Figure 4). The low Φ′ value of Indian perch (Figure 6B) belonged to the cohort of low Φ′ values among miscellaneous species, and the lower mean Φ′ value of these two stocks in question depicted its relative lower resilience among different populations of this species. Two stocks of this fish species had good biomass levels, and the fishing pressure decreased to an appropriate level in 2018. This may take it into the safe biological limit.
Commercial Species
Yellow Croaker (L. polyactis)
Yellow croaker is a benthopelagic and oceanodromous fish species of the family Sciaenidae, illustrated with black dots in Figure 5. This fish stock is an essential commercial target of fishing activities currently in the YE. It had a relative lower Linf and higher K in this family (Figure 5), and its Φ′ value was close to the average level among the recorded populations in FishBase (Figure 6B), suggesting a relative faster growth rate in its family and a normal resilience. This stock was grossly overfished with truncated length structure in 2018 (Figure 7). The ratio of the 95th percentile length to asymptotic length L95th/Linf = 0.84 (Supplementary Material), indicating the lack of large individuals (Froese et al., 2018b). Its low relative biomass (B/B0 = 0.13) indicated the severe depletion of this stock, which was similar to the situation of the species (B/B0 = 0.15) in Liaodong Bay in 2012–2013 (Zhai and Pauly, 2019), suggesting the overall overfished status of this species in coastal China.
Osbeck’s Grenadier Anchovy (C. mystus)
Osbeck’s grenadier anchovy is one of the commercial species in the YE. The catch of this stock reached the peak of 5,281.8 tonnes in 1974 and decreased to 40 tonnes in recent years (Zhao et al., 2020). Its B/B0 value in 2018 was reduced to 0.29 (Figure 4), lower than that of the same stock in 2009 (B/B0 = 0.32 from Liang and Pauly, 2017; Zhai and Pauly, 2019), which implied that its status had gotten worse. This stock had a relatively larger Linf estimated by LBB than the record in FishBase, suggesting the more complete length structure of this species than that from 2006 to 2007 in the YE and a signal of population recovery (Figure 6A; He et al., 2008; Froese and Pauly, 2019). It is distributed in the lower and right of the growth pattern of Engraulidae (Figure 5), having the same Φ′ value with the record in FishBase (Figure 6B), showing no abnormal changes in growth pattern and resilience. This indicated that it has a good restoration potentiality, although out of safe biological limits (Figure 7).
Common Hairfin Anchovy (S. tenuifilis)
Common hairfin anchovy is an amphidromous and schooling fish species living mainly in coastal waters (Froese and Pauly, 2019). This stock occupied 11.64% of the total abundance among fish species in the YE from 1998 to 2001 (Yu and Xian, 2009). It had a larger Linf value (22.8 cm in total length) than the record (20.5 cm in total length) in FishBase (Figure 6A). Its Linf and K values in 2018 were both lower than those in East China Sea in 2000–2002 (Linf = 23.6 cm in total length and K = 0.3288) from Liu et al. (2006). This stock showed a healthy status with a good length structure and a high biomass level in 2018 (Figure 7).
Bombay Duck (H. nehereus)
Bombay duck is a benthopelagic, oceanodromous, and carnivorous fish species (Froese and Pauly, 2019). It belongs to the small size cohort and the middle level in growth rate in Synodontidae (blue space in Figure 5). This species was a competitive predator in comparison with the others in this study, according to its relatively higher K values and resilience (Figures 5, 6B). Although with a relatively high Linf value from LBB, this stock was outside of safe biological limits and grossly overfished in 2018 (Figure 7). It was a dominant species in the YE for years (Sun et al., 2015); however, the length structure of this stock was severely truncated by fishing activities. This result was consistent with the estimate for the same stock in 2008–2009 (Zhai and Pauly, 2019), suggesting its overfished status for at least 10 years.
Sickle Pomfret (P. echinogaster)
Sickle pomfret is a benthopelagic and oceanodromous fish species of Stromateidae (pink space in Figure 5). Its Linf estimate for the year 2012 from LBB was lower than that in 1999 and was close to the third quartile of records in FishBase (Figure 6A). This stock appeared to have a slight increase in biomass (Figure 4) and tended to a higher growth rate in 2012 (Figure 5), which may be related with its relative higher resilience (Figure 6B). Yan et al. (2019) showed that the index of relative importance (IRI) of this species increased from 51 in 2014 to 753 in 2017 and its recruitment per spawning increased from 112.50 in 2014 to 183.13 in 2017, suggesting a signal of stock recovery after prolonging the summer fishing moratorium in East China Sea in 2017. The stock in question was already collapsed in 1999, corresponding with He et al. (2006) and Zhuang et al. (2006), and its stock status had turned to grossly overfished in 2012, although still out of its safe biological limit (Figure 7). Our study provided a signal of its recovery in the YE. However, there is no doubt that its stock status was still in bad conditions with truncated length structure and this recovery was limited. For better conservation of sickle pomfret and other commercial species, stricter and specific fishery policies and implementations are required.
Conclusion
In this paper, the LBB was used to perform stock assessments for seven common fish species based on representative length frequencies collected from the YE. The status and fishery reference points of these fish stocks were estimated, respectively. Auximetric plots and growth performance indices (Φ′) were used to reveal the growth features and imply resilience of the studied stocks, which can be useful when formulating scientific advice. The Lmean/Lopt <0.9 in six (67%) of nine stocks suggested that most of the stocks were truncated in length structures. Common hairfin anchovy in 2018 and Indian perch in 2018 showed a healthy stock biomass status with complete length structures under a sustainable fishing pressure. The others were outside of safe biological limits or overfished.
This study assumed that a species would grow rapidly toward a small size when it faced with depletions (a positive feedback) for the historical comparison in auximetric plots. The real ΔK/ΔLinf ratio, for a fish stock in different historical stages, could reveal the real feedback to environmental changes more accurately. This paper did not take environmental factors (e.g., temperature but also the presence of predators) into considerations, which may play an essential role in the life history of a fish stock, especially for forage species. This study might serve as basis for future studies and fishery management plans, which could focus on the overall assessments of all exploited fishery stocks and integrations and tradeoffs between species-specific information and ecosystem-based managements.
Data Availability Statement
The original contributions presented in the study are included in the article/Supplementary Material, further inquiries can be directed to the corresponding author/s.
Ethics Statement
Ethical review and approval was not required for the animal study because our manuscript was based on survey cruise data, and no live vertebrates or higher invertebrates were involved, thus we believe an ethical review process was not required for our study.
Author Contributions
YCW and WX conceived and designed the study. YCW performed the data analysis and wrote the first draft of the manuscript, with insights from WX, CL, and YBW. All authors contributed to the revisions of the manuscript.
Funding
This research was funded by grants from the National Natural Science Foundation of China (31872568 and 41976094) and Natural Science Foundation of China-Shandong Joint Fund for Marine Ecology and Environmental Sciences (U1606404).
Conflict of Interest
The authors declare that the research was conducted in the absence of any commercial or financial relationships that could be construed as a potential conflict of interest.
Acknowledgments
We acknowledge Daniel Pauly and Maria Lourdes Palomares from Sea Around Us, University of British Columbia, Canada, for their contributions in the workshop of the assessment of Chinese stocks held in Qingdao, China.
Supplementary Material
The Supplementary Material for this article can be found online at: https://www.frontiersin.org/articles/10.3389/fmars.2021.679299/full#supplementary-material
References
Beverton, R. J. H., and Holt, S. J. (1957). On the Dynamics of Exploited Fish Populations. Fishery Investigations Series II, XIX. London: Ministry of Agriculture, Fisheries and Food, 533.
Beverton, R. J. H., and Holt, S. J. (1966). Manual of Methods for Fish Stock Assessment, Part II-Tables of Yield Functions. FAO Fisheries Technical Paper No. 38 (Rev. 1). Rome: FAO, 10.
Cao, L., Chen, Y., Dong, S., Hanson, A., Huang, B., Leadbitter, D., et al. (2017). Opportunity for marine fisheries reform in China. Proc. Natl. Acad. Sci. U.S.A. 114, 435–442. doi: 10.1073/pnas.1616583114
CFP (2013). Regulation (EU) No 1380/2013 of the European parliament and of the council of 11 December 2013 on the common fisheries policy, amending council regulations (EC) No 1954/2003 and (EC) No 1224/2009 and repealing council regulations (EC) No 2371/2002 and (EC) No 639/2004 and council decision 2004/585/EC. Off. J. Eur. Union L354, 22–61.
Froese, R., and Pauly, D. (2019). FishBase. World Wide Web Electronic Publication. Available online at: www.fishbase.org (accessed December 31, 2019).
Froese, R., Winker, H., Coro, G., Demirel, N., Tsikliras, A. C., Dimarchopoulou, D., et al. (2018a). A new approach for estimating stock status from length frequency data. ICES J. Mar. Sci. 75, 2004–2015. doi: 10.1093/icesjms/fsy078
Froese, R., Winker, H., Coro, G., Demirel, N., Tsikliras, A. C., Dimarchopoulou, D., et al. (2018b). Status and rebuilding of European fisheries. Mar. Policy 93, 159–170. doi: 10.1016/j.marpol.2018.04.018
Froese, R., Winker, H., Gascuel, D., Sumaila, U. R., and Pauly, D. (2016). Minimizing the impact of fishing. Fish Fish. 17, 785–802. doi: 10.1111/faf.12146
Garcia, S. M., Ye, Y., Rice, J., and Charles, A. (2018). Rebuilding of Marine Fisheries Part 1: Global Review. FAO Fisheries and Aquaculture Technical Paper, 630/1. Rome: FAO.
Guo, W. X., Li, Y., and Wang, H. X. (2019). Driving factors analysis of the evolution of runoff and sediment at Datong station in resent 60 years. China Rural Water and Hydropower 7, 60–65. doi: 10.1057/9781403944023_4
He, Z. K., Sun, Z. Z., and Hong, B. (2006). Monitor on dynamics of adult and young white pomfret Pampus argenteus in south bank waters of the mouth of the Changjiang River. Fish. Sci. Technol. Inf. 33, 81–83. doi: 10.3969/j.issn.1001-1994.2006.02.010
He, W., Li, Z., Liu, J., Li, Y., Murphy, B. R., and Xie, S. (2008). Validation of a method of estimating age, modelling growth, and describing the age composition of Coilia mystus from the Yangtze Estuary, China. ICES J. Mar. Sci. 65, 1655–1661. doi: 10.1093/icesjms/fsn143
Holt, S. J. (1958). The evaluation of fisheries resources by the dynamic analysis stocks, and notes on the time factors involved. ICNAF Spec. Publ. 1, 77–95.
Hordyk, A., Ono, K., Sainsbury, K., Loneragan, N., and Prince, J. (2015a). Some explorations of the life history ratios to describe length composition, spawning-per-recruit, and the spawning potential ratio. ICES J. Mar. Sci. 72, 204–216. doi: 10.1093/icesjms/fst235
Hordyk, A., Ono, K., Valencia, S., Loneragan, N., and Prince, J. (2015b). A novel length-based empirical estimation method of spawning potential ratio (SPR), and tests of its performance, for small-scale, data-poor fisheries. ICES J. Mar. Sci. 72, 217–231. doi: 10.1093/icesjms/fsu004
Hordyk, A. R., Ono, K., Prince, J. D., and Walters, C. J. (2016). A simple length-structured model based on life history ratios and incorporating size-dependent selectivity: application to spawning potential ratios for data-poor stocks. Can. J. Fish. Aquat. Sci. 73, 1787–1799. doi: 10.1139/cjfas-2015-0422
Hou, W. F., Yu, C. G., and Chen, X. Q. (2013). Temperature distribution in Zhoushan Fishing Ground. J. Ningbo Univ. 26, 31–34.
Huang, S. L., and Tang, Y. (2019). Review and prospect of theories of fisheries management and China’s practice. J. Fish. China. 43, 211–231. doi: 10.11964/jfc.20181011512
Jin, W. H., Xue, L. J., Zhu, Z. J., and Pan, G. L. (2012). Feeding habits of Apogon lineatusin the East China Sea and southern Yellow Sea. Mar. Fish. 34, 361–370. doi: 10.13233/j.cnki.mar.fish.2012.04.003
Li, X. S., Yu, Z. H., Sun, S., and Jin, X. S. (2013). Ecological niche breadth and niche overlap of dominant species of fish assemblage in Yangtze River estuary and its adjacent waters. Chin. J. Appl. Ecol. 24, 2353–2359. doi: 10.13287/j.1001-9332.2013.0394
Li, Y., Zhang, Y., Gao, T. X., Han, Z. Q., Lin, L. S., and Zhang, X. M. (2017). Morphological characteristics and DNA barcoding of Pampus echinogaster (Basilewsky, 1855). Acta Oceanol. Sin. 36, 18–23. doi: 10.1007/s13131-017-1124-x
Liang, C., and Pauly, D. (2017). Growth and mortality of exploited fishes in China’s coastal seas and their uses for yield-per-recruit analyses. J. Appl. Ichthyol. 33, 746–756. doi: 10.1111/jai.13379
Liu, Y., Cheng, J. H., and Li, S. F. (2006). Utilization status of Setipinna taty in the East China Sea and its rational exploitation. J. Fish. Sci. China 13, 485–491.
Melnychuk, M. C., Peterson, E., Elliott, M., and Hilborn, R. (2016). Fisheries management impacts on target species status. Proc. Natl. Acad. Sci. U.S.A. 114, 178–183. doi: 10.1073/pnas.1609915114
MSA. (2007). Magnuson-Stevens Fishery Conservation and Management Act, Public Law 94-265. As Amended by the Magnuson-Stevens Fishery Conservation and Management Reauthorization Act (P.L. 109-479). Available online at: http://www.nmfs.noaa.gov/msa2005/docs/MSA_amended_msa%20_20070112_FINAL.pdf (accessed 19 December 2014)
Munro, J. L., and Pauly, D. (1983). A simple method for comparing the growth of fishes and invertebrates. Fishbyte 1, 5–6.
Munroe, T. A., and Nizinski, M. (1999). “Engraulidae. Anchovies,” in FAO Species Identification Guide for Fishery Purposes. The Living Marine Resources of the WCP. Batoid fishes, Chimaeras and Bony Fishes Part 1 (Elopidae to Linophrynidae), Vol. 3, eds K. E. Carpenter and V. H. Niem (Rome: FAO), 1698–1706.
Murua, H., Rodriguez-Marin, E., Neilson, J. D., Farley, J. H., and Juan-Jordá, M. J. (2017). Fast versus slow growing tuna species: age, growth, and implications for population dynamics and fisheries management. Rev. Fish Biol. Fish. 27, 733–773. doi: 10.1007/s11160-017-9474-1
Opitz, S., Hoffmann, J., Quaas, M., Matz-Lück, N., Binohlan, C., and Froese, R. (2016). Assessment of MSC-certified fish stocks in the Northeast Atlantic. Mar. Policy 71, 10–14. doi: 10.1016/j.marpol.2016.05.003
Pauly, D. (1979). Gill Size and Temperature as Governing Factors in Fish Growth: a Generalization of von Bertalanffy’s Growth Formula. Berichte aus dem Instituts für Meereskunde an der Universität Kiel, No. 63. Kiel: Universität Kiel, 156.
Pauly, D. (1981). The relationships between gill surface area and growth performance in fish: a generalization of von Bertalanffy’s theory of growth. Ber. Dtsch. Wissenschaftlichen Kommission Meeresforschung 28, 251–282.
Pauly, D. (1991). Growth performance in fisheries: rigorous description of patterns as a basis for understanding causal mechanisms. Aquabyte Newsl. Netw. Trop. Aquac. Sci. 4, 3–6.
Pauly, D., and Greenberg, A. (2013). ELEFAN in R: A New Tool for Length-Frequency Analysis. Fisheries Centre Research Reports 21(3). Vancouver: University of British Columbia, 52.
Pauly, D., and Le Manach, F. (2015). Tentative Adjustments of China’s Marine Fisheries Catches (1950–2010). Fisheries Centre Working Paper 2015-28. Vancouver: University of British Columbia.
Pauly, D., and Munro, J. L. (1984). Once more on the comparison of growth in fish and invertebrates. Fishbyte Newsl. Netw. Trop. Fish. Sci. 2:21.
Pauly, D., and Soriano, M. L. (1986). “Some practical extensions to Beverton and Holt’s relative yield-per-recruit model,” in the First Asian Fisheries Forum, eds J. L. Maclean, L. B. Dizon, and L.-V. Hosillos (Manila: Asian Fisheries Society), 491–495.
Petitgas, P., Secor, D. H., McQuinn, I., Huse, G., and Lo, N. (2010). Stock collapses and their recovery: mechanisms that establish and maintain lifecycle closure in space and time. ICES J. Mar. Sci. 67, 1841–1848. doi: 10.1093/icesjms/fsq082
Plummer, M. (2003). “JAGS: a program for analysis of Bayesian graphical models using Gibbs sampling,” in Proceedings of the 3rd International Workshop on Distributed Statistical Computing (DSC 2003), Vienna, eds K. Hornik, F. Leisch, and A. Zeileis (Vienna: Vienna Technical University), 20–22.
Punt, A. E., Smith, A. D. M., Smith, D. C., Tuck, G. N., and Klaer, N. L. (2014). Selecting relative abundance proxies for BMSY and BMEY. ICES J. Mar. Sci. 71, 469–483. doi: 10.1093/icesjms/fst162
Quinn, T. J., and Deriso, R. B. (1999). Quantitative Fish Dynamics. New York, NY: Oxford University Press, 560.
R Core Team (2013). R: A Language and Environment for Statistical Computing. Vienna: R Foundation for Statistical Computing.
Rosenberg, A. A., Kleisner, K. M., Afflerbach, J., Anderson, S. C., Dickey-Collas, M., Cooper, A. B., et al. (2017). Applying a new ensemble approach to estimating stock status of marine fisheries around the world. Conserv. Lett. 11:e12363. doi: 10.1111/conl.12363
Rudd, M. B., and Thorson, J. T. (2018). Accounting for variable recruitment and fishing mortality in length-based stock assessments for data-limited fisheries. Can. J. Fish. Aquat. Sci. 75, 1019–1035. doi: 10.1139/cjfas-2017-0143
Shan, X. J., Li, X. S., Yang, T., Sharifuzzaman, S. M., Zhang, G. Z., Jin, X. S., et al. (2017). Biological responses of small yellow croaker (Larimichthys polyactis) to multiple stressors: a case study in the Yellow Sea, China. Acta Oceanol. Sin. 36, 39–47. doi: 10.1007/s13131-017-1091-2
Shao, K. T. (2021). Taiwan Fish Database. Available online at: http://fishdb.sinica.edu.tw (accessed April 22, 2021)
Sparre, P., and Venema, S. C. (1998). Introduction to Tropical Fish Stock Assessment. Part 1. Manual. FAO Fisheries Technical Paper No. 306.1, Rev. 2. Rome: FAO, 407.
Sun, P. F., Dai, F. Q., Chen, Y. L., Shan, X. J., and Jin, X. S. (2015). Seasonal variations in structure of fishery resource in the Yangtze River Estuary and its adjacent waters. Prog. Fish Sci. 36, 8–16. doi: 10.11758/yykxjz.20150602
Thorson, J. T., and Cope, J. M. (2015). Catch curve stock-reduction analysis: an alternative solution to the catch equations. Fish. Res. 171, 33–41. doi: 10.1016/j.fishres.2014.03.024
Thorson, J. T., Munch, S. B., Cope, J. M., and Gao, J. (2017). Predicting life history parameters for all fishes worldwide. Ecol. Appl. 27, 2262–2276. doi: 10.1002/eap.1606
von Bertalanffy, L. (1938). A quantitative theory of organic growth (inquiries on growth laws. II.). Hum. Biol. 10, 181–213. doi: 10.2307/41447359
Watson, R., and Pauly, D. (2001). Systematic distortions in world fisheries catch trends. Nature 414, 534–536. doi: 10.1038/35107050
Whitehead, P. J. P., Nelson, G. J., and Wongratana, T. (1988). FAO Species Catalogue. Vol. 7. Clupeoid fishes of the world (Suborder Clupeoidei). An annotated and illustrated catalogue of the herrings, sardines, pilchards, sprats, shads, anchovies and wolf-herrings. FAO Fish. Synop. 7, 305–579.
Worm, B., Hilborn, R., Baum, J. K., Branch, T. A., Collie, J. S., Costello, C., et al. (2009). Rebuilding global fisheries. Science 325, 578–585. doi: 10.1126/science.1173146
Xu, Z., and Chen, J. (2010). Population division of Larimichthys polyactis in China Sea. Chin. J. Appl. Ecol. 21, 2856–2864.
Yan, L. P., Liu, Z. L., Jin, Y., and Cheng, J. H. (2019). Effects of prolonging summer fishing moratorium in the East China Sea on the increment of fishery resources. Mar. Fish. 41, 513–519. doi: 10.13233/j.cnki.mar.fish.2019.05.001
Yang, Q., Zhao, F., Song, C., Zhang, T., Zhuang, P., Jiang, T., et al. (2019). Habitat history reconstruction of Coilia mystus from the Yangtze River Estuary and its adjacent sea area. J. Fish. Sci. China 26, 1175–1184. doi: 10.3724/SP.J.1118.2019.19073
Yang, Y., and Xu, R. (2014). The environment variation trend in the Changjiang River estuary in the past 30a. Mar. Sci. 39, 101–107. doi: 10.11759/hykx20141124001
Ye, Y. (2011). Review of the State of the World Marine Fishery Resources. FAO Fisheries and Aquaculture Technical Paper. Rome: FAO, 569.
Yu, H. C., and Xian, W. W. (2009). The environment effect on fish assemblage structure in waters adjacent to the Changjiang (Yangtze) River estuary (1998–2001). Chin. J. Oceanol. Limnol. 27, 443–456. doi: 10.1007/s00343-009-9155-6
Zhai, L., and Pauly, D. (2019). Yield-per-recruit, Utility-per-recruit, and relative biomass of 21 exploited fish species in China’s coastal seas. Front. Mar. Sci. 6:724. doi: 10.3389/fmars.2019.00724
Zhang, J., Zhang, N., Li, Y., Xiao, J. G., Zhang, R., and Gao, T. X. (2019). Population genetic structure of Thryssa kammalensis in the Chinese seas inferred from control region sequences. Mar. Biodivers. 49, 2621–2632. doi: 10.1007/s12526-019-00995-3
Zhao, F., Yang, Q., Song, C., Zhang, T., and Zhuang, P. (2020). Biological characteristics and resource utilization of Coilia mystus in the Yangtze Estuary. Mar. Fish. 42, 110–119. doi: 10.13233/j.cnki.mar.fish.2020.01.012
Zhuang, P., Wang, Y. H., Li, S. F., Deng, S. M., Li, C. S., and Ni, Y. (2006). Fishes of the Yangtze Estuary. Shanghai: Shanghai Scientific & Technical Publishers.
Keywords: LBB, stock status, data limited, growth patterns, Yangtze estuary
Citation: Wang YC, Liang C, Xian W and Wang YB (2021) Using the LBB Method for the Assessments of Seven Fish Stocks From the Yangtze Estuary and Its Adjacent Waters. Front. Mar. Sci. 8:679299. doi: 10.3389/fmars.2021.679299
Received: 11 March 2021; Accepted: 05 May 2021;
Published: 15 June 2021.
Edited by:
Giuseppe Scarcella, National Research Council (CNR), ItalyReviewed by:
Yuan Li, Third Institute of Oceanography, State Oceanic Administration, ChinaValeria Mamouridis, Independent Researcher, Rome, Italy
Copyright © 2021 Wang, Liang, Xian and Wang. This is an open-access article distributed under the terms of the Creative Commons Attribution License (CC BY). The use, distribution or reproduction in other forums is permitted, provided the original author(s) and the copyright owner(s) are credited and that the original publication in this journal is cited, in accordance with accepted academic practice. No use, distribution or reproduction is permitted which does not comply with these terms.
*Correspondence: Weiwei Xian, d3d4aWFuQHFkaW8uYWMuY24=; Cui Liang, bGlhbmdjQHFkaW8uYWMuY24=