- 1State Key Laboratory of Estuarine and Coastal Research, School of Marine Sciences, East China Normal University, Shanghai, China
- 2School of Marine Science and Engineering, Nanjing Normal University, Nanjing, China
- 3Ministry of Education Key Laboratory of Coast and Island Development, School of Geography and Ocean Science, Nanjing University, Nanjing, China
- 4Shanghai Waterway Engineering Design and Consulting Co., Ltd., Shanghai, China
Humans have been sailing across seas and oceans for thousands of years. However, the story of large ships capable of affecting coastal ecology and shelf sedimentary processes is only about 100 years old. Modern large seagoing vessels with a draft of 10–20 m can cause resuspension of seabed sediment, erosion of the channel slope and shoal, enhancement of seafloor sediment activity and thickening of the active layer, thereby having a significant impact on seabed topography and sedimentation processes. However, little is known about the effects of this anthropogenic agent on shelf sedimentation due to limited observational data. Here, two sediment cores were collected from a shipping lane used by vessels of 5,000- to 50,000-ton off the coast of China to analyze their sedimentary properties, with focus on both the grain size and elements. It was found that ship disturbance selectively modified the sedimentary record, with the fine-grained sediment becoming increasingly unstable. In addition, there was a reduction in grain size of sediment finer than 6.25 Φ, which decreased by 11% after the disturbance by ship. Biogenic elements that were closely related to the ecological environment were significantly altered, with Br/Cl, Si/Ti, and Ca/Ti ratios all becoming significantly smaller. This indicated that frequent disturbance caused by ships had reduced the productivity in the waters near the shipping lane. In terms of sensitivity to the effects of ship navigation, the sedimentation response was relatively rapid and began to emerge from the commencement of ship navigation, whereas the ecological response became evident later than the sedimentation response and only appeared after a significant growth in the maritime transportation of China. Following the comparison of the two sediment cores, we propose that the constant rate of supply (CRS- with ship disturbance)–constant initial concentration (CIC- without ship disturbance) dual dating model be used to establish a dating framework in waters frequently disturbed by ship. This type of anthropogenic sedimentary dynamic process and its sedimentary–ecological effects deserve attention on this era where there is a surge in shipping globally. Shipping lanes present an excellent area for quantitative studies on the impacts of human activity and defining the Anthropocene in the context of shipping.
Introduction
Humans and the natural environment interact with each other (Ye et al., 2009; Syvitski and Kettner, 2011), and humans have been influencing the natural environment significantly for thousands of years (Ren, 1989; Debret et al., 2009; Jenny et al., 2019). Since the Industrial Revolution, humans have become the main agents of environmental change, and the concept of the Anthropocene was born in 2000 (Crutzen and Stoermer, 2000). The fact that humans act as an important force in nature brings a new scientific challenge to earth scientists, that is, the impacts of various human activities should be quantified and integrated into the existing earth science system (Ye et al., 2009).
Estuaries and offshore waters are places where the imprints of human activity are particularly prominent. For example, coastal and ocean engineering can alter the original dynamic field, leading to changes in the morphological structure and ecological function of the modern delta and decreased sustainability of the modern delta (Powell et al., 2006; De Vriend et al., 2011; Day et al., 2016; Luan et al., 2016). The impact of shelf trawling on the resuspension of fine sediment on the seabed is comparable with that of large storms (Ferré et al., 2008).
Marine vessels are undoubtedly one of the most prominent symbols of human activities in the ocean. Large ships cause significant disturbances in sediment dynamic processes mainly in three ways: (i) the jet flow generated by ships’ propellers causes resuspension of sediment on the bed of shipping lanes (Soon and Lam, 2014; Hong et al., 2016); (ii) the propagation of ship-induced waves may cause erosion of the channel slope and shoal (Rapaglia et al., 2011); and (iii) prolonged and frequent ship shuttle services enhance seabed sediment activity and increase the thickness of the active layer (Hong et al., 2013). Consequently, suspended sediment concentration increases significantly during ship navigation, and can be 30 times higher than the average background concentration (Rapaglia et al., 2011). More than that, turbid water affects the growth of phytoplankton, which in turn affects marine productivity (Huang et al., 1986; Pan and Shen, 2009).
Compared to known ship-related hydrodynamics (e.g., propeller-jet, ship wave, ship wakes, etc.), little is known about the impact of ship traffic on marine sedimentation records (e.g., the characteristics of shelf sediments), largely due to the scarcity of studies dedicated to this field. Considering that maritime transport is responsible for 80% of the total volume of international trade (Notteboom et al., 2021), this rising anthropogenic-force induced sedimentary process deserves more attention, and research related to this will be important for marine biogeochemistry, sedimentary dynamics, and geomorphology.
Over the past 70 years, China’s maritime transport has experienced explosive growth. Shanghai Port and Ningbo-Zhoushan Port have become the world’s leading ports in terms of container and cargo throughput. Due to these two ports, the coastal shipping lanes along Zhejiang Province are particularly busy. This area represents an ideal place to analyze the effects of seagoing traffic on the shelf sedimentary record. In this study, a shipping lane suitable for 5,000 ∼ 50,000 tons ships along the Zhejiang coast of the East China Sea was selected as the study site, and two short sediment cores were collected from the centerline and the periphery of the lane to analyze their ages and sediment characteristics. We use an improved 210Pb dating model to establish a more accurate depth-age framework in regions with frequent ship disturbance. In combination with development of China’s offshore shipping lanes, we explore the possible linkage between ship traffic and the changes in sedimentation.
Study Area
The booming development of China’s coastal and ocean-going shipping began in the late 20th century, with coastal transport accounting for 60% of the total domestic transport [China Port Yearbook (1999–2019)]. After decades of development, Shanghai Port and Ningbo-Zhoushan Port have become the world’s leading ports in terms of container and cargo throughput. The coastal shipping lanes along Zhejiang Province are particularly busy due to these two ports and the coastal shipping lanes intersect. The north–south lanes throughout the East China Sea include four main lanes: the Outer Shipping Lane, the Eastern Shipping Lane, the Middle Shipping Lane, and the Western Shipping Lane (Figure 1). The eastern and western shipping lanes intersect outside Aiwan Bay, where shipping is well-developed and traffic is frequent in the north–south direction. The lanes can allow ships of 5,000- to 50,000-ton to pass through, even up to 100,000 tons on some sections. This area is close to the Wenzhou Port, where many passenger ship lanes lead to the surrounding islands (He, 2008). Therefore, it is an ideal area to study about the disturbance caused by ships. The tides are regular semidiurnal tides with an average tidal range of 4 m, and the maximum can be 7 m. The wave height is approximately 1 m. During typhoons, the wave height is up to 5 m, and the maximum can reach 10 m (China Gulf Annals, 1993). The bottom sediment is clayey silt and silt (Jia et al., 2018).
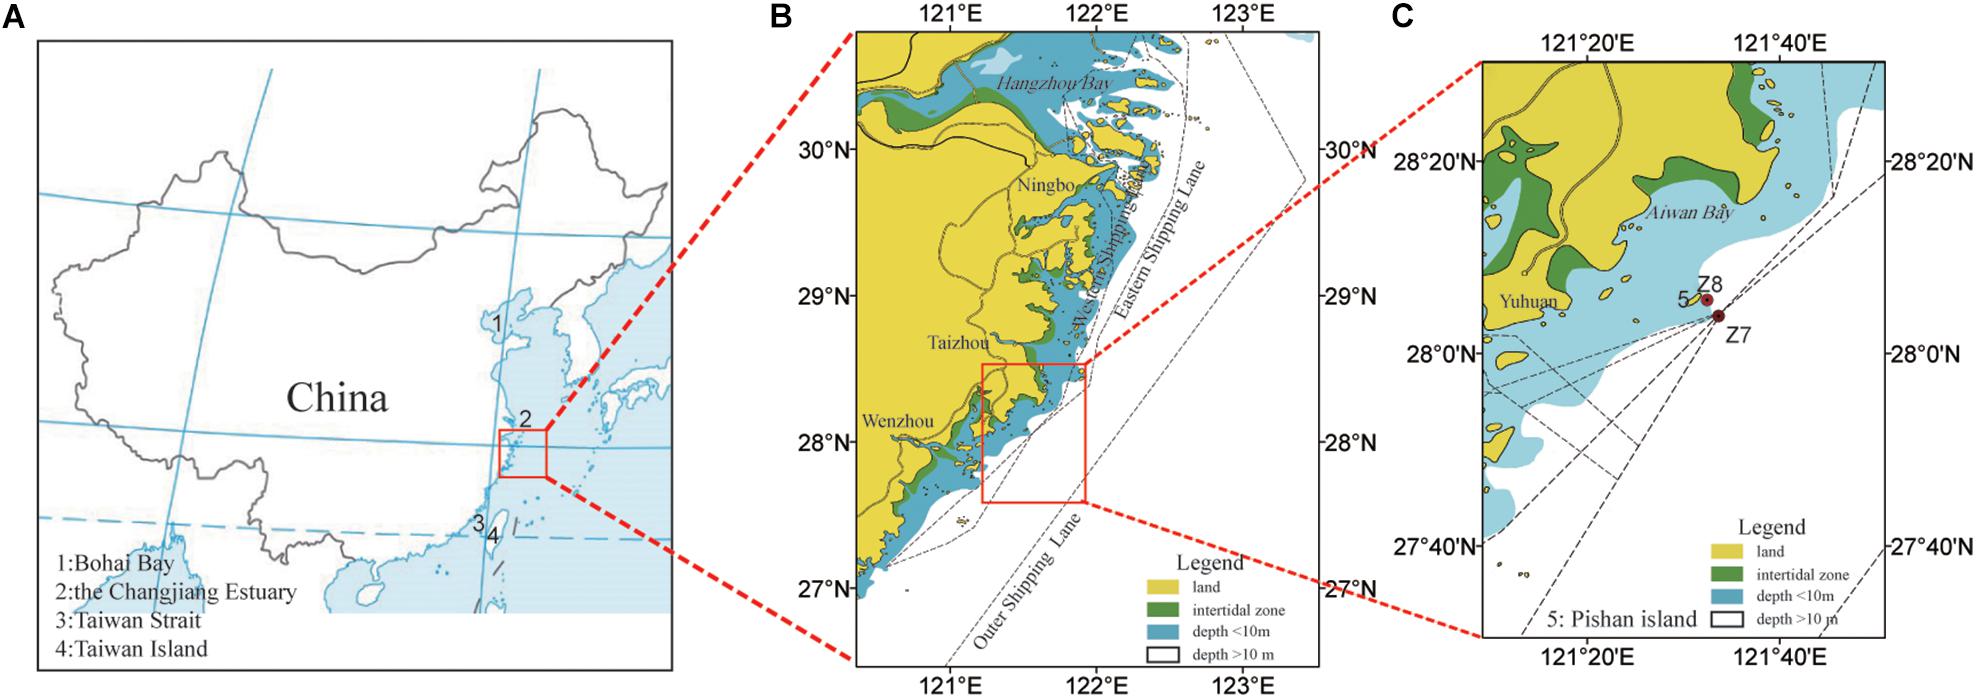
Figure 1. Maps of the shipping lane indicate (A,B) the study area (according to He, 2008) and (C) the sampling site. Core Z7 was located at the intersection of the eastern and western shipping lane, and a control core (core Z8) was collected outside the shipping lane at a distance of 4.7 km northwest to core Z7.
Materials and Methods
We obtained two cores off the coast of Aiwan Bay, Zhejiang Province, China, to analyze grain size and geochemical elements. Combined with the dating framework, we analyzed the changes in sediment characteristics over time. A literature review was conducted to understand the history of the marine transport industry and the shipping lanes where the cores have been located over the past decades, with a view to quantify the sedimentation effects of ship disturbance.
Coring
Two cores were collected in May 2018 using a gravity coring tube. Core Z7 (28°3′0″N, 121°33′36″E), 1.5 m long with a water depth of 13.2 m, was collected at the intersection of two main shipping lanes used by vessels of 5,000- to 50,000-ton. Core Z8 (28°5′21″N, 121°32′36″E), 1.5 m long with a water depth of 12 m, was collected outside the shipping lane at a distance of 4.7 km from core Z7 in the northwestern direction. The natural sedimentary environments in the region of two cores are nearly identical because of the short distance between the two cores, which will better ensure an accurate representation of the effects of disturbance on the sediment due to maritime traffic through contrast analysis.
XRF Core Scan
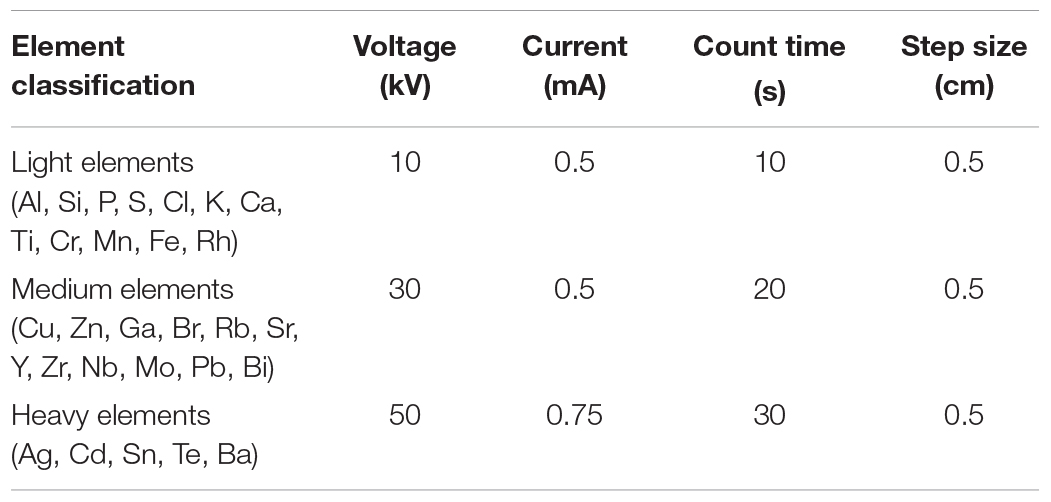
The cores were each split into two parts using a GeoTek Core Splitter. One half of the core was covered with a 4 μm thick Ultralene film to avoid the contamination of the X-ray fluorescence (XRF) core scanner (Avaatech 3RD, Netherlands) measurement unit and the desiccation of the sediment (Richter et al., 2006). Instrument settings were optimized to minimize the mean square error (MSE) values, and the step size was 0.5 cm. Count times for XRF analysis ranged from 10 to 30 s (Table 1). Reliable data were obtained for 29 elements. Four powdered standards were analyzed every day before and after the analysis of the sediment cores to monitor signal drift and indicated that the signal remained stable during the analytical runs. The experiment was completed at the State Key Laboratory of Marine Environmental Science, Xiamen University, Xiamen.
Grain Size Analysis
Grain size analysis of 1 cm sub-samples was conducted using a laser particle analyzer (Mastersizer-2000, United Kingdom), which has a measurement range of 0.02–2000 μm with a relative error of <3% for repeated measurements. The experiment was completed at the Key Laboratory of Coastal and Island Development, Nanjing University, Nanjing. The matrix formula of McManus (1988) was used to calculate the sample statistics of the grain size distribution, that is, mean grain size (Mz), sorting (S), skewness (Sk), and kurtosis (K). The above four parameters refer to: the average size, the spread of the sizes around the average, the symmetry or preferential spread to one side of the average, and the degree of concentration of the grains relative to the average, respectively (Blott and Pye, 2001). The grain size standard deviation at 10 cm intervals was calculated to extract the sensitive grain size fraction (Sun et al., 2003). The changes in the sensitive grain size fraction over time can reflect the evolution of sedimentary dynamic processes and depositional environments.
Age Models
Age models are of critical importance in interpreting sedimentary records. One of the most important means for dating recent sediments (0–150 years) is by 210Pb (half-life 22.3 years), a natural radioactive isotope of lead (Appleby, 2001). The dried sample was homogeneously pulverized, weighed, and then sealed in a plastic box (70 × 70 mm) for 3 weeks. The activities of 210Pbex and 137Cs in the sediment samples were measured following the method described by Du et al. (2010). The radioactivities of the above nuclides were measured using an HPGe γ-ray detector (Canberra Be3830, United States) with a relative counting efficiency of 35% and an energy resolution of 1.8 keV (at 1332 keV). The detector has multilayer shielding (ultralow cryostat and no peak background in the isotopes of interest). The activity of 210Pbex was calculated from the activity of total 210Pb (46.5 keV, 4.25%) minus the activity of 226Ra, determined using the γ lines at 351.9 keV (37.6%) for 214Pb and 609.3 keV (46.1%) for 214Bi. The efficiency calibration of the detector systems was conducted using LabSOCS (Baronson, 2003). The experiments were performed at the State Key Laboratory of Estuarine and Coastal Research, East China Normal University, Shanghai. The commonly used 210Pb data processing and computation mainly include the CIC dating mode and the CRS dating model (Appleby, 2001). Given the strengths and weaknesses of the two computational models, the 210Pb chronology of this study was determined using both models.
Historical Documents
To study the response of sediment characteristics to the disturbance effects of ships, it is necessary to be familiar with the shipping lanes near the study area and the frequency of ship navigation. Compared to bulk cargo ships, container ships have the characteristics of large loading capacity, fast speed, and fixed throughput, which are more representative indicators to better reflect the impacts of ship disturbance on sedimentation. The China Port Yearbook comprehensively and accurately recorded the development of China’s port navigation and shipping industry, and recorded the container throughput of China’s coastal ports from 1979 to date, which could reflect the intensity of disturbance by ship movement on the shipping lanes. Therefore, the container throughput of the whole country and three ports, namely Qingdao Port, Shanghai Port, and Guangzhou Port, were calculated for the period 1979–2018. These three ports are important coastal ports in the Yellow Sea, East China Sea, and South China Sea, respectively.
Results
Depth-Age Framework
The excess 210Pb of Z7 and Z8 remained in the law of radioactive decay. The linear fitting result of the excess 210Pb of Z7 was good, with a correlation coefficient of 0.66 by the CIC model and a sedimentation rate of 1.09 cm/yr. The Z8 was better, with a correlation coefficient of 0.91 and a sedimentation rate of 1.54 cm/yr (Figure 2). Considering that the locations of the two cores were not far from each other, approximately 4 km—expecting a great difference in sedimentation rate would be unreasonable. According to sedimentation rate data of the mud area along the coast of Zhejiang and Fujian (Jia et al., 2018), the average sedimentation rate here is approximately 1.5 cm/yr. The entire 150 cm long sedimentation sequence was recorded from approximately 100 years ago, which was before the emergence of container ships navigation along the coast of China in the late 1970s. Thus, it would be inaccurate to use uniform sedimentation rates to infer the age of sediment before and after the emergence of shipping lanes.

Figure 2. Vertical distribution of 210Pb, 226Ra in core Z7 (A), and Z8 (C). The linear fitting between depth (Y axis: cm) and ln(210pbex) (X axis: Bq/kg) of core Z7 (B) and Z8 (D). v=− k⋅λ, where v is the sedimentation rate, k is the slope of the linear fitting equation, and λ is the decay constant of 210Pb (i.e., 0.0311/yr).
In theory, the CIC model of 210Pb dating is suitable for a stable sedimentary environment, but for a less stable sedimentary environment, the CRS model may provide more accurate dating results (Zhang et al., 2008). It was found that above 70 cm depth both models gave similar curves for Z8 (Figure 3D), whereas for Z7, the difference was extremely large, with some layers up to 24 years (Figure 3A).
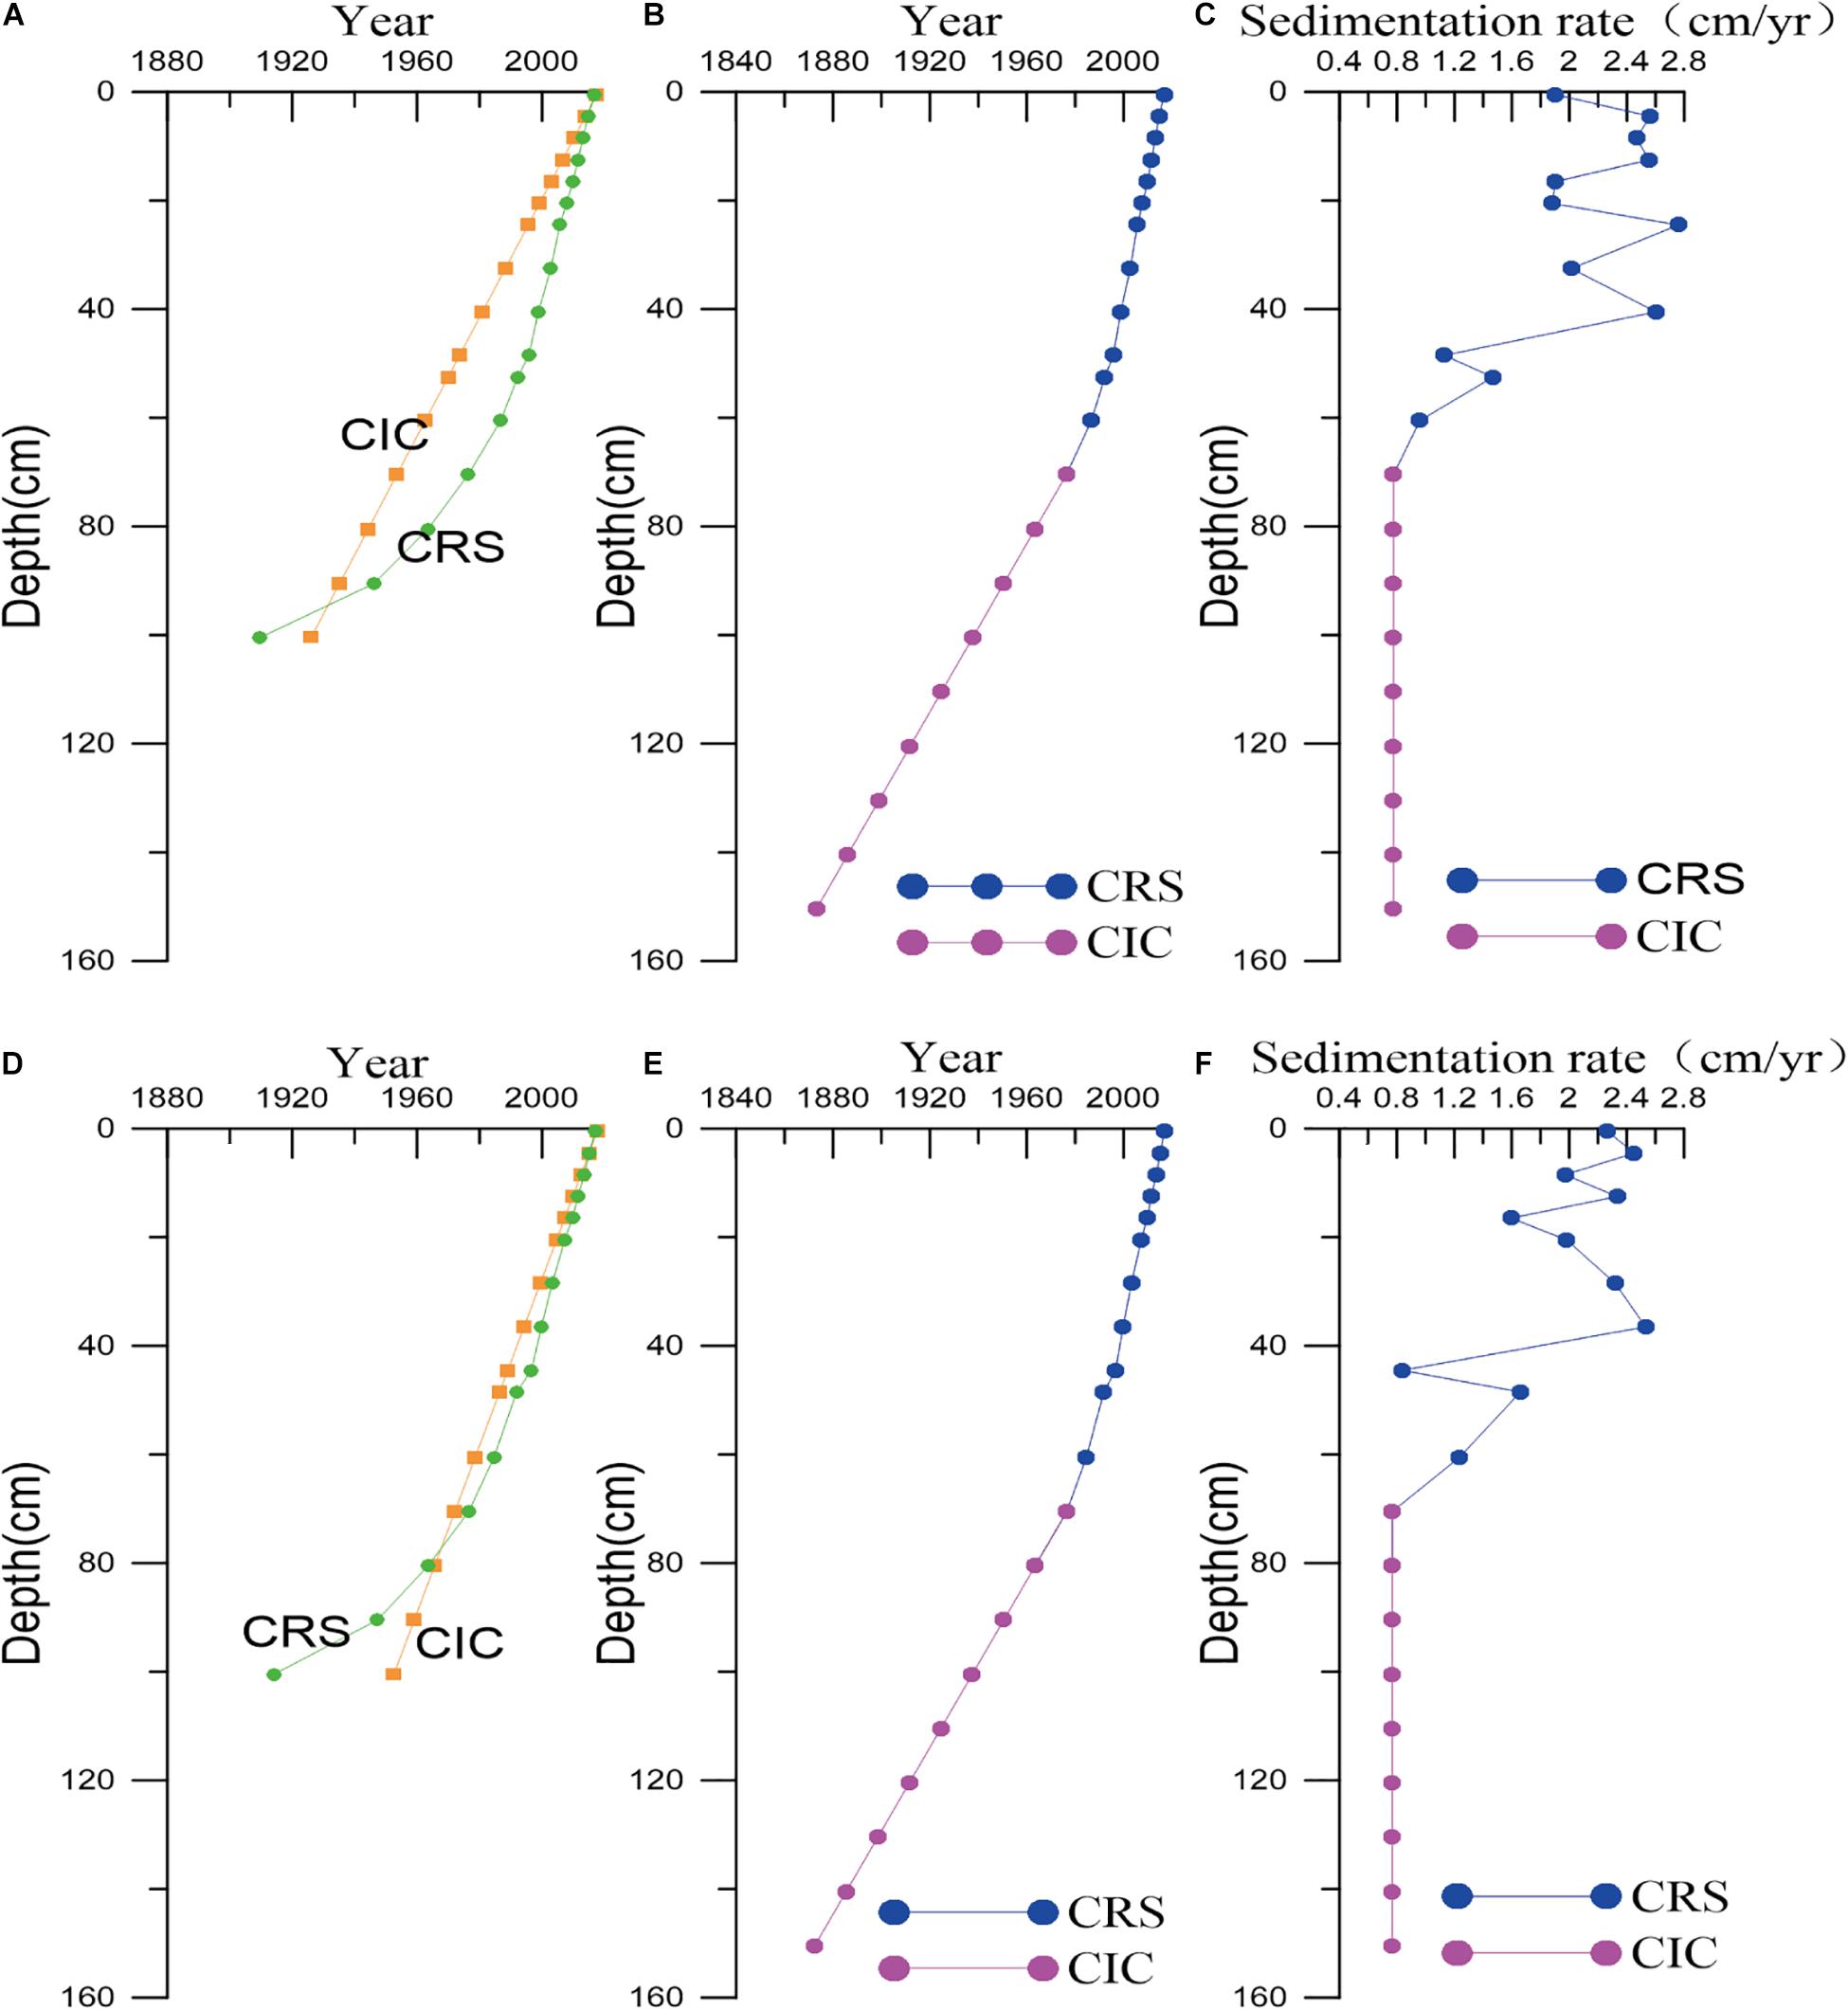
Figure 3. Dating result and sedimentation rate for core Z7 (A–C) and Z8 (D–F). The CRS and CIC dating models were combined to establish a dating framework for core Z7 (B) and Z8 (E), with the CRS model being used for depths of 0–70 cm and the CIC model for depths of 70–150 cm, to get a more accurate dating framework. (A,D) Show the difference between CIC and CRS single dating model results for depths of 0–100 cm. The sedimentation rate for core Z7 (C) and Z8 (F).
The CRS dating results of the two cores above a depth of 70 cm were almost identical, and the sedimentation records were from 1977 to 2018; below a depth of 70 cm, the CRS model algorithm led to older dating results, and increasing depth (Zhang et al., 2008), with a small sedimentation rate. Therefore, in this study, the CRS dating model was used at depths above 70 cm and the CIC dating model at depths below 70 cm. The sedimentation rate was assumed to be uniform below 70 cm, and the sedimentation rate at 70 cm was used as the sedimentation rate for the 70–150 cm section. On this basis, the dating framework was established for the two cores, and the age of sediment for each layer at the same depth were almost identical, with a mean time difference of 0.4 year. The two cores showed the sedimentation records of 1873–2018 (Figures 3B,E). The sedimentation rates of Z7 and Z8 were in the ranges of 0.77–2.76 cm/yr and 0.77–2.53 cm/yr (Figures 3C,F), respectively.
Grain Characteristics of Sediments
The grain size components of Z7 and Z8 were dominated by silt, followed by clay, with the least amount of sand (Figure 4). Overall, the content of the grain size component did not fluctuate significantly with time. The sediment type was mainly clayey silt, with an occasional silt layer. Through comparative analysis of the two cores, it was found that the grain size parameters were quite different below and above 70 cm.
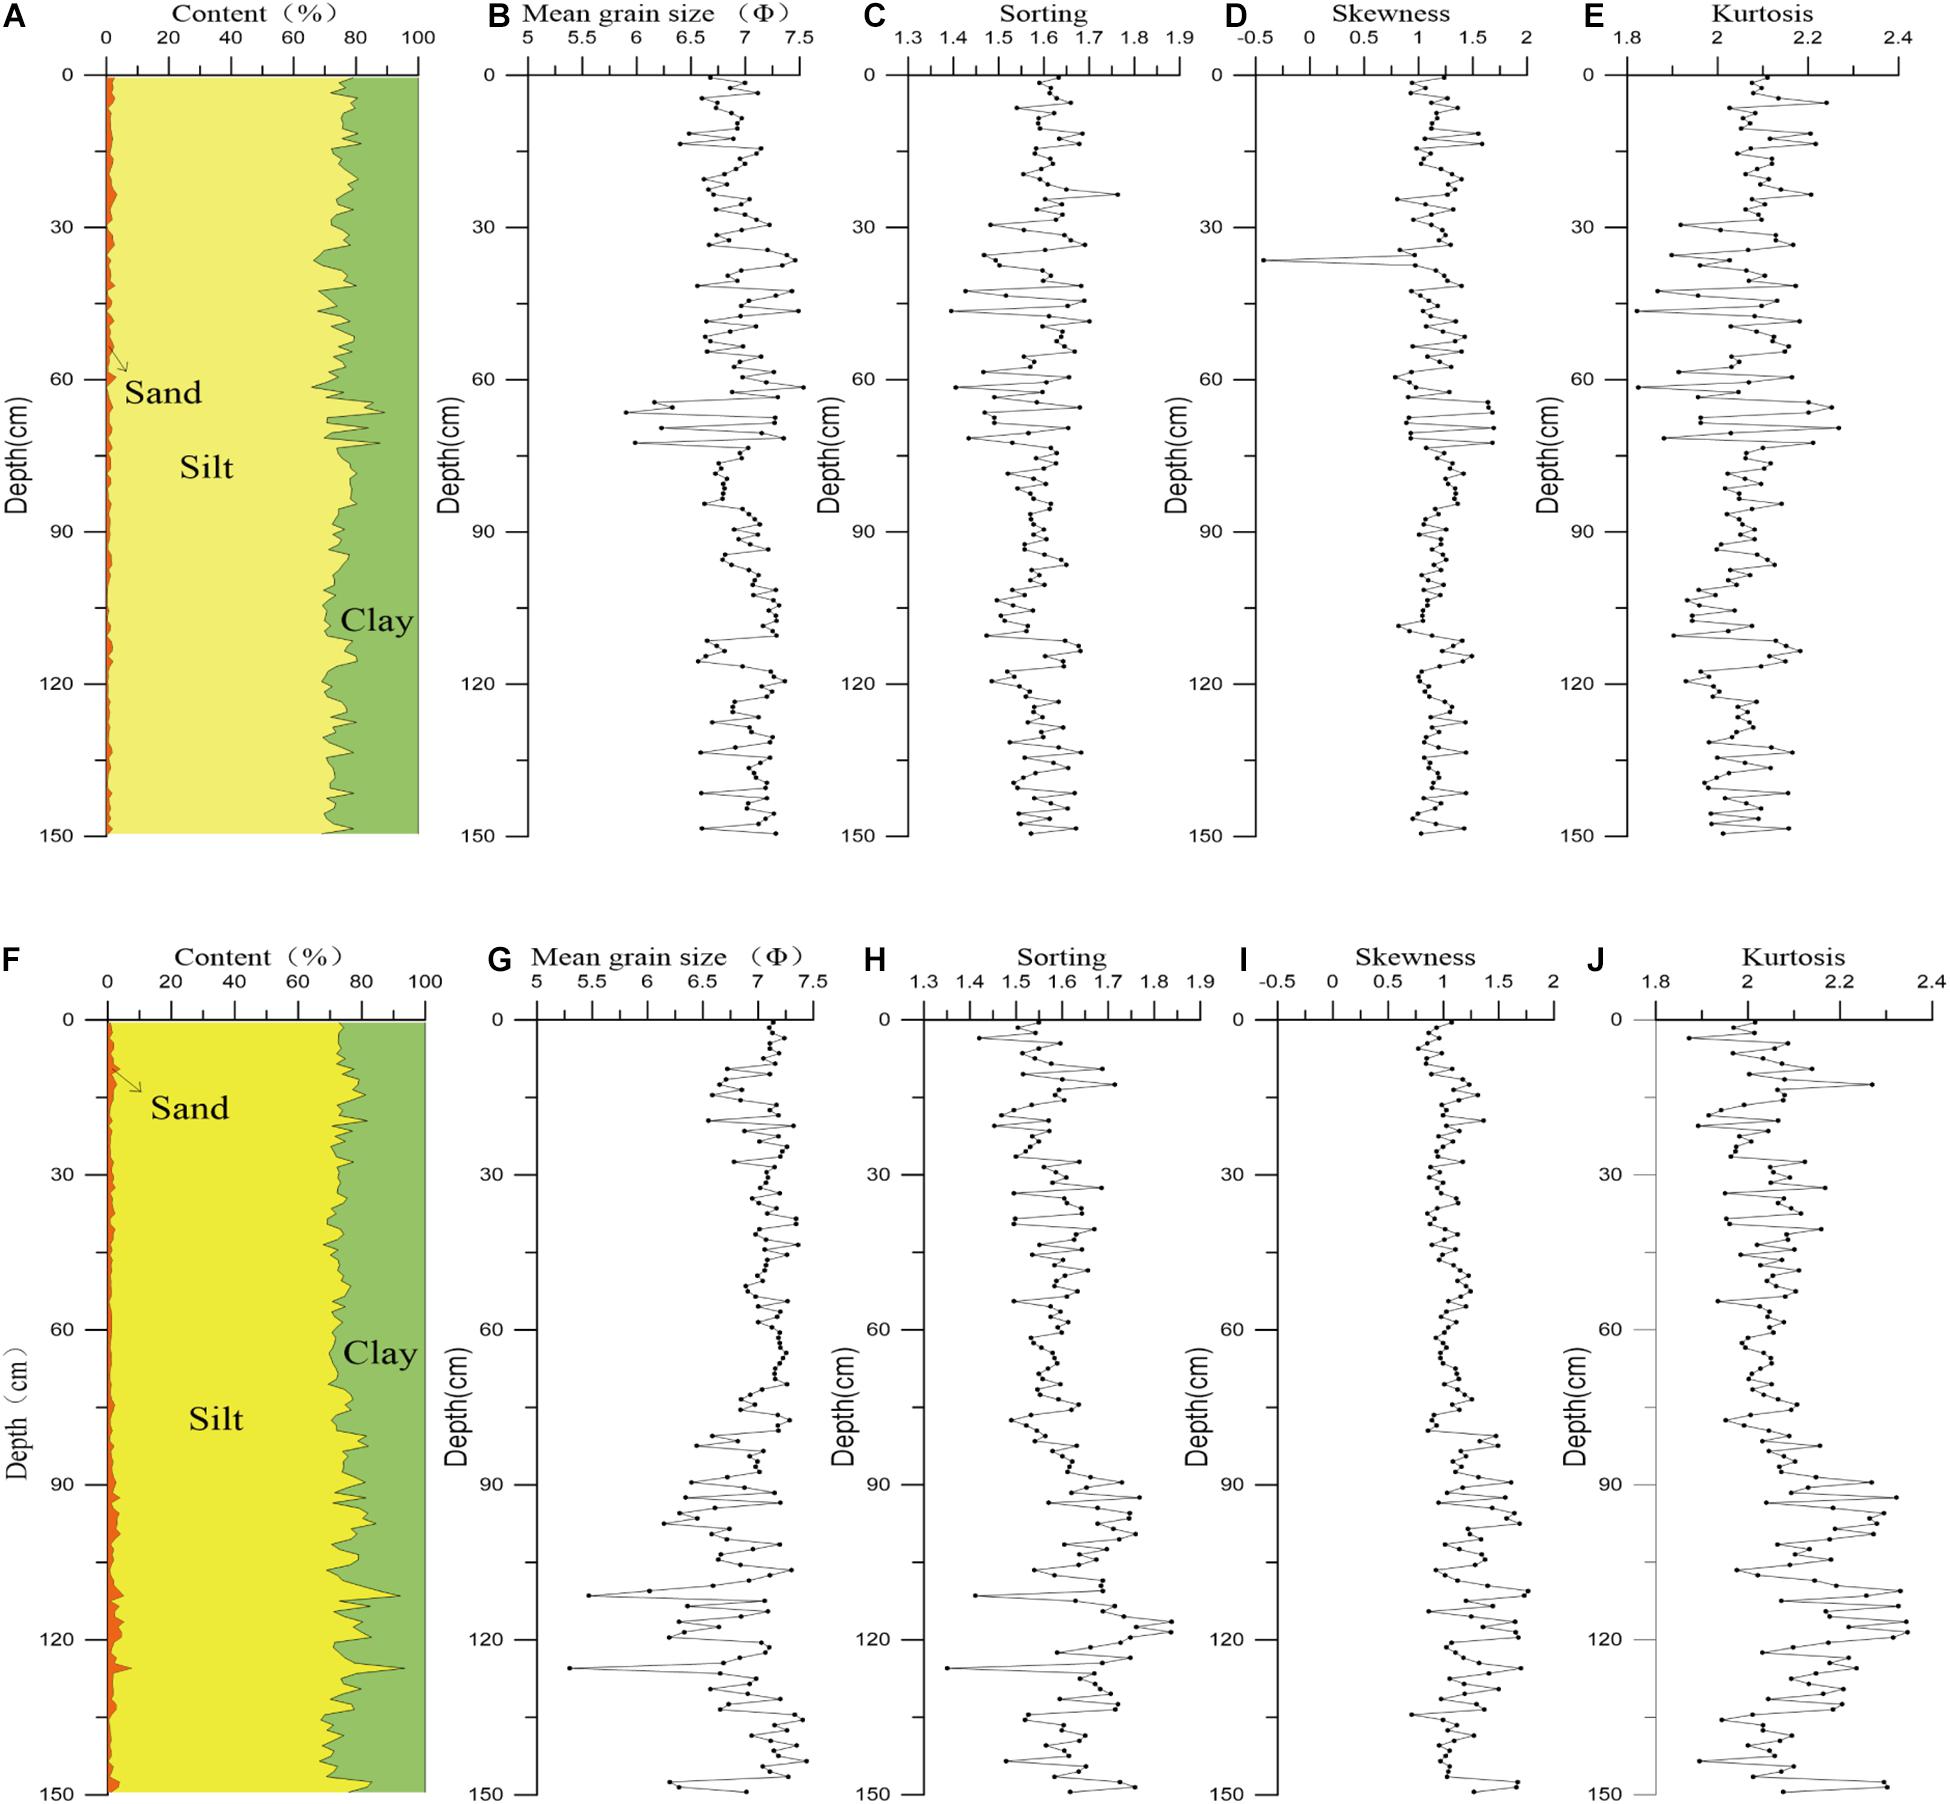
Figure 4. Vertical distribution of grain size components and parameters of core Z7 (A–E) and Z8 (F–J).
Segment I (150–70 cm) of Z7 fluctuated less in the grain size parameters, with mean grain size in the range of 6.5–7.25 Φ, sorting coefficient fluctuating approximately 1.6, skewness value approximately 1.2, and kurtosis value between 1.9 and 2.2.
Segment II (70–0 cm) of Z7 fluctuated considerably in the grain size parameters, with mean grain size in the range of 6–7.5 Φ, sorting coefficient in the range of 1.4–1.75, skewness value of approximately 1.2, and kurtosis value between 1.8 and 2.3.
Segment I (150–70 cm) of Z8 had a large fluctuation in the grain size parameters, with mean grain size in the range of 5–7.5 Φ, sorting coefficient in the range of 1.3–1.9, skewness value in the range of 0.75–1.75, and kurtosis value in the range of 1.85–2. 35.
Segment II (70–0 cm) of Z8 had a small fluctuation in the grain size parameters, with a mean grain size of approximately 7 Φ, sorting coefficient in the range of 1.4–1.7, skewness value approximately 1, and kurtosis value in the range of 1.95–2.15.
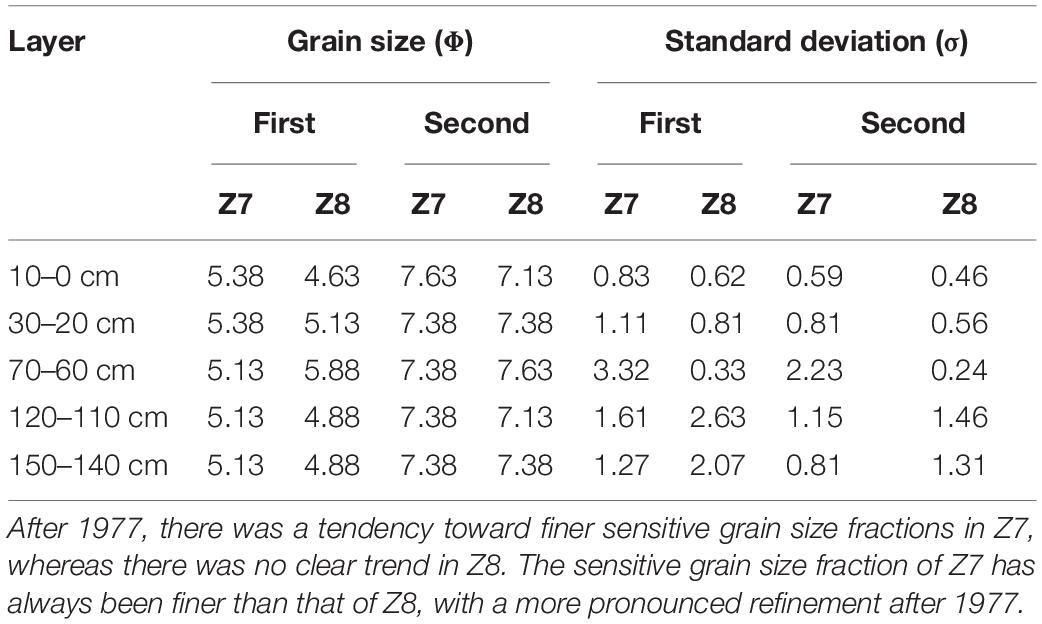
The sensitive grain size fraction was calculated at 10 cm intervals. Both Z7 and Z8 had two sensitive grain size fractions—the first between 4 and 6 Φ, and the second between 6 and 9 Φ. The peak heights (standard deviation values) of the two sensitive grain size fractions below and above 70–60 cm were very different for the two cores, with the 70 cm value corresponding to the year 1977 (Figure 3). Generally, before 1977, the standard deviation of Z7 was smaller than that of Z8, whereas after 1977, the standard deviation of Z7 was larger than that of Z8. To better illustrate the variation in the sensitive grain size fraction over time, the layer at 70–60 cm was selected and two layers below and above 70–60 cm were shown, such as 150–140 cm, 120–110 cm, 30–20 cm, and 10–0 cm (Figure 5).
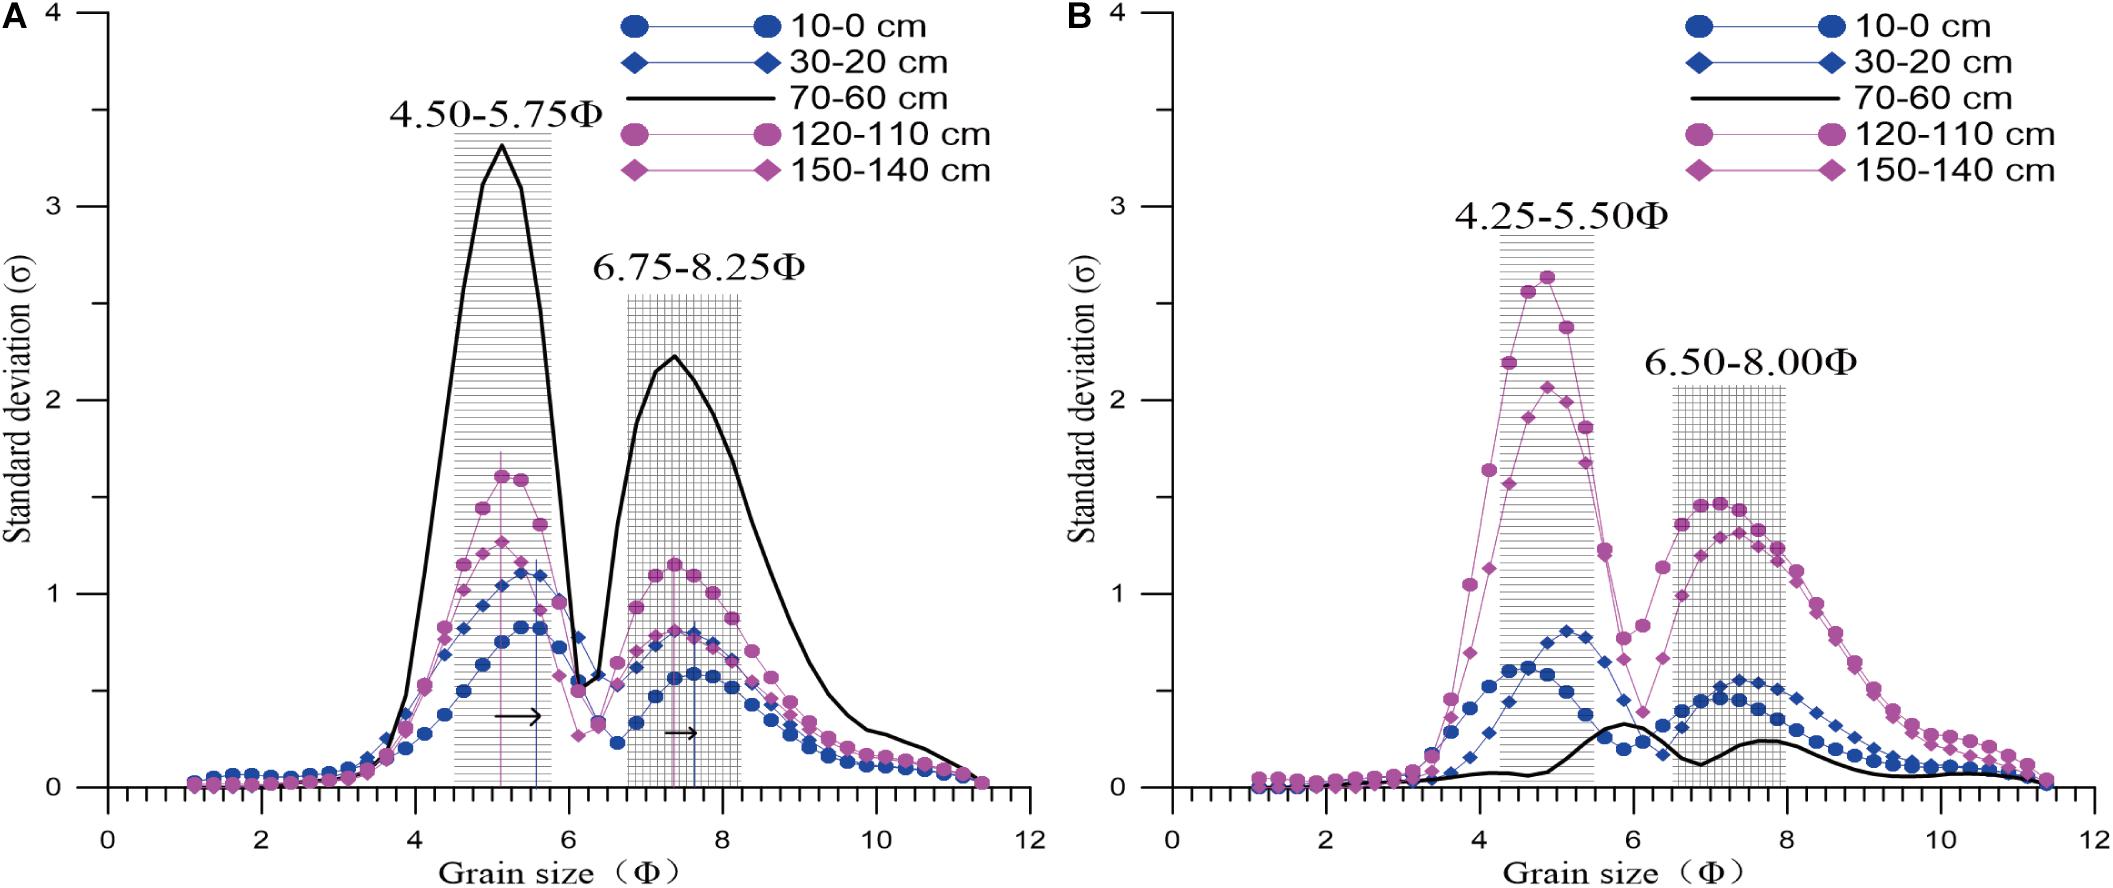
Figure 5. Sensitive grain size fractions of core Z7 (A) and Z8 (B) of the selected layer were as follows: the sensitive grain size of Z7 was relatively finer than that of Z8; the sensitive grain size fraction of Z7 tended to be finer after 1977, and Z8 had no obvious tendency. The black horizontal arrows indicate that the sensitive grain size has become finer after 1977.
Here we can see the difference below and above 70–60 cm for the two cores (Table 2), which indicated that the sedimentary dynamics of the environment had changed considerably since 1977. Before 1977, the standard deviation of Z7 was smaller than that of Z8, which meant that the sedimentary dynamics of Z7 were more stable than those of Z8. However, after 1977, the standard deviation of Z7 was larger than that of Z8, which meant that the sedimentary dynamics of Z7 were more turbulent than those of Z8. Moreover, after 1977, both the first and second sensitive grain sizes of Z7 were finer than those of Z8, which assumed that the finer particles were more affected by ship disturbance (Table 2).
The first sensitive grain size fraction of Z7 (4.50–5.75 Φ) did not change significantly in the 150–110 cm section, with a moderate increase in the 110–70 cm section, a sudden increase in the 70–60 cm section, and a moderate increase above 60 cm (Figure 6). The second sensitive grain size fraction of Z7 (6.75–8.25 Φ) did not change significantly in the 150–110 cm section, with a moderate decrease in the 110–70 cm section, a sudden decrease in the 70–60 cm section, and a moderate decrease above 60 cm. The first grain size fraction of Z8 (4.25–5.50 Φ) showed a significant change in the 150–70 cm section, a moderate increase and then a decrease, and it changed very little above 70 cm, with a moderate decrease. The second grain size fraction of Z8 (6.50–8.00 Φ) varied significantly in the 150–70 cm section, with a moderate decrease and then an increase, and it changed very little above 70 cm, with a moderate increase.
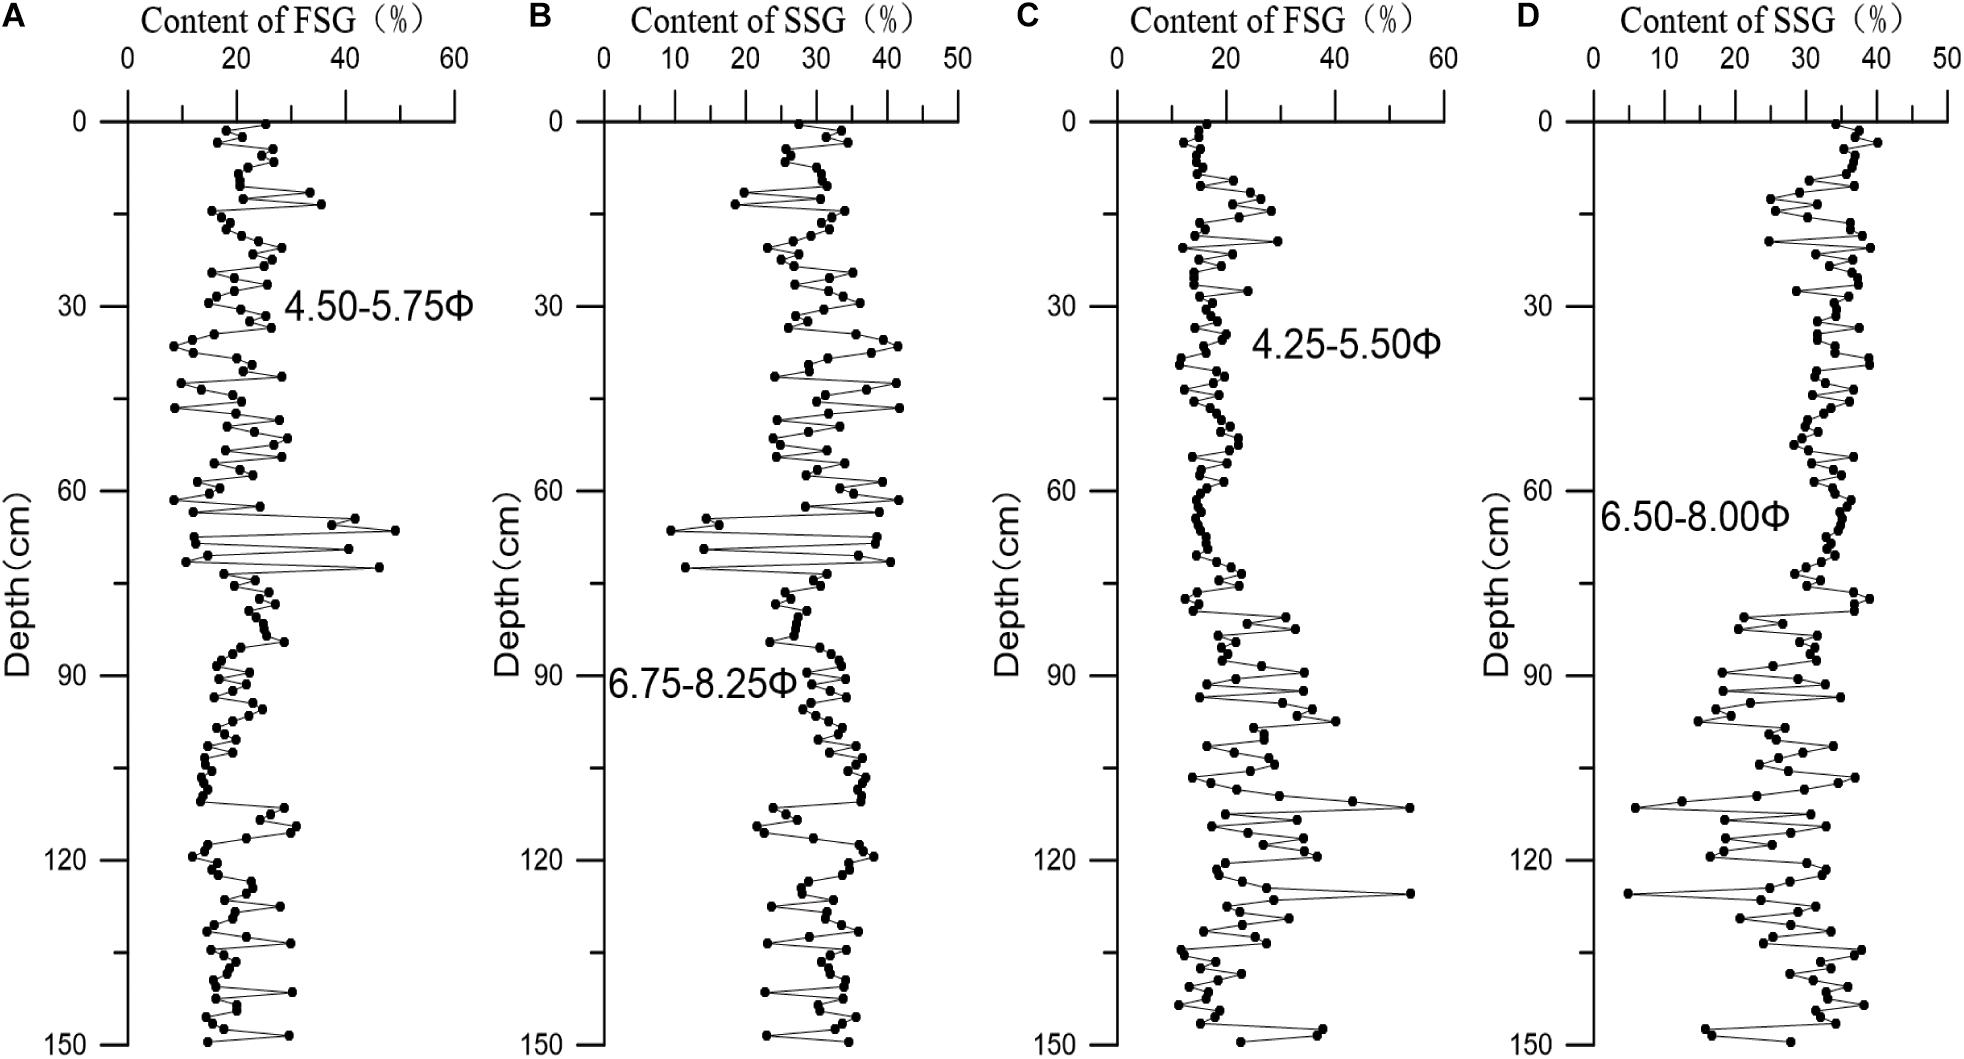
Figure 6. Variations in content of two sensitive grain size fractions of cores Z7 (A,B) and Z8 (C,D). FSG, first sensitive grain size; SSG, second sensitive grain size.
The measured grain size distribution curve (in the range of 2–12 Φ) was divided into 40 small cells in units of 0.25 Φ. The difference between two cores at the same time in these small cells was calculated separately. The content of Z8’s grain size component was subtracted from that of Z7 on the same layer, with the difference shown on a two-dimensional contour plot (Figure 7). Here we can see the quantity of coarser or finer particles difference between two cores at the same time.
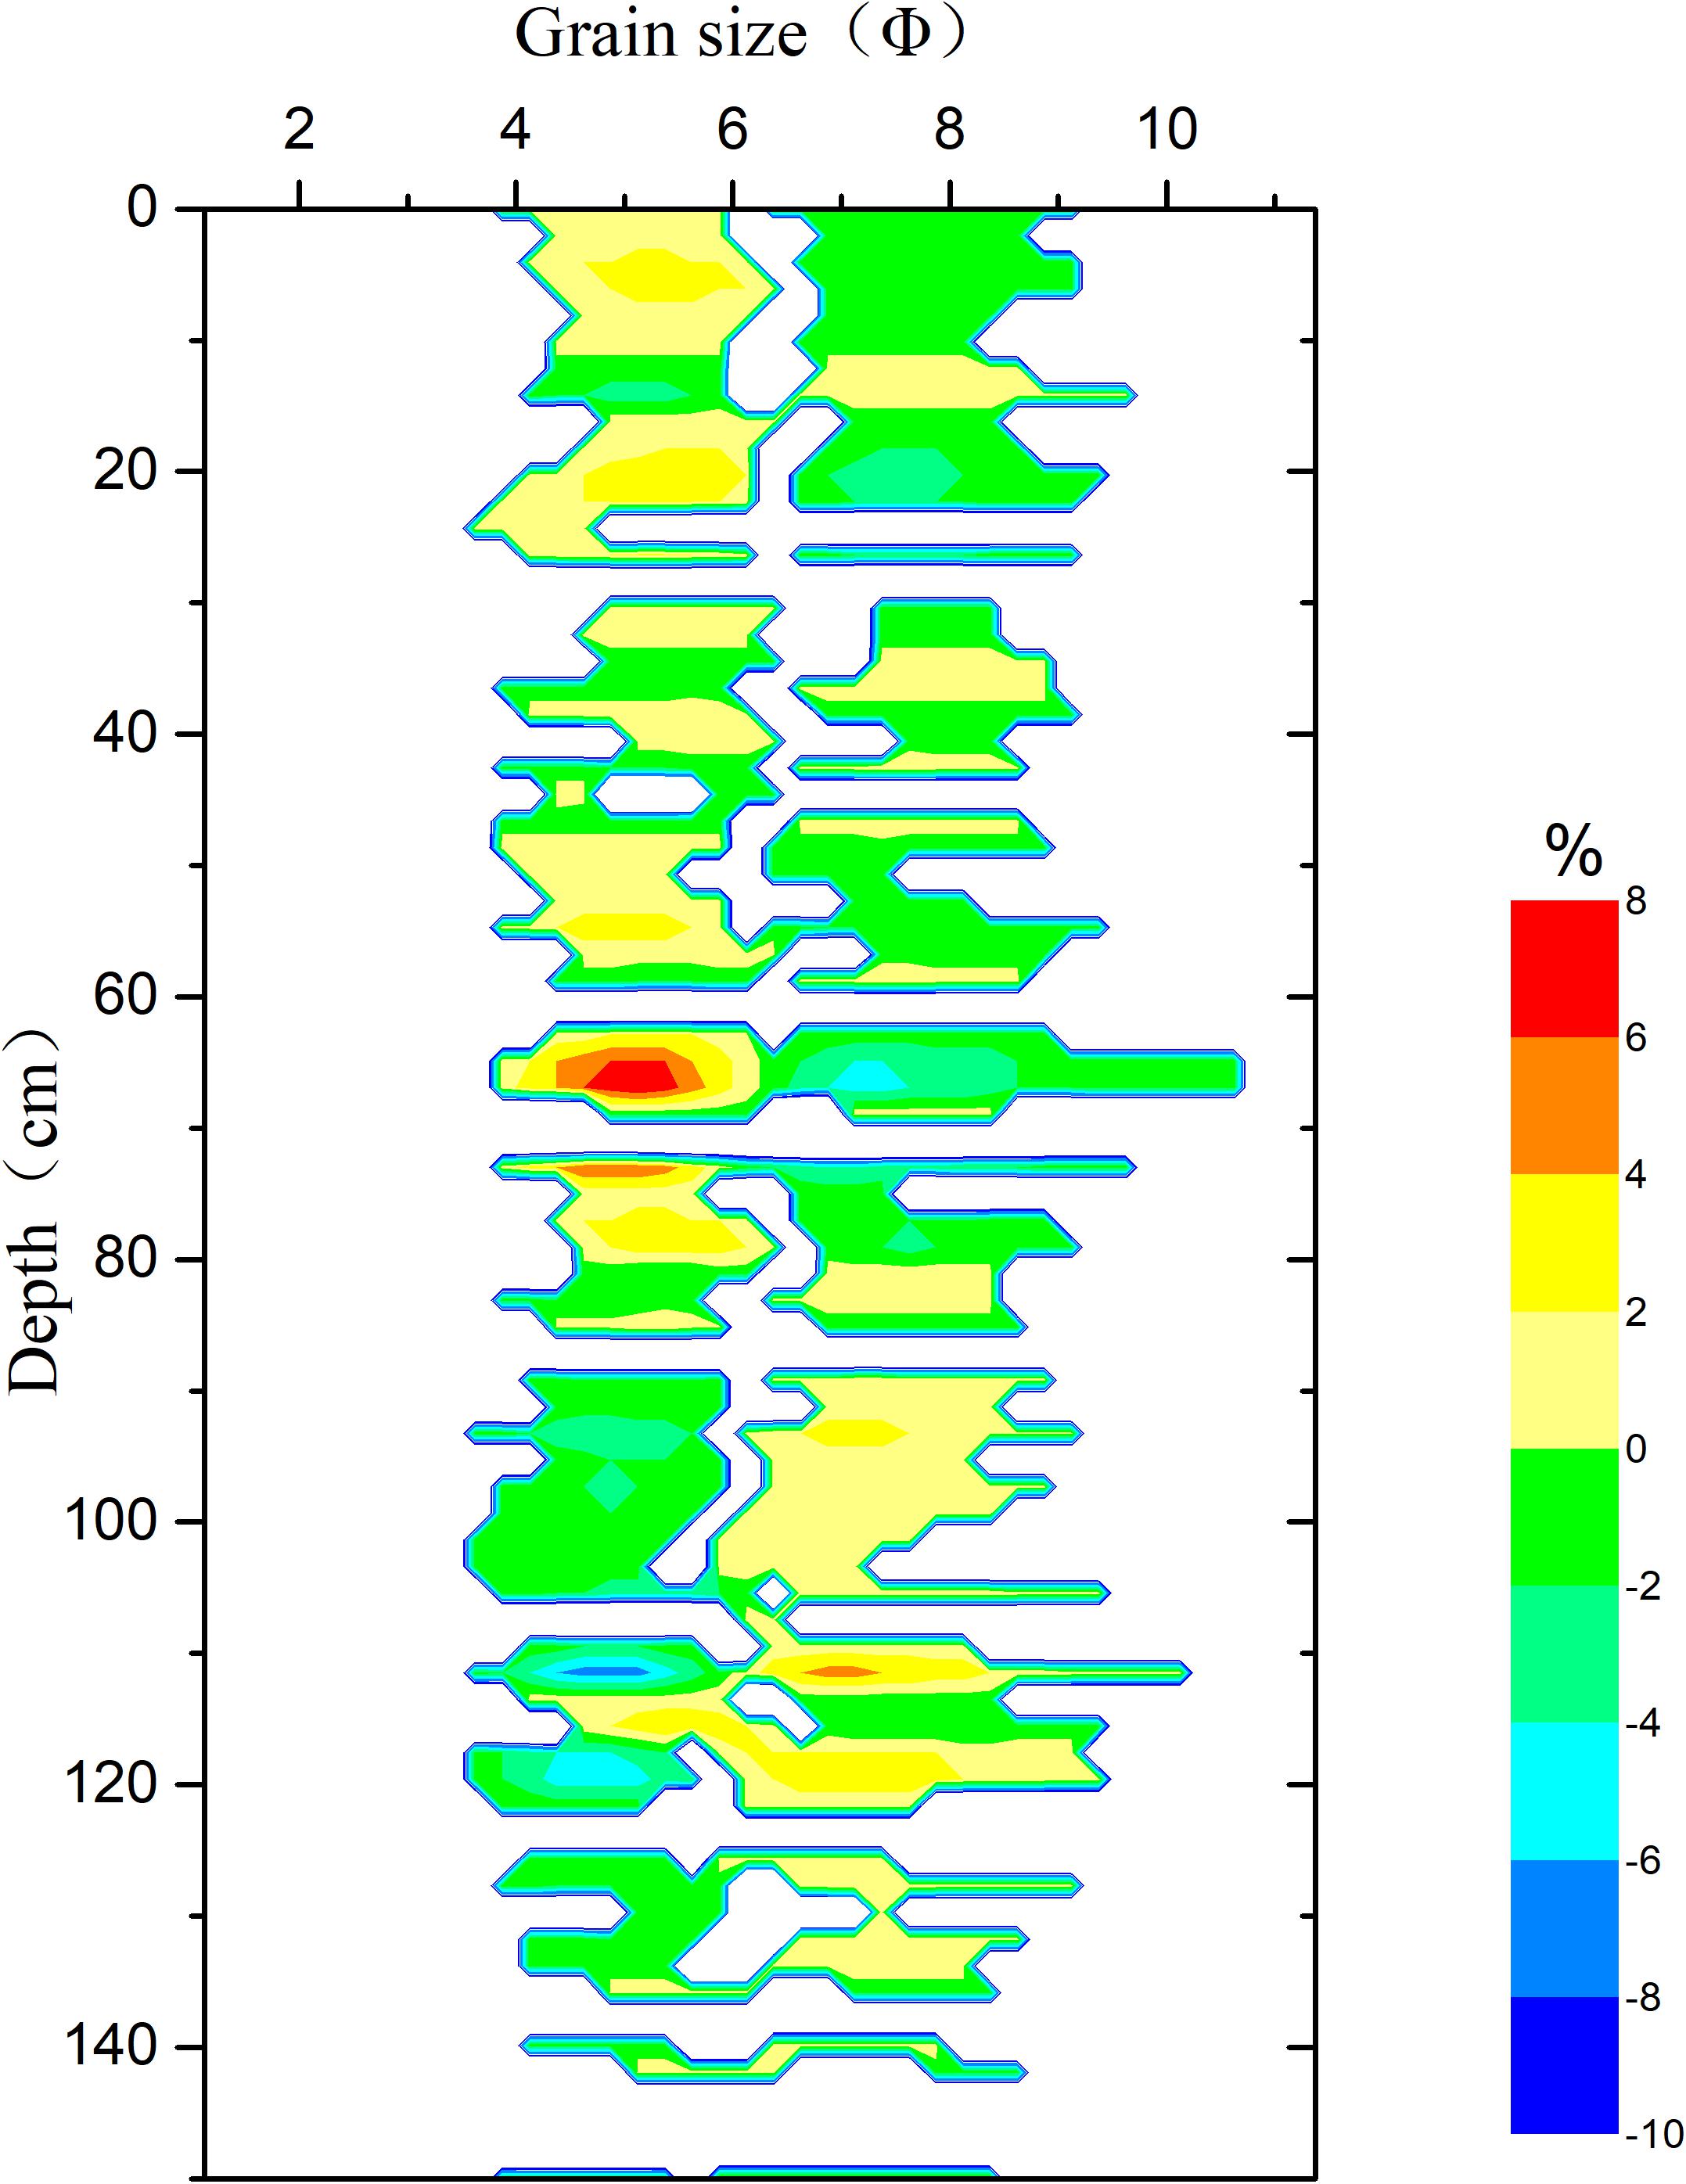
Figure 7. Difference in grain size components between two cores at 1-cm-intervals. It was obtained by subtracting the content of the grain size components of Z8 from that of Z7. % is represented the content of special grain size components. So a positive value (+) meant the content of the grain size components of Z7 was more than that of Z8 in that layer, and a negative value (–) meant the content of the grain size components of Z7 was less than that of Z8. The results showed that there was a tendency for grains in Z7 to coarsen relative to those in Z8 from 1977 (the depth of 70 cm).
The results showed that the sediment can be divided into two groups—coarse and fine—using 6.25 Φ as the boundary, and the sediment varied considerably over time. In the section of 150–140 cm, the difference in relative content between the two cores was approximately zero. In the section of 140–80 cm, the coarser particles (<6.25 Φ) of Z7 were significantly less than those of Z8, whereas the finer particles (>6.25 Φ) were significantly more than those of Z8. In the section of 80–0 cm, the opposite occurred, especially above 70 cm, where the coarser particles of Z7 were significantly more than those of Z8. This indicates that the sediment on the shipping lane showed an increase in the coarse particulate fraction and a decrease in the fine particulate fraction from 1977.
Elemental Characteristics of Sediment
Elements with specific indicators, including S, Cl, Br, Si, Ti, and Ca, were selected for comparative analysis. These elements have steady repeat scanning results and reliable detection, and have often been used by previous researchers (Thomson et al., 2006; Marsh et al., 2007; Agnihotri et al., 2008; Croudace and Rothwell, 2015; Grygar and Popelka, 2016). The content of elements is a relative value, and the data quality is influenced by several factors, such as grain size and water content variations, core surface imperfections, and the presence of organic matter (Croudace and Rothwell, 2015). In order to attenuate above effects, element-to-element ratios were used, which can allow comparison between the cores. Ti is a typical reference element used for normalization (Grygar and Popelka, 2016). The element ratios Br/Cl, S/Ti, Si/Ti, and Ca/Ti, were selected for the study (Figure 8).
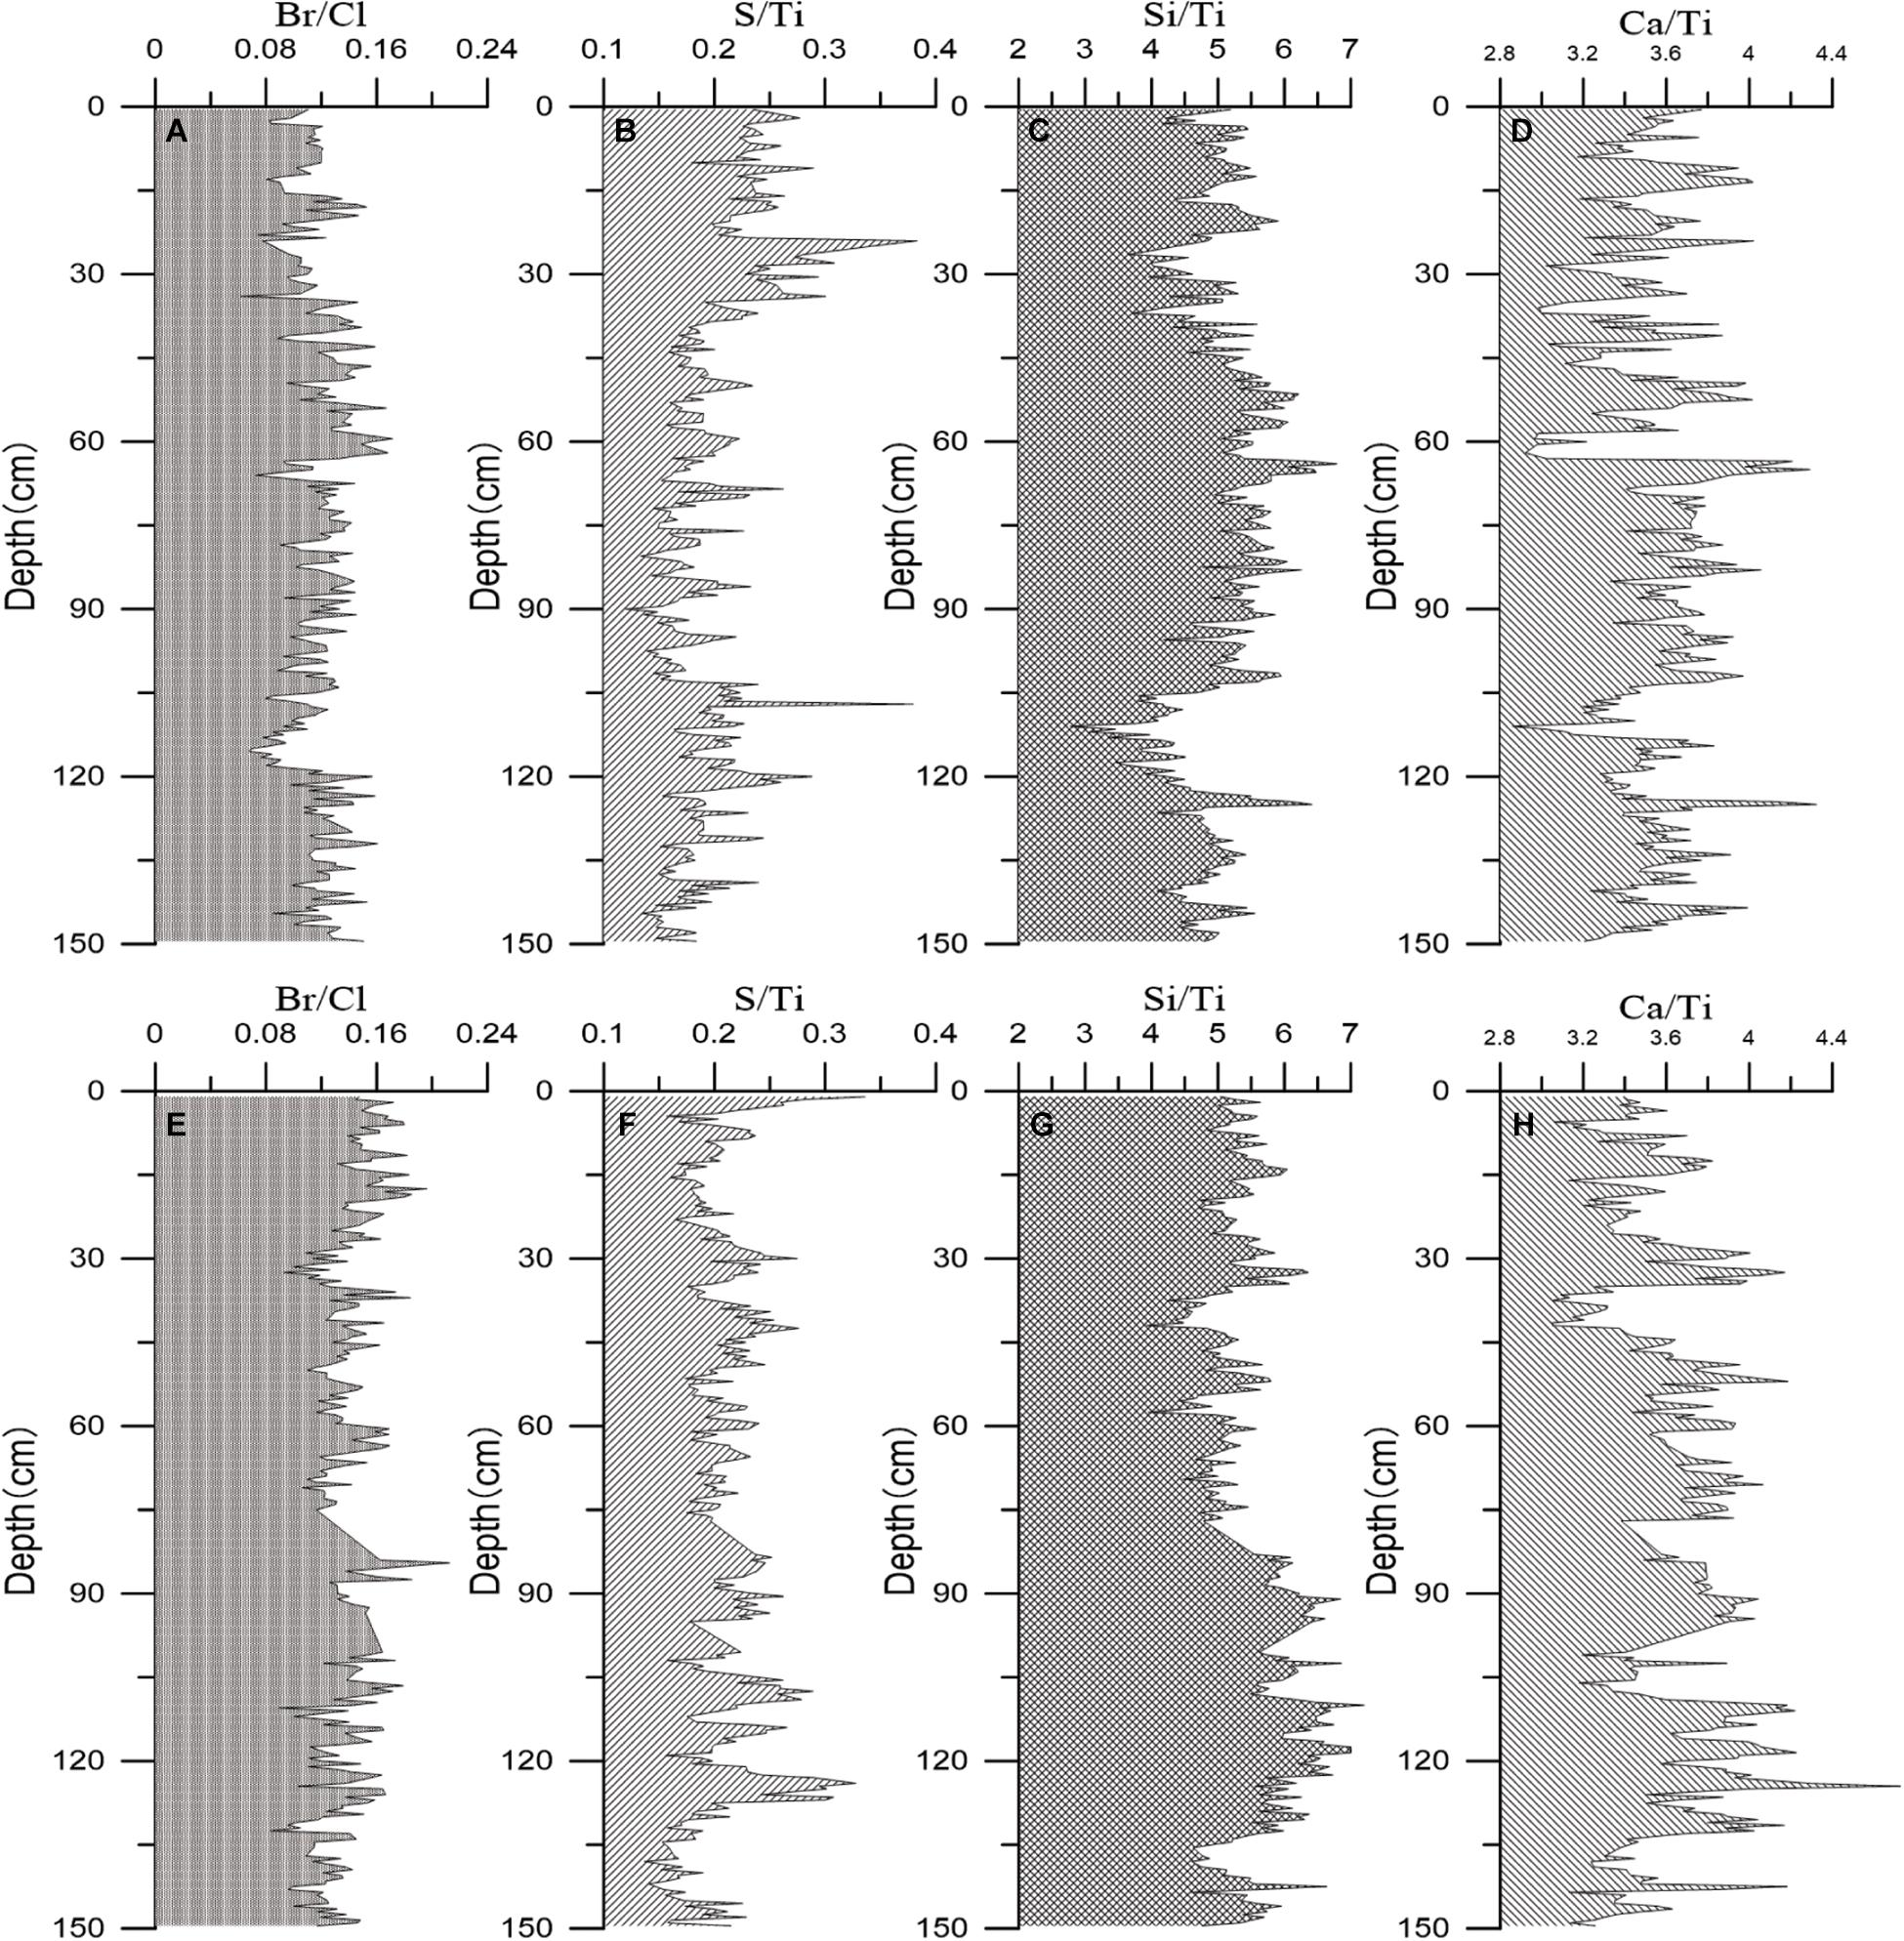
Figure 8. Variation of the element ratios over time in core Z7 (A–D) and Z8 (E–H). Element ratios of Z7 shifted significantly after 1999 (the depth of 40 cm), and element ratios of Z8 did not show a clear shift.
The Br/Cl ratio for Z7 ranged from 0.06 to 0.17, with a mean value of 0.12, and the element ratio decreased slightly in the 0–40 cm section, with a mean value of 0.11. The S/Ti ratio ranged from 0.12 to 0.38, with a mean value of 0.20, and the element ratio increased significantly in the 0–40 cm section, with a mean value of 0.24. The Si/Ti ratio ranged from 2.77 to 6.79, with a mean value of 5.01, and the element ratio decreased significantly in the 0–40 cm section, with a mean value of 4.87. The Ca/Ti ratio ranged from 2.86 to 4.32, with a mean value of 3.54, and the element ratio decreased slightly in the 0–40 cm section, with a mean value of 3.48.
The element ratios shifted at approximately 40 cm. According to the established dating framework (Figure 3B), the year was estimated to be approximately 1999.
For Z8, the most significant shift was Si/Ti, which transformed at 77 cm, with a decrease in the 0–77 cm section. The Br/Cl ratio for Z8 ranged from 0.08 to 0.21, with a mean value of 0.14. The S/Ti ratio ranged from 0.14 to 0.34, with a mean value of 0.21. The Si/Ti ratio ranged from 3.92 to 7.20, with a mean value of 5.50, and the element ratio decreased significantly in the 0–70 cm section, with a mean value of 5.17. The Ca/Ti ratio ranged from 3.05 to 4.73, with a mean value of 3.63.
Discussion
Development of China’s Offshore Shipping Lanes
Containerized maritime transport plays an important role in global trade, accounting for 80% of international cargo trade and growing at an average annual rate of 4% (Ducruet and Notteboom, 2012). A country’s container transshipment capability and accessibility directly reflect its maritime transport capacity, as well as its level of maritime transport development. China’s container industry began in 1979, with a container throughput of 32,900 twenty-foot equivalent unit (TEU). The late 20th century was in a period of rapid growth (Figure 9). According to statistics, the average annual container throughput in 1979–1999 was 2.95 million TEU, and in 1999–2018 it was 127.18 million TEU, a staggering 42-fold increase. The Port of Shanghai has held the top position for container throughput of the world’s largest ports since 2010. The external and internal feeders of foreign trade from the Port of Shanghai pass through the outside of Wenzhou Port, where our cores were collected.
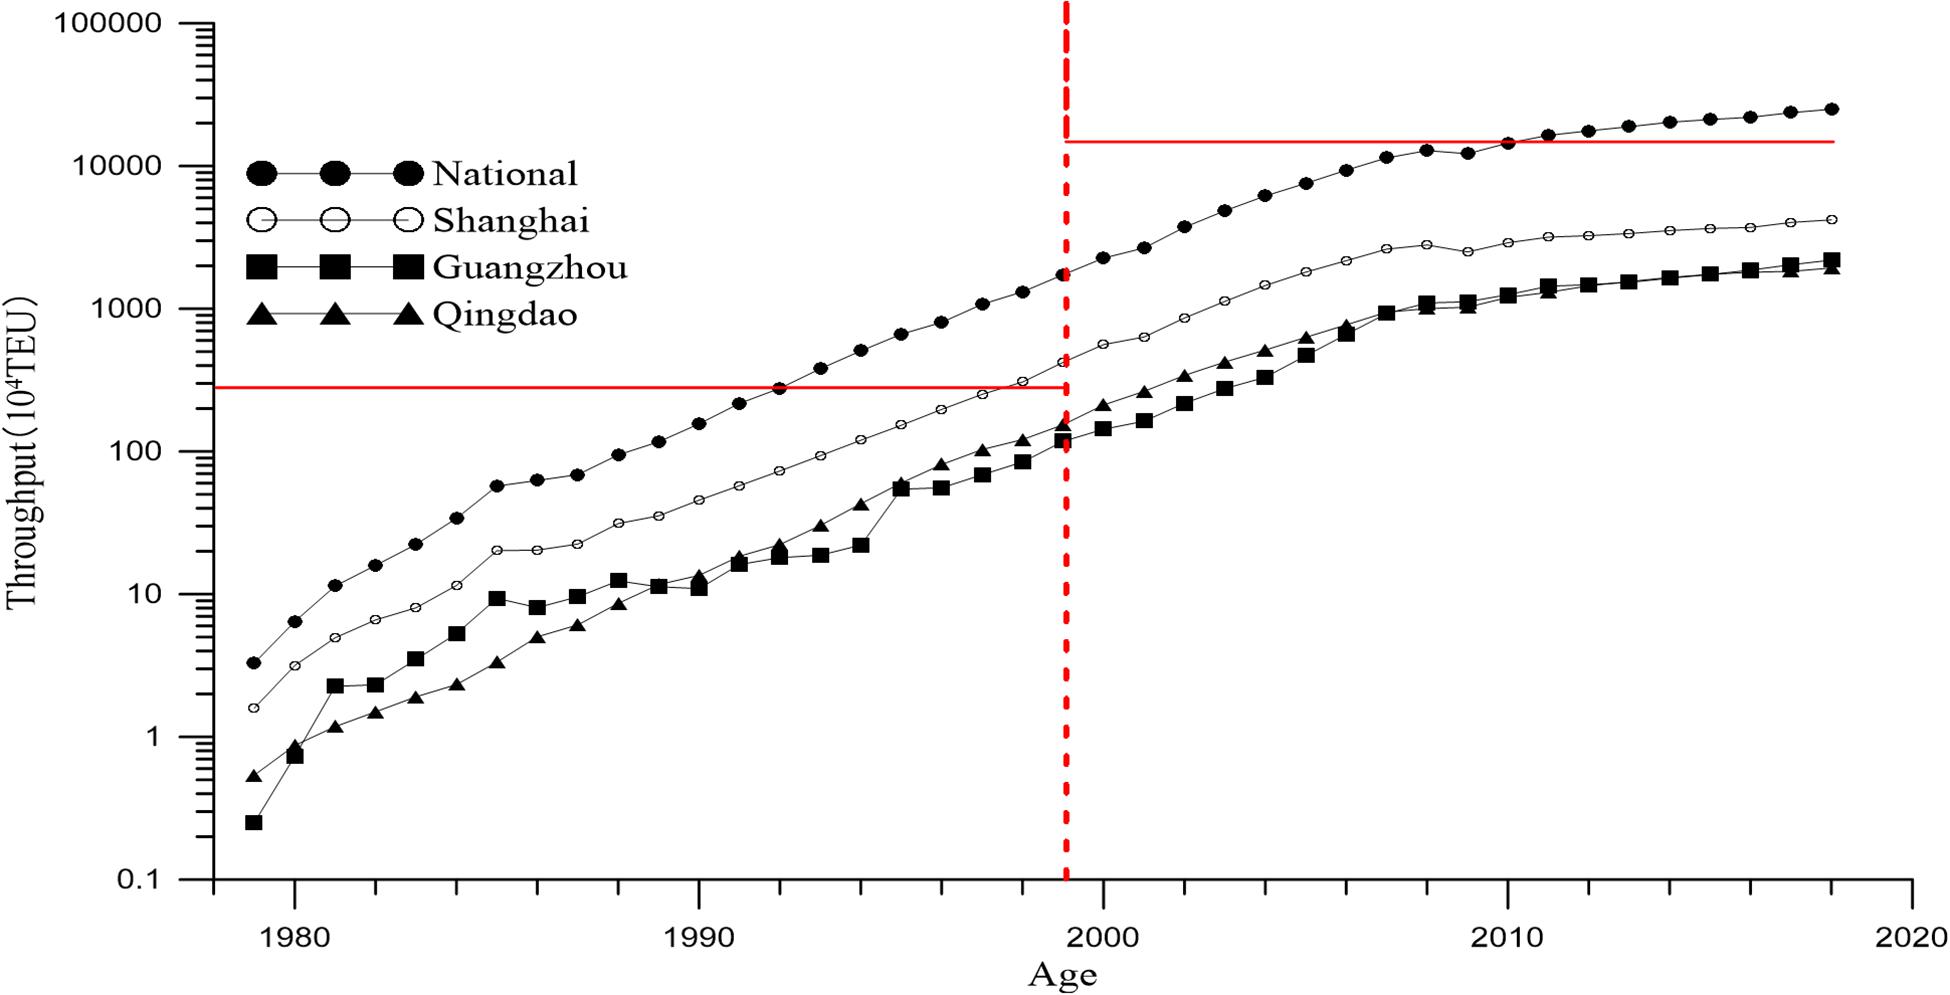
Figure 9. Throughput evolution of Chinese containers, 1979–2018. The 21st century began with rapid growth, and in 2008 the volume of seaborne trade declined as a result of the global financial crisis. The vertical dashed red line indicates the year 1999 and the two horizontal red lines indicate the average annual container throughput for the periods 1979–1999 and 1999–2018, respectively. Source: China Ports Yearbook (1999–2019).
Combining the model with global economic development scenarios, it is suggested that global maritime traffic will increase by 240–1,209% by 2050 (Sardain et al., 2019). In addition, the shipping industry entered the so-called megaship era in 2007 when a leading container shipping company deployed a fleet of mega-containerships with a carrying capacity of more than 10,000 TEUs (Imai et al., 2013). The development of megaships requires deeper draft depths and the sea areas affected by ship disturbance is expanding into deeper water accordingly, thus the disturbance effect of megaships will have an increasing impact on relatively deep waters.
China’s coastal shipping lanes are traversed in dense networks, with frequent passenger and cargo lanes. Vessels with a container load of more than 5,000 TEU, bulk cargo of more than 100,000 tons, and tankers of more than 100,000 tons meet our definition of a megaship. The southeast coast of China, the Bohai Bay, the Changjiang Estuary, the Taiwan Strait, and the eastern side of Taiwan Island are all areas affected by the disturbance of megaships (Figure 10). The study of modern sedimentary dynamics and its products in these areas should consider the influence of megaships on shipping lanes.

Figure 10. Thermal map of megaship tracks around China based on more than 5,000 TEU of containers (A), more than 100,000 tons of bulk cargo (B), and more than 100,000 tons of tankers (C) 1, the Bohai Bay; 2, the Changjiang Estuary; 3, the Taiwan Strait; 4, the Taiwan Island (Source: Shipping News, 2020 http://www.shipxy.com).
Differential Performance of Grain Size and Elements
The element content in the sediment is mainly controlled by its mineral composition. In addition, hydrodynamic conditions, adsorption and flocculation of fine particles, redox conditions, and human activities all have an influence on the variation of element content (Dong et al., 2009; Singh, 2009; Ye et al., 2013; Grygar and Popelka, 2016). The grain size of marine sediment is closely related to geochemical elements, both of which are in accordance with the “law of elements controlled by grain size” (Zhao and Yan, 1994). Fine-grained sediment can be readily enriched in some chemical elements, either because they are present in the clay minerals or because of the adsorption effect of the fine-grained particles. This is due to the correlation between particle size and elements, which are often used as a proxy for particle size (Zhou et al., 2019). However, as mentioned above, the particle size changed significantly approximately 1977, whereas the elemental ratios of S/Ti, Ba/Ca, Si/Ti, and Br/Cl did not change significantly until approximately 1999. The behavior of particle size and elements was not identical, and it was therefore worthwhile to investigate the underlying mechanism.
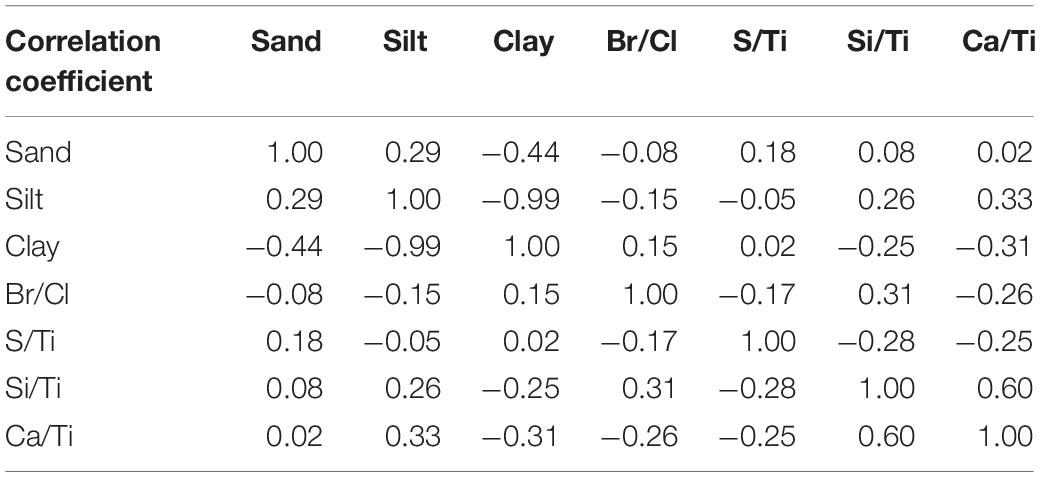
Correlation analysis was conducted between the element ratios selected in this study and the sand, silt, and clay contents. Both were found to be poorly correlated, with the correlation coefficient almost always less than 0.3 (Table 3). There was therefore no significant correlation between the grain size and the elements.
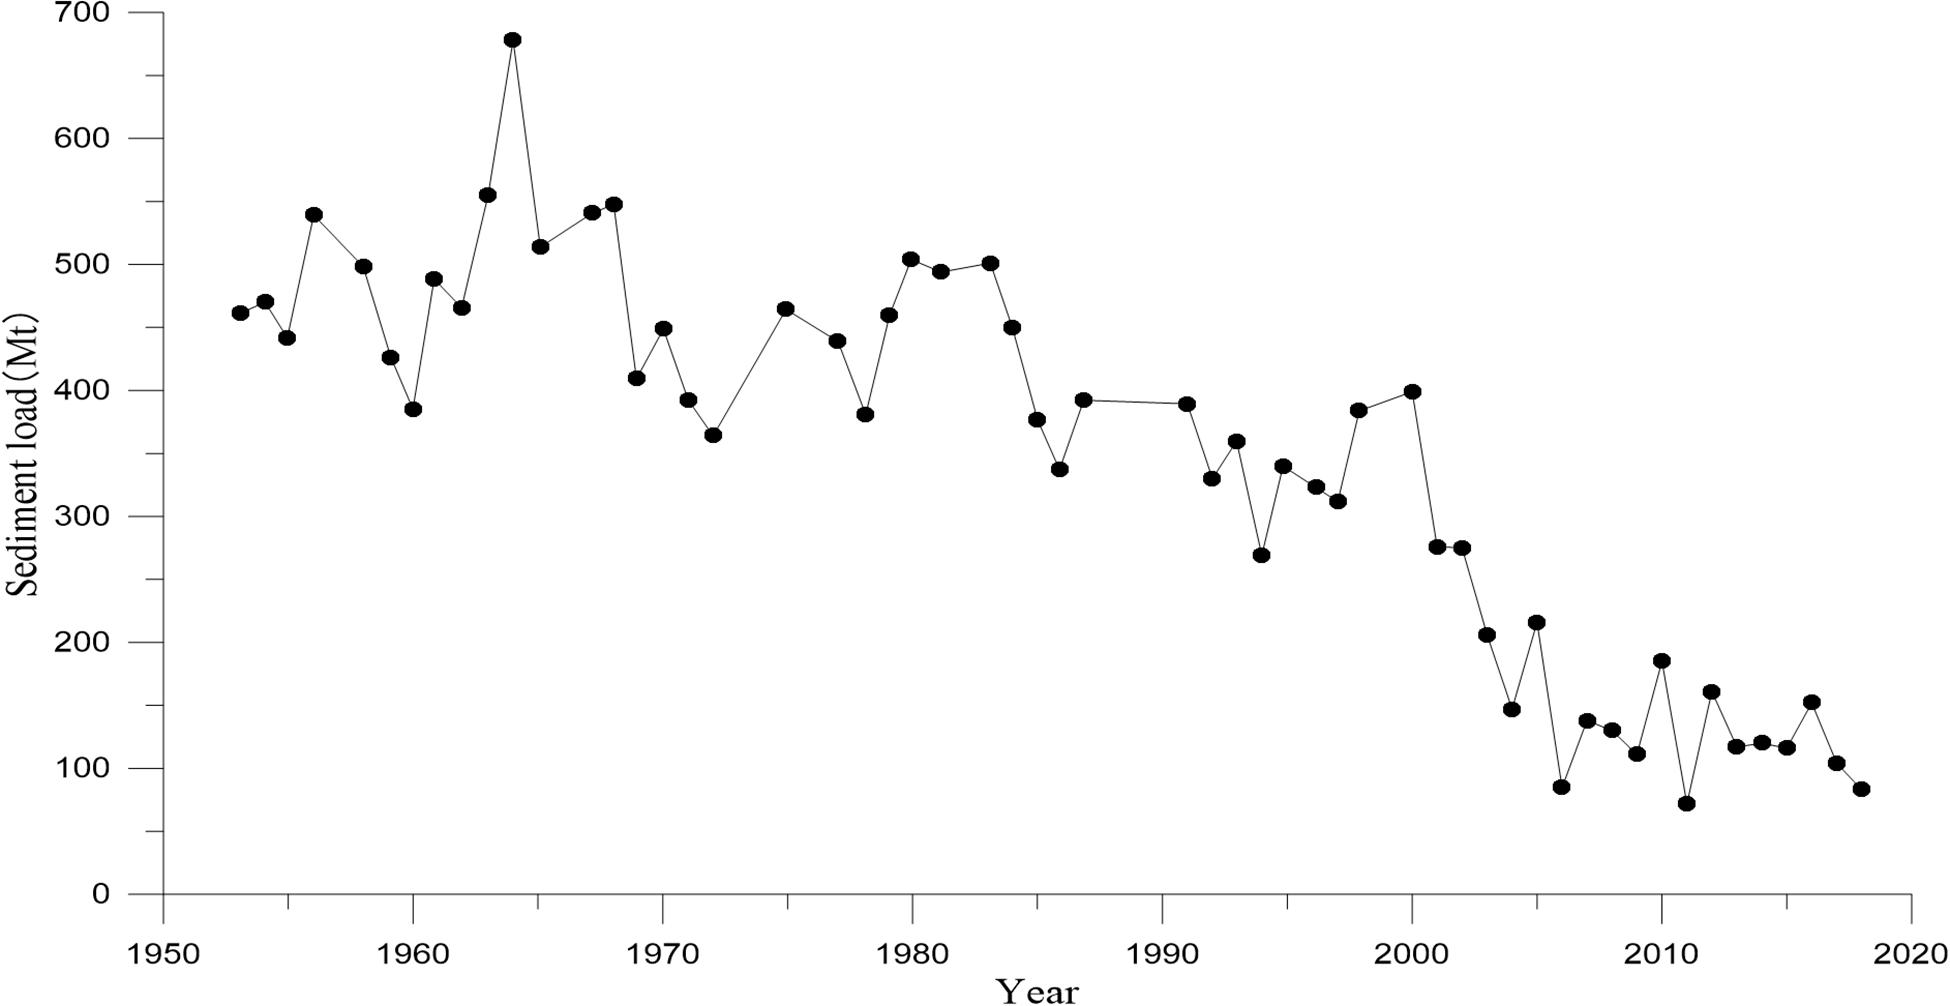
The factors influencing the change in the grain size of marine sediments can be summarized into two categories: the first is the change in sediment sources (sources or sediment flux), and the second is the change of sedimentary dynamics environment, which is closely related to the coastal circulation system and extreme climate events (Liu et al., 2010). The study area is located in the distal mud of the subaqueous Changjiang River delta, and the sediment mainly comes from the Changjiang River. Thus, the annual sediment flux of the Changjiang River Datong Station was counted during the period 1953–2018 (Figure 11). Before 2000, the annual sediment load was more than 300 Mt. After 2003, due to the influence of the Three Gorges Reservoir, the annual sediment load was less than 200 Mt. In this study, the grain size transition occurred early before the drastic change in sediment flux, so the grain size transition was not influenced by the change of sediment source. Some studies suggest that the load, grain size and sediment composition deposited over the coastal and shelf water adjacent to the estuary have changed in response to the Three Gorges Dam. However, this phenomenon occurs mostly downstream of the reservoirs and estuaries, and after long-distance transport, the signal of changing grain size in the study area has been difficult to detect (Gao et al., 2019). Even in the downstream of the reservoir, the median grain size variation is only about 5 μm (Gao et al., 2015), which is smaller than the variation caused by the navigation channel. Therefore, the transition of grain size was caused by changes in the sedimentary dynamics environment, mainly due to disturbance by ships.
Marine sediments are mainly composed of terrestrial debris, biogenic materials, and marine authigenic substances, whose relative content determines the distribution of elements in the sediment. The elements, especially the biogenic elements related to the ecological environment, can reflect the evolution of the sedimentary environment.
The time of element ratios shift lags behind the time of grain size shift, which was most likely a response of the ecological environment to the effects of ship disturbance. This occurred approximately 1999, when the frequency of navigation began to increase rapidly (Figure 9). At the beginning of ship navigation, the effects of ship disturbance did not cause significant changes in elements, until the rapid growth in the maritime transportation of China in 1999. There are complex mechanisms behind this response, involving processes such as the migration and transformation of marine biological production, biogeochemical cycling of marine substances and elements, especially redox-driven processes (Schubert et al., 1998; Duan et al., 2010). All of these processes were influenced by the environmental characteristics include suspended sediment concentration, salinity, total dissolved organic carbon, temperature, depth, pH, Eh, phytoplankton, and water circulation (Marcussen et al., 2008). Only after the disturbance frequency reached a certain level, would the elemental variation manifest. Therefore, grain size variations were expressed soon after the start of navigation, whereas the biogenic elements did not change significantly until 1999.
Sedimentary–Ecological Response to Ship Disturbance
Quantitative studies on the impact of human activities on ecology are of vital importance. In recent years, global reductions in riverine sediment fluxes have become widespread (Syvitski et al., 2005; Milliman and Farnsworth, 2011). Studies to investigate the impact of human activities, mainly in terms of changes in the fluxes and sediment properties of the sea (Dai et al., 2008; Gao et al., 2014; Yang et al., 2019), have made good progress in quantifying these impacts. For example, Dai et al. (2008) argued that, for the Changjiang River, the contribution of climate change to the reduction of sediment flux into the sea was only approximately 3%, with anthropogenic contributions accounting for 97%.
Ship navigation is an important anthropogenic agent. During navigation, ships alter the local hydraulic regime, i.e., the generation of currents and ship-induced waves (Rapaglia et al., 2011; Fleit et al., 2016). The highest near-bed velocities resulting from ship generated waves range between 0.1 and 0.4 m/s in Danube River of Hungary, which was obtained by computational fluid dynamics (CFD) modeling (Fleit et al., 2016). The average flow velocity with no ship is 0.02 m/s, which means an increase of an order of magnitude due to ship (Fleit et al., 2016). In situ measurement shows that the water velocity increases to 2.1 m/s when the ship passes by, which is more than an order of magnitude higher than the typical tide and wind driven current speed in the channels of Venice (Coraci et al., 2007). The increased current speed can increase bottom shear stress, which will cause the resuspension of sediment in shallow water areas and the erosion of the channel slope and seabed (Rapaglia et al., 2011; Ji et al., 2014; Fleit et al., 2016). It is found that the ship-generated waves (including drawdown and surge waves) have much more effects on sediment resuspension than wind waves (Houser, 2014). Once the shear stress generated by the ship is larger than the critical shear stress which is further determined by sedimentary characteristics, the seabed sediment would move in suspension, saltation, and creep (Liou and Herbich, 1976; Liao et al., 2015). The bottom shear stress caused by propeller scour is an important mechanism contributing to sediment resuspension and subsequent erosion (Liao et al., 2015). In the same situation, the resuspension of coarser particles requires a greater incipient velocity (Liou and Herbich, 1976). Finer particles are easier to resuspend. Ship-generated waves are capable of resuspending significant quantities of bottom sediment and suspended sediment concentration increases with increment of turbulent kinetic energy of the ship wakes (Houser, 2014; Ji et al., 2014). In situ observation showed that suspended sediment concentration rose from 12 mg/L to 400 mg/L in Venice Lagoon, Italy, after the ship had sailed (Rapaglia et al., 2011). The intensity of sediment disturbance by a ship is related to the speed, propeller rotation speed, water depth, and draft of the ship (Liou and Herbich, 1976; Hong et al., 2013). Generally, the faster the speed of ships, the shallower the water depth, and the deeper the draft, the stronger the intensity of the disturbance. Sediment resuspension caused by ship disturbance has led to a series of changes in both the sedimentary environment and ecology.
In this study, when establishing the dating framework, it was found that in a relatively stable sediment environment (such as the location of core Z8), the dating results obtained by the CIC and CRS dating models were consistent. However, in an unstable sediment environment (such as the location of core Z7), the results of the two dating models differed greatly, and the age difference of the same layer could be up to 24 years. Because of the inherent shortcomings of the CRS model, the bottom age is biased toward aging, whereas the CIC model homogenizes the sedimentation rate, which is obviously not applicable in an unstable sediment environment. A single dating model cannot establish a convincing and comparable dating framework. The best approach is to combine the two models, using the CRS model in the layer affected by ships and the CIC model in the lower part, to establish a CRS–CIC dual dating model. Figure 3 shows that the CRS–CIC dual dating model can be used with reliable results to address sedimentation rates in an overall sedimentary environment, but locally influenced by frequent ship motion.
Since the development of coastal shipping in China in 1977, the fluctuations of grain size has changed largely. Before 1977, the fluctuation of grain size of Z8 is wider than that of Z7, which shows an opposite trend after 1977. Core Z8 is located near a small bedrock island called “Pishan,” which will cause more complicated hydrodynamics (tidal and wave) compared to core Z7 before 1977. In this case, the fluctuation of grain size at Z8 is wider than that of core Z7. However, the hydrodynamic condition is more complicated at core Z7 than that of core Z8 after 1977 due to the disturbance of ships, causing the fluctuation of grain size of Z7 is wider than that of Z8.
In addition, the sensitive grain size at Z7 has been finer (Figure 5A). With 6.25 Φ as the boundary, the grain fraction finer than 6.25 Φ decreased (Figure 7). It was calculated that before 1977, core Z7 had a significantly higher fine grain fraction (>6.25 Φ) than core Z8, with a mean value of approximately 6%, but after 1977, core Z7 had a significantly lower fine grain fraction (>6.25 Φ), with a mean value of approximately 5%. This indicated an 11% reduction in the grain fraction finer than 6.25 Φ at the shipping lane and a significant coarsening of the sediment. Ship motion affected the local sedimentary dynamic environment. Although the total sedimentary flux was the same as the flux outside the shipping lane, it has a selective modifying effect on the sedimentary record: in the sediment on the shipping lane, which was dominated by silt, all grain fractions became more active under frequent ship disturbance. Due to differences in sedimentation mechanisms, it was relatively slow for fine grain to settle, and a significant proportion of the fine grain fraction may leave the shipping lane, causing a reduction in the fine grain fraction entering the seabed sediment. It has been shown that vessel-induced wakes can increase the concentration of suspended sediment by a factor of 30 above background values, but this surge only lasts for a few minutes, and then the high concentration persists for almost an hour before returning to background values (Rapaglia et al., 2011). The sustained high concentration is due to the slow settling velocity of fine particles.
Ship disturbance also caused ecological changes. After 1999, the value of Br/Cl in the Z7 core decreased from 0.12 to approximately 0.11, the value of S/Ti increased significantly from 0.20 to 0.24, the value of Si/Ti decreased from 5.01 to 4.87, and the value of Ca/Ti decreased from 3.54 to 3.48. The decrease in Br/Cl could indicate, to some extent, the decline of primary productivity in the region (Thomson et al., 2006). High S-levels tend to indicate a low oxygen zone (Croudace and Rothwell, 2015). Si/Ti is an important indicator of siliceous phytoplankton productivity. The principle of reduced Ca/Ti is the same as that of Si/Ti, both of which belong to the response of biogenic elements to the marine environment (Marsh et al., 2007; Agnihotri et al., 2008). Specific to the above individual indicator, small changes in value may not be evidence of significant changes in the ecological environment. However, the changes in the four indicators pointed to consistency, which may be related to the disturbance of ships in the waterway. For example, frequent disturbance by ships made the shipping lane waters turbid, and light became the most important factor limiting marine productivity. The turbidity and high concentration of suspended solids was not conducive to the growth and reproduction of phytoplankton, and this reduced primary productivity (Jiang, 1993; Pan et al., 2011). In addition, the amount of phytoplankton directly affected the dissolved oxygen content in seawater. The reduction of phytoplankton decreased the dissolved oxygen content in seawater, leading to the dissolution of iron oxides and the formation of pyrite (FeS2), which increased the amount of elemental S in the sediment (Jiang, 1993; Croudace and Rothwell, 2015). Frequent disturbance was detrimental to diatom growth and reproduction, and decreased the biotransformation rate of silicates in seawater and the “silicon fixation” effect, thus decreasing the Si/Ti value in sediment (Huang et al., 1986; Pan and Shen, 2009). Calcareous phytoplankton such as coccolithophores are widely distributed and abundant in the ocean, are well preserved in the sediment and are important sources of biogenic Ca in the sediment (Poulton et al., 2007, 2013). Frequent disturbance was also detrimental to the growth of coccolithophores, and made it difficult for biogenic Ca to adhere to the particulate matter, which can reduce the Ca/Ti ratio in the sediment. Overall, the quality of habitat conditions along the shipping lane was significantly different from those outside the shipping lane. The content of each element in the sediment of the shipping lane was controlled by a combination of physical, chemical, and biological interactions. Suspension of fine particles caused by physical disturbance affected the marine ecosystem and ultimately changed the elements in the sediment.
Human activity has left a universal and lasting imprint on Earth. The debate continues over whether the Anthropocene deserves recognition as a new unit of geological time (Waters et al., 2016). The Anthropocene Working Group (AWG) has recommended the recognition of the beginning of the Anthropocene as the mid–late 20th century. However, some researchers questioned the time starting point, arguing that significant human-induced changes to the Earth’s environment occurred long before the 20th century (Ruddiman, 2018). The Anthropocene is currently defined from a variety of perspectives, including paleontology, micropaleontology, stratigraphy, and archeology (Barnosky, 2013; Wilkinson et al., 2014; Zhuang and Kidder, 2014), as a time when humans have played an important role in changing the global environment at an unprecedented rate. The study of the Anthropocene can bring into focus the transformation of the natural environment by humans. By studying the development of the global shipping industry and its sedimentary–ecological effects since the 20th century, one can attempt to define the Anthropocene from the new perspective of ship navigation.
Conclusion
China’s container shipping industry originated in 1979 and has been growing rapidly since 1999. By studying characteristics of shelf sediments from shipping lane, our study found that over the past few decades, with the development of China’s maritime transport industry, significant changes in shelf mud deposition have occurred. Our conclusions are as follows:
(1) There were significant changes in the sediment grain size composition after ship disturbance, with the sedimentation response at the beginning of navigation. Ship disturbance selectively modified the sedimentary record. The fine-particle fraction of the sediment became more active and the particles finer than 6.25 Φ were significantly reduced (by approximately 11%) after being disturbed by the ship.
(2) Ship disturbance caused changes in the ecology of waterways, which was observed in biogenic elements. As the frequency of navigation increased, the elemental ratios of Br/Cl, Si/Ti, and Ca/Ti decreased from 0.12, 5.01, and 3.54 to 0.11, 4.87, and 3.48, respectively, but the S/Ti ratio increased from 0.20 to 0.24. The ecological response appeared later than the sedimentation response, when the growth of Chinese maritime transportation is significant. Element indicators revealed that the productivity of the shipping lane waters was reduced due to frequent ship disturbance.
(3) During their voyage, the ship disturbed the seabed sediment, thereby affecting the centennial-scale dating of the sediment record. In regions with frequent ship disturbance, we propose to use the CRS (with ship disturbance)–CIC (without ship disturbance) dual dating model approach to establish a more accurate chronological framework.
Data Availability Statement
The original contributions presented in the study are included in the article/Supplementary Material, further inquiries can be directed to the corresponding author/s.
Author Contributions
CX, JJ, and YY developed the idea and elaborated the concept. CX and JG designed and conducted the field survey. CX, PZ, and DW provided experimental data and organized and conducted the data analyses. PS and ZH collected some data on the shipping along China’s coastal ship lanes. CX, JJ, and YY wrote the manuscript. All authors contributed to the revision of the manuscript.
Funding
This study was financially supported by the National Natural Science Foundation of China (Grant numbers: 41876092, 41706095, and 41776048).
Conflict of Interest
The authors declare that the research was conducted in the absence of any commercial or financial relationships that could be construed as a potential conflict of interest.
Publisher’s Note
All claims expressed in this article are solely those of the authors and do not necessarily represent those of their affiliated organizations, or those of the publisher, the editors and the reviewers. Any product that may be evaluated in this article, or claim that may be made by its manufacturer, is not guaranteed or endorsed by the publisher.
Acknowledgments
Sheng Xu, Zhaoxiang Yang, Yaping Mei, and Zhenqiao Liu are thanked for their assistance in the core acquisition and laboratory analyses. Li Tian is thanked for the guidance to the XRF experiment. Yifei Sun is thanked for providing information about the propeller.
Supplementary Material
The Supplementary Material for this article can be found online at: https://www.frontiersin.org/articles/10.3389/fmars.2021.678845/full#supplementary-material
References
Agnihotri, R., Altabet, M. A., Herbert, T. D., and Tierney, J. E. (2008). Subdecadally resolved paleoceanography of the peru margin during the last two millennia. Geochem. Geophys. Geosyst. 9:Q05013.
Appleby, P. G. (2001). “Chronostratigraphic techniques in recent sediments,” in Tracking Environmental Change Using Lake Sediments: Basin Analysis, Coring, and Chronological Techniques, Vol. volume 1, eds W. M. Last and J. P. Smol (Dordrecht: Kluwer Academic), 171–203. doi: 10.1007/0-306-47669-x_9
Barnosky, A. D. (2013). Palaeontological evidence for defining the Anthropocene. Geol. Soc. Spec. Publ. 395, 149–165. doi: 10.1144/sp395.6
Baronson, F. L. (2003). Validation of the accuracy of the LabSOCS software for mathematical efficiency calibration of Ge detectors for typical laboratory samples. J. Radioanal. Nucl. Chem. 255, 137–141.
Blott, S. J., and Pye, K. (2001). GRADISTAT: a grain size distribution and statistics package for the analysis of unconsolidated sediments. Earth Surf. Process. Landf. 26, 1237–1248. doi: 10.1002/esp.261
China Port Yearbook. (1999–2019). China Ports Year Book Editorial Department. Shanghai: China Port Magazine Press.
Coraci, E., Umgiesser, G., and Zonta, R. (2007). Hydrodynamic and sediment transport modeling in the channels of Venice (Italy). Estuar. Coast. Shelf Sci. 75, 250–260. doi: 10.1016/j.ecss.2007.02.028
Croudace, I. W., and Rothwell, R. G. (2015). Micro-XRF Studies of Sediment Cores: Applications of a Non-Destructive Tool for the Environmental Sciences. Dordrecht: Springer.
Dai, S. B., Lu, X. X., Yang, S. L., and Cai, A. M. (2008). A preliminary estimate of human and natural contributions to the decline in sediment flux from the Yangtze River to the East China Sea. Quat. Int. 186, 43–54. doi: 10.1016/j.quaint.2007.11.018
Day, J. W., Agboola, J. I, Chen, Z., Delia, C. F., Forbes, D. L., Giosan, L., et al. (2016). Approaches to defining deltaic sustainability in the 21st century. Estuar. Coast. Shelf Sci. 183, 275–291. doi: 10.1016/j.ecss.2016.06.018
De Vriend, H. J., Wang, Z. B., Ysebaert, T., Herman, P. M., and Ding, P. (2011). Eco-morphological problems in the Yangtze Estuary and the Western Scheldt. Wetlands 31, 1033–1042. doi: 10.1007/s13157-011-0239-7
Debret, M., Sebag, D., Crosta, X., Massei, N., Petit, J. R., Chapron, E., et al. (2009). Evidence from wavelet analysis for a mid-Holocene transition in global climate forcing. Quat. Sci. Rev. 28, 2675–2688. doi: 10.1016/j.quascirev.2009.06.005
Dong, A. G., Zhai, S. K., Zabel, M., and Yu, Z. H. (2009). The distribution of heavy metal contents in surface sediments of the Changjiang Estuary in China and surrounding coastal areas. Acta Oceanol. Sin. 31, 54–68.
Du, J., Wu, Y., Huang, D., and Zhang, J. (2010). Use of 7Be, 210Pb and 137Cs tracers to the transport of surface sediments of the Changjiang Estuary China. J. Mar. Syst. 82, 286–294. doi: 10.1016/j.jmarsys.2010.06.003
Duan, L. Q., Song, J. M., Xu, Y. Y., Li, X. G., and Zhang, Y. (2010). The distribution, enrichment and source of potential harmful elements in surface sediments of bohai bay, north china. J. Hazard. Mater. 183, 155–164. doi: 10.1016/j.jhazmat.2010.07.005
Ducruet, C., and Notteboom, T. (2012). The worldwide maritime network of container shipping: spatial structure and regional dynamics. Glob. Netw. 12, 395–423. doi: 10.1111/j.1471-0374.2011.00355.x
Ferré, B., Durrieu de Madron, X., Estournel, C., Ulses, C., and Corre, G. L. (2008). Impact of natural (waves and currents) and anthropogenic (trawl) resuspension on the export of particulate matter to the open ocean: application to the Gulf of Lion (NW Mediterranean). Cont. Shelf Res. 28, 2071–2091. doi: 10.1016/j.csr.2008.02.002
Fleit, G., Baranya, S., Rüther, R., Bihs, H., Krámer, T., and Józsa, J. (2016). Investigation of the effects of ship induced waves on the littoral zone with field measurements and cfd modeling. Water 8, 300–300. doi: 10.3390/w8070300
Gao, J. H., Jia, J. J., Kettner, A. J., Xing, F., Wang, Y. P., Xu, X. N., et al. (2014). Changes in water and sediment exchange between the Changjiang River and Poyang Lake under natural and anthropogenic conditions China. Sci. Total Environ. 481, 542–553. doi: 10.1016/j.scitotenv.2014.02.087
Gao, J. H., Jia, J. J., Wang, Y. P., Yang, Y., Zou, X. Q., Li, J., et al. (2015). Variations in quantity, composition and grain size of Changjiang sediment discharging into the sea in response to human activities. Hydrol. Earth Syst. Sci. 19, 645–655. doi: 10.5194/hess-19-645-2015
Gao, J. H., Shi, Y., Sheng, H., Kettner, A. J., Yang, Y., Jia, J. J., et al. (2019). Rapid response of the Changjiang (Yangtze) river and East China Sea source-to-sink conveying system to human induced catchment perturbations. Mar. Geol. 414, 1–17. doi: 10.1016/j.margeo.2019.05.003
Grygar, T. M., and Popelka, J. (2016). Revisiting geochemical methods of distinguishing natural concentrations and pollution by risk elements in fluvial sediments. J. Geochem. Explor. 170, 39–57.
He, Y. P. (2008). Navigation Diagram of Zhejiang Coastal and Main Ports. Zhejiang Maritime Safety Administration. Dalian: Dalian Maritime University Press. doi: 10.1016/j.gexplo.2016.08.003
Hong, J. H., Chiew, Y. M., and Cheng, N. S. (2013). Scour caused by a propeller jet. J. Hydraul. Eng. 139, 1003–1012. doi: 10.1061/(asce)hy.1943-7900.0000746
Hong, J. H., Chiew, Y. M., Hsieh, H. C., Cheng, N. S., and Yeh, P. H. (2016). Propeller jet–induced suspended-sediment concentration. J. Hydraul. Eng. 142:04015064. doi: 10.1061/(asce)hy.1943-7900.0001103
Houser, C. (2014). Sediment resuspension by vessel-generated waves along the Savannah River, Georgia. J. Waterw. Port Coast. Ocean Eng. 137, 246–257. doi: 10.1061/(asce)ww.1943-5460.0000088
Huang, S. G., Yang, J. D., Ji, W. D., Yang, X. L., and Chen, G. X. (1986). Spatial and temporal variation of reactive Si, N, P and their relationship in the Changjiang estuary water. Tawan Strait 5, 115–123. (In Chinese with English abstract).
Imai, A., Nishimura, E., and Papadimitriou, S. (2013). Marine container terminal configurations for efficient handling of mega-containerships. Transport. Res. Part E Log. Transport. Rev. 49, 141–158. doi: 10.1016/j.tre.2012.07.006
Jenny, J. P., Koirala, S., Gregory-Eaves, I., Francus, P., Niemann, C., Ahrens, B., et al. (2019). Human and climate global-scale imprint on sediment transfer during the Holocene. Proc. Natl. Acad. Sci. U. S. A. 116, 22972–22976. doi: 10.1073/pnas.1908179116
Ji, S. C., Ouahsine, A., Smaoui, H., Sergent, P., and Jing, G. Q. (2014). Impacts of ship movement on the sediment transport in shipping channel. J. Hydrodyn. 26, 706–714. doi: 10.1016/s1001-6058(14)60079-2
Jia, J., Gao, J., Cai, T., Li, Y., Yang, Y., Wang, Y. P., et al. (2018). Sediment accumulation and retention of the Changjiang (Yangtze River) subaqueous delta and its distal muds over the last century. Mar. Geol. 401, 2–16. doi: 10.1016/j.margeo.2018.04.005
Jiang, G. C. (1993). The preliminary study on the eutrophication and the red tide in the south coastal area of Zhejiang. Donghai Mar. Sci. 11, 55–61. (In Chinese with English abstract)
Liao, Q., Wang, B., and Wang, P. F. (2015). In situ measurement of sediment resuspension caused by propeller wash with an underwater particle image velocimetry and an acoustic doppler velocimeter. Flow Meas. Instrum. 41, 1–9. doi: 10.1016/j.flowmeasinst.2014.10.008
Liou, Y. C., and Herbich, J. B. (1976). Sediment Movement Induced by Ships in Restricted Waterways. COE Report No. 188. College Station, TX: Texas A & M University.
Liu, Y., Zhai, S. K., and Li, J. (2010). Depositional records in the mud areas of Changjiang estuary and off Min-Zhe coast and their influence factors. Mar. Geol. Quat. Geol. 2010, 1–10. (In Chinese with English abstract)
Luan, H. L., Ding, P., Wang, Z. B., Ge, J. Z., and Yang, S. L. (2016). Decadal morphological evolution of the Yangtze Estuary in response to river input changes and estuarine engineering projects. Geomorphology 265, 12–23. doi: 10.1016/j.geomorph.2016.04.022
Marcussen, H., Dalsgaard, A., and Holm, P. E. (2008). Content, distribution and fate of 33 elements in sediments of rivers receiving wastewater in Hanoi, Vietnam. Environ. Pollut. 155, 41–51. doi: 10.1016/j.envpol.2007.11.001
Marsh, R., Mills, R. A., Green, D. R., Salter, I., and Taylor, S. (2007). Controls on sediment geochemistry in the Crozet region. Deep Sea Res. Part II Top. Stud. Oceanogr. 54, 2260–2274. doi: 10.1016/j.dsr2.2007.06.004
McManus, J. (1988). “Grain size determination and interpretation,” in Techniques in Sedimentology, ed. M. E. Tucker (Oxford: Blackwell), 63–85.
Milliman, J. D., and Farnsworth, K. L. (2011). River Discharge to the Coastal Ocean: A Global Synthesis. Cambridge: Cambridge Univ. Press.
Notteboom, T., Pallis, A., and Rodrigue, J. P. (2021). Port Economics, Management and Policy. New York, NY: Routledge.
Pan, B. Z., Wang, Z. Y., and He, X. B. (2011). Studies on assemblage characteristics of macrozoobenthos in the West River. Acta Hydrobiol. Sin. 035, 851–856. (In Chinese with English abstract).
Pan, S. J., and Shen, Z. L. (2009). Distribution and variation of silicate in the Changjiang estuary and its adjacent waters. Stud. Mar. Sin. 49, 10–18. (In Chinese with English abstract)
Poulton, A. J., Adey, T. R., Balch, W. M., and Holligan, P. M. (2007). Relating coccolithophore calcification rates to phytoplankton community dynamics: regional differences and implications for carbon export. Deep Sea Res. Part II Top. Stud. Oceanogr. 54, 538–557. doi: 10.1016/j.dsr2.2006.12.003
Poulton, A. J., Painter, S. C., Young, J. R., Bates, N. R., Bowler, B., Drapeau, D., et al. (2013). The 2008 Emiliania huxleyi bloom along the Patagonian shelf: ecology, biogeochemistry and cellular calcification. Glob. Biogeochem. Cycles 27, 1–11. doi: 10.3354/meps09445
Powell, M. A., Thieke, R. J., and Mehta, A. J. (2006). Morphodynamic relationships for ebb and flood delta volumes at florida’s tidal entrances. Ocean Dyn. 56, 295–307. doi: 10.1007/s10236-006-0064-3
Rapaglia, J., Zaggia, L., Ricklefs, K., Gelinas, M., and Bokuniewicz, H. J. (2011). Characteristics of ships’ depression waves and associated sediment resuspension in Venice Lagoon. Italy. J. Mar. Syst. 85, 45–56. doi: 10.1016/j.jmarsys.2010.11.005
Ren, M. E. (1989). Human impact on the coastal morphology and sedimentation of north China. Sci. Geogr. Sin. 9, 1–8. (In Chinese with English abstract). doi: 10.1016/s0070-4571(08)70138-9
Richter, T. O., Van der Gaast, S., Koster, B., Vaars, A., Gieles, R., de Stigter, H. C., et al. (2006). The Avaatech XRF core scanner: technical description and applications to NE Atlantic sediments. Geol. Soc. Lond. Spec. Publ. 267, 39–50. doi: 10.1144/gsl.sp.2006.267.01.03
Ruddiman, W. F. (2018). Three flaws in defining a formal ‘Anthropocene. Prog. Phys. Geogr. 42, 451–461. doi: 10.1177/0309133318783142
Sardain, A., Sardain, E., and Leung, B. (2019). Global forecasts of shipping traffic and biological invasions to 2050. Nat. Sustain. 2, 274–282. doi: 10.1038/s41893-019-0245-y
Schubert, C. J., Villanueva, J., Calvert, S. E., Cowie, G. L., Rad, U. V., Schulz, H., et al. (1998). Stable phytoplankton community structure in the arabian sea over the past 200,000 years. Nature 394, 563–566.
Singh, P. (2009). Major, trace and REE geochemistry of the Ganga River sediments: influence of provenance and sedimentary processes. Chem. Geol. 266, 242–255. doi: 10.1016/j.chemgeo.2009.06.013
Soon, C., and Lam, W. H. (2014). Ship’s propeller jet-induced scour in westports Malaysia. Paper Presented at the 24th International Society of Offshore and Polar Engineers, Busan.
Sun, Y. B., Gao, S., and Li, J. (2003). Preliminary analysis of grain-size populations with environmentally sensitive terrigenous components in marginal sea setting. Chin. Sci. Bull. 48, 83–86. (In Chinese)
Syvitski, J. P., and Kettner, A. J. (2011). Sediment flux and the Anthropocene. Philos. Trans. R. Soc. A 369, 957–975. doi: 10.1098/rsta.2010.0329
Syvitski, J. P. M., Vorosmarty, C. J., Kettner, A. J., and Green, P. (2005). Impact of humans on the flux of terrestrial sediment to the global coastal ocean. Science 308, 376–380. doi: 10.1126/science.1109454
Thomson, J., Croudace, I. W., and Rothwell, R. G. (2006). “A geochemical application of the ITRAX scanner to a sediment core containing eastern Mediterranean sapropel units,” in New Techniques in Sediment Core Analysis, Vol. 267, ed. R. G. Rothwell (London: Geological Society Special Publication), 65–77. doi: 10.1144/GSL.SP.2006.267.01.05
Waters, C. N., Zalasiewicz, J., Summerhayes, C., Barnosky, A. D., Poirier, C., Galuszka, A., et al. (2016). The Anthropocene is functionally and stratigraphically distinct from the Holocene. Science 351:2622.
Wilkinson, I. P., Poirier, C., Head, M. J., Sayer, C. D., and Tibby, J. (2014). Microbiotic signatures of the Anthropocene in marginal marine and freshwater palaeoenvironments. Geol. Soc. Lond. Spec. Publ. 395, 185–219. doi: 10.1144/sp395.14
Yang, Y., Jia, J., Zhou, L., Gao, W., Shi, B., Li, Z., et al. (2019). Human-induced changes in sediment properties and amplified endmember differences: possible geological time markers in the future. Sci. Total Environ. 661, 63–74. doi: 10.1016/j.scitotenv.2019.01.115
Ye, D. Z., Ji, J. Y., Yan, Z. W., Wang, Y., and Yan, X. D. (2009). Anthroposphere—an interactive component in the earth system. Chin. J. Atmos. Sci. 33, 409–415. (In Chinese with English abstract).
Ye, S., Laws, E. A., and Gambrell, R. (2013). Trace element remobilization following the resuspension of sediments under controlled redox conditions: City Park Lake, Baton Rouge, LA. Appl. Geochem. 28, 91–99. doi: 10.1016/j.apgeochem.2012.09.008
Zhang, J., Mou, D. H., Du, J. Z., and Zhang, J. (2008). Study on comparison of excess 210Pb chronology of several models. Mar. Environ. Sci. 27, 370–374. (In Chinese with English abstract).
Zhao, Y. Y., and Yan, M. C. (1994). Sediment Geochemistry in China’s Shallow Seas. Beijing: Science Press.
Zhou, L., Yang, Y., Wang, Z., Jia, J., Mao, L., Li, Z., et al. (2019). Investigating ENSO and WPWP modulated typhoon variability in the South China Sea during the mid–late Holocene using sedimentological evidence from southeastern Hainan Island China. Mar. Geol. 2019:105987. doi: 10.1016/j.margeo.2019.105987
Keywords: human activity, ship disturbance, sedimentary record, ecosystem, environment
Citation: Xue CF, Yang Y, Zhao PP, Wei DY, Gao JH, Sun P, Huang ZY and Jia JJ (2021) Impact of Ship Traffic on the Characteristics of Shelf Sediments: An Anthropocene Prospective. Front. Mar. Sci. 8:678845. doi: 10.3389/fmars.2021.678845
Received: 10 March 2021; Accepted: 26 July 2021;
Published: 24 August 2021.
Edited by:
Kuoping Chiang, National Taiwan Ocean University, TaiwanReviewed by:
Helena Granja, University of Minho, PortugalXiaolei Liu, Ocean University of China, China
Copyright © 2021 Xue, Yang, Zhao, Wei, Gao, Sun, Huang and Jia. This is an open-access article distributed under the terms of the Creative Commons Attribution License (CC BY). The use, distribution or reproduction in other forums is permitted, provided the original author(s) and the copyright owner(s) are credited and that the original publication in this journal is cited, in accordance with accepted academic practice. No use, distribution or reproduction is permitted which does not comply with these terms.
*Correspondence: Jianjun Jia, ampqaWFAc2tsZWMuZWNudS5lZHUuY24=
 Chengfeng Xue
 Yang Yang
 Peipei Zhao1
 Jianhua Gao
 Jianjun Jia