 Cláudia Raposo de Magalhães1,2
 Denise Schrama1,2
 Chatsirin Nakharuthai3
 Surintorn Boonanuntanasarn3
 Dominique Revets4
 Sébastien Planchon5
 Annette Kuehn4
 Marco Cerqueira1,2
 Raquel Carrilho1,2
 Ana Paula Farinha1,2
 Pedro M. Rodrigues1,2*
- 1Centre of Marine Sciences (CCMAR), Universidade do Algarve, Faro, Portugal
- 2Universidade do Algarve, Faro, Portugal
- 3School of Animal Production Technology, Institute of Agricultural Technology, Suranaree University of Technology, Nakhon Ratchasima, Thailand
- 4Department of Infection and Immunity, Luxembourg Institute of Health, Esch-sur-Alzette, Luxembourg
- 5Environmental Research and Innovation (ERIN) Department, Luxembourg Institute of Science and Technology, Esch-sur-Alzette, Luxembourg
Hepatic metabolic adjustments are key adaptive mechanisms to stress in fish targeting at increasing energy availability for the animal to efficiently cope with a stressor. Teleosts exhibit a broad variety of these metabolic responses, depending on the species biology, individual experiences and the challenge’s characteristics. Nevertheless, the molecular response to a prolonged stress can be more heterogeneous and far more complex to interpret than that to an acute stress. A comparative proteomics analysis was employed to discover the set of liver proteins involved in the adaptive processes that tune the physiological response of Sparus aurata to different suboptimal rearing conditions and physical challenges. Three separated trials were established where fish were submitted to different conditions (overcrowding, net handling and hypoxia). The response at the transcript level of 13 genes was also assessed. Mass spectrometric analysis revealed 71 differential abundant proteins distributed among the trials. Prolonged exposure to stress seems to have induced widespread changes in amino acid, carbohydrate, and lipid metabolisms, antioxidant response and protein folding, sorting and degradation processes. Two genes corresponding to heat-shock proteins were found to be differently expressed in net handled fish. These results shed light on the dynamics and extent of this species’ metabolic reprogramming under different challenges, supporting future studies on stress markers’ discovery and fish welfare research.
Introduction
Gilthead seabream (Sparus aurata) is one of the most economically important marine species for the Mediterranean aquaculture industry. In 2018, it was the fourth major species of finfish produced in Europe (FAO, 2020), with the largest amount coming from intensive farming systems (Matos et al., 2017). Intensification of the aquaculture sector may have deleterious effects on fish welfare and consequently on the environment, ecosystems and merchantable traits of the final product (Huntingford et al., 2006). Routine procedures, such as manipulation and confinement are unavoidable farming practices that can represent stressful situations for the fish (Conte, 2004). Moreover, cumulative effects of these challenging conditions can be reflected on behavior and physiology, and also jeopardize fish health and survival (Eslamloo et al., 2014). The importance of managing stress in farmed fish is already being recognized by the industry, as consumers are becoming increasingly aware of fish sentience, raising concerns regarding fish welfare and sustainability. However, the knowledge on the physiology of stress of the farmed species needs to be improved to develop accurate recommendations for best practices.
When a stimulus is perceived as a serious threat by the fish, an adaptive mechanism is triggered, known as physiological stress response. In the short-term it elicits a stimulatory and restorative response (eustress) that helps the individual to cope with the challenge and restore homeostasis, not necessarily equating impaired welfare (Iwama et al., 2006). The immediate activation of the neuroendocrine pathway is the first step following initiation of the physiological response, resulting in the release of catecholamines and cortisol into the bloodstream (Mommsen et al., 1999). It is well known that these hormones induce further changes in the metabolism, supplying energy and glucose to compensate for the coping mechanisms, while other energy-demanding processes such as growth and immune responses are concomitantly suppressed (Vijayan et al., 2010; Fabbri and Moon, 2016). Therefore, if the stressful stimulus persists and/or increases in severity, the stress response becomes maladaptive (allostatic overload), and in this case, vital biological functions can be altered or inhibited and welfare can be compromised (Korte et al., 2007; Boonstra, 2013). The coping capacity and the extent of the impact of the stress response on the fish physiology depends on the species biology, on the individual’s previous subjective experiences and coping styles, on the severity of the stressor, among other factors (Galhardo et al., 2009). This heterogeneity of the stress physiology and the myriad of mechanisms that are consequently modulated in the organism’s biological system enhances the difficulty of defining a status of impaired welfare, specially after a long-term or a repetitive stressor exposure (Ashley, 2007; Carenzi and Verga, 2009). Knowledge about the network of proteins involved in the modulation of energy-mobilizing metabolic pathways, cellular processes and molecular mechanisms when affected by specific stressors, could be an important step toward the study of fish chronic stress and the future discovery of new stress indicators. Proteins are ubiquitously affected by abiotic and biotic stimuli, resulting in alterations in protein abundance and in post-translation modifications. As these changes occur over a slower timescale, comparing with endocrine responses, proteomics can thus be a promising alternative to find indicators of an adaptive long-term stress response instead of an early response (e.g., hormones), as that used in acute stress assessment (Cowan and Vera, 2008; Marco-Ramell et al., 2016). The number of studies employing a proteome-wide characterization to unveil the molecular adaptations behind the physiological response to stress in fish has been considerably increasing (Raposo de Magalhães et al., 2020a). However, the effects on metabolism and hepatic proteome have been studied mainly as a response to environmental stimuli, xenobiotics, diseases and acute stressors (Wiseman et al., 2007; Ibarz et al., 2010; Malécot et al., 2011; Mahanty et al., 2016; Gandar et al., 2017; Pédron et al., 2017; Zhang et al., 2017; Causey et al., 2018; Naderi et al., 2018; Ghisaura et al., 2019).
The hallmark of the stress response is the activation and regulation of energy-mobilizing pathways and posterior reallocation of resources. Thus, we considered the importance of the liver and its multifaceted role in mediating metabolic adjustments that promote the rewiring of energetic resources toward the stress response, and used it as the target tissue in this study. In this sense, we exposed gilthead seabream (Sparus aurata) adults to different suboptimal rearing conditions and physical challenges, specifically high rearing densities, net handling and hypoxia. A previous metabolic fingerprinting of these same fish’s liver samples demonstrated alterations in the hepatic infrared spectra of the challenged fish, compared with undisturbed fish, suggesting a challenge-specific metabolic reprogramming (Raposo de Magalhães et al., 2020). Here, a 2D-DIGE gel-based proteomics analysis was employed to disclose the set of liver proteins involved in the gilthead seabream adaptive response to these challenges. Validation was achieved by quantitative real-time polymerase chain reaction (RT-qPCR) and the assessment of the hepatic glycogen storage. In this study we provide for the first time a comprehensive analysis of the gilthead seabream liver proteome involved in the adaptive metabolic reprogramming as a response to challenging conditions common to an aquaculture rearing facility. This work provides a fingerprint of proteins that can be further investigated as robust physiological indicators of stress, which could complement the currently used stress assessment measures and contribute for the future development of suitable stress management protocols for this species.
Materials and Methods
Ethics
This study was approved by the ORBEA Animal Welfare Committee of CCMAR and the Portuguese National Authority for the Animal Health (DGAV) on August 26th, 2019. The experiment described was conducted in accordance with the European guidelines on the protection of animals used for scientific purposes (Directive 2010/63/EU) and the Portuguese legislation for the use of laboratory animals, under a “Group-1” license (permit number 0420/000/000-n.99–09/11/2009) from the Veterinary Medicine Directorate, the competent Portuguese authority for the protection of animals, Ministry of Agriculture, Rural Development and Fisheries, Portugal and following category C FELASA recommendations.
Animals and Rearing Conditions
Three separated fish trials were conducted at the Ramalhete Experimental Research Station of the Centre of Marine Sciences (CCMAR), in Faro, Portugal. Nine homogeneous groups of gilthead seabream (Sparus aurata) adults (supplied from the commercial fish farm Maresa, Mariscos de Estero S.A., Huelva, Spain) were randomly distributed, per trial, in indoor 500 L fiberglass tanks supplied with flow-through seawater. Each trial was conducted in a different time period (from November to March). Physicochemical parameters varied within a natural regime (natural photoperiod, water temperature at 13.4 ± 2.2°C, salinity at 34.7 ± 0.8‰ and dissolved oxygen level above 5 mg.l–1). Fish were fed by hand once daily, in the morning, with commercial feed (Standard Orange 6, AquaSoja, Sorgal, S.A., Ovar, Portugal), manufactured according to the species’ nutritional requirements. During the trials, feeding amounts were adjusted according to the fish initial body weights and the daily water temperature (varying between 1 and 1.5% of the tank biomass).
Experimental Design
After a 2-week acclimation period for each trial, three challenging rearing conditions were tested, namely: OC – Overcrowding, NET – Net Handling and air exposure, and HYP – Hypoxia. Each tank was set-up with an initial rearing density of 10 kg/m3 (except for the high-stocking groups) and randomly allocated to one of the three experimental groups, in triplicate. The OC trial lasted for 54 days, and the fish, with averaged initial body weights of 372.33 ± 6.55 g, were submitted to high stocking densities, in two intensities, by increasing the number of fish in the tanks. Experimental groups were established as described: OCCTRL – 10 kg/m3, OC30 – 30 kg/m3 and OC45 – 45 kg/m3. For the NET trial, fish, with averaged initial body weights of 375.69 ± 11.88 g, were challenged for 45 days. Nets were designed for the purpose, fitted inside the tanks and lifted to air-expose the fish for 1 minute. The experimental groups were established according to the number of times, per week, that the fish were challenged: NETCTRL – undisturbed fish (the net was also fitted inside the tanks but not lifted), NET2 – fish air-exposed twice a week, and NET4 – fish air-exposed four-times a week. The last stress event was applied 72 h before sampling. In the HYP trial, fish, with averaged initial body weights of 397.99 ± 16.56 g, experienced low levels of saturated oxygen over 48 h. The required saturations were achieved by nitrogen injection into the water: HYPCTRL – 100% saturated oxygen, HYP30 – 30% saturated oxygen, and HYP15 – 15% saturated oxygen. During the 48 h, the levels of saturated oxygen in the water were measured every 30 min. If these were higher than the treatment’s requirement, nitrogen was injected, while in contrast, if the levels were lower than the requirement, the water flow was increased.
Sampling
At the end of each trial, three fish were collected from each tank, with a net, and immediately anesthetized with a lethal dose of tricaine methanesulfonate (MS-222; Merck KGaA, Darmstadt, Germany). The livers of the sampled fish were collected, cut in small pieces and divided by different 2 ml eppendorf tubes according to the different subsequent analyses. Sample tubes were immediately frozen in liquid nitrogen and stored at −80°C until further analysis. Before harvesting, fish were starved for 48 h to clean the digestive tract. All sampled fish were weighed and measured. Data concerning zootechnical parameters, such as specific growth rate, were previously published by the authors (Raposo de Magalhães et al., 2020b).
Liver Proteomics Analysis
Protein Extraction
For total protein extraction, 50 mg of gilthead seabream liver tissue (n = 6, two samples from each tank, randomly selected) were mixed with 500 μl of extraction buffer (7 M urea, 2 M thiourea, 4% 3-[(3-Cholamidopropyl) dimethylammonio]-1-propanesulfonate (CHAPS) detergent, 30 mM Tris pH 8.5), along with 5 μl of protease inhibitor cocktail (Merck KGaA) and 2 μl of Ethylenedinitrilotetraacetic acid (EDTA) 250 mM. Sample homogenization was achieved with an Ultra-Turrax IKA T8 (IKA-WERG, Germany) for 5 cycles of 15 s, followed by ultrasound disruption. Homogenates were incubated on ice for 30 min and centrifuged at 13,000 g, 4°C for 15 min to remove insoluble material. Liver extracts were diluted in the initial buffer and the protein content measured with Bradford assay using BioRad Quick Start Bradford Dye Reagent 1X (Bio-Rad Laboratories, Hercules, CA, United States) and bovine serum albumin (BSA), BioRad Bovine Serum Albumin Standard Set (Bio-Rad), as standard. Extracts were then depleted of non-protein contaminants (using 500 μg of protein) with a ReadyPrepTM 2D Clean-up kit (Bio-Rad) and resuspended in the initial buffer. The cleaned extracts’ pH was checked with a pH-indicator paper, Sigma-P4536 (Merck KGaA) and adjusted to 8.5 using 0.1 M NaOH, if necessary.
Protein Labeling and Separation
Protein separation was achieved by the two-dimensional difference gel electrophoresis (2D-DIGE) method, as follows. DIGE minimal labeling was performed as described in (Raposo de Magalhães et al., 2020b). Passive rehydration was carried out for 18 h on 24 cm ImmobilineTM Drystrips (GE Healthcare) with linear pH 4-7, on an IPG Box (GE Healthcare). A total of 150 μg of protein (50 μg from each dye) were loaded onto each strip, along with a rehydration buffer [8 M urea, 2% CHAPS detergent, 50 mM dithiothreitol (DTT), 0.001% bromophenol blue, 0.5% Bio-lyte 3/10 ampholyte (Bio-Rad)] to fulfill 450 μl. Isoelectric focusing (IEF) was performed in 4 steps: 250 V gradient 4 h, 1000 V gradient 6 h, 8000 V gradient 3 h 40 min, 8000 V step-n-hold 3 h 20 min for a total of 50,000 Vhr using the Ettan IPGphor at 20°C (GE Healthcare). Focused strips were reduced and alkylated with 6 ml of equilibration buffer (50 mM Tris-HCl pH 8.8, 6 M urea, 30% (v/v) glycerol and 2% SDS) with 1% (w/v) DTT or 2.5% (w/v) iodoacetamide (IAA) respectively for 15 min each, in constant agitation. Strips were then loaded onto 12.5% Tris-HCl SDS-PAGE in-house gels and ran in an Ettan DALTsix Large Vertical System (GE Healthcare), using a standard Tris-Glycine-SDS running buffer, at 10 mA/gel for 1 h followed by 60 mA/gel until the bromophenol blue line reaches the end of the gel.
Gel Image Analysis and Protein Identification
Gel images of CyDye-labeled 2D gels were acquired using a TyphoonTM laser scanner 9400 (GE Healthcare) as described in (Raposo de Magalhães et al., 2020b). The final gel images were analyzed using SameSpots software v4.6.1.218 (Totallab, Newcastle, United Kingdom1), including background subtraction (average normalized volume ≤ 100,000 and a spot area ≤ 500), filtering, spot detection, spot matching, normalization and statistical analysis. Spots showing volume ratios with a statistically significant difference (relative abundance variation of at least 1.0-fold, p < 0.05 - One-way ANOVA on normalized log2-transformed spot volumes, followed by p < 0.05 – Dunnett’s post hoc test) were manually excised from SYPRO® Ruby-stained (InvitrogenTM, Carlsbad, CA, United States) 2D gels. Subsequently, gel plugs were subjected to in-gel tryptic digestion, and identified by matrix-assisted laser desorption/ionization time-of-flight/time-of-flight mass spectrometry (MALDI-TOF/TOF MS), as described in (Raposo de Magalhães et al., 2020b). The mass spectrometry proteomics data have been deposited to the ProteomeXchange Consortium via the PRIDE (Perez-Riverol et al., 2019) partner repository with the dataset identifier PXD024804.
Proteomics Data Analysis
Using the amino-acid sequences (in one-letter code), the theoretical molecular weight (Mw) and isoelectric point (pI) of the identified proteins were computed using the ProtParam Tool2. Normalized log2-transformed spot volumes were imported into R v4.0.3 for MacOSX3. Each trial was analyzed separately. Volcano plots were obtained to elucidate about the number of differential proteins between each experimental group and the corresponding control group, using the EnhancedVolcano function from package EnhancedVolcano (Blighe et al., 2021), after computing student’s t-test (α = 0.05) for statistical significance. Hierarchical clustering (HCL) analysis was achieved with the heatmap.2 function from package gplots (Warnes et al., 2020). The differential proteins (One-way ANOVA, followed by Dunnett’s test, p < 0.05) were normalized according to Z-score for hierarchical clustering of samples and protein spots, taking the Euclidean distance as metrics and the average linkage as agglomeration method. Protein functional annotation, including gene ontology (GO) classification analysis, on the basis of biological process, was performed using the OmicsBox software v1.4.11 (BioBam Bioinformatics SL, Valencia, Spain4). The FASTA sequences of the identified proteins were used as input and blasted using the NCBI blast + via CloudBlast with Danio rerio and Sparus aurata as taxonomy filters. The top 10 blast hits for each query protein, with an E-value less than 1.0E-3 were retrieved. Mapping and annotation were performed based on the Blast2GO annotation methodology (Conesa et al., 2005), using the default settings. Furthermore, the identified proteins were blasted against Danio rerio, on the UniprotKB database, using the FASTA protein sequences, previously retrieved, as queries. The Search Tool for the Retrieval of Interacting Genes/Proteins (STRING) web-based tool v11.05 was then used to map the orthologs, screen for potential protein-protein interactions (PPI) and perform a Kyoto Encyclopedia of Gene and Genomes (KEGG) pathway enrichment analysis (FDR, q < 0.05). Protein nodes showing no interactions were excluded from further analysis. Network visualization and topological analysis were performed on Cytoscape v3.8.16. Important hub proteins were screened and ranked by the degree values and betweenness centrality of each node in the network.
Quantitative Real-Time Reverse Transcription Polymerase Chain Reaction (RT-qPCR) Analysis
RNA Isolation and Two Step Reverse Transcription PCR (RT-PCR)
Gilthead seabream liver samples were ground with a mortar and pestle in liquid nitrogen (n = 6, corresponding to the same two samples per tank used for the proteomics analysis). Total RNA was extracted from 100 mg of ground material using Trizol® reagent (InvitrogenTM) and treated with DNase I (RQ1 RNase-Free DNase; Promega), to remove contaminating DNA, according to the manufacturer’s instructions. The yield and purity of the RNA extraction were assessed with a NanoVue Plus spectrophotometer (GE Healthcare) and the quality and integrity were verified by 1% agarose gel electrophoresis. First strand cDNA synthesis was prepared from 1 μg of total RNA using the ImProm-IITM Reverse Transcription System kit (Promega), as follows. The complete reverse transcription reaction (20 μl) contained 0.5 μg/reaction of Oligo(dT)15 Primer, 4 μl of ImProm-IITM 5X Reaction Buffer, 5.8 μl of kit’s MgCl2, 1 μl of dNTP Mix, 0.5 μl of Recombinant RNasin® Ribonuclease Inhibitor, 1 μl of ImProm-IITM Reverse Transcriptase and milliQ water up to 20 μl. Initially, a portion of this reaction containing only Oligo(dT)15 and total RNA was incubated at 70°C for 5 min, and immediately chilled on ice before adding the remaining components. The reaction was carried out at 25°C for 10 min followed by extension at 42°C for 1.5 h and posterior inactivation of the reverse transcriptase at 70°C for 15 min. Primers for RT-PCR and RT-qPCR were newly designed using the GenScript web-based tool7, with a melting temperature of 55°C and length and GC content range of 19–24 bp and 50-55%, respectively. In silico specificity of constructed primers was corroborated by BLAST. The primers and the expected sizes of amplicons to be used as standard templates in absolute quantification assays are listed in Table 1. PCR amplification of the cDNA was performed using the Takara Ex taqTM DNA polymerase (Takara, Shiga, Japan) in a total volume of 50 μl, along with 0.2 μM of each primer and 5 μl of cDNA template. For the PCR reaction, initial denaturation was conducted at 95°C for 5 min followed by 24 reaction cycles, each consisting of a denaturation step at 95°C for 45 s, annealing at 55°C for 45 sec, and extension at 72°C for 45 s, with a final elongation step at 72°C for 5 min.
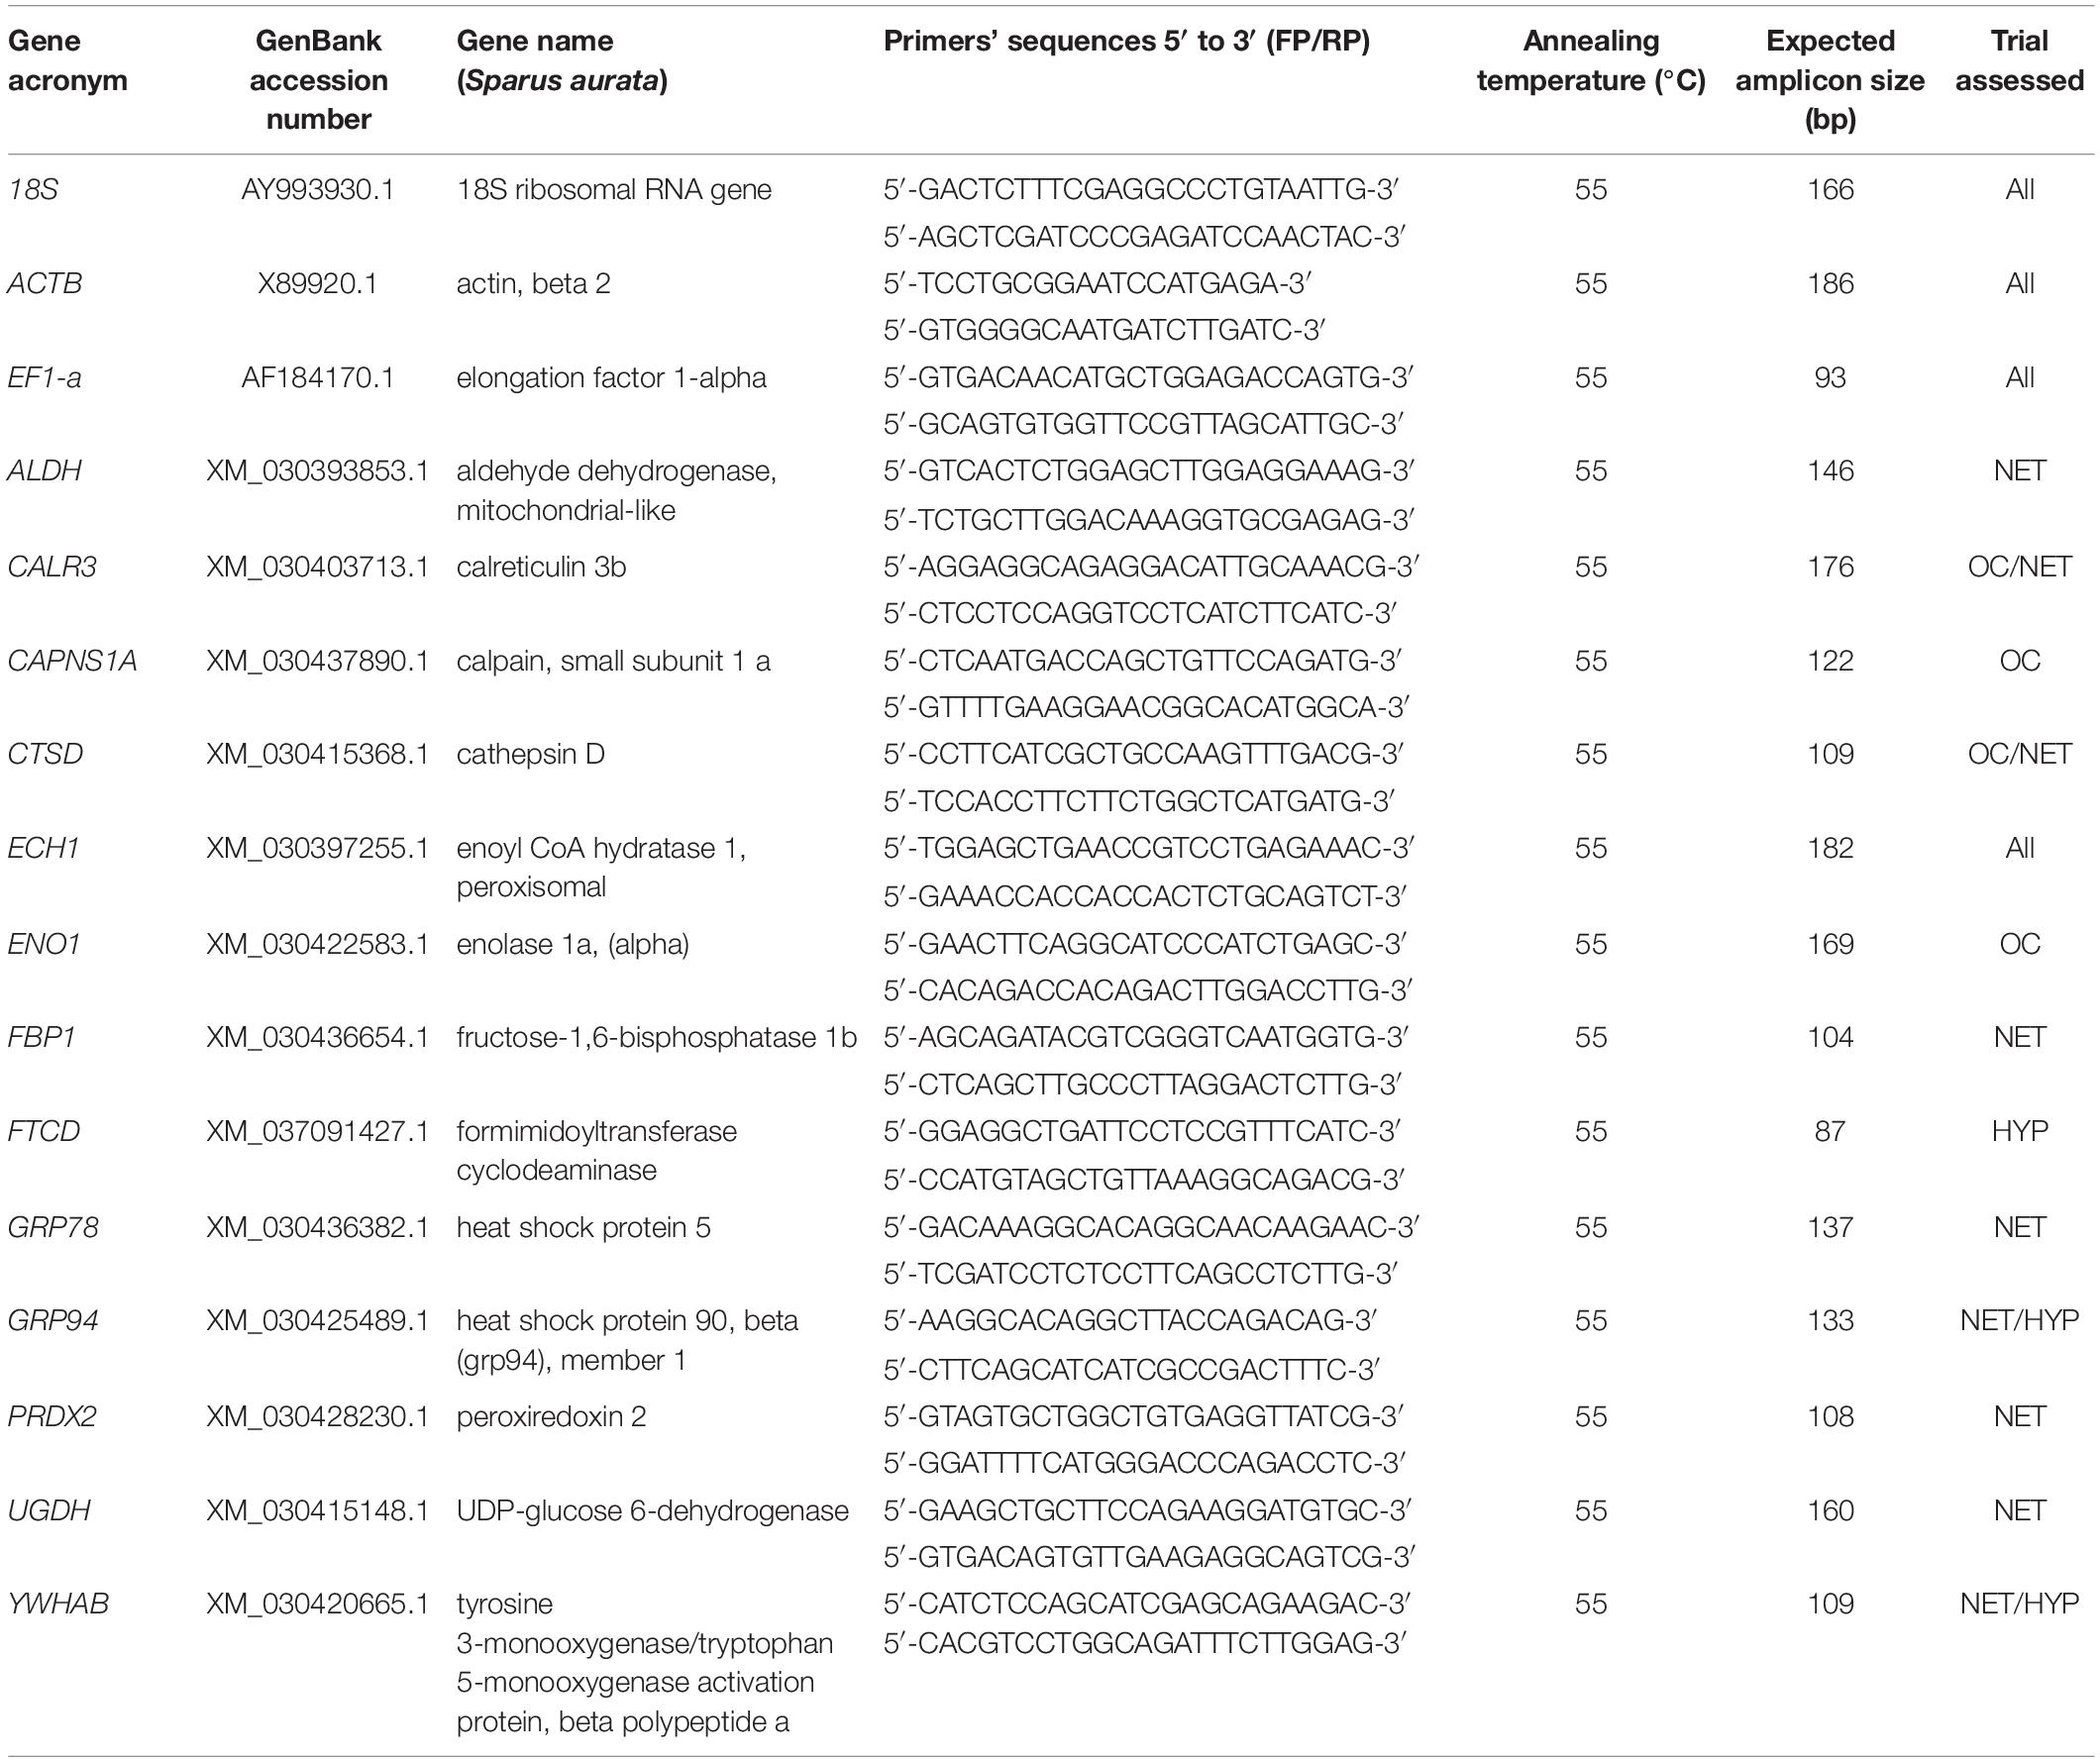
Table 1. Primers used for the RT-PCR and RT-qPCR analyses of the candidate reference genes and the target genes, and expected amplicon sizes.
Gene Cloning
The PCR products of the expected sizes were isolated and purified using the QIAEX II Gel Extraction kit (QIAGEN, Germantown, MD, United States), according to the manufacturer’s instructions. The PCR-amplified DNA fragments were cloned onto the pGEM®T-Easy plasmid (Promega) and the products were transformed into E. coli DH5a competent cells and subsequently plated onto 2xYT with Ampicilin, X-Gal and IPTG. Transformants were screened by colony PCR using the EmeraldAmp® GT PCR Master Mix (Takara). Bacterial liquid cultures of positive clone products were used for plasmid extraction, using FavorPrepTM Plasmid DNA Extraction Mini Kit (Favorgen, Ping-Tung, Taiwan), and the DNA quantified using the NanoVue Plus spectrophotometer (GE Healthcare). Purified plasmids were then sequenced by Macrogen, Inc. (Seoul, Korea) (Supplementary Material 4). Raw sequences were checked for alignment with the designed primers using Genetyx software8 and stored for further use as standards for RT-qPCR.
RT-qPCR Assay
Purified plasmids were linearized by restriction digestion with EcoRI (Takara). To prepare each target gene’s standards, plasmid copy numbers were calculated through the Avogadro’s constant, using the web-based tool: http://cels.uri.edu/gsc/cndna.html, and serial dilutions were prepared to produce a tenfold eight-point dilutions series (109 – 102). RT-qPCR reactions (in duplicate) were carried out in 96-well plates using the LightCycler® 480 Instrument II system (Roche Molecular Systems, Inc., Indianapolis, IN, United States). Each standard reaction was duplicated and run concurrently with test samples. The total reaction volume comprised 1 μl of cDNA template, 1 μl of forward primer, 1 μl of reverse primer, 2 μl of ddH2O and 5 μl of LightCycler® 480 SYBR Green I Master (Roche Molecular Systems, Inc.). RT-qPCR reactions were conducted duplicately using the following parameters: pre-incubation at 95°C for 5 min, followed by 40 amplification cycles of 95°C for 15 s, annealing for 30 s and 72°C for 30 s. Primers and annealing temperatures used in this analysis are listed in Table 1. At the end of the amplification process, the specificity was tested using melting curve analysis: 95°C for 5 s followed by 65°C for 1 min, then continuous temperature increase (1°C/15 s) to 97°C, with fluorescence measurement, and then cooling at 40°C for 30 s. The specificity of the amplicons was confirmed by the presence of a single peak. Data acquisition was carried out by the LightCycler® 480 Software v1.5 (Roche Molecular Systems, Inc.).
Expression Stability of Reference Genes and Normalization
Standard curves were computed by plotting the logarithm of the known RNA standard concentration against their corresponding quantification cycle (Cq) values. Absolute copy numbers of the target genes (ENO1, CAPNS1A, ECH1, CALR3, CTSD, GRP94, PRDX2, ALDH, FBP1, YWHABA, GRP78, UGDH, FTCD), chosen based on the corresponding protein’s expression profile and their literature-based evidence of stress-related function, in unknown samples were calculated from the respective linear logarithmic regression line equations using the Cq values obtained from duplicate RT-qPCR reactions. Raw Cq values from candidate reference genes, target genes and corresponding standards are shown in Supplementary Material (Supplementary Material 3). The chosen candidate reference genes, 18S, ACTB and EF1-a, were selected based on their frequent usage for normalization in fish gene expression studies. Their expression stability was evaluated through the commonly used algorithms Delta-CT method (Silver et al., 2006), BestKeeper (Pfaffl et al., 2004), NormFinder (Andersen et al., 2004), and geNorm (Vandesompele et al., 2002) using the web-based tool RefFinder (Xie et al., 2012)9. RefFinder integrates the data generated from all the algorithms and provides a comprehensive re-ranking of the genes. Target genes’ expression data was normalized to the geometric mean of the most stable endogenous reference genes for each sample. Normalized gene expression data is presented in log2(fold-changetreated/control).
Hepatic Glycogen Assessment
Gilthead seabream liver glycogen was assessed using a commercial kit (MAK016; Sigma-Aldrich, MO, United States). Briefly, 10 mg of liver tissue were homogenized in 100 μl of milliQ water at 4°C, using a tissue lyser (VWR, Radnor, PA, United States) and a metal bead for 30 s at 25/s frequency, and boiled for 5 min to inactivate enzymes. Samples were then centrifuged at 13,000 g for 5 min. Assays were then performed on 96-well plates, in duplicate, following manufacturer’s instructions, and read at 570 nm along with a prepared standard curve on a microplate reader Biotek Synergy 4 Hybrid TechnologyTM (Biotek Instruments Inc., Winooski, VT, United States). Sample blanks were run simultaneously in the assays, in duplicate, for glucose subtraction from the sample readings.
Univariate Statistical Analyses
Univariate statistical analyses of gene expression data and glycogen levels were performed using R v4.0.3 for MacOSX (see text footnote 3). Statistical differences between experimental groups and the control group were analyzed independently for each trial (OC, NET, and HYP), by One-way analysis of variance (One-way ANOVA) on log10-transformed data. Multiple comparisons of gene expression data were carried out by the post hoc Dunnett’s test. Normality of the residuals was assessed by a Shapiro-Wilk’s test. When transformed data from hepatic glycogen levels did not verify homoscedasticity assumption by Levene’s test, statistical significance was assessed by Welch’s ANOVA, followed by the post hoc test Games-Howell (specifically OC and NET trials). A significance level of α = 0.05 was used in all tests performed. The correlation between genes’ expression changes and the corresponding products was assessed by Pearson’s correlation. All plots were generated using the R package ggplot2 (Wickham, 2016).
Results
Gel-Based Proteomics Analysis of Gilthead Seabream Liver
Changes in the liver proteome of gilthead seabream exposed to the different challenges and undisturbed fish were assessed, comparatively, through gel-based proteomics using the 2D-DIGE technique. The number of protein spots identified in each trial is summarized schematically in Figure 1 to facilitate interpretation. Analysis of CyDye-labeled gels revealed 1205, 974 and 1060 protein spots for the OC, NET and HYP trials, respectively, within the experimental pH range of 4–7 and molecular weights ranging from 11–90 kDa. Following a statistical analysis, 36, 165, and 59 protein spots within the OC, NET and HYP trials, respectively, showed significantly differential abundances (One-way ANOVA, followed by Dunnett’s test, p < 0.05) among experimental groups. Spots were manually excised from corresponding preparative gels and identified by MALDI-TOF/TOF MS. From these, 13, 52 and 26 were successfully identified by MS/MS, with significant scores, in two databases (protein score > 76 (NCBI) or > 86 (EST), total ion score > 60, p < 0.05). All the identified proteins and their attributes are listed in Supplementary Material 1. From the protein spots identified in the OC trial, 7 were upregulated and 6 were downregulated in challenged fish, compared with control fish, while in the NET trial 22 protein spots were upregulated and 30 were downregulated. Finally, in the HYP trial, 18 of the identified protein spots were upregulated and 8 were downregulated in challenged fish. Among the protein spots of NET trial with significant identifications attributed, 12 showed more than one significant identification, while in the case of the identified protein spots corresponding to the HYP trial, 8 spots also showed more than one significant identification. Regarding the total protein identifications attributed to OC protein spots, 12 corresponded to single entries, from which 7 are proteins varying in abundance uniquely in this trial, 2 corresponded to shared identifications with the NET trial (heart-type fatty acid binding protein and calreticulin) and 3 with the HYP trial (Δ3,5, Δ2,4-dienoyl-CoA isomerase, glutathione S-transferase and proteasome subunit beta). In the case of NET trial, 42 protein identifications corresponded to single entries. Among these, 34 proteins have differential abundance exclusively in this trial, and apart from the 2 protein identifications shared with the OC trial, 6 other protein identifications are also common between NET and HYP trial (14-3-3 protein beta/alpha, actin, cytoskeletal type II keratin 8, elongation factor-1-beta, peroxiredoxin 2 and serine—pyruvate aminotransferase). Apart from the common identifications, 19 additional proteins, corresponding to single entries, were found to be varying in abundance exclusively in the HYP trial.
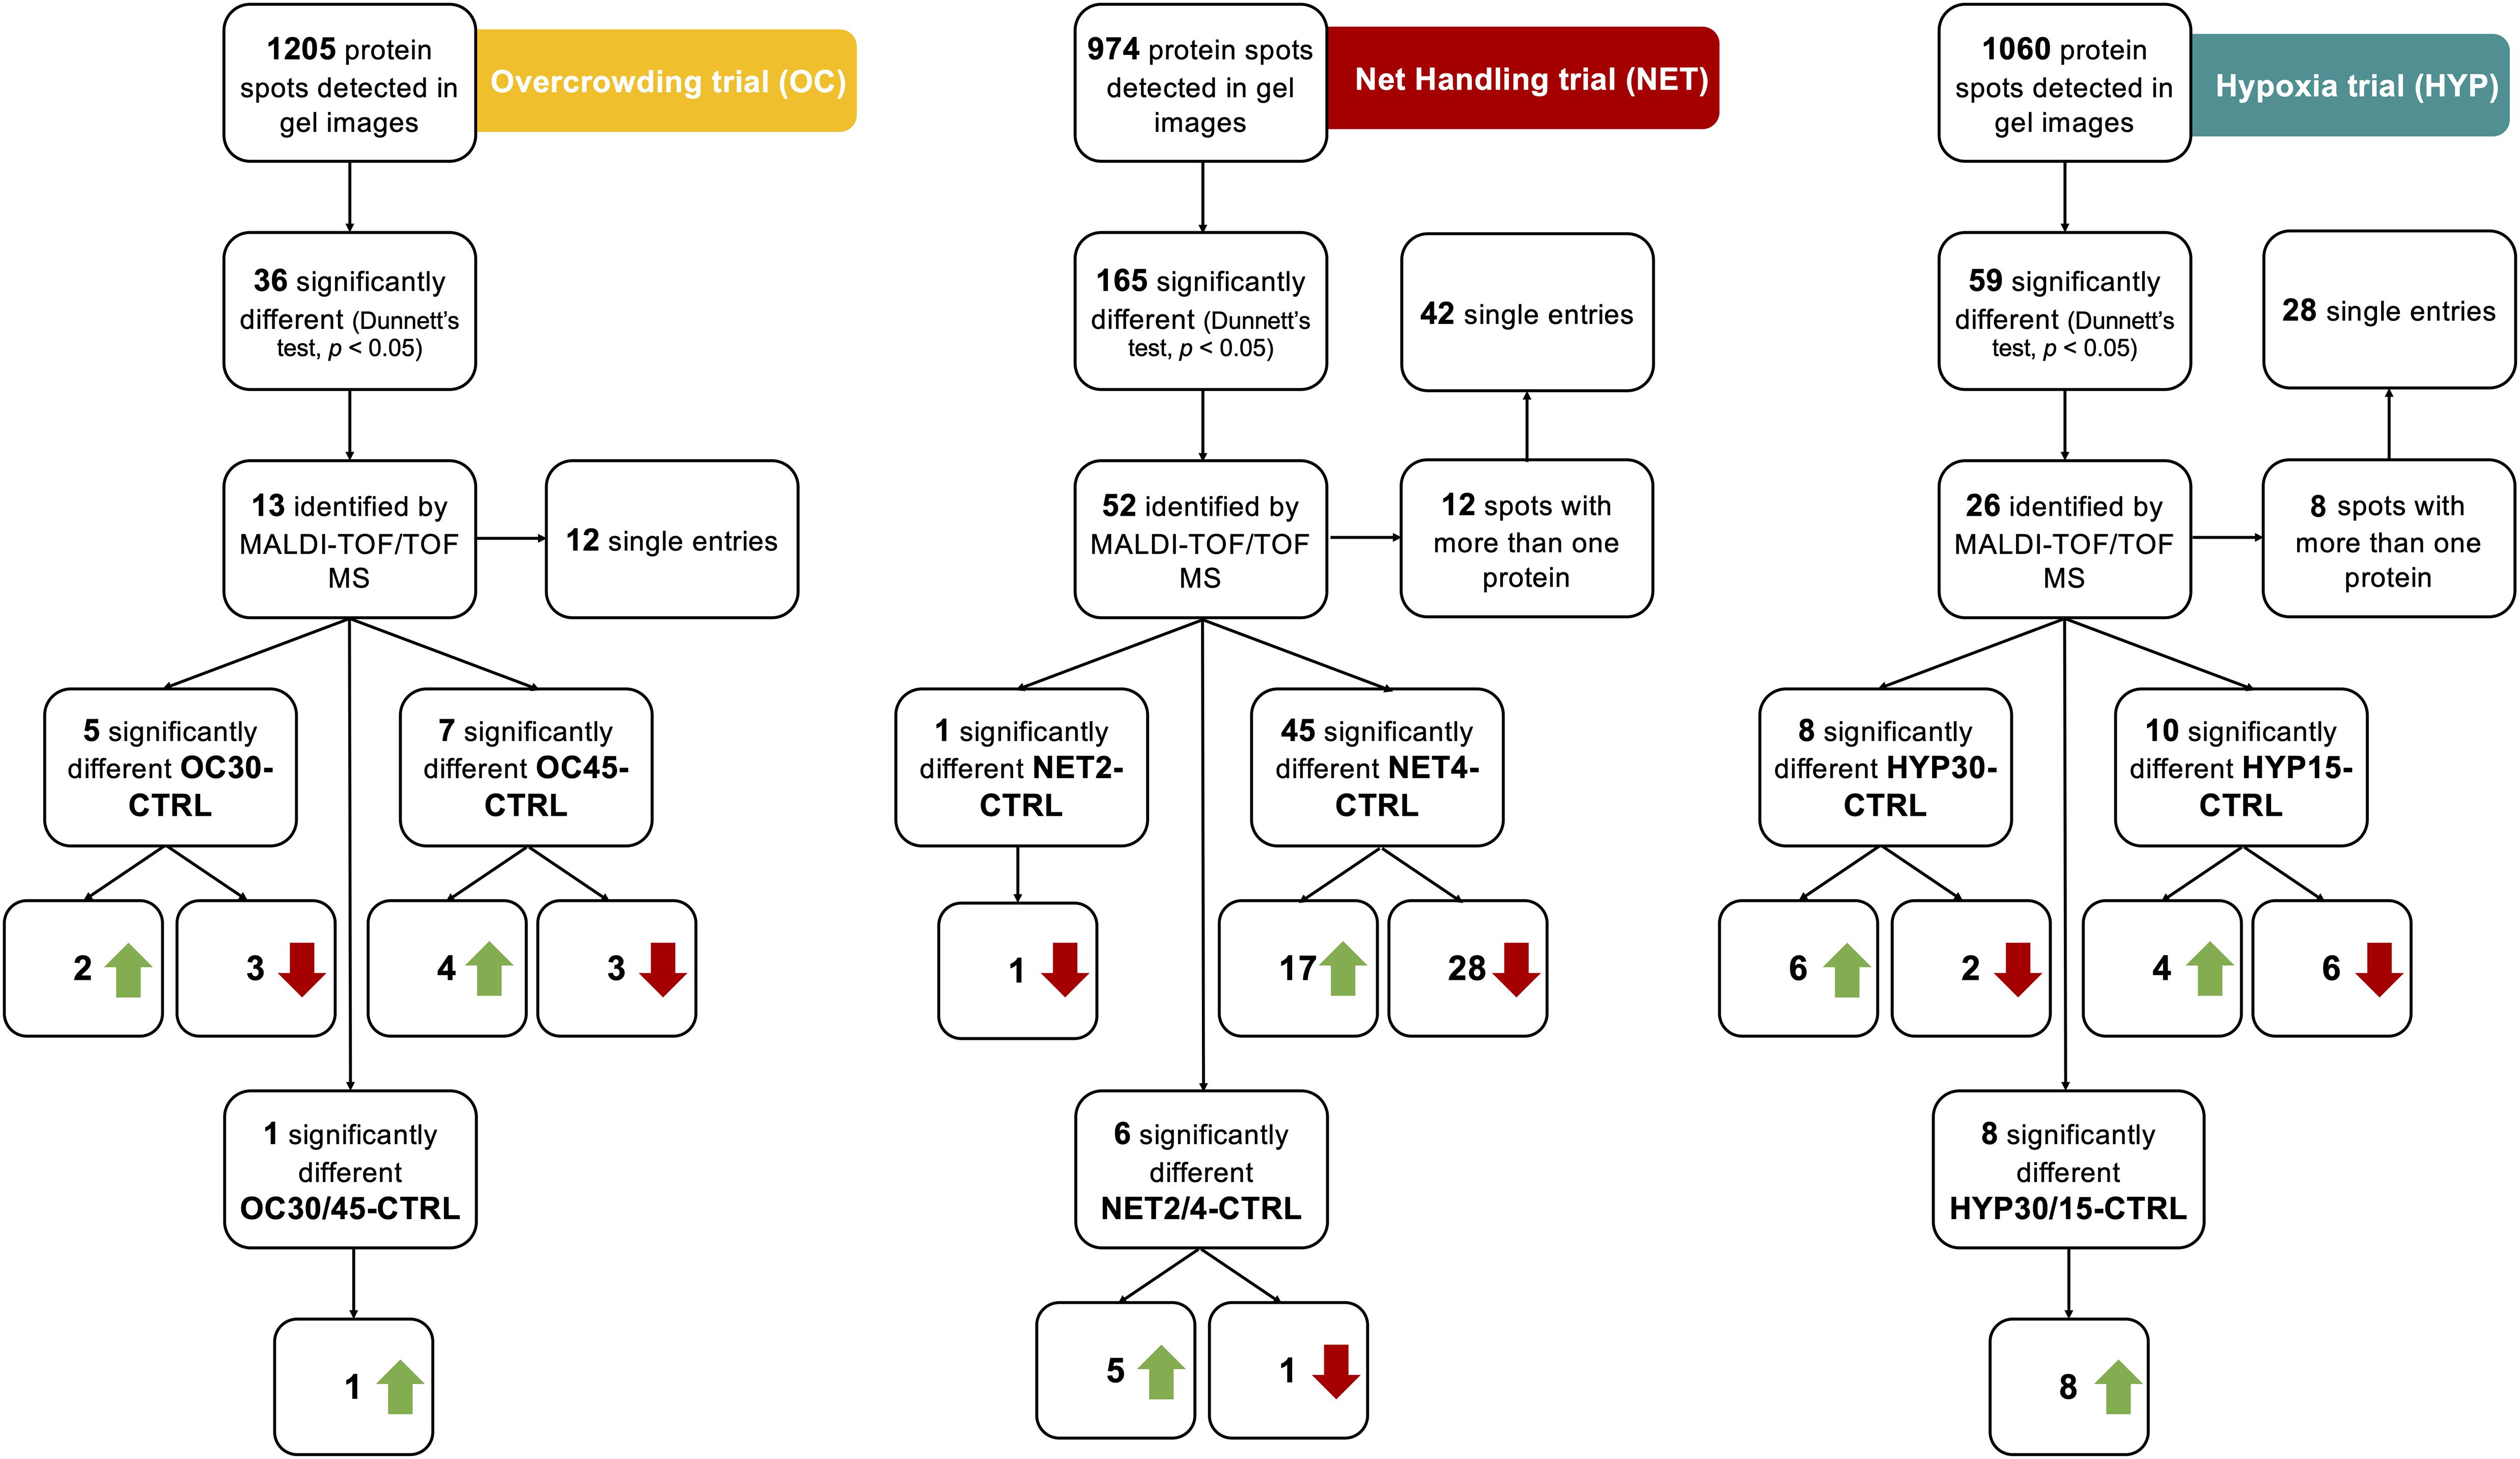
Figure 1. Summary of the protein spots identified in the 2D-gels of the proteomics analysis performed with the liver of gilthead seabream (Sparus aurata) submitted to different challenges, and their expression profiles.
Univariate and Multivariate Statistical Analyses of Differential Abundant Proteins
In order to identify, in each trial, which stress intensity induced the highest number of differential abundant proteins (DAP), the fold-change of the protein spots (log2-transformed) was plotted against their statistical significance (log10-transformed). The originated volcano plots showed that the highest number of DAP was found between the fish from OC45, NET4 and HYP15, and their corresponding control fish, in the OC (Figure 2A), NET (Figure 3A) and HYP (Figure 4A) trials, respectively. Although, in the case of OC and HYP trials, the highest fold-changes were found between the proteins of OC30 and HYP30 groups and the control group. These same observations were corroborated after HCL analysis. Separation between groups was more evidenced in the NET trial (Figure 3B), when compared with OC (Figure 2B) and HYP (Figure 4B) trials, whereas the most divergent groups were the control and NET4, as observed by the top dendrogram. Protein spots also grouped into two main clusters, one displaying a pattern of higher relative abundance (including mainly proteins related to protein synthesis, folding and sorting) and the other of lower relative abundance in challenged fish (including mainly proteins involved in the amino acid and carbohydrate metabolisms), when compared to the control.
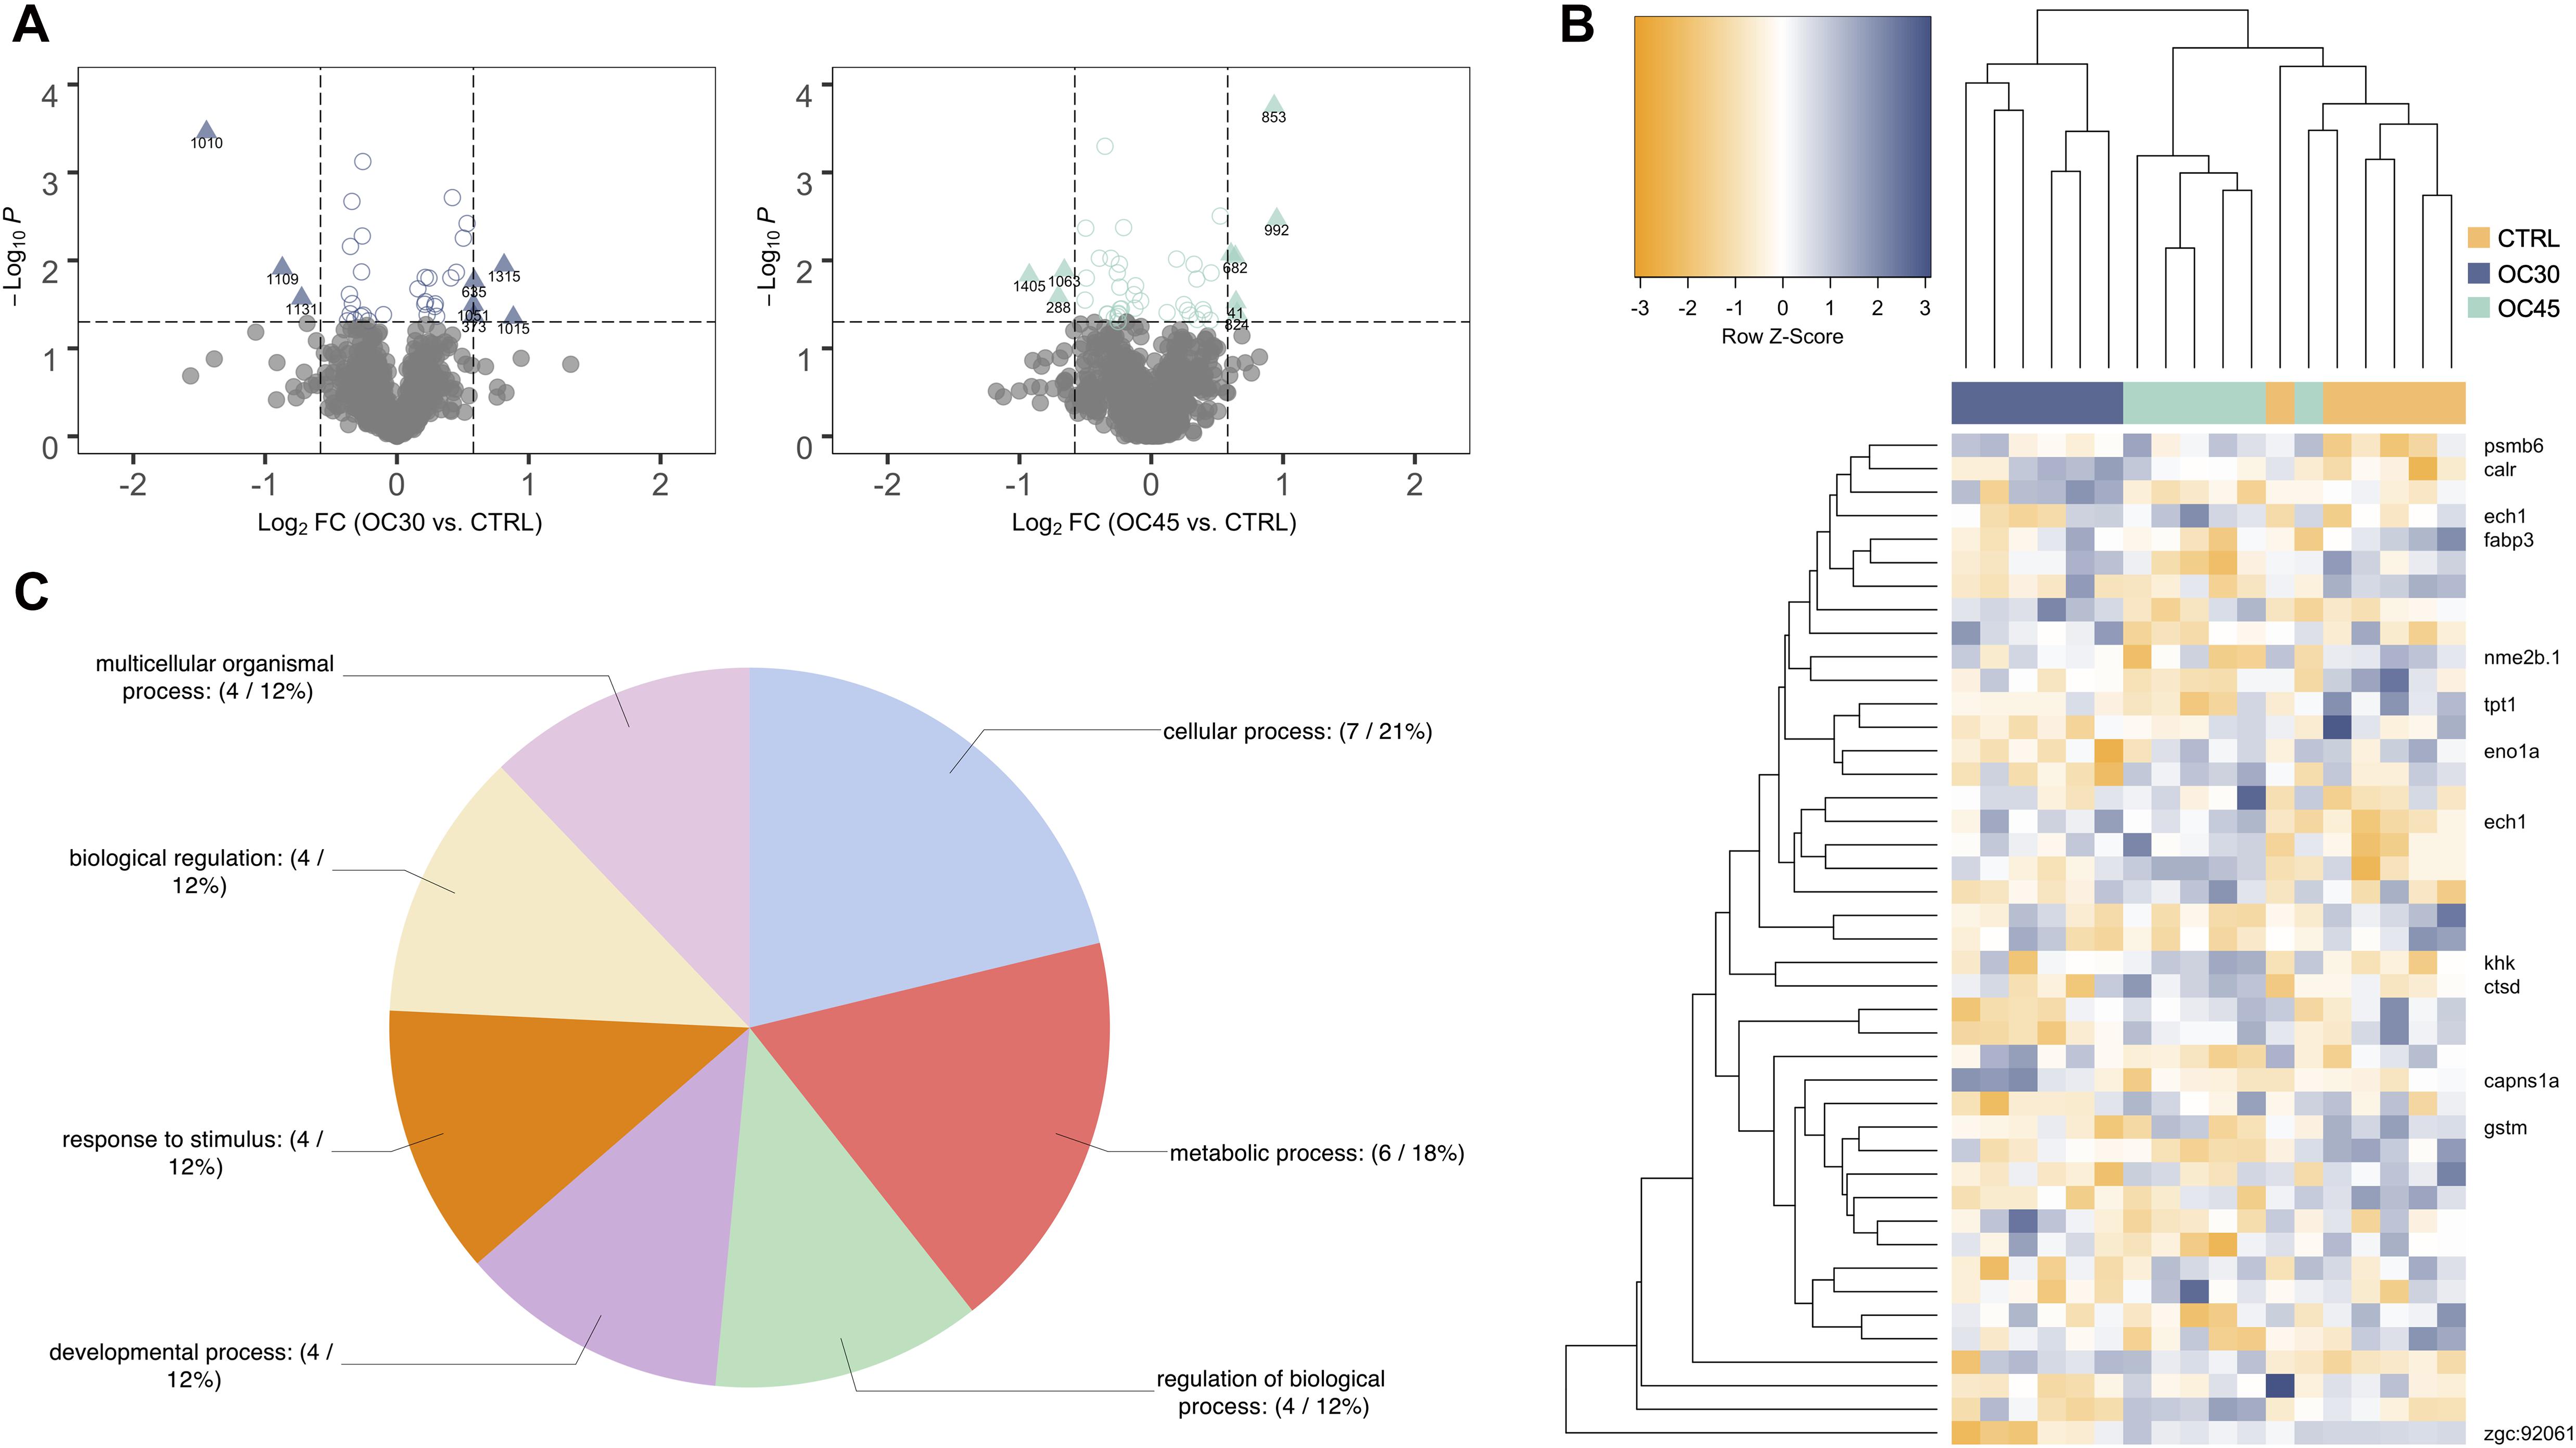
Figure 2. Proteomics data analysis of OC trial. (A) Volcano plots of the differential proteins detected by 2D-DIGE analysis on the OC trial liver samples (n = 6). Dotted vertical lines represent a 1.5-fold variation in abundance, while the dotted horizontal line represents the significance level of p < 0.05 (Student’s t-test). Triangles represent proteins significantly up- and downregulated. (B) HCL analysis of the 36 significantly different spots (One-way ANOVA, followed by Dunnett’s test, p < 0.05) in the liver of gilthead seabream from OC trial. Rows represent proteins’ expression patterns, while each column corresponds to a biological replicate (fish). (C) Functional GO classification of the identified proteins. Pie chart shows the level 2 GO annotations of biological process.
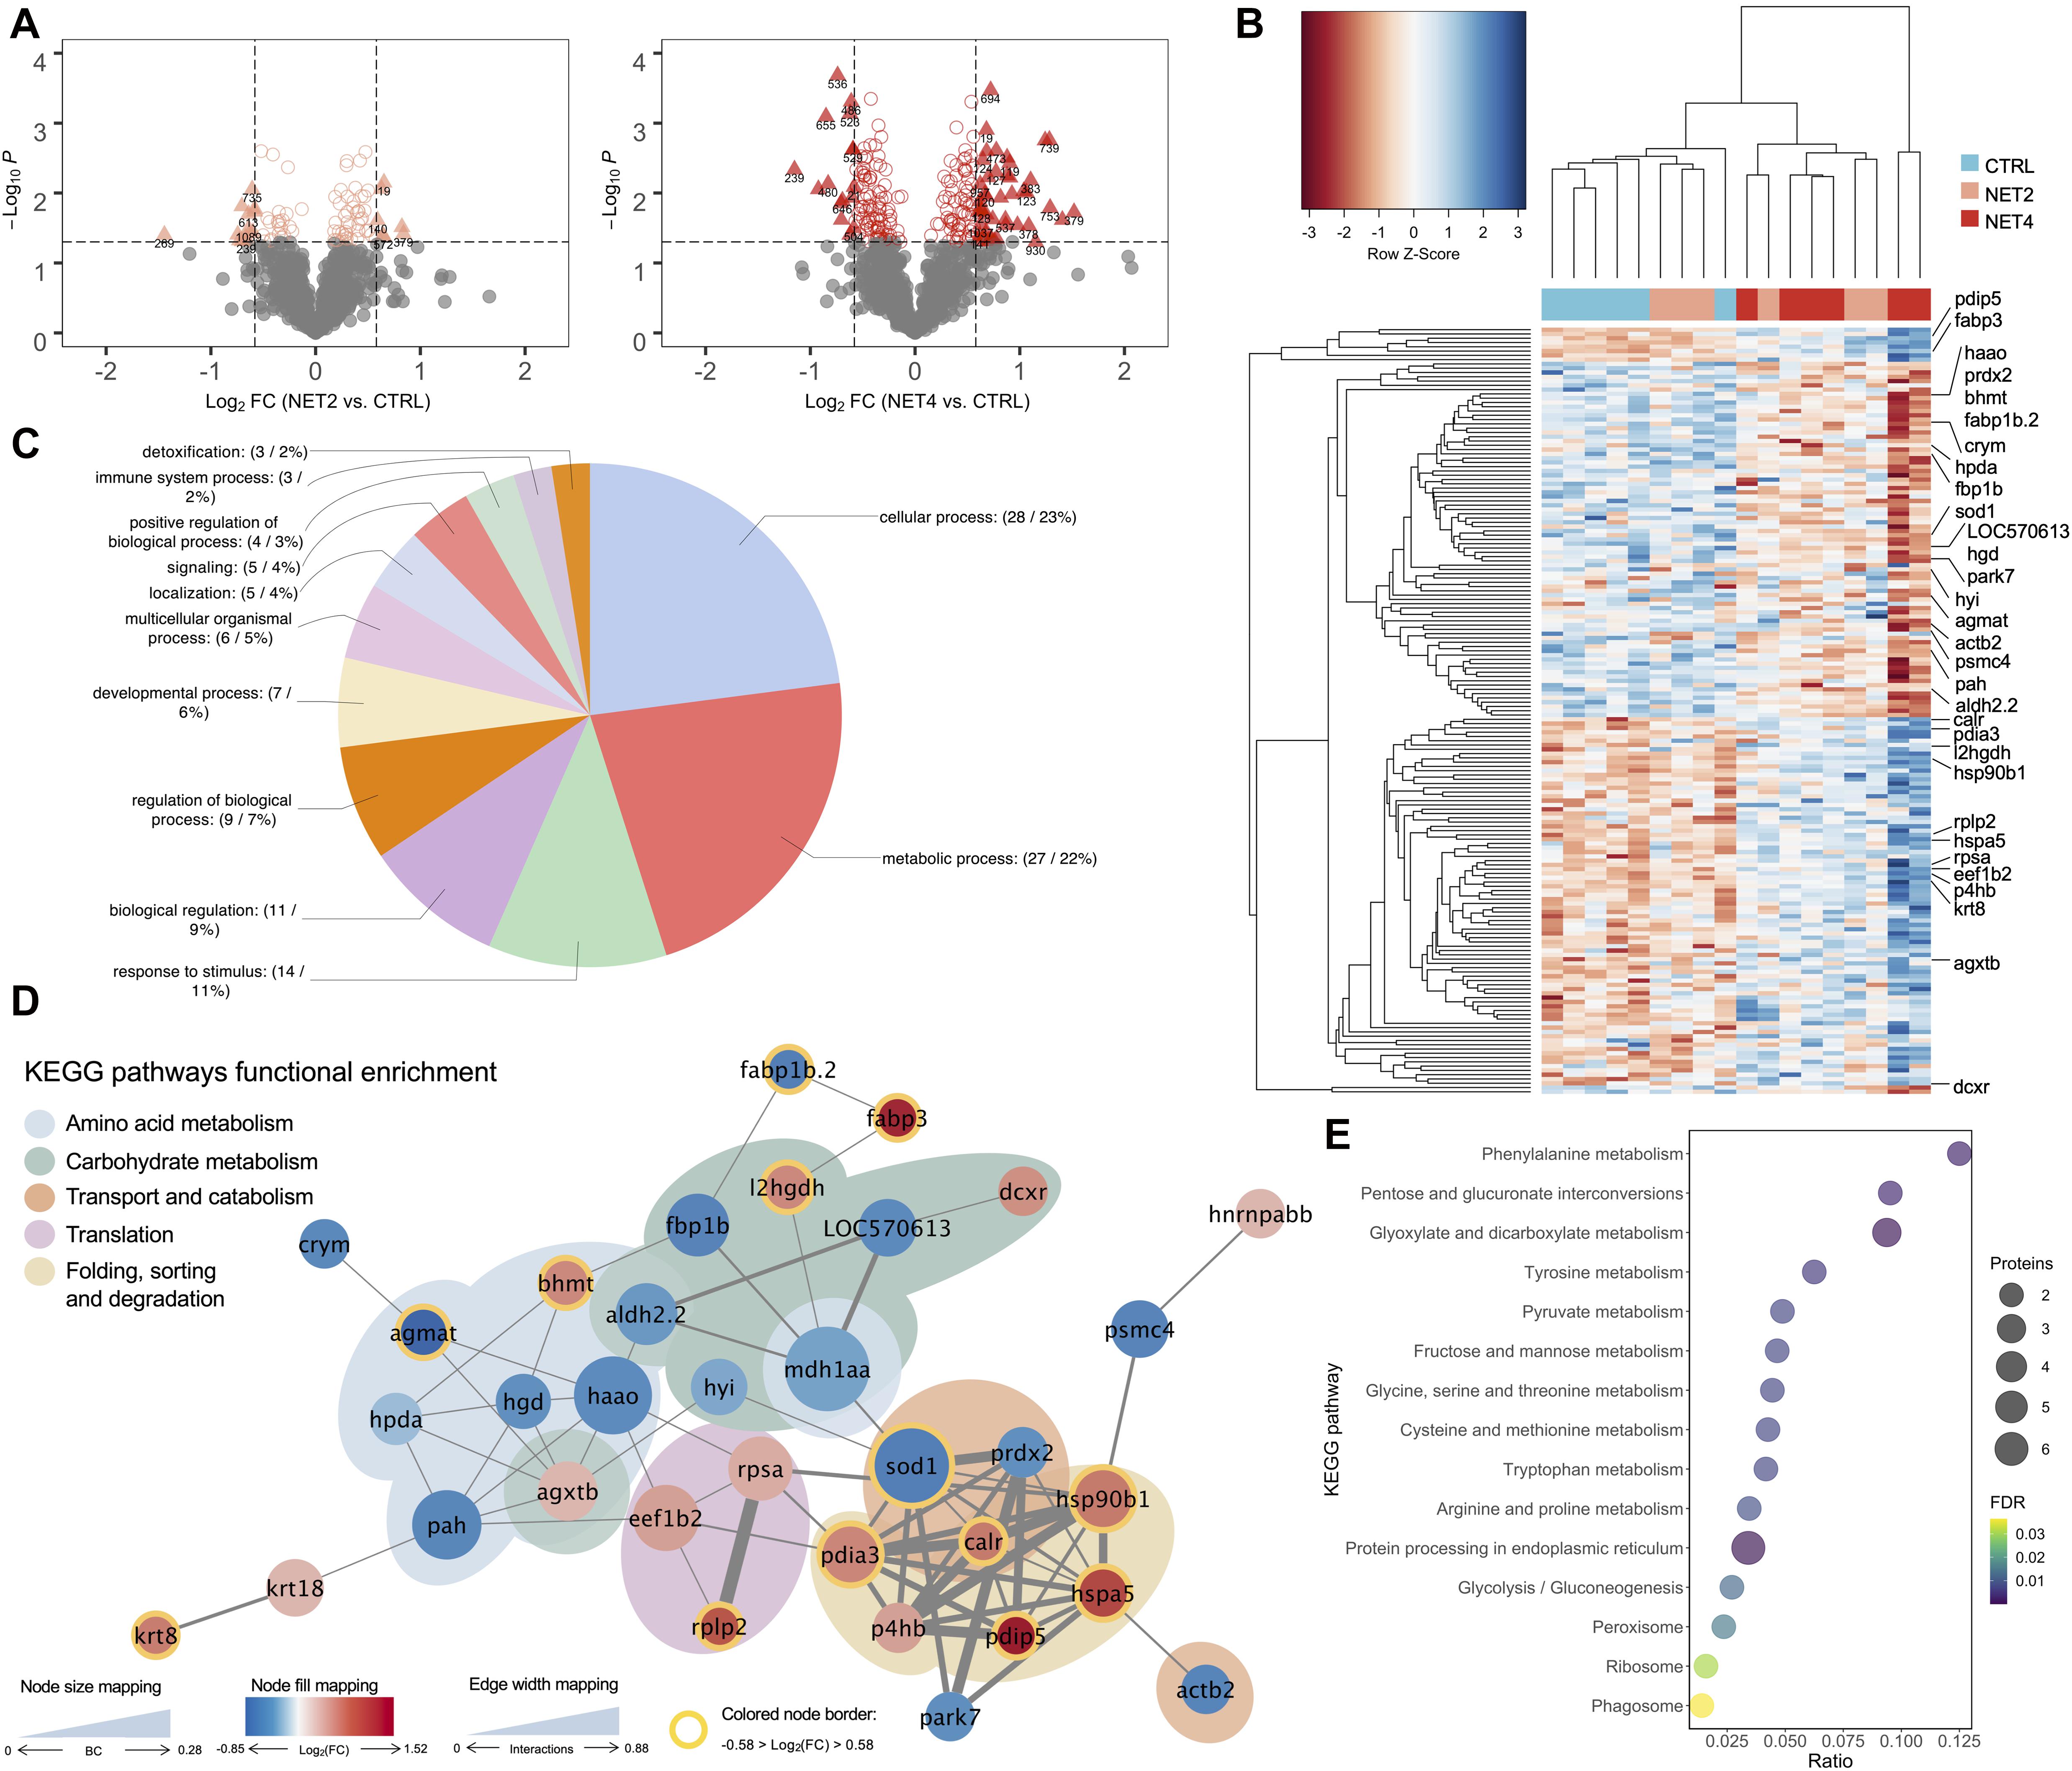
Figure 3. Proteomics data analysis of NET trial. (A) Volcano plots of the differential proteins detected by 2D-DIGE analysis on the NET trial liver samples (n = 6). Dotted vertical lines represent a 1.5-fold variation in abundance, while the dotted horizontal line represents the significance level of p < 0.05 (Student’s t-test). Triangles represent proteins significantly up- and downregulated. (B) HCL analysis of the 165 significantly different spots (One-way ANOVA, followed by Dunnett’s test, p < 0.05) in the liver of gilthead seabream from NET trial. Rows represent proteins’ expression patterns, while each column corresponds to a biological replicate (fish). (C) Functional GO classification of the identified proteins. Pie chart shows the level 2 GO annotations of biological process. (D) Protein-protein interaction network generated with 34 DAP identified in the liver of fish from NET trial. Nodes represent proteins and edges the functional associations between them. Colored areas indicate enriched KEGG pathways (FDR, p < 0.05). (E) Bubble plot representing the statistical significance and number of proteins belonging to each KEGG enriched pathway (lower level) overrepresented in the PPI network. BC, betweenness centrality.
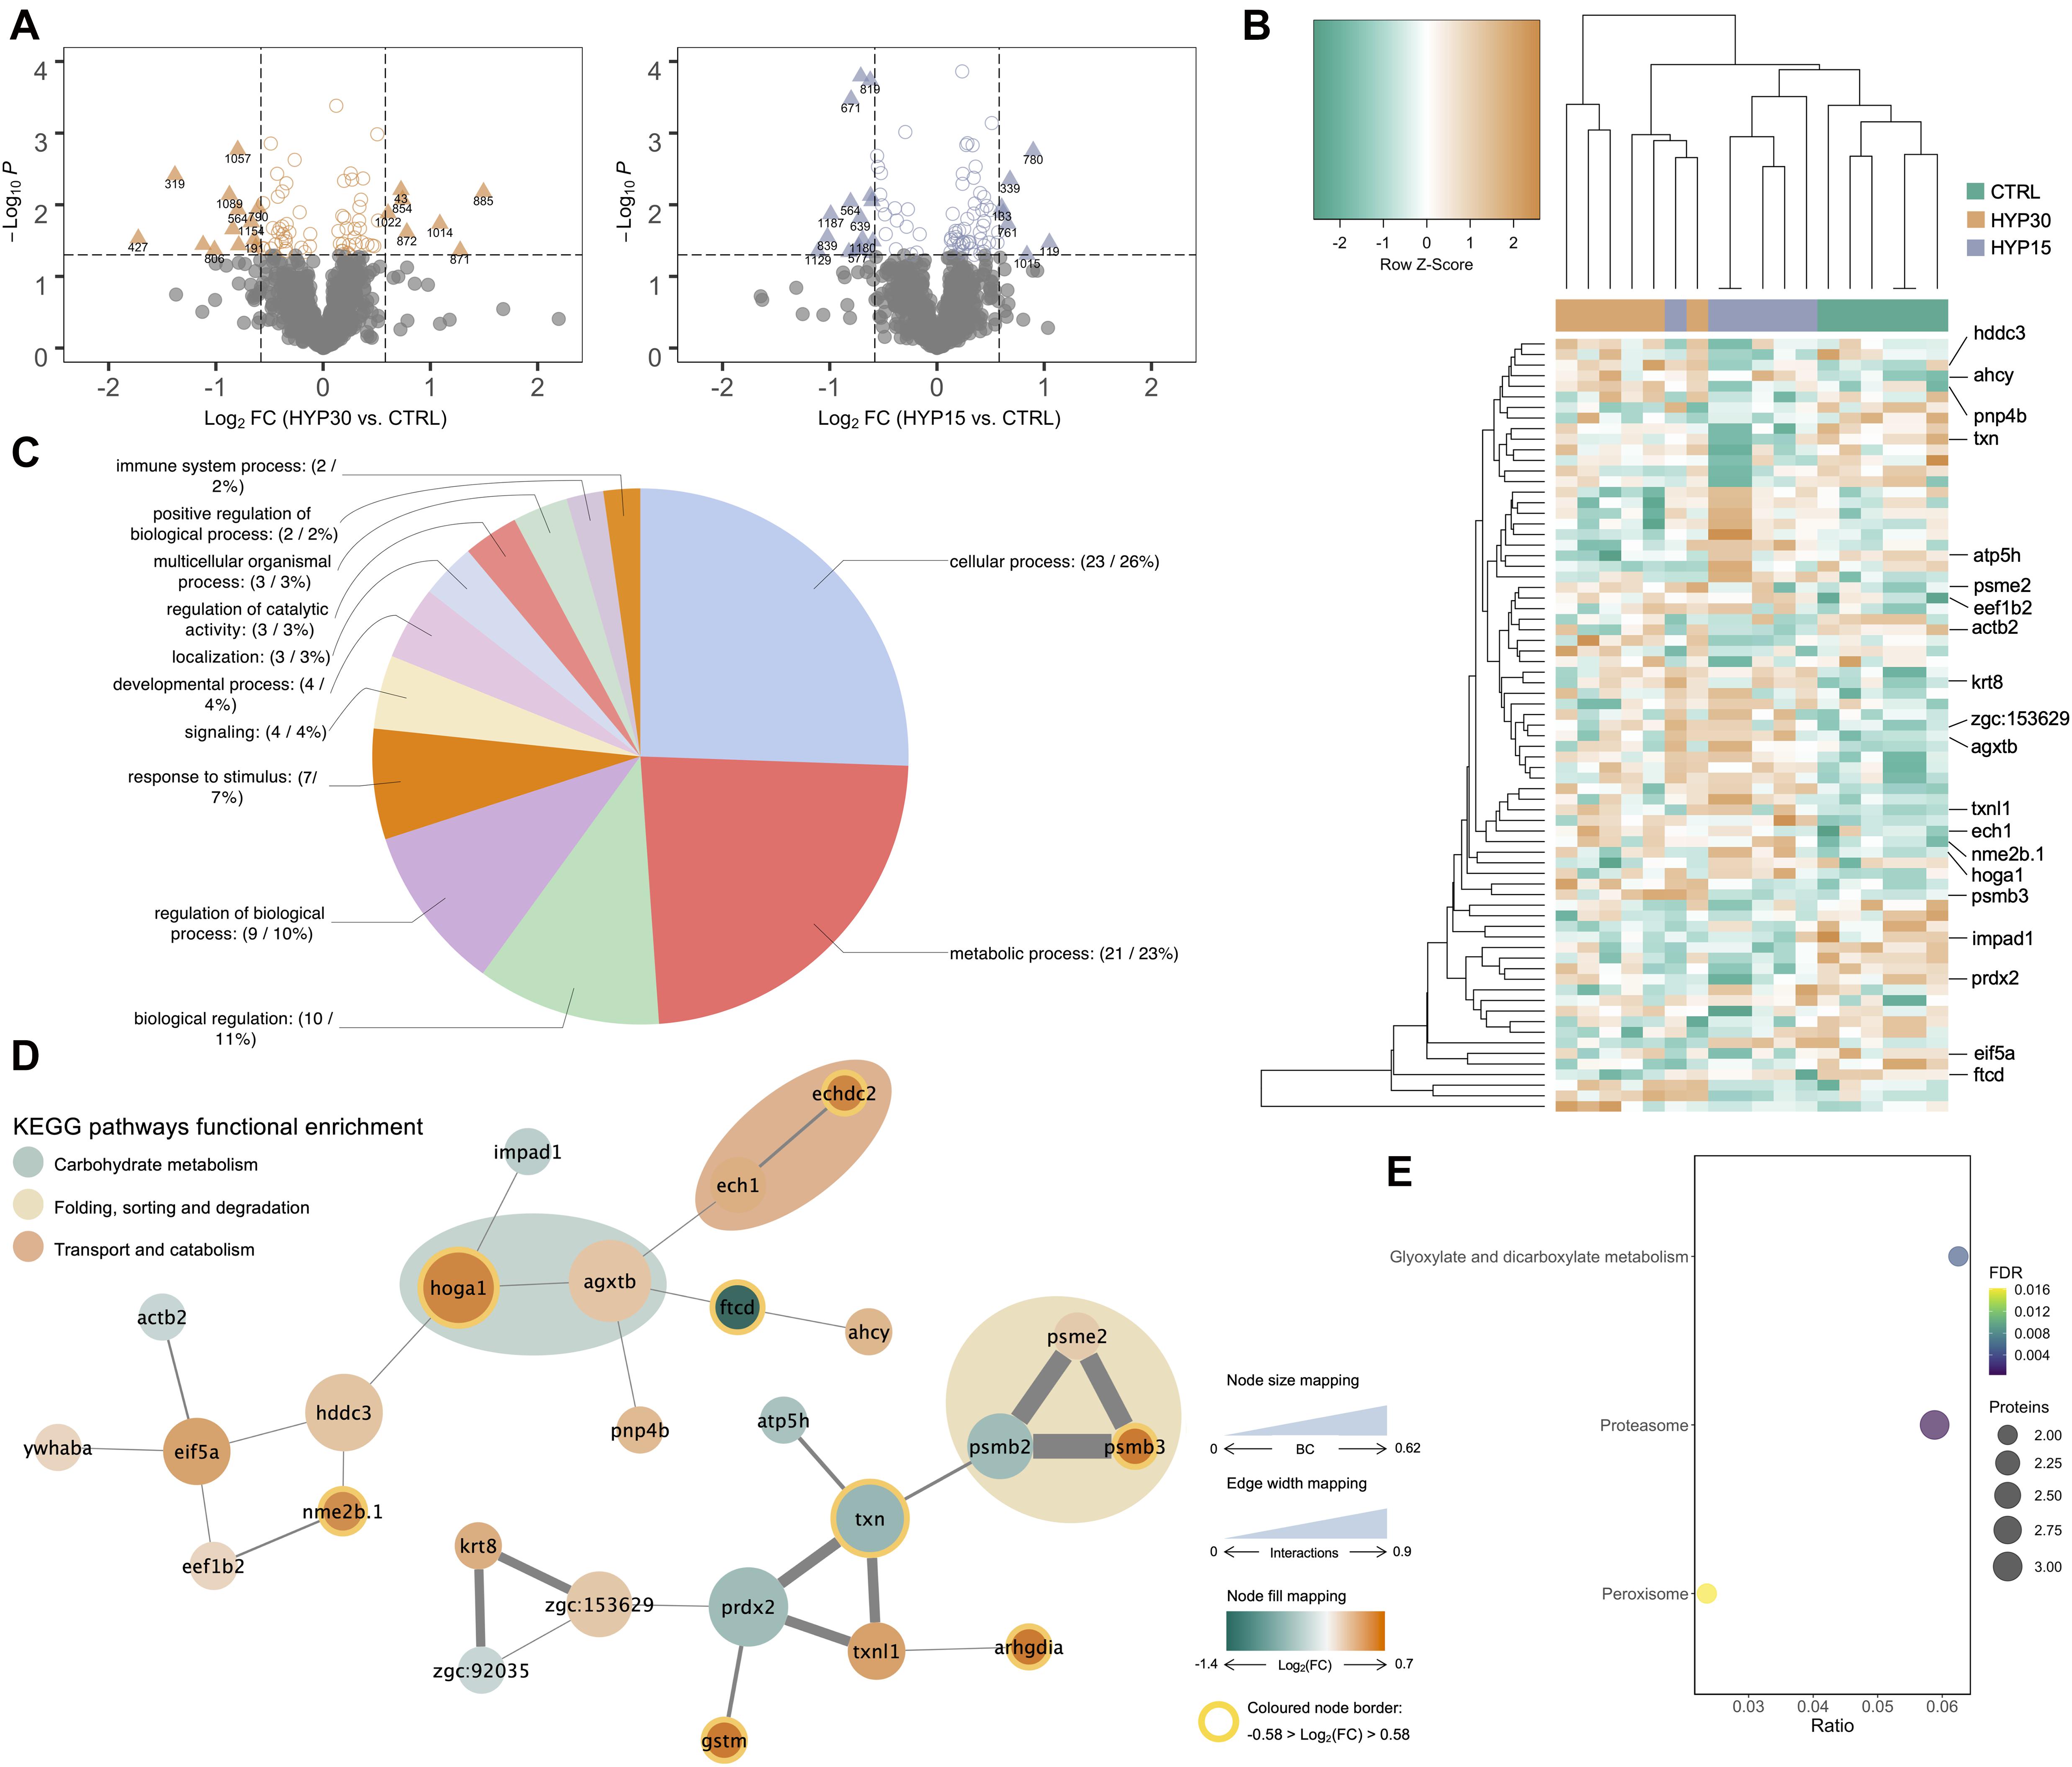
Figure 4. Proteomics data analysis of HYP trial. (A) Volcano plots of the differential proteins detected by 2D-DIGE analysis on the HYP trial liver samples (n = 6). Dotted vertical lines represent a 1.5-fold variation in abundance, while the dotted horizontal line represents the significance level of p < 0.05 (Student’s t-test). Triangles represent proteins significantly up- and downregulated. (B) HCL analysis of the 59 significantly different spots (One-way ANOVA, followed by Dunnett’s test, p < 0.05) in the liver of gilthead seabream from HYP trial. Rows represent proteins’ expression patterns, while each column corresponds to a biological replicate (fish). (C) Functional GO classification of the identified proteins. Pie chart shows the level 2 GO annotations of biological process. (D) Protein-protein interaction network generated with 26 DAP identified in the liver of fish from HYP trial. Nodes represent proteins and edges the functional associations between them. Colored areas indicate enriched KEGG pathways (FDR < 0.05). (E) Bubble plot representing the statistical significance and number of proteins belonging to each KEGG enriched pathway (lower level) overrepresented in the PPI network. BC, betweenness centrality.
Functional GO Annotation of Identified Proteins
In order to elucidate about the biological functions of the liver proteins responding to the different challenges in gilthead seabream, a gene ontology (GO) classification was performed. Functional GO annotation of the identified proteins revealed, based on the top five level 2 biological process (BP) GO terms, that the DAP were mostly implicated in cellular (GO:0009987) and metabolic processes (GO:0008152), response to stimulus (GO:0050896), biological regulation (GO:0065007) and regulation of biological processes (GO:0050789). This is shown in the pie charts of all three OC (Figure 2C), NET (Figure 3C) and HYP trials (Figure 4C). Multi-level pie charts of BP GO terms of the identified proteins from all 3 trials are shown in Supplementary Material 2. Regarding the OC trial, 4 out of the 12 unique proteins were involved in the response to stimulus. From these, 3 are upregulated [calreticulin (CALR), cathepsin (CTSD) and ketohexokinase (KHK)] and 1 is downregulated [glutathione-S-transferase (GTSM)] in challenged fish. Among the 42 unique proteins identified in the NET trial, 14 were implicated in the response to stimulus, i.e., 78 kDa glucose-regulated protein (HSPA5), protein disulfide-isomerase (P4HB), protein disulfide-isomerase A3 (PDIA3), calreticulin (CALR), 94 kDa glucose-regulated protein (HSP90B1), serine-pyruvate aminotransferase (AGXTB), aldehyde dehydrogenase (ADLH2.2), fructose-1,6-bisphosphatase (FBP1B), protein/nucleic acid deglycase DJ-1 (PARK7), Cu-Zn superoxide dismutase (SOD1), liver-type fatty acid-binding protein (FABP1B.2), phenylalanine-4-hydroxylase (PAH), peroxiredoxin 2 (PRDX2) and UDP-glucose-6-dehydrogenase (UGDH). The first six proteins described are upregulated in challenged fish, while the last eight are downregulated, when compared with control fish. The HCL analysis also shows that a subset of these proteins, specifically, the first five proteins mentioned, which are implicated in protein folding processes, are all grouped in the same cluster. In the case of the HYP trial, 7 differential proteins were implicated in the response to stimulus. From these, 4 are upregulated in challenged fish, being these serine-pyruvate aminotransferase (AGXTB), rho GDP-dissociation inhibitor (ARHGDIG), erlin-2 (ERLIN2), and glutathione-S-transferase (GSTM), while the other 3 are downregulated [inositol monophosphatase (IMPA1), peroxiredoxin 2 (PRDX2) and regucalcin (RGN)].
PPI Network Analysis and KEGG Pathway Enrichment
A protein-protein interaction (PPI) analysis was carried out with the unique protein identifications from each trial to elucidate about the biological interactions between the DAP in the liver of gilthead seabream exposed to the different challenges. The unique proteins were blasted against Danio rerio and the orthologs were used to generate a network using the STRING web-based tool. For each unique entry, one protein spot was chosen as the most representative of each protein (Supplementary Material 1), based mainly on the protein score and the closeness between experimental and theoretical molecular weights and isoelectric point. In the case of OC trial, no interactions were found in the STRING database between the identified proteins. Contrarily, in the NET trial, the generated PPI network (Figure 3D) revealed 70 edges among 34 nodes, with a clustering coefficient of 0.501 and a very significant enrichment value (p < 1.0e–16). Likewise, the HYP PPI network (Figure 4D) revealed 28 edges among 26 nodes, with a clustering coefficient of 0.551 and an enrichment value of 1.51e–11. The topological analysis of each network was performed separately on Cytoscape and specific coefficients were selected to highlight the importance and distribution of each node in the network, i.e., the size of the nodes indicates betweenness centrality (ranging from 0 to 0.28 in NET and from 0 to 0.62 in HYP), the divergent color mapping was estimated based on the fold-change (log2-transformed) of each protein (ranging from −0.85 to 1.52 in the NET network and from −1.4 to 0.7 in the HYP network), and the colored node border indicates proteins with a fold-change of at least 1.5-fold. In the NET network, 17 of the 34 nodes represent upregulated proteins in challenged fish (red nodes), while the remaining 17 represent downregulated proteins (blue nodes). PDIA3 (protein disulfide-isomerase A3), HSPA5 (78 kDa glucose-regulated protein) and SOD1 (Cu-Zn superoxide dismutase) showed the highest number of established edges (9), followed by HSP90B1 (94 kDa glucose-regulated protein) with 8, and finally by P4HB (protein disulfide-isomerase) and HAAO (3-hydroxyanthranilate 3,4-dioxygenase) with 7. Regarding the HYP network, 18 nodes represent upregulated proteins in challenged fish (orange nodes) while the remaining 8 represent downregulated proteins (green nodes). EIF5A (eukaryotic translation initiation factor 5A), AGXTB (serine-pyruvate aminotransferase, TXN (thioredoxin) and PRDX2 (peroxiredoxin 2) showed the highest degree of connectivity among the nodes, with 4 edges. It was also possible to discriminate, in the NET network, 5 cohesive overrepresented clusters summing up the 5 enriched KEGG pathways (FDR, q < 0.05). The colored areas in the network (Figure 3D) indicate the higher level enriched KEGG pathways. The lower level KEGG enriched pathways are represented in the bubble plot in Figure 3E. Protein processing in endoplasmic reticulum (term ID: dre04141) was the most overrepresented (FDR = 2.35e–6) pathway in the liver response to the net handling, accounting for 6 proteins in the network. Amino acid metabolism accounted for 9 proteins in the network, however these were distributed over 6 lower level KEGG pathway terms, i.e., phenylalanine metabolism (term ID: dre00360), tyrosine metabolism (term ID: dre00350), glycine, serine and threonine metabolism (term ID: dre00260), tryptophan metabolism (term ID: 00389), arginine and proline metabolism (term ID: dre00330) and cysteine and methionine metabolism (term ID: dre00270). Regarding the HYP network, three KEGG pathways were overrepresented (Figure 4E), being these glyoxylate and dicarboxylate metabolism (term ID: dre00630), peroxisome (term ID: dre04146) and proteasome (term ID: dre03050). The network community represented by the latter was the most over-represented KEGG pathway (FDR = 3.5e–4), which in fact represents a protein complex that integrates the proteasome.
Expression Stability of Candidate Reference Genes
The raw Cq values of the 3 candidate reference genes (Supplementary Material 3) ranged from 7.75 (18S) to 18.29 (ACTB), from 7.47 (18S) to 19.34 (ACTB) and from 6.55 (18S) to 19.58 (ACTB), in the OC, NET and HYP trial assays, respectively. The threshold fluorescence for ACTB was always higher than the other genes, indicating a low expression level. On the other hand, 18S was the most expressed gene among the candidates. Overall, considerable variations were observed between the expression levels of the different candidate reference genes.
The candidate reference genes were ranked separately for the 3 trials, according to their expression stability values, using standard algorithms (Table 2). In general, within each trial, the ranks were consistent across the different algorithms, however, between trials, the results were differential. The geNorm M value of 1.5 was employed as threshold and therefore, only genes with an M value below 1.5 were used as reference genes. ACTB and 18S were the most stable reference genes across all trials, while EF1-a was not used in NET trial since its M value was above the established threshold.
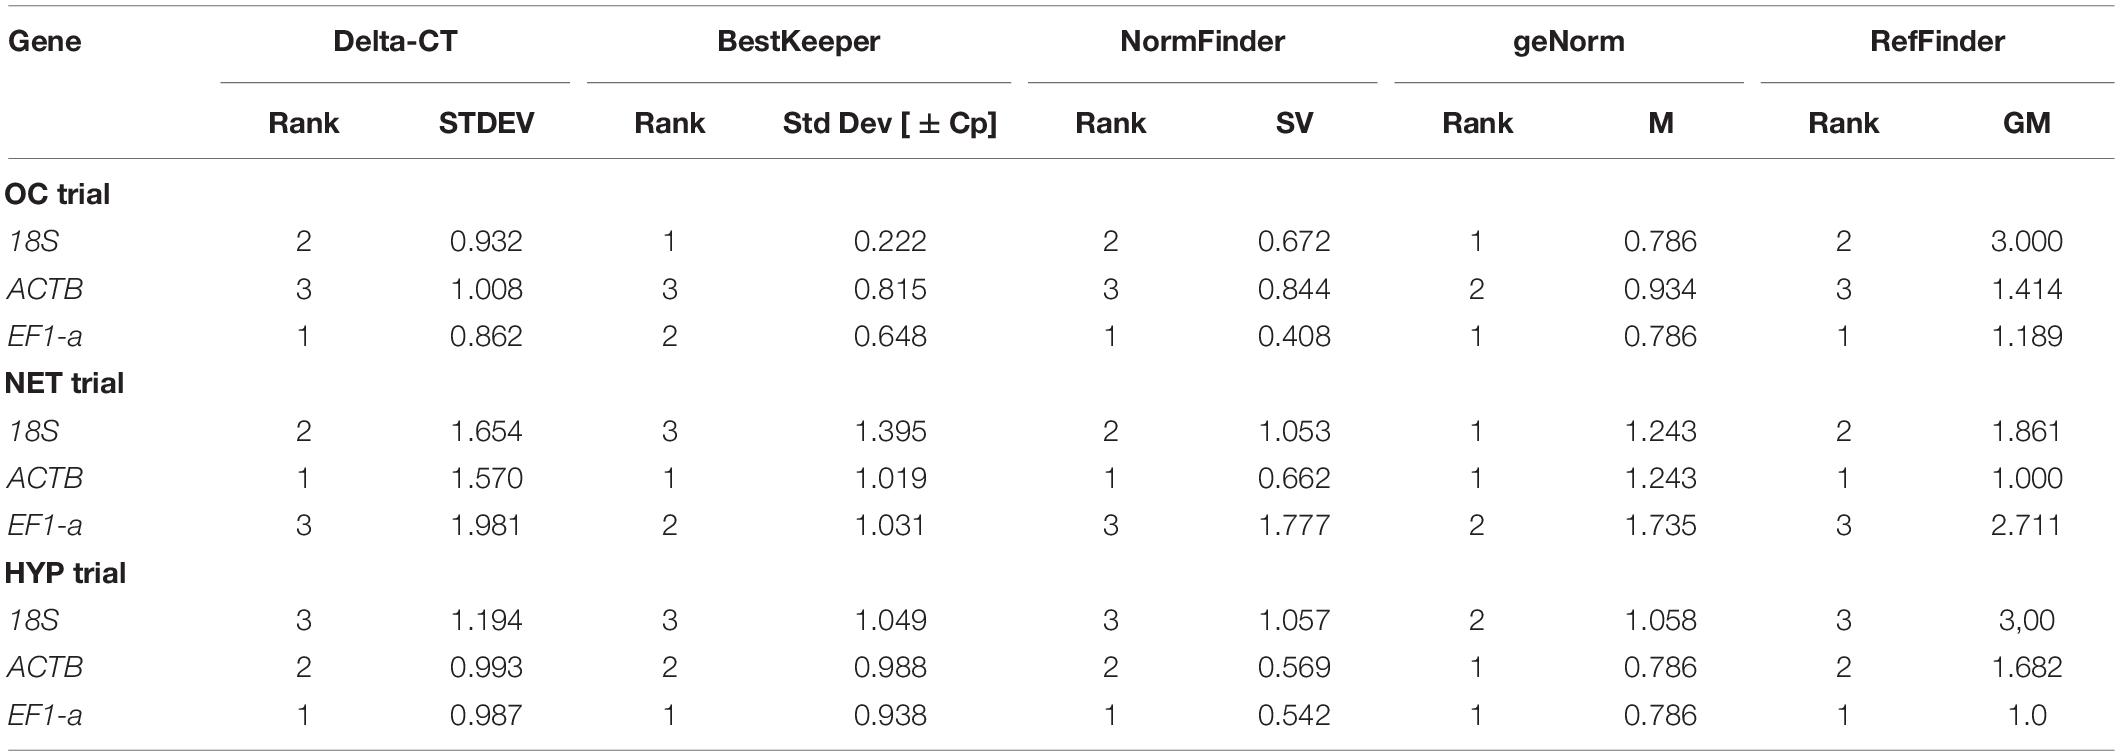
Table 2. Expression stability analysis of each candidate reference gene for gilthead seabream liver RT-qPCR analysis, based on different algorithms.
Amplification Specificity and Efficiency, and Absolute Quantification
The gilthead seabream response to the different challenges was also assessed at the transcript level. Based on the DAP obtained in the liver proteomics analysis, 13 corresponding genes (ENO1, CAPNS1A, ECH1, CALR3, CTSD, GRP94, PRDX2, ALDH, FBP1, YWHABA, GRP78, UGDH, FTCD) were selected for gene expression analysis by RT-qPCR. A melting curve analysis was carried out at the end of each amplification and used to determine primer specificity. The resulting melting peaks are shown in Supplementary Material 5. The amplification efficiency (E) was calculated for each standard curve used for absolute quantification, which varied from 92 to 110%, with a correlation coefficient (R2) kept above 0.987 (Supplementary Material 3).
The absolute copy numbers of the target genes were calculated based on the standard curves constructed with the linearized cDNA plasmids. Subsequently, the absolute copy numbers of the target genes were normalized by the absolute copy numbers of the reference genes, obtained by the geometric mean of the candidate reference genes selected in the expression stability analysis (Table 2). The higher fold-changes between challenged fish and control fish were found in the NET trial. Statistically significant differences (One-way ANOVA, followed by Dunnett’s test, p < 0.05) were found exclusively in the NET trial, specifically in genes GRP78 (NET2-CTRL: p = 0.002, NET4-CTRL: p = 0.018) and GRP94 (NET2-CTRL: p = 0.001, NET4-CTRL: p = 0.027), which were found to be upregulated in challenged fish from both experimental groups (Figure 5). These genes correspond to the proteins 78 kDa glucose-regulated protein (HSPA5) and 94 kDa glucose-regulated protein (HSP90B1), respectively, which were also found to be significantly upregulated in the livers of fish from NET4 group. Although no significant differences were found for the other target genes, the expression profiles of gene and protein expression in the NET trial were highly correlated, with a Pearson’s correlation coefficient (r) of 0.892 and a statistical significance of 0.0029.
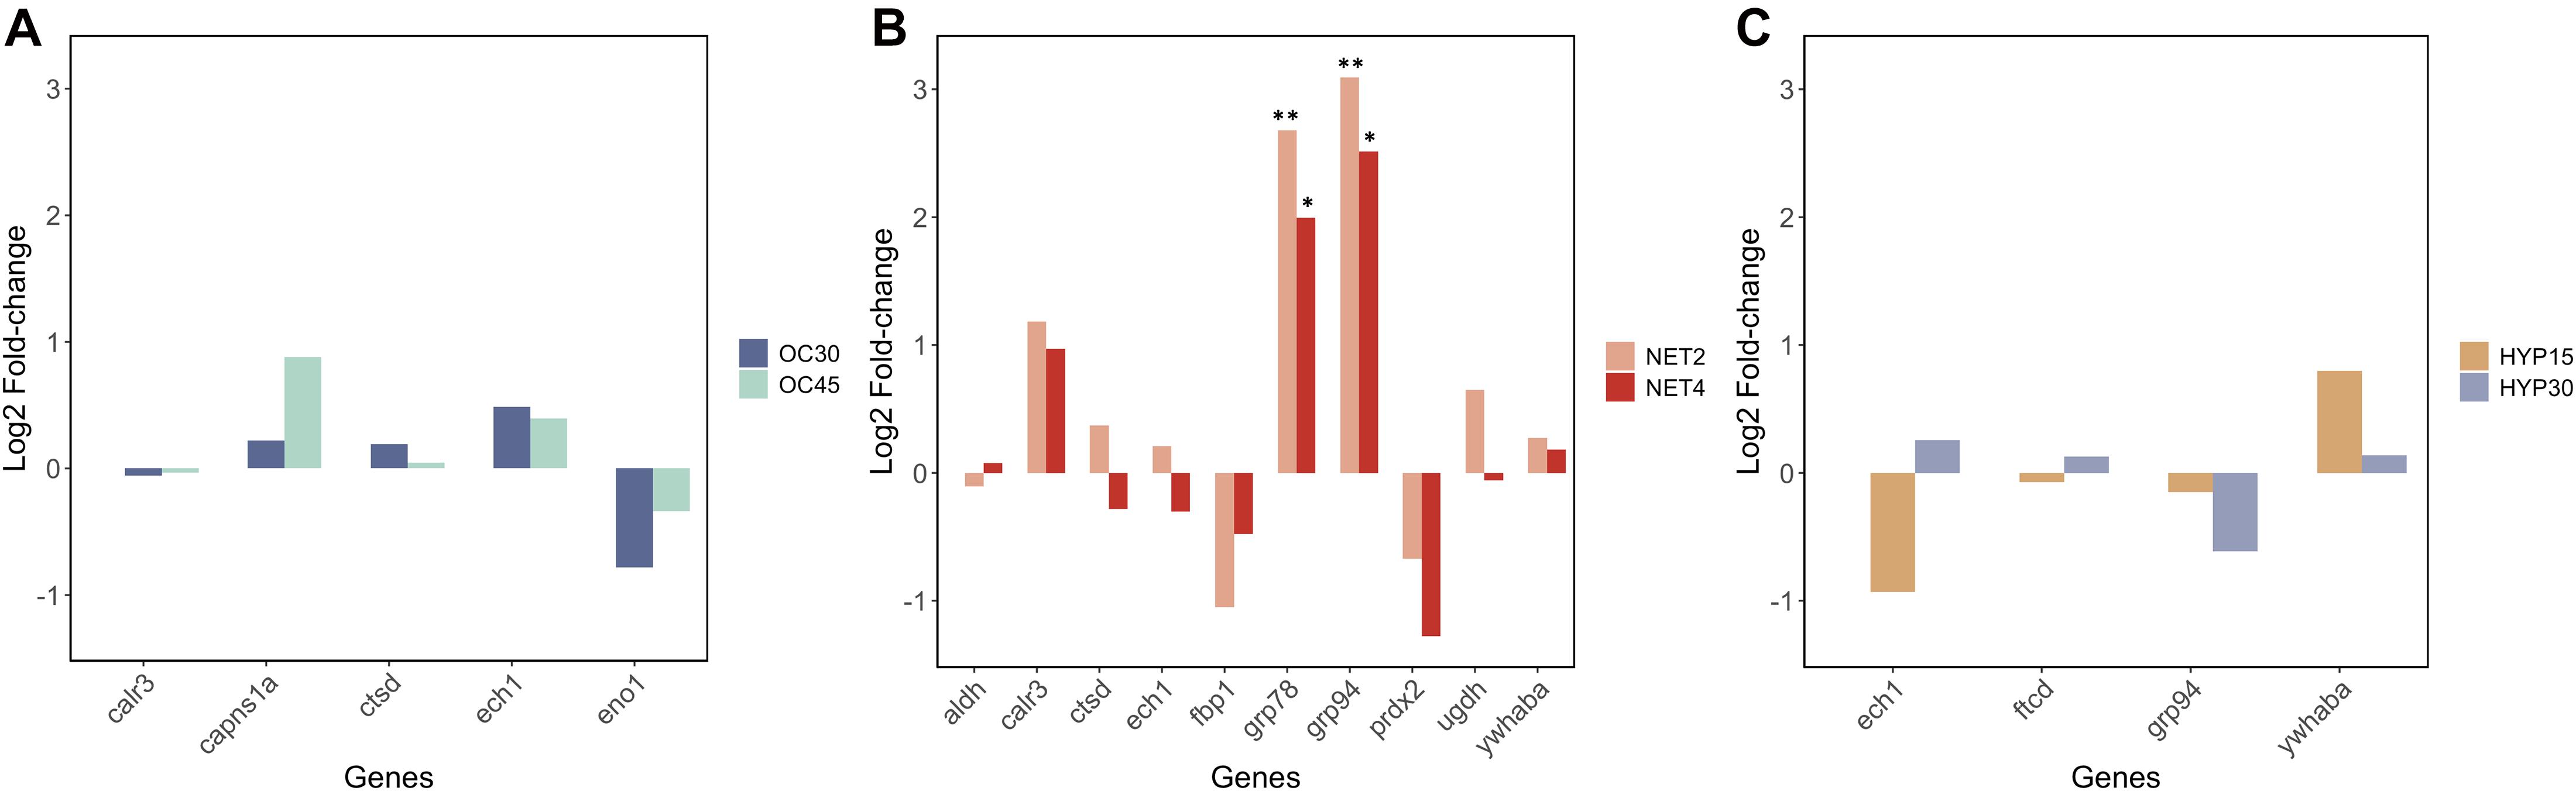
Figure 5. Expression profiles of 13 different transcripts in the liver (n = 6) of gilthead seabream (Sparus aurata) exposed to different challenges (A) OC trial, (B) NET trial, (C) HYP trial, obtained by RT-qPCR. The normalized absolute copy numbers of the target genes are presented in log2(fold-changetreated/control). Bars labeled ∗ indicate statistically significant differences when compared with the control group (One-way ANOVA, followed by Dunnett’s test, ∗p < 0.05; ∗∗p < 0.01).
Liver Glycogen Levels
Glycogen stores were assessed in the liver of gilthead seabream exposed to the different challenges using commercial kits. Statistical differences were found exclusively for the NET trial (Welch’s ANOVA, p < 0.05), between control and challenged fish from both experimental groups (Games-Howell post hoc test, NET2-CTRL: p = 0.001, NET4-CTRL: p = 0.12), whereas significantly lower levels were found in the later group (Figure 6). High dispersion of biological responses was found for the fish from OC30 (Coefficient of variation (CV) = 25.6%), NET4 (CV = 64.6%), HYP30 (CV = 43.2%) and HYP15 (CV = 46.8%).
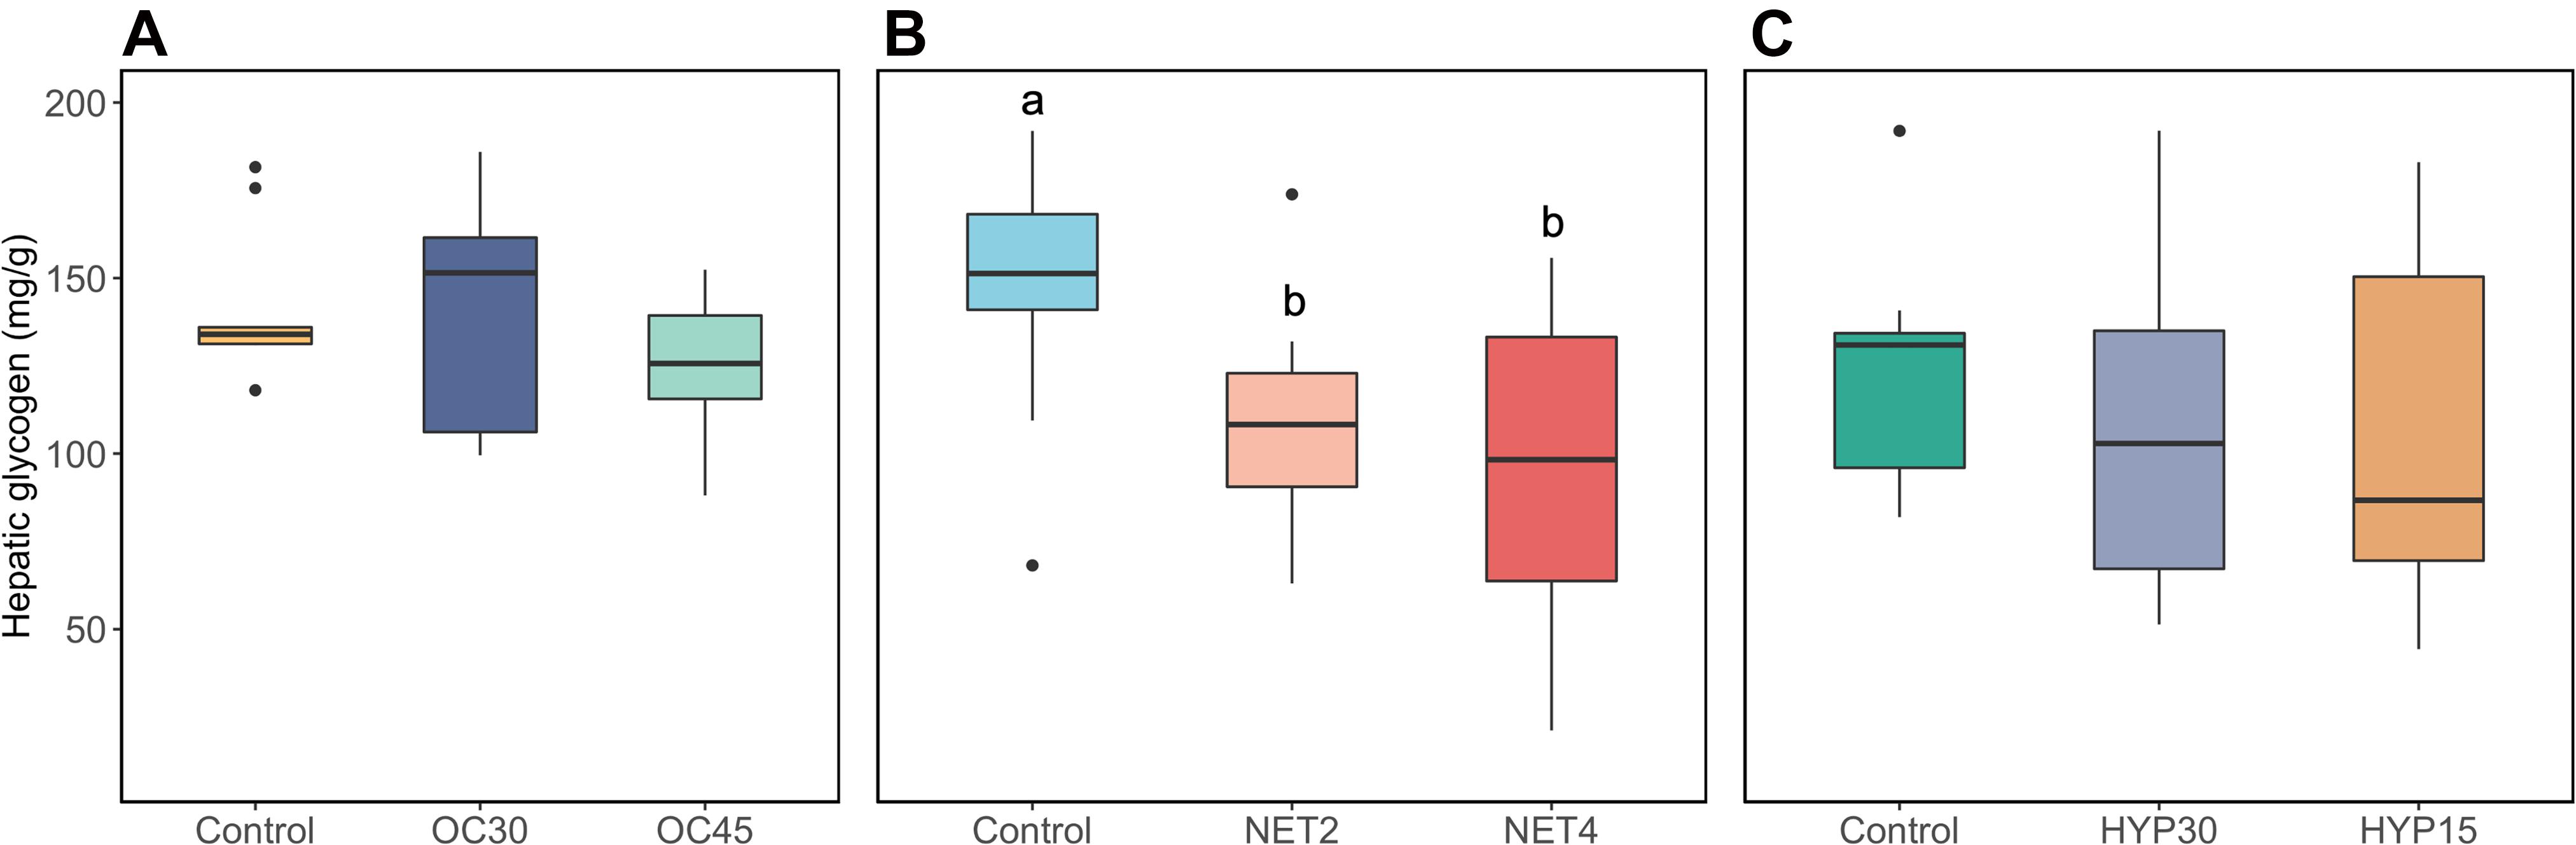
Figure 6. Boxplots showing the distribution of glycogen levels in the liver of gilthead seabream (Sparus aurata) submitted to three different challenges (A) OC trial, (B) NET trial, (C) HYP trial. The boxplots include observations (n = 9) from the 25th to the 75th percentiles as determined by R software; the horizontal line indicates the median value. Whiskers extend 1.5 times the interquartile range. Single data points represent outlying data. Lower case letters indicate statistically significant differences (p < 0.05).
Discussion
This study provides a comprehensive characterization of the liver proteome responses and related genes of gilthead seabream exposed to three different challenges, namely, overcrowding, net handling and hypoxia. Our findings demonstrate that fish respond to stress via a complex regulatory network, rather than relying on a few specific stress-related proteins. Furthermore, the different magnitude of regulatory changes observed among trials suggests a specific response influenced by its severity. This scenario is in agreement with a previous Fourier-transformed infrared spectroscopy (FTIR) exploratory analysis performed on the liver of these fish, where a metabolic reprogramming was proposed to meet the energy demands required during the physiological stress response (Raposo de Magalhães et al., 2020).
When an external challenge is perceived by the fish, the hypothalamic-pituitary-interrenal (HPI) axis in the brain is activated, initiating a physiological response which aids the fish to cope with the situation (Wendelaar Bonga, 1997). The inherent release of cortisol and catecholamines influences a diverse array of downstream biological functions, including growth, immune function, reproduction and metabolism (Pottinger, 2008). A well-studied role of cortisol in fish is the activation of specific metabolic pathways in the liver, aiming to increase the glucose production and its allocation to meet the energy requirements (Vijayan et al., 2010). After stimulation by external factors, a rapid generation of glucose occurs through glycogenolysis by the consumption of hepatic glycogen storage, while long-term production is mainly achieved through gluconeogenesis (Pankhurst, 2011). The regulation of these pathways occurs at multiple levels, such as hormonal, transcriptional and allosteric regulation, mediated by the action of insulin, glucagon and cortisol (Faught and Vijayan, 2016).
Carbohydrate Metabolism
Cortisol activates the gluconeogenic pathway in the liver by genomic and non-genomic signaling, although the former is the most well described mechanism in fish (Faught et al., 2016). It diffuses through the cell plasma membrane, binds to the glucocorticoid receptor (GR) and then translocates into the nucleus to induce the expression of gluconeogenic genes (Teles et al., 2013). Binding of other transcriptional regulators to these gene promoters is required to activate their transcription, such as those mediated by the hormone glucagon via a complex series of enzymatic reactions (Forbes et al., 2019). Plasma cortisol levels of fish handled 4 times a week (NET4 group from NET trial), published in another work (Raposo de Magalhães et al., 2020b), were significantly increased when compared with control fish. However, proteomics results from this study suggest a downregulation of gluconeogenic activity in these fish. The rate-limiting step of gluconeogenesis is the irreversible dephosphorylation of fructose 1,6-bisphosphate into fructose-6-phosphate, which is catalyzed by fructose 1,6-bisphosphatase (FBP1) (Figure 7), a key regulatory enzyme (Timson, 2019). This enzyme is tightly regulated beyond transcriptional regulation. It is inhibited by the substrate fructose 2,6-biphosphate, which it is by itself regulated by the hormone glucagon, via cyclic adenosine monophosphate (cAMP) (Enes et al., 2009). Allosterically, FBP1 is also inhibited by AMP, when adenosine triphosphate (ATP) levels are decreased, since gluconeogenesis is an energy consuming process (Gizak et al., 2012). FBP1 was significantly downregulated in the liver of NET4 fish, suggesting that gluconeogenesis was suppressed. Results from the assessment of hepatic glycogen stores (Figure 6), which show significantly decreased values in the fish from NET4 group, suggest that the glucose required for stress coping processes was most likely being produced through glycogenolysis, by the breakdown of glycogen. The elevated plasma glucose levels for these fish, previously measured and published in another work (Raposo de Magalhães et al., 2020b), support these observations. It has been described that the liver is the major organ supplying glucose to the gills and brain under situations of high energy requirement. However, it is important to note that changes in plasma glucose can be influenced by a panoply of other factors, such as diet and muscle glycogenolysis, which under stressful situations is mostly activated by catecholamines (Mommsen et al., 1999). Other proteins (DCXR, LOC570613 and UGDH) involved in the carbohydrate metabolism, specifically in the glucoronate pathway (which is within the enriched KEGG pathway named pentose and glucuronate interconversions), were significantly altered in abundance in the liver of NET4 fish. Changes in this pathway were detected in yellow drum liver, exposed to cold and/or starvation stress, to compensate for the energy deficit and convert other carbohydrates into glucose (Jiao et al., 2020).
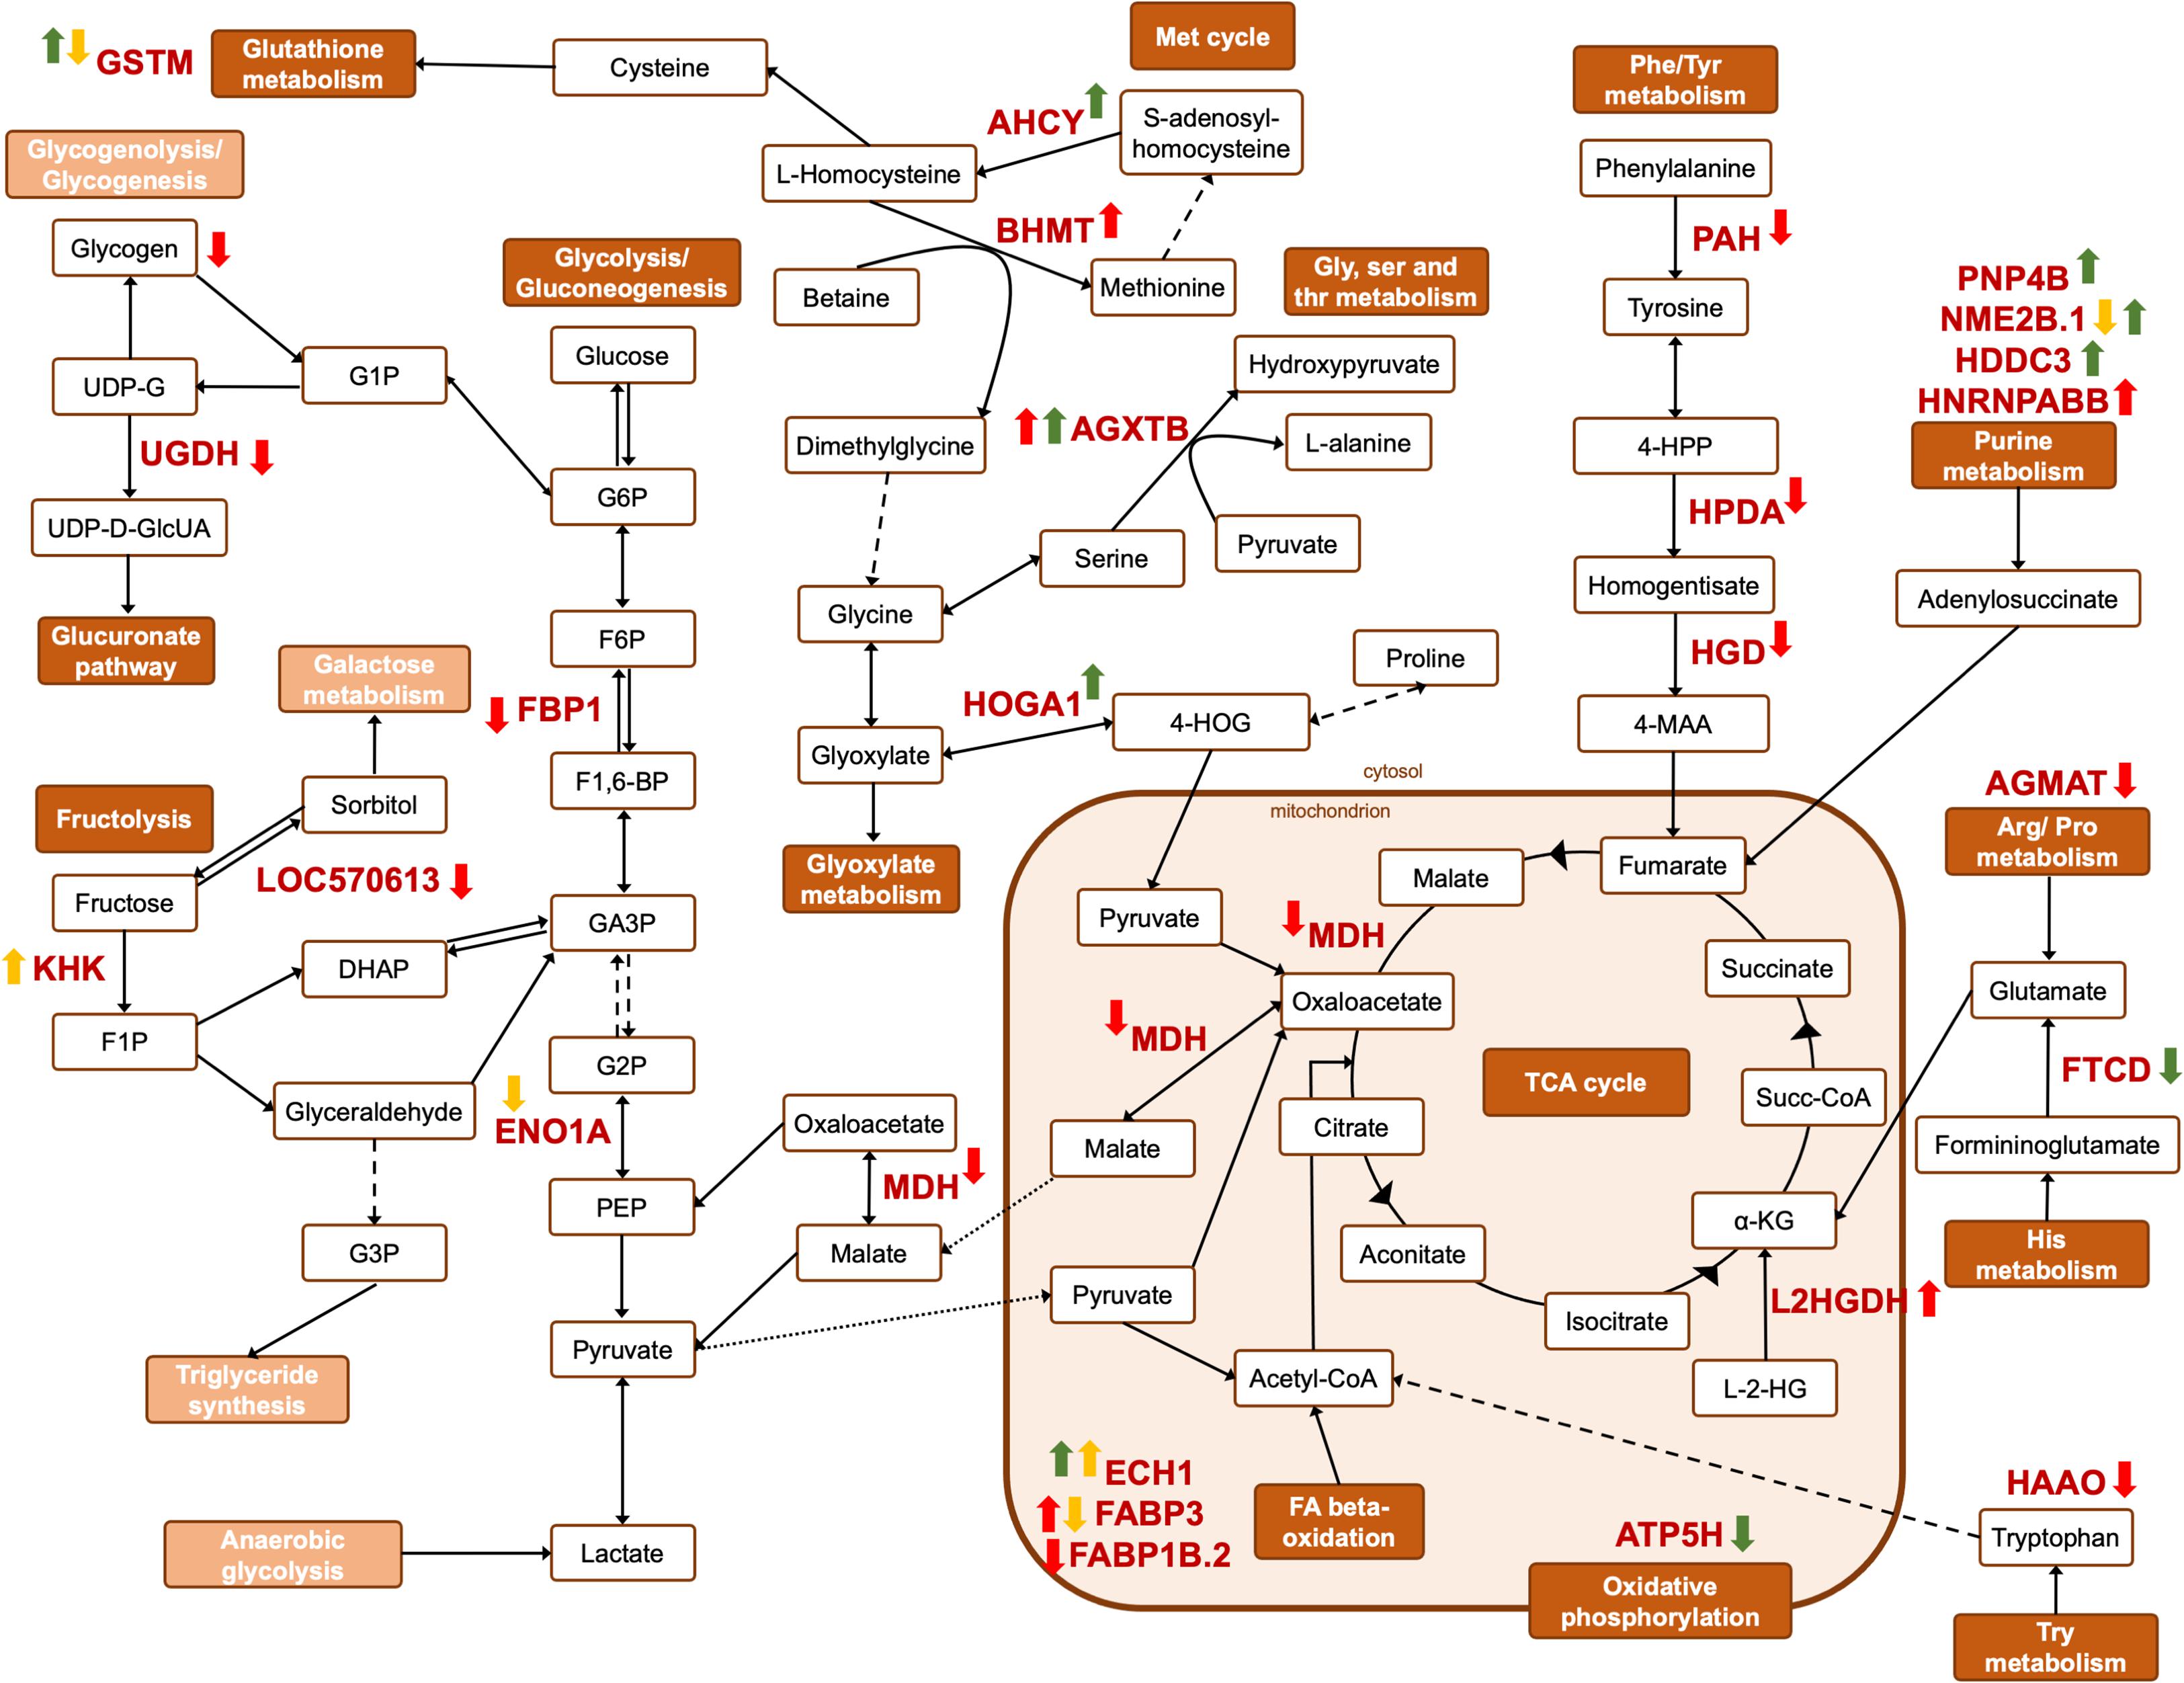
Figure 7. Schematic representation of the metabolic pathways affected by the different challenges. Yellow, red and green arrows represent differences in abundance (One-way ANOVA, followed by Dunnett’s test, p < 0.05) in the liver of Sparus aurata from OC, NET and HYP trials, respectively. Dark orange pathway names indicate affected metabolic pathways, while light orange pathway names indicate non-affected pathways. Pointed arrowed lines indicate substrate transport across the mitochondria’s membrane, while dashed arrowed lines represent more than one enzymatic reaction. α-KG, a-ketoglutarate; 4-HOG, 4-hydroxy-2-oxoglutarate; 4-HPP, 4-hydroxyphenylpyruvate; 4-MAA, 4-maleyl-2-acetoacetate; DHAP, dihydroxyacetone phosphate; F1,6-BP, fructose 1,6-biphosphate; F1P, fructose-1-phosphate; F6P, fructose-6-phosphate; GA3P, glyceraldeyde-3-phosphate; G1P, glucose-1-phosphate; G2P, glyceraldehyde-2-phosphate; G3P, glycerol-3-phosphate; G6P, glucose-6-phosphate; L-2-HG, L-2-hydroxyglutarate; PEP, phosphoenolpyruvate; UDP-D-GlcUA, UDP-D-glucuronate; UDP-G, UDP-glucose.
Similarly, in the OC trial, a repression of the gluconeogenic/glycolytic pathway appears to have occurred in challenged fish, since alpha-enolase (ENO1A), the enzyme responsible for catalyzing the interconversion of phosphoenolpyruvate into glycerate-2-phosphate, was downregulated in challenged fish (Figure 7). Previous studies on fish stress are in agreement with our observations. Chronic cortisol administration in gilthead seabream repressed the expression of the ENO1 gene (Teles et al., 2013), while in Senegalese sole, repeated handling stress induced the downregulation of the protein ENO1A (Silva et al., 2012). The RT-qPCR analysis also demonstrated a downregulation of the ENO1 and FBP1 genes, however, no statistically significant differences were found, most likely due to high biological variability in the transcript levels. Another DAP in the OC trial (significantly upregulated in the liver of fish from OC45 group), identified by the functional GO annotation in this study as being involved in the response to stimulus, is the ketohexokinase (KHK). This protein initiates the fructose metabolism by the phosphorylation of fructose into fructose 1-phosphate (Figure 7). This substrate can be further converted either into glyceraldeyde-3-phosphate, which serves as a key triose intermediate for the gluconeogenic/glycolytic pathway, or into glycerol-3-phosphate as substrate for the synthesis of triglycerides (Diggle et al., 2009). This suggests that overcrowded fish might be producing energetic resources from other alternative sources, such as by supplying triose sugars for gluconeogenesis. No significant changes were found for the plasma glucose levels in OC45 fish, when compared with control fish (published in Raposo de Magalhães et al., 2020b), although glucose can be being used by other energy-requiring tissues, such as the brain and muscle. In fact, a gel-based proteomics analysis of the muscle tissue (data not published) showed that the protein beta-enolase was significantly upregulated in these fish (log2 fold-change = 0.62; One-way ANOVA, followed by Dunnett’s test, p = 0.0369), suggesting that muscle glycolysis was most likely taking a part in glucose disposal. The significantly higher plasma lactate levels registered for these fish (published in Raposo de Magalhães et al., 2020b) indicate a potential anaerobic consumption of glucose in the muscle, which results in lactate production.
Amino Acid Metabolism
The carbohydrate and the amino acid metabolisms are intimately linked (Mommsen et al., 1999). In this study, key proteins involved in the catabolism of specific amino acids were found to be significantly downregulated mostly in fish from NET4 group, when comparing with the control group. In fact, carbohydrate metabolism and amino acid metabolism were the two overrepresented higher level KEGG pathways in the NET PPI network comprising the highest number of proteins (Figure 3D). Indeed, hepatic gluconeogenesis relies on non-carbohydrate substrates for glucose production, such as lactate, amino acids, fatty acids and glycerol. Glucogenic amino acids are thus essential precursors for gluconeogenesis and have already been described as hepatic energy fuels in fish under different stressful conditions (Vijayan et al., 2010). Notably, these can enter the gluconeogenic pathway either by conversion into pyruvate or into intermediates of the tricarboxylic acid (TCA) cycle, which, by conversion into oxaloacetate, enter the gluconeogenic pathway. The 4-hydroxyphenylpyruvate dioxygenase (HPDA) and the phenylalanine-4-hydroxylase (PAH) are two proteins involved in the phenylalanine (Phe) metabolism (Figure 7). There are two main routes by which Phe can be metabolized: oxidation to tyrosine (Tyr) and transamination to phenylpyruvate (Shafik et al., 2014). HPDA is responsible for converting phenylpyruvate into 2-hydroxy-phenylacetate, whereas PAH catalyzes the oxidation of Phe into Tyr. Both proteins were found to be downregulated in fish from NET4 group. Following the cycle, Tyr then enters the tyrosine metabolism, where HPDA also participates, being involved in the conversion of 4-hydroxy-phenylpyruvate into homogentisate (Rüetschi et al., 2000). The latter can then be converted into 4-maleyl-acetoacetate by an enzyme called homogentisate 1,2-dioxygenase (HGD) (Figure 7). However, this was also found to be downregulated in the liver of the challenged fish from our NET experiment. Downregulation of Phe and Tyr catabolism has been reported in gilthead seabream exposed to cold stress (Ibarz et al., 2010; Ghisaura et al., 2019) and hepatotoxins (Malécot et al., 2011). The substrate 4-maleyl-acetoacetate can be converted into fumarate, an intermediate of the TCA cycle. Here, fumarate is converted into malate, which is subsequently converted into oxaloacetate to enter the gluconeogenic pathway. The enzyme which reversibly catalyzes the oxidation of malate into oxaloacetate, malate-dehydrogenase (MDH) (Musrati et al., 1998), was found to be downregulated in challenged fish, thus intercepting the TCA cycle at this step (Figure 7). MDH was also found to be downregulated in the liver of rainbow trout exposed to 24 h of crowding stress (Naderi et al., 2018). Betaine-homocysteine S-methyltransferase (BHMT) was another protein found to be downregulated by stress in the liver of fish from NET4 group. It is important to mention that BHMT was identified as a differential abundant protein in 3 spots, whereas 2 were significantly up- and one was downregulated (spot no.373). However, in this last spot more than one significant identification was found. This protein exerts catalytic functions in the methionine (Met) cycle, converting L-homocysteine into Met, by transferring a methyl group from betaine. Met is a key factor in the protection of oxidative stress, reacting with a variety of reactive oxygen species (ROS) to form methionine sulphoxide (MetO), which is then reduced back to Met (Séité et al., 2018). This way, betaine is converted into dimethylglycine, a reaction likewise catalyzed by BHMT (Figure 7). Serine-pyruvate aminotransferase (AGXTB), which converts serine and pyruvate into hydroxypyruvate and alanine (Sun et al., 2019), is another DAP in the same KEGG pathway (Glycine, serine and threonine metabolism) as the last reaction mentioned. In the case of fish from NET4 group, AGXTB was found to be significantly upregulated. AGXTB was also reported to be upregulated in the kidney of rainbow trout exposed to handling stress (Krasnov et al., 2005). The proteins 3-hydroxyanthranilate 3,4-dioxygenase (HAAO), aldehyde dehydrogenase (ALDH2.2) and agmatinase (AGMAT) were other DAP involved in the amino acid metabolism, specifically in the tryptophan, and in the arginine and proline metabolism (Figure 7), which were also found to be downregulated in fish from this same group. Additionally, PAH, AGXTB and ALDH2.2 are proteins involved in the response to stimulus, according to the functional GO classification performed (Figure 3C). The downregulation of amino acid catabolic pathways in net handled fish suggests that amino acids may be being redirected toward protein synthesis.
Contrarily, in the HYP trial, the pattern of changes in protein abundance suggests an increase of amino acid catabolism. The protein 4-hydroxy-2-oxoglutarate aldolase (HOGA1) is an enzyme that catalyzes the conversion of 4-hydroxy-2-oxoglutarate into pyruvate or glyoxylate, which can enter the TCA cycle or the glyoxylate metabolism, respectively (Figure 7). Additionally, the enzyme adenosylhomocysteinase (AHCY), is involved in the Met cycle, catalyzing the reversible hydrolysis of S-adenosyl-homocysteine into adenosine and L-homocysteine (Ghisaura et al., 2014). This last intermediate of the cycle can be converted either back to methionine, or into L-cysteine, which can enter the glutathione metabolism (Figure 7). Both proteins (i.e., HOGA and AHCY) were found to be upregulated in the challenged fish from HYP trial.
Lipid Metabolism
In addition to energy repartitioning from carbohydrate metabolism, it is also well-known that stress plays a role in enhancing lipid metabolism in fish liver (Mommsen et al., 1999). Cortisol is known to enhance the lipase activity, increasing lipid catabolism and the conversion of triglycerides into glycerol and free fatty acids (FFA). However, the mechanisms behind this action in fish are not fully described (Vijayan et al., 2010). For most fish species, fatty acid (FA) beta-oxidation is the major source of energy, in the form of ATP, which occurs in the mitochondria and peroxisomes. The degradation of FAs originates acetyl-CoA, which supports gluconeogenesis, ketogenesis and ATP production through the TCA cycle (Olivares-Rubio and Vega-López, 2016). Enoyl-coA hydratase is an enzyme which participates in both the mitochondrial and the peroxisomal beta-oxidation, while Δ3,5, Δ2,4-dienoyl-CoA isomerase is an auxiliary enzyme in the degradation of unsaturated fatty acids (Poirier et al., 2006; Figure 7). Both were found to be upregulated in the liver of hypoxia-exposed fish, which is in agreement with previous studies on Nile tilapia exposed to hypoxia stress (Li et al., 2018). Similarly, in the OC trial, Δ3,5, Δ2,4-dienoyl-CoA isomerase was also found to be upregulated in the liver of overcrowded fish. Fatty-acid binding proteins (FABPs), which are implicated in the transport of these molecules to different cell compartments (Furuhashi et al., 2011), were also found to be differentially abundant in challenged fish from OC and NET trials. FABP3 was significantly downregulated in the liver of overcrowded fish, while in the NET4 group, two protein spots corresponding to this protein were identified as differently abundant, one up- and one downregulated, making impossible to infer about the expression pattern of this protein in these fish. Contrarily, FABP1B.2 was downregulated in fish from NET4 group. The observed changes in lipid metabolism, similar to the pattern of changes observed in carbohydrate metabolism, adds more weight to the different ways energetic resources can be used according to the severity of the challenge.
Antioxidant System
Reactive oxygen species (ROS) are generated as byproducts during the normal course of aerobic metabolism. ROS accumulation can lead to DNA mutation, mRNA and protein denaturation, membrane lipid peroxidation and ultimately, cell death (Bhattacharya, 2015). Generation of antioxidant proteins is the primary liver response against oxidative stress, such as Cu/Zn superoxide dismutase (SOD), peroxiredoxins (PRDX), thioredoxins (TXN) and glutathione (GSSH) system-related proteins. SOD is the first enzyme involved in ROS scavenging. It is a metalloenzyme responsible for catalyzing the dismutation of superoxide anion (O–2) into O2 and hydrogen peroxide (H2O2). Peroxiredoxins catalyze the reduction of peroxides with the help of thioredoxin (Valero et al., 2015). Glutathione-S-transferase (GST) catalyzes the conjugation of cellular components damaged by ROS with reduced glutathione (GSSH) and nicotinamide adenine dinucleotide phosphate (NADPH) (Storey, 1996). All these proteins were found to be downregulated in challenged fish from all 3 trials (GSTM in OC trial, SOD1 and PRDX2 in NET trial, and PRDX2 and TXN in HYP trial), with the exception of GSTM in hypoxia-exposed fish which was upregulated. The transcription levels of SOD1 were also found to be decreased in Atlantic cod exposed to hypoxia (Olsvik et al., 2006), while gilthead seabream exposed to cold stress also showed a decreased abundance of TXN (Ghisaura et al., 2019). This might suggest that FA beta-oxidation, in fish from overcrowding and hypoxia stress, occurred mainly in the mitochondria and not in the peroxisome, since the main byproduct of peroxisomal beta-oxidation would be H2O2 (Poirier et al., 2006). Moreover, as previously proposed, dysfunction of the ability to detoxify is itself a reflection of oxidative stress (Banh et al., 2016; Nuez-Ortín et al., 2018). This hypothesis is also supported in NET trial by the downregulation of BHMT which is responsible for maintaining steady levels of the glutathione precursor S-adenosylmethionine and preventing homocysteine accumulation (Obeid, 2013). Additionally, reduction in the abundance of ALDH2.2, which is an important protein in the detoxification of aldehydes (Xiao et al., 2009), may aggravate the effects of potential oxidative stress in fish from NET4 group. Nevertheless, the secondary response to oxidative stress, characterized by the increased abundance of chaperones, was activated.
Cellular Stress Response
In the current study, a broad-scale increase in abundance of chaperones and stress response proteins was observed in response to net handling and overcrowding challenges, whereas the majority was involved in the unfolded protein response (UPR). When there is an excessive accumulation of unfolded and/or misfolded proteins in the endoplasmic reticulum (ER) (ER stress), the UPR is activated to mitigate the situation and avoid apoptosis. This process can thus be interpreted as a quality control of protein conformation, whereas the correctly folded proteins are exported to the Golgi complex. In contrast, incorrectly proteins are retained at ER for refolding, by heat shock proteins, or targeted for proteasome-mediated degradation (Ji and Kaplowitz, 2006). The widely studied heat shock protein (HSP) family is composed of proteins with a cytoprotective role that are involved in protein refolding and assembly (Roberts et al., 2010). These proteins are usually upregulated in fish tissues in response to an array of different stressors (Iwama et al., 2004; Vijayan et al., 2010). In our study, two different HSPs were significantly upregulated in the liver of net handled fish, the 78 kDa glucose-regulated protein (HSPA5/GRP78) and the 94 kDa glucose-regulated protein (HSP90B/GRP94). Regarding HSPA5, 3 spots were detected as DAP, whereas only one presented downregulation in challenged fish (spot no. 319). However, more than one protein were significantly identified in this spot. This same increased regulation was also verified at the transcript level, whereas the RT-qPCR analysis of the corresponding gene expression showed statistically significant differences in GRP78 and GRP94 genes, between the challenged and the control fish from NET trial (Figure 5B). The close relation of HSP90 with GR is well established in mammals. In teleosts, HSP90 was proposed to increase the stability of GR before it binds to cortisol (Sathiyaa and Vijayan, 2003). Moreover, in vitro exposure of rainbow trout hepatocytes to cortisol showed an upregulation of HSP90 (Aluru and Vijayan, 2007). The high plasma cortisol levels observed in net handled fish, published in another work (Raposo de Magalhães et al., 2020b), corroborates the transcript and corresponding proteins changes observed in this study. Calreticulin (CALR) together with protein-disulfide isomerases (PDI) are also involved in UPR (Grek and Townsend, 2013). CLR is the major calcium-binding protein of the ER (Kales et al., 2007). P4HB, PDIA3 and PDIP5 are different isoforms of the protein-disulfide isomerase family and play a crucial role in catalyzing disulfide bond formation (Grek and Townsend, 2013). These chaperones were significantly upregulated in challenged fish from NET trial, while CALR was likewise upregulated in challenged fish from OC trial. However, differential abundance of proteasome degradation proteins suggests that protein degradation was inhibited in net handled fish, since 26S protease regulatory subunit 6B (PSMC4) was downregulated. In hypoxia-exposed fish, no conclusive hypothesis can be generated since two isoforms of proteasome degradation proteins were identified, being one upregulated (PSMB3 and PSME2) and the other downregulated (PSMB2). Downregulation of proteasome degradation proteins was reported in the liver proteome of Atlantic cod following exposure to elevated temperatures (Nuez-Ortín et al., 2018). Contrarily, in overcrowded fish, proteasome subunit beta type-6 (PSMB6) and cathepsin (CTSD), a lysosomal protein also responsible for protein degradation, were found to be upregulated. CTSD was previously reported to be upregulated in the liver of trout following an acute stressor (Wiseman et al., 2007) and after a cortisol treatment (Aluru and Vijayan, 2007). These significant changes in the chaperones’ abundance suggest that the high intensity of these challenges might have compromised the antioxidant defense barrier but enhanced the expression of heat shock proteins since oxidative stress may damage proteins.
Protein Synthesis
Other proteins showing significant changes in abundance levels were related to the purine and pyrimidine metabolism, including nucleoside-diphosphate kinase (NME2B.1), purine nucleoside phosphorylase (PNP4B) and guanosine-3′,5′-bis(diphosphate) 3′-pyrophosphohydrolase (HDDC3), to transcription [heterogeneous nuclear ribonucleoprotein (HNRNPABB)], and translation, such as elongation factor-1-beta (EEF1B2), eukaryotic translation initiation factor 5A (EIF5A), 60S acidic ribosomal protein P2 (RPLP2) and ribosomal 40S subunit (RPSA), all undergoing upregulation to different extents in NET and HYP trials, thus indicating an overall increase in protein synthesis.
Conclusion, Limitations and Future Directions
Our study demonstrates that the metabolic shift occurring in gilthead seabream liver, in order to cope with a challenge and restore homeostasis, comprises an intricately complex network of proteins involved in different but coordinated metabolic pathways and cellular processes. Long-term exposure to repetitive net handling, coupled with air exposure, was associated with significantly perturbed carbohydrate metabolism and amino acid catabolism, and ER stress. The latter was also associated with overcrowded fish, although to a lower extent, together with alterations in lipid metabolism. In contrast, a shorter-term challenge (hypoxia) induced a different rearrangement of the stress response. However, considering the number of DAP, net handling was undoubtedly the stressor that caused the highest impact on the liver proteome response. Additionally, two genes were found to be differently expressed in net-handled fish. However, a high variability was verified within the same group, which could be associated to individual biology or sample processing differences. Undeniably, a broader transcriptomic approach would be necessary to evaluate the direct activity of the genome under the conditions tested. Collectively, results suggest a response influenced mainly by the severity of the challenge, which appeared to be tightly associated with the plasma glucocorticoid levels. Differences in the circulating levels of cortisol could explain the different magnitude of proteome alterations after exposure to a continuous (overcrowding) and a repetitive (net handling) challenge. A possible habituation or exhaustion and desensitization by the overcrowded fish can skew interpretation of a “stressed state.” Finally, this work demonstrates the potential of proteomics approaches for the study of protein interactions and their roles in the mounting of the adaptive response to stress. Additionally, it provides a set of proteins that could be further investigated as novel stress markers to complement the currently used stress indicators. However, this data needs to be thoroughly validated before inferring about potential candidate biomarkers. Further integration of other omics modalities could provide a complete picture of the underlying biology behind the stress response modulation, across multiple organizational levels. Establishing, as accurately as possible, resting levels of the desired markers and study the link between the quantification of the stress response with fitness traits and fish performance metrics would also be necessary. Nonetheless, this will provide a complementary approach to classical physiological and behavioral observations for the future development of a multidisciplinary welfare assessment.
Data Availability Statement
The mass spectrometry proteomics data have been deposited to the ProteomeXchange Consortium via the PRIDE partner repository with the dataset identifier PXD024804 (http://www.ebi.ac.uk/pride/archive/projects/PXD024804).
Ethics Statement
The animal study was reviewed and approved by the ORBEA Animal Welfare Committee of CCMAR and the Portuguese National Authority for the Animal Health (DGAV) on August 26th, 2019 with number 014833.
Author Contributions
CM carried out the animal experiments, the proteomics and gene expression analyses, performed the bioinformatic and statistical analyses and wrote the manuscript. DS assisted with the animal experiments and the proteomics analysis. CN and SB performed the gene expression analysis. DR, AK, and SP performed the mass spectrometry analyses and participated in the interpretation. MC designed and assisted with the animal experiments and was a major contribution to the paper’s writing. RC assisted with the animal experiments and the hepatic glycogen assessment. AF advised and assisted on the data bioinformatic and statistical analyses. PR designed the experiments and was a major contribution to the paper’s writing. All authors provided a critical review and gave final approval for publication, agreeing to be held accountable for the work performed therein.
Funding
This study was supported by Portuguese national funds from FCT - Foundation for Science and Technology through project UIDB/04326/2020 and the project WELFISH (Refa 16-02-05-FMP-12, “Establishment of Welfare Biomarkers in farmed fish using a proteomics approach”), financed by Mar2020, in the framework of the programme Portugal 2020. CM acknowledges an FCT scholarship, Refa SFRH/BD/138884/2018, and an EURASTiP exchange grant, funded by the project “Promoting Multi-Stakeholder Contributions to International Cooperation on Sustainable Solutions for Aquaculture Development in South-East Asia” (ID: 728030) within the EU Horizon 2020 programme “H2020-EU.3.2.3. - Unlocking the potential of aquatic living resources”. DS acknowledges an FCT scholarship, Refa SFRH/BD/136319/2018.
Conflict of Interest
The authors declare that the research was conducted in the absence of any commercial or financial relationships that could be construed as a potential conflict of interest.
Acknowledgments
The authors would like to thank Araya Jangprai and Khanakorn Phonsiri, from the School of Animal Production Technology, Institute of Agricultural Technology, Suranaree University of Technology for their assistance during gene expression analysis.
Supplementary Material
The Supplementary Material for this article can be found online at: https://www.frontiersin.org/articles/10.3389/fmars.2021.676189/full#supplementary-material
Footnotes
- ^ http://totallab.com/samespots/
- ^ http://us.expasy.org/tools/protparam.html
- ^ https://www.r-project.org
- ^ https://www.biobam.com/omicsbox/
- ^ https://string-db.org/
- ^ http://www.cytoscape.org/
- ^ https://www.genscript.com/tools/pcr-primers-designer
- ^ https://genetyx.co.jp
- ^ https://www.heartcure.com.au/reffinder/
References
Aluru, N., and Vijayan, M. M. (2007). Hepatic transcriptome response to glucocorticoid receptor activation in rainbow trout. Physiol. Genomics 31, 483–491. doi: 10.1152/physiolgenomics.00118.2007
Andersen, C. L., Jensen, J. L., and Ørntoft, T. F. (2004). Normalization of real-time quantitative reverse transcription-pcr data: a model-based variance estimation approach to identify genes suited for normalization, applied to bladder and colon cancer data sets. Cancer Res. 64, 5245–5250. doi: 10.1158/0008-5472.CAN-04-0496
Ashley, P. J. (2007). Fish welfare: current issues in aquaculture. Appl. Anim. Behav. Sci. 104, 199–235. doi: 10.1016/J.APPLANIM.2006.09.001
Banh, S., Wiens, L., Sotiri, E., and Treberg, J. R. (2016). Mitochondrial reactive oxygen species production by fish muscle mitochondria: potential role in acute heat-induced oxidative stress. Comp. Biochem. Physiol. B Biochem. Mol. Biol. 191, 99–107. doi: 10.1016/j.cbpb.2015.10.001
Bhattacharya, S. (2015). “Reactive oxygen species and cellular defense system,” in Free Radicals in Human Health and Disease, eds V. Rani and U. C. Yadav (Cham: Springer).
Blighe, K., Rana, S., and Lewis, M. (2021). EnhancedVolcano: Publication-Ready Volcano Plots with Enhanced Colouring and Labeling. R Packag. Version 1.6.0.
Boonstra, R. (2013). Reality as the leading cause of stress: rethinking the impact of chronic stress in nature. Funct. Ecol. 27, 11–23. doi: 10.1111/1365-2435.12008
Carenzi, C., and Verga, M. (2009). Animal welfare: review of the scientific concept and definition. Ital. J. Anim. Sci. 8, 21–30. doi: 10.4081/ijas.2009.s1.21
Causey, D. R., Pohl, M. A., Stead, D. A., Martin, M., Secombes, C. J., and Macqueen, D. J. (2018). High-throughput proteomic profiling of the fish liver following bacterial infection. BMC Genomics 19:719. doi: 10.1186/s12864-018-5092-0
Conesa, A., Götz, S., García-Gómez, J. M., Terol, J., Talón, M., and Robles, M. (2005). Blast2GO: a universal tool for annotation, visualization and analysis in functional genomics research. Bioinformatics 21, 3674–3676. doi: 10.1093/bioinformatics/bti610
Conte, F. S. (2004). Stress and the welfare of cultured fish. Appl. Anim. Behav. Sci. 86, 205–223. doi: 10.1016/j.applanim.2004.02.003
Cowan, M. L., and Vera, J. (2008). Proteomics: advances in biomarker discovery. Expert Rev. Proteomics 5, 21–23. doi: 10.1586/14789450.5.1.21
Diggle, C. P., Shires, M., Leitch, D., Brooke, D., Carr, I. M., Markham, A. F., et al. (2009). Ketohexokinase: expression and localization of the principal fructose-metabolizing enzyme. J. Histochem. Cytochem. 57, 763–774. doi: 10.1369/jhc.2009.953190
Enes, P., Panserat, S., Kaushik, S., and Oliva-Teles, A. (2009). Nutritional regulation of hepatic glucose metabolism in fish. Fish Physiol. Biochem. 35, 519–539. doi: 10.1007/s10695-008-9259-5
Eslamloo, K., Akhavan, S. R., Fallah, F. J., and Henry, M. A. (2014). Variations of physiological and innate immunological responses in goldfish (Carassius auratus) subjected to recurrent acute stress. Fish Shellfish Immunol. 37, 147–153. doi: 10.1016/j.fsi.2014.01.014
Fabbri, E., and Moon, T. W. (2016). Adrenergic signaling in teleost fish liver, a challenging path. Comp. Biochem. Physiol. B Biochem. Mol. Biol. 199, 74–86. doi: 10.1016/J.CBPB.2015.10.002
Faught, E., Aluru, N., and Vijayan, M. M. (2016). “The molecular stress response,” in Biology of Stress in Fish: Fish Physiology, eds C. B. Schreck, L. Tort, A. P. Farrell, and C. J. Brauner (London, UK: Academic Press – Elsevier), 113–166.
Faught, E., and Vijayan, M. M. (2016). Mechanisms of cortisol action in fish hepatocytes. Comp. Biochem. Physiol. B Biochem. Mol. Biol. 199, 136–145. doi: 10.1016/j.cbpb.2016.06.012
Forbes, J. L. I., Kostyniuk, D. J., Mennigen, J. A., and Weber, J. M. (2019). Glucagon regulation of carbohydrate metabolism in rainbow trout: in vivo glucose fluxes and gene expression. J. Exp. Biol. 222:jeb211730. doi: 10.1242/jeb.211730
Furuhashi, M., Ishimura, S., Ota, H., and Miura, T. (2011). Lipid chaperones and metabolic inflammation. Int. J. Inflam. 2011, 1–12. doi: 10.4061/2011/642612
Galhardo, L., Oliveira, R. F., and Galhardo Oliveira, R. F. L. (2009). Psychological stress and welfare in fish. Annu. Rev. Biomed. Sci. 11, 1–20.
Gandar, A., Laffaille, P., Marty-Gasset, N., Viala, D., Molette, C., and Jean, S. (2017). Proteome response of fish under multiple stress exposure: effects of pesticide mixtures and temperature increase. Aquat. Toxicol. 184, 61–77. doi: 10.1016/j.aquatox.2017.01.004
Ghisaura, S., Anedda, R., Pagnozzi, D., Biosa, G., Spada, S., Bonaglini, E., et al. (2014). Impact of three commercial feed formulations on farmed gilthead sea bream (Sparus aurata, L.) metabolism as inferred from liver and blood serum proteomic. Proteome Sci. 12:44. doi: 10.1186/s12953-014-0044-3
Ghisaura, S., Pagnozzi, D., Melis, R., Biosa, G., Slawski, H., Uzzau, S., et al. (2019). Liver proteomics of gilthead sea bream (Sparus aurata) exposed to cold stress. J. Therm. Biol. 82, 234–241. doi: 10.1016/j.jtherbio.2019.04.005
Gizak, A., Sok, A. J., Lipinska, A., Zarzycki, M., Rakus, D., and Dzugaj, A. (2012). A comparative study on the sensitivity of Cyprinus carpio muscle and liver FBPase toward AMP and calcium. Comp. Biochem. Physiol. B Biochem. Mol. Biol. 162, 51–55. doi: 10.1016/j.cbpb.2012.03.001
Grek, C., and Townsend, D. M. (2013). Protein disulfide isomerase superfamily in disease and the regulation of apoptosis. Endoplasmic Reticulum Stress Dis. 1, 4–17. doi: 10.2478/ersc-2013-0001
Huntingford, F. A., Adams, C., Braithwaite, V. A., Kadri, S., Pottinger, T. G., Sandoe, P., et al. (2006). Current issues in fish welfare. J. Fish Biol. 68, 332–372. doi: 10.1111/j.0022-1112.2006.001046.x
Ibarz, A., Martín-Pérez, M., Blasco, J., Bellido, D., De Oliveira, E., and Fernández-Borràs, J. (2010). Gilthead sea bream liver proteome altered at low temperatures by oxidative stress. Proteomics 10, 963–975. doi: 10.1002/pmic.200900528
Iwama, G. K., Afonso, L. O. B., Todgham, A., Ackerman, P., and Nakano, K. (2004). Are hsps suitable for indicating stressed states in fish? J. Exp. Biol. 207, 15–19. doi: 10.1242/jeb.00707
Iwama, G. K., Afonso, L. O. B., and Vijayan, M. M. (2006). “Stress in fish,” in Physiology of Fishes, eds D. H. Evans and J. B. Claiborne (Boca Ratón, FL: CRC, Taylor & Francis), 320–342.
Ji, C., and Kaplowitz, N. (2006). ER stress: can the liver cope? J. Hepatol. 45, 321–333. doi: 10.1016/j.jhep.2006.06.004
Jiao, S., Nie, M., Song, H., Xu, D., and You, F. (2020). Physiological responses to cold and starvation stresses in the liver of yellow drum (Nibea albiflora) revealed by LC-MS metabolomics. Sci. Total Environ. 715:136940.
Kales, S. C., Bols, N. C., and Dixon, B. (2007). Calreticulin in rainbow trout: a limited response to endoplasmic reticulum (ER) stress. Comp. Biochem. Physiol. B Biochem. Mol. Biol. 147, 607–615. doi: 10.1016/j.cbpb.2007.04.002
Korte, S. M., Olivier, B., and Koolhaas, J. M. (2007). A new animal welfare concept based on allostasis. Physiol. Behav. 92, 422–428. doi: 10.1016/j.physbeh.2006.10.018
Krasnov, A., Koskinen, H., Pehkonen, P., Rexroad, C. E., Afanasyev, S., and Mölsä, H. (2005). Gene expression in the brain and kidney of rainbow trout in response to handling stress. BMC Genomics 6:3. doi: 10.1186/1471-2164-6-3
Li, M., Wang, X., Qi, C., Li, E., Du, Z., Qin, J. G., et al. (2018). Metabolic response of Nile tilapia (Oreochromis niloticus) to acute and chronic hypoxia stress. Aquaculture 495, 187–195. doi: 10.1016/j.aquaculture.2018.05.031
Mahanty, A., Purohit, G. K., Banerjee, S., Karunakaran, D., Mohanty, S., and Mohanty, B. P. (2016). Proteomic changes in the liver of Channa striatus in response to high temperature stress. Electrophoresis 37, 1704–1717. doi: 10.1002/elps.201500393
Malécot, M., Marie, A., Puiseux-Dao, S., and Edery, M. (2011). ITRAQ-based proteomic study of the effects of microcystin-LR on medaka fish liver. Proteomics 11, 2071–2078. doi: 10.1002/pmic.201000512
Marco-Ramell, A., de Almeida, A. M., Cristobal, S., Rodrigues, P., Roncada, P., and Bassols, A. (2016). Proteomics and the search for welfare and stress biomarkers in animal production in the one-health context. Mol. Biosyst. 12, 2024–2035. doi: 10.1039/C5MB00788G
Matos, E., Dias, J., Dinis, M. T., and Silva, T. S. (2017). Sustainability vs. Quality in gilthead seabream (Sparus aurata L.) farming: are trade-offs inevitable? Rev. Aquac. 9, 388–409. doi: 10.1111/raq.12144
Mommsen, T. P., Vijayan, M. M., and Moon, T. W. (1999). Cortisol in teleosts: dynamics, mechanisms of action, and metabolic regulation. Rev. Fish Biol. Fish. 9, 211–268.
Musrati, R. A., Kollárová, M., Mernik, N., and Mikulášová, D. (1998). Malate dehydrogenase: distribution, function and properties. Gen. Physiol. Biophys. 17, 193–210.
Naderi, M., Keyvanshokooh, S., Ghaedi, A., and Salati, A. P. (2018). Effect of acute crowding stress on rainbow trout (Oncorhynchus mykiss): a proteomics study. Aquaculture 495, 106–114. doi: 10.1016/J.AQUACULTURE.2018.05.038
Nuez-Ortín, W. G., Carter, C. G., Nichols, P. D., Cooke, I. R., and Wilson, R. (2018). Liver proteome response of pre-harvest Atlantic salmon following exposure to elevated temperature. BMC Genomics 19:133. doi: 10.1186/s12864-018-4517-0
Obeid, R. (2013). The metabolic burden of methyl donor deficiency with focus on the betaine homocysteine methyltransferase pathway. Nutrients 5, 3481–3495. doi: 10.3390/nu5093481
Olivares-Rubio, H. F., and Vega-López, A. (2016). Fatty acid metabolism in fish species as a biomarker for environmental monitoring. Environ. Pollut. 218, 297–312. doi: 10.1016/J.ENVPOL.2016.07.005
Olsvik, P. A., Kristensen, T., Waagbø, R., Tollefsen, K. E., Rosseland, B. O., and Toften, H. (2006). Effects of hypo- and hyperoxia on transcription levels of five stress genes and the glutathione system in liver of Atlantic cod Gadus morhua. J. Exp. Biol. 209, 2893–2901. doi: 10.1242/jeb.02320
Pankhurst, N. W. (2011). The endocrinology of stress in fish: an environmental perspective. Gen. Comp. Endocrinol. 170, 265–275. doi: 10.1016/J.YGCEN.2010.07.017
Pédron, N., Artigaud, S., Infante, J.-L. Z., Le Bayon, N., Charrier, G., Pichereau, V., et al. (2017). Proteomic responses of European flounder to temperature and hypoxia as interacting stressors: differential sensitivities of populations. Sci. Total Environ. 586, 890–899. doi: 10.1016/j.scitotenv.2017.02.068
Perez-Riverol, Y., Csordas, A., Bai, J., Bernal-Llinares, M., Hewapathirana, S., Kundu, D. J., et al. (2019). The PRIDE database and related tools and resources in 2019: improving support for quantification data. Nucleic Acids Res. 47, D442–D450. doi: 10.1093/nar/gky1106
Pfaffl, M. W., Tichopad, A., Prgomet, C., and Neuvians, T. P. (2004). Determination of stable housekeeping genes, differentially regulated target genes and sample integrity: bestKeeper - Excel-based tool using pair-wise correlations. Biotechnol. Lett. 26, 509–515. doi: 10.1023/B:BILE.0000019559.84305.47
Poirier, Y., Antonenkov, V. D., Glumoff, T., and Hiltunen, J. K. (2006). Peroxisomal β-oxidation-A metabolic pathway with multiple functions. Biochim. Biophys. Acta Mol. Cell Res. 1763, 1413–1426. doi: 10.1016/j.bbamcr.2006.08.034
Pottinger, T. G. (2008). “The stress response in fish-mechanisms, effects and measurement,” in Fish Welfare, ed. E. J. Branson (Oxford, UK: Blackwell Publishing Ltd), 32–48.
Raposo de Magalhães, C., Carrilho, R., Schrama, D., Cerqueira, M., Rosa, A. M., and Rodrigues, P. M. (2020). Mid-infrared spectroscopic screening of metabolic alterations in stress - exposed gilthead seabream (Sparus aurata). Sci. Rep. 10:16343. doi: 10.1038/s41598-020-73338-z
Raposo de Magalhães, C., Cerqueira, M., Schrama, D., Moreira, M., Boonanuntanasarn, S., and Rodrigues, P. M. L. (2020a). A Proteomics and other Omics approach in the context of farmed fish welfare and biomarker discovery. Rev. Aquac. 12, 122–144. doi: 10.1111/raq.12308
Raposo de Magalhães, C., Schrama, D., Farinha, A. P., Revets, D., Kuehn, A., Planchon, S., et al. (2020b). Protein changes as robust signatures of fish chronic stress: a proteomics approach to fish welfare research. BMC Genomics 21:309. doi: 10.1186/s12864-020-6728-4
Roberts, R. J., Agius, C., Saliba, C., Bossier, P., and Sung, Y. Y. (2010). Heat shock proteins (chaperones) in fish and shellfish and their potential role in relation to fish health: a review. J. Fish Dis. 33, 789–801. doi: 10.1111/j.1365-2761.2010.01183.x
Rüetschi, U., Cerone, R., Pérez-Cerda, C., Schiaffino, M. C., Standing, S., Ugarte, M., et al. (2000). Mutations in the 4-hydroxyphenylpyruvate dioxygenase gene (HPD) in patients with tyrosinemia type III. Hum. Genet. 106, 654–662. doi: 10.1007/s004390050039
Sathiyaa, R., and Vijayan, M. M. (2003). Autoregulation of glucocorticoid receptor by cortisol in rainbow trout hepatocytes. Am. J. Physiol. Cell. Physiol. 284, C1508–C1515. doi: 10.1152/ajpcell.00448.2002
Séité, S., Mourier, A., Camougrand, N., Salin, B., Figueiredo-Silva, A. C., Fontagné-Dicharry, S., et al. (2018). Dietary methionine deficiency affects oxidative status, mitochondrial integrity and mitophagy in the liver of rainbow trout (Oncorhynchus mykiss). Sci. Rep. 8, 1–14. doi: 10.1038/s41598-018-28559-8
Shafik, M., Ibrahime, H., Elyazeid, I. A., Abass, O., and Saad, H. M. (2014). The stress of phenylalanine on rats to study the phenylketonuria at biochemical and molecular level. J. Appl. Pharm. Sci. 4, 24–29. doi: 10.7324/JAPS.2014.40405
Silva, T. S., Cordeiro, O. D., Matos, E. D., Wulff, T., Dias, J. P., Jessen, F., et al. (2012). Effects of preslaughter stress levels on the post-mortem sarcoplasmic proteomic profile of gilthead seabream muscle. J. Agric. Food Chem. 60, 9443–9453. doi: 10.1021/jf301766e
Silver, N., Best, S., Jiang, J., and Thein, S. L. (2006). Selection of housekeeping genes for gene expression studies in human reticulocytes using real-time PCR. BMC Mol. Biol. 7:33. doi: 10.1186/1471-2199-7-33
Storey, K. B. (1996). Oxidative stress: animal adaptations in nature. Braz. J. Med. Biol. Res. 29, 1715–1733.
Sun, Y., Li, W., Shen, S., Yang, X., Lu, B., Zhang, X., et al. (2019). Loss of alanine-glyoxylate and serine-pyruvate aminotransferase expression accelerated the progression of hepatocellular carcinoma and predicted poor prognosis. J. Transl. Med. 17, 1–16. doi: 10.1186/s12967-019-02138-5
Teles, M., Boltaña, S., Reyes-López, F., Santos, M. A., Mackenzie, S., and Tort, L. (2013). Effects of chronic cortisol administration on global expression of GR and the liver transcriptome in Sparus aurata. Mar. Biotechnol. 15, 104–114. doi: 10.1007/s10126-012-9467-y
Timson, D. J. (2019). Fructose 1, 6- bis phosphatase: getting the message across. Biosci. Rep. 39:BSR20190124. doi: 10.1042/BSR20190124
Valero, Y., Martínez-Morcillo, F. J., Esteban, M. Á, Chaves-Pozo, E., and Cuesta, A. (2015). Fish peroxiredoxins and their role in immunity. Biology 4, 860–880. doi: 10.3390/biology4040860
Vandesompele, J., De Preter, K., Pattyn, F., Poppe, B., Van Roy, N., De Paepe, A., et al. (2002). Accurate normalization of real-time quantitative RT-PCR data by geometric averaging of multiple internal control genes. Genome Biol. 3, .1–.0034.
Vijayan, M. M., Aluru, N., and Leatherland, J. F. (2010). “Stress response and the role of cortisol,” in Fish Diseases and Disorders, Vol 2: Non-Infectious Disorders, eds J. F. Leatherland and P. Woo (Oxfordshire: CAB International), 182–201.
Warnes, G. R., Bolker, B., Bonebakker, L., Gentleman, R., Huber, W., Liaw, A., et al. (2020). gplots: Various R Programming Tools for Plotting Data. R Packag. version 3.1.1.
Wiseman, S., Osachoff, H., Bassett, E., Malhotra, J., Bruno, J., VanAggelen, G., et al. (2007). Gene expression pattern in the liver during recovery from an acute stressor in rainbow trout. Comp. Biochem. Physiol. D Genomics Proteomics 2, 234–244. doi: 10.1016/j.cbd.2007.04.005
Xiao, T., Shoeb, M., Siddiqui, M. S., Zhang, M., Ramana, K. V., Srivastava, S. K., et al. (2009). Molecular cloning and oxidative modification of human lens ALDH1A1: implication in impaired detoxification of lipid aldehydes. J. Toxicol. Environ. Heal. A Curr. Issues 72, 577–584. doi: 10.1080/15287390802706371
Xie, F., Xiao, P., Chen, D., Xu, L., and Zhang, B. (2012). miRDeepFinder: a miRNA analysis tool for deep sequencing of plant small RNAs. Plant Mol. Biol. 80, 75–84. doi: 10.1007/s11103-012-9885-2
Keywords: aquaculture, fish welfare, energy, metabolism, proteomics, RT-qPCR, stress
Citation: Raposo de Magalhães C, Schrama D, Nakharuthai C, Boonanuntanasarn S, Revets D, Planchon S, Kuehn A, Cerqueira M, Carrilho R, Farinha AP and Rodrigues PM (2021) Metabolic Plasticity of Gilthead Seabream Under Different Stressors: Analysis of the Stress Responsive Hepatic Proteome and Gene Expression. Front. Mar. Sci. 8:676189. doi: 10.3389/fmars.2021.676189
Received: 05 March 2021; Accepted: 08 April 2021;
Published: 05 May 2021.
Edited by:
José Luis Soengas, University of Vigo, SpainReviewed by:
Lluis Tort, Universitat Autònoma de Barcelona, SpainManuel Gesto, Technical University of Denmark, Denmark
Copyright © 2021 Raposo de Magalhães, Schrama, Nakharuthai, Boonanuntanasarn, Revets, Planchon, Kuehn, Cerqueira, Carrilho, Farinha and Rodrigues. This is an open-access article distributed under the terms of the Creative Commons Attribution License (CC BY). The use, distribution or reproduction in other forums is permitted, provided the original author(s) and the copyright owner(s) are credited and that the original publication in this journal is cited, in accordance with accepted academic practice. No use, distribution or reproduction is permitted which does not comply with these terms.
*Correspondence: Pedro M. Rodrigues, cG1yb2RyaWdAdWFsZy5wdA==