 Daniel R. Quijano Quiñones
 Jorge A. López-Rocha
 Isis Hernández-Herrera3
 Edgar Torres-Irineo
95% of researchers rate our articles as excellent or good
Learn more about the work of our research integrity team to safeguard the quality of each article we publish.
Find out more
BRIEF RESEARCH REPORT article
Front. Mar. Sci. , 25 May 2021
Sec. Marine Fisheries, Aquaculture and Living Resources
Volume 8 - 2021 | https://doi.org/10.3389/fmars.2021.669112
This article is part of the Research Topic The Approach to Complex Systems in Fisheries View all 9 articles
The understanding of fishing effort allocation has been recognized as a key feature within the spatial management planning of fisheries. In small-scale fisheries this assessment is challenging because of their multi-specific context. This has resulted in management regulations that do not fulfill their objectives. Therefore, the analysis of vessels movement is needed for the better assessment and management of small-scale fisheries. Thus, we used a Random Walk (RW) modeling approach to characterize the fishing trips of small-scale multi-gear vessels targeting multiple species. We analyzed activities of three different gears (hand net, handline, longline) and two fishing methods (diving, “gareteo”) recorded with a GPS from 156 fishing trips along three fishing seasons (2018–2020) by the small-scale fleet of Yucatan, Mexico. We fitted seven RW models for the movement data and compared their relative and absolute fit through a delta Akaike test and G-Tests respectively. A total of 143 trajectories showed conclusive evidence to establish a CCRW-type movement; the remaining 13 trajectories fit three models (CCRW, TRW and CRW). The Random Walk models were useful for modeling a multi-gear, small-scale fleet operating in southeast Mexico. According to our results, the Composite Correlated Model was the most suitable RW for this fleet. For future studies, we suggest increasing the number of fishing trips and conducting specific studies by gear and fishing method. Also, the application of relative and absolute fit tests to compare the performance of RW models is highly recommended.
The allocation of fishing effort has been recognized as a key feature within the spatial management designs used in fisheries (Daw, 2008; McCluskey and Lewison, 2008). Therefore, understanding the correct allocation of fishing effort could enhance spatial management (Dorn, 2001). In mixed fisheries such as small-scale fisheries (SSF) this assessment is particularly challenging because these fisheries target a variety of species and use multiple gears. SSF are complex systems characterized by feedback relationships among biological, environmental, human and economic factors. These factors largely determine the allocation of fishing effort and fleet dynamics (Holland and Sutinen, 1999). Thus, a disregard for fleet dynamics and fishermen behavior has resulted in management regulations that seldom fulfill their objectives (Branch et al., 2006).
The use of multiple fishing gears in mixed fisheries is highly dynamic throughout the year and depends on the target species; consequently, catch rate trends can be modified as a result of fishing fleet behavior (Ulrich and Andersen, 2004). Therefore, understanding the relationship between fishing gears and species caught is important for improving the assessment and management of fisheries. The assessment of fishermen behavior and fleet dynamics in developing countries such as Mexico has been poorly explored. Ignoring these factors has led to a failure to achieve management objectives. In this sense, the analysis of vessel movements can help to determine what type of fishing gear is used, which in turn could help to develop better estimates of fishing effort allocation and improve the identification of target species according to fishing gear (Metcalfe et al., 2017). Furthermore, it could be possible to incorporate this approach into Vessel Monitoring Systems (VMS) suited for small-scale fleets to track fishing activities at sea concerning fishing gears employed.
From an ecological point of view, fishermen have been assumed to behave like predators (Bertrand et al., 2007; Hilborn, 2007). Thus, it is particularly important to identify the dynamics of fishing effort allocation. Exploring this behavior could lead us to identify illegal, unreported and unregulated fishing activities (Marzuki et al., 2015), determine patterns in the spatial distribution of fishing resources from fishing data (Bertrand et al., 2008) or infer fishing strategies from geo-referenced data (Joo et al., 2014). Moreover, several researchers have recognized the need to understand fishermen behavior in different contexts and to consider how this relates to target species (Fulton et al., 2011; van Putten et al., 2013; Bourdaud et al., 2019; Wijermans et al., 2020).
Nonetheless, the acquisition of spatio-temporal data of fishing effort in SSF has been challenging due to: (1) a lack of or limitations in sampling programs; (2) a wide range of landing sites; and (3) a lack of reliability in terms of catch statistics and fleet size (Metcalfe et al., 2017; Chuenpagdee et al., 2019; Cardiec et al., 2020). Worldwide, VMS and Automatic Identification Systems (AIS) are mandatory for industrial fisheries and have been developed for the surveillance and monitoring of fishing fleets (Kroodsma et al., 2018). However, in SSF these have not been implemented, although with the use of cost-effective equipment such as GPS it is possible to get insights into fishermen behavior at sea (Alvard et al., 2015; Metcalfe et al., 2017; Cardiec et al., 2020).
In Yucatan, fishery management is based mainly on fishing effort controls (closed seasons, total allowable catches, limits on fleet size and restrictions on fishing gear). However, there is no spatial management planning scheme for SSF. Despite the efforts, main commercial species have showed a decrease in catches and CPUE. Furthermore, since the mid-1990s, fishermen in this region have used GPS to mark fishing grounds, resulting in increasing fishing pressure. Thus, in the absence of spatial monitoring systems (VMS or AIS), it would be useful to acquire data from GPS devices for spatial management schemes (e.g., closed areas, identification of illegal fishing). However, determining fishing effort allocation in mixed fisheries – including SSF – is difficult due to the diverse use of fishing gears (Bourdaud et al., 2019). Therefore, the movement of fishing vessels should be a key factor in understanding the spatial dynamics of fishing fleets. According to Bertrand et al. (2007), movement analysis makes it possible to examine how fishermen adapt their spatial behavior in relation to a species’ distribution, much like a predator-prey relationship. This information is essential for assessing the spatial fishing behavior in the context of a SSF operating with several fishing gears (Wilen, 2004).
In this context the Random Walk (RW) approach has been used for spatial analysis in monospecific fishing fleets (Bertrand et al., 2015). In this study we explored the application of Random Walk (RW) models to the characterization of fishing trips from SSF operating in Yucatan, Mexico. We argue that this approach will be useful for modeling the spatial behavior of small-scale vessels and therefore could lead to a better assessment of fishing effort allocation for SSF in the area.
The information used in this study was obtained from observers aboard vessels of the SSF in Yucatan, Mexico. This multi-specific fleet employs more than 10,000 fishermen and operates in three of the most important fisheries in southeast Mexico: groundfish, octopus and sea cucumber (DOF, 2017). The fleet sample under investigation operates out of Sisal, Yucatan (Figure 1) at a maximum depth of 40 m and less than 40 km from the coastline (DOF, 2014; FAO-SEDER, 2016). These vessels are made of fiberglass with 7–9 m length, and they have a one metric ton of load capacity. Fishing trips last between 6 and 12 h. They have an outboard motor (45–80 hp) and carry up to three fishermen. On some trips the boats can also carry up to two “dinghies,” which are small wooden boats (3 m) without a motor that operate close to the boat.
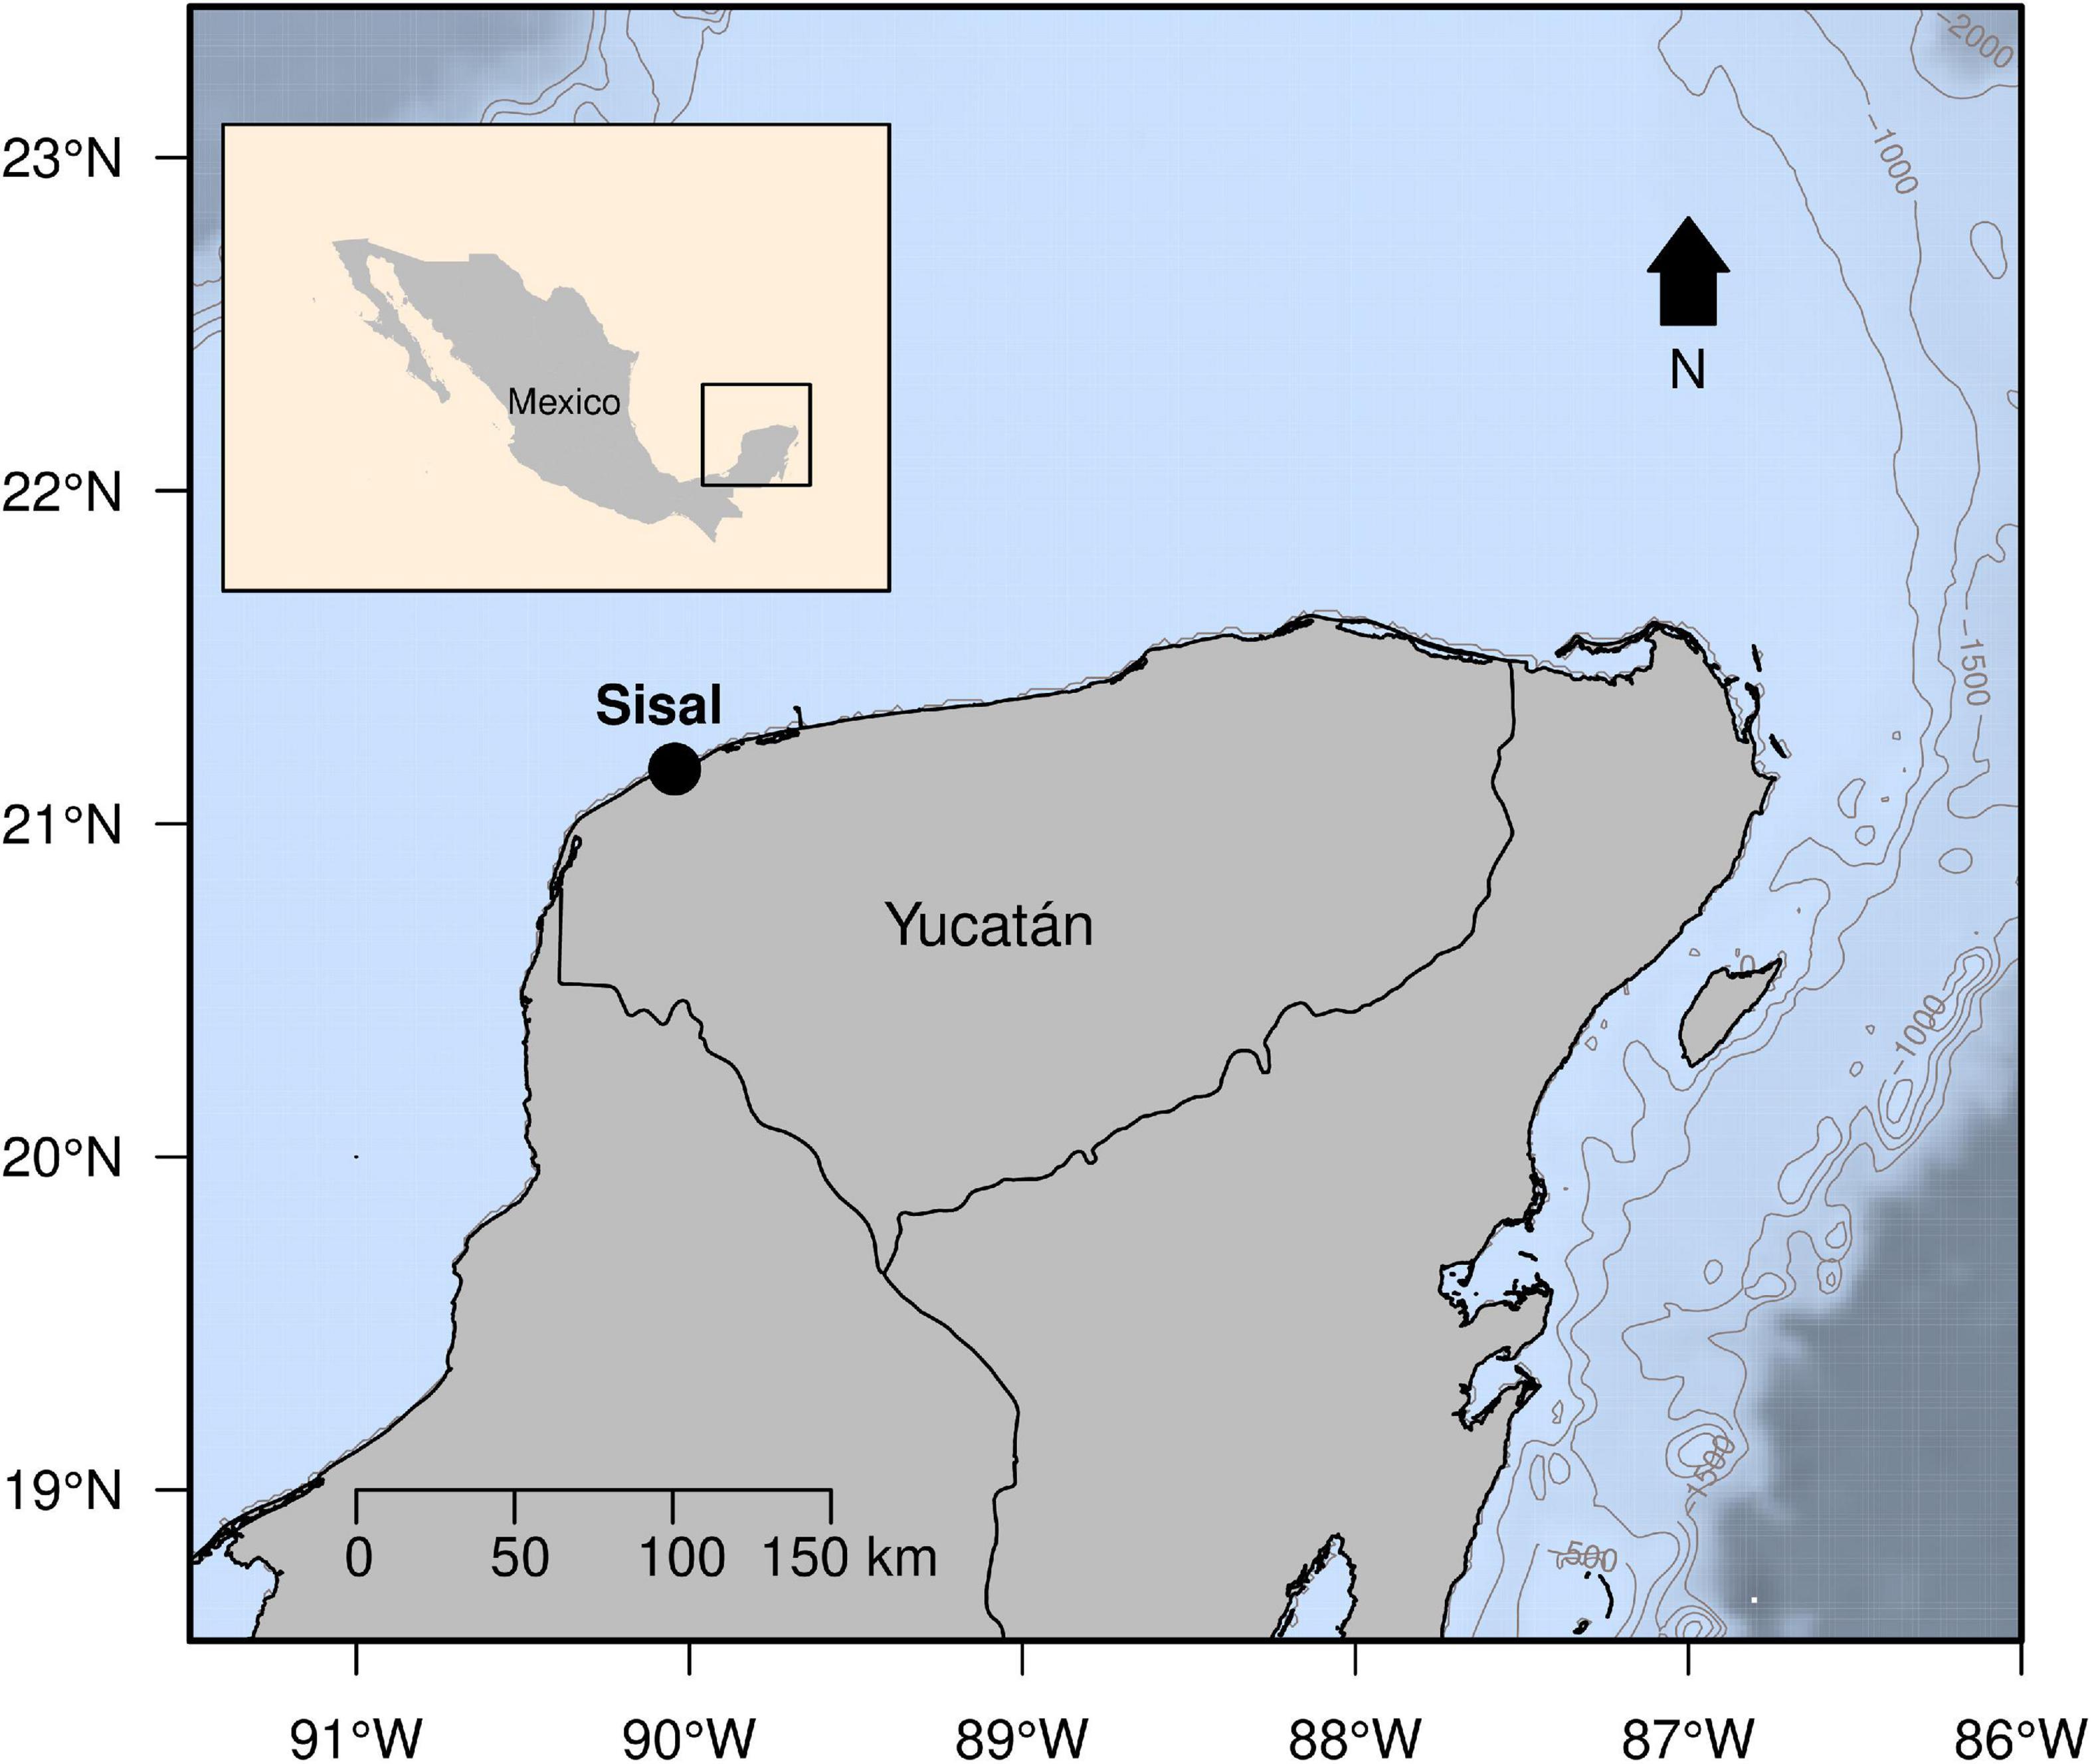
Figure 1. Geographic location of Sisal port, Yucatán, México.
The data analyzed come from 156 fishing trips (Supplementary Material) and were collected during three fishing seasons (2018, 2019, and 2020). On each fishing trip, an observer recorded the route with a GPS (Garmin eTrex 20) at a log frequency of one minute from port until returning. No land record was included. The activities of three different gears (hand net, handline, longline) and two fishing methods (diving, “gareteo”) were recorded. All these fishing gears and methods, except for “gareteo,” are used to catch different groundfish species, particularly Serranidae and Lutjanidae. “Gareteo” is a method targeting octopus using dinghies that is characteristic in the study region. It involves the use of bamboo poles (named “jimbas”) up to 3 m long, from which bait lines are suspended (mainly crab). The dinghy is allowed to drift, and the fisherman waits for the octopuses to catch the bait before retrieving the line. However, due to the variable nature of the fishing activities, it was not possible to record an equal number of fishing trips for each gear and method (Supplementary Table 1).
A Random Walk (RW) is a discrete random event, in which the spatial position of an object varies with time and according to a set of probabilistic rules (Bartumeus et al., 2005; Bertrand et al., 2007). The RW represents the movement of organisms as a series of discrete displacements (steps), separated by successive reorientation events (turning angles) (Bartumeus et al., 2005; Bartumeus and Catalan, 2009). Thereby, a spatial variable (distance, angle) and a temporal variable (duration) are obtained, each with its own probability density function (PDF).
In general terms, RW can be divided into two groups. The first group is the RW in which each step is chosen independently of previous steps and can be selected from all possible orientations (360°) with the same probability of being chosen. Therefore, there is no correlation between the orientations and the distribution is uniform (Dray et al., 2010). Within this group, the first described RW was the Brownian movement (Mark, 1947). The Brownian movement (BW) implies that animals move randomly inside an area, limited by the presence of a barrier (physical or ecological) (Turchin, 1998; Bertrand et al., 2007). The length of each step has a normal distribution (finite variance and mean) and the presence of long-extension steps is low (Gautestad and Mysterud, 2013). This type of movement can occur in a limited space where there is a great abundance of targets or food items (Yoda et al., 2012). This movement was modeled by Turchin (1998) as which establishes a linear function between step number (n) and the square length of each step (R2). If γ > 1 the displacement is classified as super-diffusive. There is also a truncated version of BW (TBW), the difference being that TBW has an upper bound in the PDF of the length step and there are no extremely long steps.
Within the same group of RW, the Lévy walk (LW) model has dominated the literature over the last 20 years. In the 1980s, several authors suggested that organisms that adopt movements with Lévy distributions increase their probability of finding food compared to BW. The LW entered the biological scene with foraging studies of ants (Shlesinger and Klafter, 1986). Subsequently, it was adapted by Klafter et al. (1990) and modified by Viswanathan et al. (1999). Within the LW, each step is defined independently by a Pareto-Lévy probability distribution (Pyke, 2015). This distribution models infrequent long steps connected with higher frequency short steps (Ben-Avraham and Havlin, 2000). The most widely used model is described with a potential function , where P(lj) is the probability of occurrence of a step with length (l) in the interval j, and μ is an exponent that defines the characteristics of the displacement and takes values between 1 and 3. One of the reasons for its wide application is the flexibility of the model to represent different types of trajectory. When μ = 1, the movement is completely directed (ballistic) and when μ ≥ 3 it is in the domain of the Brownian movement; the LW movement lies between 1 < μ < 3 (Bertrand et al., 2007). For the truncated model (TLW), the PDF of the LW is bounded a < P(lj) < b so that the probability of extremely long steps is negligible.
The second type of RW is known as Correlated Random Walk (CRW). With this type of model each step is dependent on the previous step; this is called directional persistence (Patlak, 1953; Renshaw and Henderson, 1981; James et al., 2011). Directional persistence is modeled by assuming that the turning angles of each step are correlated. However, the influence of the orientation of the initial steps progressively decreases with time (Benhamou, 2006). In the biological field Kareiva and Shigesada (1983) used the model , where is the expected value of the distance traveled in the nth step, d is the distance of each nth step and c is the cosine of the angle between steps (cos θ). The assumption of a correlation between the angles simulates the behavior observed in nature such as searching for food, water or breeding areas, or avoiding predators. In the truncated version of CRW (TCRW), the PDF of d is limited with a restriction (a < P(d) < b) such that there are no steps with extremely long distances (Auger-Methe et al., 2015).
An extension of the CRW model is the Correlated Composite Random Walk (CCRW). This model is a combination of two different RWs and represents two behaviors. The first corresponds to intensive foraging and is usually modeled as a BW. The second corresponds to extensive foraging and is modeled with a CRW (Codling et al., 2008; Auger-Methe et al., 2015). The CCRW establishes that an organism can be in two phases (a, b) which alternate according to a Bernoulli process. In the n step, the organism is in phase a with probability pj; in the next step, n+1, the probability of continuing in the same phase is 1- pj, while phase b obtains a probability pj. Both phases (a, b) have a probability of 0.5 at the beginning of the movement, and the organism moves at a different speed (υ) in each phase. The angle in each step is defined as φn = θn−θn−1; each phase has a mean angle with the value 0 ≤ ci < 1, and two assumptions are made: angle ca ≤ cb and speed υa ≤ υb. Therefore, phase a will be intensive with low or no angular correlation (θj≈0), low speed, with multiple turns and short steps. Conversely, b will be extensive with high angle correlation (θj≈1), high speed and with (almost straight) long steps (Plank and Codling, 2009).
All RWs described have been used for modeling different types of movement, and in the last 15 years LW has proven to be suitable for modeling industrial fishing fleet trajectories (Bartumeus et al., 2005; Bertrand et al., 2005, 2007; Joo et al., 2014; Wang and Zhu, 2019). However, in recent years it has been argued that the LW is not necessarily the best model for describing the optimal movement of organisms and, by extension, vessels. The main controversy is the assumption of independence between the steps and the lack of fit tests between different RWs (Pyke, 2015). Based on the foregoing discussion, this research used the methodology described by Codling et al. (2008) to assess the fit of seven RWs to a set of small-scale fleet movement data.
Every fishing trip had at least 900 georeferenced positions to ensure a consistent analysis (Codling et al., 2008; Plank and Codling, 2009). First, we defined relevant steps that represent the intentional movements of the fishermen in their trajectories, for which the local turn method was used. With this method a relevant step is identified if the angle between two consecutive steps exceeds a predetermined threshold (Codling and Plank, 2011). However, there is no precise methodology for defining the appropriate threshold and misspecifications can occur when the threshold is high or low (Auger-Methe et al., 2011; Codling and Plank, 2011). On this matter Auger-Methe et al. (2015) used a threshold of 10 ° with good results. Based on this precedent, analysis for the present study was conducted according to three different thresholds: 0°, 5° and 10°.
The fit of seven RWs was evaluated for the SSF data: Brownian (BW), Truncated Brownian (TBW), Levy Walk (LW), Truncated Levy Walk (LTW), Correlated (CRW), Truncated Correlated (TCRW) and Composite Correlated (CCRW). It must be specified that TBW and TCRW were included as null models. The likelihood functions used to calculate the parameters of each model incorporated two sources of information: (a) the distance of each step and (b) the orientation angle. A step was defined as the length from the start point and the end point for the ith-step. The orientation angle was defined as the angle formed by two consecutive steps (Bartumeus et al., 2005; Auger-Methe et al., 2015). Table 1 shows the likelihood functions used.
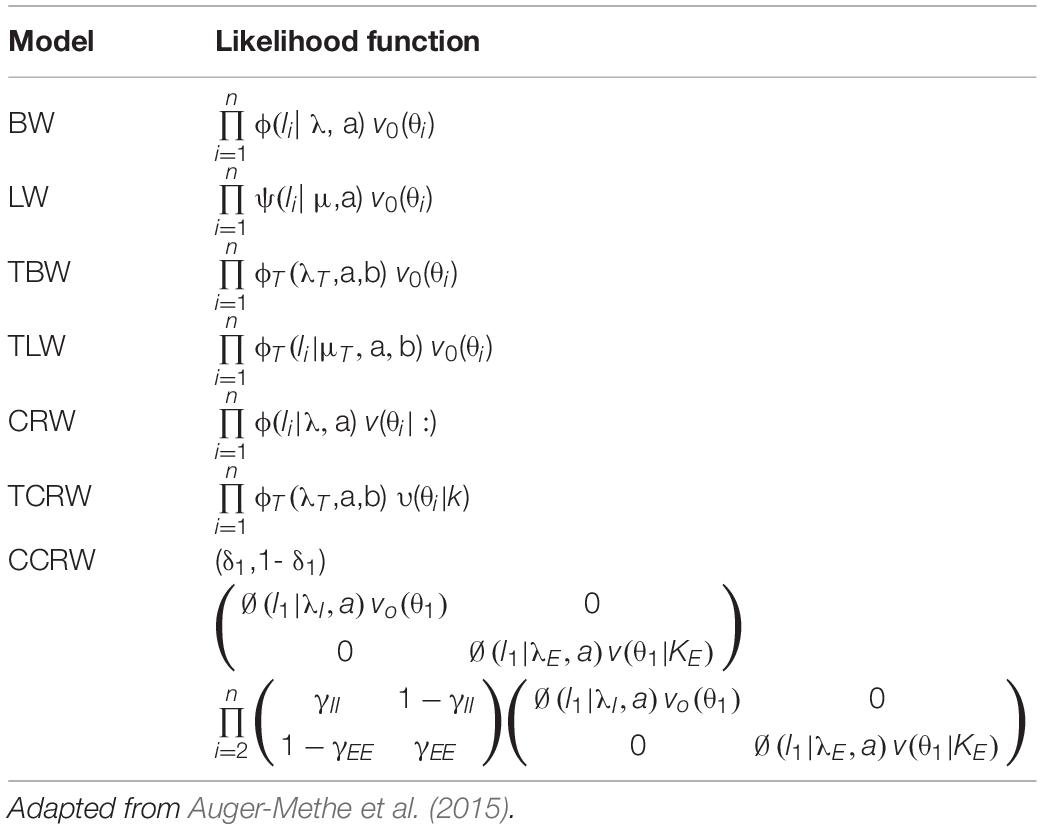
Table 1. Likelihood functions for each of the RW models.
The parameters to be estimated (Table 2) were: a = first step minimum distance; b = maximum distance; δI = probability of starting an intensive search; γI = probability of starting an extensive search; γEE = probability of maintaining an extensive search; k = directional correlation; λ(m–1) = exponential distribution rate; λT (m–1) = truncated Pareto exponential distribution rate; λI(m–1) = intensive search rate; λE(m–1) = extensive search rate; μT = truncated Pareto parameter; μ = non-truncated Pareto parameter. Additionally, ϕ(), ψ(), v0() and v() described the PDF of each model, where ϕT() is the truncated version of ϕ(),li(step length) is the distance between the starting and ending locations at nth step, and θi is the angle of a step relative to the previous step direction.
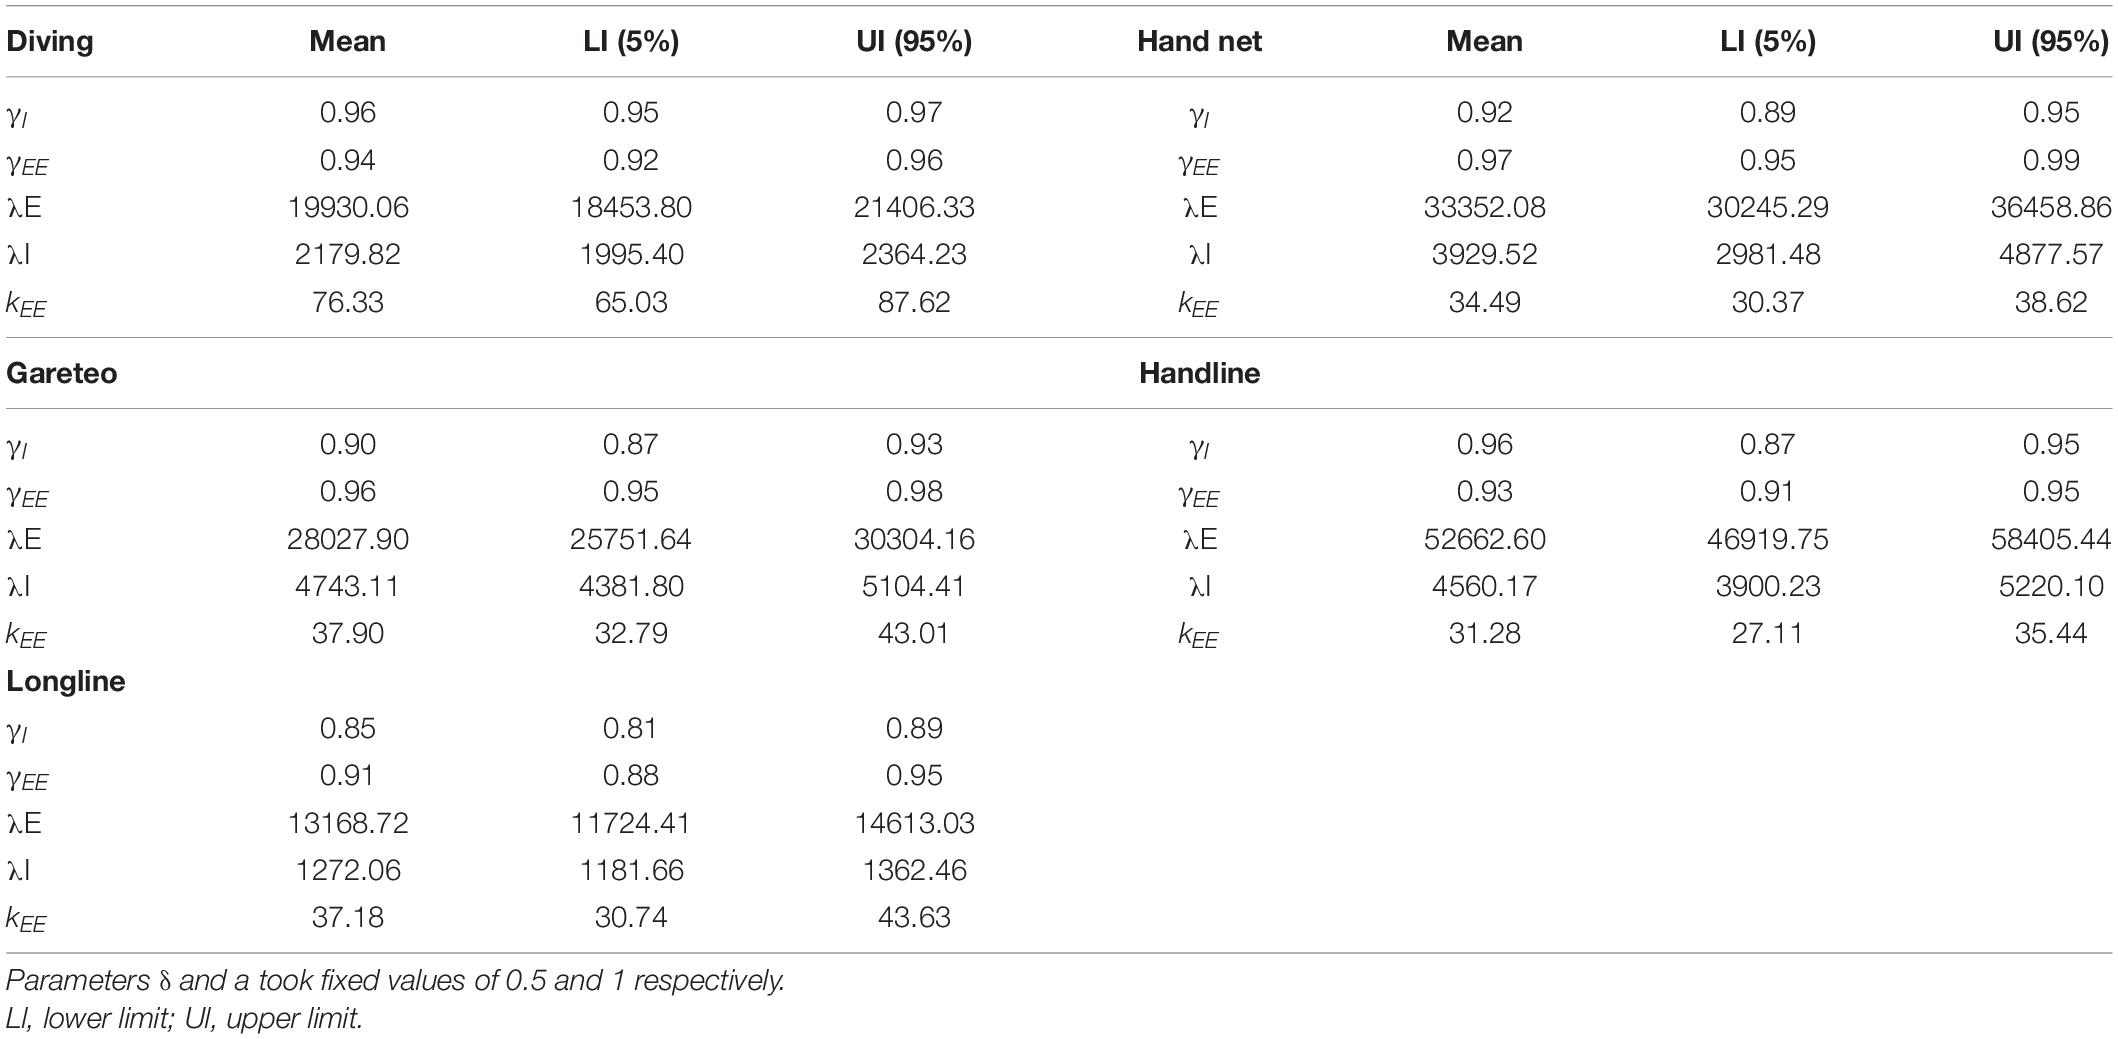
Table 2. Mean estimate values for five parameters of the CCRW model.
The Delta Akaike (ΔA) test was used to compare the relative fit. The model closest to 0 value was considered the best model (Burnham and Anderson, 2002). To corroborate the result of ΔA, an absolute fit test was carried out. The G-test was selected because it assumes that the steps are independent, which is an important assumption in the RW approach (Auger-Methe et al., 2011; Edwards, 2011). The CCRW was a special case because it incorporates the correlation between the steps. Therefore, a modified G-test was selected (Zucchini et al., 2017), which uses pseudo-residuals that incorporate interdependence between observations. In both tests the significance was set at 0.05. The R 3.6.1 platform (R Core Team, 2019) and the “CCRWvsLW” library (Auger-Methe, 2015) were used to carry out all the analyses.
A total of 156 trajectories were analyzed and different results were obtained for the three scenarios. In scenario 1 (0° threshold), 92% of the trajectories showed conclusive evidence from the ΔA and G-test to establish a CCRW movement. In scenario 2 (5° threshold), only 70% of the trajectories resulted in a solution and 56% were identified as CCRW. The remaining 14% of the trajectories fit two models (TCRW, CRW), but the G-test was not significant. In scenario 3 (10° threshold), 71% of the trajectories did not result in a solution and in the remaining 29% the G-test was not significant. General results presented by model can be seen in Supplementary Table 2.
Based on the aforementioned, only the scenario 1 results will be presented. A total of 143 trajectories fit the CCRW model; 12 trajectories presented a fit for multiple models (CRW, TCRW, LW), but the G-test was not significant. Only one trajectory (handnet) presented BW as the best fit model. Table 2 shows the estimates of the CCRW parameters and Figure 2 presents fit models by fishing gear and fishing method.
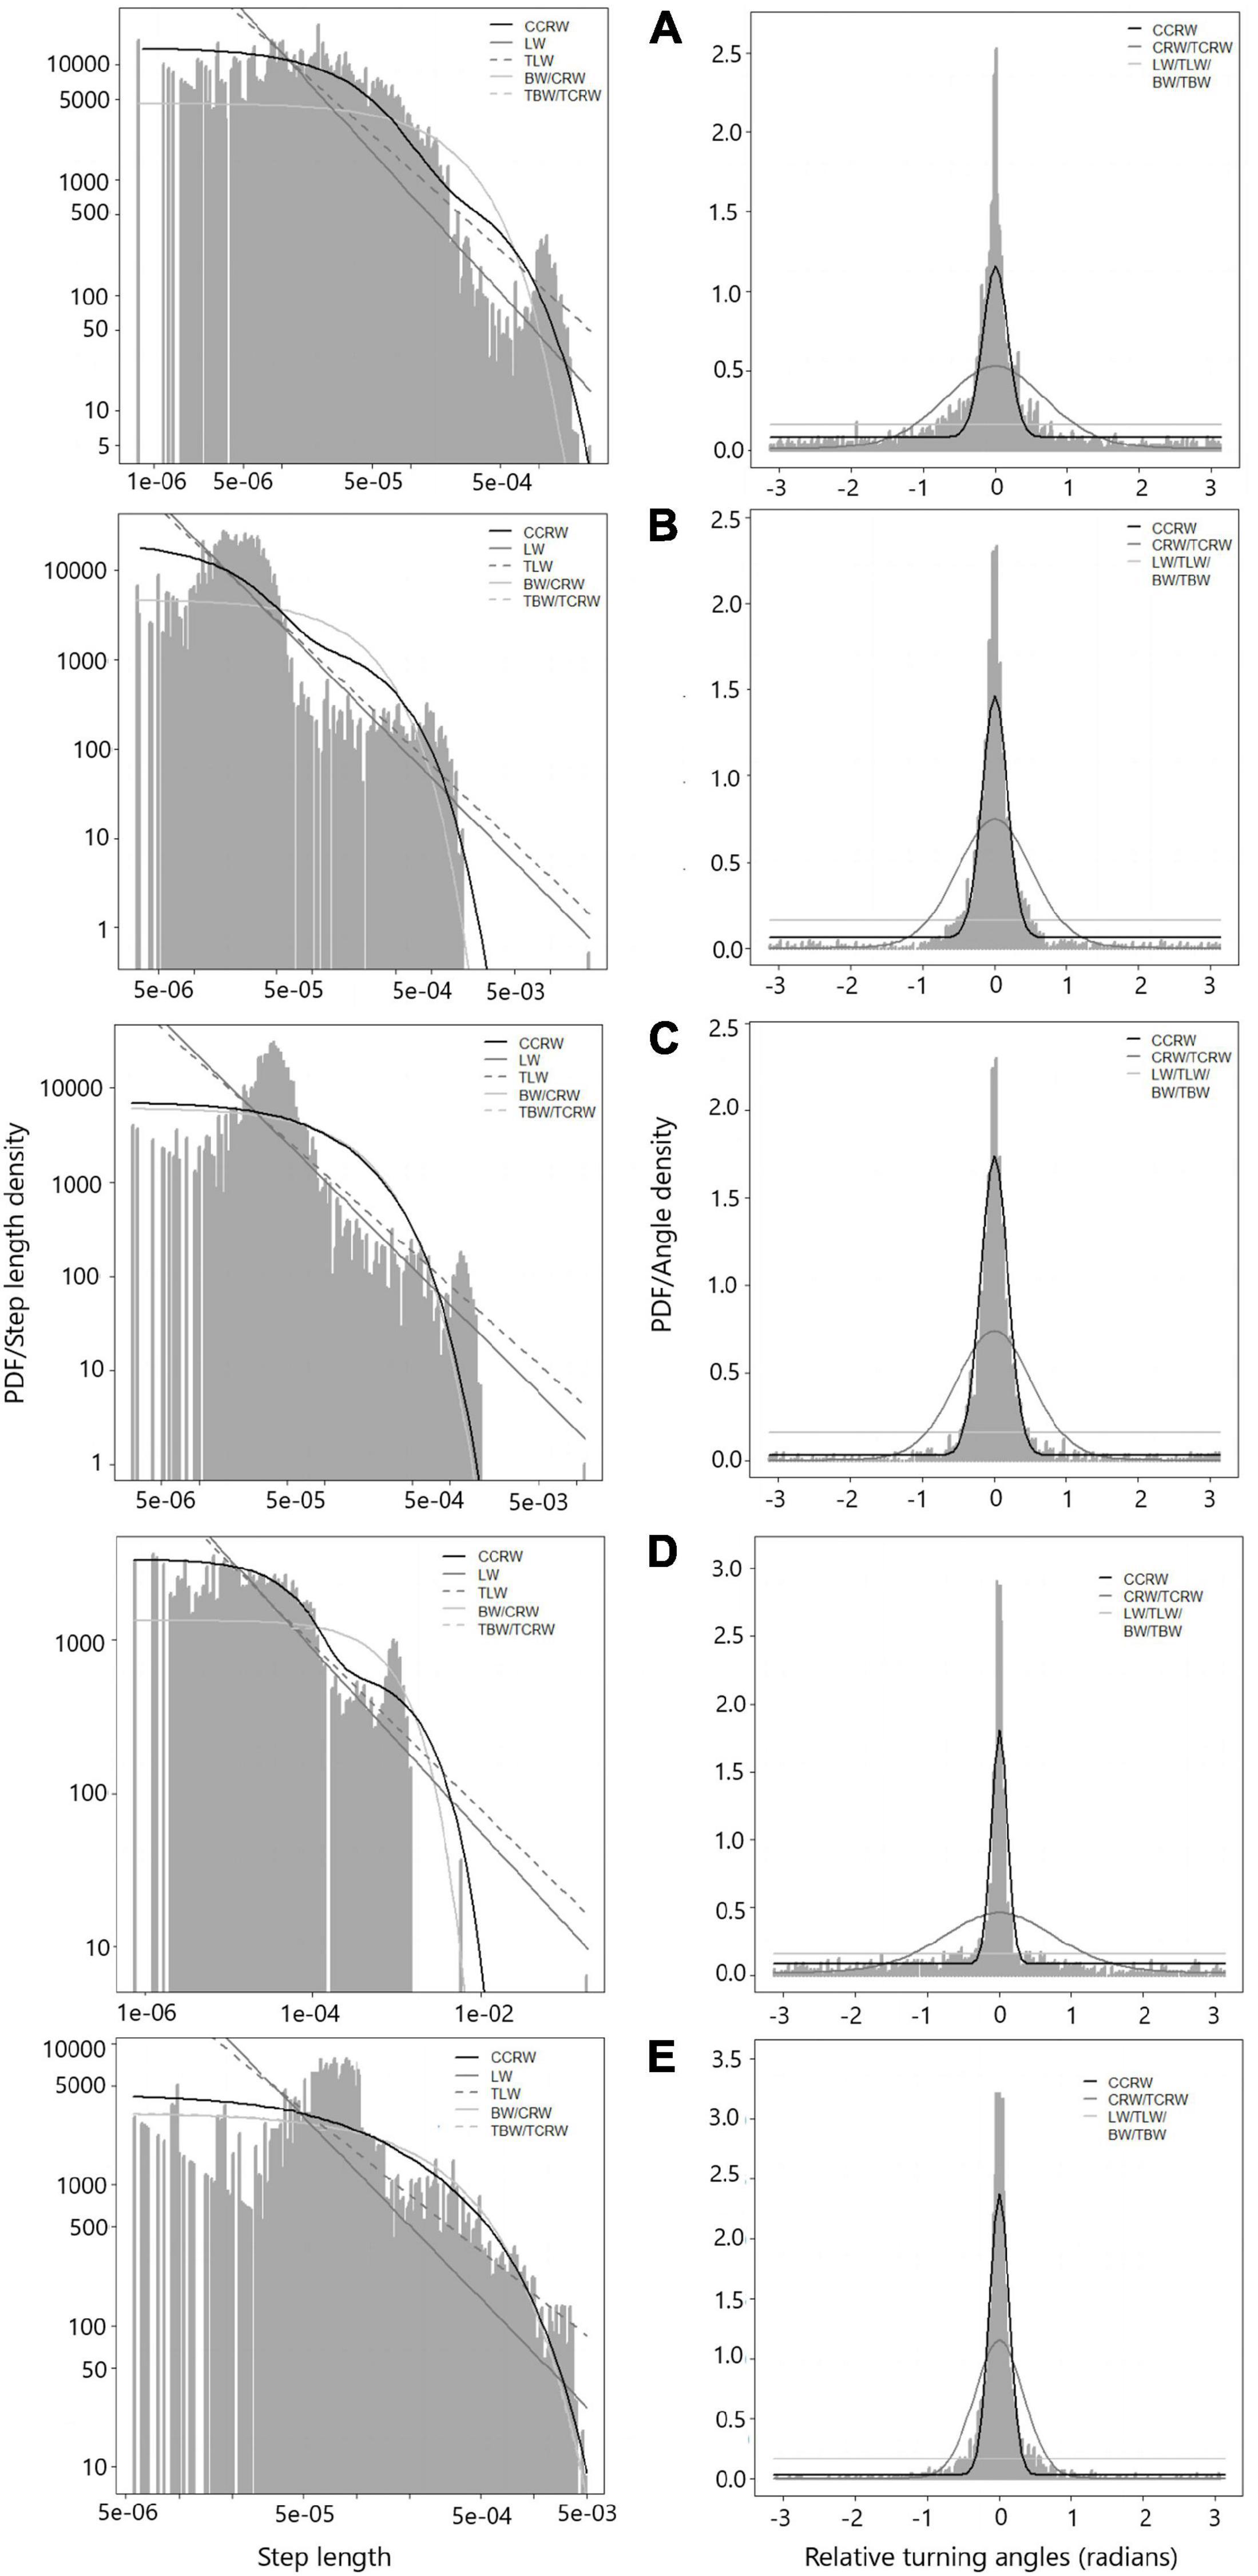
Figure 2. Model fitting to data from trajectories. (A) diving; (B) hand net; (C) gareteo; (D) handlines; (E) longline. Left figure represents step length, right figure represents relative turning angles.
Additionally, the values of two parameters of the CCRW were useful for establishing whether the trajectories could be considered as an efficient search strategy or not. To reach this conclusion it was necessary that γI > 0.5, γEE > 0.5 and kEE > 0 (Codling et al., 2008). In our analysis, 99% of the trajectories identified as CCRW fulfilled these three conditions. Supplementary Figure 1 shows examples of the trajectories recorded by gear and fishing method.
The methodology used was appropriate to fulfill the objectives of this work. To our knowledge, this is the first study that simultaneously evaluates different RWs for the analysis of spatial dynamics in SSF. The main results obtained were not expected, given the multi-species nature of the SSF. It was assumed that the trajectories could be adequately modeled by different types of RW, but this was not the case, as over 90% of the trajectories were appropriately modeled as CCRW. This contrasts with the findings of Bertrand et al. (2005, 2007) and Joo et al. (2014), who concluded that the LW is adequate for describing the movement of fishing vessels. The differences found between the results produced by those authors and those of the present study are discussed in a comparative framework.
Previously, Bertrand et al. (2007) discussed fishermen from an ecological perspective as predators in the ecosystem who use strategies to obtain food. In fact, this point of view is important to current ecosystem management approaches (Pikitch et al., 2004). Fishermen are top predators (Bertrand et al., 2008) and must develop tactics that ensure success in fishing operations. These tactics may vary depending on the type of “predator.” Previous studies analyzed the behavior of industrial fleets which are composed of large vessels and characterized by a high degree of autonomy in their operations (days), and usually deploy fishing effort over a single resource (Bertrand et al., 2008; Joo et al., 2014; Wang and Zhu, 2019). By contrast, the fleet examined for this study is smaller in terms of boat length and autonomy (6–12 h) and uses different fishing gears throughout the year. These contrasting characteristics could be a factor in the differences observed in the type of movement of each “predator” or fleet. Technology may also be a factor: while SSF mainly have a GPS device, large vessels have sonar, sea-bottom recognition systems, or both. This technological difference could result in different fishing strategies and different RWs.
As mentioned before, a LW assumes that the angles between successive steps are not correlated. This means that the organism chooses the direction of the following steps without preference (Dray et al., 2010; Edwards, 2011; Pyke, 2015). The issue with this assumption in SSF lies in the ecological meaning. For its fulfillment, the fishermen should not have any kind of preference on which area they deploy their fishing effort. This opposes to the decision-making process that fishermen go through when fishing; in fact, multiple factors influence their decisions such as economic, social, management regulations, markets and even personal preference (Salas et al., 2004; Daw, 2008; Cinner et al., 2009). SSF fishermen usually record fishing grounds in their own logbooks and they re-visit several recorded fishing grounds when looking for fishing resources.
Nevertheless, there are scenarios where an assumption of no correlation can be fulfilled in SSF. For example, when fishermen search for new fishing areas (Salas et al., 2004), thereby developing a random movement associated with the search. Another scenario can be observed when fishermen enter a new fishery: without prior knowledge of the resource distribution, they must carry out a random search. In this sense, it would be interesting to analyze data from fisheries during these two scenarios and compare them with the trajectory of the same fishery with experienced fishermen.
Lastly, the CCRW is characterized by the correlation between consecutive steps of a trajectory (Renshaw and Henderson, 1981). The advantage of this approach for the small-scale fleet is that it allows straight movements between fishing sites (extensive search) to be modeled together with fishing (intensive search), incorporating fishermen’s knowledge of fishing sites. In addition, our results indicate that spatial effort allocation is carried out efficiently as the fishermen give priority to fishing, while straight movements between sites can be done even with a single step.
In this study, the use of the “local turning” method to define relevant steps in the trajectories induced misspecifications despite the recommendations (Auger-Methe et al., 2015). Consistent results were obtained when the original trajectories data were analyzed. This aspect agrees with Codling et al. (2008) who indicated that misspecification problems may be due to failures in defining relevant steps and not to the properties of the observed movements. Accordingly, we recommend that in future studies the trajectories should be analyzed with and without different threshold angles; in this way more effective analysis would be possible.
The CCRW was useful for understanding and characterizing the behavior of small-scale vessels. The first behavior between fishing sites was characterized by high speed and a small change of angle during successive steps. This behavior may be due to two activities: a) when the fishermen go to their preferred fishing grounds or b) when changing their fishing ground. In both, the fishermen’s experience and the CPUE of past trips could be relevant when choosing where to move (Salas et al., 2004). The second behavior corresponded to the action of the intensive search or fishing, which is characterized by low speed and wide turning angles, with the intention of remaining in a particular area. The extension of these catching areas can vary by fishing gear or fishing method.
Empirically, this fishing operation with two types of behavior is well suited to fishing gears and fishing methods such as diving and hand-net, where the fisherman directly catches the resource. However, CCRW was also adequate for describing fishing operations such as longline, gillnet and “gareteo.” With fishing gears like longline or gillnet, the fishermen leave the gears in the water column and after several hours they return to collect them. In the case of “gareteo” (targeting octopus), the fishermen let the boat drift with the current. It might be argued that a LW would be suitable; however, the CCRW model was the most appropriate.
There are two possible reasons for this. The first could be attributed to limited information about the trajectory. The second reason may be the fishermen’s own adaptations to the uncertainty of fishing. Some fishermen in Yucatán carry more than one fishing gear during a fishing trip to increase the number of resources they can catch (Quijano et al., 2018). When it comes to nets and longlines, these are likely to be left in the water column as fishermen move to other fishing areas, where they can use handline for example. In the case of “gareteo,” having an additional fishing gear such as handline is an advantage if octopus catches are low, as it allows the fishermen to switch between species.
The Random Walk models were useful for modeling a multi-species, small-scale fleet operating in southeast Mexico. According to our results, the CCRW model was the most suitable for this fleet. Our results highlight the usefulness of low-cost tracking devices such as GPS to acquire data on the spatial distribution of small-scale vessels. However, having observers on board vessels is highly expensive, and it is difficult to cover the entire fleet. Instead, management authorities – together with fishermen – could develop a program to share the tracking of fishing trajectories and analyze the relevant data to better understand fishing effort allocation. In fact, in Yucatan there is no marine spatial planning scheme for small-scale fisheries, yet this type of data is key to spatial management. For instance, in recent years, the implementation of closed areas has been promoted to protect commercial species such as sea cucumber. Therefore, a potential collaboration among authorities, fishermen and researchers would result in an effective spatial monitoring scheme to assess the accomplishment of this management tool.
Further studies in this field would include conducting specific analyses by gear and fishing method in order to characterize the footprint of each. However, more data is required in relation to each fishing gear and/or method. This type of study will result in a better estimate of the fishing effort by fishing gear and targeted species. Therefore, for the purpose of future studies, we suggest increasing the base of fishing trips and conducting specific studies by gear and fishing method. The application of relative and absolute fit tests to compare the performance of RW models is also highly recommended.
The original contributions presented in the study are included in the article/Supplementary Material, further inquiries can be directed to the corresponding author/s.
Written informed consent was obtained from the individual(s) for the publication of any potentially identifiable images or data included in this article.
DQ and ET-I contributed to design of the study and statistical analysis. JL-R wrote sections of the manuscript. IH-H organized the database. All authors contributed to manuscript revision, read, and approved the submitted version.
This work was supported by the UNAM-PAPIIT IA208720 research project from Dirección General de Asuntos del Personal Académico, Universidad Nacional Autónoma de México, PEI-CONACyT (250655), and CONACYT-CB252215 (carried out by Cinvestav Mérida, EPOMEX, and UNAM) research projects.
The authors declare that the research was conducted in the absence of any commercial or financial relationships that could be construed as a potential conflict of interest.
DQ acknowledges support from the Direction General de Asuntos del Personal Académico (DGAPA) of the Universidad Nacional Autónoma de México (UNAM) for the post-doctoral scholarship. The authors also thank the fishermen for their information and experience, and for allowing us on board their vessels to conduct observations. The referees and the editor also provided thoughtful comments, which greatly improved the manuscript.
The Supplementary Material for this article can be found online at: https://www.frontiersin.org/articles/10.3389/fmars.2021.669112/full#supplementary-material
Alvard, M., Carlson, D., and McGaffey, E. (2015). Using a partial sum method and GPS tracking data to identify area restricted search by artisanal fishers at moored fish aggregating devices in the Commonwealth of Dominica. PLoS One 10:e0115552. doi: 10.1371/journal.pone.0115552
Auger-Methe, M., Clair, C. C. S., Lewis, M. A., and Derocher, A. E. (2011). Sampling rate and misidentification of Lévy and non-Lévy movement paths: comment. Ecology 92, 1699–1701. doi: 10.1890/10-1704.1
Auger-Methe, M., Derocher, A. E., Plank, M. J., Codling, E. A., and Lewis, M. A. (2015). Differentiating the Levy walk from a composite correlated random walk. Methods Ecol. Evol. 6, 1179–1189. doi: 10.1111/2041-210X.12412
Bartumeus, F., and Catalan, J. (2009). Optimal search behavior and classic foraging theory. J. Phys A Math. Theor. 42:434002. doi: 10.1088/1751-8113/42/43/434002
Bartumeus, F., da Luz, M. E., Viswanathan, G. M., and Catalan, J. (2005). Animal search strategies: a quantitative random-walk analysis. Ecology 86, 3078–3087. doi: 10.1890/04-1806
Ben-Avraham, D., and Havlin, S. (2000). Diffusion And Reactions in Fractals and Disordered Systems. Cambridge, UK: Cambridge University Press.
Benhamou, S. (2006). Detecting an orientation component in animal paths when the preferred direction is individual dependent. Ecology 87, 518–528. doi: 10.1890/05-0495
Bertrand, S., Bertrand, A., Guevara-Carrasco, R., and Gerlotto, F. (2007). Scale−invariant movements of fishermen: the same foraging strategy as natural predators. Ecol. Appl. 17, 331–337. doi: 10.1890/06-0303
Bertrand, S., Burgos, J. M., Gerlotto, F., and Atiquipa, J. L. (2005). évy trajectories of fishers as an indicator of pelagic fish spatial distribution: the case of the Peruvian anchovy (Engraulis ringens) fishery. ICES J. Mar. Sci. 62, 477–482. doi: 10.1016/j.icesjms.2004.12.002
Bertrand, S., Dewitte, B., Tam, J., Díaz, E., and Bertrand, A. (2008). Impacts of Kelvin wave forcing in the Peru Humboldt Current system: scenarios of spatial reorganizations from physics to fishers. Prog. Oceanogr. 79, 278–289. doi: 10.1016/j.pocean.2008.10.017
Bertrand, S., Joo, R., and Fablet, R. (2015). Generalized Pareto for Pattern-Oriented Random Walk Modelling of Organisms’ Movements. PLoS ONE 10:e0132231. doi: 10.1371/journal.pone.0132231
Bourdaud, P., Travers-Trolet, M., Vermard, Y., and Marchal, P. (2019). Improving the interpretation of fishing effort and pressures in mixed fisheries using spatial overlap metrics. Can. J. Fish. Aquat. Sci. 76, 586–596. doi: 10.1139/cjfas-2017-0529
Branch, T. A., Hilborn, R., Haynie, A. C., Fay, G., Flynn, L., Griffiths, J., et al. (2006). Fleet dynamics and fishermen behavior: lessons for fisheries managers. Can. J. Fish. Aquat. Sci. 63, 1647–1668. doi: 10.1139/f06-072
Burnham, K. P., and Anderson, D. R. (2002). Model Selection and Multimodel Inference: a Practical Information-Theoretic Approach. New York: Springer.
Cardiec, F., Bertrand, S., Witt, M. J., Metcalfe, K., Godley, B. J., and McClellan, C. (2020). “Too Big To Ignore”: a feasibility analysis of detecting fishing events in Gabonese small-scale fisheries. PLoS One 15:e0234091. doi: 10.1371/journal.pone.0234091
Chuenpagdee, R., Rocklin, D., Bishop, D., Hynes, M., Greene, R., Lorenzi, M. R., et al. (2019). The global information system on small-scale fisheries (ISSF): a crowdsourced knowledge platform. Mar. Policy 101, 158–166. doi: 10.1016/j.marpol.2017.06.018
Cinner, J. E., Daw, T., and McClanahan, T. R. (2009). Socioeconomic factors that affect artisanal fishers’ readiness to exit a declining fishery. Conserv. Biol. 23, 124–130. doi: 10.1111/j.1523-1739.2008.01041.x
Codling, E. A., and Plank, M. J. (2011). Turn designation, sampling rate and the misidentification of power laws in movement path data using maximum likelihood estimates. Theor. Ecol. 4, 397–406. doi: 10.1007/s12080-010-0086-9
Codling, E. A., Plank, M. J., and Benhamou, S. (2008). Random walk models in biology. J. R. Soc. Interface. 5, 813–834. doi: 10.1098/rsif.2008.0014
R Core Team. (2019). R: a Language and Environment for Statistical Computing. Vienna, Austria: R Foundation for Statistical Computing.
Daw, T. M. (2008). Spatial distribution of effort by artisanal fishers: exploring economic factors affecting the lobster fisheries of the Corn Islands, Nicaragua. Fish. Res. 90, 17–25. doi: 10.1016/j.fishres.2007.09.027
DOF. (2014). Plan de Manejo Pesquero de Mero (Epinephelus morio) y especies asociadas en la Península de Yucatán. México, D.F: Diario Oficial de la Federación.
DOF. (2017). Diario Oficial de la Federación, Secretaría de Agricultura, Ganadería, Desarrollo Rural, Pesca y Alimentación. Acuerdo por el que se da a conocer la Actualización de la Carta Nacional Pesquera. México, D.F: Diario Oficial de la Federación.
Dorn, M. W. (2001). Fishing behavior of factory trawlers: a hierarchical model of information processing and decision making. ICES J. Mar. Sci. 58, 238–252. doi: 10.1006/jmsc.2000.1006
Dray, S., Royer-Carenzi, M., and Calenge, C. (2010). The exploratory analysis of autocorrelation in animal-movement studies. Ecol. Res. 25, 673–681. doi: 10.1007/s11284-010-0701-7
Edwards, A. M. (2011). Overturning conclusions of Levy flight movement patterns by fishing boats and foraging animals. Ecology 92, 1247–1257. doi: 10.1890/10-1182.1
FAO-SEDER. (2016). Diagnóstico de los Sectores de la Pesca y la Acuacultura en el Estado de Yucatán. Rome: FAO.
Fulton, E. A., Smith, A. D., Smith, D. C., and van Putten, I. E. (2011). Human behaviour: the key source of uncertainty in fisheries management. Fish Fish. 12, 2–17. doi: 10.1111/j.1467-2979.2010.00371.x
Gautestad, A. O., and Mysterud, A. (2013). The Lévy flight foraging hypothesis: forgetting about memory may lead to false verification of Brownian motion. Mov. Ecol. 1, 1–18. doi: 10.1186/2051-3933-1-9
Hilborn, R. (2007). Reinterpreting the state of fisheries and their management. Ecosystems 10, 1362–1369.
Holland, D. S., and Sutinen, J. G. (1999). An empirical model of fleet dynamics in New England trawl fisheries. Can. J. Fish. Aquat. Sci. 56:253264. doi: 10.1139/f98-169
James, A., Plank, M. J., and Edwards, A. M. (2011). Assessing Lévy walks as models of animal foraging. J. R. Soc. Interface 8, 1233–1247. doi: 10.1098/rsif.2011.0200
Joo, R., Bertrand, A., Bouchon, M., Chaigneau, A., and Demarcq, H. (2014). Ecosystem scenarios shape fishermen spatial behavior. The case of the Peruvian anchovy fishery in the Northern Humboldt Current System. Prog. Oceanogr. 128, 60–73. doi: 10.1016/j.pocean.2014.08.009
Kareiva, P. M., and Shigesada, N. (1983). Analyzing insect movement as a correlated random walk. Oecologia 56, 234–238. doi: 10.1007/bf00379695
Klafter, J., Blumen, A., Zumofen, G., and Shlesinger, M. F. L. (1990). Lévy walk approach to anomalous diffusion. Physica A 168, 637–645. doi: 10.1016/0378-4371(90)90416-p
Kroodsma, D. A., Mayorga, J., Hochberg, T., Miller, N., Boerder, K., Ferretti, F., et al. (2018). Response to Comment on “Tracking the global footprint of fisheries. Science 361, eaat7789. doi: 10.1126/science.aat7789
Mark, K. (1947). Random Walk and the Theory of Brownian Motion. Am. Math. Mon. 54, 369–391. doi: 10.1080/00029890.1947.11990189
Marzuki, M. I., Garello, R., Fablet, R., Kerbaol, V., and Gaspar, P. (2015). Fishing gear recognition from VMS data to identify illegal fishing activities in Indonesia. In Oceans 2015-Genova. New York: IEEE. doi: 10.1109/OCEANS-Genova.2015.7271551
McCluskey, S. M., and Lewison, R. L. (2008). Quantifying fishing effort: a synthesis of current methods and their applications. Fish Fish. 9, 188–200. doi: 10.1111/j.1467-2979.2008.00283.x
Metcalfe, K., Collins, T., Abernethy, K. E., Boumba, R., Dengui, J. C., Miyalou, R., et al. (2017). Addressing uncertainty in marine resource management; combining community engagement and tracking technology to characterize human behavior. Conserv. Lett. 10, 460–469. doi: 10.1111/conl.12293
Patlak, C. S. (1953). Random walk with persistence and external bias. Bull. Math. Biophys. 15, 311–338. doi: 10.1007/BF02476407
Pikitch, E. K., Santora, C., Babcock, E. A., Bakun, A., Bonfil, R., Conover, D. O., et al. (2004). Ecosystem-based fishery management. Science 305, 346–347. doi: 10.1126/science.1098222
Plank, M. J., and Codling, E. A. (2009). Sampling scale and misidentification of Lévy and non-Lévy movement paths. Ecology 90, 3546–3553. doi: 10.1890/09-0079.1
Pyke, G. H. (2015). Understanding movements of organisms: it’s time to abandon the Lévy foraging hypothesis. Methods Ecol Evol. 6, 1–16. doi: 10.1111/2041-210X.12298
Quijano, D., Salas, S., Monroy-García, C., and Velázquez-Abunader, I. (2018). Factors contributing to technical efficiency in a mixed fishery: implications in buyback programs. Mar. Policy 94, 61–70. doi: 10.1016/j.marpol.2018.05.004
Renshaw, E., and Henderson, R. (1981). The correlated random walk. J. Appl. Probab. 18, 403–414. doi: 10.2307/3213286
Salas, S., Sumaila, U. R., and Pitcher, T. (2004). Short-term decisions of small-scale fishers selecting alternative target species: a choice model. Can. J. Fish. Aquat. Sci. 61, 374–383. doi: 10.1139/f04-007
Shlesinger, M. F., and Klafter, J. (1986). Lévy Walks Versus Lévy flights. On Growth and Form. Dordrecht: Springer.
Turchin, P. (1998). Quantitative analysis of movement. Measuring and modeling population redistribution in animals and plants. Sunderland: Sinauer Associates.
Ulrich, C., and Andersen, B. S. (2004). Dynamics of fisheries, and the flexibility of vessel activity in Denmark between 1989 and 2001. ICES J. Mar. Sci. 61, 308–322. doi: 10.1016/j.icesjms.2004.02.006
van Putten, I., Lalancette, A., Bayliss, P., Dennis, D., and Hutton, T. (2013). Norman-López, et al. Bayesian model of factors influencing indigenous participation in the Torres Strait tropical rocklobster fishery. Mar. Policy 37, 96–105. doi: 10.1016/j.marpol.2012.04.001
Viswanathan, G. M., Buldyrev, S. V., Havlin, S., da Luz, M. G. E., Raposo, E. P., and Stanley, H. E. (1999). Optimizing the success of random searches. Nature 401, 911–914. doi: 10.1038/44831
Wang, R., and Zhu, G. (2019). Inferring Behavior of Chinese Krill Fishing Vessel Using a Simple Walk Model. J. Ocean Univ. China 18, 939–946. doi: 10.1007/s11802-019-3976-5
Wijermans, N., Boonstra, W. J., Orach, K., Hentati−Sundberg, J., and Schlüter, M. (2020). Behavioural diversity in fishing-Towards a next generation of fishery models. Fish Fish. 21, 872–890. doi: 10.1111/faf.12466
Wilen, J. E. (2004). Spatial management of fisheries. Mar. Resource Econ. 19, 7–19. doi: 10.1086/mre.19.1.42629416
Yoda, K., Tomita, N., Mizutani, Y., Narita, A., and Niizuma, Y. (2012). Spatio-temporal responses of black-tailed gulls to natural and anthropogenic food resources. Mar. Ecol. Prog. Series 466, 249–259. doi: 10.3354/meps09939
Keywords: small scale fisheries, small scale fleet, spatial dynamics, random walk, modeling
Citation: Quijano Quiñones DR, López-Rocha JA, Hernández-Herrera I and Torres-Irineo E (2021) Spatial Dynamics Modeling of Small-Scale Fishing Fleets With a Random Walk Approach. Front. Mar. Sci. 8:669112. doi: 10.3389/fmars.2021.669112
Received: 18 February 2021; Accepted: 22 April 2021;
Published: 25 May 2021.
Edited by:
Andrés M. Cisneros-Montemayor, University of British Columbia, CanadaReviewed by:
Valeria Mamouridis, Independent Researcher, Rome, ItalyCopyright © 2021 Quijano Quiñones, López-Rocha, Hernández-Herrera and Torres-Irineo. This is an open-access article distributed under the terms of the Creative Commons Attribution License (CC BY). The use, distribution or reproduction in other forums is permitted, provided the original author(s) and the copyright owner(s) are credited and that the original publication in this journal is cited, in accordance with accepted academic practice. No use, distribution or reproduction is permitted which does not comply with these terms.
*Correspondence: Edgar Torres-Irineo, ZWRnYXIudG9ycmVzQGVuZXNtZXJpZGEudW5hbS5teA==
†These authors have contributed equally to this work
Disclaimer: All claims expressed in this article are solely those of the authors and do not necessarily represent those of their affiliated organizations, or those of the publisher, the editors and the reviewers. Any product that may be evaluated in this article or claim that may be made by its manufacturer is not guaranteed or endorsed by the publisher.
Research integrity at Frontiers
Learn more about the work of our research integrity team to safeguard the quality of each article we publish.