- Scripps Institution of Oceanography, University of California, San Diego, La Jolla, CA, United States
Over the last several years, the Air-Sea Interaction Laboratory at Scripps Institution of Oceanography has developed a fleet of wave-powered, uncrewed Wave Gliders (Liquid Robotics) specifically designed and instrumented for state-of-the-art air-sea interaction and upper ocean observations. In this study, measurement capabilities from these platforms are carefully described, compared, and validated against coincident measurements from well-established, independent data sources. Data collected from four major field programs from 2013 to 2020 are considered in the analysis. Case studies focusing on air-sea interaction, Langmuir circulations, and frontal processes are presented. We demonstrate here that these novel, instrumented platforms are capable of collecting observations with minimal flow-structure interaction in the air-sea boundary layer, a region of crucial current and future importance for models of weather and climate.
1. Introduction
The ocean and atmosphere are coupled through a continuous exchange of heat, mass, momentum, and energy across the ocean surface boundary layer. While it is now widely recognized that this relationship plays a critical role in larger scale climate models, the details of the smaller scale dynamics on which the models rely are not fully understood (Rogers, 1995; Melville, 1996; Cavaleri et al., 2012). This is in part due to the complexity of making reliable in-situ field measurements of the intermittent phenomena that characterize the time- and space-varying boundary layers of the upper ocean and lower atmosphere. Since the smaller scale physics are not captured by the coarser resolutions of remote sensing technology, there is a necessity for complementary in-situ measurements whether it be for standardized model assimilation, forthcoming satellite sensor calibration and validation missions, or novel fine-scale scientific measurements.
Historically, direct observations of the fundamental variables that are exchanged across the ocean surface have been limited to voluntarily instrumented ships, moored instruments and buoys, surface drifters and floats, a limited number of research vessels and platforms, and uniquely equipped, low-flying research aircraft (Rogers, 1995; Ardhuin et al., 2019; Centurioni et al., 2019; Davis et al., 2019). While there is synergy between this diverse set of observation methods, there are in general several noticeable drawbacks to the current in-situ measurement platform infrastructure. First, buoys and moorings require expensive ship time for remote deployments, recoveries, and maintenance services, and are primarily limited to point measurements near the most populated coastlines in the context of a vast ocean. Secondly, ships, both voluntary and those dedicated to research, are expensive to keep operational, requiring a dedicated crew, and the overall superstructure of the ship itself creates a considerable physical signature on any background air-sea processes that can not be completely filtered out during analysis, and often limits our ability to collect observations close to the ocean surface. Next, drifters and floats are typically designed to be manufactured at higher volumes, with less flexibility for instrumented payload capacity and customization, and their arrays and networks tend to collect in banded, convergent regions, therefore not fully representing the conditions of a given area. Furthermore, research platforms such as the Research Platform Floating Instrument Platform (R/P FLIP) have proven to be the benchmark for novel field measurements, but campaign opportunities are rare and costly, and observations are constrained primarily to point measurements in fixed time windows that may only sample a narrow scope of prevailing atmospheric conditions. Finally, low-flying research aircraft are expensive, scarcely available, have poor relative endurance, and require high levels of human risk.
Over the past two decades, the proliferation of smaller, lower power sensors and data acquisition systems, GPS and Iridium satellite communications, and platforms mechanically designed to harness wind, wave and solar power sources, have allowed for innovative technological alternatives to emerge [i.e., Wave Glider—(Hine et al., 2009), Wirewalker—(Pinkel et al., 2011), Saildrone—(Meinig et al., 2015)]. The Liquid Robotics Wave Glider is a particularly well-suited platform for air-sea interaction measurements that leverages many of these new concepts. The remote operation and minimal supervision that this unique platform requires offers an alternative to operationally demanding and costly research vessels and aircraft. The sustainable solar power source allows for prolonged endurance, while the unlimited source of ocean surface wave propulsion and capacity for towed or profiled sensors allows for flexible horizontal and vertical sampling strategies in remote locations that is not available on typical moored or freely drifting platforms. Also, the unobtrusive design of the vessel minimizes its own physical imprint on the complex environment of the lower atmospheric and upper marine boundary layers that the vessel simultaneously occupies and measures.
Although a relatively recent technology, a number of scientific studies have been cited in the literature that reveal the flexibility of the Wave Glider's capabilities in other oceanographic subdisciplines that range from biological acoustics (Hildebrand et al., 2014; Pagniello et al., 2019), to ocean chemistry (Bresnahan et al., 2016), to seafloor geodesy (Foster et al., 2020). The robust design and autonomous capabilities of this cost-effective measurement platform have also unlocked new opportunities for comparisons between in-situ data and satellite products in remote locations as demonstrated with Chl-a measurements across the Pacific Ocean (Goebel et al., 2014) and wind observations in the Southern Ocean (Schmidt et al., 2017), with similar correlation studies currently underway that focus on better understanding submesoscale ocean dynamics through a comprehensive dataset that includes direct measurements from Wave Gliders as well as airborne observations from cutting edge, remote sensing technologies (see NASA-funded Sub-Mesoscale Ocean Dynamics Experiment, or S-MODE). Air-sea interaction applications have been one of the most well-investigated fields of study using Wave Gliders, with the most extreme examples again demonstrating the rugged vehicle design through direct observations of upper ocean response to intense wind forcing by Lenain and Melville (2014). The most relevant work to the current study was undertaken by Thomson et al. (2018), where they measured the directional wave spectrum and wind stress from onboard instrumentation that was sampled, and independently ground truthed, over the course of seven distinct field campaigns that experienced an extensive range of atmospheric conditions. Although there were some biases observed in the optimal vehicle wave propulsion frequency ranges that requires better characterization in the future, the overall accuracy of the wind and wave spectra and bulk parameterizations was found to be sufficient for model assimilation and within the error bars that can be associated with spatial offsets and platform limitations (i.e., buoy mooring line tension) of the sourced ground truth data.
In this manuscript we present and demonstrate additional measurement capabilities that were not explored in these prior studies, detailing the instrument packages of four Wave Gliders that have been specially equipped with innovative sensor packages for air-sea boundary layer measurements by the Air-Sea Interaction Laboratory at Scripps Institution of Oceanography (SIO). The vehicles were deployed across four different field experiments from 2013 to 2020, with data collected alongside a range of other concurrent measurement platforms and instrument packages. Data are analyzed and compared against the coincident observations and the results are put in the context of existing measurement systems with an emphasis on future applications.
2. Instrumentation
2.1. Wave Glider
The Liquid Robotics (LR, Sunnyvale, California) Wave Glider is an ocean-wave-propelled autonomous surface vehicle (ASV) with a two-body design. The lower portion, called the sub, is tethered to the surface float portion of the vehicle by a 6 m-long (version “SV2”) or 8 m-long (version “SV3”) umbilical cable. The six fins on the sub hinge with a degree of freedom that only allows for alignment with the forward component of the underlying orbital motion of ocean surface waves, converting the elliptical oscillation that is encountered at fin depth into a horizontal force that propels the instrumented surface float forward, independent of wave direction. An electronically controlled rudder attached to the sub allows for maneuverability in the platform's yaw axis when navigating through a collection of user-defined waypoints.
Solar panels are mounted on the top of the float to supply a renewable source of power to onboard navigation and shore communication systems as well as any onboard user instrumentation. Sealed payload bays beneath the solar panels can house data acquisition systems and supporting electronics for the sensor packages that can be installed above or below the ocean surface on the float, along the umbilical, on the sub, or towed behind or below the vehicle either along the ocean surface or at a given depth. The updated SV3 model has a larger footprint than the SV2, with a third solar panel and increased battery capacity for additional power potential, an electric thruster for supplementary propulsion, and an optional electric winch that is mounted to the sub for subsurface sensor profiling.
Control and navigation of the vehicles is handled from user shore stations through an Iridium satellite link. Navigational waypoints and system commands can be sent to the vehicle through a web-based graphical user interface. Telemetry packets with comprehensive platform information as well as sub-sampled payload sensor data is transmitted back to shore using the same vehicle Iridium control link for real-time monitoring during data sampling missions.
The Air-Sea Interaction Laboratory at SIO currently operates a fleet of four Wave Gliders with two SV3 and two SV2 vehicle models that have been instrumented specifically for air-sea interaction research as shown in Figure 1. Details of both platform's sensor payloads, that were designed and fabricated at SIO and are used in the forthcoming analysis, are described in the next section and summarized in Table 1.
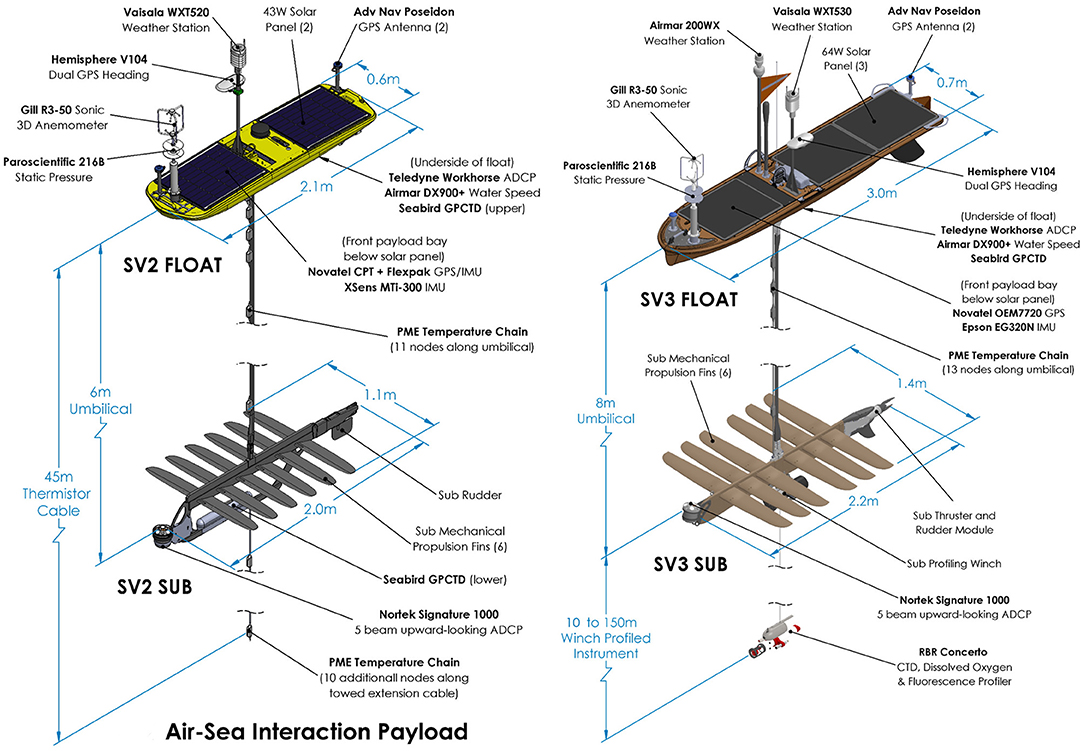
Figure 1. Perspective views of the Air-Sea Interaction Laboratory SV2 and SV3 Wave Gliders showing their respective instrument packages and their most relevant dimensions.
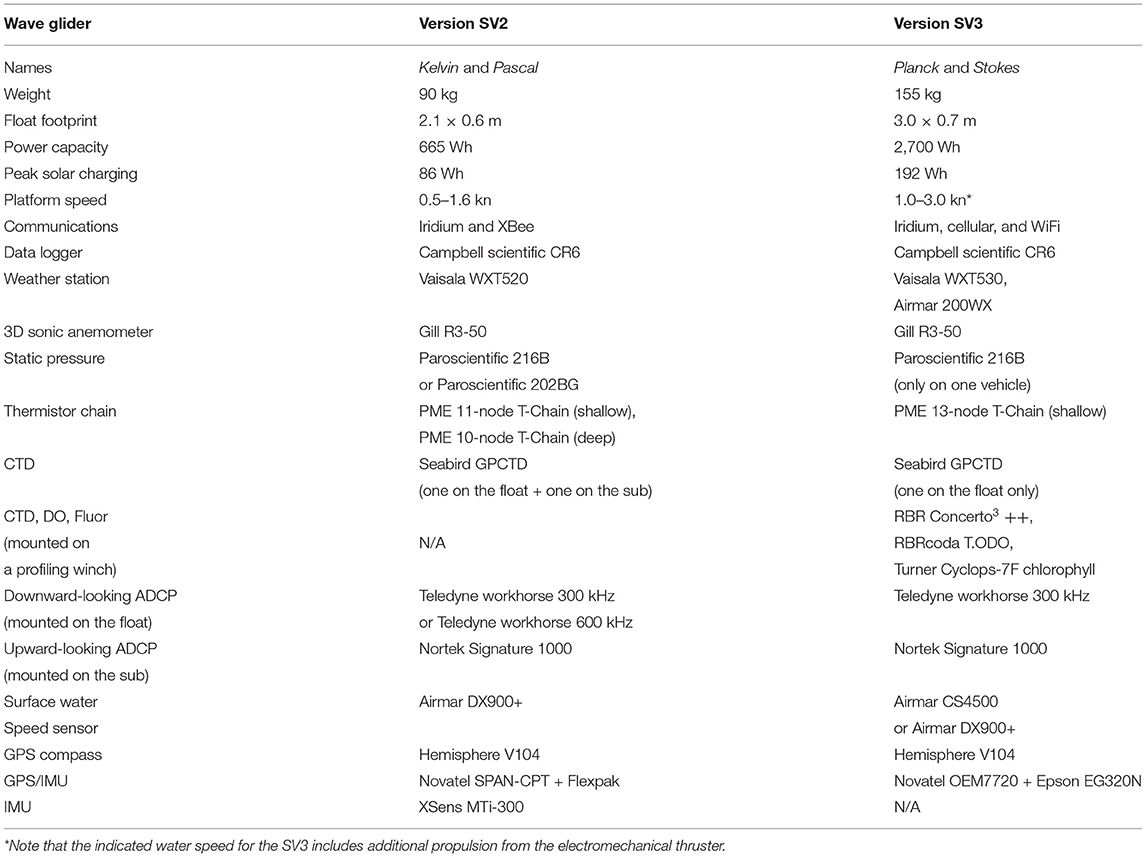
Table 1. General specifications for the Liquid Robotics SV2 and SV3 Wave Glider versions and their respective air-sea interaction payload instrumentation.
2.2. Air-Sea Interaction Payload
Novatel's Synchronous Position, Attitude, and Navigation (SPAN) technology combines a Global Positioning System (GPS) receiver and an inertial measurement unit (IMU) sensor with additional firmware that allows for the synchronization and coupling of the two complementary data streams. The combined trajectory solution can be further post-processed using Novatel's Inertial Explorer software that employs Precise Point Positioning (PPP, Zumberge et al., 1997), a processing technique that removes or models GPS system errors to provide cm-level position and degree-second-level orientation accuracy, even when located far out of range from conventional, terrestrially-based differential ground stations. The SPAN system for the SV2 platform integrates a Novatel FlexPak GPS receiver and Novatel SPAN-CPT IMU, while the SV3 platform combines a Novatel OEM7720 GPS receiver and an Epson EG320N IMU. Two pressure-rated Advanced Navigation Poseidon GPS antennas are mounted at opposite ends of the float, elevated above the deck to optimize heading measurements and satellite constellation coverage, and are connected to the SPAN GPS receiver that is housed inside the sealed payload below the solar panels through bulkhead connections. Note that the SPAN system drains a significant amount of the overall payload power, especially for the SV2 model, and can be power cycled through the Wave Glider's Iridium link via system commands from shore to conserve power during a deployment.
The Hemisphere V104 GPS compass is mounted at about 50 cm above the waterline on a small elevated mast attached to the float for both platforms and acts as the primary GPS receiver when the SPAN is powered off. The compact single housing of the V104 contains dual GPS antennas, a single axis gyro, and two single axis tilt sensors which improve system performance and reliability, helping to mitigate outages and decrease re-acquisition times during poor GPS coverage scenarios that can occur in heavy seas. The SV2 payload also includes an Xsens MTi-300, a low power IMU that can replace the SPAN system during power savings outages.
The Vaisala WXT (model 520 for the SV2, 530 for the SV3) is a weather sensor providing wind speed and direction, air temperature, pressure, humidity, and rain data, and is mounted on the same mast as the V104, ~1 m above the ocean surface. The Airmar 200WX provides similar data as the WXT but without the rain data and with an additionally integrated GPS receiver and IMU, but is only available on SV3 vehicles, and is mounted on its own separate mast ~1.2 m above the waterline. The Gill R3-50 is a 3D sonic anemometer (see Grare et al., 2016) that is mounted vertically on the bow of the float, providing high-rate (20 Hz), three-dimensional wind speed measurements ~75 cm above the ocean surface. A Paroscientific 216B static pressure sensor (a similar Paroscientific 202BG model is used instead on one of the SV2 platforms) is mounted inside the sealed payload, with a custom quad-disc intake probe similar to the design of Nishiyama and Bedard (1991), integrated into the Gill sensor frame and plumbed down through to the sensor in the payload bay via stainless steel braided hose and bulkhead tube fittings.
Precision Measurement Engineering's thermistor chain (T-Chain) is a waterproof electrical cable with inline-molded thermistor nodes that are separated by customizable distances. T-Chains were mounted to both the SV2 (11 thermistor nodes, 6 m long) and SV3 (13 thermistor nodes, 8 m long) umbilical cables that connect the float to the sub. Additionally, an ~40 m long weighted T-Chain extension cable was hanging below the sub on each SV2 platform to provide an added 10 thermistor nodes and two inline pressure sensors down to ~45 m depth.
A Seabird Glider Payload CTD (GPCTD) is also mounted along the keel of the float for both vehicle models in a low-profile enclosure to measure ocean conductivity, temperature, and depth. An additional GPCTD is mounted to the topside of the sub for both SV2 platforms at ~6 m depth. Lastly, an RBR Concerto3 is included on the two SV3 vehicles and can be profiled from 10 m down to ~150 m depth from an integrated Liquid Robotics subsea winch that is mounted directly to the base of the SV3's sub. The Concerto instrument package measures conductivity, temperature, and depth with additionally integrated dissolved oxygen (RBRcoda T.ODO) and chlorophyll (Turner Cyclops-7F) sensors.
Teledyne RD Instruments' Workhorse Monitor acoustic doppler current profiler (ADCP) is also installed on the hull of all vehicles to measure currents from the downward-looking 4-beam transducer design. Both SV3s and one SV2 vehicle are outfitted with a 300 kHz model measuring current profiles down to ~107 m depth, while the second SV2 vehicle is equipped with a 600 kHz model with measurements down to ~73 m depth. Additionally, an upward-looking 5-beam Nortek Signature 1000 ADCP is mounted to the leading edge of the sub for all vehicles, providing high resolution 1 MHz turbulence profiles from 6 m (SV2) or 8 m (SV3) depth up to the ocean surface with a 20 cm vertical resolution. Finally, an Airmar DX900+ (a similar Airmar CS4500 model is used instead on one of the SV3 platforms), an electromagnetic dual-axis water speed and temperature sensor, is also installed on the vehicle's hull.
3. Experiments
3.1. SOCAL2013
SOCAL2013 was an Office of Naval Research (ONR)-funded field campaign set in Southern California that was specifically coordinated to collect spatio-temporal, phase-resolved measurements of wind and waves over a broad range of environmental conditions. The experiment was located between San Clemente and San Nicholas Islands off of Southern California (in the vicinity of 33° 13.202' N, 118° 58.767' W), where the R/P FLIP was moored from 7 to 22 November 2013. The R/P FLIP was instrumented with a suite of sensors (see Grare et al., 2016, 2018; Lenain and Melville, 2017; Lenain et al., 2019) to characterize the atmospheric, surface, and subsurface conditions at the experiment site. Two SV2 Wave Gliders were deployed from the Research Vessel (R/V) Sproul and recovered by the R/V Melville in the vicinity of the R/P FLIP over the course of SOCAL2013.
3.2. LASER2016
The Consortium for Advanced Research on Transport of Hydrocarbon in the Environment (CARTHE), which is funded by the Gulf of Mexico Research Initiative, conducted the LAgrangian Submesoscale ExpeRiment in 2016 (LASER2016) in the Gulf of Mexico, an experiment that was carried out to better understand pollutant transport in the context of submesoscale ocean currents in the open ocean environment. Two SV2 vehicles were deployed and recovered multiple times during the experiment between 25 January 2016 until 10 February 2016 from the R/V Walton Smith. In conjunction with the various in-situ measurements taken during LASER2016, the Modular Aerial Sensing System (MASS, see Melville et al., 2016) was also deployed collaboratively in the vicinity as part of a NASA-funded calibration and validation campaign for the AirSWOT remote sensing instrument (NASA/JPL). The MASS was installed on a Partenavia P68C, a twin engine fixed-wing airplane from Aspen Helicopter, based in Oxnard, California. The MASS collected coincident data in the Gulf of Mexico during 13 science flights over the course of LASER2016, with flight operations based out of Jack Edwards National Airport in Gulf Shores, Alabama.
3.3. LCDRI2017
The Langmuir Cell Department Research Initiative experiment of 2017 (LCDRI2017) was another ONR-funded field experiment set in Southern California, with a focused intent on advancing the understanding of fluxes into and across the ocean mixed layer, including an examination of surface waves and wave breaking, Langmuir cells and wave-current interaction. Like SOCAL2013, this experiment was located between San Clemente and San Nicholas Islands, where the R/P FLIP was again moored and outfitted with a comprehensive array of sensors to characterize the upper ocean and lower atmospheric boundary layers from 16 March to 10 April 2017. Over the course of the field study, two SV2 vehicles were deployed and recovered from the R/V Saikhon in the vicinity of the R/P FLIP and the R/V Sally Ride.
3.4. SIO2020
Data from the profiling RBR CTD was collected during a short 1-day deployment of one SV3 Wave Glider ~2 km offshore of the Scripps Institution of Oceanography Pier in La Jolla, CA on 7 February 2020 (SIO2020). The vehicle was deployed and recovered via the pier's boat crane and towed through shallow waters into reasonable fin-actuating depths by the R/V John P Scripps, a 19 foot Boston Whaler owned by SIO. The SV3 then traversed on its own through a collection of target waypoints that were placed throughout Scripps Canyon, a submarine canyon just offshore from the pier with depths well beyond 100 m, to allow for sensor profiling by the subsea winch installed on the SV3 sub.
3.5. TFOex2020
The Task Force Ocean experiment of 2020 (TFOex2020) was another ONR-funded field experiment set in Southern California, focusing on characterizing the influence of the physical phenomena which occur in the oceanic boundary layer (stratification, internal waves, Langmuir cells) and at the ocean-atmosphere interface (breaking waves) on acoustic transmissions in both shallow and deep waters. The deep part of the experiment took place 200 nm off the coast of San Diego, while the shallow part was conducted between San Clemente and Catalina Islands. Due to COVID-19 restrictions, two SV3 and one SV2 Wave Gliders were deployed only during the shallow water portion of the experiment from 11 November to 24 November 2020. The Wave Gliders were deployed and recovered from the R/V Beyster in the vicinity of the R/V Sally Ride.
4. Comparison With Independent Measurements
In this section we compare Wave Glider observations to measurements collected from either the R/P FLIP or the R/V Sally Ride during the LCDRI2017 experiment.
4.1. Marine Atmospheric Boundary Layer Measurements
Figure 2 presents measurements of atmospheric variables observed by one of the SV2 Wave Gliders (shades of blue), colloquially named Kelvin, alongside measurements from the R/P FLIP (shades of red) during the LCDRI2017 campaign. For this data set, the Wave Glider was maintaining a rectangular pattern around R/P FLIP with a minimum, mean, and maximum separation of 180, 800, and 3,100 m, respectively. On the Wave Glider, all atmospheric measurements were collected from the Vaisala WXT520 weather station mounted 1 m above the sea surface. On the R/P FLIP, wind conditions were measured from a Gill R3-50 sonic anemometer, while atmospheric temperature and humidity were collected from a Campbell Scientific HC2S3 probe. Both instruments were located 8.3 ± 0.3 m above the mean sea level (MSL). Atmospheric pressure was sampled by a LICOR-7500 Open Path CO2/H2O Analyzer mounted 14.0 ± 0.3 m above the MSL. All instruments on the R/P FLIP were mounted on a vertical mast that was secured to the end of the portside boom of the R/P FLIP. For both platforms, wind measurements were corrected to account for the motion of the platform.
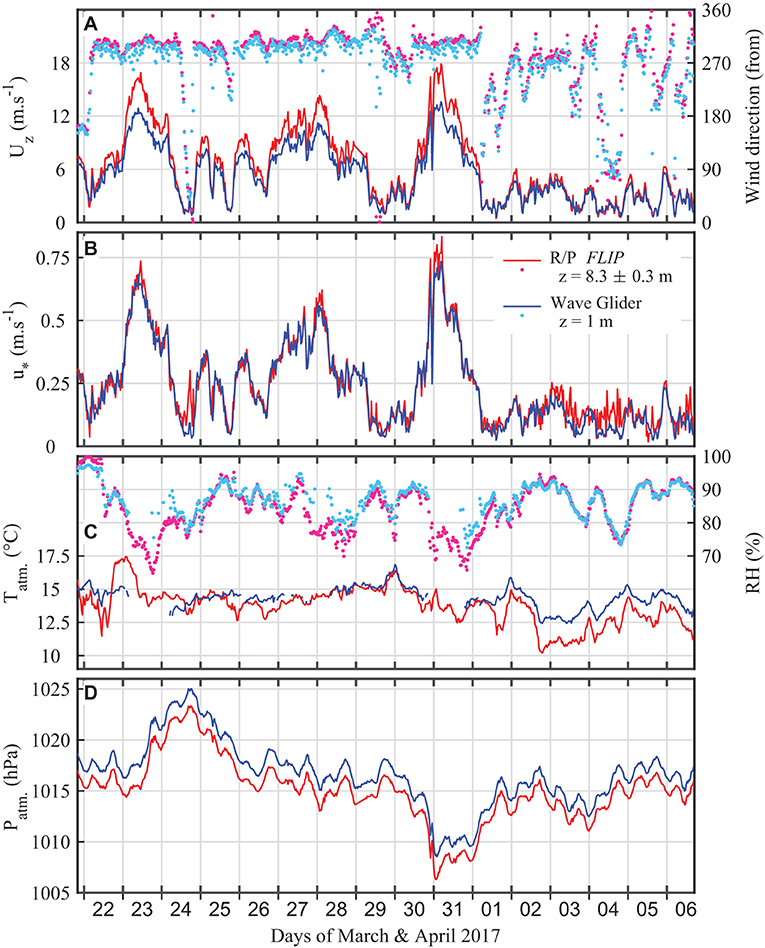
Figure 2. Comparison of atmospheric variables recorded from the R/P FLIP (shades of red) and the SV2 Wave Glider Kelvin (shades of blue) during the LCDRI2017 experiment. (A) Wind speed Uz (left axis, solid lines) and wind direction (right axis, dots). (B) Wind stress u* measured using the eddy-covariance technique on the R/P FLIP and using Charnock's relationship on the Wave Glider. (C) Atmospheric temperature (left axis, solid lines) and relative humidity (right axis, dots). (D) Atmospheric pressure. For all panels, variables are expressed at the height they were measured, i.e., 1 m above the surface layer for the Wave Glider and 8.3 m above the mean sea level for the R/P FLIP. In (C), gaps in the Wave Glider data correspond to measurements that were discarded because they were associated with periods of high wind and waves when the Wave Glider was subject to frequent capsizes, leading to abnormal values of the atmospheric temperature and relative humidity.
In Figure 2A, the wind speed Uz (left axis, dark lines) and wind direction (right axis, light dots) are presented with both variables being expressed at the height z of the instrument, i.e., z = 1 m for the Wave Glider and z = 8.3 ± 0.3 m. Overall we find a good agreement between the measurements collected from the R/P FLIP and the Wave Glider. While we observe a slight bias in the wind direction due to mounting misalignment, the coefficients of determination r2 for the wind direction and the wind speed are 0.84 and 0.99, respectively; the corresponding root mean square errors (rmse) are 22° and 0.25 m s−1. The high coefficient of determination for the wind speed was not expected given the different measurement heights between the two platforms. The slope a of the linear regression between the R/P FLIP and the Wave Glider observations is 0.76 ± 0.01. Note that computing the wind speed at 10 m, U10, using the Charnock relationship (Charnock, 1955), i.e., assuming a wind log profile without accounting for atmospheric stability nor wave effects, the linear regression slope increases up to 0.97 ± 0.01 while keeping r2 = 0.99. We find the degree of correlation for the wind direction to be lower than that of the wind speed. The slope a of the linear regression is also low (a = 0.78 ± 0.02). These differences are driven by observations collected during low wind speeds. When only considering wind speeds larger than 3 m s−1, r2 increases to 0.94, the rmse decreases to 7° and the slope a increases to 0.96 ± 0.02. The differences at low wind speed can be attributed in some parts to the accuracy of the GPS compass variables (e.g., heading, speed, and course over ground) used to motion-compensate and geo-reference the apparent wind measured by the instrument in the frame of the vehicle. These GPS compass variables have intrinsic accuracies which do not depend, to first order, on the wind speed. Therefore, when the wind is moderate or high, intrinsic errors of these variables are small and negligible compared to the wind speed. However, when the wind is low and comparable to the speed of the platform, these errors are proportionally larger and could explain this bias. More importantly, a larger source of the discrepancy can likely be attributed to the increase in the spatial variability of wind conditions under a background of low winds, increasing the bias introduced by the physical platform separation that was experienced during data collection.
In Figure 2B, measurements of the friction velocity u* is presented for both platforms. For the Wave Glider, the friction velocity is estimated using the modified version of the Charnock's relationship (Charnock, 1955) used in the COARE model (Equation 6, Fairall et al., 2003), while for the R/P FLIP, u* is computed using eddy-correlation techniques (Grare et al., 2013, 2018). The agreement between the two estimates is remarkable, with a coefficient of determination r2 of 0.95, rmse = 0.04 m s−1 and a linear regression slope between the two products equal to 0.97 ± 0.02. We do observe some disparities for high winds (and waves). This might be caused by the break down of the Charnock assumptions used to derive u* from the mean wind speed Uz, specifically the wave effects on the airflow (i.e., airflow separation, wave-induced momentum flux) that can no longer be ignored.
In Figure 2C, both atmospheric temperature (left axis, dark lines) and relative humidity (right axis, light dots) are reported. As the profile of the atmospheric temperature depends strongly on the stability of the marine atmospheric boundary layer (MABL), it is not surprising to observe, at times, large differences in the observations collected from the two platforms, since they were collected at different elevations. In general, the atmospheric temperature measured from the Wave Glider is warmer than that measured from a higher elevation on the R/P FLIP, as the ocean was on averaged warmer than the lower atmosphere. For the relative humidity (RH), we generally find a good agreement between the two platforms with a few periods of time subject to large differences (e.g., on the March 23, 28, and 31). These occurred when the wind was high (>10 m s−1) and the significant wave height Hs was >2 m, corresponding to periods of time where the SV2 Wave Glider was subject to frequent capsizing, especially in cross-wind and -wave transect heading angles. Data recorded in these conditions were discarded for this reason.
Finally, in Figure 2D, comparison of the atmospheric pressure collected from both platforms is shown. The agreement is good when accounting for the bias ΔP = ρagΔz due to the height of measurement difference Δz. The slope of the linear regression is then 1.01 ± 0.01, the coefficient of determination is 0.995, and the rmse is 0.21 hPa.
4.2. Water Temperature Profiles
A comparison of the water temperature over the first 50 m of the ocean boundary layer measured by the respective T-Chains that were mounted on both the SV2 Wave Glider Kelvin and on the R/P FLIP during the LCDRI2017 campaign is shown in Figure 3A. The colored timeline corresponds to data collected from the R/P FLIP while the white (15.2°), light gray (14.8°), dark gray (14.65°), and black (14°) contour lines correspond to the Wave Glider measurements. Data are averaged over 20 min long records. As described earlier, the Wave Glider T-Chain is split into two sections, with the shorter upper portion located between the float and the sub, attached to the Wave Glider umbilical, and the longer lower portion towed below the sub using a weighted downrigger mounted to the deep end to maintain a vertical orientation of the T-Chain. The top section is composed of 11 temperature nodes, while the bottom section is equipped with 10 thermistors plus two pressure sensors to compute the actual depth at each node. The temperature sensors are spaced logarithmically near the surface and linearly at increasing depth such that their distances from the surface are 0.34, 0.60, 0.81, 1.00, 1.51, 2.00, 2.50, 3.24, 3.99, 4.73, and 5.73 m for the upper portion, and 7.48, 11.48, 15.48, 19.48, 23.48, 27.48, 31.48, 35.48, 39.48, and 43.48 m for the lower portion, while the integrated pressure nodes are located at 24.48 and 45.48 m below the surface. The depth of the sub is derived using data from the GPCTD that is mounted on the sub. When the Wave Glider is underway, the drag that is induced by the water friction, which depends on both the Wave Glider speed and the oceanic current, modifies the depth of each temperature node. The actual depth of each thermistor is calculated through linear interpolation using the depth of two consecutive pressure sensors. On the R/P FLIP, the T-Chain is composed of 17 temperature sensors, again logarithmically spaced close to the surface, extending down to 51 m water depth. The T-Chain is lowered from the end of one of the R/P FLIP's booms and heavily weighted at its deep end to keep the chain as vertical as possible. The depth of the reference bottom pressure sensor varied by less than half a meter during the deployment, so we therefore assume that the 17 nodes of the R/P FLIP T-Chain remained at a constant depth during the experiment. Data sets from the two T-Chains were interpolated onto a fixed vertical grid and compared with each other over the course of LCDRI2017 in Figure 3A. Good agreement between measurements from the two platforms is observed with a coefficient of determination equal to 0.82 and a root mean square error of 0.27°C. Note that some of these differences can be in part explained by the fact that the measurements and reference frames of the Wave Glider and the R/P FLIP are not identical. On the Wave Glider, the measurements are performed in a wave-following frame, ideal for measurements close to the surface, with the temperature sensors remaining at a constant distance from the oscillating surface. However, at greater depths where the vertical displacement of the water column is minimal, the nodes of the T-Chain experience a wave-coherent motion as the sub moves up and down under the action of the waves above. This motion is responsible for a pseudo-profiling of the water column around the mean depth of the T-Chain nodes. On the other hand, the R/P FLIP T-Chain is fixed with minimal vertical motion. This impacts the measurement quality close to the surface as upper nodes can end up completely out of the water in the trough of large waves, but with the benefit of uncontaminated measurements in the absence of T-Chain motions at larger depths.
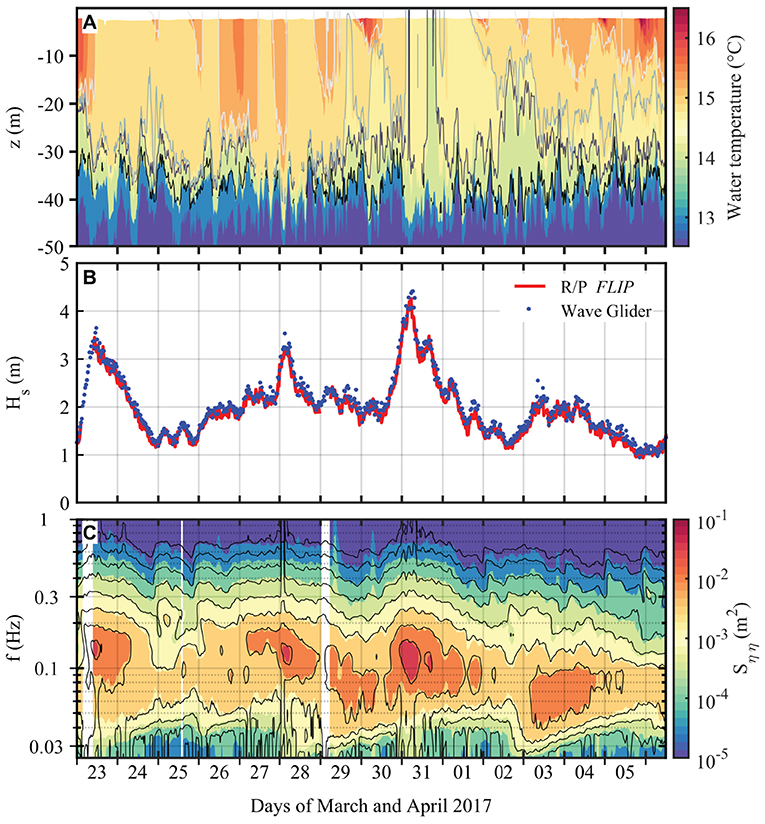
Figure 3. (A) Time evolution of the water temperature during the LCDRI2017 experiment measured by the thermistor chains mounted on the SV2 Wave Glider Kelvin and on the R/P FLIP. Colormap and contour lines correspond to data from the R/P FLIP and from the SV2 Kelvin, respectively. The white contour line corresponds to 15.2°C, light gray is 14.8°C, dark gray is 14.65°C, and black is 14.0°C. Direct comparison of 20 min averaged water temperature between the two instruments gives a coefficient of determination r2 = 0.8 ± 0.03. (B) Significant wave height Hs and (C) omni-directional spectrogram of the wave field measured from the R/P FLIP and the SV2 Wave Glider Kelvin during LCDRI2017. In (C), the colored map and black contours are from the R/P FLIP and the Wave Glider, respectively. The significant wave height Hs is computed from the integration of the omni-directional spectrum, both being computed over 30 min long records. For the R/P FLIP, Sηη is computed from a single laser wave gauge, while for the Wave Glider, the surface elevation is assumed to be described by the vertical displacement (heave motion) of the Wave Glider. The coefficient of determination r2 for Hs is equal to 0.95.
4.3. Surface Wave Observations
Figures 3B,C, 4 show comparisons of wave statistics computed from measurements collected from the SV2 Wave Glider Kelvin and from the R/P FLIP during the LCDRI2017 experiment. On the R/P FLIP, surface waves were characterized using an array of laser waves gauges (Measurement Device Limited ILM-500) that were mounted on each of the horizontally extended port, starboard, and face booms to derive both omni- and directional wave spectra. Horizontal spacing between the laser wave gauges ranged from about 1 to 45 m. On the Wave Glider, surface wave measurements are derived from the motion of the float, specifically the vertical displacement (heave) and horizontal velocities measured by the Hemisphere V104 dual-antenna GPS receiver. As outlined by Thomson et al. (2018), GPS antenna lever arm height corrections are small (the GPS antenna is located 50 cm above the waterline) and have therefore been neglected here. Statistical variables are computed over 30 min records. The omnidirectional spectrum Sηη(f) is computed over a 200 s moving window with a 100 s overlap providing a frequency resolution of 0.005 Hz. The significant wave height Hs is computed by integrating the omnidirectional spectrum from 0.04 to 1 Hz, such that . On the R/P FLIP, the directional spectra are computed from the WAFO toolbox (Iterative Maximum Likelihood Method, IMLM, WAFO-group, 2000) using the point observations of surface displacement collected from the array of wave gauges. For the Wave Glider, the wave directional spectra are computed following Thomson et al. (2018), computing the four normalized directional Fourier coefficients (a1, b1, a2, b2) to estimate the directional distribution using a maximum entropy method as described in Lygre and Krogstad (1986) and Krogstad (1989).
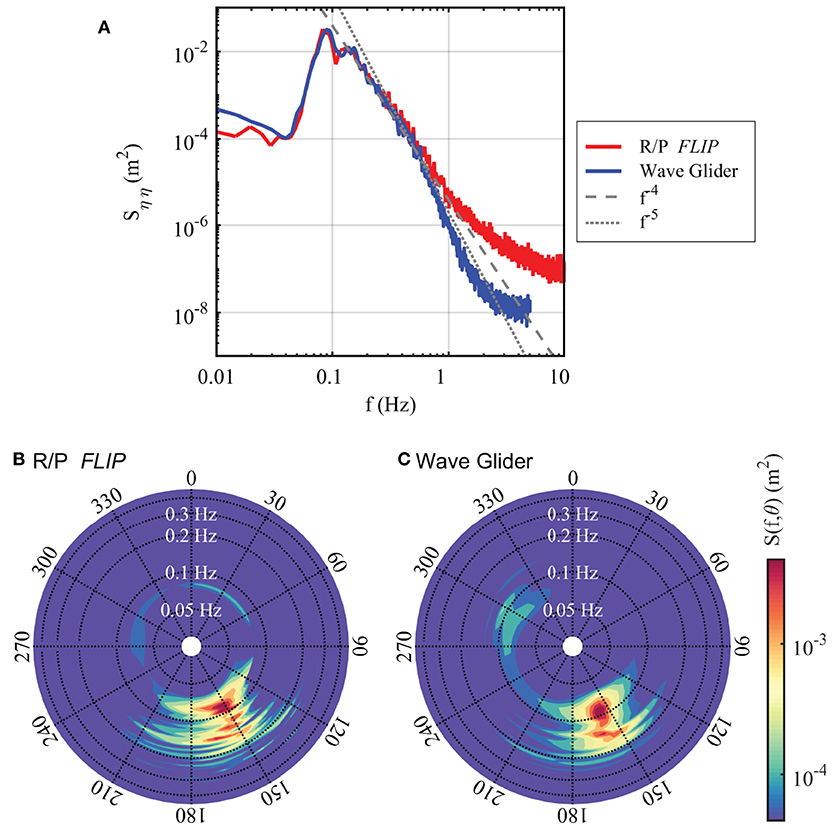
Figure 4. (A) Comparison of the omni-directional wave spectra measured from the R/P FLIP (red) and the SV2 Wave Glider Kelvin (blue) from the 30 min record starting at 2300 UTC 31 March 2017 during LCDRI2017 while the wind was blowing at 8.1 m s−1. For the R/P FLIP, Sηη is computed from the surface displacement measured by a single laser wave gauge, while for the Wave Glider, the surface elevation is assumed to be described by the vertical displacement (heave motion) of the Wave Glider. There is good agreement between the two platforms in the frequency range [0.04, 0.6] Hz. (B,C) Comparison of surface wave directional spectra measured from the R/P FLIP and the SV2 Wave Glider Kelvin during the same 30 min record as in (A). For the R/P FLIP, the directional spectrum was derived from the array of single point laser wave gauges mounted on each of the R/P FLIP booms. For the Wave Glider, the directional spectrum was derived from the three components of the Wave Glider velocity. Both directional spectra are computed using the WAFO toolbox. Frequency increases radially outward following a logarithmic scale from the center of each plot, with the color scale depicted as the log of the energy density.
Figure 3B shows the significant wave height Hs measured from the R/P FLIP (red line) and from the SV2 Wave Glider Kelvin (blue dots), while Figure 3C shows the surface wave omnidirectional spectrogram measured from R/P FLIP (colored background) and from the Wave Glider (contour lines) deployed during the LCDRI2017 experiment. The agreement between the observations collected from the two platforms is excellent. For Hs, we find a coefficient of determination r2 of 0.97 with a 0.12 m rmse while the slope and intercept of the linear regression are 1.01 ± 0.02 and 0.04 ± 0.03, respectively. We find at times some discrepancies between the two products, caused by the loss of GPS signals during Wave Glider capsizes, e.g., at 0100 UTC 28 March 2017. During this particular 30 min record, we identified 31 occurrences of float roll angles >45°, of which 11 led to a capsize (roll angle >90°). Overall, despite these few cases, we find good agreement between the surface wave measurements collected from the R/P FLIP and the Wave Glider. The spectrogram comparison over the range of frequencies plotted in Figure 3C gives a coefficient of determination r2 of 0.89 while the slope and intercept of the linear regression are 1.02 ± 0.005 and 0.01 ± 0.004, respectively. Note that, for the wave Glider measurements, outliers at low frequencies (i.e., below 0.04 Hz) are generated by perturbations to the GPS signal produced by either atmospheric disturbances, poor satellite coverage or changes in the satellite constellation. At these low frequencies, additional post-processing of GPS data is required to properly resolve ocean surface topography; this is not achievable with the V104 instrument currently installed on the Wave Glider but possible with higher-end GPS receivers.
Figure 4A shows the surface wave omnidirectional spectra computed from one of the SV2 Wave Glider (blue) and from the R/P FLIP (red) on 2300 UTC 31 March 2017 computed over a 30 min record during LCDRI2017. We find a good spectral agreement between both platforms, especially from 0.04 to 0.6 Hz. These spectra both follow a −4 slope (thick gray dashed line), characteristic of the “equilibrium” range, up to >0.5 Hz. Lenain and Pizzo (2020) predict a transition from equilibrium to saturation ranges that depends on the friction velocity, such that a transition frequency where r is a constant set to 9.7e-3. Here we find fn= 0.51 Hz, approximately the same frequency where the spectrum computed from the Wave Glider exhibits a transition from −4 to −5 slope, as expected from the theory (Lenain and Melville, 2017; Lenain and Pizzo, 2020). A −5 slope line is also plotted, for reference.
Corresponding directional spectra from the same two data sources are shown in Figures 4B,C. Note that the concentric rings represent the frequency range, logarithmically spaced, with the color scaled to the log of the energy density. While we find minor differences in the directional spectra estimated from the two platforms, likely caused by the different type of measurement techniques and associated processing, we find that the mean direction and spreading captured by the Wave Glider is in good agreement with the observations from the R/P FLIP. Further analysis of additional statistical wave parameters (e.g., mean wave period Tp or mean wave direction θp) is not included, as it is beyond the scope of this manuscript. Note that a detailed directional wave spectrum performance validation computed for Wave Glider platforms is already presented in Lenain and Melville (2014) and Thomson et al. (2018).
4.4. Current Profiles
In Figure 5, 30 min averaged profiles of east (top) and north (bottom) components of the current measured during the LCDRI2017 experiment from the SV2 Wave Glider Kelvin (colored background plot) and the R/V Sally Ride (black contours) for a 5-day period starting on 1200 UTC 01 April 2017 are shown.
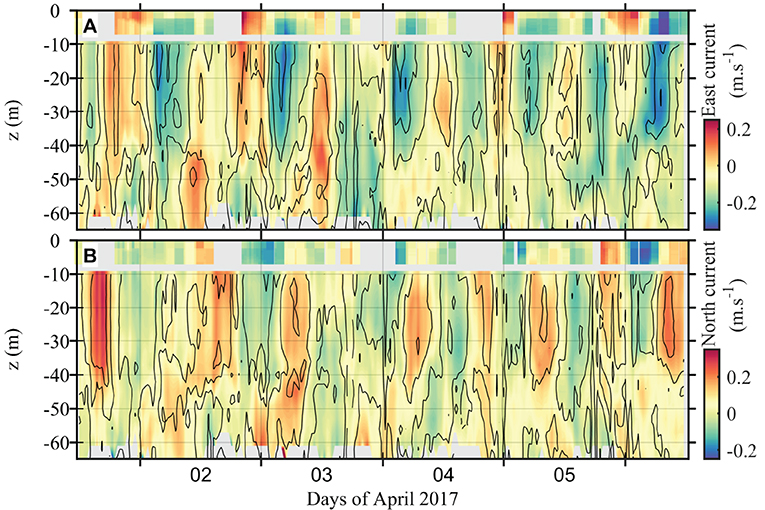
Figure 5. (A) East current and (B) north current components measured by the SV2 Wave Glider Kelvin (colormap) and the R/V Sally Ride (black contours) during LCDRI2017. Current above 6 m depth was measured by the upward-looking 5-beam Nortek Signature 1000 ADCP, while current below this depth was measured by the downward-looking Teledyne RDI Workhorse 600 kHz ADCP. The shallowest measurements (at 5.08 m depth) from the RDI ADCP were removed because they were contaminated by side-lobe reflections due to the sub fins. Direct comparison of the 30 min averaged current components between the downward-looking ADCPs from the two platforms gives a coefficient of determination r2 = 0.70 when comparing currents measured at depths in the 9.6–60.6 m depth range.
The Wave Glider was equipped with two ADCPs: a downward-looking Teledyne RDI Workhorse 600 kHz ADCP mounted on the float, and an upward-looking Nortek Signature 1000 5-beam ADCP mounted on the sub. The downward-looking ADCP was set to actively transmit 30 pings for 15 s per 60-s ensemble, with 25 4-m measurement bins from 5.1 down to 101.1 m depth. Velocity profiles are recorded in the Wave Glider float frame of reference and subsequently corrected for the Wave Glider velocity and heading using the V104 sensor (15 s averaged) to obtain current profiles in an earth coordinate system. Note that data for the bin closest to the vehicle's sub are discarded, as they are contaminated by spurious return signals from the underwater sub. The upward-looking Signature 1000 ADCP was set to sample at 16 Hz, with the four angled beams interleaved with the fifth vertical beam (i.e., at 8 Hz each). Velocities were recorded in “beam” mode, with 40 range bins, corresponding to a 0.25 m vertical resolution, profiling from about 6 m water depth up to the ocean surface. The high frequency content (f>0.05Hz) of the sub velocity was estimated using the attitude and heading reference system (AHRS) that was integrated inside the Signature 1000, while its lower frequency content was assumed to be described by the motion of the float and was therefore computed from the low-pass filtered position output of the V104. Attitude angles were provided by the integrated AHRS measurements for all frequencies. The combination of these velocities and angles were used to express ocean currents in an earth frame coordinate system.
The R/V Sally Ride was equipped with a downward-looking Teledyne WorkHorse 300 kHz ADCP mounted on the hull, 4 m below the waterline. The ADCP was set to record 120 s ensembles made of 150 pings, measuring currents at 50 depths, every 2 m from about 10–108 m depth. Each ensemble (averaged over the 150 pings) was corrected for the motion and orientation of the ship and expressed in an earth frame coordinate system using 120 s averaged attitude and position products from the onboard R/V Sally Ride gyroscope and GPS sensors.
The two data sets presented in Figure 5 are in good agreement, with both data sets showing a clear tidal diurnal regime along with a sharp change of current profiles across the base of the mixed layer (around z = −40 m). Despite the data gap near the Wave Glider sub, we also find a good overall continuity between observations from the downward- and upward-looking ADCPs mounted on the Wave Glider. Note that although the theoretical maximum range of the 600 kHz ADCP is only 51.5 m, we were at times able to perform reliable measurements down to about 65 m. Both averaged data sets were interpolated onto the same vertical grid (−13.5 < z < −60.5 m) and were compared against each other. The comparison was carried out for the east and north components of the current as well as on its absolute speed. For this range of depth, the coefficient of determination was, respectively 0.74, 0.73, and 0.70 with a rmse equal to 0.04 m s−1 for all components. The slopes of the linear regression are 0.922 ± 0.019, 0.904 ± 0.020, and 0.841 ± 0.020, respectively, while the intercepts are respectively −0.009 ± 0.003, −0.004 ± 0.002, and 0.023 ± 0.003 m s−1. Note that using observations at shallower depths improve the comparison. For example, considering only data such that z > −36.5 m (above the mixed layer base) leads to an increase of r2 up to 0.82, 0.82 and 0.78, respectively, along with a minor increase (about 2–5%) of the slopes of the linear regression. For the purpose of this comparison, the R/V Sally Ride observations collected while the ship was underway or changing course were discarded in the analysis. We found that the R/V Sally Ride current observations were highly sensitive to changes in the speed and heading of the ship, inherent to the selected ADCP settings (i.e., 120 s averaged ensembles) that intrinsically assume that in order to properly correct the current observations for ship motion, the ship speed and heading need to remain constant over the duration of the ensemble (120 s). The same comment applies to the Wave Glider downward-looking ADCP observations as the ADCP was also set to record ensembles, although shorter (15 s) than on the R/V Sally Ride. Following this particular field experiment, to improve the quality of the Wave Glider current measurements, the sampling strategy was revised to instead record each profile per individual acoustic ping, applying the motion-compensation correction to each sample before averaging the data. We believe this is the best strategy to perform accurate current profile measurements from a highly dynamic platform. An example of current profiles measured using this improved strategy is presented in Figures 6B,C. This data set was collected in November 2020 during the TFOex2020 from the SV3 Wave Glider Planck using a 300 kHz Workhorse ADCP from Teledyne RDI with a 2 m resolution. Note that these current profiles are the motion-compensated averaged products computed in real-time by the payload that are sent back to shore every 15 min. Each individual ADCP ping (i.e., every second) is corrected for the velocity of the Wave Glider. The measurements at −8 and −16 m were discarded because they were contaminated by side-lobe reflections from the Wave Glider sub. Current profiles are not affected by changes of the platform heading that are despicted in Figure 6A and the improved vertical discretization enables resolving fine structures such as those observed in Figures 6B,C. As part of the upcoming NASA S-MODE field program, we plan to conduct a detailed validation of the Wave Glider current profile observations against a bottom-mounted, upward-looking ADCP in the spring of 2021.
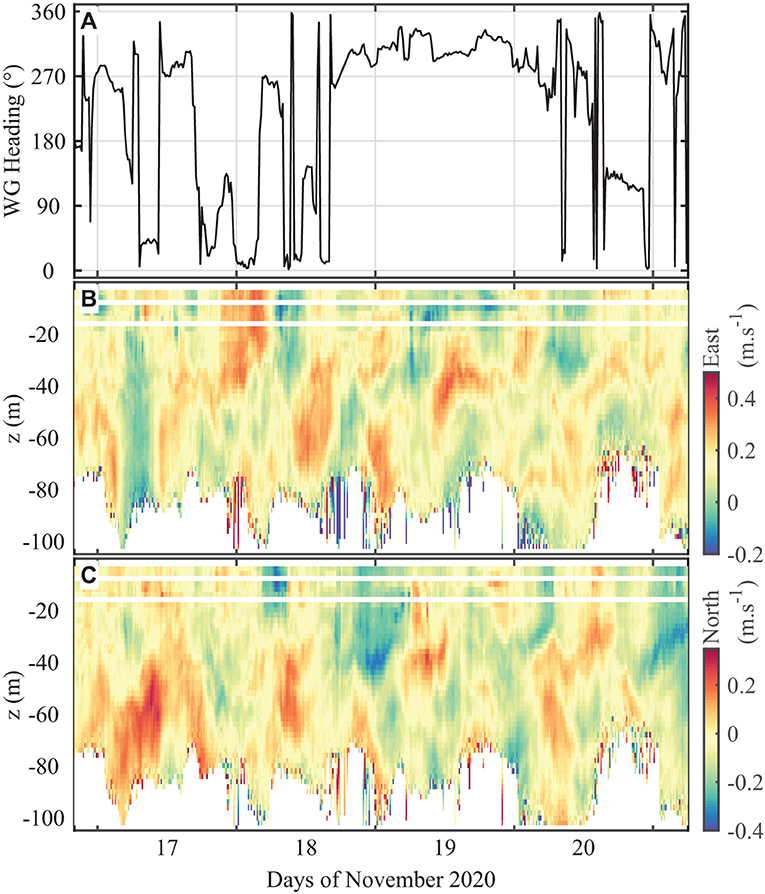
Figure 6. (A) Heading angle of the platform, (B) east current, and (C) north current components measured by the SV3 Wave Glider Planck during the TFOex2020 experiment. The measurements at 8 and 16 m were discarded because they were contaminated by side-lobe reflection due to the sub fins. Current measurements were performed by a 300 kHz downward-looking ADCP. These current profiles are the motion-compensated, averaged products computed in real-time by the payload and sent back to shore via Iridium satellite communications every 15 min. Each individual 1 s ADCP ping is corrected for the velocity of the platform and, subsequently, the current profiles do not exhibit any correlations with the heading of the Wave Glider that had been observed previously when motion compensation was executed after averaging over longer duration, multiple ping ensembles.
Figure 7 shows a comparison of the 30 min averaged profiles of east (left panel) and north (right panel) components of the ocean current collected during the LCDRI2017 experiment starting at 0900 UTC 02 April 2017. Profiles from the two SV2 Wave Gliders, Kelvin in blue and Pascal in black, are presented along with observations from the R/V Sally Ride data in red. During this 30 min record, the R/V Sally Ride remained approximately idle, with an average speed of <2 cm s−1 while maintaining a constant heading. We find good agreement between observations from the three different platforms below 10 m, the minimum depth that is reasonably achievable from the ship-mounted ADCP. The plots also highlight the change in current profiles across the mixed layer depth. At the top of the ocean boundary layer (OBL), we find continuity of the current profiles from the downward- to the upward-looking ADCPs for both Wave Gliders. Discrepancies between the two Wave Gliders found in the near-surface current observations are caused by spatial variability, as the Wave Gliders were separated by 1.5 km at that particular time. Note that the ability to collect current profiles close to the surface is crucial to relate orbital and suborbital remote sensing velocity products to the more traditional in-situ measurements that usually only provide valid observations at depths larger than a few meters. Figure 7 shows that these instrumented Wave Gliders are well suited to bridge that gap.
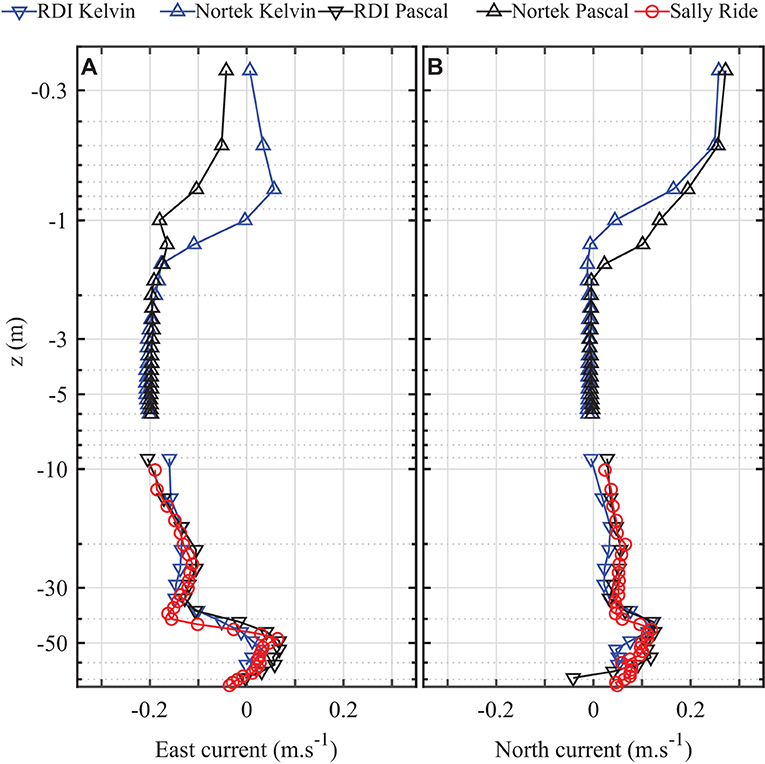
Figure 7. Example of profiles of the (A) east and (B) north components of the current from both the SV2 Wave Gliders Kelvin (blue) and Pascal (black), and from the R/V Sally Ride (red) during the LCDRI2017 experiment. These profiles were averaged over a 30 min record starting at 0900 UTC 2 April 2017. The agreement between the three platforms is good as well as the continuity of measurements between the downward- (down triangle) and upward- (up triangle) looking ADCPs that are mounted on the Wave Gliders. Note that at the time of this particular record, the Wave Gliders were separated by 1.5 km.
5. Air-Sea Interaction and Upper Ocean Research From Wave Gliders
In this section, we present a series of scientific results showcasing the unique capabilities of these instrumented Wave Gliders.
5.1. Wind Fluctuations
Figure 8 presents wind turbulence measurements from the Gill R3-50 instrument mounted on the SV2 Wave Glider Pascal during the SOCAL2013 experiment off the coast of Southern California. Phase-averaged observations of ocean surface elevation (blue) and downwind (red) and vertical (black) wind components are plotted together from a 6 min record starting at 1908 UTC 14 November 2013 in Figure 8A. In this case the mean wind speed was 4.3 m s−1 with the phase speed of the dominant waves Cp = 13.3 m s−1, i.e., measurements were performed below the critical layer of the dominant waves. The critical layer lies at the height where the mean wind speed equals the phase speed of a wave of given wavenumber. Across the critical layer, there is an abrupt change of the wave-induced wind velocities (Miles, 1957; Grare et al., 2013, 2018). Wind measurements were motion compensated using post-processed data from the Novatel SPAN GPS/IMU system and phase-averaged signals were computed following Hristov et al. (1998) and were smoothed using a 30° running-average window. Note the large amplitude of both of the wind component fluctuations along the wave profile and the phase offsets between the surface elevation and the wind components that are consistent with Grare et al. (2018). Figure 8B depicts the power spectral density of the surface elevation along with the downwind and vertical wind components over the same time period. Note the agreement of the wind spectral density and the −5/3 Kolmogorov slope (dashed line), as well as the coherent spectral peaks in the surface elevation and the wind components.
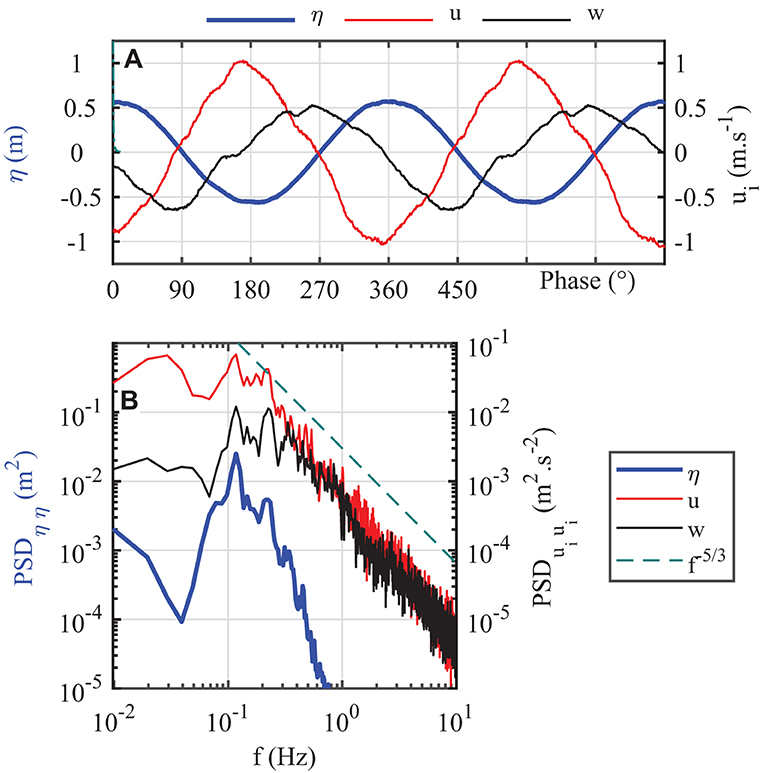
Figure 8. Wind turbulence measurements from the Gill R3-50 three-dimensional ultrasonic anemometer on the SV2 Wave Glider Pascal. (A) Phase-averaged ocean surface elevation η (blue), downwind (red), and vertical (black) wind fluctuations. Phase-averaged signals were smoothed using a 30° running-average window. Downwind fluctuations are the largest and are nearly out-of-phase with the waves while vertical fluctuations are in quadrature with the waves. This is consistent with Grare et al. (2018) when measurements are performed below the critical layer. (B) Power spectral density of the surface elevation (blue) and the two wind components (red and black). Wind fluctuations follow the −5/3 Kolmogorov energy cascade (dashed line) and exhibit peaks of energy collocated with the wave energy peaks. All data were taken from a single 6 min record starting at 1908 UTC 14 November 2013 during the SOCAL2013 experiment.
5.2. Observations of Langmuir Cells
The Craik-Leibovich II (Craik and Leibovich, 1976) theory of Langmuir circulation, or “Langmuir turbulence,” introduces a vortex force that is the vector product of the Stokes drift of the wave field and the vertical vorticity of the ocean currents. This vortex force leads to the generation of coherent streamwise vortical structures, also called Langmuir cells, in the OBL. These Langmuir circulations play a crucial role in upper ocean dynamics and mixing, but are very difficult to observe and characterize in the field.
Figure 9A shows water temperature profiles interpolated from the T-Chain instrument on an SV2 Wave Glider at 0633 UTC 23 March 2017 along a 1,900 m cross-wind transect (roughly 4.5 h in duration) during the LCDRI2017 experiment. At that time the wind speed was 11.8 m s−1 at 1 m above the surface, equivalent to U10 = 15.2 m s−1, while the significant wave height was about 2.7 m. Figure 9B shows a 200-m long enlarged section of the transect with the same color scaling and additional black contour lines that represent the 15.37°C isotherm. The ocean temperature profile exhibits semi-periodic fluctuations from the surface down to the mixed layer depth which are distinctive features in the presence of Langmuir cells, where cold water from the bottom of the OBL ascends toward divergent surface areas, while warm surface waters are brought down under the action of down-welling currents at the location of convergent surface streaks. The 15.37°C isotherm shown in Figure 9B highlights the presence of quasi circular cells in the first 10–15 m of the OBL and also the penetration depth of these Langmuir circulations.
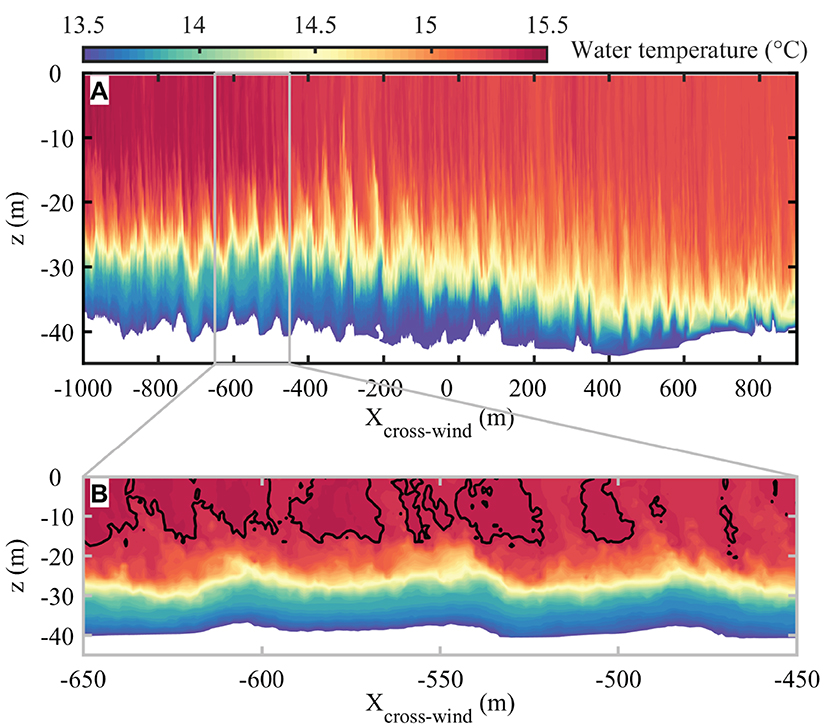
Figure 9. Water temperature profile map along a crosswind transect highlighting the presence of Langmuir cells during LCDRI2017 from the SV2 Wave Glider Kelvin. The transect started at 0633 UTC 23 March 2017 and was completed in 4 h and 39 min. (A) Colored map of the water temperature profiles along the entire 1,900 m long transect. (B) An enlarged 200 m long portion of the transect with the same color scale and additional black contours representing the temperature level at 15.37°C. This isotherm highlights the presence of quasi circular cells in the first 10–15 m of the OBL which are distinctive features representative of Langmuir cells.
Figure 10A shows another example of temperature profiles collected along a cross-wind transect. This 1,700 m long transect started at 1920 UTC 30 March 2017 and was completed in only 50 min during LCDRI2017. We observe similar water temperature fluctuations as in Figure 9. This transect was coincident with a research aircraft overflight, that was equipped with the Modular Aerial Sensing System (MASS, see Melville et al., 2016). This airborne instrument package is equipped with a high-resolution infrared camera (FLIR SC6000) capable of capturing thermal structure at the surface of the ocean with great accuracy, such as the surface signature of Langmuir circulations.
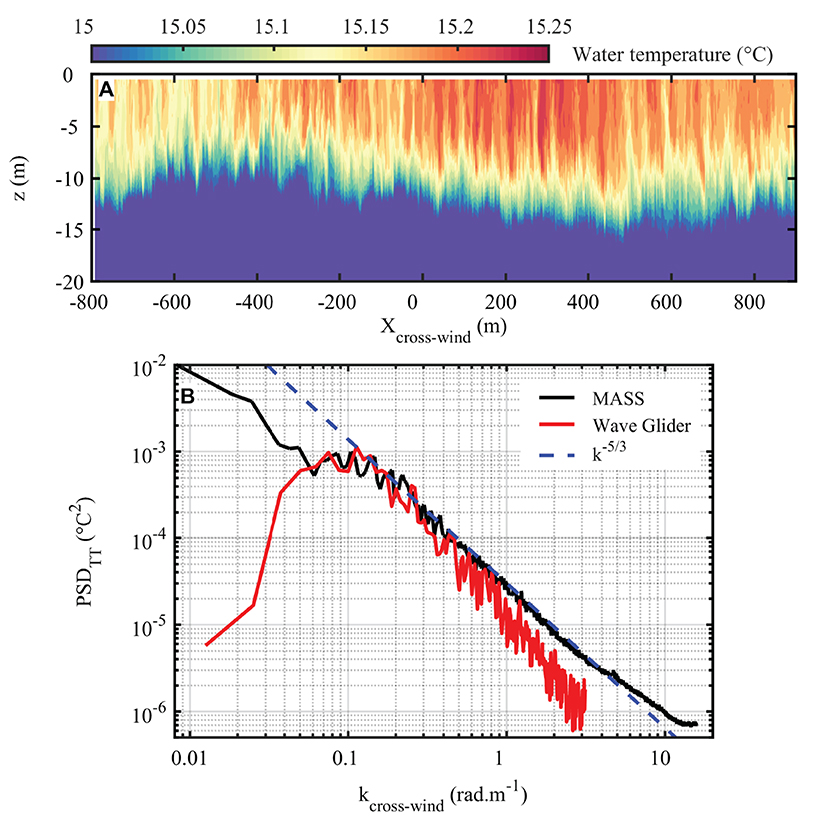
Figure 10. (A) Water temperature profile map along a 1,700 m long crosswind transect highlighting the presence of shallow Langmuir cells during LCDRI2017. The transect started at 1920 UTC 30 March 2017 and was completed in only 50 min. (B) Spatial spectra of the near-surface temperature measured by the Wave Glider (red line) along with the spatial spectrum of the SST measured by the airborne MASS instrument (black line). Both spectra exhibit a peak near the wavenumber k = 0.1 rad s−1 (i.e., wavelength λ ~ 60 m). For the Wave Glider, the spectrum was computed on the water temperature averaged over depths in the range [0.5, 2.5] m, while for the MASS, the spectrum was computed on the sea surface temperature measured by the infrared camera.
Wavenumber spectra of the surface temperature measured by both the Wave Glider (red) and the MASS system (black) along coincident cross-wind transects are shown in Figure 10B. For the Wave Glider, the spectrum was computed from water temperature measurements that were averaged over depths ranging from 0.5 to 2.5 m below the surface, while the MASS infrared camera collected measurements of the sea surface temperature with a penetration depth of a few microns. Both spectra exhibit a peak around k = 0.1 rad s−1 (i.e., wavelength λ ~ 60 m); we find that they otherwise follow a −5/3 slope (blue) at higher frequencies which suggests that the distribution of energy along the different scales of the Langmuir cells follows the classical turbulent energy cascade. A more complete analysis of wavenumber spectra of sea surface temperature from airborne and Wave Glider platforms is currently underway by the present authors, and is beyond the scope of the present study.
5.3. Observations of Ocean Surface Boundary Layer Deepening
The ability to characterize both directional surface waves and wind forcing from Wave Gliders, along with properties of the upper ocean, is crucial to better understanding mixed layer dynamics. This includes the fundamental process of mixed layer deepening due to the action of surface waves and wind, as shown in Figures 11, 12, for relatively calm seas, off the coast of Southern California during the LCDRI2017 experiment. Wave Glider observations derived from the interpolated T-Chain measurements show enhanced mixing and a deepening of the mixed layer as the wind increases, after a period of gradual surface heating and low winds.
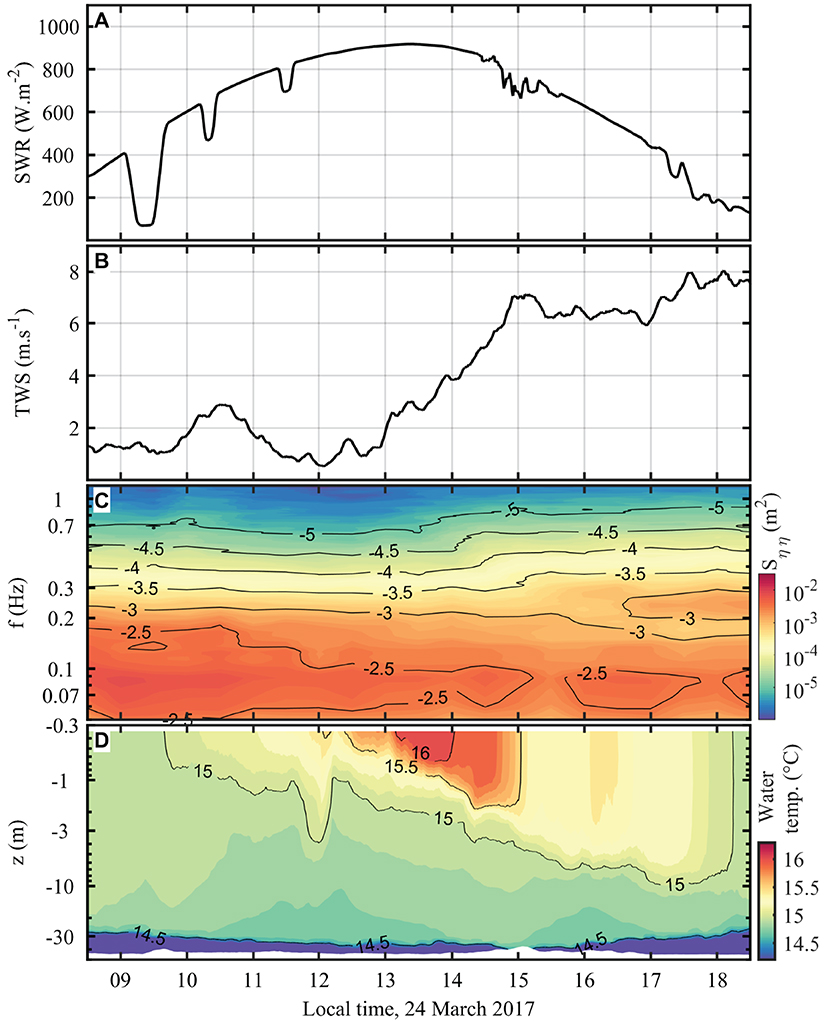
Figure 11. Ten-hours evolution of (A) the short-wave solar radiation SWR, (B) the true wind speed TWS, (C) the wave field spectrogram, and (D) the water temperature during LCDRI2017 starting at 0830 PDT 24 March 2017. Solar radiation was measured from the R/P FLIP while wind, waves, and water temperatures were measured by the SV2 Wave Glider Kelvin. In the morning when the wind was low, the heat from the incoming solar radiation was stored in a very thin layer beneath the interface. As soon as the wind increased, short wind-waves developed leading to enhanced mixing through direct mechanisms such as wave breaking or via indirect mechanisms such as Langmuir circulation. The surface heat content was then quickly mixed downward, leading to an increase of the water temperature throughout the ocean mixed layer.
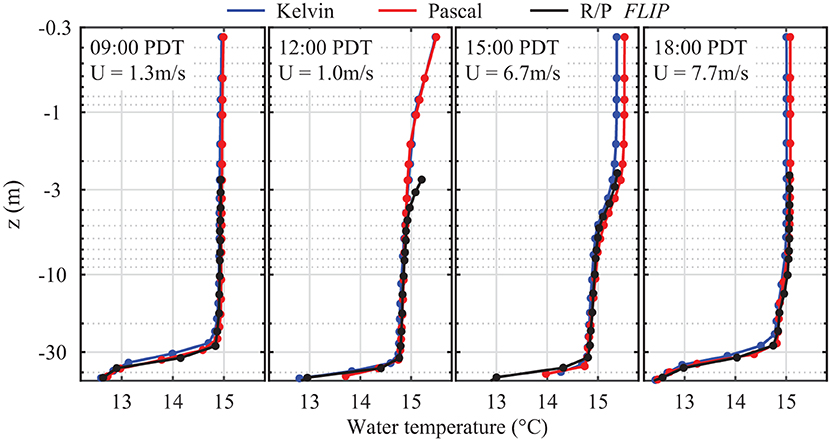
Figure 12. Water temperature profiles during LCDRI2017 measured 3 h apart starting at 1600 UTC (0900 local time) 24 March 2017. The water profiles were measured from T-Chains mounted on the R/P FLIP (black) and on the SV2 Wave Gliders Kelvin (blue) and Pascal (red). In each panel, local Pacific Daylight Time (PDT) and wind speed are reported. Horizontal axis corresponds to water temperature ranging from 12.2 to 16.2°C. Data collected by the Wave Gliders close to the surface highlight the warming of the top layer (first meter below the surface) while the wind was light. Because of enhanced mixing when the wind later increases, the heat accumulated in this top layer was mixed and transported throughout the ocean mixed layer column.
The 10-h record, starting at 1530 UTC 24 March 2017, is depicted in Figure 11, showing (Figure 11A) the shortwave solar radiation from the R/P FLIP (Kipp and Zonen CNR1 net radiometer) over the same timeline as (Figure 11B) the 1 m wind speed, (Figure 11C) the surface wave spectrogram, and (Figure 11D) the water temperature profile measured by the SV2 Wave Glider Kelvin that was operating in the vicinity of the R/P FLIP. Figure 12 highlights the evolution of temperature profiles collected from Kelvin, Pascal and R/P FLIP at specific times over this same sampling period. Note that the time displayed here is local (PDT), to highlight the progression of these parameters during daylight hours. The solar radiation, the wind speed and the water temperature variables from both plots were smoothed using a 10 min running average.
Figure 11A shows that incoming short wave radiation increased in the morning, reaching its peak at 1324 local time before decreasing slowly later in the afternoon. Note that the deviations in short wave radiation occurring in the morning are likely due to shadowing from atmospheric clouds or from rigging lines aboard R/P FLIP, while the small perturbations in the afternoon are likely the result of solar reflection onto the exposed hull of the vertically-deployed R/P FLIP. Until 1300 PST, the wind remained low (<3.3 m s−1), then increased steadily for 2 h before reaching a constant speed of around 7 m s−1 for the last 4 h of the period of interest. This increase is responsible for the development of young, short waves (see spectrogram in Figure 11C) that led to the mixing of the warm surface layer into the OBL through wave breaking and Langmuir circulation, the latter playing a crucial role in extending mixing to larger depths, as presented in Figures 11D, 12.
5.4. Submesoscale Fronts
Over the past several years, climate model studies and limited observations (e.g., D'Asaro et al., 2018) have shown that submesoscale vertical exchange is generally concentrated near km-scale fronts, jets, and eddies (McWilliams, 2016). It has also been suggested that submesoscale variability has a net effect on heat exchange between the ocean and atmosphere that is larger than greenhouse heating effects (Su et al., 2018). Recently, Rascle et al. (2020) have shown that there are important features below the generic O(0.1) km cutoff that is often used as a lower spatial bound (see also Lenain and Pizzo, 2020, 2021). In-situ, dense, small scale measurements of the oceanic boundary layer at such scales are therefore critically needed to further our understanding of these processes.
Figure 13 shows the trajectory of a Wave Glider deployed in the Gulf of Mexico during the LASER2016 experiment as it repeatedly crossed a well-defined submesoscale front. The observations shown started on 1800 UTC 30 January 2016 and lasted for 21 h. The trajectory is color coded for (Figure 13A) temperature, (Figure 13B) salinity, and (Figure 13C) density, measured by the GPCTD mounted on the Wave Glider sub (~6 m deep), and averaged over 10 min segments. The Wave Glider crossed this frontal interface four times over the time period. We find warm, saltier waters on the east side of a sharp frontal boundary with cold, fresher water on the west side. This specific front is analyzed in great detail in Shao et al. (2019).
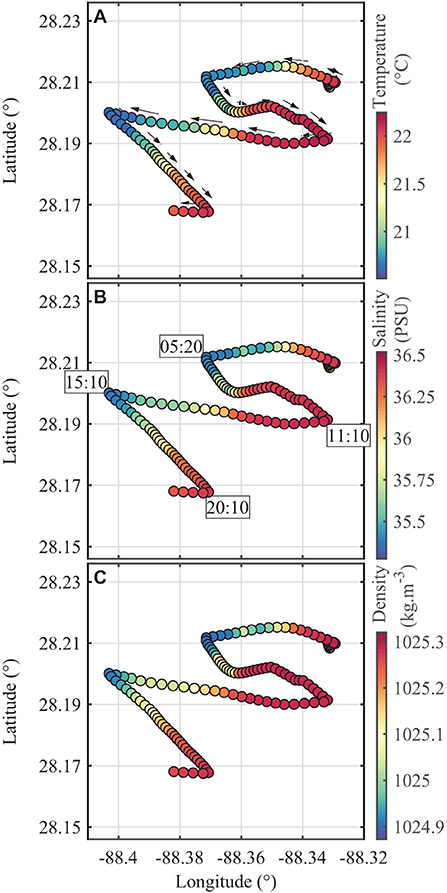
Figure 13. Water properties measured by the GPCTD mounted on the sub of the SV2 Wave Glider Pascal while sampling a submesoscale frontal structure for 21 h during the LASER2016 experiment starting at 1800 UTC 30 January 2016. (A) Temperature. (B) Salinity. (C) Density. Measurements were performed at a depth of 6.38 m. The black arrows in the top panel indicate the course of the Wave Glider, while boxed numbers in the middle panel correspond to the elapsed time in hour:minute since the beginning of the sampling period. On the east side of the front, waters from the central area of the Gulf of Mexico were warmer, saltier and heavier than the cold, fresh, and light waters discharged from the mouth of the Mississippi River on the west side of the front.
In Figure 14, observations of temperature profiles for the very first transect that is shown in Figure 13 in the vicinity of 28.21° N, 88.33° W, starting at 2025 UTC on 30 January 2016 and lasting 140 min, are presented. In each of these subplots, xeast represents the eastward distance relative to the front, where x>0 corresponds to the east side of the frontal boundary. Figure 14A shows the entire 3.6 km transect, highlighting the slope of the interface between the cold and warm waters as well as the complex temperature structures along this interface. A 200 m section of the transect located at the front is presented in Figure 14B to show greater detail. Finally, Figure 14C shows another subsection of the transect about 2.8 km to the west of the front where large fluctuations of the temperature indicates the presence of internal waves.
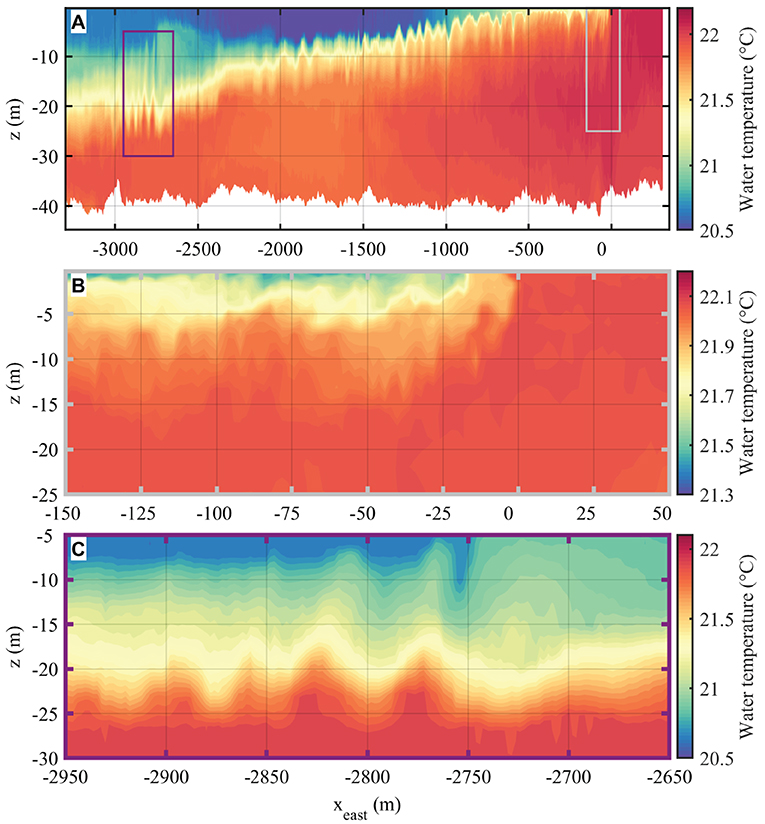
Figure 14. Variations of the water temperature along a 3.6 km long (140 min) transect while crossing a front during the LASER2016 experiment. (A) The entire transect. (B) Zoomed in view of 200 m across the frontal interface. (C) Zoomed in view of the transect while sampling across internal-types waves. In the first 50 m after crossing the front (see B), the top nodes of the T-Chain experienced the sharp change of temperature before the bottom nodes, highlighting the slope of the front. As the Wave Glider moved away from the front (see A), fluctuations of the temperature in the top layers increased in amplitude and in width. In the first 500 m, small fluctuations (~0.4°C) occurred within the first 2 m of the water column while further away (750–1,500 m), the amplitude of the water temperature fluctuations reached almost 1°C and affected deeper layers. Around 2,800 m away from the front, internal-type waves are observed (see C).
The unstable configuration of this front, where cold water is found above warmer water calls attention to the need to not only collect temperature observations across submesoscale fronts, but also to measure density. As such, the newer version of the Air-Sea Interaction Laboratory SV3 Wave Gliders are now equipped with a winch capable of profiling more comprehensive instrument packages down to 150 m water depth. An example of a series of temperature, salinity, dissolved oxygen and chlorophyll concentration profiles is shown in Figure 15, collected from an RBR Concerto sensor off the coast of San Diego in February 2020.
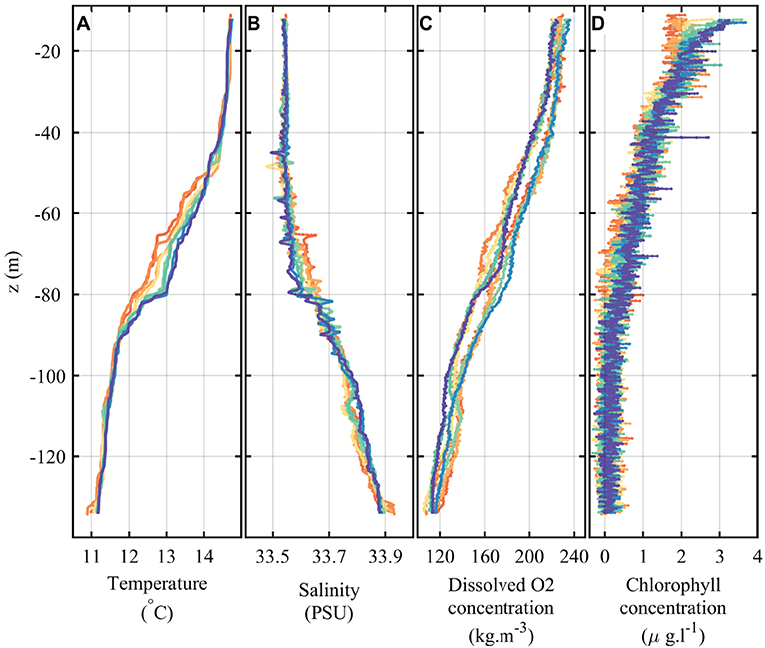
Figure 15. Depth profiles of water properties measured by the RBR Concerto3 CTD mounted on the sinker of the subsea winch of the SV3 Wave Glider Planck. (A) Temperature. (B) Salinity. (C) Dissolved O2 concentration. (D) Chlorophyll concentration. Eight consecutive profiles are shown over the course of 96 min. These data were measured during a test deployment off the SIO pier on 7 February 2020. Data are smoothed by averaging the data over a 1 s sliding window.
6. Discussion
In this work, we have presented novel, instrumented, wave-powered uncrewed surface vehicles specifically designed for air-sea interaction and upper ocean research. Measurement capabilities from these platforms are carefully described, compared, and validated against coincident measurements from well-established, independent data sources. Overall, we find that these instrumented, uncrewed surface vehicles are capable of collecting unique observations of the upper ocean boundary layer, surface waves and the lower atmosphere that are critical to advancing our understanding of the underlying physical processes of these domains.
These results demonstrate that these platforms can play a significant role in ocean sciences, including physical, chemical, and biological processes. For example, there are currently significant gaps in our ability to obtain observational records of submesoscale features. This is due to the range of scales present, which are generally too large (and evolve much too rapidly) for traditional oceanographic platforms (e.g., ARGO, Slocum gliders), while being too small to be observed from satellites (McWilliams, 2016). We anticipate that uncrewed surface vehicles such as the instrumented Wave Gliders presented here can greatly contribute to overcome these observational challenges, effectively expanding the reach of these traditional oceanographic platforms.
Data Availability Statement
The original contributions presented in the study are publicly available. This data can be found at the UCSD Library Digital Collection (Grare et al., 2021).
Author Contributions
LG and NS designed, developed, and tested the Air-Sea Interaction payload under the supervision of LL. LL, NP, LG, and NS conceived and planned the experiments. LG analyzed the data and generated the figures. NS, LG, and LL wrote the manuscript with support from NP. All authors discussed the results and contributed to the final manuscript.
Funding
This research was supported by grants from the Physical Oceanography programs at ONR (Grants N00014-17-1-2171, N00014-14-1-0710, and N00014-17-1-3005 and N00014-19-1-2635), NSF (OCE; Grant OCE-1634289), and NASA (Grant 80NSSC19K1688).
Conflict of Interest
The authors declare that the research was conducted in the absence of any commercial or financial relationships that could be construed as a potential conflict of interest.
Publisher's Note
All claims expressed in this article are solely those of the authors and do not necessarily represent those of their affiliated organizations, or those of the publisher, the editors and the reviewers. Any product that may be evaluated in this article, or claim that may be made by its manufacturer, is not guaranteed or endorsed by the publisher.
Acknowledgments
The authors gratefully acknowledge the crucial contribution of Ken Melville to this program prior to his passing in the fall of 2019. The authors are grateful to the crews of the R/V Beyster, R/V Walton Smith, R/V Saikhon, R/V Sally Ride and R/P FLIP for their support during the field deployments. Finally the authors thank the Liquid Robotics team for their support since the beginning of this project.
References
Ardhuin, F., Stopa, J. E., Chapron, B., Collard, F., Husson, R., Jensen, R. E., et al. (2019). Observing sea states. Front. Mar. Sci. 6:124. doi: 10.3389/fmars.2019.00124
Bresnahan, P., Wirth, T., Martz, T., Andersson, A., Cyronak, T., D'Angelo, S., et al. (2016). A sensor package for mapping ph and oxygen from mobile platforms. Methods Oceanogr. 17, 1–13. doi: 10.1016/j.mio.2016.04.004
Cavaleri, L., Fox-Kemper, B., and Hemer, M. (2012). Wind waves in the coupled climate system. Bull. Am. Meteorol. Soc. 93, 1651–1661. doi: 10.1175/BAMS-D-11-00170.1
Centurioni, L. R., Turton, J., Lumpkin, R., Braasch, L., Brassington, G., Chao, Y., et al. (2019). Global in situ observations of essential climate and ocean variables at the air-sea interface. Front. Mar. Sci. 6:419. doi: 10.3389/fmars.2019.00419
Charnock, H. (1955). Wind stress on a water surface. Q. J. R. Meteorol. Soc. 81, 639–640. doi: 10.1002/qj.49708135027
Craik, A. D. D., and Leibovich, S. (1976). A rational model for Langmuir circulations. J. Fluid Mech. 73, 401–426. doi: 10.1017/S0022112076001420
D'Asaro, E. A., Shcherbina, A. Y., Klymak, J. M., Molemaker, J., Novelli, G., Guigand, C. M., et al. (2018). Ocean convergence and the dispersion of flotsam. Proc. Natl. Acad. Sci. U.S.A. 115, 1162–1167. doi: 10.1073/pnas.1718453115
Davis, R. E., Talley, L. D., Roemmich, D., Owens, W. B., Rudnick, D. L., Toole, J., et al. (2019). 100 years of progress in ocean observing systems. Meteorol. Monogr. 59, 3.1–3.46. doi: 10.1175/AMSMONOGRAPHS-D-18-0014.1
Fairall, C. W., Bradley, E. F., Hare, J. E., Grachev, A. A., and Edson, J. B. (2003). Bulk parameterization of air-sea fluxes: updates and verification for the coare algorithm. J. Clim. 16, 571–591. doi: 10.1175/1520-0442(2003)016<0571:BPOASF>2.0.CO;2
Foster, J. H., Ericksen, T. L., and Bingham, B. (2020). Wave glider-enhanced vertical seafloor geodesy. J. Atmos. Ocean. Technol. 37, 417–427. doi: 10.1175/JTECH-D-19-0095.1
Goebel, N. L., Frolov, S., and Edwards, C. A. (2014). Complementary use of wave glider and satellite measurements: description of spatial decorrelation scales in chl-a fluorescence across the pacific basin. Methods Oceanogr. 10, 90–103. doi: 10.1016/j.mio.2014.07.001
Grare, L., Lenain, L., and Melville, W. K. (2013). Wave-coherent airflow and critical layers over ocean waves. J. Phys. Oceanogr. 43, 2156–2172. doi: 10.1175/JPO-D-13-056.1
Grare, L., Lenain, L., and Melville, W. K. (2016). The influence of wind direction on campbell scientific csat3 and gill r3-50 sonic anemometer measurements. J. Atmos. Ocean. Technol. 33, 2477–2497. doi: 10.1175/JTECH-D-16-0055.1
Grare, L., Lenain, L., and Melville, W. K. (2018). Vertical profiles of the wave-induced airflow above ocean surface waves. J. Phys. Oceanogr. 48, 2901–2922. doi: 10.1175/JPO-D-18-0121.1
Grare, L., Statom, N. M., Pizzo, N., and Lenain, L. (2021). Data from: Instrumented Wave Gliders for Air-Sea Interaction and Upper Ocean Research. UC San Diego Library Digital Collections. doi: 10.6075/J00C4VX6
Hildebrand, J., D'Spain, G. L., and Wiggins, S. M. (2014). Glider-based passive acoustic marine mammal detection. J. Acoust. Soc. Am. 136, 2118–2118. doi: 10.1121/1.4899628
Hine, R., Willcox, S., Hine, G., and Richardson, T. (2009). “The wave glider: a wave-powered autonomous marine vehicle,” in OCEANS 2009 (Biloxi, MS), 1–6. doi: 10.23919/OCEANS.2009.5422129
Hristov, T., Friehe, C., and Miller, S. (1998). Wave-coherent fields in air flow over ocean waves: Identification of cooperative behavior buried in turbulence. Phys. Rev. Lett. 81, 5245–5248. doi: 10.1103/PhysRevLett.81.5245
Krogstad, H. E. (1989). Reliability and Resolution of Directional Wavespectra From Heave, Pitch, and Roll Data Buoys. Directional Ocean Wave Spectra. Johns Hopkins University Press.
Lenain, L., and Pizzo, N. (2021). Modulation of surface gravity waves by internal waves. J. Phys. Oceanogr. doi: 10.1175/JPO-D-20-0302.1. [Epub ahead of print].
Lenain, L., and Melville, W. K. (2014). Autonomous surface vehicle measurements of the ocean's response to tropical cyclone freda. J. Atmos. Ocean. Technol. 31, 2169–2190. doi: 10.1175/JTECH-D-14-00012.1
Lenain, L., and Melville, W. K. (2017). Measurements of the directional spectrum across the equilibrium saturation ranges of wind-generated surface waves. J. Phys. Oceanogr. 47, 2123–2138. doi: 10.1175/JPO-D-17-0017.1
Lenain, L., and Pizzo, N. (2020). The contribution of high-frequency wind-generated surface waves to the stokes drift. J. Phys. Oceanogr. 50, 3455–3465. doi: 10.1175/JPO-D-20-0116.1
Lenain, L., Statom, N. M., and Melville, W. K. (2019). Airborne measurements of surface wind and slope statistics over the ocean. J. Phys. Oceanogr. 49, 2799–2814. doi: 10.1175/JPO-D-19-0098.1
Lygre, A., and Krogstad, H. E. (1986). Maximum entropy estimation of the directional distribution in ocean wave spectra. J. Phys. Oceanogr. 16, 2052–2060. doi: 10.1175/1520-0485(1986)016<2052:MEEOTD>2.0.CO;2
McWilliams, J. C. (2016). Submesoscale currents in the ocean. Proc. R. Soc. A Math. Phys. Eng. Sci. 472:20160117. doi: 10.1098/rspa.2016.0117
Meinig, C., Lawrence-Slavas, N., Jenkins, R., and Tabisola, H. M. (2015). “The use of saildrones to examine spring conditions in the Bering sea: vehicle specification and mission performance,” in OCEANS 2015 - MTS/IEEE Washington (Washington, DC), 1–6. doi: 10.23919/OCEANS.2015.7404348
Melville, W. K. (1996). The role of surface-wave breaking in air-sea interaction. Annu. Rev. Fluid Mech. 28, 279–321. doi: 10.1146/annurev.fl.28.010196.001431
Melville, W. K., Lenain, L., Cayan, D. R., Kahru, M., Kleissl, J. P., Linden, P. F., et al. (2016). The modular aerial sensing system. J. Atmos. Ocean. Technol. 33, 1169–1184. doi: 10.1175/JTECH-D-15-0067.1
Miles, J. W. (1957). On the generation of surface waves by shear flows. J. Fluid Mech. 3, 185–204. doi: 10.1017/S0022112057000567
Nishiyama, R. T., and Bedard, A. J. (1991). A “quad-disc” static pressure probe for measurement in adverse atmospheres: with a comparative review of static pressure probe designs. Rev. Sci. Instrum. 62, 2193–2204. doi: 10.1063/1.1142337
Pagniello, C. M. L. S., Cimino, M. A., and Terrill, E. (2019). Mapping fish chorus distributions in southern California using an autonomous wave glider. Front. Mar. Sci. 6:526. doi: 10.3389/fmars.2019.00526
Pinkel, R., Goldin, M. A., Smith, J. A., Sun, O. M., Aja, A. A., Bui, M. N., et al. (2011). The wirewalker: a vertically profiling instrument carrier powered by ocean waves. J. Atmos. Ocean. Technol. 28, 426–435. doi: 10.1175/2010JTECHO805.1
Rascle, N., Chapron, B., Molemaker, J., Nouguier, F., Ocampo-Torres, F. J., Osuna Cañedo, J. P., et al. (2020). Monitoring intense oceanic fronts using sea surface roughness: satellite, airplane, and in situ comparison. J. Geophys. Res. 125:e2019JC015704. doi: 10.1029/2019JC015704
Rogers, D. P. (1995). Air-sea interaction: connecting the ocean and atmosphere. Rev. Geophys. 33, 1377–1383. doi: 10.1029/95RG00255
Schmidt, K. M., Swart, S., Reason, C., and Nicholson, S.-A. (2017). Evaluation of satellite and reanalysis wind products with in situ wave glider wind observations in the southern ocean. J. Atmos. Ocean. Technol. 34, 2551–2568. doi: 10.1175/JTECH-D-17-0079.1
Shao, M., Ortiz-Suslow, D. G., Haus, B. K., Lund, B., Williams, N. J., Özgökmen, T. M., et al. (2019). The variability of winds and fluxes observed near submesoscale fronts. J. Geophys. Res. 124, 7756–7780. doi: 10.1029/2019JC015236
Su, Z., Wang, J., Klein, P., Thompson, A. F., and Menemenlis, D. (2018). Ocean submesoscales as a key component of the global heat budget. Nat. Commun. 9, 1–8. doi: 10.1038/s41467-018-02983-w
Thomson, J., Girton, J. B., Jha, R., and Trapani, A. (2018). Measurements of directional wave spectra and wind stress from a wave glider autonomous surface vehicle. J. Atmos. Ocean. Technol. 35, 347–363. doi: 10.1175/JTECH-D-17-0091.1
WAFO-Group (2000). WAFO - A Matlab Toolbox for Analysis of Random Waves and Loads- A Tutorial., Lund: Mathematical Statistics; Center for Mathematical Sciences; Lund University.
Keywords: wave glider, autonomous surface vehicle, air-sea interaction, ocean boundary layer, surface water waves
Citation: Grare L, Statom NM, Pizzo N and Lenain L (2021) Instrumented Wave Gliders for Air-Sea Interaction and Upper Ocean Research. Front. Mar. Sci. 8:664728. doi: 10.3389/fmars.2021.664728
Received: 05 February 2021; Accepted: 17 June 2021;
Published: 16 August 2021.
Edited by:
Gilles Reverdin, Centre National de la Recherche Scientifique (CNRS), FranceReviewed by:
Christoph Waldmann, University of Bremen, GermanyWilliam Drennan, University of Miami, United States
Copyright © 2021 Grare, Statom, Pizzo and Lenain. This is an open-access article distributed under the terms of the Creative Commons Attribution License (CC BY). The use, distribution or reproduction in other forums is permitted, provided the original author(s) and the copyright owner(s) are credited and that the original publication in this journal is cited, in accordance with accepted academic practice. No use, distribution or reproduction is permitted which does not comply with these terms.
*Correspondence: Laurent Grare, bGdyYXJlJiN4MDAwNDA7dWNzZC5lZHU=
 Laurent Grare
 Nicholas M. Statom
 Nick Pizzo
 Luc Lenain