 Rianna E. Burnham
 Svein Vagle
 Caitlin O’Neill1
 Krista Trounce
95% of researchers rate our articles as excellent or good
Learn more about the work of our research integrity team to safeguard the quality of each article we publish.
Find out more
ORIGINAL RESEARCH article
Front. Mar. Sci. , 30 July 2021
Sec. Marine Ecosystem Ecology
Volume 8 - 2021 | https://doi.org/10.3389/fmars.2021.664691
This article is part of the Research Topic Before-After Control-Impact (BACI) Studies in the Ocean View all 17 articles
The inland waters around southern Vancouver Island and northern Washington State, known as the Salish Sea, host critical habitat for endangered southern resident killer whales (SRKW). This is, however, a highly traversed area, with approaches to industrial ports and coastal cities, international shipping lanes, ferry routes, and considerable recreational vessel traffic. Vessel noise is a key threat to SRKW prosperity, and so conservation measures directed to mitigate its effects have been explored annually since 2017. Here, we describe trials undertaken in 2020, which included spatially limited slowdown zones, exclusion areas as Interim whale Sanctuary Zones (ISZs), and a lateral displacement of tug transits to increase the distance between their route and SRKW foraging areas. To assess each of the measures we first considered the level of mariner participation using data from the Automated Identification Systems (AIS), mandatory for commercial vessels. Knowing this, the changes in soundscape were examined, focused on impacts on broadband (10 Hz to 100 kHz) ambient noise and the frequencies used by SRKW for communication (500 Hz to 15 kHz) and echolocation (15 to 100 kHz). A control period of two-months prior to trial initiation was used to quantify the changes. High levels (> 80%) of compliance were found for each measure, except ISZs, where observance was low. Median reduction in speeds ranged from 0.2–3.5 knots. Resulting sound reductions were most notable in the lower frequencies, although reductions were also recorded in SRKW pertinent ranges. Tug displacement also reduced ambient noise in these frequencies, despite making up a small portion of the overall traffic. The management trials were effective in reducing potential impacts singularly and in concert. Greater awareness and stakeholder engagement may increase compliance and, therefore, the efficacy of measures in the future.
Killer whales (Orcinus orca) frequent the coast of British Columbia. The inland waters around southern Vancouver Island and northern Washington State, collectively referred to as the Salish Sea, hosts both Bigg’s (formerly transient) and resident killer whale ecotypes. Whereas the mammal-eating Bigg’s killer whale population has increased (Towers et al., 2012), the piscivorous southern resident killer whale (SRKW) population has declined to 75 individuals in recent years (Center for Whale Research, 2021) and are listed as Endangered under both the Canadian Species at Risk Act (SARA) and the American Endangered Species Act (ESA, Krahn et al., 2004; National Oceanic and Atmospheric Administration [NOAA], 2005). Swiftsure Bank and the Strait of Juan de Fuca, Haro Strait on the west side of San Juan Island, Boundary Pass, Swanson Channel, and southern portions of the Strait of Georgia are designated critical habitat for SRKW, and are areas they utilize frequently during the summer (Balcomb and Bigg, 1986; Krahn et al., 2004; Department of Fisheries and Oceans Canada [DFO], 2017b; Olson et al., 2018). Components of these sites, including high bathymetric relief with nearshore shallow reefs adjacent to deep water, and strong tidal currents to aggregate prey, are the foundations of foraging habitat (Groot et al., 1984; Heimlich-Boran, 1988; Hauser et al., 2007; Hanson et al., 2010; Olson et al., 2018).
Killer whales use sound as their principal means to sense their environment. They actively send and receive information on their surroundings using echolocation clicks, whistles, or calls. Echolocation is used to form a cognitive image of their surroundings and so plays a role in navigation, and prey location and capture (Ford, 1989; Au et al., 2004). The whistles and calls are used to communicate between conspecifics, or hunting groups. Acoustic additions from vessels are in the frequency ranges that SRKW use for communication and echolocation (Veirs et al., 2016), potentially impacting their ability to send and receive signals, or accurately interpret them. Indeed, vessel presence and acoustic disturbance have been identified as a key limiting factor to SRKW population recovery and survival (Weilgart, 2007; Lacy et al., 2017; Department of Fisheries and Oceans Canada [DFO], 2018; Raverty et al., 2020).
Critical habitats in the Salish Sea experience high rates of commercial vessel traffic transiting international shipping lanes to ports including Victoria, Vancouver, Tacoma, Port Angeles, and Seattle. Here, we present the results of management actions undertaken to limit acoustic impacts of vessels on SRKW in the area. Since 2017, several conservation measures have been implemented in areas designated as key foraging areas for SRKW. These include voluntary spatially delimited slowdown trials and alteration of vessel tracks in or near existing shipping lanes under the Enhancing Cetacean Habitat and Observation (ECHO) program, and mandated exclusion areas, Interim whale Sanctuary Zones (ISZs), implemented and managed by Transport Canada. All measures were implemented with the support of the Canadian and U.S. coast guards, marine transportation industries and Fisheries and Oceans Canada (DFO).
The voluntary slowdown measures were first applied in the summer of 2017 for a 31 km portion of Haro Strait in the Compulsory Pilotage Area (Pilotage Act 1985). Although the focus of the slowdown request was piloted commercial vessels over 350 gross tons, and pleasure craft over 500 gross tons, all vessels were encouraged to reduce their speed when it was safe and feasible. This initial trial found decreased speed effectively reduced source level noise for container ships, cruise vessels, vehicle carriers, tankers, and bulkers (MacGillivray et al., 2019). In 2019, the slowdown zone was increased to encompass Haro Strait and Boundary Pass completely, over a distance of 55 km. Participation has increased from 61% in the first year to consistently over 80% in 2018 and 2019, resulting in decreases in ambient noise particularly in the low frequencies (MacGillivray et al., 2017, 2019; Joy et al., 2019).
The initial lateral displacement trial in 2018 requested all outbound deep-sea vessels and both outbound and inbound tugs and barges operating in, or north of, the outbound shipping lane to move their transits southward within the bounds of the shipping lanes over a 63 km area in the Strait of Juan de Fuca. This was intended to move vessels away from areas frequented by SRKW, presumably to forage (Olson et al., 2018). Restricted movement was possible for piloted vessels, which moved their transit approximately 600 m southward, resulting in little effect on the ambient noise level. The transit of tugs through this area is not restricted to shipping lanes; their passage through Juan de Fuca is often closer to the coastline than the shipping lanes, even when not transiting port-to-port (Cominelli et al., 2019). Therefore, for the same trial an average shift of approximately 3900 m was possible from tugs (Vagle and Neves, 2019). Tugs showed high participation, significantly reducing noise in the higher frequencies of the soundscape (Vagle and Neves, 2019). Since 2019, trials have requested tugs and barges only to alter their vessel passage routes, resulting in as much as a 7 dB reduction in the broadband ambient noise, and 11.5 dB reduction of higher frequency noise, on a per-transit basis for the trial that year (Vagle, 2020).
Vessel exclusion zones, known as Interim whale Sanctuary Zones (ISZs) have been implemented in key SRKW foraging areas on Swiftsure Bank and in Swanson Channel, off Pender Island, and around East Point off Saturna Island since 2019 (Olson et al., 2018). Mandated to all vessel types, these measures were enforced by Parks Canada wardens (Author Pers. Obs., 2019). However, compliance especially for small, recreational vessels was low (Vagle, 2020).
Here, we report on the results from the most recent trials, undertaken through the summer and fall of 2020, using acoustic recordings made at Swiftsure Bank, Jordan River in the Strait of Juan de Fuca, Haro Strait, Boundary Pass, and Swanson Channel and Saturna Island in the southern Gulf Islands. The ambient noise levels during the trials are compared to pre-trial baselines, as well as noise levels and results from similar trials enacted in the summers of 2017-2019. Measures of the effectiveness of the trials are two-fold: First, the level of voluntary participation to the slowdown and displacement measures, and compliance to the exclusion zones by mariners are established. With this in mind, we then consider the changes in the sound fields between the control and trial conditions. The efficacy of measures are assessed on their own and jointly for reducing anthropogenic noise in areas used by SRKW in the Salish Sea. Comparison between voluntary and regulated actions are also possible. Although the analysis considers the effect of overall ambient noise changes resulting from the management measures, we also focus on soundscape changes in the frequency bands used by SRKW for foraging and communication. This assessment will help us refine future measures for enhanced success in achieving conservation goals.
Several conservation measures aimed at mitigating vessel noise were in place during the summer of 2020. Vessel passage through the trial areas was characterized via Automatic Information System (AIS) data collected by Canadian Coast Guard terrestrial receivers. Class A AIS transceivers are mandatory for vessels over 300 tons (excluding fishing vessels) and for passenger vessels over 150 tons carrying more than 12 passengers. Also, towage and escort vessels of any tonnage must carry a Class A transceiver. Class A vessel data were primarily from larger commercial vessels, classified as bulkers, container ships, ferries, fishing vessels, government or research vessels, naval vessels, cruise ships, recreational vessels, tankers, tugs, vehicle carriers, or registered whale watching vessels. In addition, Class B vessel data were also used, which is typically transmitted from smaller vessels, often pleasure craft, fishing, or smaller commercial vessels that carry an AIS transceiver by choice. The AIS system transmits vessel name, identification number, type, and location every 5–30 s. These data were cleaned and binned into 5-min packages from which the pathway and speed of each vessel was interpolated. Passive acoustic moorings were deployed to monitor the soundscape in each of the trial areas subject to conservation measures. A recorder at Jordan River was previously assessed to best represent the lateral displacement request (Vagle and Neves, 2019; Vagle, 2020), located approximately halfway through the trial zone, and 5 km north of the outbound traffic lane (Figure 1 and Supplementary Table 1). Each of the slowdown and ISZ areas had a designated mooring to monitor the changes in ambient noise recordings resulting from the measures (Figure 1). The efficacy of the mitigation actions was assessed through comparison to control, pre-trial periods two months immediately prior to trial initiation.
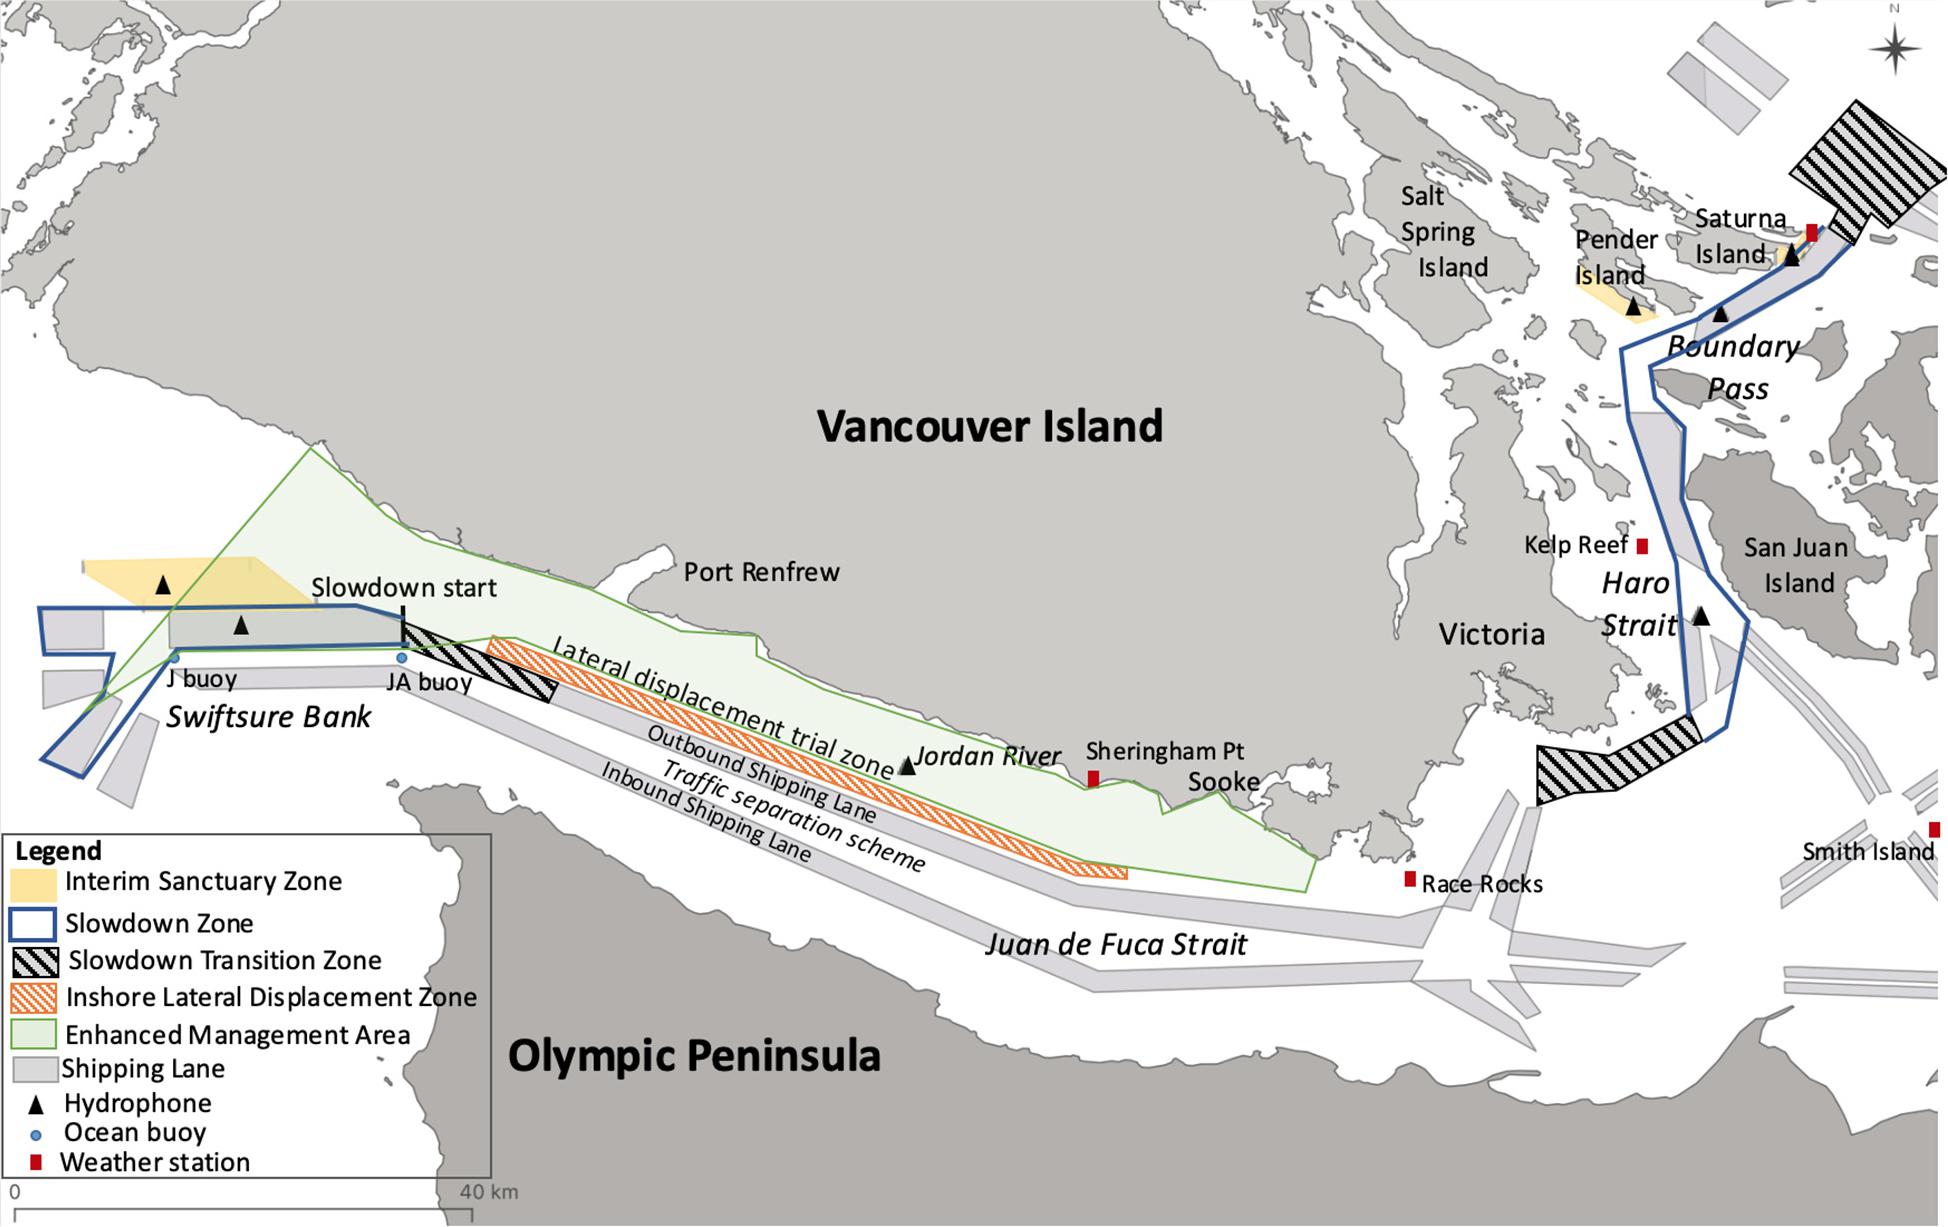
Figure 1. The study area within the Salish Sea. Commercial shipping lanes are shown, as are the locations for all the management actions undertaken in the summer of 2020.
A slowdown of bulkers, tankers, ferries and government vessels transit speed to 11 knots, and vehicle carriers, cruise, and container vessels to 14.5 knots, was requested for sections of shipping lanes crossing Swiftsure Bank, and through Haro Strait and Boundary Pass (Figures 1–3). Other vessel types, including government, naval and ferries vessels transiting the specified areas were also requested to slow down, however, the noise reduction related to changes in speed from commercial shipping were given greatest attention. These piloted vessels have shown participation resulting in notable sound level reductions in previous years (MacGillivray et al., 2017, 2019; Joy et al., 2019), and so remain the focus. The slow transit zone extended from Discovery Island in the south to East Point of Saturna Island to the north covering 55 km of Haro Strait and Boundary Pass (Figures 1, 2). Monitoring for whales began in June, with measures initiated by a SRKW sighting on July 1, 2020. The trial ran until October 31, 2020 (Table 1). A similar slowdown request was also made for an area of Swiftsure Bank for outbound vessels over a 31–37 km stretch from the start of a transition zone just east of JA buoy to the end of the in- and outbound traffic separation scheme from August 1-October 31, 2020 (Table 1 and Figures 1, 3).
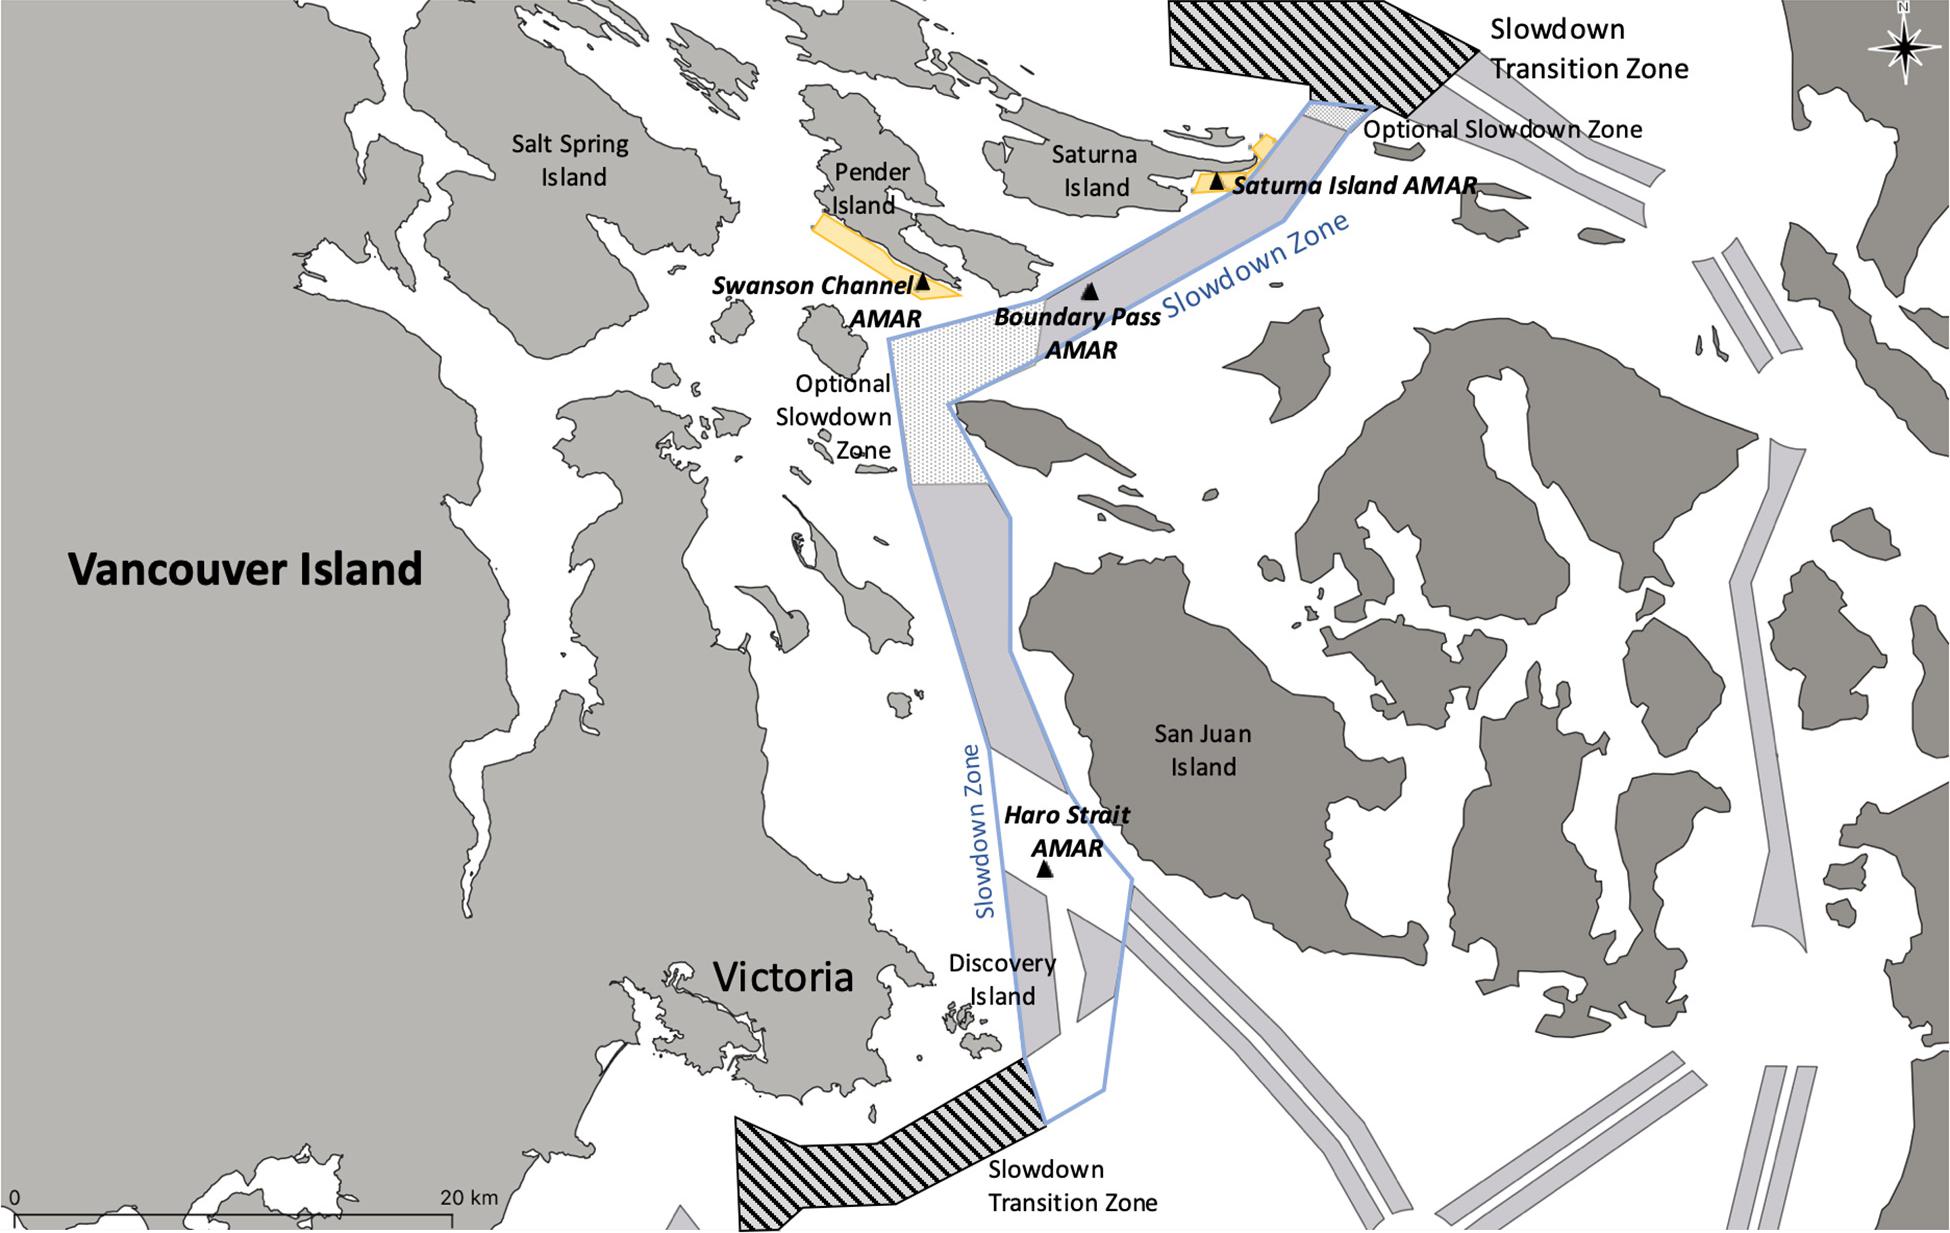
Figure 2. The voluntary slowdown area in Haro Strait and Boundary Pass, and transition zones. The mooring locations used to assess the slowdown are shown with black triangles. Interim Sanctuary Zones (ISZs) are indicated in yellow.
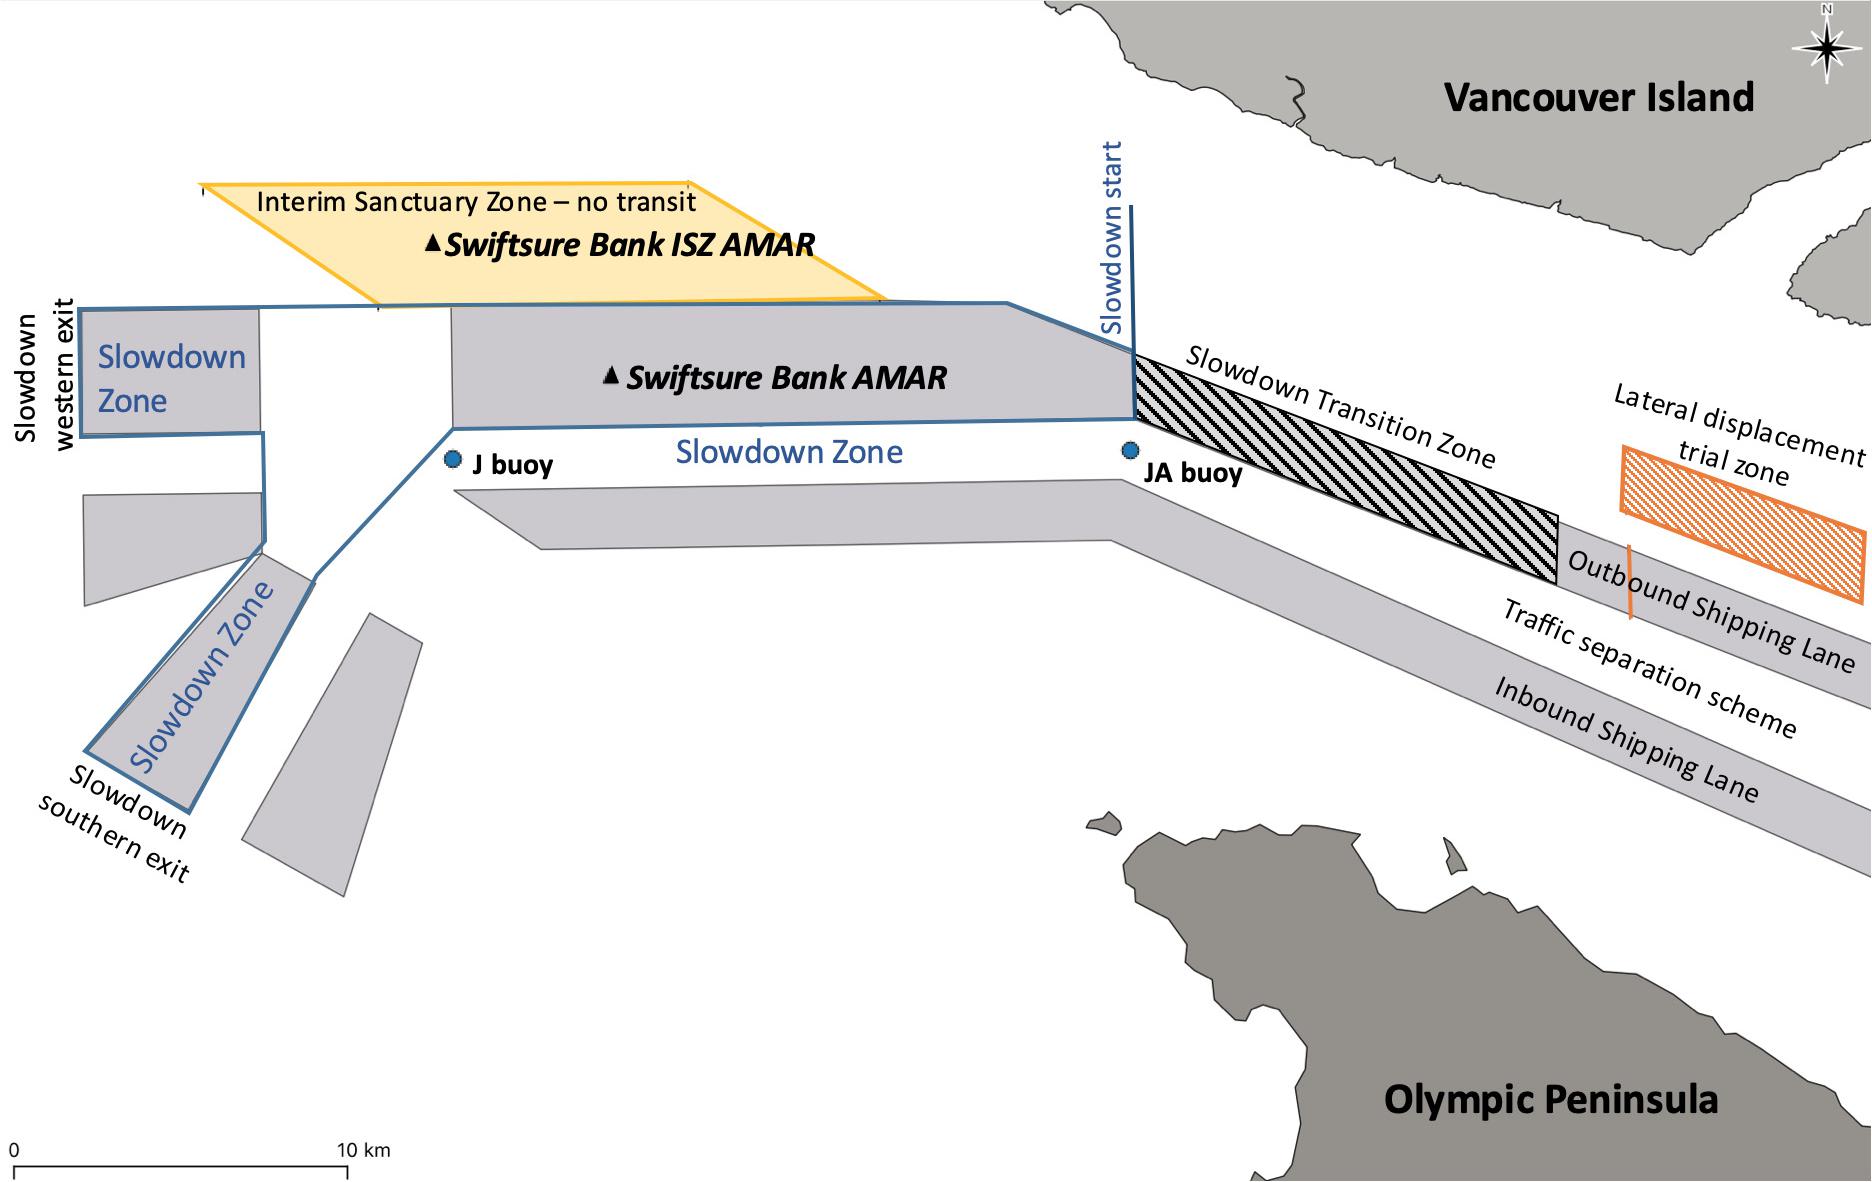
Figure 3. The voluntary slowdown area and transition zones on Swiftsure Bank, with slowdown requested west of the JA buoy. The mooring locations used to assess the slowdown are shown with black triangles and labeled as AMAR. The Interim Sanctuary Zone (ISZ) is indicated in yellow, and the start of the lateral displacement trial zone in Juan de Fuca in orange.
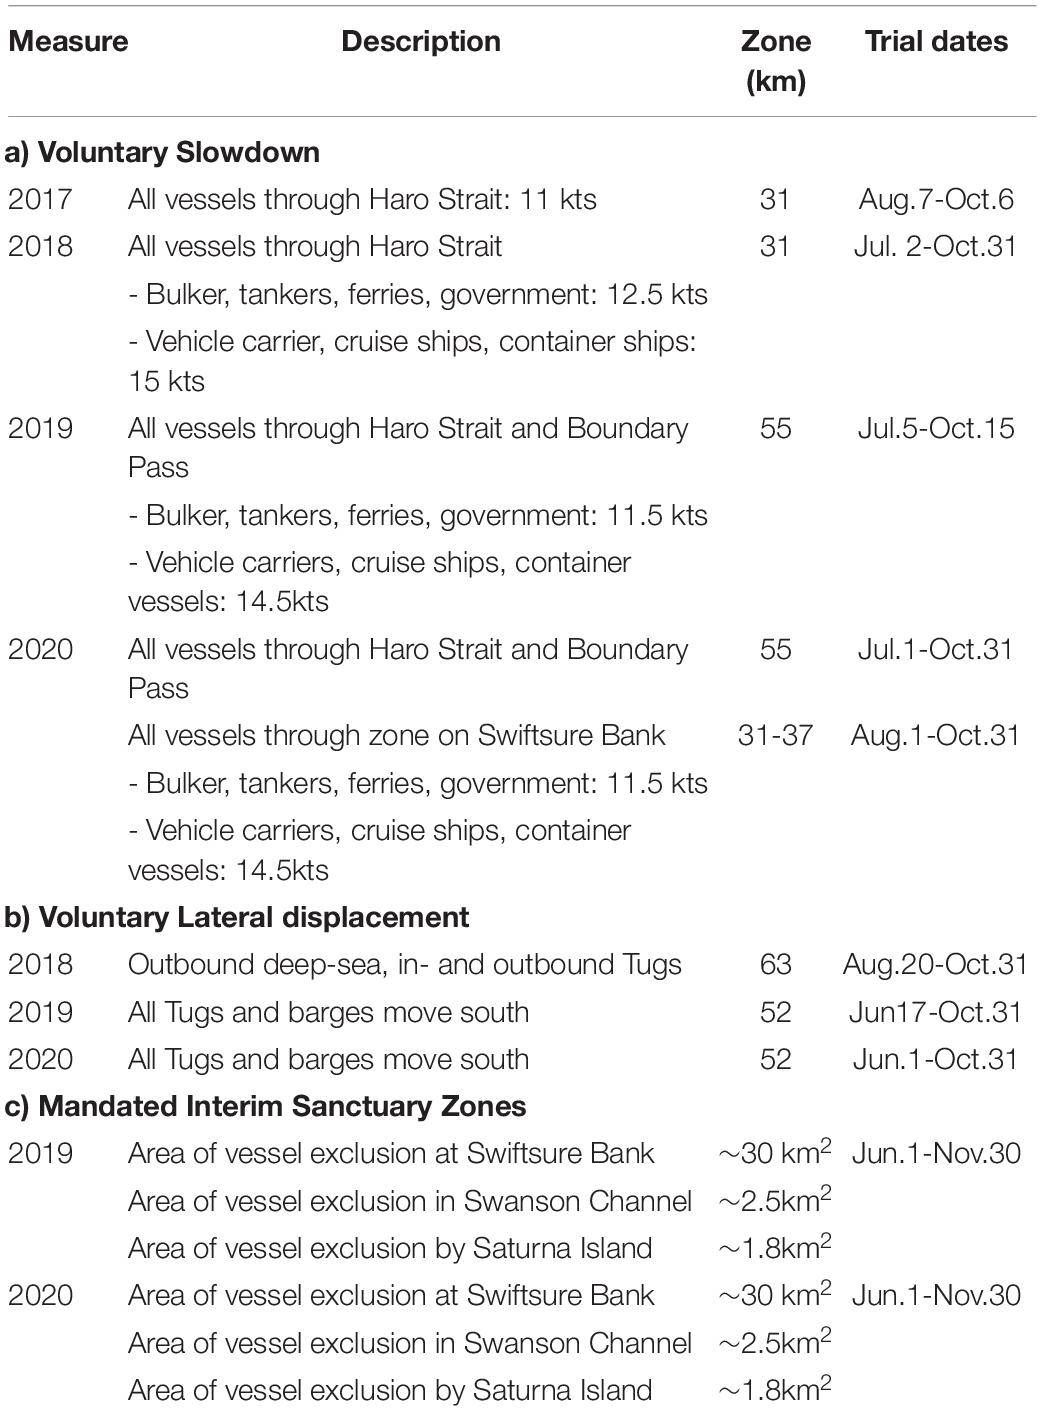
Table 1. Conservation measures enacted during the summer 2017–2020.
A more southerly transit route through the outbound shipping lane or a dedicated 1,500 m wide inshore lateral displacement zone, which maintained a 1000 m buffer from the traffic separation scheme (Table 2 and Figure 4), was requested for tugs and barges. This trial was applied from June 1 to October 31, 2020, and was designed to move vessels away from presumed SRKW foraging areas, and concentrate traffic into the shipping lanes. This might have both acoustic benefits and reduce vessel-strike risk.
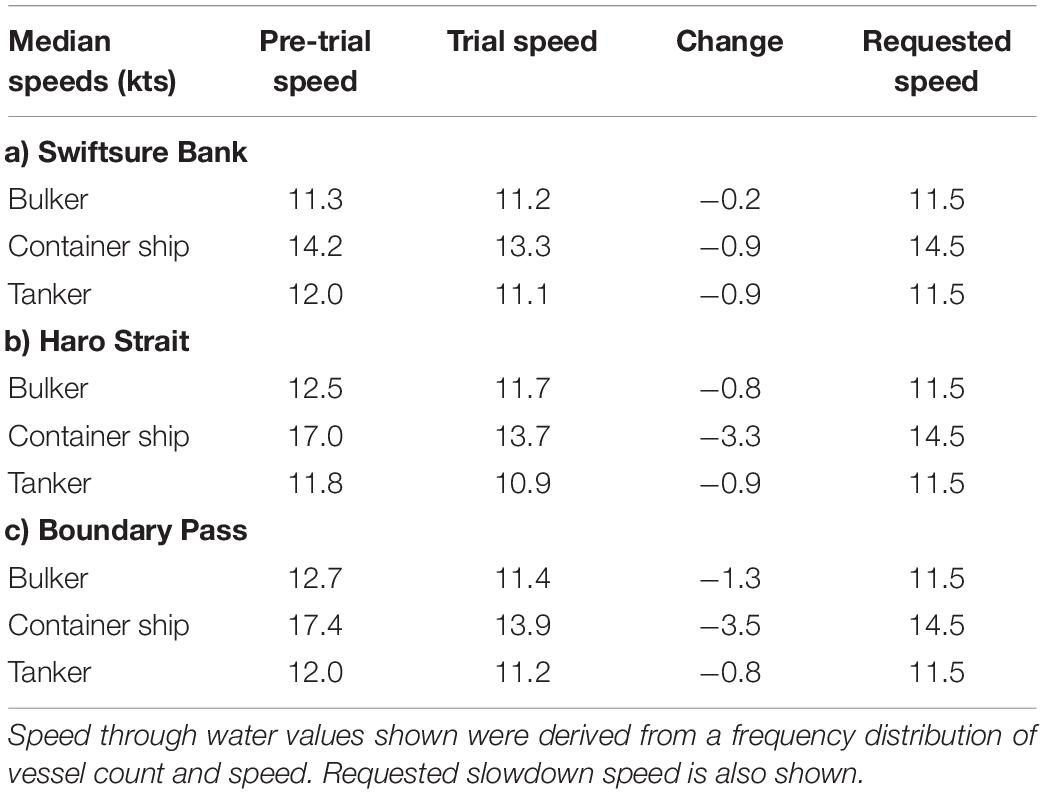
Table 2. Values of median speed for pre-trial and trial periods, and median speed change between periods for slowdown regions.
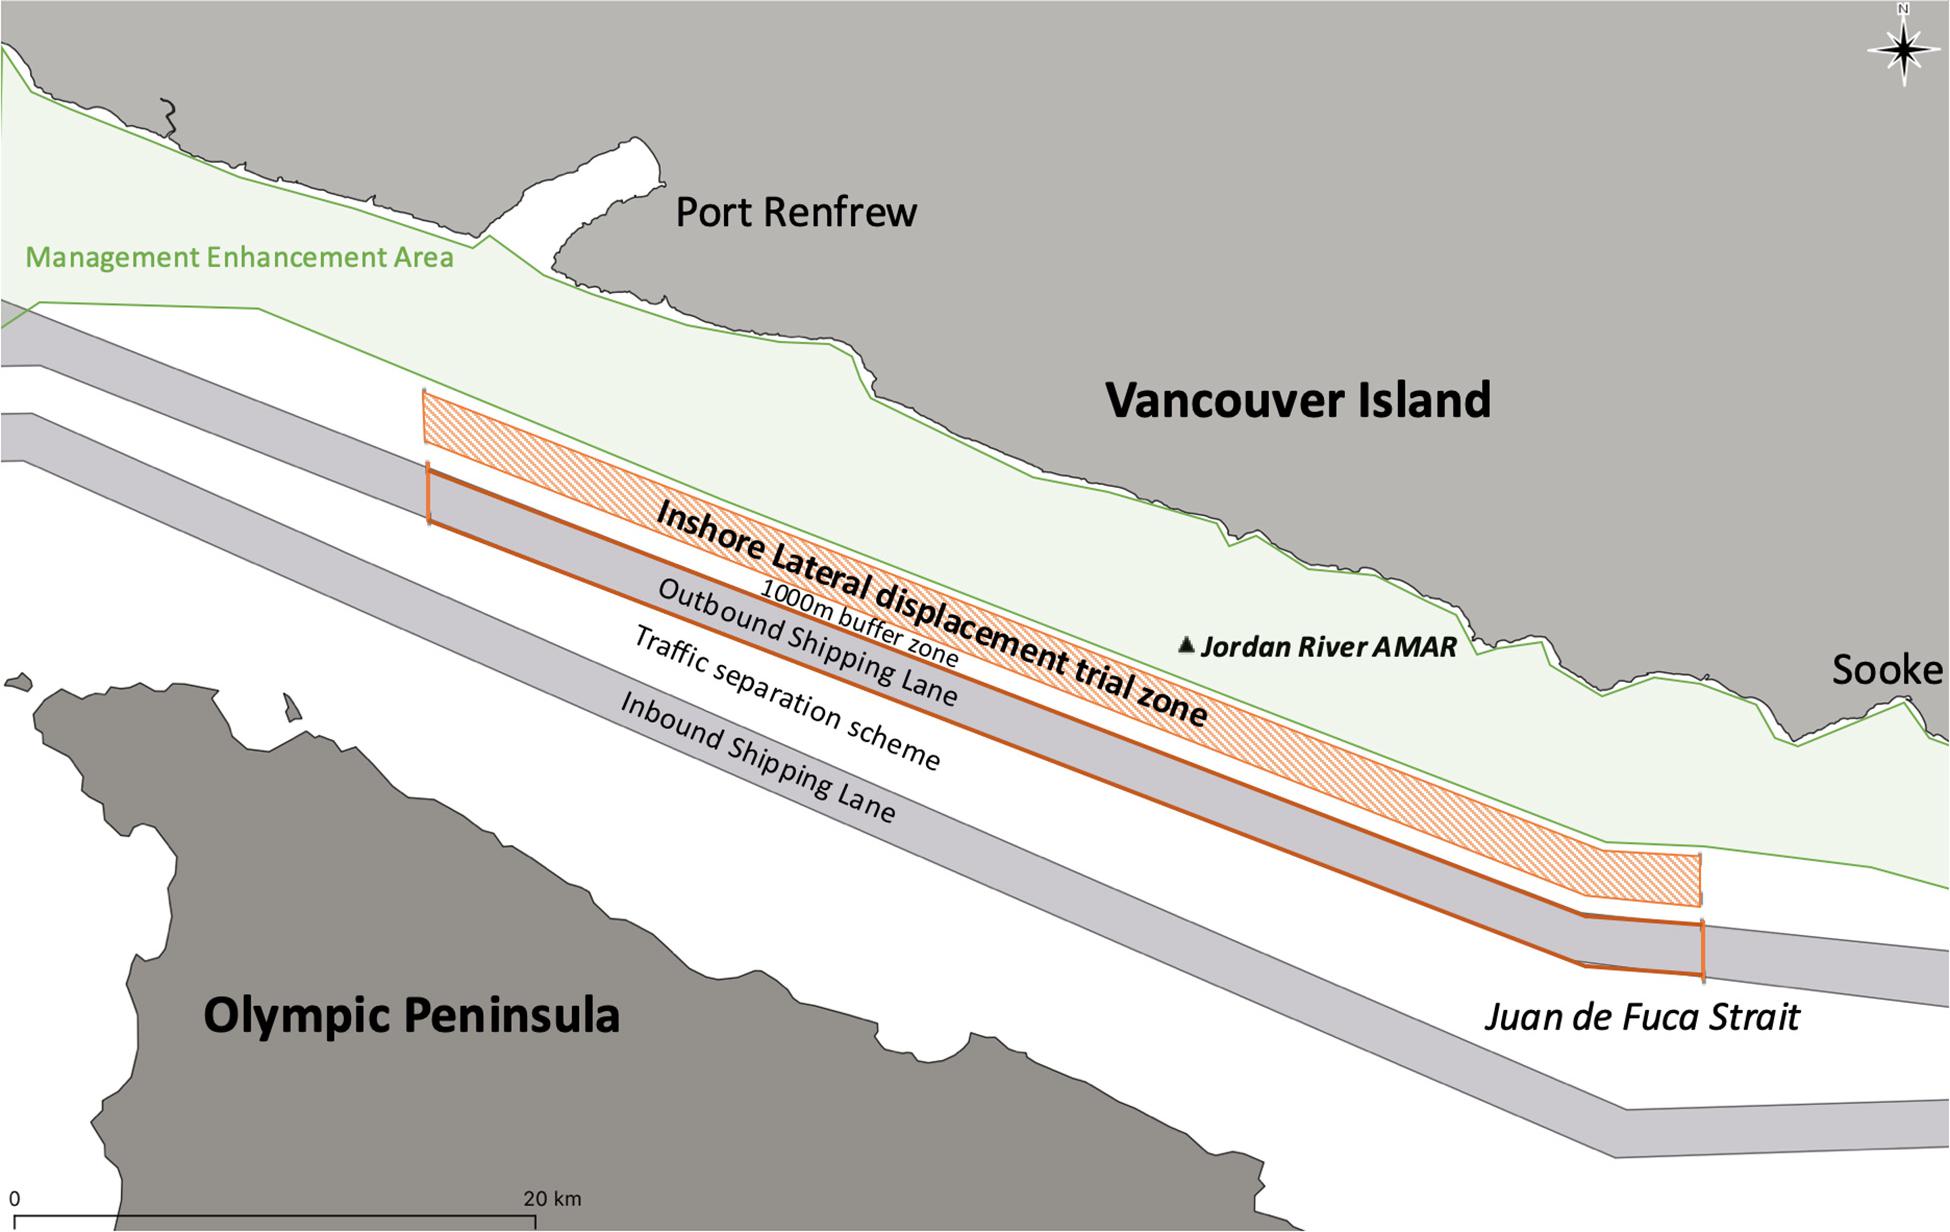
Figure 4. The section of Juan de Fuca where tugs were requested to transit either in the 1500 m inshore lateral displacement zone or outbound shipping lane to take a more southern route. The hydrophone deployed at Jordan River used to assess the efficacy of this measure is shown as a black triangle and labeled as Jordan River AMAR.
The tracks of each tug transit were examined, and the average distance for closest approach established. Change between the control and trial periods was examined through an independent t-test. The potential for change in sound pressure levels (SPL) for each tug passage, following a change in passage route into the lateral displacement zone, was also considered by examining the AIS data for vessels with multiple transits both before and during the trial.
Interim whale Sanctuary Zones (ISZs) on Swiftsure Bank, in Swanson Channel off Pender Island, and around East Point off Saturna Island were implemented between June 1 and November 30, 2020 (Figure 1 and Table 1, Supplementary Table 2). The measures were assessed until October 31 to be in-line with the other management measures. The passages of vessels, per type, within the ISZs during the control and enforcement period were established from AIS data. The vessel transits per type within 8 km of the recorders positioned in the ISZs were also examined to better understand the vessel-derived noise additions to the recordings (Figure 5), with pre-trial and trial passage rate compared through independent t-tests.
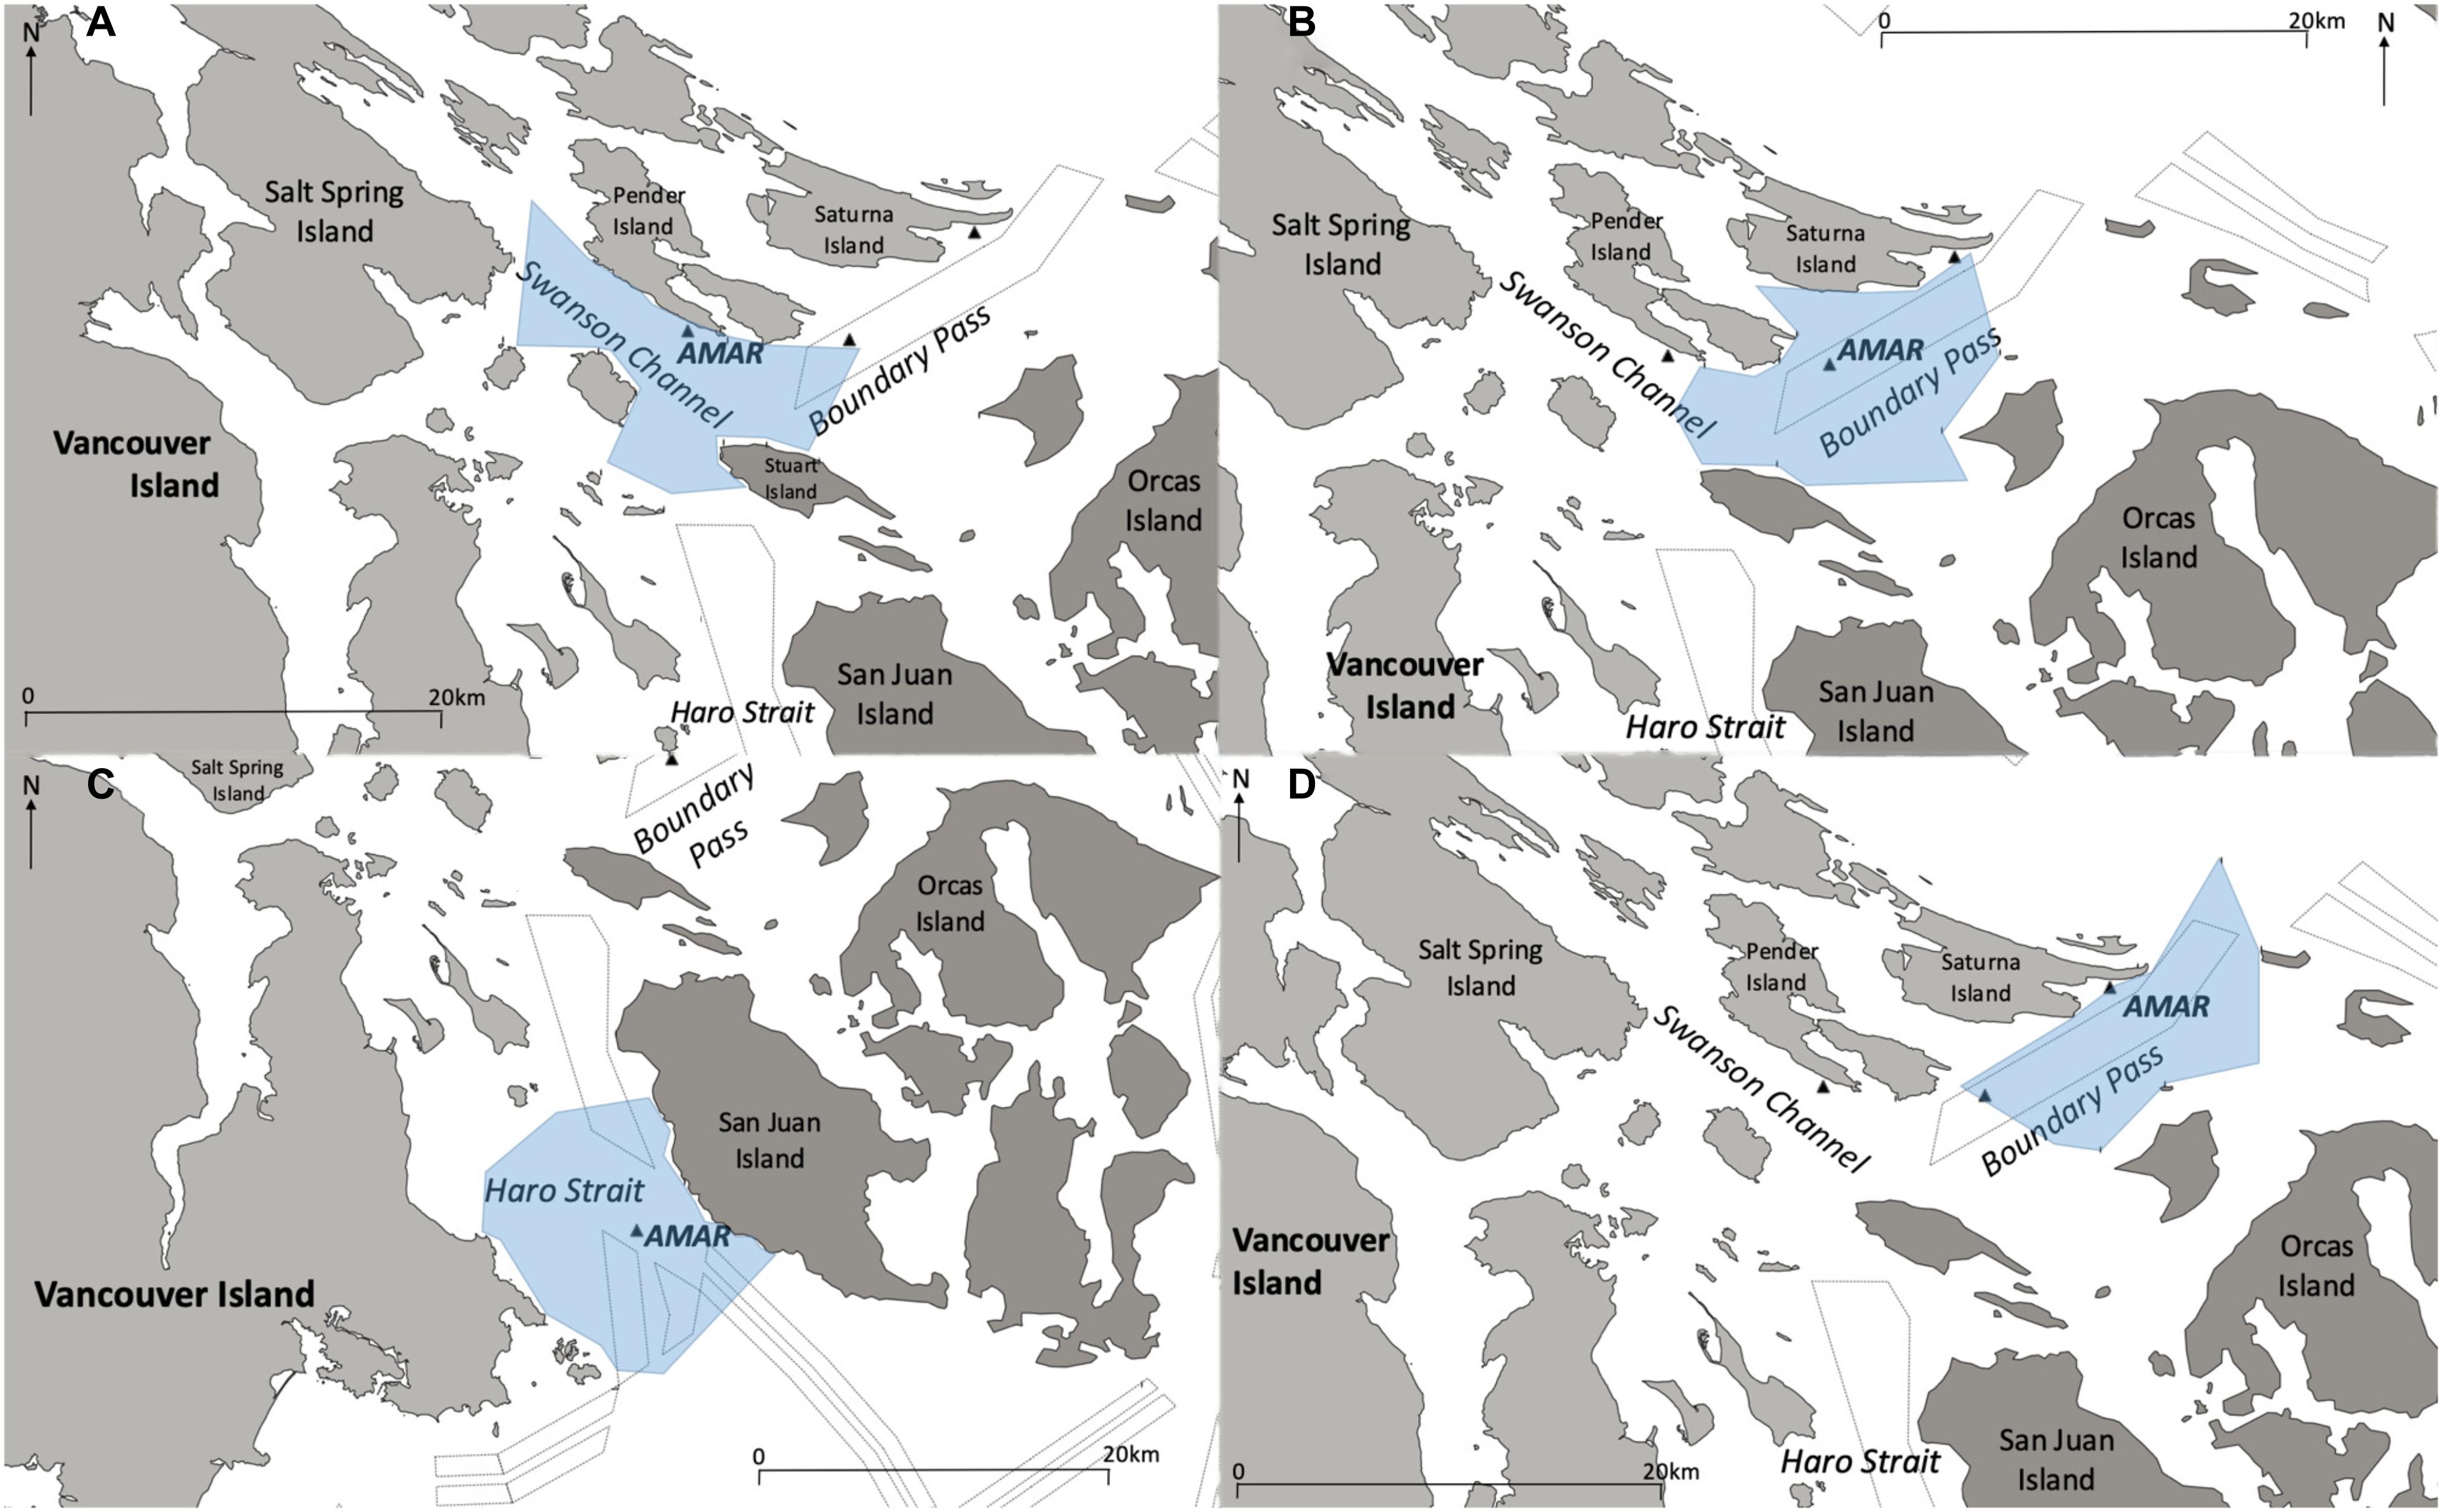
Figure 5. Modified polygons of maximum extent of 8 km (blue shading) around the (A) Swanson Channel, (B) Boundary Pass, (C) Haro Strait, and (D) East Point, Saturna Island acoustic moorings (labeled AMAR) used to quantify vessel passages.
The passage rate of vessels by type was determined from the AIS data and the number of transits reported to the Port of Vancouver. Impacts from COVID-19 restrictions, in force from April 6, 2020 were considered, whereby all commercial marine vessels with a capacity of more than 12 passengers were prohibited from engaging in non-essential activities, such as tourism or recreation; cruise ships with the capacity for overnight accommodations for 100 or more people were banned in Canadian waters and refused moorage in Canadian ports, and ferries were required to reduce the maximum number of passengers to 50% of capacity (gov.bc.ca; Transport Canada, 2020). The number of ferry transits between Canadian ports through the summer were quantified from information from BC Ferries (bcferries.ca). Ferries transiting between Canadian and American ports were absent throughout. Recreational boating was discouraged, but formal restrictions were eased in late June (June 24, gov.bc.ca).
Vessel presence, quantified from AIS track data, was used to assess participation in trials and establish the vessel-derived input to the soundscape for both control and trial periods. For the slowdown trial areas in Haro Strait and Boundary Pass, and the ISZs on Saturna Island and in Swanson Channel the area over which the impact of vessels was considered was restricted by the geography, constrained by island or reef landmasses (Figure 5). In the more open water areas, vessel presence up to a maximum distance of 8 km was considered, to restrict the analysis to vessels within the shipping lanes, or waters immediately proximal to the trial zones (Figure 5). For the slowdown program at Swiftsure Bank, the analysis of vessels was restricted to the outbound traffic lane and a maximum distance of 8 km. The maximum distance of 8 km for the lateral displacement trial includes the waters from the Jordan River mooring to the outbound shipping lane, but not as distant as the inbound lane.
The 8 km limit is greater than the estimated detection range of SRKW communication calls in Juan de Fuca Strait and on Swiftsure Bank, which at its maximum was estimated to be 6.5 km (L10, Swiftsure Bank during the summer; Mouy et al., 2020). Abiotic noise during the summer months is presumed to be lowest; however, we used the conservative 8 km distance to recognize that noise from wind, waves, water movement, and precipitation makes substantial additions to the soundscape (Vagle et al., 1990; Medwin et al., 1992; Richardson et al., 1995; Nystuen, 1996; Nystuen and Ma, 2002; Ma et al., 2005; Pensieri et al., 2015).
We quantified and compared vessels in these 8 km radius areas, or modified polygons (Figure 5) for slowdown and lateral displacement trials. For the ISZs on Swiftsure Bank, off Saturna Island, and in Swanson Channel the vessel assessment from AIS data was restricted to the area of exclusion (Supplementary Table 2). Vessels were aggregated into five classes: Class A deep-sea vessels, containing bulkers, container ships, tankers, and vehicle carriers; fishing vessels; tugs; passenger vessels, which included both ferries and cruise ships, and Class B vessels. In this analysis Class B was used to assess the presence of small vessels in each trial zone. The AIS data on the four Class A categories were used to quantify compliance with the slowdown trials. For the lateral displacement trial, only Class A tugs were used. For the ISZs, avoidance of all vessel types was considered, with Class B vessel movements highlighted.
The closest approach distance between each AIS-tracked vessel in these categories and the acoustic recorder was assessed and normalized to calculate the probability density functions of distance for pre-trial and trial transits. This analysis was applied to slowdown areas to confirm that any changes in the soundscape were a result of participation in the voluntary measure. For the lateral displacement, the passage distance of tugs were the focus of the analysis.
Individual vessel speed was derived to give speed over ground (SOG) from the time difference and distance between sequential 5-minute data points in the AIS data. This was corrected to speed through water (STW) by accounting for the speed and direction of surface currents retrieved from the WebTide model (Hannah et al., 2008).
The control-trial comparisons completed to assess the efficacy of each of the conservation measures used a pre-trial period of two months from the initiation date of the voluntary measure. For slowdown trials at Swiftsure Bank this control period was June 1-July 31, 2020, whereas for slowdown in Haro Strait and Boundary Pass, lateral displacement through Juan de Fuca Strait, and the Swiftsure Bank and Swanson Channel ISZs, control periods from April 1-May 31 2020 were used. Pre-trial recordings for the Saturna Island ISZ were limited to May 9-31, 2020 only.
The underwater recordings were made using Autonomous Multichannel Acoustic Recorders (AMAR G4, JASCO Applied Sciences) equipped with GeoSpectrum Technologies M36-100 hydrophones mounted on a quiet mooring that positioned the hydrophone approximately 2 m above the sea floor. Each system was calibrated from 100 Hz to 250 kHz by the manufacturer, and then again at 250 Hz prior to each deployment. Continuous recordings were made at a sample rate of 256-kHz with 24-bit resolution and stored on internal SD memory cards as wav files. On retrieval, these wav files were processed with custom Python scripts, modified from those used by Merchant et al. (2015). One-minute power spectra were computed using a 1-s Hanning window, with a 50% overlap and Welch’s averaging, from which sound pressure level (SPL) measures were calculated. Recordings from trial periods (Table 1) were compared to the baseline established from pre-trial recordings for all management actions.
Broadband ambient noise in the 10 Hz to 100 kHz frequency range was evaluated for changes between the pre-trial and trial recordings. This range represents the frequencies for which, if noise levels were increased, there may be behavioral or physiological implications for SRKW (Heise et al., 2017). Killer whale vocalizations are typically between 500 Hz and 15 kHz; noise in this range potentially could obscure conspecific calling or social behaviors, linked to group cohesion and coordination. Echolocation occurs in the frequency range of 15-100 kHz, therefore acoustic additions in this range could mask signal echoes, impairing navigation, orientation, and prey location and capture (Heise et al., 2017). Changes in soundscape and vessel presence were evaluated using the decadal bands 10–100 Hz, 100–1000 Hz, 1000–10,000 Hz and 10,000–100,000 Hz.
To evaluate the changes in ambient noise from each of the mitigation measures, a cumulative distribution function (CDF) SPL analysis was conducted. The L5, L50 and L95 exceedance levels were obtained for each using only data that satisfied restrictions to minimize potential flow and wind noise in the recordings to better assess the input from vessels. Here L95 represents general baseline quiet ambient conditions exceeded 95% of the time, L50 represents the median and levels of noise 50% of the time, and L5 gives the upper level of noise inputs, present for a small proportion (5%) of the recordings. The L50 exceedance level is used frequently in noise comparisons to represent typical sound levels (e.g., Klinck et al., 2012; Merchant et al., 2012), whereas the L95 and L5 levels indicate the range of sound levels present, and help characterize both the background ambient noise level (L95) and periods of elevated noise that may mask SRKW acoustic signals, or initiate behavioral change (Clark et al., 2009; Merchant et al., 2015).
Restrictions on the data analyzed were made to limit abiotic noise additions potentially obscuring the SPL changes resulting from the management measures. Only recordings made during slack tides, when current estimates were less than 0.25 m/s, were used. Current estimates were accessed from Webtide (Hannah et al., 2008). Also, wind speeds could not exceed 5 m/s. Wind speed data were collected from lighthouse or weather buoy recordings. For Juan de Fuca Strait, the Sheringham Point light station (48.0500N, -123.8833W) was used; for Swiftsure Bank, wind measures were taken from the Cape Flattery/JA ocean buoy (48.4930N, -124.7260W); Smith Island (48.3206N, -122.8308W) wind recordings were used for Haro Strait, and for Boundary Pass, and for the ISZs at Swanson Channel and Saturna Island, wind speed data from East Point light station on Saturna Island (48.7800N, -123.0400W) were used. All of these weather stations (Figure 1) reported hourly.
Acoustic additions from small vessels may contribute significantly to the overall noise levels, and potentially mask the change in the sound field resulting from the conservation measures. The use of Class B data represented the minimum presence of small vessels, but many more were expected to be present and not be equipped with AIS transponders. In an effort to reduce the impact of these vessels in the soundscape assessments for the slowdown trials, a small vessel detection algorithm, based on the approach by Warner et al. (2020), was implemented. This small vessel detector aimed to identify small vessels both moving slowly and at speed in the acoustic data to be removed, but retain signals for vessels subject to the trial measures. The detector used hourly median SPL levels in three decadal bands, comparing observed SPL values to threshold SPL values in decibels (dB). Exceedances in SPL at or above the threshold values compared to hourly values were a determinant of small vessels (Warner et al., 2020). The frequency band 100–1000 Hz has previously been used successfully as an indicator of vessel presence (Merchant et al., 2012, 2015); for the small vessel detector an increased amplitude in this band by 6 dB, together with SPL elevated by 5 dB in the range 1–10 kHz, and by 23 dB in the 10–100 kHz compared to an hourly median indicated small vessels moving at speed. In addition, this same definition but with SPL in the 100–1000 Hz range exceeding the hourly median by 6 dB, but by no more than 9 dB represented small vessels moving slowly (Warner et al., 2020). The precision (95.4%) and efficacy of the detector was established for a test dataset by both manual review of the acoustic data, and comparison to visual observations noting the number of small vessels around the mooring during recording (Warner et al., 2020). Those sections of data indicated by the detector to include small vessels were omitted from the data analyzed for slowdown and lateral displacement trials. For the ISZs it was only times that these criteria were met that were used to determine the changes in the sound field as a result of Class B and small vessel presence.
The AIS data indicated that the vessel passages, by type, within the 8 km distances or modified polygons varied considerably between the sites (Figures 6, 7). At Swiftsure Bank and Jordan River there was greater consistency between the control and trial periods (Figure 6). Deep-sea commercial traffic dominated Jordan River, with Class A vessels consistently about 50% of the transits within 8 km of the mooring by week (Figure 6). This contrasted with Haro Strait and Boundary Pass, which showed an increase of Class B vessels from May to peak in July to August, and then decline again in the late summer (Figure 6). This increase in smaller vessels was less pronounced at Swiftsure Bank, with a greater proportion of ‘other’ vessel additions (Figure 6). Tug traffic was present at all locations, but was most common on Swiftsure Bank, Jordan River, and Haro Strait. The level and proportional presence of each vessel type at each of these sites was consistent with the year before (Vagle, 2020).
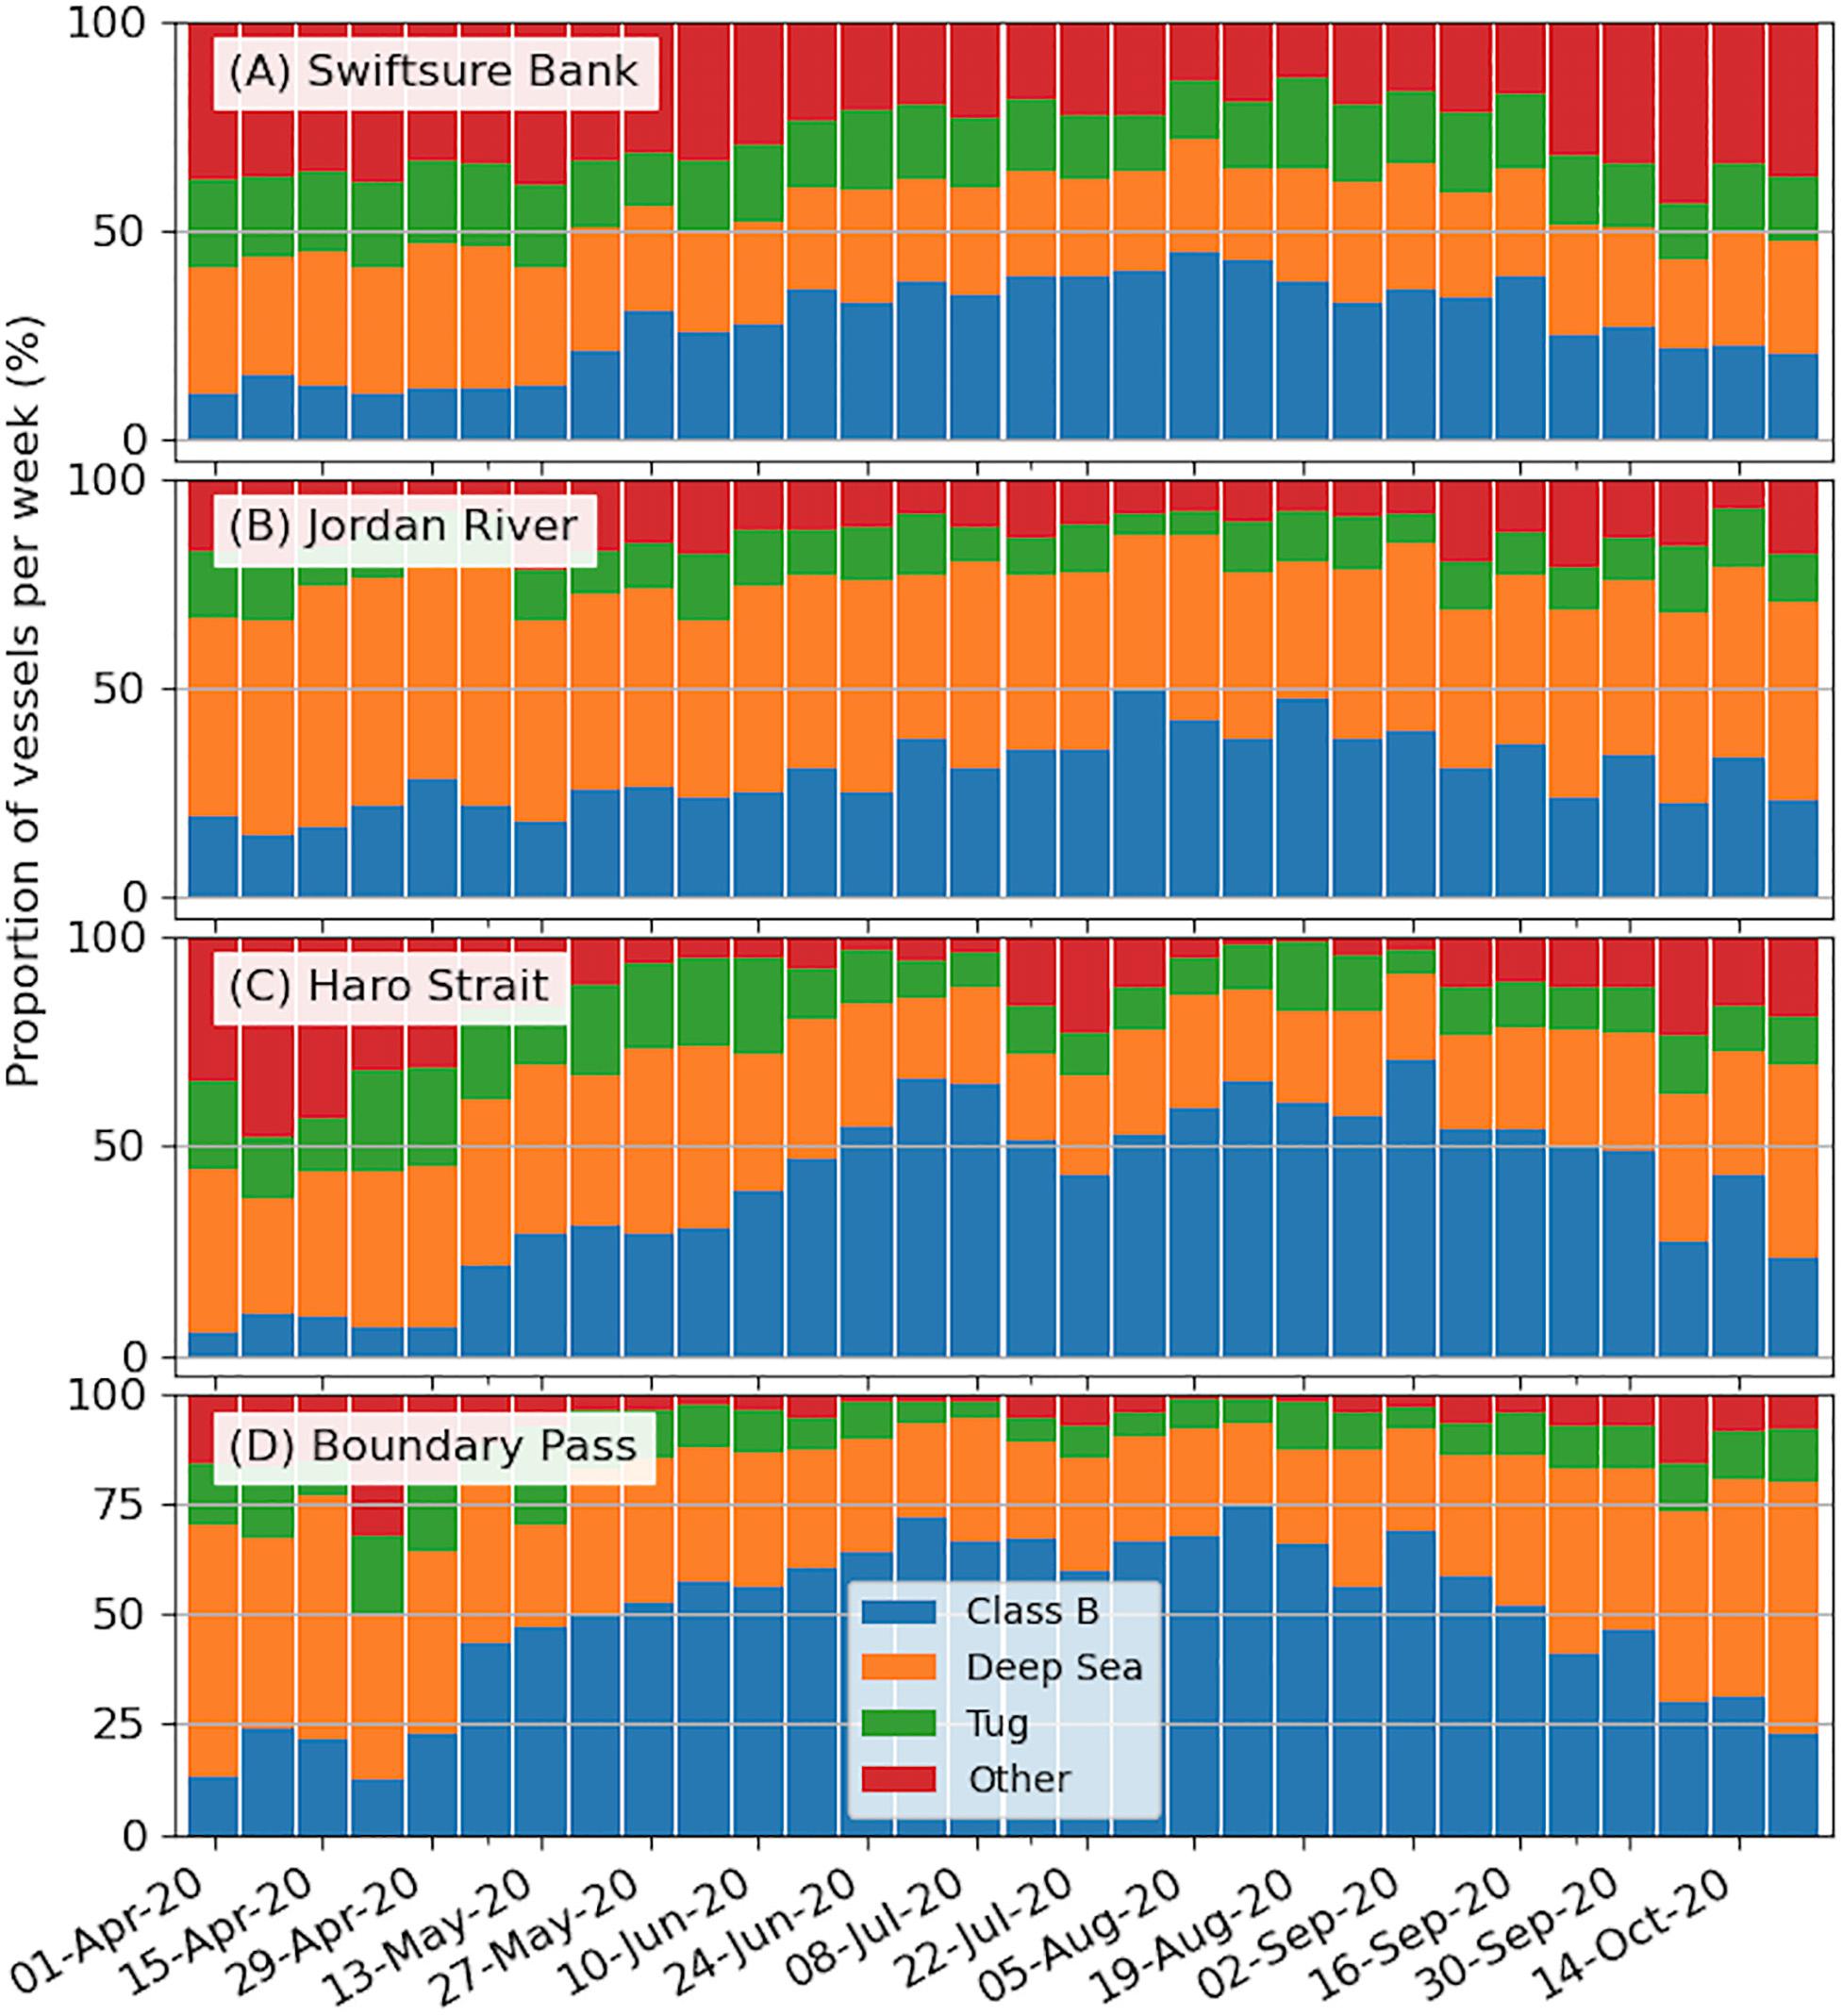
Figure 6. Vessel passages by type within 8 km of the mooring expressed proportionally of weekly totals from AIS data for (A) Swiftsure Bank, (B) Jordan River, (C) Haro Strait, (D) Boundary Pass. The data were used to assess changes in the sound field based on vessel presence and participation. Trial for (A) Aug. 1-Oct. 31; (B) Jun. 1-Oct 31; (C) and (D) Jul. 1- Oct. 31.
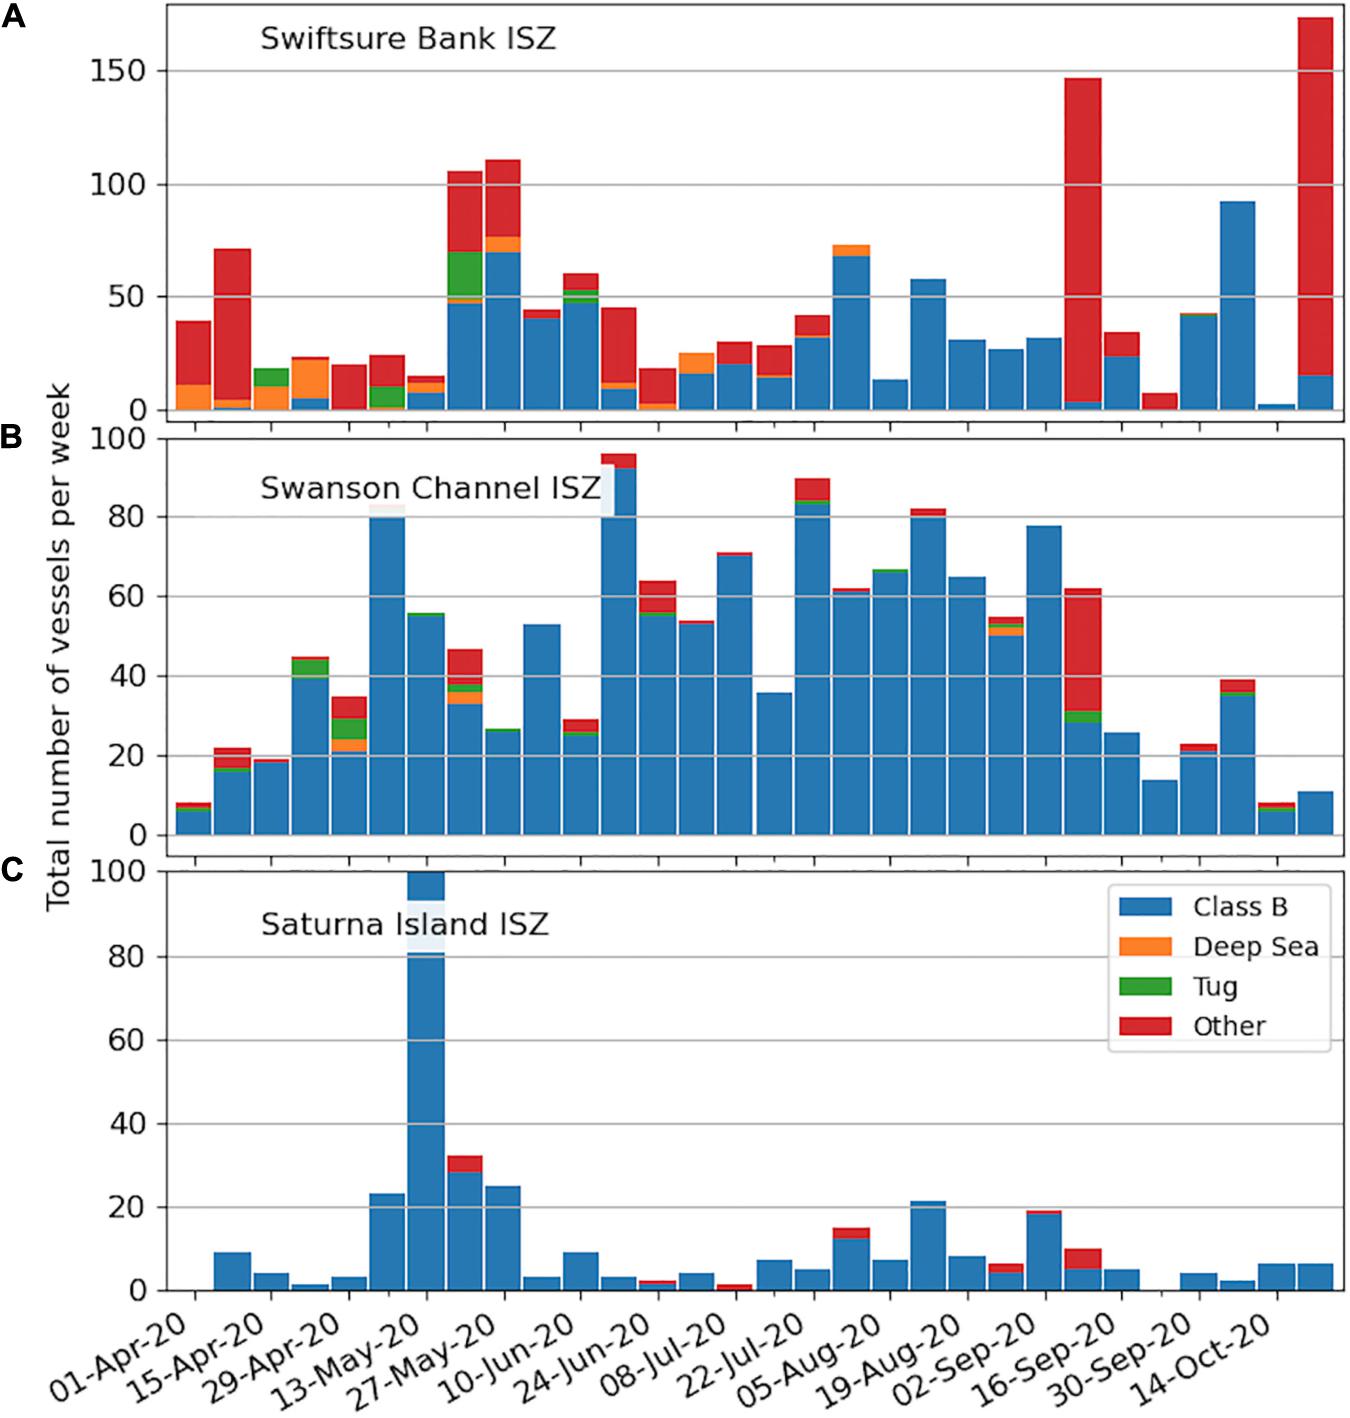
Figure 7. Vessel passages within the Interim Sanctuary Zones (ISZz) at (A) Swiftsure Bank, (B) Swanson Channel, (C) Saturna Island expressed weekly from AIS data. The number of vessels, and the proportion of vessel type, is shown. Trial period for ISZs Jun. 1-Oct. 31, 2020.
Class B vessels dominated in the ISZs. The exclusion zone on Swiftsure Bank showed more variety in vessel composition over time compared to the other locations (Figure 7). Only Saturna Island showed periods when vessels were absent, with vessel presence for Swiftsure Bank and Swanson Channel actually elevated during the enforced exclusion period (Figure 7).
The proportion of time that each vessel type was at the closest point of approach, and likely the dominant noise source for 10-min periods, was aggregated and examined on a weekly basis. Class A vessels were closest to the mooring for 50% of the recording time in both control and trial periods at Swiftsure Bank and Jordan River. Proportions of the recordings with vessels within 8 km were greatest for moorings on Swiftsure Bank and Jordan River, consistently exceeding 60%. In Haro Strait and Boundary Pass, the AIS data showed tugs to pass closest to the moorings. Conversely, AIS data showed vessels to be present rarely more than 20% of the time per week at the mooring within the ISZ off Saturna Island.
Recordings from within the Swanson Channel ISZ may reflect the change in ferry traffic over the summer. Passage numbers from Otter Bay, the closest ferry terminal on Pender Island, and in proximity to the ISZ, showed ferry traffic decreased following the April COVID-19 restrictions. The summer months would normally see increases in ferry transits through the study area, however sailings between Vancouver Island and the lower mainland of British Columbia and the Gulf Islands were reduced or suspended as part of the pandemic response measures. As restrictions eased, sailings through the summer increased to 70% of 2019 levels. The number of transits were consistent throughout the trial period. The most notable change between years resulting from these restrictions was for cruise ships and ferries transiting across the American-Canadian border, which were totally absent for summer 2020 (Vancouver Fraser Port Authority, Unpublished data). This, however, did not overtly impact the results of the conservation measures trialed in this analysis.
The number of Class A commercial cargo vessel transits through the Salish Sea to the Port of Vancouver were generally unchanged when compared to previous years (Vancouver Fraser Port Authority, Unpublished data). Importantly, for the lateral displacement trial and comparison between years, the transits of tugs were also comparable to previous years. A notable short-term decline in passages in June-July was seen for vehicle carriers/roll-on-roll-off vessels only (Vancouver Fraser Port Authority, Unpublished data). The AIS data showed a reduction of Class B vessels in Canadian waters in 2020 compared to previous years, perhaps due to COVID-19 restrictions and passage of recreational vessels between America and Canada being restricted throughout the summer.
The AIS data showed the number of vessel transits through the slowdown zones at Swiftsure Bank and Haro Strait to Boundary Pass were consistent during trial periods and the control period. Therefore, any changes in the ambient noise fields resulted from either a change in the relative distance of the transit from the mooring, or changes in vessel speeds. The former was ruled out through the probability density analysis of closest approach, using the AIS data on weekly vessel passages. For Swiftsure Bank, vessels predominantly transited between 0.8-1.2 km from the mooring. This was consistent for both pre- and trial periods. A peak of vessel passages at a distance of approximately 10 km from the mooring was recorded for July 1-November 1, which, when vessels were considered by type, was attributed to tugs. Vessels were most likely to pass within 2 km of the mooring at Haro Strait, and within 1 km at Boundary Pass. The probability densities were again consistent between the pre- and trial periods. The AIS data showed participation in the slowdown measures to be greater in 2020 compared to all other trial years. This was also confirmed in the pilots’ self-reporting; there were 1803 transits through the Haro Strait-Boundary Pass slow down zone, 91% of which pilots reported to have reduced their speed. At Swiftsure Bank, a non-piloted area, STW calculations suggested 82% of the 861 transits reduced speed to within one knot of the target speeds during the trial period (Vancouver Fraser Port Authority, Unpublished data).
The speed through water for each vessel was quantified and compared to an overall median value for vessels of the same type for each of the slowdown regions and passages within 8 km (Table 2). Most of the transit speeds fell within 5 knots above or below the pre-trial median speed. The most notable reduction of speed was by container ships that participated in the program in the Haro Strait-Boundary Pass trial area. The median speeds recorded at Swiftsure Bank for bulkers and container ships were, however, already below the requested slowdown speed in the pre-trial periods (Table 2).
The overall number of tugs transiting the Strait of Juan de Fuca was low compared to the number of other commercial vessels, therefore their impact on the overall noise field was also relatively low. The density of position reports of tugs in the lateral displacement zone in 2020 was greater than in 2019. The mean changes in distance from the Enhanced Management Area (Figures 1, 2), protected for SRKW foraging, increased on average by 1.22 km from 2017, when no lateral displacement was enacted, to the 2020 lateral displacement (Vancouver Fraser Port Authority, Unpublished data). However, a large majority of the tug travel in this area was noted in the inbound and outbound shipping lanes, or south of the shipping lanes, in United States waters, outside of the trial period.
During the 2020 study period all tugs north of the outbound shipping lane, or within 8 km of the Jordan River mooring were tracked. During the pre-trial period (April 1-June 1) 24 different tugs and a total of 46 transits were considered. During the trial period (June 1-November 1) 32 different tugs were tracked with a total of 144 transits. This was a significant increase in average daily transit number between pre-trial and trial periods (t(280.512) = 2.353, p = 0.019, Figure 8). Overall, the mean transit distance of tugs from the mooring increased significantly (Figure 8; t(2.029) = 168.051, p = 0.044), by 463 m on average. Passages within 1.5 km of the mooring showed a considerable decrease during the trial period (Figure 8). Eighty-two percent of the tugs spent at least of 50% of their transit through the trial zone in the outbound lane or the lateral displacement zone. This was an increase from 76% of transits in the previous year. For tugs that made multiple transits (n = 11) in both the pre-trial and trial periods, the distances were either significantly increased (n = 3) or unchanged, and already at a distance consistent with the request (n = 8). The transit speeds of these vessels were also generally reduced in the displacement and enhanced management zones in Juan de Fuca Strait compared to those in shipping lanes or the traffic separation zone (Vancouver Fraser Port Authority, Unpublished data).
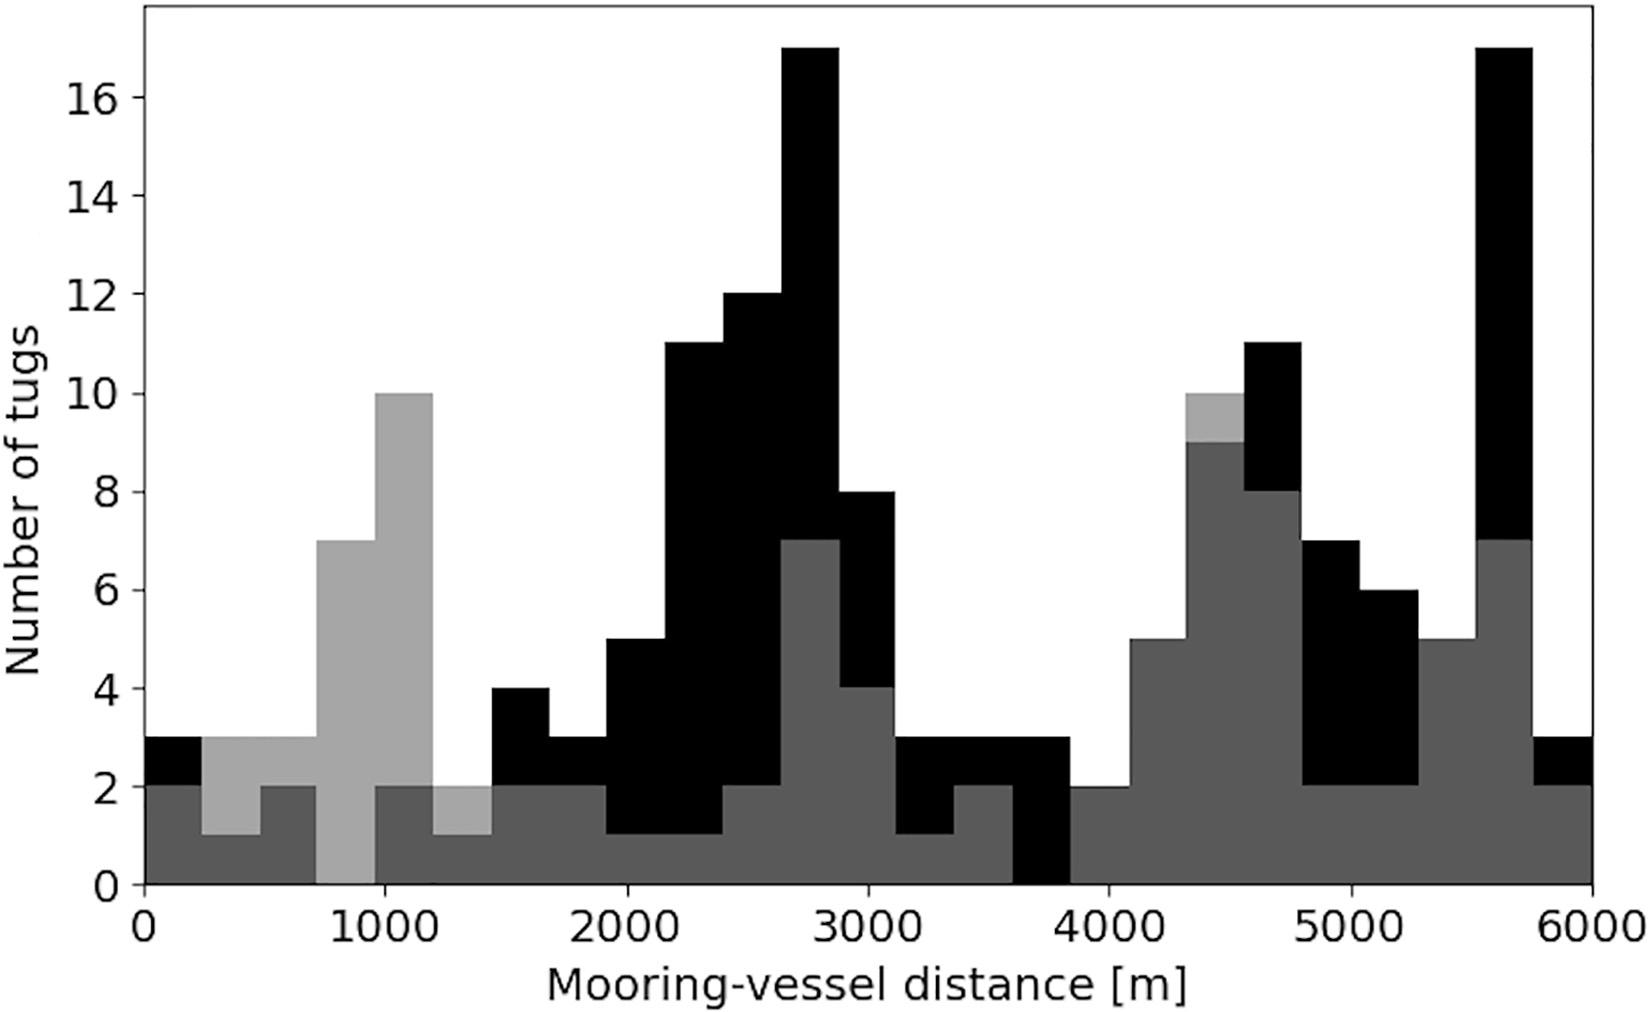
Figure 8. Distribution of nearest approach distances for tugs as they passed the Jordan River mooring (positioned at zero) during the pre-trial period (light) and trial period (black). Darker gray represents where pre- and trial period results overlap.
Vessel passages through the ISZs were quantified and expressed for pre-trial and trial periods (Figure 7). Generally, the number of vessels (Figure 7), and proportion of time with vessels in the ISZs increased as the summer progressed. Swanson Channel showed Class B vessels consistently present, with this vessel type dominating proportionally. The number of vessels within the area around the mooring (Figure 5) significantly increased for the period that the ISZ measures were in place compared to the control period (t(388.406) = 8.102, p < 0.001), and generally increased throughout the summer also. Limited recording time in May, prior to the commencement of the exclusion zone measures, was available for Saturna Island to further act as a control. However, this pre-trial period did feature days with considerable vessel presence (Figure 7). In the week of May 13, 2020 AIS records showed several days with vessels present for at least 6 hours per day, and two days exceeding 16 hours from the AIS records. The traffic composition in the Swiftsure Bank ISZ was representative of its proximity to the commercial traffic lanes, as well as being an area use by Class B and smaller, recreational vessels.
Data for periods when current speeds exceeded 0.25 m/s, wind speeds were more than 5 m/s, or when the small vessel detector signaled the presence of non-AIS tracked vessels were removed to more clearly evaluate the efficacy of the vessel slowdowns and lateral displacement. The low-current criterion reduced the number of available minutes of valid data by about 50%, except for the Swanson Channel ISZ where the reduction was only 6%. The corresponding reduction in available minutes due to the wind speed criterion varied between 16 and 46%. The reduction in available minutes to analyze as a result of the small vessel detector ranged between a low of 5% at Jordan River to a high of 18% in the Swanson Channel ISZ (see Supplementary Table 4). Therefore, the largest proportion of removals resulted from the restriction of abiotic noise in the ambient levels. Removals of small vessels, following the removal of high wind and current periods, were greatest in the ISZs at Swanson Channel (43%) and Saturna Island (57%), and least at the Swiftsure Bank slowdown mooring. Overall, this process left between 11-34% of the trial data to compare to equally filtered control data, with Jordan River the least affected and Swanson Channel the most. A similar removal of Class A vessels left between 20-62% of the data for an analysis of the changes in ambient noise levels for the Class B vessel presence in ISZs (see Supplementary Table 4).
The SPLs derived from the cumulative distribution functions (CDFs), and changes between trial and pre-trials periods showed a decrease in almost all locations and frequency ranges tested at the L5, L50, and L95 exceedance levels (Table 3 and Supplementary Table 3). Considerable decreases were seen for median broadband soundscape frequencies during the slowdown and lateral displacement trial periods compared to the prior two months. Similar declines were seen for the frequency ranges relevant to SRKW (Table 3). For Swiftsure Bank, Boundary Pass, and Jordan River reductions were seen most notably in SPL values at median levels, whereas for Haro Strait these reductions were limited to periods when the noise levels were most elevated, at the L5 exceedance level (Table 3). Lesser reductions in SPL were seen in the ISZ recordings when comparing data collected during the slowdown trials were compared to control periods. The ISZ measures on Swiftsure Bank did show notable decreases in the lowest frequencies in ambient noise (L95) levels, unmatched by other moorings (Supplementary Table 3).
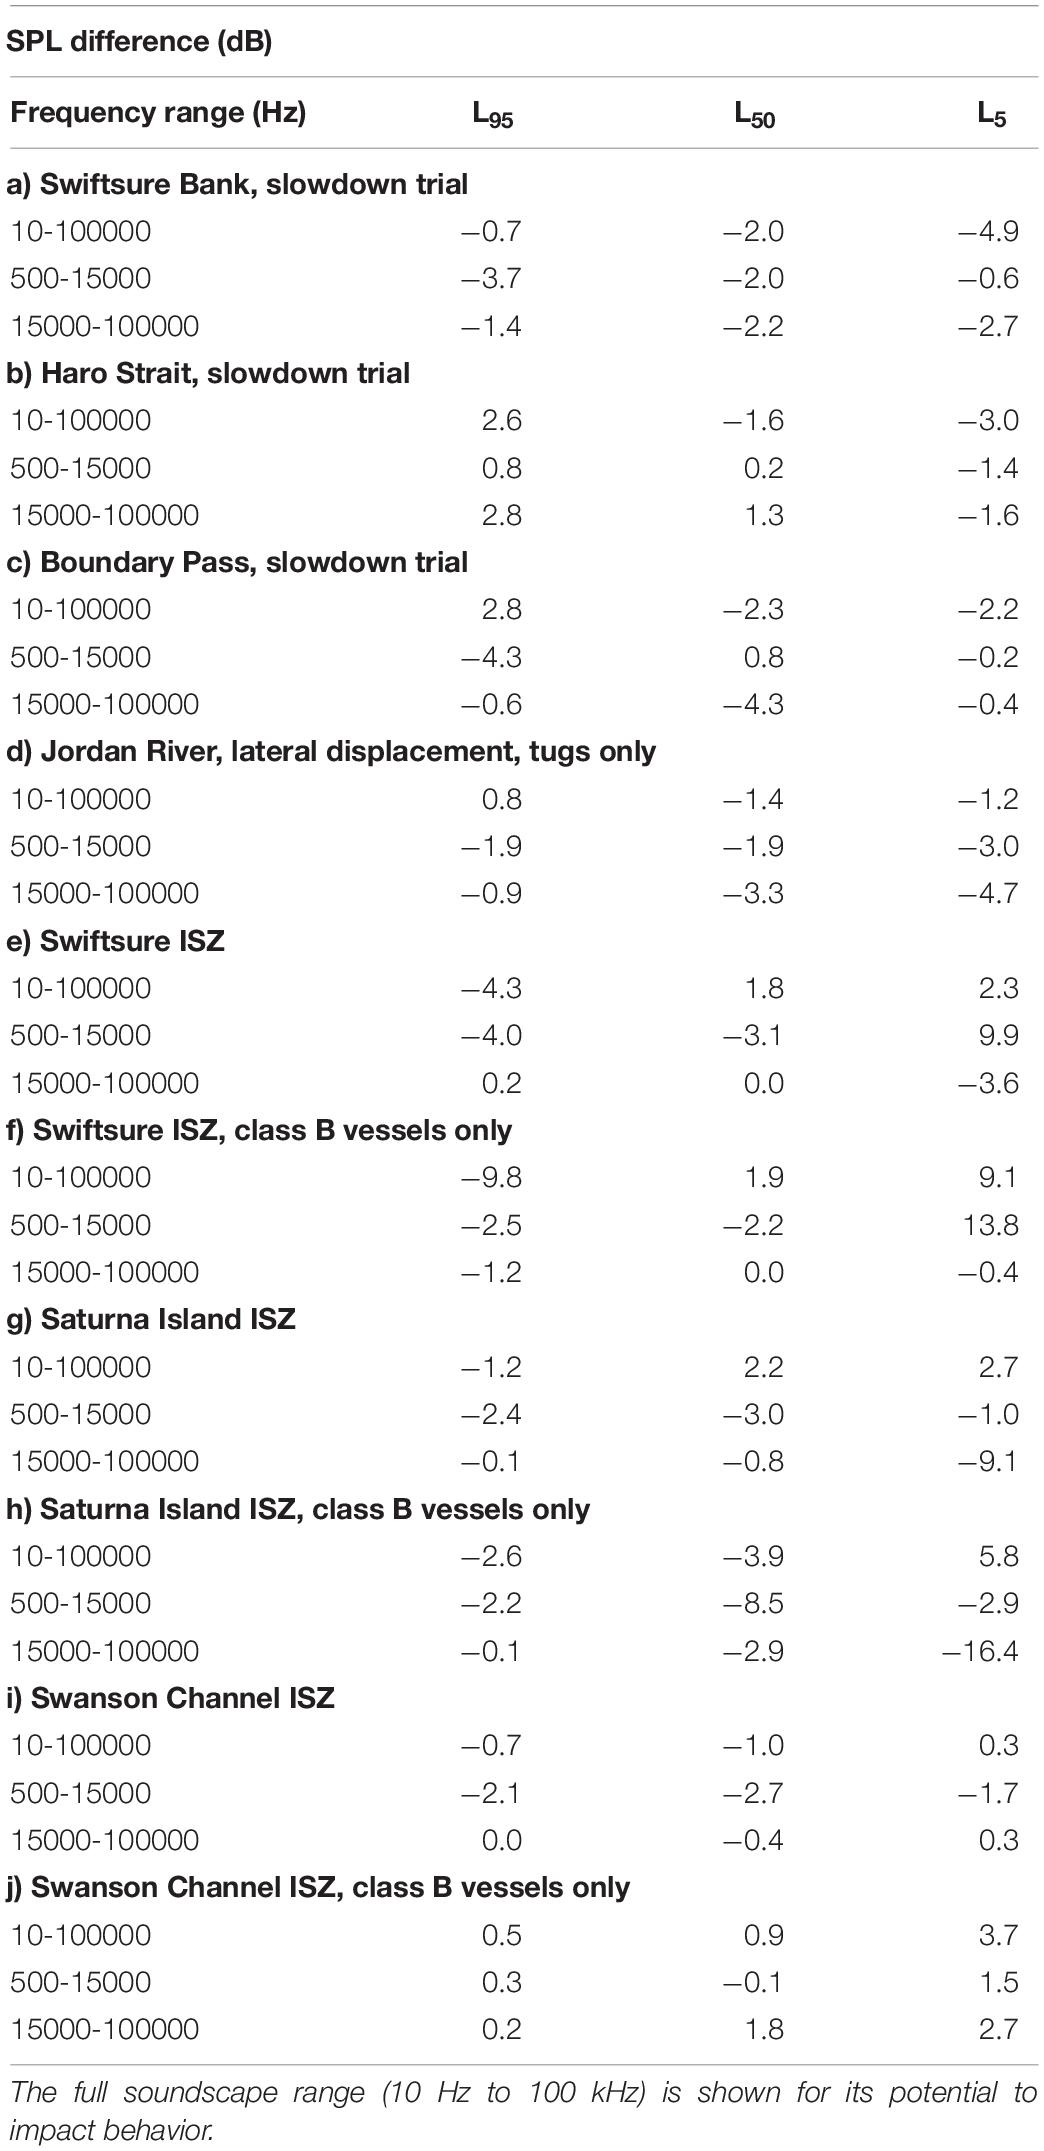
Table 3. The differences in SPL between pre-trial and trial periods at the L5, L50, L95 exceedance levels are shown for frequency ranges important to SRKW communication (500 Hz to 15 kHz) and echolocation (15–100 kHz).
Slowdown trials at Swiftsure Bank and Boundary Pass resulted in reductions in median noise levels predominantly in the lowest frequency bands (Supplementary Table 3). The greatest broadband ambient noise reductions were at Swiftsure Bank as a result of the slowdown action. Boundary Pass comparisons showed the greatest reduction in the SRKW communications band at the L95 level, more indicative of a change in background noise (Table 3). The greatest reduction in noise in echolocation frequencies came from the median SPL at the same mooring. The Haro Strait mooring showed a similar pattern of declines in SPL, with the more notable reductions seen at the L5 exceedance level (Table 3).
The impact of tug movement in the lateral displacement zone was considered separately because the number of vessels was limited (n = 46 and n = 144, pre-trial and trial periods respectively), and only the impact of the closest approaches of these vessels was considered (Table 3). Considerable reductions were seen in the SRKW frequency ranges, with mid- to higher-frequency ranges showing the most noticeable decreases in SPL during the trial period (Table 3 and Supplementary Table 3). The reductions possible from individual tug transits were also quantified. Sixteen individual vessels were identified in the AIS data to have made transits in the management zone in both the pre-trial and trial periods, 11 of these were multiple transits. Eight of these tugs made their journeys at a consistent distance from the mooring in both the control and trial periods, and were already at a distance that complied with the trial and use of the lateral displacement zone. Three of the tugs were found to alter their route in accordance to the lateral displacement trial request. The most significant change showed the closest approach distance in the pre-trial period to be 750 m, which was increased to 1760 m during the trial period. This increase of more than 1 km distance from the mooring reduced overall soundscape levels in the broadband frequency 10 Hz to 100 kHz from 130.6 dB re 1 μPa to 125.3 dB re 1 μPa (−5.3 dB change). Similar reductions in the SRKW communication band (−4.7 dB) and echolocation band (−5.6 dB) were recorded. In both of the SRKW communication frequency ranges, greater reductions were found at Jordan River than could be attributed from changes in tug traffic alone. However, the reverse was true for the reduction in broadband ambient noise, with overall no change at this mooring when all vessel types were considered.
Inclusion of the changes in Class B vessels only for the ISZs in this analysis focused on smaller vessels. Reductions in SPL were considerable in the highest frequency ranges at Saturna Island, whereby changes considering Class B vessels only far outweighed those found when including Class A traffic (Supplementary Table 3). This pattern was reversed for Swanson Channel, suggesting that Class B vessels remained in the exclusion zone during the trial period (Figure 7 and Table 3). Although background and median noise levels were reduced for recordings made in the Swiftsure ISZ when measures were in place, these reductions were focused in the low frequencies. The removal of Class A vessels from the recordings showed even greater reductions in these low-frequencies and ambient noise levels (Table 3). This was also seen for the Swanson Channel ISZ, with few reductions found at this mooring for the Class B vessel comparison of trial to control (Figure 5). Saturna Island ISZ, however, showed much greater reductions when considering only Class B vessels, focused in the mid- to high-frequencies and SRKW bands (Table 3).
Large scale changes in the acoustic environments of cetaceans are an increasing concern (Tyack, 2008). Vessel presence, and vessel-derived acoustic disturbance is one of three main factors listed as limiting the population recovery for SRKW (Weilgart, 2007; Lacy et al., 2017; Department of Fisheries and Oceans Canada [DFO], 2018). Whale habitat use in the Salish Sea is associated with the abundance of their salmonid prey (Nichol and Shackleton, 1996; Baird et al., 2005), foraging, or traveling between foraging and wintering habitats (Balcomb and Bigg, 1986; Krahn et al., 2004). The management experiments discussed here encompassed known SRKW summer habitat on Swiftsure Bank, in portions of Juan de Fuca Strait, Haro Strait and the west side of San Juan Island, Swanson Channel, Boundary Pass, and southern portions of the Strait of Georgia (Department of Fisheries and Oceans Canada [DFO], 2017a, b; Olson et al., 2018).
Killer whales use their acoustic senses for navigation and foraging, as well as to maintain contact between conspecifics. Marine traffic creates disturbances that modify behavior, degrades marine environments, and effectively fragments habitat (Pirotta et al., 2019). Noise from vessels has the potential to affect the whales’ ability to perform critical life processes through masking. The management measures outlined here are aimed to reduce the impact from vessels. In particular, reducing noise additions to the frequency ranges used by SRKW in echolocation and calling. Also, changes in the spatial extent over which they can communicate or echolocate impacts navigation, foraging success, and group cohesion. Decreased foraging success, for an already nutritionally stressed population (Ford et al., 2009) is a serious challenge to survival.
Compensation techniques in calling, including louder vocalizations, and in altered frequencies, help SRKW maintain acoustic contact in the presence of small vessels as noted by Holt et al. (2009, 2011). This may, however, also alter their energetic balance, expending more energy to call more consistently (Noren et al., 2013; Holt et al., 2015). However, through metabolic studies with dolphins, Noren et al. (2017) suggest the energetic cost of altered acoustics use, especially for echolocation, is negligible compared to other behaviors that might result from vessel presence. Changes in behavior or avoidance of noise sources in foraging areas (Lusseau et al., 2009; Noren et al., 2009, 2016) resulting from the perception of anthropogenic noise as a risk (Tyack, 2008) may further compound its energetic implications. The cumulative cost of these responses is heightened for SRKW as a prey-limited species.
Assessing the efficacy of mitigation programs should take into account both the rate of compliance by vessels to changes in their speed and/or route, and then, knowing the rate of participation in a trial, quantify the reductions of noise in the sound field. All the measures enacted were aimed to balance the effective change in SPL and compliance. Efficacy also should be measured in the frequencies relevant to the focal species for these measures, as we have done using the frequency ranges for SRKW communication and echolocation.
Adaptations of the conservation actions have been made since the trials began in 2017 to both increase participation and reductions in ambient noise level. For the slowdown trials, for example, changes in the trial start time, area, and speed restrictions have resulted in increased noise reductions. As well, the proportion of vessels participating in the trial in 2020 surpassed previous years. The initiation of measures has been based on sightings of SRKW in the Salish Sea since 2018. The whales follow the ‘in-migration’ of northern Chinook salmon (Oncorhynchus tshawytscha) populations, which typically occurs from April to September (Waples et al., 2004). Chinook salmon is the near-sole prey for this period for SRKW, with fish from the Fraser River comprise up to 90% of their diet at this time in these inland waters (Hanson et al., 2010, 2021); however, there have been large fluctuations in salmon abundance and survival in the Salish Sea (Ruff et al., 2017), and stocks are depleted (Nelson et al., 2019). These losses have been linked to habitat degradation, over-harvest, and changing ecosystem conditions (Lawson, 1993; Ruckelshaus et al., 2002; Peterson and Schwing, 2003; Ward et al., 2015). In recent years, SRKW have reduced their residency times in the Salish Sea, and have been noted to have been absent between April and June, entering these waters increasingly later in the summer (Shields et al., 2018; Hanson et al., 2021).
Vessel presence was most altered by COVID-19 restrictions in pre-trial rather than trial periods, although restrictions and advisories to limit travel remained in place throughout. The week-by-week reductions in noise levels in the Strait of Georgia reported by Thomson and Barclay (2020) in January to April 2020 were not seen in our data, nor were the reductions in commercial vessel traffic they reported in comparison to previous years. We, therefore, have not made any attempt to correct the comparison between the control and trial periods to account for these restrictions.
For Boundary Pass and Haro Strait, pilot-reported participation (91%) exceeded that of previous years, including 2019 where the request was the same for distance and speed. The reductions in broadband ambient noise were similar to previous trial years (Joy et al., 2019; MacGillivray et al., 2019). However, the greatest SPL changes were noted in the lower frequencies in prior studies. During the 2020 trial there were also reductions in the mid- to high-frequencies for median and background (L95) exceedance levels for Boundary Pass, and in the upper sound limits in Haro Strait (L5; Table 3 and Supplementary Table 3). Previous trials had not noted SPL reductions for frequencies greater than 15 kHz. This may result from the removal of small vessels from the analysis, which typically add to higher frequencies, and are seasonally increased during the trial period (Figure 6). The slowdown at Swiftsure Bank was introduced in 2020, and showed a high rate of participation. However adjustment in transit speeds from pre-trial to trial were not as great as those for the slowdown zone in the inner waters, especially for container vessels (Table 2). Despite this, changes in median ambient noise levels were recorded, predominantly in the low frequencies (Supplementary Table 3), with the change between the control and trial period in these frequencies greater than those calculated for Haro Strait and Boundary Pass. The changes in noise levels at frequencies pertinent to SRKW (Branstetter et al., 2017; Heise et al., 2017) showed greatest change at Boundary Pass for the slowdown measures, and were at their least in the adjoining Haro Strait (Table 3). The differences in acoustic levels and changes in ambient noise between the slowdown trial zones could be attributed to differing topography, distances between moorings and vessel passage, and water property profiles (Warner et al., 2020), as well as the different composition of vessel traffic (Figure 6).
Noise emissions differ by vessel class. Container ships emit the greatest sound levels of the Class A vessels tracked in this study. Each transit has the capacity to elevate noise relative to ambient by approximately 20 dB, focused in the 125 Hz to 20 kHz range (Veirs et al., 2016). Similar levels have been noted for bulkers and cargo vessels (Veirs and Veirs, 2006; Veirs et al., 2016). The greater proportion of deep-sea and tug traffic at Swiftsure Bank compared to the Haro Strait and Boundary Pass zone (Figure 6), may have instigated the larger reduction in low-frequency bands despite the reduction of speed between zones. Regressions between the source level of vessel emissions and speed (SOG) have shown a linear relationship in the order of 0.93 dB per knot (1.8 dB per m/s) for broadband source levels for the vessels transiting through the slowdown zones, likely to vary within a range of 0.2-3.4 dB dependent on vessel class (Veirs et al., 2016). Our examination of SPL change was done through aggregate vessel classes, but several other factors may influence the acoustic output other than speed, including the vessel draft, size, loading, and maintenance schedule (International Maritime Organization [IMO], 2014).
A reduction in speed by deep-sea and passenger vessels to 11 knots minimizes the amount of lost whale foraging time in excess of 10% (Joy et al., 2019). Although a reduction of speed results in lower acoustic inputs, it also extends transit times, and so has the potential to increase the overall exposure time to vessel noise for SRKW. However, notable increases in the percentage of time with Class A vessels in proximity to the moorings was not seen at the commencement or during the slowdowns, suggesting that the benefits in reducing the overall sound exposure levels in the whales’ soundscape in these areas was not at the expense of SRKW exposure time.
The lateral displacement trial of tugs and barges has shown both a good rate of participation, and reduction of the noise in both the broadband and higher frequencies in all years. The results shown here build on previous success (Vagle and Neves, 2019; Vagle, 2020). The reduction in noise as a result of moving tugs away from SRKW critical habitats was noticeable. The reductions were not as great as noted in 2019 for the trial reported here, but compares well to the initial results in 2018 which had reductions between 4.3–5.8 dB resulting from altered tug transit routes (Vagle and Neves, 2019). The reductions in 2019 were aided by a general reduction in shipping traffic (Vagle, 2020). The probability of closest approach in the trial period was increased from within 2 km of the mooring, with higher participation in displacement trial in 2020 than in previous years. Moreover, tugs were generally taking a route more distant to the mooring outside of the trial. It should be noted that some of the tug transits were port-to-port and so would not be subject to the lateral displacement measures. These were not included in the transit numbers used to measure participation, but they would still be present in the AIS and acoustic data streams.
The physical presence and proximity of vessels has been demonstrated to hinder foraging behaviors, with changes in dive patterns and lost feeding opportunities reported (Williams et al., 2006, 2009, 2014; Lusseau et al., 2009; Noren et al., 2009; Holt et al., 2021). The greater maneuverability of tugs compared to other vessel types has allowed a shift in transit routes resulting in an increased distance between them and SRKW foraging habitat (Department of Fisheries and Oceans Canada [DFO], 2017a, b). This is more feasible than a complete rerouting of shipping lanes. By putting greater space between the areas used by the whales and the vessel transit routes, the displacement measures reduce the disturbance from physical presence, while also decreasing the risk of vessel strikes. The significance of individual tugs voluntarily altering their routes was seen with reductions of approximately 5 dB in both the overall soundscape and SRKW frequencies used for calling and echolocation, resulting directly from an increase of 1 km in transit distance from the mooring.
Following the results of these trials, modeling exercises have been used to assess further mitigation actions. An additional westward shift of the existing traffic lanes through Haro Strait, and southward shift of the outbound lane through Juan de Fuca Strait, for example, has been suggested to further reduce noise levels in areas critical for SRKW (Matthews et al., 2018). In areas where safe transit lanes are limited, as they are in the Salish Sea, the creation or alteration of shipping lanes may not be possible. Instead, re-direction of some vessel types or speed reductions are more easily achieved and can succeed in reducing the vessel impacts (Vanderlaan and Taggart, 2007; Conn and Silber, 2013; Laist et al., 2014). This is also true for species whose presence and movements are less predictable, or show changes in presence over space and time as is increasingly noted for SRKW in the Salish Sea (Hanson et al., 2021).
Exclusion of vessels from the ISZs had the lowest levels of compliance. Swiftsure Bank showed very little change, if any, between the proportion and time spent by vessels between pre-trial and test periods. However, there were considerable reductions in the ISZ recordings. This suggests that the recordings at this mooring may also be affected by the slowdown measures in place in the traffic lane proximal to the ISZ (Figures 1, 3 and Table 3). This could also be indicated by the most notable changes in SPL being focused in the lower-frequencies, even when focusing on changes in the presence of Class B vessels in the ISZ (Supplementary Table 3). The presence of commercial vessel was low (Figure 7), and the probability density analysis showed Class A vessels did not travel within 2 km of the ISZ mooring, which further suggests the changes may be a result of the proximal slowdown. The ISZs in the Gulf Islands also typically showed low compliance, although the time with, and presence of vessels (Figure 7) was much less than the management area on Swiftsure Bank. The noise reductions at Swanson Channel were focused in the low-frequencies, and those representing vessel presence. Changes from pre-trial were greatest only when considering Class A vessels, suggesting that Class B and recreation vessels may be prevalent while the ISZ was in place, which was confirmed by the AIS data (Figure 7). The change in ferry passages over time, as COVID-19 restrictions were eased through the summer, was considered principally for its effect on the sound field in the Swanson Channel ISZ. On a more regional scale, as considered here, ferries can make substantial additions to the soundscape. The number of ferry transits to Otter Bay and through the Gulf Islands were consistent between July and October 2020. The recordings from the Swanson Channel mooring showed decreases in SPL despite the increase of traffic, both from ferries and smaller recreational vessels (Figure 7). The Saturna Island ISZ showed the lowest vessel presence during the trial period (Figure 7). However, the comparison between this and baseline levels in the month before, especially for Class B vessels (Table 3 and Figure 7) indicates an inflated reduction due to intense vessel activity just before the commencement of the exclusion. This is believed to be a result of the installation and testing of an underwater listening station from mid- to late-May. The pre-trial period was half of the other ISZs, as recordings prior to May 9 were not available. For the ISZs, as with all the management measures assessed, we were only able to demonstrate the compliance by AIS-tracked vessels. Assessment of changes in behavior by recreational mariners is much harder to measure, and remains a significant gap in our analysis. Whether the contributions from small vessels would surpass those of commercial vessels, especially on localized scales, is currently not possible to establish. However, their addition to the sound field could be considerable based on their high number, high speed, and use of coastal areas in the Salish Sea. Unchanged or increased SPL levels in the decadal bands compared to the control pre-trial recordings, especially in the 100–1000 Hz range (Supplementary Table 3), considered with the proportional composition of vessel traffic at each site (Figure 7) suggests that the use of the management zones by smaller Class B and recreational vessels remained high, or indeed increased, as the summer and trial period progressed. Until the presence and acoustic additions of small vessels are better characterized, we may underestimate the impacts of vessel noise on cetacean species, especially those in coastal waters.
Our conclusions are limited by the reliance on AIS data to characterize vessel presence, especially when establishing compliance to ISZs. Many vessels known to use these areas, such as pleasure craft and fishing vessels, are not required to transmit AIS data. Even for vessels where transceivers are required, the cooperation of vessel captains is needed. For terrestrial AIS there are gaps in coverage between base stations as the broadcasts are approximately line-of-sight, which may reduce the reliability of the spatial data. The broadcasts are also subject to human error in data input, data corruption, signal noise, and instrument failure (Aarsæther and Moan, 2009; McGillivary et al., 2009; Silber and Bettridge, 2010; Robards et al., 2016).
Our ambient noise recordings have shown that considerable changes in SPLs can be exacted with relatively small changes. The change in slowdown measures between years by 0.5 to 1 knot, depending on vessel type, showed increased reductions between 2018 and 2019 (Joy et al., 2019). As well, the altered route of tugs and barges, a relatively small component of the vessel traffic through Juan de Fuca Strait and other management areas, reduced noise in the sound field. Also, we found changes by single vessels can have a noteworthy impact. Most significantly, all trial zones showed reductions in the SRKW communication and echolocation frequency ranges (Table 3).
The limitations of vessel transit speed and route alteration, as analyzed here, are operational measures designed to reduce the vessel noise impacts on an endangered species using habitat areas deemed critical for its survival. A reduction in anthropogenic noise reduces the impact of lost echolocation and communication ability that is required for locating and capturing prey. An alternative approach would be source-based, whereby vessel design is altered from the outset, or the existing fleet is retrofitted to reduce their source levels (Veirs et al., 2017). A more regular maintenance schedule is also an effective means of reducing a vessel’s acoustic impact (International Maritime Organization [IMO], 2014). Operational measures can be enacted more proactively, and are typically applied on a local scale and for shorter times. Source-base initiatives are longer term measures that are being considered by the ECHO program and its collaborators, with the potential for port incentives to be provided to the quieter vessels. These would have a more global and long-term effect.
A combination of both source and operational measures will be the most effective route for decreasing the additions of noise in the acoustic environment in the Salish Sea. A clear and coordinated approach for managers, with additional effort given to raising mariners’ awareness, is needed to maintain and increase participation. Additional measures such as vessel convoying and greater restrictions in timing or transit zones are yet to be fully explored. This may increase the length of quiet periods between vessel transits for SRKW.
A high level of stakeholder collaboration and regulatory incentive to follow management directives was key to the successes experienced in similar management programs in other critical whale habitats (Wiley et al., 2013; Ebdon et al., 2019). In other regions where speed reductions are in place, vessel compliance is reported directly to the operating company (e.g., Right Whale Corporate Responsibility Card for vessels in Stellwagen Bank) or openly online (e.g., the Whale Safe Tool for vessels in the Santa Barbara Channel) to increase adherence to the speed limits in future transits.
The high rates of voluntary participation in the slowdown and displacement trials we describe here suggests there is promise in the application of these measures to reduce human impact on the soundscape, even without regulatory backing. Commercial vessel noise and disturbance has been identified as the greatest threat to SRKW success, after the decline in prey availability (Lacy et al., 2017). Whereas Chinook stock enhancements and increased habitat quality involve complex solutions over time, the measures described here can have an immediate benefit on whales transiting or foraging in the Salish Sea. Enforcement at current levels may increase compliance further, and prevent compensatory behavior to try and make up lost time by increasing speed in other areas, for example. In this study, voluntary measures demonstrated a higher-level of compliance than those mandated, although a program to heighten awareness of the measures may further increase voluntary participation before the introduction of more regulatory measures are needed. The enforcement of the ISZ would also greatly benefit from increased awareness as to the location and rationale of the conservation measures. What is yet to be determined are the full behavioral implications that each of these measures has on SRKW. Increased knowledge of whale response, and both short- and long-term consequences of vessel-based acoustic disturbance will enhance the accurate design, prioritization, and implementation of effective management plans.
The raw data supporting the conclusions of this article will be made available by the authors, without undue reservation.
RB and SV led the conception and design of the work, data collection and analysis, and analyzed and interpreted the data. CO’N provided technical expertise in the field and with the AMAR systems for data collection. KT provided details from the POV on the trials, vessel transits and participation. RB drafted the work. All authors revised, provided review and revisions, and final approval of the work.
This work was funded by the Government of Canada’s Ocean Protection Plan.
The authors declare that the research was conducted in the absence of any commercial or financial relationships that could be construed as a potential conflict of interest.
All claims expressed in this article are solely those of the authors and do not necessarily represent those of their affiliated organizations, or those of the publisher, the editors and the reviewers. Any product that may be evaluated in this article, or claim that may be made by its manufacturer, is not guaranteed or endorsed by the publisher.
The authors would like to thank Peter Van Buren, Christie Morrison and Harald Yurk for help with acquiring the data and time spent in the field. Thanks also must go to the officers and crew on CCGS VECTOR for all their help with servicing our hydrophone moorings in the Salish Sea.
The Supplementary Material for this article can be found online at: https://www.frontiersin.org/articles/10.3389/fmars.2021.664691/full#supplementary-material
Supplementary Table 1 | Hydrophone mooring locations and the management measures they are used to assess.
Supplementary Table 2 | Coordinates for the extents of the Interim Sanctuary Zones in 2020.
Supplementary Table 3 | Comparison of sound pressure levels (SPLs) at the L5, L50, L95 exceedance levels in decadal bands, overall soundscape (10 Hz-100 KHz) and frequency ranges important to SRKW. The absolute SPL values and differences between in SPL for pre-trial and trial periods are shown.
Supplementary Table 4 | Iterative filtering process of data vessel minutes (VM) to remove tide noise, then wind noise then small vessel (Class B) noise. Analyzed Class A VM are those representing the presence of tanker, bulkers, container ships, or vehicle carriers. Class B VM the removal of Class A presence is done before the removal of tide- or wind-effected vessel minutes.
Aarsæther, K. G., and Moan, T. (2009). Estimating navigation patterns from AIS. J. Navig. 62, 587–607. doi: 10.1017/s0373463309990129
Au, W. W. L., Ford, J. K. B., Horne, J. K., and Allman, K. A. N. (2004). Echolocation signals of free- ranging killer whales (Orcinus orca) and modeling of foraging for chinook salmon (Oncorhynchus tshawytscha). J. Acoust. Soc. Am. 115, 901–909. doi: 10.1121/1.1642628
Baird, R. W., Hanson, M. B., and Dill, L. M. (2005). Factors influencing the diving behaviour of fish eating killer whales: sex differences and diel and interannual variation in diving rates. Can. J. Zool. 83, 257–267. doi: 10.1139/z05-007
Balcomb, K. C., and Bigg, M. A. (1986). “Population biology of three resident killer whale pods in Puget Sound and off southern Vancouver Island,” in Behavioural Biology of Killer Whales, eds B. C. Kirkevold and J. S. Lockard (New York, NY: Alan R. Liss), 85–95.
Branstetter, B., St Leger, J., Acton, D., Stewart, J., Houser, D., Finneran, J. J., et al. (2017). Killer whale (Orcinus orca) behavioral audiograms. J. Acoust. Soc. Am. 141:2387. doi: 10.1121/1.4979116
Center for Whale Research (2021). Southern Resident Orca Community Demographics, Composition of Pods, Births and Deaths Since 1998. Harbor, WA: Center for Whale Research.
Clark, C., Ellison, W., Southall, B., Hatch, L., Van Parijs, S. M., Frankel, A., et al. (2009). Acoustic masking in marine ecosystems: intuitions, analysis, and implication. Mar. Ecol. Prog. Ser. 395, 201–222. doi: 10.3354/meps08402
Cominelli, S., Leahy, M., Devillers, R., and Hall, G. B. (2019). Geovisualization tools to inform the management of vessel noise in support of species’ conservation. Ocean. Coastal. Mang. 169, 113–128. doi: 10.1016/j.ocecoaman.2018.11.009
Conn, P. B., and Silber, G. K. (2013). Vessel speed restrictions reduce risk of collision-related mortality for North Atlantic right whales. Ecosphere 4, 1–16. doi: 10.1890/ES13-00004.1
Department of Fisheries and Oceans Canada [DFO] (2017a). Evaluation of the Scientific Evidence to Inform the Probability of Effectiveness of Mitigation Measures in Reducing Shipping-Related Noise Levels by Southern Resident Killer Whales. DFO Can. Sci. Advis. Sec. Sci. Advis. Rep. 2017/041. Ottawa: DFO.
Department of Fisheries and Oceans Canada [DFO] (2017b). Identification of Habitats of Special Importance to Resident Killer Whales (Orcinus orca) off the West Coast of Canada. DFO Can. Sci. Advis. Sec. Sci. Advis. Rep. 2017/011. Ottawa: DFO.
Department of Fisheries and Oceans Canada [DFO] (2018). Recovery Strategy for the Northern and Southern Resident Killer Whales (Orcinus orca) in Canada. Ottawa: Fisheries & Oceans Canada, 10–84.
Ebdon, P., Riekkola, L., and Constantine, R. (2019). Testing the efficacy of ship strike mitigation for whales in the Hauraki Gulf, New Zealand. Ocean Coast. Manag. 184:10503.
Ford, J. K. B. (1989). Acoustic behaviour of resident killer whales (Orcinus orca) off Vancouver Island, British Columbia. Can. J. Zool. 67, 727–745. doi: 10.1139/z89-105
Ford, J. K. B., Ellis, G. M., Olesiuk, P. F., and Balcomb, K. C. (2009). Linking killer whales survival and prey abundance: food limitation in the oceans’ apex predator? Biol. Lett. 6, 139–142.
Groot, C., Margolis, L., and Bailey, R. (1984). “Does the route of seaward migration of Fraser River sockeye salmon (Oncorhynchus nerka) smolts determine the route of return migration of the adults?,” in: Mechanisms of migration in fishes, eds J. D. McCleave G. P. Arnold J. J. Dodson, and W.H. Neill (New York, NY: Plenum Press), 283–292.
Hannah, C. G., Dupont, F., Collins, A. K., Dunphy, M., and Greenberg, D. (2008). Revisions to a Modelling System for Tides in the Canadian Arctic Archipelago. Can. Tech. Rep. Hydrogr. Ocean Sci. 259, 6–62.
Hanson, M., Baird, R., Ford, J., Hempelmann-Halos, J., Van Doornik, D., Candy, J., et al. (2010). Species and stock identification of prey consumed by endangered southern resident killer whales in their summer range. Endang. Sp. Res. 11, 69–82. doi: 10.3354/esr00263
Hanson, M. B., Emmons, C. K., Ford, M. J., Everett, M., Parsons, K., Park, L. K., et al. (2021). Endangered predators and endangered prey: seasonal diet of Southern Resident killer whales. PLoS One 16:e0247031. doi: 10.1371/journal.pone.0247031
Hauser, D. D., Logsdon, M. G., Holmes, E. E., Van Blaricom, G. R., and Osborne, R. W. (2007). Summer distribution patterns of southern resident killer whales Orcinus orca: core areas and spatial segregation of social groups. Mar. Ecol. Prog. Ser. 351:301. doi: 10.3354/meps07117
Heimlich-Boran, J. R. (1988). Behavioral ecology of killer whales (Orcinus orca) in the Pacific Northwest. Can. J. Zool. 66, 565–578. doi: 10.1139/z88-084
Heise, K. A., Barrett-Lennard, L. G., Chapman, N. R., Dakin, D. T., Erbe, C., Hannay, D. E., et al. (2017). Proposed metrics for the management of underwater noise for Southern Resident killer whales. Coastal Ocean Rep. Ser. 2:30.
Holt, M. M., Noren, D. P., Dunkin, R. C., and Williams, T. M. (2015). Vocal performance affects metabolic rate in dolphins: implications for animals communicating in noisy environments. J. Exp. Biol. 218, 1647–1654.
Holt, M. M., Noren, D. P., and Emmons, C. K. (2011). Effects of noise levels and call types on the source levels of killer whale calls. J. Acoust. Soc. Am. 130, 3100–3106. doi: 10.1121/1.3641446
Holt, M. M., Noren, D. P., Veirs, V., Emmons, C. K., and Veirs, S. (2009). Speaking up: killer whales (Orcinus orca) increase their call amplitude in response to vessel noise. J. Acoust. Soc. Am. 125, EL27–EL32. doi: 10.1121/1.3040028
Holt, M. M., Tennessen, J. B., Ward, E. J., Hanson, B. E., Emmons, C. K., Giles, D. A., et al. (2021). Effects of vessel distance on sex on the behavior of Endangered killer whales. Front. Mar. Sci.:582182. doi: 10.3389/fmars.2020.582182
International Maritime Organization [IMO] (2014). Guidelines for The Reduction of Underwater Noise from Commercial Shipping to Address Adverse Impacts on Marine Life. The Marine Environment Protection Committee, MEPC. 1/Circ.833. London: IMO.
Joy, R., Tollit, D., Wood, J., MacGillivray, A., Li, Z., Trounce, K., et al. (2019). Potential benefits of vessel slowdowns on endangered southern resident killer whales. Front. Mar. Sci. 6:344. doi: 10.3389/fmars.2019.00344
Klinck, H., Nieukirk, S. L., Mellinger, D. K., Klinck, K., Matsumoto, H., and Dziak, R. P. (2012). Seasonal presence of cetaceans and ambient noise levels in polar waters of the North Atlantic. J. Acoust. Soc. Am. 132, EL176–EL181.
Krahn, M. M., Ford, M. J., Perrin, W. F., Wade, P. R., Angliss, R. P., Hanson, M. B., et al. (2004). 2004 Status review of southern resident killer whales (Orcinus orca) under the Endangered Species Act. Technical Memo 2004, NMFS-NWFSC-62. Seattle, WA: U.S. Dept. Commerce, NOAA.
Lacy, R. C., Williams, R., Ashe, E., Balcomb, K. C. III, Brent, L. J. N., Clark, C. W., et al. (2017). Evaluating anthropogenic threats to endangered killer whales to inform effective recovery plans. Sci. Rep. 7:14119.
Laist, D. W., Knowlton, A. R., and Pendleton, D. (2014). Effectiveness of mandatory vessel speed limits for protecting North Atlantic right whales. Endanger. Species Res. 23, 133–147. doi: 10.3354/esr00586
Lawson, P. W. (1993). Cycles in ocean productivity, trends in habitat quality, and restoration of salmon runs in Oregon. Fisheries 18, 6–10. doi: 10.1577/1548-8446(1993)018<0006:ciopti>2.0.co;2
Lusseau, D., Bain, D. E., Williams, R., and Smith, J. C. (2009). Vessel traffic disrupts the foraging behavior of southern resi- dent killer whales Orcinus orca. Endang. Species. Res. 6, 211–221. doi: 10.3354/esr00154
Ma, B. B., Nystuen, J. A., and Lien, R.-C. (2005). Prediction of underwater sound levels from rain and wind. J. Acoust. Soci. Am. 117, 3555–3565. doi: 10.1121/1.1910283
MacGillivray, A., Li, Z., and Yurk, H. (2017). Modelling of Cumulative Vessel Noise for Haro Strait Slowdown Trial: Phase 1: Pre-trial Interim Report. Document Number 01443. Version 1.0. Tokyo: JASCO.
MacGillivray, A. O., Li, Z., Hannay, D. E., Trounce, K. B., and Robinson, O. (2019). Slowing deep-sea commercial vessels reduces underwater radiated noise. J. Acoust. Soc. Am. 146, 340–351. doi: 10.1121/1.5116140
Matthews, M.-N. R., Alavizadeh, Z., Hannay, D. E., Horwich, L., and Frouin-Mouy, H. (2018). Assessment of Vessel Noise within the Southern Resident Killer Whale Critical Habitat: Final Report. Document number 01618, Version 2.1. Canada: Transport Canada/Government of Canada.
McGillivary, P. A., Schwehr, K. D., and Fall, K. (2009). “Enhancing AIS to improve whale-ship collision avoidance and maritime security,” in Proceedings of the OCEANS 2009, MTS/IEEE Biloxi - Marine Technology for Our Future: Global and Local Challenges, Biloxi, MS, 1–8.
Medwin, H., Nystuen, J. A., Jacobus, P. W., Ostwald, L. H., and Snyder, D. E. (1992). The anatomy of underwater rain noise. J. Acoust. Soc. Am. 92, 1613–1623. doi: 10.1121/1.403902
Merchant, N. D., Fristrup, K. M., Johnson, M. P., Tyack, P. L., Witt, M. J., Blondel, P., et al. (2015). Measuring acoustic habitats. Methods Ecol. Evol. 6, 257–265. doi: 10.1111/2041-210X.12330
Merchant, N. D., Witt, M. J., Blondel, P., Godley, B. J., and Smith, G. H. (2012). Assessing sound exposure from shipping in coastal waters using a single hydrophone and Automatic Identification System (AIS) data. Mar. Poll. Bull. 64, 132–1329. doi: 10.1016/j.marpolbul.2012.005.004
Mouy, X., Wladichuk, J. L., and Austin, M. E. (2020). Modelling Acoustic Detection Ranges of Resident Killer Whales. Document 02241, Version 1.0. Ottawa: Fisheries and Oceans Canada.
National Oceanic and Atmospheric Administration [NOAA] (2005). Endangered and Threatened Wildlife and Plants: Endangered Status for Southern Resident Killer Whales. Department of Commerce. Rules and Regulations. 50 CFR Part 224. Washington, DC: NOAA.
Nelson, B. W., Shelton, A. O., Anderson, J. H., Ford, M. J., and Ward, E. J. (2019). Ecological implications of changing hatchery practises in Chinook salmon in the Salish Sea. Ecosphere 10:e02922.
Nichol, L. M., and Shackleton, D. M. (1996). Seasonal movements and foraging behaviour of northern resident killer whales (Orcinus orca) in relation to the inshore distribution of salmon (Oncorhynchus spp.) in British Columbia. Can. J. Zool. 74, 983–991. doi: 10.1139/z96-111
Noren, D., Holt, M. M., Dunkin, R. C., and Williams, T. M. (2017). Echolocation is cheap for some mammals: dolphins conserve oxygen while producing high-intensity clicks. J. Exp. Mar. Bio. Ecol. 495:1002. doi: 10.1016/j.jembe.2017.07.002
Noren, D. P., Holt, M. M., Dunkin, R. C., and Williams, T. M. (2013). The metabolic cost of communicative sound production in bottlenose dolphins (Tursiops truncatus). J. Exp. Biol. 216, 1624–1629. doi: 10.1242/jeb.083212
Noren, D. P., Holt, M. M., Dunkin, R. C., Thometz, N. M., and Williams, T. M. (2016). Comparative and cumulative energetic costs of odontocete responses to anthropogenic disturbance. Proc. Meetings on Acou. 27:040008 doi: 10.1121/2.0000299
Noren, D. P., Johnson, A. H., Rehder, D., and Larson, A. (2009). Close approaches by vessels elicit surface active behaviors by southern resident killer whales. Endang. Species Res. 8, 179–192. doi: 10.3354/esr00205
Nystuen, J. A. (1996). Acoustic rainfall analysis: rainfall drop size distribution using the underwater sound field. J. Atmosph. Ocean. Tech. 13, 74–84. doi: 10.1175/1520-0426(1996)013<0074:arards>2.0.co;2
Nystuen, J. A., and Ma, B. (2002). “Using ambient sound to passively monitor sea surface processes,” in Proceedings of the Sixth Pan Ocean Remote Sensing Conference (PORSEC), eds B. P. Pasaribu, R. Kaswadji, I. W. Nurjava, and J. L. Gaol (New York, NY: PORSEC Association), 9–14.
Olson, J. K., Wood, J., Osborne, R. W., Barrett-Lennard, L., and Larson, S. (2018). Sightings of southern resident killer whales in the Salish Sea 1976-2014: the importance of a long-term opportunistic dataset. Endang. Species. Res. 37, 105–118. doi: 10.3354/esr00918
Pensieri, S., Bozzano, R., Nystuen, J. A., Anagnostou, E. N., Anagnostou, M. N., and Bechini, R. (2015). Underwater acoustic measurements to estimate wind and rainfall in the Mediterranean Sea. Adv. Meteorol. 2015:612512.
Peterson, W. T., and Schwing, F. B. (2003). A new climate regime in northeast Pacific ecosystems. Geophys. Res. Lett. 30:4.
Pirotta, V., Grech, A., Jonsen, I. D., Laurance, W. F., and Harcourt, R. G. (2019). Consequences of global shipping traffic for marine giants. Front. Ecol. Environ. 17, 39–47. doi: 10.1002/fee.1987
Raverty, S., St. Leger, J., Noren, D. P., Burek-Huntington, K., Rotstein, D. S., Gulland, F. M. D., et al. (2020). Pathology findings and correlations with body condition index in stranded killer whales (Orcinus orca) in the northeastern Pacific and Hawaii from 2004 to 2013. PLoS One 15:e0242505. doi: 10.1371/journal.pone.0242505
Richardson, W. J., Greene, C. R. Jr., Malme, C. I., and Thomson, D. (1995). Marine Mammals and Noise. San Diego, CA: Academic Press.
Robards, M. D., Silber, G. K., Adams, J. D., Arroyo, J., Lorenzini, D., Schwehr, K., et al. (2016). Conservation science and policy applications of the marine vessel automatic identification system (AIS)–a review. Bull. Mar. Sci. 92, 75–103. doi: 10.5343/bms.2015.1034
Ruckelshaus, M. H., Levin, P., Johnson, J. B., and Kareiva, P. M. (2002). The Pacific salmon wars: what science brings to the challenge of recovering species. Ann. Rev. Ecol. System. 33, 665–706. doi: 10.1146/annurev.ecolsys.33.010802.150504
Ruff, C. P., Anderson, J. H., Kemp, I. M., Kendall, N. W., and Mchugh, A. (2017). Salish Sea Chinook salmon exhibit weaker coherence in early marine survival trends than coastal populations. Fish. Ocean. 26, 625–637. doi: 10.1111/fog.12222
Shields, M. W., Lindell, J., and Woodruff, J. (2018). Declining spring usage of core habitat by endangered fish-eating killer whales reflects decreased availability of their primary prey. Pac. Cons. Biol. 24, 189–193. doi: 10.1071/PC17041
Silber, G. K., and Bettridge, S. (2010). Vessel Operations in Right Whale Protection Areas in 2009. NOAA Technical Memorandum NMFS-OPR-44. Silver Spring, MD: NOAA.
Thomson, D. J. M., and Barclay, D. R. (2020). Real-time observations of the impact of COVID-19 on underwater noise. J. Acoust. Soc. Am. 147:3390. doi: 10.1121/10.0001271
Towers, J. R., Ford, J. K. B., and Ellis, G. M. (2012). Digital photo-identification dataset management and analysis: testing protocols using a commercially available application. Can. Tech. Rep. Fish. Aquat. Sci. 2978, 6–16.
Transport Canada (2020). Minister Garneau Announces Extended Measures for Cruise Ships and Pleasure Craft in Canada. Ottawa, ON: Transport Canada.
Tyack, P. (2008). Implications for marine mammals of large-scale changes in the marine acoustic environment. J. Mammal. 89, 549–558. doi: 10.1644/07-mamm-s-307r.1
Vagle, S. (2020). Evaluation of the efficacy of the Juan de Fuca lateral displacement trial and Swiftsure Bank plus Swanson Channel interim sanctuary zones, 2019. Can. Tech. Rep. Hydrogr. Ocean Sci. 332, 6–60.
Vagle, S., Large, W. G., and Farmer, D. M. (1990). An evaluation of the WOTAN technique of inferring oceanic winds from underwater ambient sound. J. Atmosph. Ocean. Tech. 7, 576–595. doi: 10.1175/1520-0426(1990)007<0576:aeotwt>2.0.co;2
Vagle, S., and Neves, M. (2019). Evaluation of the effects on underwater noise levels from shifting vessel traffic away from Southern Resident Killer Whale foraging areas in the Strait of Juan de Fuca in 2018. Can. Tech. Rep. Hydrogr. Ocean Sci. 329, 6–64.
Vanderlaan, A. S. M., and Taggart, C. T. (2007). Vessel collisions with whales: the probability of lethal injury based on vessel speed. Mar. Mamm. Sci. 23, 144–156. doi: 10.1111/j.1748-7692.2006.00098.x
Veirs, S., Veirs, V., Williams, R., Jasny, M., and Wood, J. (2017). A key to quieter seas: half of ship noise comes from 15% of the fleet. PeerJ 6:e26525v1.
Veirs, S., Veirs, V., and Wood, J. (2016). Ship noise in an urban estuary extends to frequencies used for echolocation by endangered killer whales. PeerJ 3:e955v3. doi: 10.7287/peerj.preprints.955v3
Veirs, V., and Veirs, S. (2006). Average Levels and Power Spectra of Ambient Sound in the Habitat of Southern Resident Orcas. Washington, DC: NOAA/NMFS/NWFSC.
Waples, R. S., Teel, D. J., Myers, J. M., and Marshall, A. R. (2004). Life-history divergence in Chinook Salmon: historic contingency and parallel evolution. Evolution 58, 386–403. doi: 10.1111/j.0014-3820.2004.tb01654.x
Ward, E. J., Anderson, J. H., Beechie, T. J., Pess, G. R., and Ford, M. J. (2015). Increasing hydroplogic variability threatens depleted anadromous fish populations. Glob. Change Biol. 21, 2500–2509. doi: 10.1111/gcb.12847
Warner, G. A., Wood, J. D., MacGillivray, A. O., Li, Z., Frouin-Mouy, H., Tollit, D., et al. (2020). “Chapter 1. Hydroacoustic monitoring,” in Proceedings of the ECHO Program 2019 Voluntary Vessel Slowdown Hydroacoustic Studies: Final Report (Washington, DC: NOAA).
Weilgart, L. (2007). The impacts of anthropogenic ocean noise on cetaceans and implications for management. Can. J. Zool. 85, 1091–1116. doi: 10.1139/z07-101
Wiley, D., Hatch, L., Thompson, M., Schwehr, K., and MacDonald, C. (2013). Marine sanctuaries and marine planning: protecting endangered marine life. Proc. Mar. Saf. Secur. Counc. 70, 10–15.
Williams, R., Bain, D. E., Smith, J. C., and Lusseau, D. (2009). Effects of vessels on behavior patterns of individual Southern Resident killer whales Orcinus orca. Endang. Species Res. 6, 199–209. doi: 10.3354/esr00150
Williams, R., Erbe, C., Ashe, E., Beerman, A., and Smith, J. (2014). Severity of killer whale behavioral responses to ship noise: a dose–response study. Mar. Poll. Bull. 79, 254–260. doi: 10.1016/j.marpolbul.2013.12.004
Keywords: Salish Sea, southern resident killer whales, critical habitat, vessel exclusion, slowdown, mitigation actions, soundscape monitoring, passive acoustics
Citation: Burnham RE, Vagle S, O’Neill C and Trounce K (2021) The Efficacy of Management Measures to Reduce Vessel Noise in Critical Habitat of Southern Resident Killer Whales in the Salish Sea. Front. Mar. Sci. 8:664691. doi: 10.3389/fmars.2021.664691
Received: 05 February 2021; Accepted: 08 July 2021;
Published: 30 July 2021.
Edited by:
Kerri D. Seger, Applied Ocean Sciences (AOS), United StatesReviewed by:
Brad Hanson, National Marine Fisheries Service (NOAA), United StatesCopyright © 2021 Burnham, Vagle, O’Neill and Trounce. This is an open-access article distributed under the terms of the Creative Commons Attribution License (CC BY). The use, distribution or reproduction in other forums is permitted, provided the original author(s) and the copyright owner(s) are credited and that the original publication in this journal is cited, in accordance with accepted academic practice. No use, distribution or reproduction is permitted which does not comply with these terms.
*Correspondence: Rianna E. Burnham, cmlhbm5hLmJ1cm5oYW1AZGZvLW1wby5nYy5jYQ==
Disclaimer: All claims expressed in this article are solely those of the authors and do not necessarily represent those of their affiliated organizations, or those of the publisher, the editors and the reviewers. Any product that may be evaluated in this article or claim that may be made by its manufacturer is not guaranteed or endorsed by the publisher.
Research integrity at Frontiers
Learn more about the work of our research integrity team to safeguard the quality of each article we publish.