 You-You Hao1
 Zhuo-Yi Zhu1,2*Fu-Tao Fang1Tihana Novak3
 Milan Čanković3Enis Hrustić3
 Zrinka Ljubešić4Ming Li1
 Jin-Zhou Du1
 Rui-Feng Zhang2
 Blaženka Gašparović3
- 1State Key Laboratory of Estuarine and Coastal Research, East China Normal University, Shanghai, China
- 2School of Oceanography, Shanghai Jiao Tong University, Shanghai, China
- 3Division for Marine and Environmental Research, Ruder Bošković Institute, Zagreb, Croatia
- 4Department of Biology, Faculty of Science, University of Zagreb, Zagreb, Croatia
Estuaries modify the concentration and composition of riverine nutrients and organic matter (OM), which eventually determine the riverine flux effect to coasts. Nutrients, organic carbon (OC), pigments, and amino acids (AAs) from the samples collected in the eutrophic Wenchang River Estuary (WRE) in China and the oligotrophic Krka River Estuary (KRE) in Croatia were analyzed in order to have a better understanding of how estuaries regulate terrestrial materials. We found a clear increase of dissolved inorganic nitrogen (DIN) concentration and its subsequent decrease due to the removal of DIN (over 100 μM) in the WRE, whereas DIN showed minor variation lengthwise in the KRE, i.e., with the salinity changes, ranging between 1.0 and 5.8 μM. The elevated algae-derived OC, dissolved organic nitrogen, and particulate AAs nitrogen suggest that the OM assimilation may explain approximately one-third of the DIN removal in the WRE, whereas in the oligotrophic KRE, such inorganic to organic transformation is not likely to be significant. Due to the prominent estuarine nitrogen removal/assimilation process, DIN/dissolved inorganic phosphorus (DIP) ratio was as high as 425 in the upper WRE under strong riverine influence, but it declined to as low as 5.4 at the mouth of WRE, that is even lower than DIN/DIP ratio at the mouth of oligotrophic KRE (12). When compared with other rivers worldwide, the Wenchang River showed high nutrients and organic carbon yields. Given the contrasting estuarine process (e.g., DIN removal) between the KRE and the WRE, apparent high nutrient yield from eutrophic rivers should be viewed with caution in ocean studies as the final impact to coastal zone could be similar to the oligotrophic rivers like the KRE.
Introduction
Estuarine systems serve as active transition zones connecting the rivers and the seas, and are among the most active interfaces in the biosphere and the geosphere, playing important roles in biogeochemical cycles under the framework of land-ocean interaction (Jickells, 1998; Durr et al., 2011). With the rapid development of the economy and increasing population, many rivers and estuaries are exposed to increases in eutrophication pressure (Hilton et al., 2006). Although fluxes of medium and small rivers are much slower when compared with the world largest rivers, they exist in large numbers and their influences had been greatly underestimated in previous global matter budgets (Milliman and Syvitski, 1991). Further, given the highly spatial and temporal heterogeneity of medium and small rivers, and lack of routine monitoring systems, their roles in terrestrial material export remain of interest, and they are important questions to be answered (Hilton et al., 2008; Wheatcroft et al., 2010; Wu et al., 2017).
Medium and small rivers are usually characterized by limited water capacity, short water residence time, and distinct pulse-export feature (West et al., 2011). In addition, medium and small rivers have relatively limited capacities to accommodate terrigenous organic matter (OM), and hence, they tend to be more affected by anthropogenic activities in comparison with large rivers with much larger catchments and water capacities. Different intensities of basin land use result in contrasting riverine nutrient loads. Therefore, nutrient concentrations between eutrophic and oligotrophic rivers can differ by one or two orders of magnitude (Paerl et al., 2007; Holmes et al., 2012; Nguyen et al., 2019; Chupakov et al., 2020; Zhang et al., 2021). Estuarine water dwells due to tide impact, whereas for estuaries with lagoon or lagoon-like structures, the estuarine water residence time is further extended. Terrestrial materials hence undergo a longer time of alternation and/or cycling process within the estuaries, likely enhancing the estuarine filtering or alternation effect (Durr et al., 2011). In turn, the estuarine processing of terrestrial materials strongly modifies and determines the net river flux, affecting its amount and impact on coastal seas (Unger et al., 2013). Eutrophic rivers may even have a counteracting process in the estuaries that regulates the final output nutrient concentrations and compositions to the sea. Therefore, it is hard to draw a simple conclusion that oligotrophic rivers have a smaller impact on coastal zone relative to eutrophic rivers.
Removal of estuarine nutrients and potential corresponding assimilation of OM result in the OM composition changes in the estuary. Biomarker approaches [amino acids (AAs)] are important proxies for OM origin, and therefore they are powerful tools in riverine and estuarine OM studies (Hedges et al., 1994; Duan and Bianchi, 2007; Unger et al., 2013). Selective removal or accumulation of certain AAs and changes in their compositions shed a light on OM assimilation and/or OM degradation status (Dauwe and Middelburg, 1998). Although, the source effect from diatom detritus, which is especially enriched in certain AAs, may cause a bias in such an approach. As bacteria play a significant role in OM alternation and degradation, the D-forms of AA (D-AAs), which are basically derived from bacteria and bacteria-related detritus, are important indicators of bacterial contribution to OM alternation (Kawasaki and Benner, 2006). Chlorophyll a (Chla) is a universally present pigment in phytoplankton, and therefore it frequently serves to estimate algal particulate organic carbon (POC) by using the Chla-POC ratio (Abril et al., 2002). In addition, different phytoplankton groups have certain diagenetic carotenoids. Based on this, a factor analysis and a steepest descent algorithm to find the best fit to the pigment data matrix, for example, CHEMTAX, provides an estimate on phytoplankton community structure (Mackey et al., 1996).
On the east Hainan Island, China, the Wenchang River is a typical eutrophic river with a lagoon-like structure (the Bamen Bay) in the lower reaches of its estuary (Figure 1A). The riverine input, groundwater discharges, and aquaculture effluents are key sources for the observed high estuarine nutrient concentrations, with extremely high DIN concentrations and DIN/ dissolved inorganic phosphorus (DIP) ratios, which are higher than the Redfield ratio (Liu et al., 2011). Due to the shallow depth (usually 3–5 m) and the wide presence of muddy mangroves wetland, total suspended matter (TSM) in the estuary (Bamen Bay) is high (10 s of mg/L), indicating strong surface-bottom interaction. Soil-derived materials, freshwater, and marine planktons are the major sources of particulate OM in the Wenchang River Estuary (WRE) (Unger et al., 2013). Flood events are found to be the major factor in exporting particulate OM into the adjacent sea (Herbeck et al., 2011).
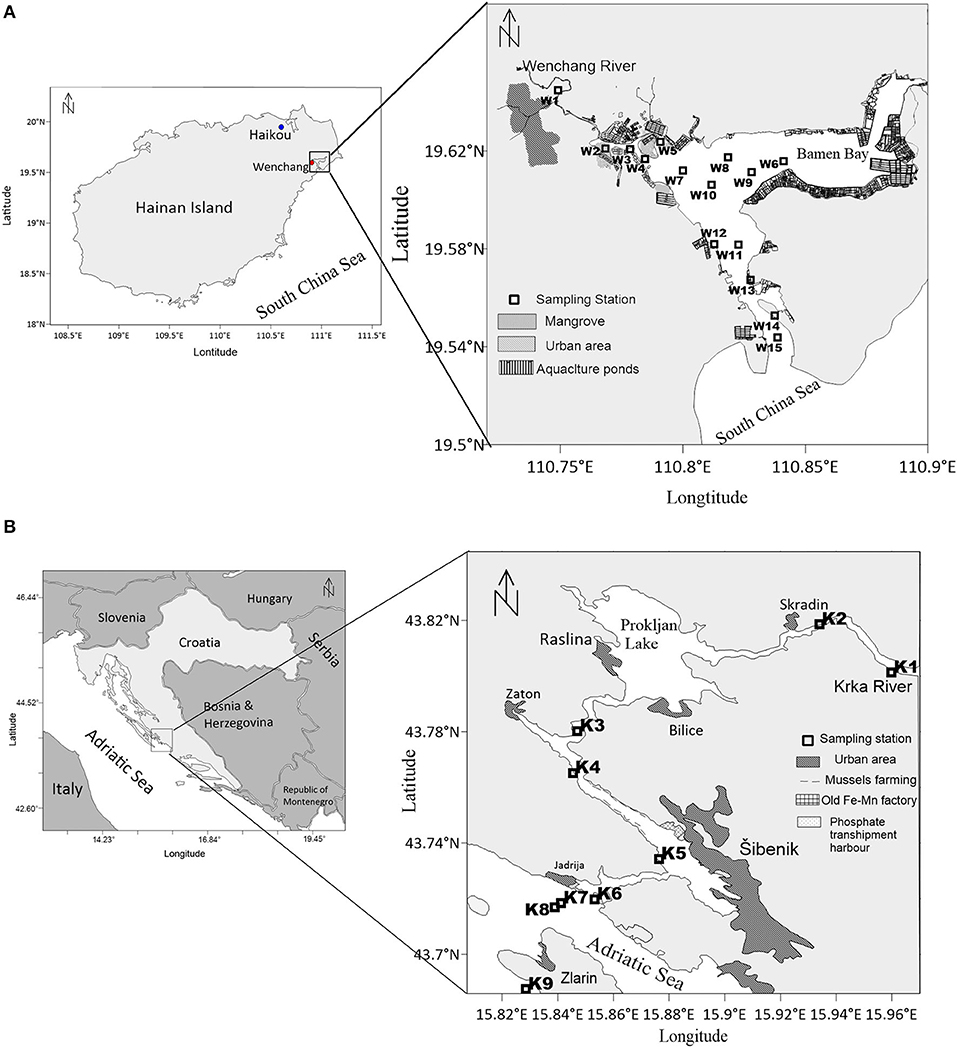
Figure 1. Study areas and sampling stations in (A) the Wenchang River Estuary (WRE) and (B) the Krka River Estuary (KRE).
The Krka River Estuary (KRE) is an oligotrophic estuary with lagoon-like geomorphology in the lower reaches (Figure 1B). Stratification throughout the year is the key feature (Zutić and Legović, 1987), in which the permanent halocline has been recognized as a layer of highest microbiological activity and accumulation of OM (Zutić and Legović, 1987; Fuks et al., 1991). As a karstic estuary, the nutrients and carbon in the KRE have a strong sub-ground contribution (Liu et al., 2019b). POC concentration in the KRE is very low (Vrana Špoljarić et al., 2021), largely due to the limited in situ primary production (Cauwet, 1991), except for the summer season (Cindrić et al., 2015). However, there are some anthropogenic activities in the lower reaches of the KRE, including urbanization, aquaculture (mussels farming), and shipment (Padan et al., 2020). Despite a moderate anthropogenic influence, nutrients and dissolved organic carbon (DOC) concentrations in the KRE remain at very low levels for the past decades (Cauwet, 1991; Sempéré and Cauwet, 1995; Cetinić et al., 2006; Cindrić et al., 2015; Liu et al., 2019b).
Although there have been studies focusing on the nutrient transportation and the biogeochemical processes in both Wenchang and Krka estuaries, a comparative study between such different estuaries was lacking. These two estuaries are notably different in regard to climate and eutrophication levels, but both estuaries have lagoon-like structures, favoring the dwelling of brackish estuarine water. A comparative study between these contrasting estuaries would hence improve our understanding of the estuarine nutrient dynamics as well as the alteration of OM and their potential impacts on the coastal seas. Results obtained from such a comparative study could advance our understanding of the medium and small rivers/estuaries systems (Eyre and Balls, 1999).
Under this background, we sought to address the following questions: what are the nutrient changes within the KRE and the WRE? and what are the corresponding estuarine OM responses between these contrasting, oligotrophic vs. eutrophic, estuaries? To address these, two field investigations were conducted in the Wenchang and Krka estuaries. Nutrients, bulk organic carbon, and biomarkers (AAs and pigments) were analyzed with emphasis given to the surface layer, where terrestrial nutrients changes are prominent. The removal or addition of terrestrial nutrients in the estuaries was first clarified by comparing nutrient concentration changes along the river channel to downstream estuary with increasing salinity. Next, the various OM composition features and potential responses to respective nutrient modifications were compared between the two contrasting estuaries. At last, the nutrient fluxes and budgets of KRE and WRE were estimated and compared to those of rivers and estuaries of different sizes worldwide.
Materials and Methods
Study Areas
The Wenchang River is situated on the east Hainan Island, China, in the northern part of the South China Sea (Figure 1A). The catchment basin is situated within agricultural land and urban areas, having about 380 km2, with a mean runoff of 9.1 m3s−1 (Liu et al., 2011). Based on the 50-year data of monthly discharge record for the east Hainan Island rivers, May is the month when daily discharge equals around 60% of its annual mean (Yang et al., 2013). The WRE has a lagoon-like structure, which is called Bamen Bay (Figure 1A). The Bamen Bay (stations W1–W10) has a water depth of 1–3 m (mostly ~2 m). At stations W11 to W15, the water depth is 3–8 m. The WRE is a tidal-controlled estuary, with a tidal range of approximately 1.5 m (spring tide) and 0.5 m (neap tide). The lagoon, together with tide, significantly increases the river water residence time in the WRE, which is around 1 week (Krumme et al., 2012). The basin is influenced by a tropical monsoon climate with the dry season from November to April and the wet season from May to October. Mangrove that used to be the dominant landform of the WRE, shrank so far over 70%, mainly due to aquaculture activities in recent decades (Thomsen et al., 2020). The aquaculture ponds were built mainly for shrimps. Nutrients in the ponds showed a large variability, with nitrate and ammonium ranging from 0.01 to 31.2 μM and 0.32 to 157 μM, respectively (Liu et al., 2011). The untreated effluents from aquaculture ponds are directly exported into the Bamen Bay every few days (Krumme et al., 2012). In the adjacent coastal area, there is a retreat of seagrass beds and deterioration of coral reefs (Herbeck et al., 2011; Krumme et al., 2012; Zhang et al., 2013). Due to strong anthropogenic activities, nutrient and OM concentrations within the WRE are high (Herbeck et al., 2011; Liu et al., 2011).
The Krka River is located on the eastern coast of the Adriatic Sea (Croatia), where it forms a 23.5 km long salt-wedge estuary (Figure 1B). The KRE is relatively narrow, except for two wider parts being the Prokljan Lake and the area of City of Šibenik (Figure 1B). The depth gradually increases from 1 to 2 m below the waterfalls at the head of the estuary to 43 m at the mouth of the estuary. Karst landform is the key feature of the Krka River basin. The mean runoff varies from 40 to 60 m3/s (Bonacci et al., 2006). During our field survey, the Krka River flow was 60% of the annual mean (Liu et al., 2019b). Tide effect is very limited, with tidal height <0.5 m, which results in permanent stratification (Legović et al., 1994). The fresh water above the brackish layer has a residence time of 2 to 3 days (Liu et al., 2019b), shorter than that for WRE (1 week). With rocky riverbank, water in the KRE is much cleaner (low in TSM) relative to the turbid WRE. Many submerged or short-lived springs exist along the Krka River catchment, playing an important role in the transport of biogenic elements into the KRE (Cukrov et al., 2008). Upper estuary is the aquaculture area for shellfish farming. In the KRE, nitrate is prevailingly from natural sources, while phosphorus is mainly of anthropogenic origin (Legović et al., 1994). The upper estuary is characterized by low nutrient concentrations and an extremely low input of terrigenous material from the Krka River (Legović et al., 1994), while the lower part is relatively rich in nutrients (Grẑetić et al., 1991; Vidjak et al., 2012).
Field Sampling
The field investigations in the KRE and the WRE were conducted during September 4–10, 2014 and May 8–11, 2015, respectively. There was no rainfall recorded 14 days before and during samplings. The sampling stations are shown in Figure 1, covering the salinity ranges from 0 to 37.5 for the KRE and 0 to 33.3 for the WRE. Precleaned buckets were used to collect surface water samples from small boats. Conductivity (salinity), temperature, and dissolved oxygen (DO) were measured using a HQ40D multimeter probe (Hach Lange, Germany). The probe for DO was calibrated before and after use. In addition to surface samples, deep samples were also collected at some stations, using a cleaned 5L Niskin sampler. Water samples were stored immediately in a cooled dark box and brought back to the land laboratory within a few hours. Nutrient samples were filtered via acid-cleaned acetate cellulose filters (0.45 μm, Millipore) (the WRE) or not filtered (the KRE). Samples for DOC were filtered through 0.45 μm Millipore nylon membrane (one time use only) with disposable syringes at WRE and through precombusted 0.7 μm glass fiber (GF/F) membrane (Whatman, United Kingdom) at KRE. Duplicate nutrient and DOC samples from selected stations were collected to check the nutrient and DOC concentrations following respective filtration strategy. As for POC, particulate AAs and pigments, suspended particles in the water samples were concentrated onto precombusted (450°C, 5 h) filter membranes (Whatman GF/F, 0.7 μm). All samples were kept frozen at −20°C until laboratory measurements. Samples were processed under gentle vacuum to avoid cell breakages during filtration. All water samples were filtered immediately or within a few hours after the collection. Dissolved organic nitrogen (DON) and TSM samples were missing for a few stations in the KRE, however, the water on these stations was of the same color and transparency as in the area from K6 to K9 stations, indicating that TSM changes among these sites should be minor.
In addition, the higher plant tissues (mainly leaves) were also collected. Such samples were collected outside the lab in Shanghai, but species that are commonly distributed in temperate and subtropical regions are selected, including tree (Willow), shrub (Papaya Begonia), emergent aquatic plant (Oriental cattail), and bamboo. The plant leaves were collected by cutting via clean scissors. Leaves were immediately brought to the lab and processed for pigment determination via high performance liquid chromatography (HPLC).
Laboratory Measurements
Nutrients were determined spectrophotometrically by using a continuous flow analyzer (Skalar SANplus). Total dissolved nitrogen (TDN) was determined after high temperature and high-pressure digestion of potassium persulfate (Grasshoff et al., 1999). The concentration of dissolved inorganic nitrogen is the sum of , , and . The concentration of DON was calculated by subtraction of DIN from TDN. The detection limits and reproducibility for nutrient analyses were: 0.05 and 0.025 μmol L−1; 0.01 and 0.01 μmol L−1; 0.1 and 0.098 μmol L−1; and DIP 0.03 and 0.03 μmol L−1. Measurement of duplicate samples indicated that differences in nutrient concentrations with or without filtration for the KRE were within 10%. DOC was determined by a total organic carbon (TOC) analyzer (TOC-V Shimadzu) using a high temperature catalytic oxidation method, with relative deviation <2%. DOC concentrations determined by two filtration protocols (0.45 μm nylon filters or 0.7 μm GF/F filters) also gave comparable results (within 10% difference).
POC and particulate nitrogen (PN) samples from the WRE were measured by an elemental analyzer (Elementar, Vario ELIII), after the inorganic carbon being removed by reaction with HCl vapor. The detection limit of carbon is 7.5 × 10⁻⁶ g, with a precision better than 6%, based on repeated determinations. POC and PN samples from the KRE were measured using a Shimadzu TOC-VCPH carbon analyzer plus solid sample module SSM-5000A. The average filter blank, including the instrument blank, corresponded to 5 μg C/L. The reproducibility for the glucose standard was 3%. For total hydrolysable particulate amino acids (THPAA), we followed the methods by Fitznar et al. (1999) with slight modification (Zhu et al., 2014). Briefly, the filters were freeze-dried (for particulate samples) first. Samples were hydrolyzed with HCl (9M) at 110°C. AA enantiomers were measured by a HPLC system (1200 series, Agilent, USA) after precolumn derivatization with o-Phthaldialdehyde (OPA) and N-Isobutyryl-L/D-cysteine (IBLC/IBDC). The column was a Phenomenex Hyperclone column (BDS C18, 250 × 4 mm, 5 μm) with a corresponding precolumn to separate and quantify alanine (Ala), arginine (Arg), isoleucine (Ile), leucine (Leu), lysine (Lys), methionine (Met), phenylalanine (Phe), serine (Ser), threonine (Thr), tyrosine (Tyr), valine (Val), aspartic acid, asparagine, glutamic acid, glutamine, γ- aminobutyric acid (GABA), and glycine (Gly). During hydrolyzation, asparagine is transformed into aspartic acid and glutamine is transformed into glutamic acid. In this work, Asx stands for the combination of aspartic acid and asparagine, and Glx for glutamic acid and glutamine. AAs enantiomers (L- and D- form) were measured when possible. Authentic AA standards (enantiomers) were purchased from Sigma-Aldrich and Merck. The calibration of racemization during hydrolysis was performed following Kaiser and Benner (2005). The detection limit of hydrolyzed AAs was 40 nM (in total) and the precisions were better than 8%.
The pigments analyzed from the samples of higher plants are reported herein, while the pigment data in the samples from the WRE and the KRE were already published (Vrana Špoljarić et al., 2021). Accordingly, the Chla data and diagnostic pigments, for both estuaries, were cited from Vrana Špoljarić et al. (2021). Also note that some data of the KRE (for DIN; Liu et al., 2019b) and the WRE (for nutrients and POC; Vrana Špoljarić et al., 2021) are published in previous literature, with different foci compared with the current study.
Data Processing and Calculations
The program CHEMTAX was used to estimate the phytoplankton community structure (Mackey et al., 1996). Rather than using simple ratios of marker pigments, CHEMTAX uses a steepest-descent algorithm to fit a matrix of expected pigment ratios for several taxa, to one consisting of the actual pigment ratios from unknown samples. For the WRE, the pigments used for analysis were peridinin, 19′-butanoyloxyfucoxanthin, fucoxanthin, 19′-hexanoyloxyfucoxanthin, prasinoxanthin, violaxathin, alloxanthin, lutein, zeaxanthin, chlorophyll b and Chla. For the KRE, additional pigments were analyzed including diatoxanthin, divinyl chlorophyll b, and divinyl Chla. The input pigment ratios were chosen from published work obtained from identical or similar regions when possible. For the WRE, the ratio was cited from Zhu et al. (2015). For the KRE, the ratio was cited from Marty et al. (2008). The CHEMTAX was only applied to the surface samples.
In addition to μM unit, % was also calculated for POC, as POC (in mg/L) divided by TSM (in mg/L). The AA carbon yield (in %; further on termed PAA-C%) was the combination of all AA carbon concentrations (in μM) divided by corresponding POC (in μM). Similarly, the AA nitrogen yield (PAA-N%) was calculated as all AA nitrogen concentrations divided by corresponding PN. The degradation index (DI) is a proxy that is derived from AA data set first presented by Dauwe and Middelburg (1998). It was calculated by the following equation:
where vari, AVG vari, SD vari, and fac. coef.i are the mol %, mean, standard deviation, and factor score coefficient of AA i, respectively. Factor score coefficients were calculated using principal component analysis and were directly cited from the literature (Vandewiele et al., 2009). The index ranged from +1 for fresh phytoplankton/bacteria to −1.5 for highly degraded oxidized sediments.
For the river flux estimate, we used our data of e.g., nutrients and DOC at the freshwater station of each estuary (river end-member, S = 0) multiplied by the corresponding annual river discharge in 2015 for the Wenchang and 2014 for the Krka.
Results
Basic Hydrology, Chemistry, and Phytoplankton of the Wenchang River Estuary
For the WRE, the transition from dry to wet season occurs in May. During our investigation in May, surface salinity increased from 0 at the river end (Station W1) to 33.3 at the estuarine mouth (Station W15). The water temperature varied from 27.9 to 31.5°C (Figure 2A). In the near-bottom waters, temperature (28.1–30.2°C) and salinity (10.1–33.1) were similar to those of surface waters, indicating mixed state of the water column. To facilitate description and discussion, the WRE is divided into three sections based on the surface salinity, namely the Wenchang River (S = 0), the upper estuary (S <16.8), and the lower estuary (S > 16.8). Lower estuary includes the lagoon (Bamen Bay) and the estuarine mouth (Figure 2A). DO predominantly ranged between 4 and 6 mg/L, but in the upper estuary section, elevated DO concentrations were observed. The DO saturation (in %) in surface waters ranged between 130 and 234% in the upper estuary section and dropped to 39 and 119% in the lower estuary section (mean 91%) (Figure 2).
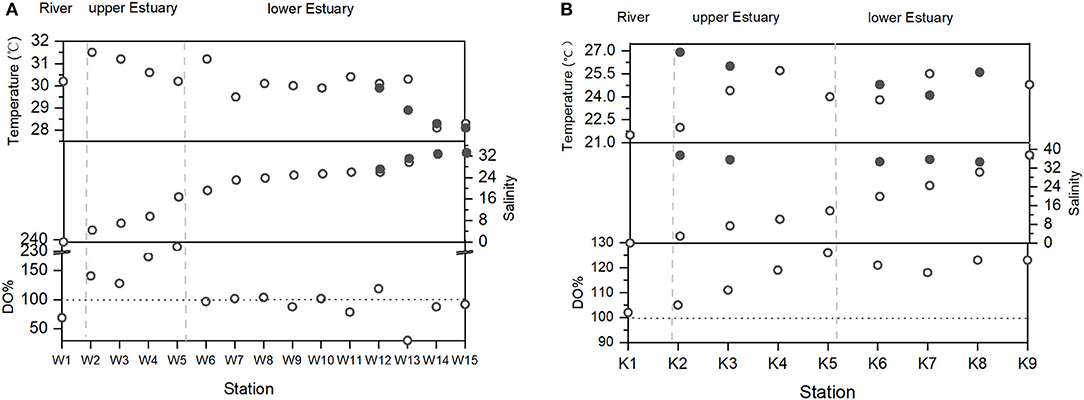
Figure 2. Variations of temperature, salinity, and DO in (A) the WRE and (B) the KRE. White circles: surface; black circles: bottom layers.
The DIN increased from 33 μM at the river water end-member to as high as 155 μM in the upper estuary (W1–W2), followed by a sharp decline (from W2 to W5), and remained ~15 μM in the lower estuary (Figure 3A). Ammonium was the main contributor to DIN (Table 1) in the estuary, which exhibited a clear peak in the upper estuary (W2), followed by a sharp drop from site W2 to W5(Figure 3A). Nitrate was ~30 μM in the river water, and it dropped to ~0.1 μM in the lower estuary (Figure 3A). There was an increasing trend of DON from W2 to W4 in the upper estuary, followed by a slight decrease in the lower estuary (Table 1). DIP increased from river water (0.1 μM) to the estuary (1.5 ± 0.8 μM in the lower estuary) (Table 1). The DIN/DIP ratio was extremely high (425) in the river, while a sharp decrease occurred in the estuary with an average DIN/DIP ratio of 7 in the lower estuary (Table 1), and the minimum DIN/DIP ratio was as low as 2 (W8). DOC in the whole WRE was 239 ± 62 μM. An inverted-U shaped pattern was found for the DOC distribution from the river to the estuary (Figure 4). The increase of DOC from the river to the upper estuary occurred in the salinity range from 0 to 16.8 (W1–W5), where the mangrove exists (Figure 1A). In the middle and the bottom water layers, DOC concentrations were lower (102–220 μM) compared to the corresponding surface DOC values (surface mean DOC concentration was 239 μM).
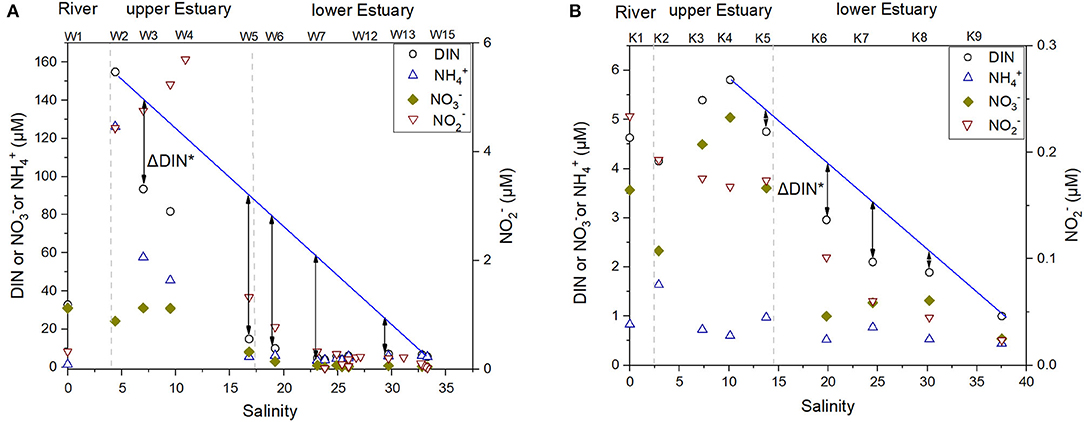
Figure 3. Dissolved inorganic nitrogen (DIN), ammonium, nitrate, and nitrite variation along salinity of the surface waters in (A) the WRE and (B) the KRE. Note the scales of the Y-axes for the two estuaries are different. The blue lines are the linear regression between highest DIN and marine end-member DIN. The differences between the measured values and values on blue lines, namely ΔDIN*, indicate the amount of DIN that is removed during respective estuarine transport after the presence of maximum DIN in the upper estuaries.
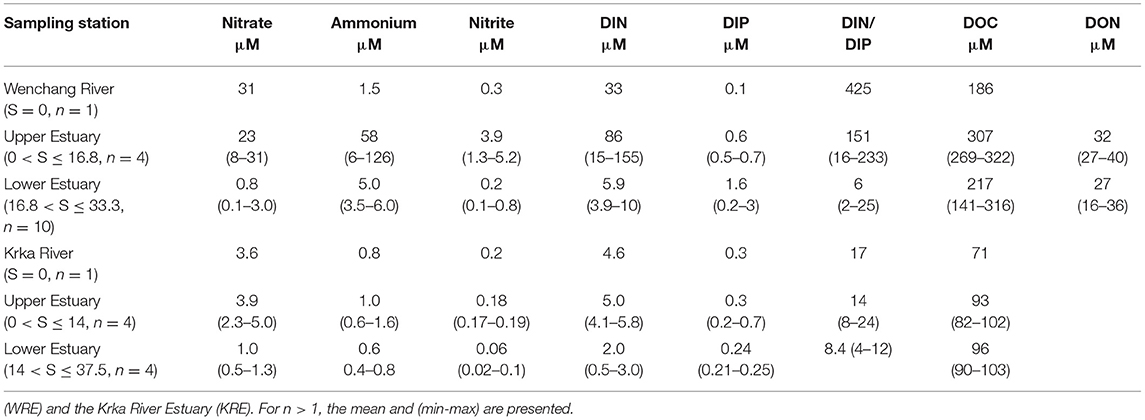
Table 1. Nutrients and dissolved organic matter (OM) in surface waters of the Wenchang River Estuary.
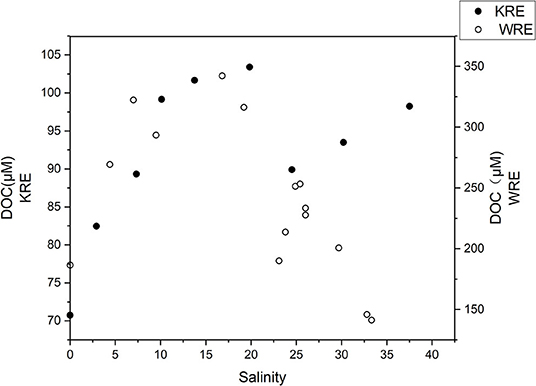
Figure 4. Dissolved organic carbon (DOC) variation vs. salinity of the surface waters in the WRE and the KRE. Note the y-axes of the two estuaries are on different scales.
With respect to particulate phase, TSM was as high as 64 mg/L in the lower estuary, with mean values of 43 ± 14 mg/L and 38 ± 14 mg/L for the upper and the lower estuary, respectively (Table 2). POC in the river water was low (49.4 μM), followed by a sharp increase at stations W2 to W5 in the upper estuary (281 to 447 μM). At the river end, POC% was ~12%, and the maximum was 18% (W2) in the upper estuary. POC% variation pattern was similar to that of POC (Figure 5A). The extremely high POC% occurred at stations W2 to W4 in the upper estuary, which were as high as 11% to 18% (Figure 5A), corresponding to the decrease of DIN (Figure 3A). Chla was very low in the river water (1.0 μg/L). Maximum Chla was found in the upper estuary (W2–W5; at which DIN was relatively low and POC relatively high), where Chla concentrations were all higher than 28 μg/L (up to 88 μg/L at W3). In the downstream, Chla concentrations in the lower estuary gradually decreased to a mean concentration of 3.2 ± 1.7 μg/L (Table 2). THPAA increase from the river to the upper estuary was a clear observation, while in the lower estuary, THPAA variations along the salinity gradient were very scattered (Figure 6A). The maximal THPAA (2.8 μM) was found at W8 (Table 2). The PAA-C% and PAA-N% gradually increased from a depleted value in the river water (0.5% for AA-C yield and 0.9% for AA-N yield) to 3.4% ± 3.4%(AA-C yield) and 8.8% ± 1.0% (AA-N yield) in the lower estuary (Table 2), indicating that there was an increase in AA proportion in bulk POC from the river to the estuary. The DI values ranged from −0.9 to 0.4, with the minimum (−0.9) found at W9, where THPAA maximum was found (Table 2; Figure 6A). If the minimum DI (−0.9) at W9 is excluded, the mean DI of all THPAA samples (surface + profile) from the WRE was 0.11 ±0.15. The Gly in total THPAA (Gly%) gradually increased from the river (~12%) across the upper WRE (~13%) to the lower WRE (over 16%) (Figure 6A). The D-form/L-form ratio of Ala ranged from 0.14 to 0.19 and its decrease was observed in the lower WRE (Figure 6A).
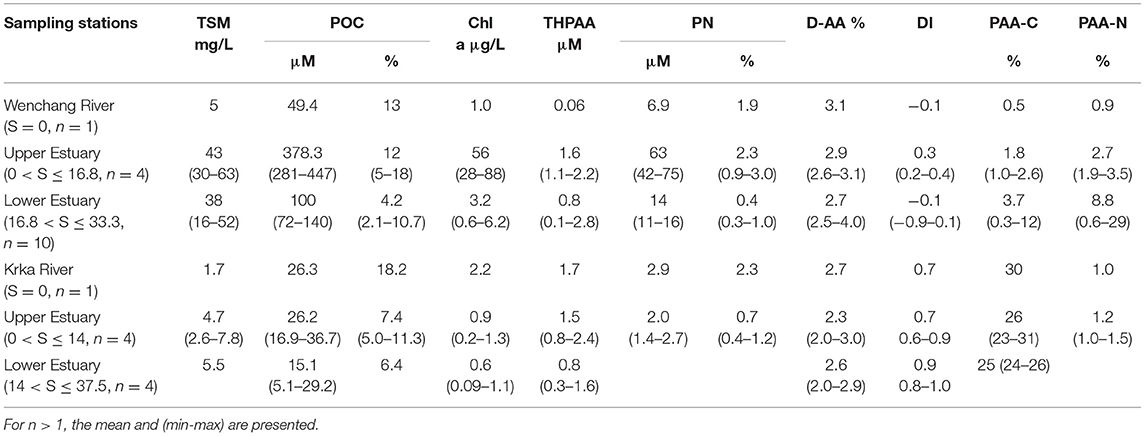
Table 2. Total suspended matter (TSM) and Particulate OM in surface waters of the WRE and the KRE.
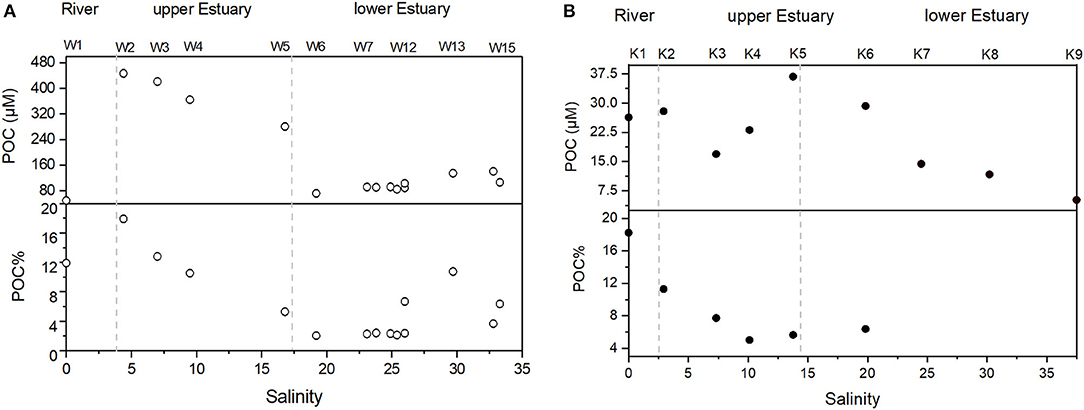
Figure 5. Particulate organic carbon (POC) variation vs. salinity of the surface waters in (A) the WRE and (B) the KRE. POC% is calculated as [POC (mg/L)/TSM (mg/L)] X 100%.
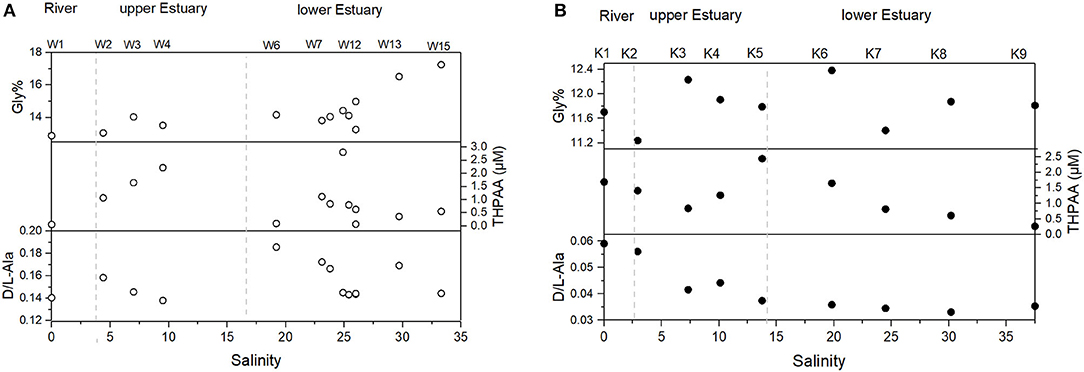
Figure 6. Particulate OM composition (as revealed by amino acids) variation vs. salinity of the surface waters in (A) the WRE and (B) the KRE.
The structure and succession of phytoplankton community along the salinity gradient in the WRE and the KRE, as estimated by CHEMTAX, are shown in Figure 7. In the WRE, the phytoplankton community succession along the salinity gradient is not clear. Except for a few stations, diatoms and cyanobacteria dominated almost all sites, together contributing over 77% of the total Chla (Figure 7A).
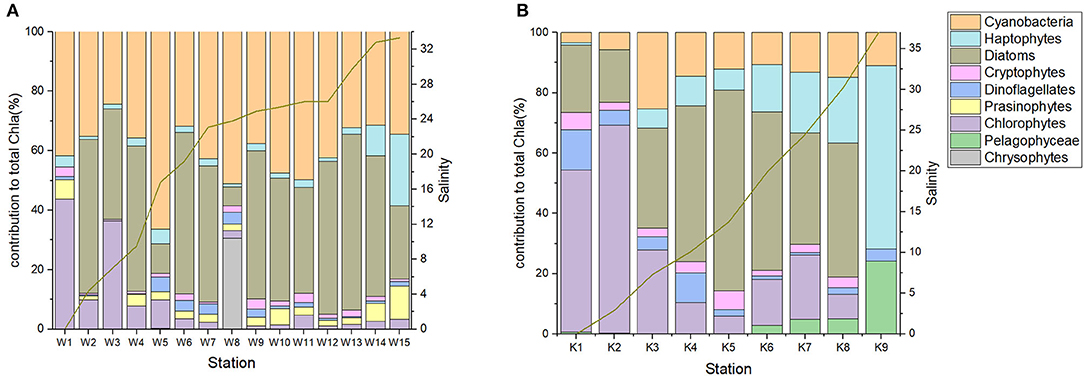
Figure 7. Phytoplankton community succession vs. salinity in surface waters in (A) the WRE and (B) KRE as estimated by CHEMTAX based on HPLC measured pigments. The lines indicate the salinity. The raw pigment data are from Vrana Špoljarić et al. (2021).
Basic Hydrology, Chemistry, and Phytoplankton of the Krka River Estuary
September is the dry season for the KRE. During our investigation in September, surface salinity increased from 0 at the river end (Station K1) to 37.9 at the coastal zone in the Adriatic Sea (K9), the water temperature varied between 21.5 and 25.7 °C (Figure 2B). In the near-bottom waters, temperature (24.1–36.9°C) and salinity (34.7–37.5) were clearly higher than those of the surface waters, indicating very strong stratification. Similarly, the KRE is divided into three sections based on salinity, namely the Krka River (S = 0), the upper estuary (S <14), and the lower estuary (S > 14). DO concentrations in the KRE were all > 7 mg/L, predominantly higher than DO concentrations at most of the sites in the WRE. No apparent increase of DO% was found in the upper estuary (Figure 2), and only in this section, DO concentration was higher in the WRE compared with the KRE. In the near-bottom waters, DO remained similar to that in the surface waters, excluding site K2.
Dissolved inorganic nitrogen in the KRE ranged from 0.5 to 5.8 μM (Table 1), being much lower than DIN in the WRE (Table 1). An increase of DIN in the upper estuary followed by a gradual decrease in the lower estuary was observed (Figure 3B). The magnitude of these changes was much lower compared to WRE (Figure 3A). The dominant contributor to DIN was nitrate. Concentration of orthophosphate i.e., DIP in the river water was 0.3 μM, almost three times as high as that in the Wenchang River (Table 1). In the upper estuary, DIP was 0.7 μM and dropped to 0.2 μM in the lower estuary (Table 1).
Dissolved organic carbon in the KRE surface waters ranged from 71 to 103 μM, being much lower compared with DOC values in the WRE. DOC concentrations gradually increased from the river to the station with salinity 20, similar to the WRE (Figure 4). At salinity > 20, DOC in the KRE again increased whereas in the WRE, DOC decreased (Figure 4). Vertically, higher DOC values appeared in the middle and the bottom layer. For example, DOC in the middle and near-bottom waters at station K2 were as high as 117 and 119 μM, respectively, whereas the corresponding DOC value in the surface water was 82 μM. For comparison, DIN concentrations were generally higher in the surface waters than in the middle and the bottom layers. Such contrasting concentrations indicated the pronounced stratification and its role in inhibition of vertical mixing and diffusion of materials.
With respect to particles, TSM concentrations in the KRE were much lower (1.7 to 5.5 mg/L) than those in the WRE (Table 2). POC distribution resembled that of the TSM, with maximum POC (36.7 μM) at K5 (Figure 5B). The POC% averaged 6.1%, with the highest value (18.2%) in the river water (Table 2). Overall, POC% between these estuaries was comparable, except for the upper KRE that had considerably lower POC% values (Figure 5B). The Chla concentrations in the KRE were lower than those in the WRE (Table 2) and ranged from 0.09 to 2.22 μg/L (Table 2). THPAA in the river water was 1.7 μM, which was much higher than that in the Wenchang River, while both estuaries showed similar THPAA concentrations (Figure 6B). The Gly% in the KRE was within a narrow range (11.2–12.4%) along the salinity gradient, being clearly lower than that in the WRE (Figure 6A). A gradual increase of DI from river to estuary was identified, with values increasing from 0.67 in the river to nearly 1 in the lower estuary. The D/L of alanine in the KRE was only one-third or one-fifth of that in the WRE, which gradually decreased seaward from 0.06 in the river to ~0.03 in the lower estuary (Figure 6B).
In the KRE, the phytoplankton community succession along the salinity gradient was much clearer than in the WRE. In the fresh water and upper estuary, chlorophytes were the key phytoplankton group, followed by increasing contribution from diatoms with increasing salinity (Figure 7B). In the coastal area (S > 35), haptophytes became the most important contributor to total Chla.
Discussions
Regulation of Nutrients in Surface Waters of the Wenchang River Estuary and the Krka River Estuary
Though some salinity and temperature data from the bottom layer are missing for the WRE, the KRE and the WRE show contrasting water column feature. The KRE is stratified whereas the WRE is more vertically mixed (Figure 2). Also, POC and TSM concentrations in the oligotrophic KRE were much lower compared with those in the WRE (Table 2). In addition to the terrestrial input, surface-bottom coupling is also different between the two estuaries. As a consequence, clear differences in DIN composition and distribution along the salinity gradient were identified between the two estuaries (Table 1). The DIN mean concentration in the oligotrophic KRE (3.6 ± 1.7 μM) is lower than in other pristine-basins or mesotrophic rivers/estuaries such as Mtwendwe (17.3 μM) in South Africa (Human et al., 2018) and Krathis River (21.3 μM) in Greece (Skoulikidis and Amaxidis, 2009). For the eutrophic WRE, its maximum DIN concentration (155 μM) was considerably higher in comparison to means of other eutrophic estuaries (~110 μM) (Smith et al., 2003). However, the overall mean DIN of the entire WRE (29 μM) is obviously lower than the reported means of eutrophic estuaries (110 μM), indicating that the WRE behaves as a DIN sink (Liu et al., 2011). Also, the sharp decline of DIN in the WRE is largely responsible for the great drop of DIN/DIP ratio from the riverine part (425) to the river mouth of the WRE (5.4).
Compared to the riverine site (W1), there is a great increase of DIN (especially ammonium) upon the river entering the WRE, followed by a sharp drop (Figure 3A). This DIN increase originated from the extensive agriculture and aquaculture activities, as well as mangroves (Herbeck et al., 2011; Zhang et al., 2020). While DIN concentration in the upper WRE was as high as 154 μM (Table 1; Figure 3A), DIN remained very low (~7 μM) in both the lower estuary and in the adjacent South China Sea off the Hainan island (Table 1) (Zhang et al., 2020). These findings suggest clear DIN removal, especially in the upper estuary (i.e., W2–W5; Figure 3A). In contrast, The KRE displayed a narrow range of DIN concentrations, suggesting more balanced DIN addition-removal (Figure 3B). The minor variation of DIN (only a few μM) in oligotrophic KRE is almost negligible when compared with the large variation of DIN over 100 μM in the eutrophic WRE (Figure 3). For eutrophic estuaries, such sharp DIN gradient along a salinity gradient in the upper estuary (Figure 3A) indicates important estuarine processes that counteract the strong nitrogen input, which finally maintains a relatively depleted DIN concentration in the estuarine mouth and hence results in a limited impact to the coastal ecosystem.
The removal of DIN in both WRE and KRE should be considered with the salinity changes in mind. Here, a ΔDIN* was used to quantify the DIN removal in both the WRE and the KRE. The term ΔDIN* is the difference of measured DIN concentrations and linear dilution curve that connects the maximum DIN (e.g., ~160 μM at S ≈ 4.5 for WRE) and seawater end-member DIN values (Figure 3). This value (ΔDIN*) quantifies the removal of the maximum DIN observed in the upper estuary. For the WRE, ΔDIN* at W5 is as high as 74 μM, whereas for the KRE, its ΔDIN* at K7 is only 1.2 μM. In addition, in the WRE, ammonium is the main DIN species that was removed (or added) (Figure 3A), while in the KRE, it is nitrate that varied to a larger extent relative to ammonium (Figure 3B).
Compared with the KRE, the WRE undergoes more substantial addition and further removal of DIN (W2–W5; Figure 3). While the strong anthropogenic activities (intense aquaculture and urbanization) are responsible for the addition of DIN (mainly ammonium) in the eutrophic WRE (Li et al., 2014), there are several possible mechanisms for the following removal of DIN (nitrate + ammonium).
The primary mechanism is likely to be the nitrification-denitrification-related nitrogen loss processes. It has been shown that wastewater from dredging shrimp ponds could immediately increase the wetlands ammonium concentration, followed by a clear N2O release from muddy mangrove wetlands sediment, and hence a corresponding decrease in water column DIN concentration (Chen et al., 2020). The mechanism behind this phenomenon is sudden input of ammonium that triggers prompt and strong nitrification (especially ammonium oxidation) in the oxic water column, followed by anammox and denitrification processes in the anoxic sediment, which causes nitrogen loss by generating bypass products of nitrogenous gases. For the WRE sediment, oxic layer (indicated by porewater) was up to 3 mm deep and remained anoxic beneath (Song GD, personal communication). Furthermore, denitrification in the tropical estuarine anoxic sediment showed high rates (10 s to 100 s of μmol N/m2/day) (Alongi et al., 2000, 2005). In this shallow and vertically mixed estuary, strong sediment water exchange and 1 week order of the Bamen Bay water residence time (Huang et al., 2011; Krumme et al., 2012) are all in favor of the removal of water column nitrogen. A strong increase of nitrite (4–6 μM) was observed at site W2–W5, where sharp removal of DIN took place (Figure 3A). Therefore, nitrification-denitrification-related nitrogen loss processes are expected to play an important role in the DIN regulation in the WRE (Liu et al., 2011). For the KRE, the deeper water depth (usually 10 s of meters) and much stronger stratification in the water column limit the impact of sediment to surface waters. And much shorter water residence time (2–3 days) further carries away the impact of sediments in a faster manner relative to the WRE (Liu et al., 2019b). As a consequence, a clear increase of nitrite in the KRE was absent (Figure 3B). Therefore, limited nitrification-denitrification-related nitrogen loss processes are expected for the KRE.
In addition to possible ammonium oxidation in the water column, the interactions between ammonium and suspended particles are additional ways for DIN (especially ammonium) removal from the water column (Raaphorst and Malschaert, 1996; Deng et al., 2016). Under low salinity conditions (e.g., S <23), ammonium and sediment have a higher exchange rate due to lower competition for cation exchange sites by ions, and hence, a higher nitrogen removal efficiency is expected in sediments underlaying freshwater or low salinity water (Seitzinger et al., 1991). The contribution of ammonium-TSM interactions is limited in both WRE and KRE; further studies are needed to precisely quantify their contribution.
Strong in situ photosynthesis is indicated by higher surface Chla concentration and DO% in the upper estuary of WRE (Table 2; Figure 2). Consequently, increased PN (e.g., over 75 μM) was observed. Increased Chla, DO%, and PN in the upper estuary section suggest the very strong in situ production of OM. Therefore, in addition to the above inorganic-nitrogen-related processes, DIN assimilation or transformation to organic form is also at work (W1–W4; Figure 8; Table 1). From W2 to W4 in the upper estuary, a decrease of DIN (ΔDIN = 67 μM) paralleled an increase in DON (ΔDON = 12.9 μM) and PN (ΔPN = 1.58 μM) (Figure 8). Correspondingly, there was an increase in AA N yield, from 1.95% at salinity 4.4 to 3.53% at salinity 9.5, suggesting a substantial assimilation of DIN into proteins. In other words, there may be a prominent nitrogen assimilation at this salinity range (4.4 to 9.5), where an extremely high DIN concentration was present. The increase of DON and PN from W2 to W4 explained roughly one-third of the corresponding DIN loss (Figure 8). Given that there might be additional DON or PN input, the one-third estimate should be viewed as the upper limit. In the WRE, the removal of DIN and its potential fate of assimilation into particulate OM could cause changes in particulate OM composition. It is difficult to conduct a similar comprehensive analysis for the KRE due to the lack of sufficient DON and PN data. However, Chla, DO%, and PN in the KRE showed no significant increases in the upper estuary section (Figure 2, Table 2), suggesting minor in situ production and in situ assimilation of nitrogen.
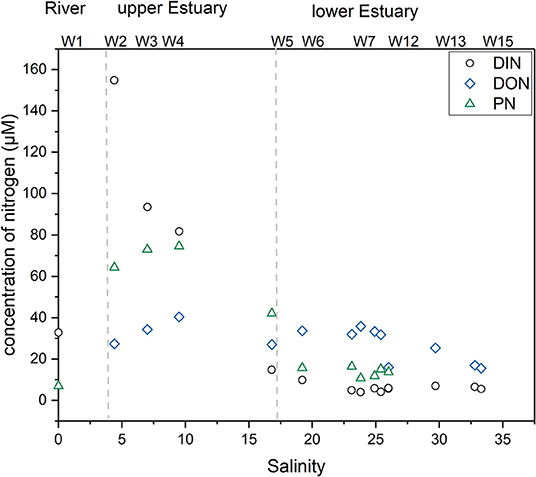
Figure 8. Nitrogen variation vs. salinity in the surface layer of the WRE.
As for DIP, it is a nutrient that is strongly affected by desorption and adsorption processes to/from particles or sediments (Liu et al., 2004). In the upper estuary of the WRE, where significant DIN increase and OM assimilation prevailed, DIP remained at the level of 0.5 μM, resulting in a very large DIN/DIP ratio (197 ± 33). These results suggest a strong P limitation for the OM assimilation in the upper estuary of the WRE. In the lower estuary, with the addition of DIP (Table 2), the DIN/DIP ratios greatly dropped to 2–5, and maintained at 5.4 at the mouth of the estuary (W13). As for the oligotrophic KRE, DIN/DIP ratio within the river and estuary did not change significantly (Table 1), and at the mouth of the KRE, the DIN/DIP ratio was 12 (K6). These results indicate contrasting input and output DIN/DIP ratios between the eutrophic WRE and the oligotrophic KRE. At the river end, the DIN/DIP ratios were 425 vs. 17, whereas at the mouths of estuaries, these ratios dropped to 5.4 vs. 12 for the WRE and the KRE, respectively. Though the magnitude of difference in DIN/DIP ratios between the Wenchang River and the Krka River was 25 times (425 vs. 17), their impacts to coastal ecosystems in term of nutrient stoichiometry are likely to be similar.
Implication of Particulate Organic Matter Compositions
Algal- Particulate Organic Carbon and Potential Impact of Higher Plants
In addition to contrasting nutrient background (Table 1; Figure 3) and land use differences, mean Chla in surface waters of the WRE was 18 times higher than that in the KRE (Table 2). Algae are an important POC carrier in rivers and estuaries (Legendre, 1998; Wysocki et al., 2006), and as a primary approach, the algal-POC can be quantified by converting the Chla concentration into algal-POC via proper factors. Previously, a range of POC/Chla ratios were reported, covering values from 30 to 50 for freshwater algae (Riemann et al., 1989; Abril et al., 2002). Here, we used a moderate ratio of 40 (Abril et al., 2002) to quantify the algal-POC, which has been applied to the Hainan Island river (Zhu et al., 2015). The algal-POC proportion in bulk POC (i.e., algal-POC%) in the WRE was as high as 70%, while in the KRE, the maximum proportion was only 30% (Figure 9A). Due to the abundance of nutrients, autochthonous POC was much more abundant in the WRE. Consequently, autochthonous POC is likely to play a more important role in the WRE (especially for the river and the upper estuary) compared with the KRE. The algal-POC proportion from W2 to W5 was over 30% (Figure 9A), and this is consistent with elevated DO% in the same section (Figure 2A), suggesting strong in situ production activities. Again, the vivid in situ production is consistent with the aforementioned high assimilation/ transformation of DIN into organic nitrogen in the same region.
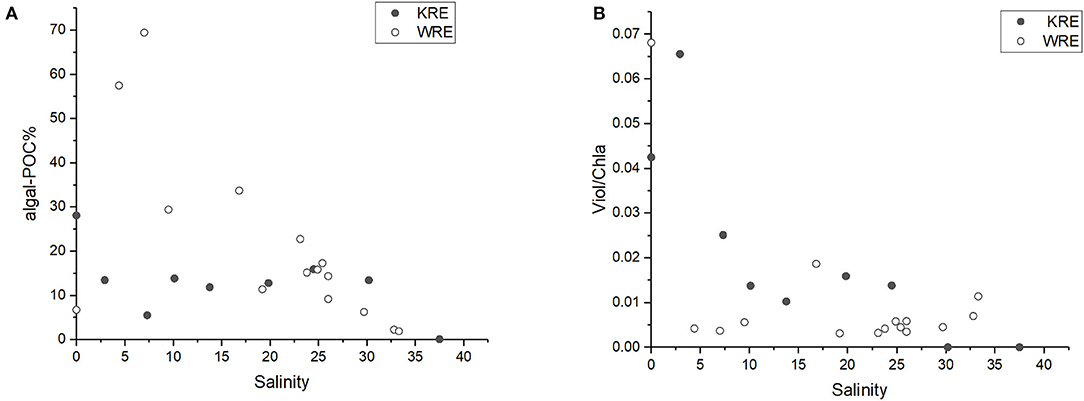
Figure 9. Particulate OM variation vs. salinity in both estuaries as revealed by (A) algal-POC% and (B) Viol/Chla.
A decreasing algal-POC% pattern in both estuaries was identified. High percentages were found in the Krka River end-member (S = 0), followed by a decreasing trend along with increasing salinity (Figure 9A). A decreasing algal-POC% pattern in both estuaries is consistent with previous findings in other rivers/estuaries like Loire and Scheldt estuaries (Abril et al., 2002). Higher plants are another significant Chla source, which may cause bias in the algal-POC estimate. Herein, we applied the ratio of the diagnostic pigment to reveal the higher plant impact on the total Chla. Violaxanthin (Viol) and diadinoxanthin cycles represent two important photoprotection mechanisms for higher plants and algae (Goss and Latowski, 2020). While both cycles can be found in phytoplankton, higher plants have Viol cycle only. As expected, Viol was commonly detected in various higher plants (Table 3), with the mean Viol/Chla ratio of 0.09. Among the phytoplankton, only a few groups (green and brown algae) have limited Viol cycle and hence contain few Viol (as indicated by trace Viol/Chla ratio). The other phytoplankton groups, including diatoms and cyanobacteria, have no Viol at all (Mackey et al., 1996). In addition, not only the Viol content in the green and/or brown algae is very depleted relative to that in the higher plants (Mackey et al., 1996; Goss and Latowski, 2020), but also the presence of these algae in the phytoplankton community was low, or even at trace level (Figure 7B). At the river and the upper estuaries (S <5), maximum Viol/Chla ratios (0.065–0.07) were found (Figure 9B). High Viol/Chla ratios in the Krka River and the upper estuary were very close to the higher plant Viol/Chla end-member ratio value (0.09). These results suggest the potential impact from higher plants. High Viol/Chla ratio was lowered rapidly with salinity increase after which in situ production of Chla dominated. These findings further emphasize that autochthonous POC (in situ produced) is more dominant in the WRE upper section, whereas reverse condition (i.e., allochthonous POC from river/terrestrial sources should play a more important role) likely stands for the upper KRE (where S <5). This notion is consistent with the DIN removal and its corresponding assimilation and transformation by phytoplankton into OM. In the lower reaches, where salinity was > 20, algal-POC% in both estuaries were <10% and comparable to each other (Figure 9A).
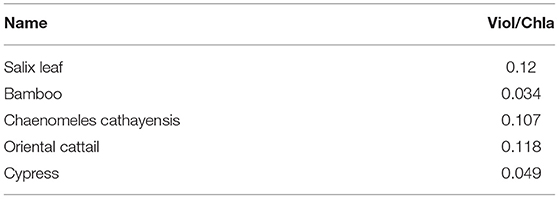
Table 3. Pigment ratios of Viol/Chla in higher plants.
Besides particulate OM, it is interesting that the overall DOC patterns in the WRE and the KRE were reverse (especially S > 20; Figure 4). The distinct DOC concentration levels (i.e., high DOC in the WRE and low DOC in the KRE; Table 1) indicate the contrasting river basin DOC yield rates and sources (Unger et al., 2013; Marcinek et al., 2020). DOC is mainly contributed by the leaching effect in the basin (Rixen et al., 2016), further affected by desorption/adsorption from/to suspended particles or sediments and anthropogenic activities (e.g., aquaculture). The WRE is characterized by mangroves and intensive aquaculture, which are known for their high OM (Bao et al., 2013), and hence the strong increase of DOC in the estuary up to a concentration of 350 μM is observed (Figure 4). In the KRE, DOC in dry summer can be over 140 μM, whereas, in wet winter, it drops to only 10 s of μM (Marcinek et al., 2020). In September, when the Krka River is still at its low discharge, the DOC in the KRE (103 μM at S = 19.8) can be even higher when compared to the sea end-member DOC (<100 μM; Figure 4). The possible explanation for such higher estuarine DOC relative to a marine site in the KRE are the intense biological activities in relatively undisturbed water above the halocline (Cetinić et al., 2006; Marcinek et al., 2020).
Particulate Organic Matter Degradation and the Eutrophication Impact
The algal-POC% variation patterns in the WRE suggest that the enrichments of POC are largely attributed to autotrophic contribution to POC in the upper estuary, while in the lower estuary, a sharp drop in algal contribution was observed (Figure 9A). For the KRE, algal POC contribution remained 15% in most of the estuary sections (Figure 9B), suggesting a stable algal proportion in particulate organic matter (POM) in most parts of the estuary. In addition to POM composition, DO saturation status indicates the overall status of the ecosystem. Undersaturated DO indicates the system is heterotrophic, whereas oversaturated DO indicates the system is autotrophic. From the view of POM composition, undersaturated DO indicates that POM is likely to be more degraded as a stronger rework or reuse of OM is going on within the ecosystem, whereas oversaturated DO means the OM should be newer as the system is assimilating new OM from inorganic carbon. Judged by DO distribution patterns (Figure 2), OM was in a productive phase in the upper estuary (oversaturated DO at W2–W5) and changed to degraded phase in the lower estuary of the WRE, whereas in the entire KRE, DO was oversaturated, indicating that OM in the KRE should be in a productive stage and hence the POM should be fresher.
Low DI value indicates the strong presence of degraded OM, while a high DI value indicates the presence of labile OM (Dauwe and Middelburg, 1998). In addition, the non-proteinogenic AA gamma aminobutyric acid (GABA) is also an indicator of OM degradation status (Dauwe and Middelburg, 1998). Usually, the DI value is negatively related to GABA contribution to total AA (GABA%), as found in the lower streams of Mississippi and Pearl (Duan and Bianchi, 2007) and Changjiang Estuary (Wang et al., 2018). When comparing KRE and WRE, an overall negative correlation between DI and GABA% exists for the WRE, while the pattern between DI and GABA% is complicated for the KRE (Figure 10B). Except for the outlier on the left most site (DI ~ −1) in Figure 10B that requires further study, the other three outliers in the upper WRE (namely stations W2–W4; Figure 10B) were likely to be a response to the abnormally high in situ production (see elevated DO% for W2–W5 in Figure 2A) and assimilation of organic nitrogen. In the lower estuary, where DO remained undersaturated (Figure 2A), we observed corresponding particulate OM composition changes, including higher D/L Ala ratios (Figure 6A) and lower DI values (Figure 10B). These POM composition changes indicate that the POM was overall degraded during estuarine mixing in the lower WRE, which is again consistent with the notion derived from DO distribution patterns.
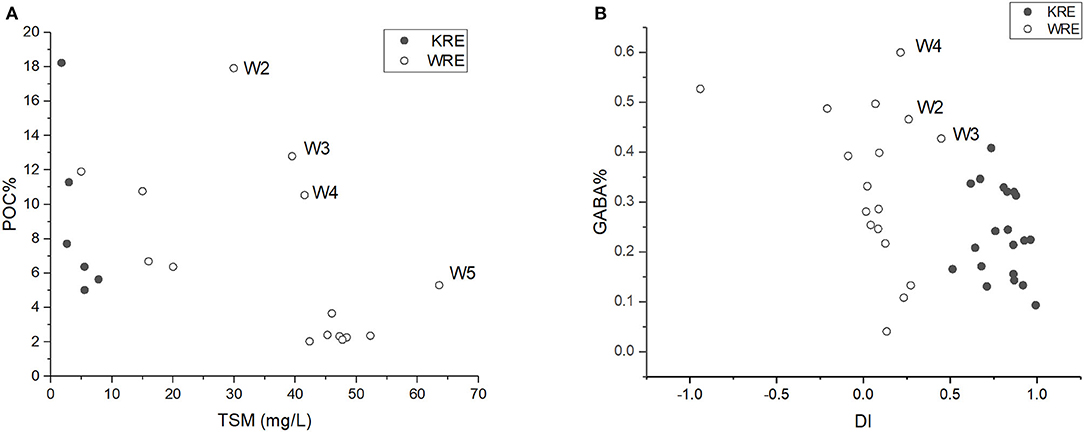
Figure 10. (A) POC (in %) plotted against total suspended matter (TSM) in the WRE and the KRE (surface samples only). (B) GABA% plotted against DI for the WRE and the KRE (all layers).
A comparison of POM degradation status between the estuaries are also provided. Lower DI values were obtained in the WRE samples compared with the KRE samples (Table 2), which means bulk particulate OM in the KRE was less degraded than that in the WRE. This is consistent with the DO status (Figure 2). Further, a higher D/L AA ratio indicates stronger fingerprints of bacteria and the alternation of OM (Amon et al., 2001; Kaiser and Benner, 2008). Much higher D/L ratio was found for the WRE compared with the KRE (Figure 6), indicating much more active alternation of OM by bacteria in the WRE (Jones et al., 2005). It is possible that such intense bacterial rework signal in the WRE (elevated D/L ratio) was fueled by higher temperature and eutrophication (more nutrients and OM). Last but not least, higher surface TSM was identified in the shallow WRE compared to that in the deeper and stratified KRE (Figure 10A). It is hence reasonable to expect a stronger resuspension or sediment input in the WRE compared with the strongly stratified KRE (Unger et al., 2013; Cindrić et al., 2015). This is also supported by the common distribution of mangroves and muddy tidal flats in the WRE whereas for the KRE, karst landform basin yields very limited suspended matter content. As OM in the sediments and/or soils are usually more refractory relative to suspended POM in terms of AAs (Dauwe and Middelburg, 1998), POM in the WRE showed generally much more degraded status than that in the KRE. During the dry season (like September for this study), it is reported that OM is clearly generated by the intense biological activity in the KRE (Marcinek et al., 2020).
Riverine Flux and Yield Rates
Discharge in the WRE and the KRE were both ~60% of its annual mean during our samplings. Those daily fluxes equalled 1096 kg vs. 2445 kg (DOC), 290 kg vs. 910 kg (POC), 225 kg vs. 186 kg (DIN), and 1.2 kg vs. 24 kg (DIP), for the Wenchang and the Krka River, respectively. While most of the materials fluxes are lower for the Wenchang River (due to lower discharge), the apparent DIN flux is reverse, due to extremely high DIN in the river end.
In addition to daily discharge, annual discharge and especially annual basin yields are more useful data for comparison with other rivers worldwide, because the published data are available on the annual basis. For the WRE and the KRE, the annual flux and further yield (flux divided by basin area) were estimated based on the reported annual river discharge and basin area (Bonacci et al., 2006; Liu et al., 2019b), together with the OM and nutrient concentrations (samples collected at S = 0), bearing in mind that the riverine materials can show seasonality in both their concentrations and compositions (Holmes et al., 2012; Wang et al., 2012; Krishna et al., 2016). To solve the single sampling time problem, the published seasonal Wenchang River end-member data is also used to calculate the flux and further yield if available (Tian, 2009; Liu et al., 2011). For the river without seasonal data (the Krka River), usually, rivers tend to transport more suspended materials during high discharge compared with the low discharge period. For the dissolved phase, in comparison, the variations in concentrations are more complicated. In the monsoon-controlled tropical Indian rivers, high DIN concentrations were found during the initial discharge period but then the concentration maintained stable (variability <20%) for the rest of the discharge time (Krishna et al., 2016).
The yields of materials for the oligotrophic Krka River were lower than that of the eutrophic Wenchang River (Table 4). This is not surprising as the eutrophic Wenchang River usually has much higher dissolved and particulate material concentrations (Tables 1, 2). The DOC and the POC yields for the eutrophic Wenchang River were 2.4 and 0.5 t C km−2 yr−1, respectively, which were over 4 and 2 times higher than those for the Krka River (Table 4). The DIN yields for the Wenchang River were over 20 times higher than that for the Krka River (Table 4). In comparison, the DIP yield in the Wenchang River was the same as that in the Krka River (Table 4). The differences in river basin and aquaculture activity intensity may play a role in such river end DIP concentrations. Since both Croatia and China apply a phosphorus-free detergent policy, the environmental contamination from detergents is likely playing only a minor role.
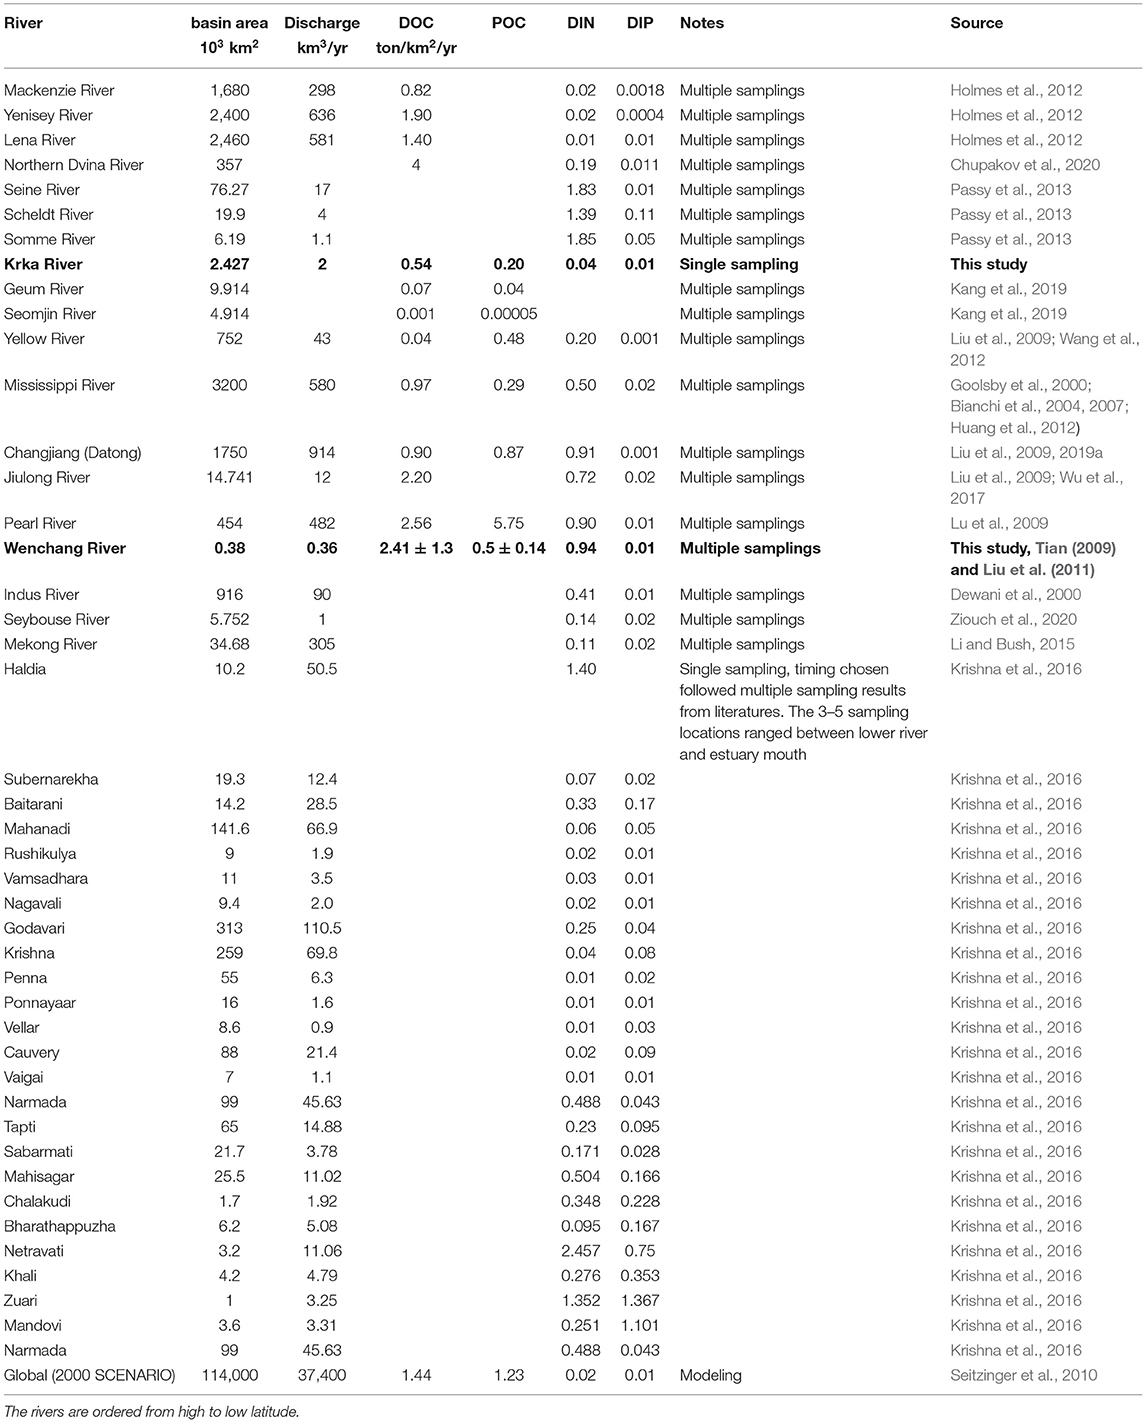
Table 4. Basin area, discharge, and estimate of OM and nutrient yields for the Wenchang and the Krka Rivers and a comparison with other world rivers.
Compared with other rivers worldwide, the DOC yield in the Krka River is at the low end (Table 4). It is not surprising when compared with rivers that flow through the organic-matter-rich basins, like Siberian rivers and the heavy-human-impacted rivers (the Changjiang and the Mississippi) (Table 4). Given that in situ biological activities increased the DOC in this season (Marcinek et al., 2020) and further when an annual riverine DOC mean is considered, the DOC flux and the yield for the Krka River should be even lower. As a comparison, DOC yield for the Wenchang River is among the highest, compared to the Jiulong River and the Pearl River (China), which are also located in tropical regions with heavy human impact (Table 4).
The DIN yields for the pristine Krka River are among the lowest when compared with other European rivers, e.g., the Seine, the Scheldt, and the Somme, let along the eutrophic WRE and other Indian rivers (Table 4). The DIN yields of the Wenchang River are also lower than some other rivers like the Seine, Scheldt, and Somme and some Indian rivers like the Haldia, Netravati, and Zuari (Table 4). Up to 90% of riverine DIN was captured or removed within the estuaries like those from India (Bhavya et al., 2016; Gupta et al., 2016; Krishna et al., 2016). For the eutrophic WRE, a sharp DIN drop was also observed (Figure 3A). As for the oligotrophic KRE, such estuarine nitrogen removal is absent (Figure 3B), likely due to the limited riverine nitrogen input and short water residence time (Seitzinger et al., 2006). As a result, DIN/DIP ratio in the Wenchang River was as high as 425, whereas in the Krka River, DIN/DIP ratio was only 17. Due to the intense biogeochemical processes within the estuary (e.g., DIN removal; Figure 3A), DIN/DIP ratio in the lower WRE channel dropped to 5.4, in comparison with a DIN/DIP ratio of 12 in the lower KRE. Taken together, our work highlighted the complexity and significance in cross comparison between eutrophpic and oligotrophic rivers. It is noteworthy that eutrophic rivers (e.g., Wenchang) may be exerting a similar limited impact to the coastal zone compared to those of pristine rivers (e.g., Krka), which is largely owing to the estuarine nitrogen regulation processes.
Conclusions
Different types of river basins of the WRE and the KRE make the biogeochemical processes of their estuaries differ from each other, resulting in different modifications of the net biogenic elements fluxes. Although both eutrophic Wenchang and oligotrophic Krka estuaries are lagoons or lagoon-like structures in the lower part, their comparisons indicated that there are significant differences in the biogeochemistry.
The eutrophic WRE showed a sharp removal of DIN, accompanied by increasing organic nitrogen content. We found that the OM assimilation may explain approximately one-third of the DIN removal in the WRE if the additional riverine OM input is ignored. With respect to oligotrophic estuaries like the KRE, rework of nutrients like DIN removal was at trace level, and transformation of DIN into organic form in such estuary is not likely to be significant. It is clear that different water column vertical structures, together with POC and TSM concentration differences, strongly affect the nutrient-related biogeochemical processes, including nitrification and/or denitrification, sorption and/or desorption processes. Nevertheless, strong yet contrasting estuarine nitrogen processes result in a reverse relationship of DIN/DIP output ratios; at the river end, DIN/DIP ratios in the WRE and the KRE were 425 vs. 17, but after the estuarine regulating process, the DIN/DIP ratios at the seaward output end became much similar (all <16) in the WRE and the KRE, respectively.
The fluxes of small and medium rivers should be viewed with caution in land-ocean interaction and river flux studies. Our work advances the understanding of the significance of estuarine processes, which greatly regulate river end-member nutrients and OM. This is especially important for eutrophic rivers. The high nutrient concentrations in eutrophic rivers and estuaries, like the WRE, may be exerting a similar nutrient impact to coastal zones when compared to those of oligotrophic systems such as KRE in terms of DIN/DIP stoichiometry.
Data Availability Statement
The original contributions presented in the study are included in the article/supplementary materials, further inquiries can be directed to the corresponding author/s.
Author Contributions
Y-YH measured the samples and wrote the draft, revised the manuscript. Z-YZ composed the idea and scientific question, participated field work, revised the manuscript, and funded the project. F-TF measured part of the samples and revised part of the manuscript. TN, MC, EH, and ZL provided part of the raw data and revised the manuscript. MC participated the field work. J-ZD and R-FZ participated the field work and provided part of raw data. BG participated the field work, revised the manuscript, and funded the project. All authors contributed to the article and approved the submitted version.
Conflict of Interest
The authors declare that the research was conducted in the absence of any commercial or financial relationships that could be construed as a potential conflict of interest.
Publisher's Note
All claims expressed in this article are solely those of the authors and do not necessarily represent those of their affiliated organizations, or those of the publisher, the editors and the reviewers. Any product that may be evaluated in this article, or claim that may be made by its manufacturer, is not guaranteed or endorsed by the publisher.
Acknowledgments
We are grateful to the captains of the fishing boats who helped us in the fieldwork. We thank Nan Chiang, Harvard University, Massachusetts, USA, for her help in revising the manuscript. We thank the three reviewers for their insightful comments and suggestions, which had helped to improve the manuscript. For the China side, this work was funded by the Ministry of Science and Technology of China via China-Croatia bilateral collaboration supporting Z-YZ's project proposal and by the 111 Project (BP0820020) granted by the Ministry of Education, China. The Croatian side was funded by the Croatian Science Foundation under the project IP-11-2013-8607.
References
Abril, G., Nogueira, M., Etcheber, H., Cabeçadas, G., Lemaire, E., and Brogueira, M. J. (2002). Behaviour of organic carbon in nine contrasting European estuaries. Estuar. Coast. Shelf Sci. 54, 241–262. doi: 10.1006/ecss.2001.0844
Alongi, D. M., Pfitzner, J., Trott, L. A., Tirendi, F., Dixon, P., and Klumpp, D. W. (2005). Rapid sediment accumulation and microbial mineralization in forests of the mangrove Kandelia candel in the Jiulongjiang Estuary, China. Estuar. Coast. Shelf Sci. 63, 605–618. doi: 10.1016/j.ecss.2005.01.004
Alongi, D. M., Tirendi, F., Trott, L. A., and Xuan, T. T. (2000). Benthic decomposition rates and pathways in plantations of the mangrove Rhizophora apiculata in the Mekong delta, Vietnam. Mar. Ecol. Prog. Ser. 194, 87–101. doi: 10.3354/meps194087
Amon, R. M. W., Fitznar, H. P., and Benner, R. (2001). Linkages among the bioreactivity, chemical composition, and diagenetic state of marine dissolved organic matter. Limnol. Oceanogr. 46, 287–297. doi: 10.4319/lo.2001.46.2.0287
Bao, H. Y., Wu, Y., Tian, L. X., Zhang, J., and Zhang, G. L. (2013). Sources and distributions of terrigenous organicmatter in a mangrove fringed small tropical estuary in South China. Acta Oceanol. Sin. 32, 18–26. doi: 10.1007/s13131-013-0295-3
Bhavya, P. S., Kumar, S., Gupta, G. V. M., Sudheesh, V., Sudharma, K. V., Varrier, D. S., et al. (2016). Nitrogen uptake dynamics in a tropical eutrophic estuary (Cochin, India) and adjacent coastal waters. Estuaries Coasts 39, 54–67. doi: 10.1007/s12237-015-9982-y
Bianchi, T. S., Filley, T., Dria, K., and Hatcher, P. G. (2004). Temporal variability in sources of dissolved organic carbon in the lower Mississippi river. Geochim. Cosmochim. Acta 68, 959–967. doi: 10.1016/j.gca.2003.07.011
Bianchi, T. S., Wysocki, L. A., Stewart, M., Filley, T. R., and Mckee, B. A. (2007). Temporal variability in terrestrially-derived sources of particulate organic carbon in the lower Mississippi River and its upper tributaries. Geochim. Cosmochim. Acta 71, 4425–4437. doi: 10.1016/j.gca.2007.07.011
Bonacci, O., Jukic, D., and Ljubenkov, I. (2006). Definition of catchment area in karst: case of the rivers Krcic and Krka, Croatia. Hydrol. Sci. J. 51, 682–699. doi: 10.1623/hysj.51.4.682
Cauwet, G. (1991). Carbon inputs and biogeochemical processes at the halocline in a stratified estuary: Krka River, Yugoslavia. Mar. Chem. 32, 269–283. doi: 10.1016/0304-4203(91)90043-V
Cetinić, I., Viličić, D., Burić, Z., and Olujić, G. (2006). Phytoplankton seasonality in a highly stratified karstic estuary (Krka, Adriatic Sea). Hydrobiologia 555, 31–40. doi: 10.1007/s10750-005-1103-7
Chen, G., Chen, J., Ou, D., Tam, N. F. Y., Chen, S., Zhang, Q., et al. (2020). Increased nitrous oxide emissions from intertidal soil receiving wastewater from dredging shrimp pond sediments. Environ. Res. Lett. 15:094015. doi: 10.1088/1748-9326/ab93fb
Chupakov, A. V., Pokrovsky, O. S., Moreva, O. Y., Shirokova, L. S., Neverova, N. V., Chupakova, A. A., et al. (2020). High resolution multi-annual riverine fluxes of organic carbon, nutrient and trace element from the largest European Arctic river, Severnaya Dvina. Chem. Geol. 538:119491. doi: 10.1016/j.chemgeo.2020.119491
Cindrić, A.-M., Garnier, C., Oursel, B., PiŽeta, I., and Omanović, D. (2015). Evidencing the natural and anthropogenic processes controlling trace metals dynamic in a highly stratified estuary: the Krka River estuary (Adriatic, Croatia). Mar. Pollut. Bull. 94, 199–216. doi: 10.1016/j.marpolbul.2015.02.029
Cukrov, N., Cmuk, P., Mlakar, M., and Omanović, D. (2008). Spatial distribution of trace metals in the Krka River, Croatia: an example of the self-purification. Chemosphere 72, 1559–1566. doi: 10.1016/j.chemosphere.2008.04.038
Dauwe, B., and Middelburg, J. J. (1998). Amino acids and hexosamines as indicators of organic matter degradation state in North Sea sediments. Limnol. Oceanogr. 43, 782–798. doi: 10.4319/lo.1998.43.5.0782
Deng, W., Xu, X., Chen, C., He, J., Xu, D., and Wang, L. (2016). Sorption and desorption characteristics of ammonium in the surface sediments of Lake Dianchi. Hupo Kexue J. Lake Sci. 28, 75–85. doi: 10.18307/2016.0109
Dewani, V. K., Ansari, I. A., and Khuhawar, M. Y. (2000). Evaluation and transport of nitrogen and phorphorus by river Indus at Kotri barrage. J. Chem. Soc. Pak. 22, 104–110.
Duan, S., and Bianchi, T. S. (2007). Particulate and dissolved amino acids in the lower Mississippi and Pearl Rivers (USA). Mar. Chem. 107, 214–229. doi: 10.1016/j.marchem.2007.07.003
Durr, H. H., Laruelle, G. G., Van Kempen, C. M., Slomp, C. P., Meybeck, M., and Middelkoop, H. (2011). Worldwide typology of nearshore coastal systems: defining the estuarine filter of river inputs to the oceans. Estuaries Coasts 34, 441–458. doi: 10.1007/s12237-011-9381-y
Eyre, B., and Balls, P. (1999). A comparative study of nutrient behavior along the salinity gradient of tropical and temperate estuaries. Estuaries 22, 313–326. doi: 10.2307/1352987
Fitznar, H. P., Lobbes, J. M., and Kattner, G. (1999). Determination of enantiomeric amino acids with high-performance liquid chromatography and pre-column derivatisation with o-phthaldialdehyde and N-isobutyrylcysteine in seawater and fossil samples (mollusks). J. Chromatogr. A 832, 123–132. doi: 10.1016/S0021-9673(98)01000-0
Fuks, D., Devescovi, M., Precali, R., Krstulović, N., and Šolić, M. (1991). Bacterial abundance and activity in the highly stratified estuary of the Krka River. Mar. Chem. 32, 333–346. doi: 10.1016/0304-4203(91)90047-Z
Goolsby, D. A., Battaglin, W. A., Aulenbach, B. T., and Hooper, R. P. (2000). Nitrogen flux and sources in the Mississippi River Basin. Sci. Tot. Environ. 248, 75–86. doi: 10.1016/S0048-9697(99)00532-X
Goss, R., and Latowski, D. (2020). Lipid dependence of xanthophyll cycling in higher plants and algae. Front. Plant Sci. 11:455. doi: 10.3389/fpls.2020.00455
Grasshoff, K., Kremling, K., and Ehrhardt, M. (Eds.). (1999). Methods of Seawater Analysis. Weinheim: Wiley-VCH.
Grẑetić, Z., Precali, R., Degobbis, D., and Škrivanić, A. (1991). Nutrient enrichment and phytoplankton response in an Adriatic karstic estuary. Mar. Chem. 32, 313–331. doi: 10.1016/0304-4203(91)90046-Y
Gupta, G. V. M., Sudheesh, V., Sudharma, K. V., Saravanane, N., Dhanya, V., Dhanya, K. R., et al. (2016). Evolution to decay of upwelling and associated biogeochemistry over the southeastern Arabian Sea shelf. J. Geophys. Res. Biogeosci. 121, 159–175. doi: 10.1002/2015JG003163
Hedges, J. I., Cowie, G. L., Richey, J. E., Quay, P. D., Benner, R., Mike, S., et al. (1994). Origins and processing of organic matter in the Amazon River as indicated by carbohydrates and amino acids. Limnol. Oceanogr. 39, 743–761. doi: 10.4319/lo.1994.39.4.0743
Herbeck, L. S., Unger, D., Krumme, U., Liu, S. M., and Jennerjahn, T. C. (2011). Typhoon-induced precipitation impact on nutrient and suspended matter dynamics of a tropical estuary affected by human activities in Hainan, China. Estuar. Coast. Shelf Sci. 93, 375–388. doi: 10.1016/j.ecss.2011.05.004
Hilton, J., O'hare, M., Bowes, M. J., and Jones, J. I. (2006). How green is my river? A new paradigm of eutrophication in rivers. Sci. Tot. Environ. 365, 66–83. doi: 10.1016/j.scitotenv.2006.02.055
Hilton, R. G., Galy, A., Hovius, N., Chen, M.-C., Horng, M.-J., and Chen, H. (2008). Tropical-cyclone-driven erosion of the terrestrial biosphere from mountains. Nat. Geosci. 1, 759–762. doi: 10.1038/ngeo333
Holmes, R. M., Mcclelland, J. W., Peterson, B. J., Tank, S. E., Bulygina, E., Eglinton, T. I., et al. (2012). Seasonal and annual fluxes of nutrients and organic matter from large rivers to the arctic ocean and surrounding seas. Estuaries Coasts 35, 369–382. doi: 10.1007/s12237-011-9386-6
Huang, D., Du, J., and Zhang, J. (2011). Particle dynamics of 7Be, 210Pb and the implications of sedimentation of heavy metals in the Wenjiao/Wenchang and Wanquan River estuaries, Hainan, China. Estuar. Coast. Shelf Sci. 93, 431–437. doi: 10.1016/j.ecss.2011.05.013
Huang, W. J., Cai, W. J., Powell, R. T., Lohrenz, S. E., Wang, Y., Jiang, L. Q., et al. (2012). The stoichiometry of inorganic carbon and nutrient removal in newline the Mississippi River plume and adjacent continental shelf. Biogeosciences 9, 2781–2792. doi: 10.5194/bg-9-2781-2012
Human, L. R. D., Magoro, M. L., Dalu, T., Perissinotto, R., Whitfield, A. K., Adams, J. B., et al. (2018). Natural nutrient enrichment and algal responses in near pristine micro-estuaries and micro-outlets. Sci. Tot. Environ. 624, 945–954. doi: 10.1016/j.scitotenv.2017.12.184
Jickells, T. D. (1998). Nutrient biogeochemistry of the coastal zone. Science 281, 217–222. doi: 10.1126/science.281.5374.217
Jones, V., Collins, M. J., Penkman, K. E. H., Jaffé, R., and Wolff, G. A. (2005). An assessment of the microbial contribution to aquatic dissolved organic nitrogen using amino acid enantiomeric ratios. Org. Geochem. 36, 1099–1107. doi: 10.1016/j.orggeochem.2004.11.008
Kaiser, K., and Benner, R. (2005). Hydrolysis-induced racemization of amino acids. Limnol. Oceanogr. Methods 3, 318–325. doi: 10.4319/lom.2005.3.318
Kaiser, K., and Benner, R. (2008). Major bacterial contribution to the ocean reservoir of detrital organic carbon and nitrogen. Limnol. Oceanogr. 53, 99–112. doi: 10.4319/lo.2008.53.1.0099
Kang, S., Kim, J. H., Kim, D., Song, H., Ryu, J. S., Ock, G., et al. (2019). Temporal variation in riverine organic carbon concentrations and fluxes in two contrasting estuary systems: Geum and Seomjin, South Korea. Environ. Int. 133:105126. doi: 10.1016/j.envint.2019.105126
Kawasaki, N., and Benner, R. (2006). Bacterial release of dissolved organic matter during cell growth and decline: molecular origin and composition. Limnol. Oceanogr. 51, 2170–2180. doi: 10.4319/lo.2006.51.5.2170
Krishna, M. S., Prasad, M. H. K., Rao, D. B., Viswanadham, R., Sarma, V. V. S. S., and Reddy, N. P. C. J. (2016). Export of dissolved inorganic nutrients to the northern Indian Ocean from the Indian monsoonal rivers during discharge period. Geochim. Cosmochim. Acta 172, 430–443. doi: 10.1016/j.gca.2015.10.013
Krumme, U., Herbeck, L. S., and Wang, T. J. M. E.R. (2012). Tide- and rainfall-induced variations of physical and chemical parameters in a mangrove-depleted estuary of East Hainan (South China Sea). Mar. Environ. Res. 82, 28–39. doi: 10.1016/j.marenvres.2012.09.002
Legendre, L. (1998). Flux of particulate organic material from the euphotic zone of oceans: estimation from phytoplankton biomass. J. Geophys. Res. Oceans 103, 2897–2903. doi: 10.1029/97JC02706
Legović, T., Zutić, V., Gr?etić, Z., Cauwet, G., Precali, R., and Viličié, D. (1994). Eutrophication in the Krka estuary. Mar. Chem. 46, 203–215. doi: 10.1016/0304-4203(94)90056-6
Li, R. H., Liu, S. M., Li, Y. W., Zhang, G. L., Ren, J. L., and Zhang, J. (2014). Nutrient dynamics in tropical rivers, lagoons, and coastal ecosystems of eastern Hainan Island, South China Sea. Biogeosciences 11, 481–506. doi: 10.5194/bg-11-481-2014
Li, S. Y., and Bush, R. T. (2015). Rising flux of nutrients (C, N, P and Si) in the lower Mekong River. J. Hydrol. 530, 447–461. doi: 10.1016/j.jhydrol.2015.10.005
Liu, D., Bai, Y., He, X., Tao, B., Pan, D., Chen, C.-T. A., et al. (2019a). Satellite estimation of particulate organic carbon flux from Changjiang River to the estuary. Remote Sens. Environ. 223, 307–319. doi: 10.1016/j.rse.2019.01.025
Liu, J., Hrustić, E., Du, J., Gašparović, B., Canković, M., Cukrov, N., et al. (2019b). Net submarine groundwater-derived dissolved inorganic nutrients and carbon input to the oligotrophic stratified karstic estuary of the Krka River (Adriatic Sea, Croatia). J. Geophys. Res. Oceans 124, 4334–4349. doi: 10.1029/2018JC014814
Liu, S. M., Hong, G. H., Zhang, J., Ye, X. W., and Jiang, X. L. (2009). Nutrient budgets for large Chinese estuaries. Biogeosciences 6, 2245–2263. doi: 10.5194/bg-6-2245-2009
Liu, S. M., Li, R. H., Zhang, G. L., Wang, D. R., Du, J. Z., Herbeck, L. S., et al. (2011). The impact of anthropogenic activities on nutrient dynamics in the tropical Wenchanghe and Wenjiaohe Estuary and Lagoon system in East Hainan, China. Mar. Chem. 125, 49–68. doi: 10.1016/j.marchem.2011.02.003
Liu, S. M., Zhang, J., and Li, D. J. (2004). Phosphorus cycling in sediments of the Bohai and Yellow Seas. Estuar. Coast. Shelf Sci. 59, 209–218. doi: 10.1016/j.ecss.2003.08.009
Lu, F. H., Ni, H. G., Liu, F., and Zeng, E. Y. (2009). Occurrence of nutrients in riverine runoff of the Pearl River Delta, South China. J. Hydrol. 376, 107–115. doi: 10.1016/j.jhydrol.2009.07.018
Mackey, M. D., Mackey, D. J., Higgins, H. W., and Wright, S. W. (1996). CHEMTAX - A program for estimating class abundances from chemical markers: application to HPLC measurements of phytoplankton. Mar. Ecol. Prog. Ser. 144, 265–283. doi: 10.3354/meps144265
Marcinek, S., Santinelli, C., Cindrić, A.-M., Evangelista, V., Gonnelli, M., Layglon, N., et al. (2020). Dissolved organic matter dynamics in the pristine Krka River estuary (Croatia). Mar. Chem. 225:103848. doi: 10.1016/j.marchem.2020.103848
Marty, J.-C., Garcia, N., and Raimbault, P. (2008). Phytoplankton dynamics and primary production under late summer conditions in the NW Mediterranean Sea. Deep Sea Res. Part I Oceanogr. Res. Pap. 55, 1131–1149. doi: 10.1016/j.dsr.2008.05.001
Milliman, J., and Syvitski, J. (1991). Geomorphic tectonic control of sediment discharge to ocean – the importance of small mountainous rivers. J. Geol. 100, 525–544. doi: 10.1086/629606
Nguyen, T. T. N., Némery, J., Gratiot, N., Strady, E., Tran, V. Q., Nguyen, A. T., et al. (2019). Nutrient dynamics and eutrophication assessment in the tropical river system of Saigon – Dongnai (southern Vietnam). Sci. Tot. Environ. 653, 370–383. doi: 10.1016/j.scitotenv.2018.10.319
Padan, J., Marcinek, S., Cindric, A. M., Layglon, N., Garnier, C., Salaun, P., et al. (2020). Determination of sub-picomolar levels of platinum in the pristine Krka River estuary (Croatia) using improved voltammetric methodology. Environ. Chem. 17, 77–84. doi: 10.1071/EN19157
Paerl, H., Valdes-Weaver, L., Joyner, A., and Winkelmann, V. (2007). Phytoplankton indicators of ecological change in the eutrophying Pamlico Sound system, North Carolina. Ecol. Appl. 17, 88–101. doi: 10.1890/05-0840.1
Passy, P., Gypens, N., Billen, G., Garnier, J., Thieu, V., Rousseau, V., et al. (2013). A-model reconstruction of riverine nutrient fluxes and eutrophication in the Belgian Coastal Zone since 1984. J. Mar. Syst. 128, 106–122. doi: 10.1016/j.jmarsys.2013.05.005
Raaphorst, W. V., and Malschaert, J. F. P. (1996). Ammonium adsorption in superficial North Sea sediments. Cont. Shelf Res. 16, 1415–1435. doi: 10.1016/0278-4343(95)00081-X
Riemann, B., Simonsen, P., and Stensgaard, L. (1989). The carbon and chlorophyll content of phytoplankton from various nutrient regimes. J. Plankton Res. 11, 1037–1045. doi: 10.1093/plankt/11.5.1037
Rixen, T., Baum, A., Wit, F., and Samiaji, J. (2016). Carbon leaching from tropical peat soils and consequences for carbon balances. Front. Earth Sci. 4:74. doi: 10.3389/feart.2016.00074
Seitzinger, S., Harrison, J. A., Böhlke, J. K., Bouwman, A. F., Lowrance, R., Peterson, B., et al. (2006). Denitrification across landscapes and waterscapes: a synthesis. Ecol. Appl. 16, 2064–2090. doi: 10.1890/1051-0761(2006)016[2064:DALAWA]2.0.CO;2
Seitzinger, S. P., Bouwman, A. F., and Kroeze, C. (2010). Preface to special section on Past and Future Trends in Nutrient Export From Global Watersheds and Impacts on Water Quality and Eutrophication. Global Biogeochem. Cycles 24:2. doi: 10.1029/2010GB003851
Seitzinger, S. P., Gardner, W. S., and Spratt, A. K. (1991). The effect of salinity on ammonium sorption in aquatic sediments: implications for benthic nutrient recycling. Estuaries 14, 167–174. doi: 10.2307/1351690
Sempéré, R., and Cauwet, G. (1995). Occurrence of organic colloids in the stratified estuary of the Krka River (Croatia). Estuar. Coast. Shelf Sci. 40, 105–114. doi: 10.1016/0272-7714(95)90016-0
Skoulikidis, N., and Amaxidis, Y. (2009). Origin and dynamics of dissolved and particulate nutrients in a minimally disturbed Mediterranean river with intermittent flow. J. Hydrol. 373, 218–229. doi: 10.1016/j.jhydrol.2009.04.032
Smith, S. V., Swaney, D. P., Talaue-Mcmanus, L., Bartley, J. D., Sandhei, P. T., Mclaughlin, C. J., et al. (2003). Humans, hydrology, and the distribution of inorganic nutrient loading to the ocean. Bioscience 53, 235–245. doi: 10.1641/0006-3568(2003)053[0235:HHATDO]2.0.CO;2
Thomsen, E., Herbeck, L. S., and Jennerjahn, T. C. (2020). The end of resilience: surpassed nitrogen thresholds in coastal waters led to severe seagrass loss after decades of exposure to aquaculture effluents. Mar. Environ. Res. 160:104986. doi: 10.1016/j.marenvres.2020.104986
Tian, L. (2009). Distributions of organic carbon in the east china sea, yellow sea, northeastern Hainan rivers and coasts(in Chinese) [Dissertation/master's thesis], East China Normal University, Shanghai, China.
Unger, D., Herbeck, L. S., Li, M., Bao, H., Wu, Y., Zhang, J., et al. (2013). Sources, transformation and fate of particulate amino acids and hexosamines under varying hydrological regimes in the tropical Wenchang/Wenjiao Rivers and Estuary, Hainan, China. Cont. Shelf Res. 57, 44–58. doi: 10.1016/j.csr.2012.02.014
Vandewiele, S., Cowie, G., Soetaert, K., and Middelburg, J. J. (2009). Amino acid biogeochemistry and organic matter degradation state across the Pakistan margin oxygen minimum zone. Deep Sea Res. II 56, 318–334. doi: 10.1016/j.dsr2.2008.05.035
Vidjak, O., Bojanić, N., Matijevic, S., Grozdan, K., Ninčević Gladan, Ž., Skejic, S., et al. (2012). Environmental drivers of zooplankton variability in the coastal eastern Adriatic (Mediterranean Sea). Acta Adriatica 53, 243–261.
Vrana Špoljarić, I., Novak, T., Gašparović, B., Kazazić, S. P., Canković, M., Ljubešić, Z., et al. (2021). Impact of environmental conditions on phospholipid fatty acid composition: implications from two contrasting estuaries. Aquatic Ecol. 55, 1–20. doi: 10.1007/s10452-020-09805-6
Wang, K., Chen, J. F., Jin, H. Y., Li, H. L., and Zhang, W. Y. (2018). Organic matter degradation in surface sediments of the Changjiang estuary: evidence from amino acids. Sci. Tot. Environ. 637, 1004–1013. doi: 10.1016/j.scitotenv.2018.04.242
Wang, X. C., Ma, H. Q., Li, R. H., Song, Z. S., and Wu, J. P. (2012). Seasonal fluxes and source variation of organic carbon transported by two major Chinese Rivers: the Yellow River and Changjiang (Yangtze) River. Global Biogeochem. Cycles 26:10. doi: 10.1029/2011GB004130
West, A. J., Lin, C. W., Lin, T. C., Hilton, R. G., Liu, S. H., Chang, C. T., et al. (2011). Mobilization and transport of coarse woody debris to the oceans triggered by an extreme tropical storm. Limnol. Oceanogr. 56, 77–85. doi: 10.4319/lo.2011.56.1.0077
Wheatcroft, R. A., Goni, M. A., Hatten, J. A., Pasternack, G. B., and Warrick, J. A. (2010). The role of effective discharge in the ocean delivery of particulate organic carbon by small, mountainous river systems. Limnol. Oceanogr. 55, 161–171. doi: 10.4319/lo.2010.55.1.0161
Wu, G. J., Cao, W. Z., Huang, Z., Kao, C. M., Chang, C. T., Chiang, P. C., et al. (2017). Decadal changes in nutrient fluxes and environmental effects in the Jiulong River Estuary. Mar. Pollut. Bull. 124, 871–877. doi: 10.1016/j.marpolbul.2017.01.071
Wysocki, L. A., Bianchi, T. S., Powell, R. T., and Reuss, N. (2006). Spatial variability in the coupling of organic carbon, nutrients, and phytoplankton pigments in surface waters and sediments of the Mississippi River plume. Estuar. Coast. Shelf Sci.69, 47–63. doi: 10.1016/j.ecss.2006.03.022
Yang, Z. H., Jia, J. J., Wang, X. K., and Gao, J. H. (2013). Characteristics and variations of water and sediment fluxes into the sea of the top three rivers of Hainan in recent 50 years. Mar. Sci. Bull. 32, 92–99.
Zhang, J., Wang, D. R., Jennerjahn, T., and Dsikowitzky, L. (2013). Land–sea interactions at the east coast of Hainan Island, South China Sea: a synthesis. Cont. Shelf Res. 57, 132–142. doi: 10.1016/j.csr.2013.01.004
Zhang, J., Zhang, Y., Zhang, P., Li, Y., Li, J., Luo, X., et al. (2021). Seasonal phosphorus variation in coastal water affected by the land-based sources input in the eutrophic Zhanjiang Bay, China. Estuar. Coast. Shelf Sci. 252:107277. doi: 10.1016/j.ecss.2021.107277
Zhang, P., Ruan, H., Dai, P., Zhao, L., and Zhang, J. (2020). Spatiotemporal river flux and composition of nutrients affecting adjacent coastal water quality in Hainan Island, China. J. Hydrol. 591:125293. doi: 10.1016/j.jhydrol.2020.125293
Zhu, Z.-Y., Liu, S.-M., Wu, Y., Li, Y., Zhang, J., and Hu, J. (2015). Phytoplankton dynamics and its further implication for particulate organic carbon in surface waters of a tropical/subtropical estuary. Estuar. Coasts 38, 905–916. doi: 10.1007/s12237-014-9866-6
Zhu, Z. Y., Wu, Y., Zhang, J., Dittmar, T., Li, Y., Shao, L., et al. (2014). Can primary production contribute non-labile organic matter in the sea: amino acid enantiomers along the coast south of the Changjiang Estuary in May. J. Mar. Syst. 129, 343–349. doi: 10.1016/j.jmarsys.2013.07.018
Ziouch, O. R., Laskri, H., Chenaker, H., Ledjedel, N. E., Daifallah, T., and Ounissi, M. (2020). Transport of nutrients from the Seybouse River to Annaba Bay (Algeria, SW Mediterranean). Mar. Pollut. Bull. 156:111231. doi: 10.1016/j.marpolbul.2020.111231
Keywords: dissolved inorganic nitrogen, particulate organic carbon, particulate nitrogen, amino acids, pigments, estuary, Krka, Wenchang
Citation: Hao Y-Y, Zhu Z-Y, Fang F-T, Novak T, Čanković M, Hrustić E, Ljubešić Z, Li M, Du J-Z, Zhang R-F and Gašparović B (2021) Tracing Nutrients and Organic Matter Changes in Eutrophic Wenchang (China) and Oligotrophic Krka (Croatia) Estuaries: A Comparative Study. Front. Mar. Sci. 8:663601. doi: 10.3389/fmars.2021.663601
Received: 03 February 2021; Accepted: 26 July 2021;
Published: 24 August 2021.
Edited by:
Jun Sun, China University of Geosciences Wuhan, ChinaReviewed by:
Xiaolin Li, Xiamen University, ChinaG. V. M. GUPTA, Centre for Marine Living Resources and Ecology (CMLRE), India
Jadran Faganeli, Marine Biology Station Piran, National Institute of Biology, Slovenia
Copyright © 2021 Hao, Zhu, Fang, Novak, Čanković, Hrustić, Ljubešić, Li, Du, Zhang and Gašparović. This is an open-access article distributed under the terms of the Creative Commons Attribution License (CC BY). The use, distribution or reproduction in other forums is permitted, provided the original author(s) and the copyright owner(s) are credited and that the original publication in this journal is cited, in accordance with accepted academic practice. No use, distribution or reproduction is permitted which does not comply with these terms.
*Correspondence: Zhuo-Yi Zhu, emh1LnpodW95aUBzanR1LmVkdS5jbg==; emh1LnpodW95aUAxNjMuY29t