 Merrill B. Rudd
 Jason M. Cope
 Chantel R. Wetzel
 James Hastie2
- 1Scaleability LLC, Seattle, WA, United States
- 2Fishery Resource Analysis and Monitoring Division, Northwest Fisheries Science Center, National Marine Fisheries Service, National Oceanic and Atmospheric Administration, Seattle, WA, United States
Many fisheries in the world are data-moderate, with data types (e.g., total removals, abundance indices, and biological composition data) of varied quality (e.g., limited time series or representative samples) or available data. Integrated stock assessments are useful tools for data-moderate fisheries as they can include all available information, can be updated due to the availability of more information over time, and can directly test the inclusion and exclusion of specific data types. This study uses the simulation testing and systematic data reduction from the US West Coast benchmark assessments to examine the performance of Stock Synthesis with catch and length (SS-CL) compositions only. The simulation testing of various life histories, recruitment variabilities, and data availability scenarios found that the correctly specified SS-CL can estimate unbiased key population quantities such as stock status with as little as 1 year of length data although 5 years or more may be more reliable. The error in key population quantities is decreased with an increase in years and the sample size of length data. The removal of the length compositions from benchmark assessments often caused large model deviations in the outputs compared to the removal of other data sources, indicating the importance of length data in integrated models. Models with catch and length data, excluding abundance indices and age composition, generally provided informative estimates of the stock status relative to the reference model, with most data scenarios falling within the CIs of the reference model. The results of simulation analysis and systematic data reduction indicated that SS-CL is potentially viable for data-moderate assessments in the USA, thus reducing precautionary buffers on catch limits for many stocks previously assessed in a lower tier using catch-only models. SS-CL could also be applied to many stocks around the world, maximizing the use of data available via the well tested, multifeature benefits of SS.
Introduction
Fisheries vary in data quantity and quality, which affect the amount of information used for stock status information. An integrated stock assessment framework can include all the available information and can be updated due to the availability of more information available over time. Stock Synthesis (SS; Methot and Wetzel, 2013) is an example of an integrated stock assessment framework that allows for flexible approaches to data treatment. This ranges from “data-rich” applications, with a full complement of catch, abundance index, and biological data (mainly length and/or age compositions), to “data-limited” applications, which typically include only one of the abovementioned information inputs. Many fisheries worldwide fall in the “data-moderate” category, where one of catch, abundance index, or biological compositions is unavailable (Thorson and Cope, 2015; Wetzel and Punt, 2015; Dichmont et al., 2021). Each category may be further limited if the available data types cover only a limited time series, have only a limited sample size, or are not fully representative of the stock (Booth and Quinn, 2006). Data type, data quality, and the representativeness of the stock affect the type of model that could reasonably be applied to infer stock status, the degree of uncertainty in the estimates of stock status, and the consideration of the level of a precautionary buffer when making management decisions.
Data-moderate cases often lean on the data-limited approaches that require specific, limited inputs, which may ignore auxiliary data types or make unnecessary simplifying assumptions leading to high uncertainties in population estimates. Important data such as biological composition may be ignored to fit the mold of specific data-limited modeling approaches when an abundance index is not available. Length compositions are a key input to most stock assessments as the information is easier to obtain compared to ages, and thus being a main source of recruitment and spawning potential information (Thorson et al., 2019). It is also typically believed that many fisheries use a length-selective gear, therefore lengths are essential for estimating gear selectivity and fishing intensity (Parma and Deriso, 1990; Punt et al., 2014). Some catch-only methods have been extended to include biological compositions as they become available (Thorson and Cope, 2015), and length-only methods have explored the inclusion of catch data if available to estimate population size (Rudd and Thorson, 2018). The amount of length composition needed is not well understood and may also depend on life history characteristics (Minte-Vera et al., 2017), thus assessments with catch and length and with no abundance index are not widely used in management jurisdictions where catch limits are required.
When stock assessments are based on limited data, a precautionary approach to management would warrant additional buffers to catch limits and other management options. To address this issue, the Scientific and Statistical Committee (SSC) of the Pacific Fishery Management Council defined three broad assessment categories, each with an associated allowable biological catch (ABC) buffer defined by a model uncertainty. This ABC buffer defines the percentage reduction of the overfishing limit (OFL), which is a catch level that corresponds to the maximum sustainable yield of the stock. The OFL is meant to be a level beyond the catch threshold, which would likely to result in overfishing (NOAA, 2021). Category 1 (“data-rich” or “full”) assessments estimate the OFL using a mixture of data types, including total catch, abundance indices or surveys, and length and/or age composition data. On the other side of the data spectrum, category 3 (“data limited”) stock assessment methods estimate the OFL using catch, life history parameters, and a prior on relative stock abundance in a specific year of the time series (Dick and MacCall, 2011; Cope, 2013). Current data-limited methods for category 3 stocks do not include abundance indices or biological compositions that would inform stock status over time (Thorson and Cope, 2015). To date, category 2 (“data-moderate”) assessments approved by the Pacific Fishery Management Council SSC were developed using specific data-moderate approaches for the West Coast groundfish stocks. These data-moderate assessments are to combine catch-based methods using an abundance index, excluding biological composition data (Cope et al., 2013; Wetzel and Punt, 2015). A key difference between categories 3 and 2 assessments is that category 3 assessments are meant as an objective approach to set sustainable catch limits based on catch-only approaches without estimating stock status. With the inclusion of an abundance index, category 2 assessments may track stock responses to management intervention. Therefore, category 2 assessments may also include prior information on relative stock abundance that should be updated from the data (if not, then they are functionally a category 3 assessment in which the data are not used to inform current stock status). Data-moderate models also may not necessarily estimate recruitment deviations due to the lack of information on age classes typically held within biological compositions (Cope et al., 2015).
To date, stocks with catch or length and with no abundance index would be relegated to data-limited assessments with additional uncertainty buffers that may not be necessary if biological composition data could be included in an integrated model with catch data. This is important because category 3 assessments have higher uncertainty buffers than category 2 assessments. However, abundance indices are not always informative about the population. In some cases, data-rich stock assessment results may show a little change to the reference model outputs with the exclusion of an abundance index (Wetzel et al., 2017). These assessment sensitivity results observationally suggest a reliance mainly on catch and compositional data only for some data-rich stock assessments, and thus offering evidence that catch and length only models can be adequate to inform management metrics. Further, in situations of assessing more stocks than possible at one time, it may be of a strategic interest to perform catch and length assessments for the stocks that are minor targets or are believed to be at high abundance, rather than spending limited resource capacity to prepare data types and perform a full assessment with every available data source.
This study focuses on the performance of estimating key population quantities such as stock status in SS models with catch and length (SS-CL) data only in a maximum likelihood context. Firstly, we used the simulation testing to evaluate the performance of SS-CL under a variety of life histories and data permutations. We then removed data from current U.S. West Coast groundfish benchmark stock assessments to explore how sensitive the benchmark assessments are to the removal of different data types reducing down to catch and length data only, specifically focusing on the amount of length composition data used. Removing data sources is a commonly applied approach in stock assessment analyses to understand the influence and or potential contradictory information providing a way of measuring how data conditioning affects the model outputs (Cope et al., 2015). Both approaches, simulation and conducting sensitivities to benchmark stock assessments, provide unique ways to evaluate the use of different applications of length and catch models for consideration as an additional data-moderate stock assessment method for application to stocks off the U.S. West Coast, and for the general use of integrated stock assessment models worldwide in data-moderate contexts.
Materials and Methods
The use of SS with catches and length composition only requires a very few adjustments from the applications that include an abundance index. Models may include multiple fleets, sexes, or other dynamics that have been already included as the features in SS. Catches range from the first to the last year of the model and are assumed known without error. Length compositions are assumed to be representative of their respective fleet, sex, etc. Life history values such as the productivity of stock (steepness), growth parameters, natural mortality, fecundity, and maturity are generally prespecified rather than being estimated though the estimation could be possibly dependent on the length data quantity and/or quality. Recruitment can be estimated by following standard bias correction procedures. Selectivity parameters can be estimated or fixed. Data weighting is needed for models with multiple fleets and would follow the standard procedures for other SS models (Punt, 2017).
Simulation Testing
Operating Model
We used SS as an operating model to simulate “true” populations and generate data based on the approach developed in the R package ss3sim (Anderson et al., 2014). The ss3sim approach involves inputting a set of “true” life history values, fishing mortality time series, and recruitment deviations, then generating population trajectories by running the SS model without calculating the Hessian matrix for SDs. This serves to include age-structured population dynamics and stochasticity to generate all true values for the population.
We developed four life history scenarios based on the West Coast groundfish stocks that varied in longevity (e.g., how long they live) and the individual growth rate (e.g., how much of their lives are spent at their maximum size). The shorter-lived life history type had a natural mortality rate (M) of 0.18 for an approximately maximum age of 30 years, whereas the longer-lived life history type had an M of 0.09 for an approximately maximum age of 60 years (Hamel, 2015). We considered slower- and faster-growing options for the shorter- and longer-lived life history types by adjusting the von Bertalanffy growth coefficient (k). We chose the values of k associated with reaching the asymptotic length at 90% of the maximum age (slower-growing) and 50% of the maximum age (faster-growing). We confirmed that the M/k ratios were close to 1.0 and 0.60 for the slower-growing life history types and for the faster-growing life history types, respectively as these M/k ratios are representative for the West Coast groundfish stocks assessed through 2018 (Figure 1, Supplementary Table 1). We kept the asymptotic length constant at 55 cm and assumed that the length at 50% maturity was equal to 66% of the asymptotic length (i.e., 36.3 cm) for all life history types (Cope and Punt, 2009). Selectivity was constant over scenarios and time using the double-normal selectivity function to represent logistic selectivity assuming a peak selectivity at 42 cm. Parameter values used for each of the four life history types are available in Table 1, and growth curves are shown in Supplementary Figure 1.
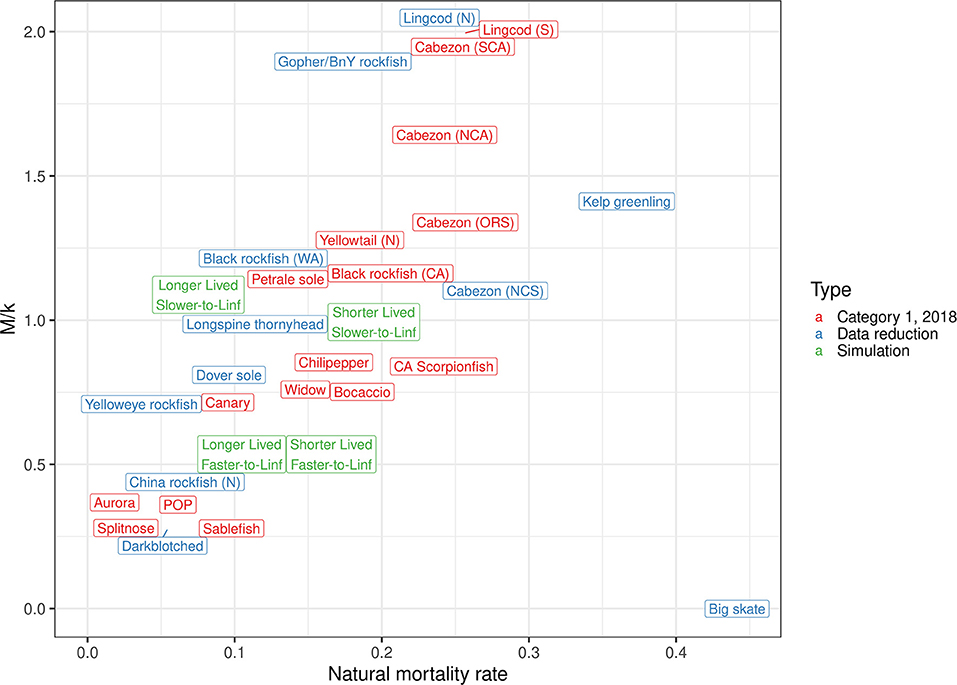
Figure 1. Natural mortality rate (M) compared with the ratio of M to von Bertalanffy growth coefficient k (M/k) for various groundfish species.

Table 1. Parameter values used to develop life history scenarios in the operating model.
We input the fishing mortality time series based on a time series of the ratio of the fishing mortality rate to the fishing mortality rate associated with MSY (F/FMSY) shared across life history types. After reviewing the fishing mortality rate time series from the US West Coast stocks, we identified a general pattern of low exploitation before World War II, then the exploitation rate increases after World War II until the 1980s or 1990s. After remaining at a high exploitation rate in the 1990s, the exploitation rate declines through the present (Figure 2). To mimic this pattern, we assumed that the F/FMSY ratio remained relatively low for the first 25 years, increasing from 0.01 to 0.05, then increased more rapidly from 0.05 to 2 over the next 30 years. The F/FMSY ratio remained at 2 for 5 years, then decreased from 2 to 0.6 over the next 20 years, and remained at 0.6 for the last 20 years of the time series. We then scaled this F/FMSY ratio using the FMSY for each life history type. FMSY was calculated by finding the constant F-value that maximizes long-term catch. FMSY was 0.08 for both longer-lived life histories, whereas FMSY was 0.17 and 0.16 for the shorter-lived, faster-growing life history type and the shorter-lived, slower-growing life history type, respectively (Table 1). The catch time series was calculated within the operating model based on the input fishing mortality rate time series and the scale of the population (Supplementary Figure 2).
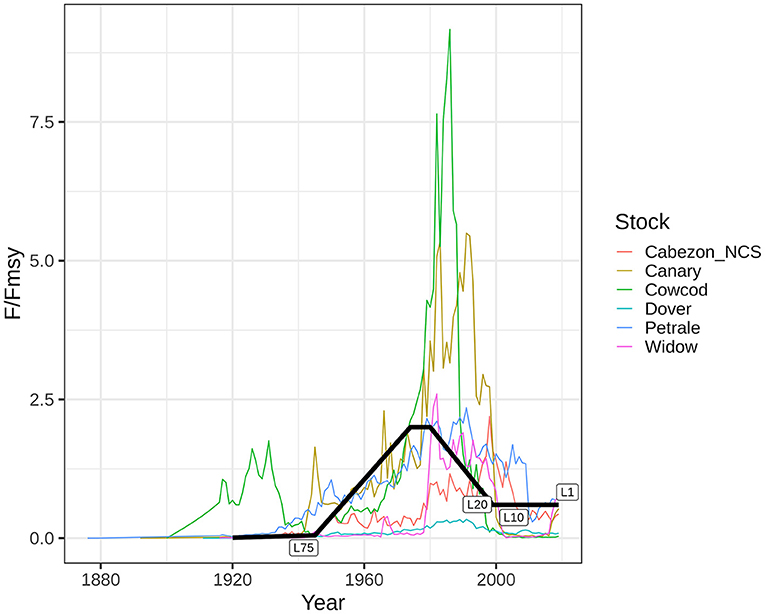
Figure 2. Ratio of estimated fishing mortality rate to FMSY for the six West Coast stocks, which informed the shape of our chosen F/FMSY time series on which the simulated fishing mortality rate scenario is based. The simulated F/FMSY series is labeled where the length data are included: for 75, 20, 10, and 1 year of data.
Recruitment followed an underlying Beverton–Holt stock-recruit curve with steepness (h) equal to 0.7 and a recruitment SD of 0.8, on the higher side for West Coast species (Supplementary Table 1). We compared a high recruitment variability scenario to a lower recruitment variability scenario, with the SD of 0.4. The log of equilibrium recruitment was assumed to be constant at 10.0. Simulation replicates were varied by the input recruitment deviates; the time series of recruitment deviates for each simulation replicate was identical across life history types (Supplementary Figures 3, 4).
Data Scenarios
Each true population determined by a life history type, a recruitment variability, and a simulation replicate was then subjected to data availability scenario tests based on the number of samples of length data annually and the number of years of length data included in the model. We generated the observation data from the operating model population by sampling of the expected data.
To test the ability of SS to estimate the key parameters of interest with catch and length data alone, we included a “perfect” catch and length scenario. The “perfect” scenario assumed that the length composition data was known perfectly over 100 years with an input sample size of 1,000 lengths per year. The “perfect” scenario was used to make sure that any biases in scenarios with catch and length data only were due to the limitation of sample size or recruitment variability, rather than structural inconsistencies between the observation and estimation models. For all other length data scenarios of interest, we used the samples from the length composition with either 200 samples (representing a moderate sample size) or 50 samples (representing a limited sample size) per year using a multinomial distribution. We tested an additional scenario where the length data sample size decreased over time, specifying 200 samples per year before the year 88 and 50 samples from the years 88–100.
For each sample size scenario, we also explored the number of years of length data included in the model. From the sampled data, we considered the inclusion of the final (a) 75, (b) 20, (c) 10, (d) 5, and (e) 1 year of the sampled length data. We tested a decline in the sample size over time only with the 20-year length data scenario. The approach of a subset of the number of years after the data were generated allowed us to directly compare the number of years of length data included in the model, rather than any stochastic association with the resampling of the length composition for each independent scenario.
Estimation Model
For all scenarios, we assumed that the catch was known without any error based on the input fishing mortality time series. We used SS 3.30.14 to test the model under various simulation scenarios. The estimated parameters included the recruitment deviations, log of equilibrium recruitment log(R0), and two selectivity parameters governing the shape and peak of the left side of the double-normal selectivity curve. We fixed natural mortality, growth parameters, steepness, and the recruitment SD to their true values.
We also ran sensitivity tests assuming that the natural mortality rate was 10% lower and higher than the truth (0.081 and 0.099 compared with the true value of 0.09), the asymptotic length was 10% lower and higher than the truth (49.5 and 60.5 cm compared with the true value of 55 cm), and the coefficient of variation (CV) around the growth curve was 25% lower and higher than the truth (0.075 and 0.125 compared to the true value of 0.1) for the “perfect” scenario to understand the expected patterns.
The first year of estimated recruitment deviates was the maximum age subtracted from the first year of length data, starting in year 1 if length data is available before year 29 (based on the longevity of the short-lived life history being 30 years). To determine the final year of estimated recruitment deviates, we identified the age associated with 5% selectivity for each life history type, and subtracted that age from the final year in the model. For example, the short-lived, slow-growing life history type reached 5% selectivity at age three, so the final year of estimated recruitment deviates was 97 out of 100 (Table 1). To prevent the biased estimates of the spawning output in the early years of the time series, we allowed for the estimation of early recruitment deviates starting 30 years before the first year of removals by the fishery.
We used the iterative procedure developed by Methot and Taylor (2011) to account for the bias adjustment in estimated recruitment deviates. We first ran SS to calculate the Hessian matrix, then the bias ramp parameters were estimated based on the model estimates from the first run. We then input the bias ramp parameter estimates and reran the model without calculating the Hessian matrix to speed up the simulation model runs. We used the bias-adjusted model estimates to compare across scenarios to mimic the model parameter estimation that would take place using SS-CL in practice. In subsequent steps, the Hessian matrix on the second run could be estimated to explore the characterization of the uncertainty of individual model runs for length data scenarios.
Performance Metrics
We determined the convergence rate of each scenario defined by the maximum final parameter gradient <1.0 and the maximum likelihood estimate of the log of unfished recruitment log(R0) <12.0 to ensure that the population is estimated to be a reasonable size (e.g., the failed model convergence that would likely to be due to the selection of a bad starting value via jitter rather than the inability to estimate the population size). From the converged runs, we calculated the relative error for key population quantities for each of 100 simulation replicates. Relative error was calculated as:
where ES is the estimated value and ER is the true value for the simulation study. We used “bias” to describe the accuracy of the estimator, calculated as the median relative error (MRE). We used “error” to describe the precision around a parameter estimate, which is calculated as the median absolute relative error (MARE; Ono et al., 2012).
Systematic Data Reduction in Benchmark Stock Assessments
A subset of West Coast groundfish stocks with the existing full assessments were selected for data explorations (Table 2). The selected stock encompasses a range of life histories (e.g., flatfishes, roundfishes, elasmobranchs, and rockfishes), exploitation (e.g., recreational or commercial fisheries), and data availability [e.g., catch-per-unit-effort (CPUE) indices, fishery-independent indices, and length and age compositions]. Each assessment also presents variable amounts of data quality and quantity within each data type, thus there is no ability to standardize the data within the data scenarios.
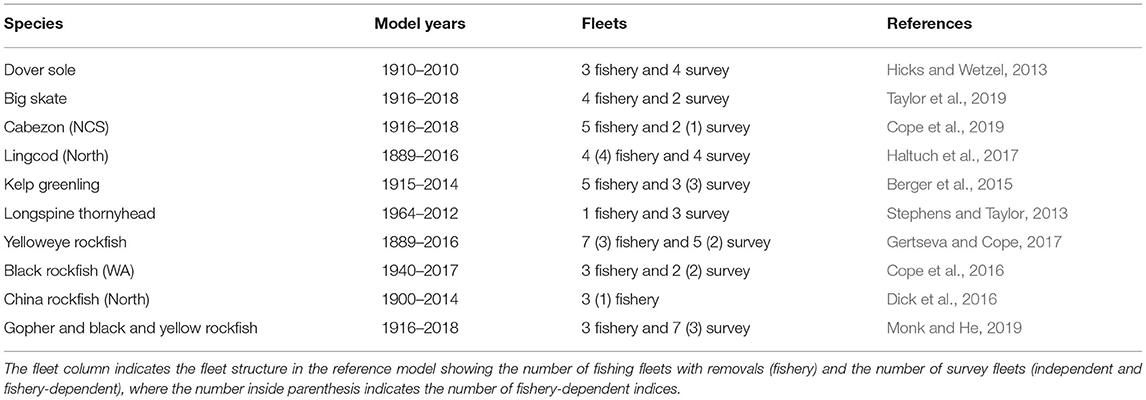
Table 2. List of West Coast groundfish stock assessments evaluated.
To generate appropriate data scenario comparisons to the full assessments, a number of steps were taken based on the data scenario. The archived assessment for each of the listed assessment years for each of the stocks in Table 2 is used as a starting point for analysis. A select group of the archived assessment was then converted to SS v.3.30.15 (Dover sole, longspine thornyhead, and kelp greenling) for the ease of exploration with the converted model compared to the original model to ensure similar estimates and model performance. All biological parameters were fixed across the scenarios to limit the effects of an aberrant parameter estimation as it is possible to estimate those parameters outside the model while allowing selectivity and recruitment deviations (if estimated) to remain estimated (parameters not typically estimated outside the models). Additionally, in case of their presence in the model, the retention parameters governing the length of individuals were retained in case of capture and were fixed at the MLE estimates to avoid variances in the estimates of total mortality among the runs. Next, each of the full assessments was run with the full Hessian and reweighted according to the Francis data weighting approach (Francis, 2017). This step was performed due to the assessments ranging over a period of time when model weighting approaches were evolving. Additionally, because the scenarios were aimed to explore the sensitivity of the model to data, applying the appropriate data weighting within each scenario was considered as essential. The reweighted full assessment model was termed as the “reference” model.
Model Treatments
Seven data scenarios relative to the reference model were conducted. Each of the scenarios and the steps applied in their generation were as follows:
1. Removal of all indices (“-Indices”): The likelihood contribution for all indices in the model was set equal to zero. The data remaining in the model were the catches, lengths, and ages that were available in the reference model.
2. Removal of all lengths (“-Lengths”): The likelihood contribution for all length data in the model was set equal to zero. The data remaining in the model were the catches, indices, and ages that were available in the reference model.
3. Removal of all ages (“-Ages”): The likelihood contribution for all age data in the model was set equal to zero. The data remaining in the model were the catches, indices, and lengths that were available in the reference model.
4. “Only lengths”: The likelihood contribution for all indices and age data in the model was set equal to 0. The data remaining in the model were the catches and lengths that were available in the reference model.
5. “Lengths 20 years”: The likelihood contribution for all indices and age data in the model was set equal to zero and all length data prior to 20 years before the final model year were removed. The data remaining in the model were the catches from all years and length data from the last 20 years of the model. If the reference model had selectivity blocks applied to fleet selectivity (could be a survey or fishery) that were outside the new length data range, those parameters were fixed at the reference model MLE estimate.
6. “Lengths 10 years”: It exhibited the same setup as described above for the “Lengths 20 years” scenario but its lengths were reduced to the value in the last 10 years of the model.
7. “Lengths 1 year”: It exhibited the same setup as described above in the previous two length-based scenarios but with only retaining the final year length data.
Performance Metrics
The performance of each data scenario was evaluated using the measure of relative error in the four estimated quantities: (1) unfished spawning output, (2) spawning output in the final year, (3) stock status (i.e., the fraction of an unfished spawning output) in the final year, and (4) the OFL value for the first projection year calculated within SS due to the association of the catch with FMSY. The relative error was calculated from Equation (1), where Es is the estimated quantity from the data scenario s and ERis the estimate from the full reference model. The 95% CI of the relative error is also provided to indicate whether a given scenario would be found within the estimated uncertainty of reference models. Those scenarios that do fall outside those bounds would be indicative of a more significant departure from the reference model.
Results
Simulation Testing
Stock Synthesis models with catch and length data converged at high rates across scenarios. The highest rates of non-convergence occurred for scenarios with a single year of length composition, particularly with only 50 samples of length per year (Supplementary Table 2). We verified that 100 simulation replicates were enough to quantify the bias and error by checking that the MRE reached an asymptote after 100 simulation replicates (Supplementary Figure 5).
The “perfect information” scenario, where the length composition was known perfectly for all 100 years, confirmed that SS estimated unbiased and precise key population quantities across 100 simulation replicates with both a high and low recruitment variability when excluding an abundance index and age composition (Figure 3, Supplementary Tables 3–6). The unbiased perfect information scenario under a high and low recruitment variability led us to assume that any breakdown in the bias or error under alternative sampling scenarios was due to the limited number of samples and the number of years of length data included in the model.
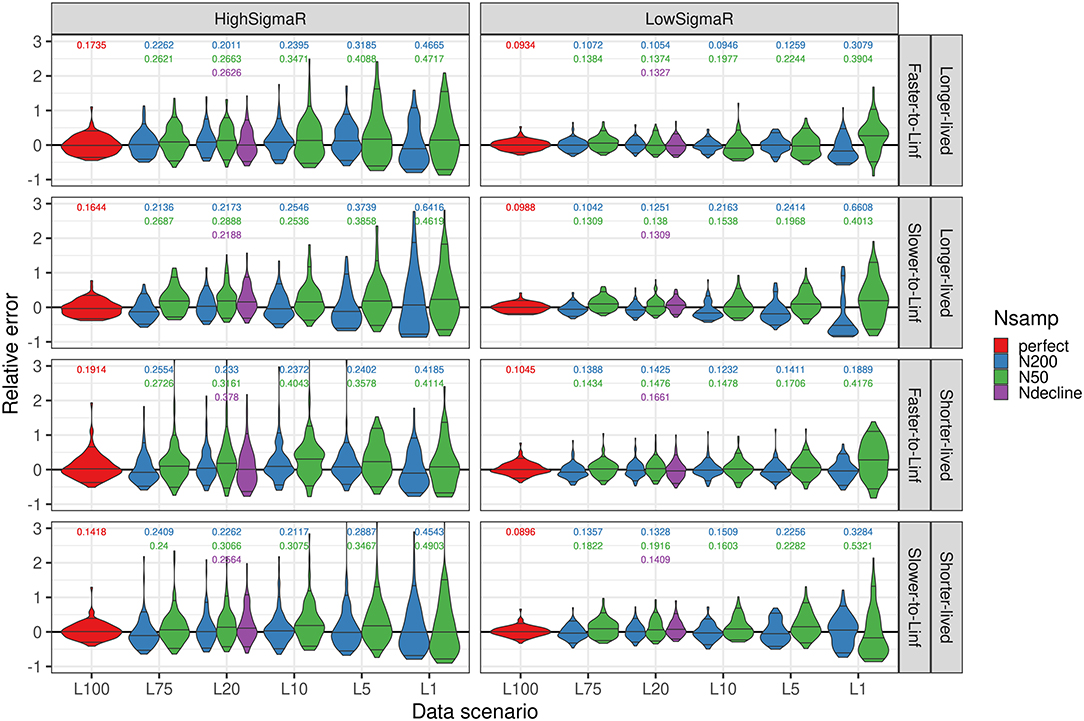
Figure 3. Distribution of relative err or (estimated – true)/true for the fraction unfished in the terminal year across simulation replicates, life history, and recruitment variability scenarios, with the number of years of length data on the x-axis and color indicating the sample size of length data (“perfect” indicates the length data that is known without error and “Ndecline” is a decline from 200 to 50 samples over the last 20 years of the series). Lines in the violin plots show the median and 90th quantiles, which are generally centered at zero with some variabilities with fewer years of length data. The values above each violin plot show the median absolute relative error (MARE), where there are multiple values, the top value corresponds to N = 200 samples annually, the next corresponds to N = 50 samples annually and with 20 years of length data, and the third value corresponds to a declining N from 200 to 50 samples over the time series of length compositions.
The bias increased only marginally with a decrease in the years of length data and sample size. Under the lower recruitment variability scenario, the bias in the terminal year fraction unfished was mostly affected with a single year of length data for the longer-lived life history types, or with a low sample size and single year of length data across life history types (Supplementary Table 3). With a higher recruitment variability, the bias pattern with a decrease in years of length data was more ambiguous; compared with fewer years of length data, some scenarios with 75 years of length data were more biased in the terminal year of fraction unfished (Figure 3, Supplementary Table 4).
The error increased with a decrease in years and a lower sample size of length data, and was higher with a higher recruitment variability (Figure 3, Supplementary Tables 5, 6). The error increased the most when paring down from 5 to 1 year of length data for low recruitment variability scenarios, and a high recruitment variability with a sample size of 200 lengths per year (Figure 3, Supplementary Tables 5, 6). With a higher recruitment variability and a low sample size, the increase in error was most pronounced with 5 or 10 years of length data (Figure 3, Supplementary Table 6).
A decline in the sample size from 200 to 50 samples over 20 years had an intermediate bias and error to the scenarios with constantly 200 or 50 samples per year. The bias was <16% with a high recruitment variability and <10% with a low recruitment variability for all life history scenarios in a decline of the sample size scenario (Supplementary Tables 3, 4). The error was <38% with a high recruitment variability and <17% with a low recruitment variability across life history scenarios (Supplementary Tables 5, 6).
There were no significant patterns in the bias or error between life history scenarios. The shorter-lived, and particularly faster-growing, life history types had some higher rates of model non-convergence with fewer years of length data compared with the longer-lived life history types (Supplementary Table 2). While the bias and error were higher for some combinations of life history type, recruitment variability, sample size of lengths, and the number of years of length data, none of the patterns held constant across scenarios to properly tease apart the impacts directly related to the life history type (Supplementary Tables 3–6).
When the natural mortality rate was assumed to be 10% lower than the truth, the estimates of a fraction of unfished were biased to be lower than the truth (i.e., the stock assessment would be conservative in the estimates of stock status). The opposite was true when the natural mortality rate was assumed to be 10% higher than the truth (i.e., the stock assessment would assume that the stock biomass was higher than the truth). When the asymptotic length was assumed to be 10% greater than the truth, the fraction unfished in the last year of data was estimated to be lower than the truth. In this case, the stock assessment would be conservative in the estimates of stock status. Conversely, when the asymptotic length was assumed to be 10% less than the truth, the fraction unfished was estimated to be greater than the truth, overestimating the view of stock status (Figure 4). However, in this case, 54% of the model runs did not converge, a phenomenon that did not occur when the asymptotic length was mis-specified higher than the truth. Issues on model convergence would indicate to analysts that some fixed values, such as asymptotic length, may not be correct. Mis-specifying the CV around the growth curve to be lower than the truth did not impact the bias or error in the estimates of the fraction unfished in the last year of data. However, assuming that more variation around the growth curve led to underestimates of the fraction unfished and more conservative estimates of stock status (Figure 4).
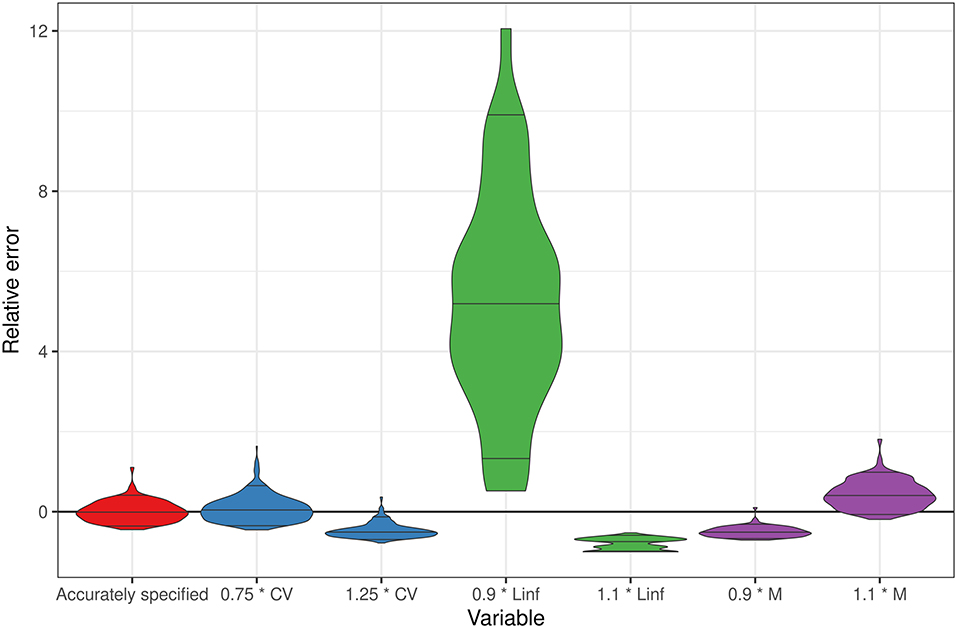
Figure 4. Distribution of relative error (estimated – true)/true for the fraction unfished in the terminal year across simulation replicates for the longer-lived, faster-growing life history scenario under a high recruitment variability. All models assume 100 years of length data are perfectly specified, comparing a bias and an error when the CV of the growth curve is mis-specified by ±25%, the asymptotic length (Linf) is mis-specified by ±10%, and the natural mortality rate is mis-specified by ±10%.
Systematic Data Reduction in Benchmark Stock Assessments
There are several caveats to be mindful of when interpreting these results. Each data inclusion scenario is within an assessment that shows variable levels of a consistent or inconsistent signal among data types, as well as how much each data type in the reference model is weighted. Each truncated length scenario represents a different amount of the total available length data. Additionally, the level of sampling in the most recent years of data is also highly variable among the stocks. Lastly, the model structure assumed across data scenarios (e.g., estimated vs. fixed parameters) likely do not fully reflect the decisions an assessment author may possibly make when faced with the data remaining for a real world assessment. The results are structured first within species categories as those often share common data issues, then general result patterns are provided and the relative error for the unfished spawning output, the final spawning output, the final fraction unfished, and the OFL are shown for all species in Figures 5, 6.
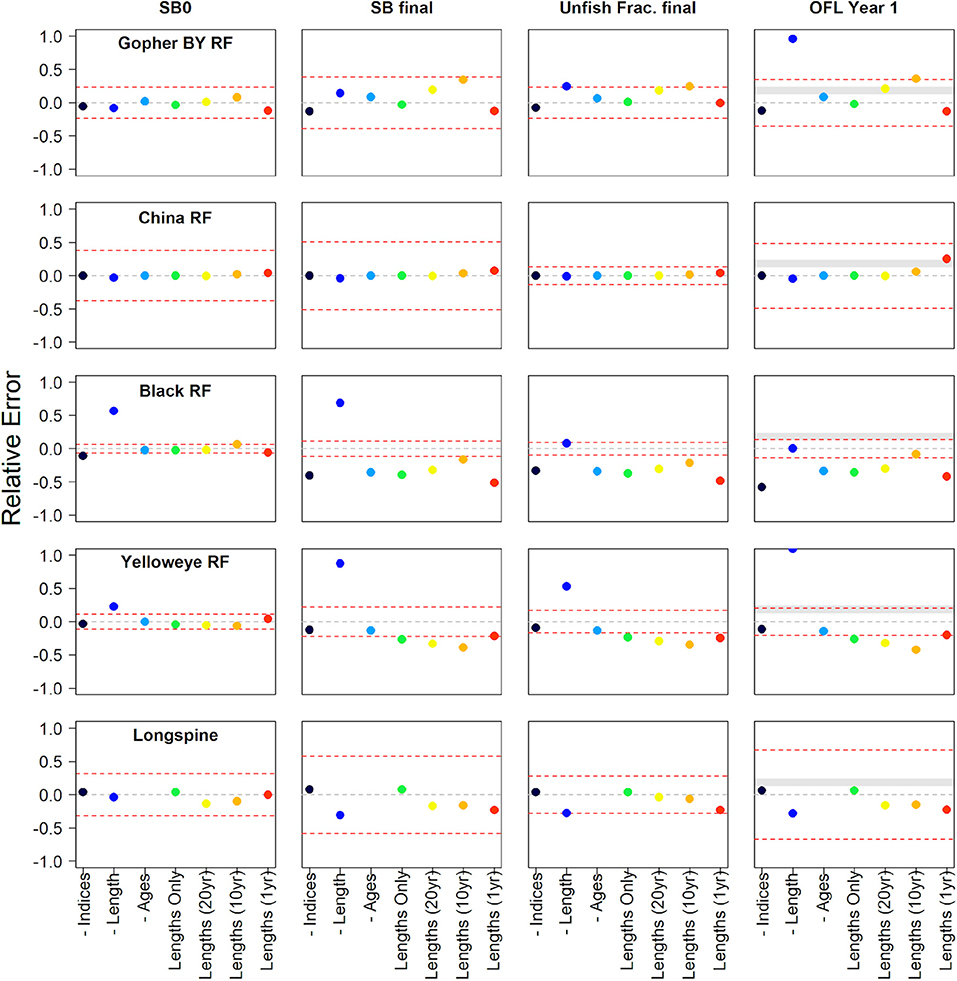
Figure 5. The relative error of unfished spawning biomass, final model year spawning biomass, final model year fraction of unfished spawning biomass, and the first overfishing level estimated from each data scenario compared against the reference model for nearshore rockfish, slope rockfish, and slope scorpaenids. The data scenarios either remove specific data from the assessment model indicated by “-” (e.g., -Indices are model results with all indices removed) or only use specific amounts of length data (e.g., “Lengths (20yr)” has the 20 years of length data at the end of the modeled period). The dashed gray line identifies the zero line and the dashed red lines identify the 95% confidence interval from the reference model for each of the estimated quantities. The gray banded area on the OFLs indicates the area between a category 2 sigma of 1.0 and either a P* (called P-star) value of 0.45 or 0.45 (buffer = 0.874 vs. 0.761) translated into relative error (0.126–0.238) where the resulting Acceptable Biological Catch if based on the estimated OFL would be greater than the OFL of the reference model.
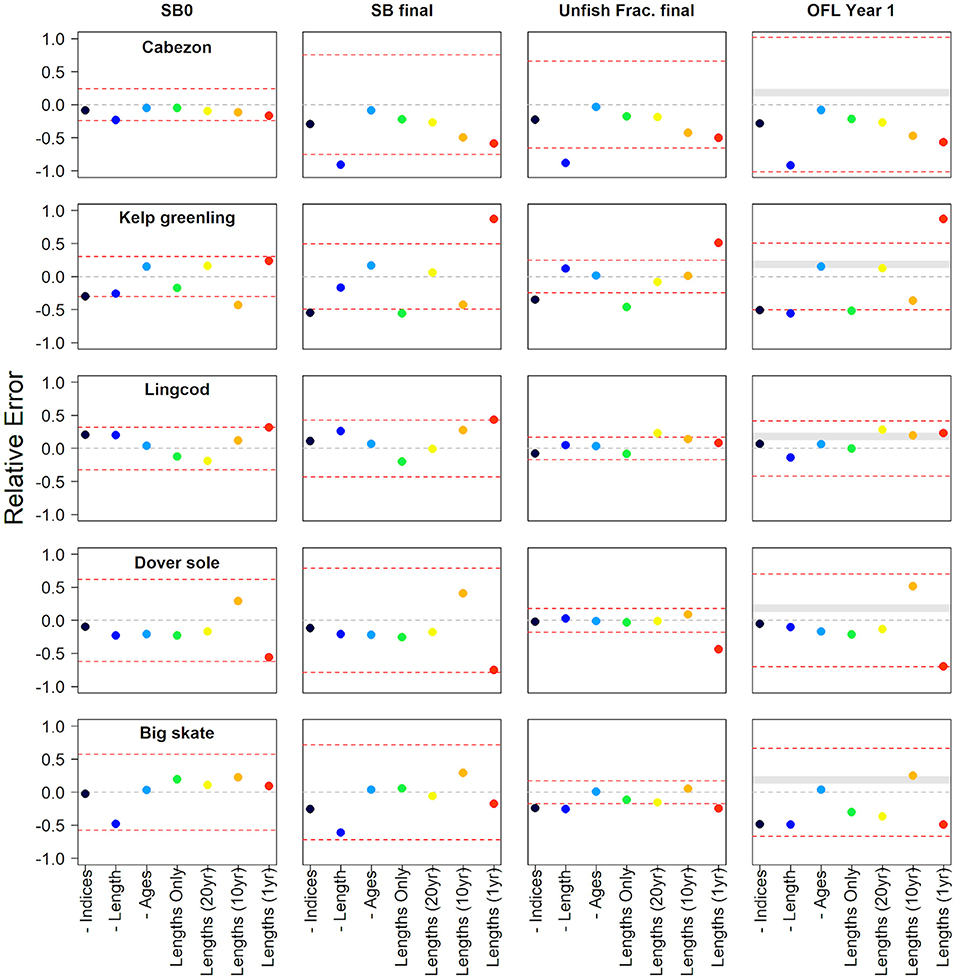
Figure 6. The relative error of unfished spawning biomass, final model year spawning biomass, final model year fraction of unfished spawning biomass, and the first overfishing level estimated from each data scenario compared against the reference model for nearshore roundfishes, flatfish, and elasmobranch. The data scenarios either remove specific data from the assessment model indicated by “-” (e.g., -Indices are model results with all indices removed) or only use specific amounts of length data (e.g., “Lengths (20yr)” has the 20 years of length data at the end of the modeled period). The dashed gray line identifies the zero line and the dashed red lines identify the 95% confidence interval from the reference model for each of the estimated quantities. The gray banded area on the OFLs indicates the area between a category 2 sigma of 1.0 and either a p* (called P-star) value of 0.45 or 0.45 (buffer = 0.874 vs. 0.761) translated into relative error (0.126–0.238) where the resulting Acceptable Biological Catch if based on the estimated OFL would be greater than the OFL of the reference model.
The performance and stability of models with only length and catch data were better with fewer fleets. Most data scenarios fell within the CIs of the reference benchmark assessment model considered by management as the availability of the best scientific information. Spawning output in the last year of the model and the OFL tended to be most sensitive to the data removal of all model outputs considered. The removal of length composition from the assessment often caused large model deviations in the outputs compared to the removal of other data sources. Models with only length compositions tended to provide informative outputs relative to the reference benchmark assessment, especially for the fraction unfished.
The estimates of recent fraction unfished and the OFL were conservative (biased low) for 7 of the 10 stocks in comparison with the reference model. The lack of length data most often led to the lower estimates of the spawning output, the fraction unfished, and the OFL in comparison to the reference model. The possession of either 1 year or 10 years of length data often led to the most variable results. The inclusion of only 1 year of length data led to more conservative estimates of the model output in 7 out of 10 models. Only one of the higher estimates, kelp greenling, was outside the CIs of the reference model. In the following sections, we offer specific insights and details into the results of each case study.
Gopher and Black-and-Yellow Rockfish
The gopher and black-and-yellow rockfish complex comprises two shallow nearshore demersal species that are a minor target for recreational and commercial fisheries. They are mostly taken by hook-and-line, and the live-fishery nature of the commercial fishery makes length collection a more suitable sampling option. The model covers the waters of California up to Cape Mendocino. The catch time series begins over 100 years ago, with both fishery-dependent and fishery-independent abundance indices and length compositions beginning around 35 years before the end of the model (2019, Figure 7). Age compositions are very limited. Likelihood profiling indicated a weak but generally consistent signal in the length and age compositions, and to a lesser extent, in the indices (Monk and He, 2019). The six indices of abundance in the model show stark contradictions in the information content for various model parameters (Monk and He, 2019). Meanwhile, there are several indices, which do not provide a consistent signal within the model. The reference model exhibits a high uncertainty in the spawning output, and lower uncertainty in the current fraction unfished. Biologically, gopher and black-and-yellow rockfish would be more similar to the lower growing life history in the simulation study.
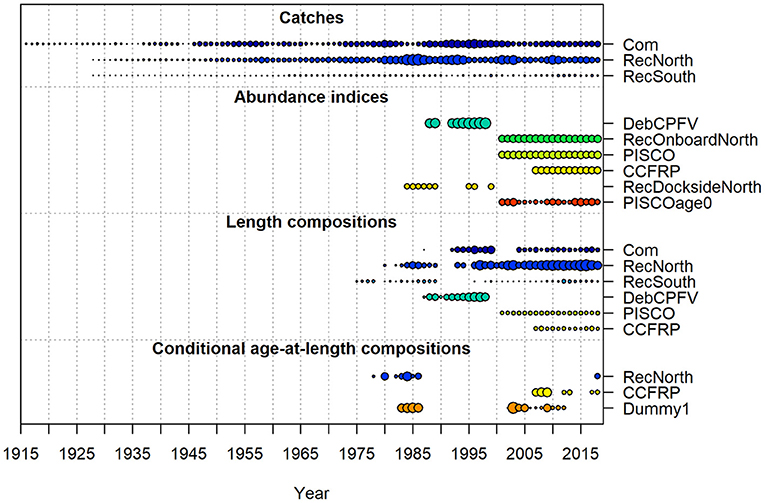
Figure 7. Summary of the data type, the length of data time series, and the quantity for gopher and black-and-yellow rockfish. The size of the bubble by year is based on the sample size (e.g., larger bubbles indicate higher sample sizes). The bubble size for the indices is equal to the inverse of the mean SE for the survey. Catches are both commercial (Com) and recreational (RecNorth and RecSouth). Abundance indices are either fishery-dependent from onboard observers (DebCPFV, RecOnboardNorth, and RecDocksideNorth) or from fishery-independent surveys (PISCO, CCFRP, and PISCOage0). Length compositions come from the catch, one fishery-dependent survey (DebCPFV) and two fishery-independent surveys (PISCO and CCFRP). Conditional age-at-length compositions come from the recreational catch, a fishery-independent survey (CCFRP), and a dummy fleet representing a number of sampling techniques.
The removal of the length compositions demonstrated the largest effect on the model outputs relative to the reference model although that effect was minimal (Figure 8). The truncation of length data time series to 20 or 10 years of data show notable changes in the terminal year spawning output and current fraction unfished (Figure 8). These changes tended to be higher in the spawning output and subsequently more in the optimistic fraction unfished. Relative changes across the model outputs and data scenarios were within the CIs of the model, with the exception being the high positive relative error of the estimated OFL value in case of the removal of all length compositions (Figure 5).
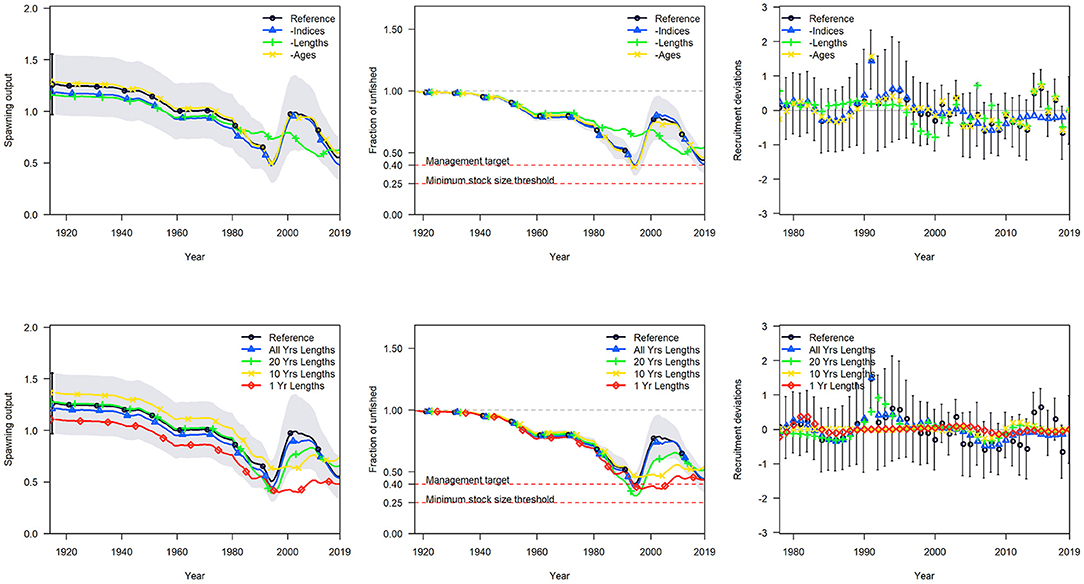
Figure 8. Comparison of model estimates of spawning output, the fraction unfished, and annual recruitment deviations relative to the reference model (black) for gopher and black-and-yellow rockfish. The top row are comparisons between the reference model and when all indices (blue), all lengths (green), or all ages (yellow) are removed. The bottom row are comparisons between the reference model and when only catches and all lengths (blue), 20 years of lengths (green), 10 years of length (yellow), or only 1 year of lengths (red) are used in the model.
China Rockfish
China rockfish is a deeper nearshore demersal species that is a minor target for recreational and commercial fisheries. It is mostly taken by hook-and-line, and the live-fishery nature of the commercial fishery makes the length collection a more suitable sampling option. The northern model covers the waters of Washington State. The catch time series begins just over 50 years ago, with a single fishery-dependent abundance index beginning in the early 1980s, and the majority of length and age composition data from the catch present during approximately the last 20 years of the model (Supplementary Figure 6). Likelihood profiling indicated a weak but generally consistent signal in the index and length and age compositions (Dick et al., 2016). The reference model exhibits a high uncertainty in the spawning output but a low uncertainty in the current fraction unfished. Biologically, China rockfish would be more similar to the faster-growing life history in the simulation study. Recruitment deviations are not estimated in the reference model.
There is a very little effect on model outputs with any of the data scenarios (Supplementary Figure 7). All model outputs were within the CIs of the reference model (Figure 5). The biggest deviation from the reference model was found in the estimate of OFL for the 1 year of length data scenario.
Black Rockfish
Black rockfish is a mostly nearshore, pelagic schooling species that is a major recreational target. It is therefore limited in the net-based catches and is mostly taken by a hook-and-line gear. The Washington State black rockfish stock assessment catch time series begins roughly 80 years ago, with the fishery-dependent abundance indices, length and age composition beginning mostly around 40 years prior to the final model year (2015, Supplementary Figure 8). Likelihood profiling indicated that indices and the length composition data show some agreement despite often in contradiction to the age composition data (Cope et al., 2015). The reference model exhibits low uncertainty and very little retrospective patterns. Biologically, black rockfish would be more similar to the slower growing life history in the simulation study.
The removal of the length composition data demonstrated the largest effect on model outputs, especially on the population scale estimate (Supplementary Figure 9). The removal of indices or ages had a little effect on the estimate of the initial spawning output and across the majority of the time series, but both data scenarios had departures in the estimates during the final years of the model resulting in the estimates of a more depleted stock relative to the reference model (Supplementary Figure 9). The truncation of lengths shows significant decreases in the terminal year spawning output and current fraction unfished (Supplementary Figure 9). Most data scenarios demonstrated lower terminal spawning output and current fraction unfished estimates compared to the small CIs of the reference model (Figure 5). While the reference model was near the target-relative spawning output level, the length scenarios tended to be closer to the minimum stock size threshold (Supplementary Figure 9).
Yelloweye Rockfish
The yelloweye rockfish stock assessment is a two-area model containing submodels for California and Oregon/Washington with both fishery-dependent and fishery-independent abundance indices, length compositions, and age-at-length compositions (Gertseva and Cope, 2017). Yelloweye rockfish typically inhabit deep rocky habitat, and is difficult to sample using a trawl gear but is effectively sampled using a hook-and-line gear. The large size of yelloweye rockfish has made the species a target of recreational fisheries though they were believed overfished for many years, and thus have been under strict harvest guidelines since the mid-2000s. The restrictions had also decreased the availability of the amount of data to subsequent stock assessments.
The catch time series is about 130 years, with the data sources starting around 40 years ago (Supplementary Figure 10). Likelihood profiling indicated that indices and the length composition data are generally in agreement despite of their opposition to age data. Sensitivity analysis shows the removal of lengths that caused issues in the estimation of the initial spawning output and current relative stock abundance (Gertseva and Cope, 2017). Overall, uncertainty in the model is relatively low. This low uncertainty in the asymptotic estimates may be due to the model being one sex as female and male life history parameters are very similar. While natural mortality and recruitment compensation (i.e., steepness) parameters are fixed (a common approach for a West Coast groundfish stock assessment), growth, recruitment, and many selectivity parameters are estimated, providing an ample space for uncertainty in parameter estimation in case of data lacking information. Biologically, yelloweye rockfish is more similar to the slower growing life history in the simulation study.
The removal of the length compositions demonstrated the largest effect on model outputs (Supplementary Figure 11) as the model estimated a very different stock abundance throughout the time series, indicating that the length data are a primary source of information in the reference model. The removal of indices or ages had a little effect, which results in very similar spawning output trajectories and fraction unfished over time (Supplementary Figure 11). The truncation of length data had small and consistent effects on the model output despite enough to be outside the small CIs of the reference model (Figure 5).
Longspine Thornyhead
Longspine thornyhead are a deep water species off the West Coast that are primarily targeted by commercial trawl fishing and are frequently sampled by fishery-independent trawl surveys (Supplementary Figure 12). The most recent assessment for longspine thornyhead was conducted in 2013 and accepted as a data-limited stock assessment (category 2) because no age data were included due to the current inability in aging this species.
For comparing the two data scenarios that included either catch plus index only data or catch and length data, the estimate was nearly identical to the reference model in case of the presence of only lengthy data (Figure 5, Supplementary Figure 13). This indicates that the indices in the reference model have a little influence on the model estimates. For examining the model estimates in case of the use of variable amounts of length data, the model performance in terms of the fraction unfished was similar to the reference model in case of the use of either 20 or 10 years of data (Figure 5, Supplementary Figure 13). The relative error across data scenarios to the OFL estimates were well within the reference model 95% CI (Figure 5).
Cabezon
The northern California substock of cabezon was used in this example, with a range from Point Conception to the California-Oregon border. The catch time series is also very long, with length compositions starting in earnest 40 years ago, and a fishery-dependent index of abundance that stretches back 60 years, terminating 25 years ago, though also with another fishery-independent index in the most recent years (Supplementary Figure 14). Age composition data was limited to fishery-independent samples only. Likelihood profiling indicated that indices and the length composition data are generally in agreement, and the sensitivity analysis shows the removal of either caused issues on estimating the final spawning output and fraction unfished (Cope et al., 2019). This is also reflected in the levels of asymptotic uncertainty in the reference model spawning output being highest for the final year. Biologically, cabezon would be more similar to the faster-growing life history in the simulation study.
The removal of the length compositions demonstrated the largest effect on model outputs (Supplementary Figure 15) as the model had a hard time converge without lengths, with the highest uncertainty in the final year stock abundance. The removal of indices or ages had a little effect. However, even 1 year of length data allowed the model to provide reasonable results (Supplementary Figure 15). For scenarios lacking indices and ages, there is a linear trend downward in the spawning output and subsequently the lower relative stock abundance as the time series of lengths decreases (Figure 6). While the estimates without indices and ages are lower than the reference model, all results are within the reference confidence intervals for each metric under all length scenarios.
Kelp Greenling
Kelp greenling is a nearshore species that experience both recreational and commercial exploitation and is not sampled by the existing West Coast trawl surveys (Supplementary Figure 16). The data available in the reference model consists primarily of fishery-dependent CPUE indices, length, and age composition data after the year 2000. The reference model included three CPUE indices that in case of their removal from the model (“-Indices”) caused the estimated spawning output to decline, with the stock trajectory at the lower 95% CI of the reference model (Figure 6, Supplementary Figure 17). However, the relative stock trajectory was similar to the reference model until the end of the time series where the data scenario sharply declined. When all length data were dropped from the model, the spawning output was lower than the reference model with changes in the pattern of the stock trajectory over time but estimated a similar unfished fraction at the end of the time series. The data scenario removing only the age data resulted in the most similar stock estimates of stock sizes and fraction unfished (Supplementary Figure 17).
The suite of scenarios examining the model performance relative to the reference model when only the catch and length data that were available were highly variable (Figure 6, Supplementary Figure 17). The scenario that retained all length data had a similar trajectory post-1980, but then diverged from the reference model at the end of the time series. The difference in the recent year estimates indicates that the CPUE indices in the reference model have a large influence in recent year estimates that the length data did not support. However, when only the last 20 years of lengths were used, the stock trajectory over time differs, but ultimately estimates a similar fraction unfished in recent years. The estimates of stock size, status, and the trajectories differed greatly from the reference model when only limited data were available (10 or 1 year, Supplementary Figure 17). The relative error of the estimated final spawning output and fraction unfished were well outside the reference model CI for the 1-year data sensitivity (Figure 6).
Lingcod
The lingcod north substock comprises the areas of the Oregon and Washington coast. The substock has a long catch time series, with most fishery-dependent abundance indices and length compositions starting in the early 1980s with some fishery-independent abundance indices in recent years (Supplementary Figure 18). The age composition data are available for the final 20–30 years of the model (Supplementary Figure 18). Likelihood profiling indicated indices and the length composition data show some agreement despite often in contradiction to the age composition data (Haltuch et al., 2018). The reference model exhibits the most uncertainty in the initial abundance though the last 20 years of the spawning output also show an increase in uncertainty. Biologically, lingcod, especially women, would be more similar to the slower growing life history in the simulation study. Recruitment deviations are estimated in the reference model.
The removal of the length compositions or indices demonstrated the largest and most similar effects on the model outputs (Supplementary Figure 19). The removal of ages had a little effect given the growth was fixed. The length-only models show a divergence in models with varying degrees of data showing reduced absolute abundance with the most length data and a higher abundance with lower years of length data (Supplementary Figure 18). Larger departures from the reference model occurred with less sampled years. All data scenarios demonstrated consistent estimates of the fraction unfished with even 1 year of length data scenario resulting in an informative estimate in the final year. There was a linear trend upward in the spawning output and overall steady and slightly larger fraction unfished as the time series of lengths decreased (Figure 6). The estimates were all within the reference model CIs for each metric under each length scenario.
Dover Sole
Dover sole is a primarily exploited commercial trawl gear of the West Coast. The co-occurrence of this species with sablefish, a highly valuable stock, along with its own marketability have resulted in a long exploitation history. The reference assessment has a large number of length and age composition data from both commercial fleets and survey fleets, with the four fishery-independent surveys that were relatively flat across the sampled years (1980–2010, Supplementary Figures 20, 21).
The model was relatively insensitive to the removal of the index data (“- Indices”, Figure 6, Supplementary Figure 21) with only a small decline in the spawning output across time. The reference model estimated a relatively stable spawning output time series with limited impacts to the stock size due to removals. The indices in the model were relatively flat across time, especially the most recent index from 2003 to 2010, and the limited change in the model estimates when the indices were removed highlights the lack of information in these data. The data scenarios that removed either all the length (“-Lengths”) or the age data (“- ges”) resulted in downward shifts in the estimated spawning output but were similar to the reference model in terms of scale.
The data scenarios that were explored using only catch and length data generally varied based on the amount of available length data. The scenario that included either all or 20 years of length data were comparable with the “-Ages” data scenario, which used all the lengths and indices in the reference model (Figure 6, Supplementary Figure 21). The scale of the population from these scenarios were lower than the reference model but resulted in similar population scale estimates. However, when a larger amount of length data, either only 10 or 1 year of length data, were removed, the estimates varied to a greater extent from the reference model and in the 1-year scenario resulted in the fraction unfished that was outside the 95% CI from the reference model.
Big Skate
The big skate assessment is an example of a stock with a long catch history but mostly limited to data within the last 20 years (Supplementary Figure 22). While the fishery-independent indices of abundance had small average slopes upward across time, the fits to the indices are mostly flat, indicating a very little influence or the information content. The age data also seem to be weakly informative and contradictory to the signal in the index. Likelihood component analyses (Taylor et al., 2019) indicate length compositions to be the most informative data source. The estimates of spawning output are highly largely uncertain. Biologically, a big skate growth is slow to reach asymptotic size, thus having relatively more informative length compositions. Recruitment was not estimated in this model.
The removal of the length compositions demonstrated the largest effect on model outputs (Supplementary Figure 23) though given the already large uncertainty in the reference model spawning output was just within the confidence bound (Figure 6). Further examination of altering the available length composition data showed mostly conservative deviations from the reference model in case of the inclusion of no indices or age data, with even 1 year of length data being informative of model scale and relative abundance (Figure 6). The OFL estimate demonstrated the largest deviation from the reference model.
Discussion
This study used two types of experiments to explore the possible use of catch and length data in age-structured models when reliable abundance indices and age composition are unavailable. The simulation study demonstrated that we can expect the unbiased estimates of key population quantities on average when including only catch and length data. The probability of an accurate parameter estimate for any given stock assessment generally increases with more years of length composition data, a higher sample size of length data, and for the stocks with a lower recruitment variability. A single year of length data was typically most biased and with the highest error, but 5 years of length data decreased the bias and error.
These results are applicable to data-moderate stocks worldwide. When stocks are lacking an abundance index, one option may be to compare the estimates of the stock status or an exploitation rate with catch- or length-only approaches, leaning on an ensemble of models to make management decisions. Pons et al. (2020) compared the bias and error of catch- and length-only methods in the estimation of their common output, exploitation rate if both catch and length are available without an abundance index. One takeaway of this exploration was that catch and length would ideally be used together in an integrated model. While the length-based integrated mixed effects model integrated catch and length data to estimate fishing mortality and recruitment deviations over time (Rudd and Thorson, 2018), the important features of age-structured populations such as multiple fleets, multiple sexes, and alternate selectivity functions (e.g., dome-shaped selectivity) are not implemented or thoroughly tested (Pons et al., 2019). Meanwhile, SS has a wide range of important features for modeling age-structured population dynamics that are well tested with an ongoing technical support from NOAA. Further, many catch-only approaches simply approximate a sustainable catch limit rather than model population dynamics (Carruthers et al., 2014). In cases of using catch-only methods to estimate stock status, they generally do not perform well (Free et al., 2020). With a few years of length data, SS-CL would likely improve the assessments previously relying on catch-only approaches.
In addition to improvements in the estimates of stock status, the integrated SS framework allows for the ability to consider model goodness of fit, residual analysis, retrospective analysis, and other diagnostics useful for considering the model choice and uncertainty. The ability to model the key aspects of abovementioned age-structured population dynamics along with statistical diagnostics makes it reasonable to relax the precautionary buffer between the OFL (e.g., MSY) and ABC (i.e., recommended catch limit). In the USA, only 11% of the OFLs and ABCs are calculated using data-moderate methods, compared with 30% using data-rich assessments and 59% using data-limited approaches (Newman et al., 2015). This may be due to the lack of approved data-moderate assessment approaches. With the approval of SS-CL for use in data-moderate assessments for the stocks managed by the Pacific Fishery Management Council, a large proportion of OFLs and ABCs set using data-limited approaches may upgrade to the data-moderate category, particularly when OFLs are approximated using catch-only approaches and recent length compositions are becoming available.
While SS may be used to model multiple fleets, areas, and sexes, the simulations in this study represent the simplified versions of fish stocks with only a single fleet operating in a homogenous area. Length compositions must be representative of the entire fishery to accurately inform the fraction unfished, and this task becomes more complicated with multiple fleets and selectivity (Sharma et al., 2014; Pons et al., 2020). Future simulation testing could help inform the potential issues using length and catch data only by exploring mis-specified selectivity forms, sex-specific growth rates for species with sexual dimorphism, and more life history scenarios. Comparison of simulation testing with systematic data reduction allows us to understand the impact of catch and length-only models from multiple practical angles.
The systematic data reduction study demonstrated that the length composition data proved a critical input to a variety of West Coast groundfish stock assessments. Length data were not just ancillary to other data types as models reduced to only length and catch histories, including those with short time series (10 years or less) of length compositions that retained much of the information of reference models. A big reason for this is that the length composition is a key input to estimating both fleet selectivity and recruitment variability in an age-structured stock assessment (Minte-Vera et al., 2017; Thorson et al., 2019). Shorter time series of length compositions would often offer simplified views of the past population dynamics but could still provide the informed estimates of the fraction unfished in the final model years (Thorson and Cope, 2015; Rudd and Thorson, 2018). The results here are encouraging for the use of length and catch models as viable data-moderate stock assessment candidates.
Meanwhile, it is most desirable to have all forms of data that are integrated and working together in a stock assessment, it is not unusual that different data types show weak and/or conflicting contributions of indices of abundance. Many stocks do not have scientifically designed abundance indices available; the fishery-dependent CPUE time series that are available subsequently suffer from a systematic bias or an insufficient contrast leading to large uncertainties, and thus a weak influence on model outputs. For stocks with a low-contrast standardized trawl survey index, the index had a limited influence on the model estimates. These stock assessments tend to behave similarly to length-only models, so there is a precedent for length-driven models to inform the West Coast fisheries management.
In instances where data sources such as abundance indices or length compositions are more influential, contradictory signals present real problems (Maunder et al., 2017). Data weighting is an important, nontrivial aspect of developing reference stock assessment models, and there is no way to do it (Francis, 2017; Punt, 2017). Thus, decisions are necessary to resolve contradictory data. Down weighting of certain likelihood components in favor of others is common but may instead mask important model misspecifications (Maunder and Piner, 2017; Wang and Maunder, 2017). The inclusion of multiple data types in an integrated model may cause additional challenges as data may have an influence on unrelated model processes (Piner et al., 2016), thus arguing for the specification of model parameters outside the model. One example is the establishment of life history values such as natural mortality or growth external to the model to better establish selectivity parameters, and subsequently exploring the model misspecification through sensitivity analyses. The decision to fix the life history parameters in these model comparisons is therefore a common practice, and also provided one level of experimental control in separating the effects of data exclusion rather than life history misspecification. This decision likely decreased the influence of age, and possibly length, composition to a certain extent, but was a trade-off to gain the interpretability of results. It is also possible that size compositions may hold limited information about the population trend, especially given the uncertainty in life history parameters (Minte-Vera et al., 2017) or should be down weighted to only inform selectivity (Sharma et al., 2014).
When length compositions were the only source of data, they tend to offer more conservative OFL estimates due to the changes in either the initial or final estimates of the stock size. The most conservative estimates generally arose in case of the availability of limited years of length data though the degree of this difference varies. The basic argument of including length compositions is that they provide the information on length-based selectivity, the fishing intensity, recruitment deviations, and the current fraction unfished. When the indices of abundance or age compositions are either unavailable or too resource-intensive to process, length plus catch models show the capacity to provide suitable estimates of sustainable catch. In most cases, length-only models were more conservative than the reference model in all examined model outputs, decreasing the chance that such models will lead to overfishing in the short term.
The stripping back of stock assessment data does not presume simpler models. Most of the model complexities were maintained across these data scenarios, and are not likely how one would specify a stock assessment model if truly faced with limited data. When data are sparse, parsimony is beneficial as the estimation of numerous selectivity parameters with little data may complicate the model convergence. How this would influence the comparisons that were not explored though keeping the model complexity high still resulted in reasonable results for the length-only models. Likewise, other simplifications were made, such as fixing life history parameters to the reference model, thus possibly reducing the amount of deviance from the reference model.
Similar to many stock assessments, future applications of SS-CL will be limited due to the difficulties in making the assumptions about fixed parameters and model structure. Mis-specifying key life history values, such as natural mortality, asymptotic length, or the CV in the growth curve, demonstrates the expected biases. Applications will turn to external studies or meta-analyses to inform the fixed values of growth, natural mortality, or steepness parameters. However, biases associated with fixing the life history values or potential estimation biases from confounding parameters would also be potential issues in any stock assessment and should always be considered. Analysts would also be alerted about the potential issues of parameter and model misspecification through convergence issues, as seen with the parameter misspecification in the simulation study, as well as likelihood profiling, residual diagnostics, and retrospective analysis (Carvalho et al., 2017).
The use of SS-CL, a viable application, as a stock assessment tool for fisheries with life history information, time series of removals, and as little as a snapshot or short time series of representative length compositions. A flow chart for using the SS-CL approach is given in the Supplementary Material. The technical support behind SS, well-tested features such as multiple fleets and sexes, and an integrated nature to include all data as they become available make SS-CL a viable stock assessment option for data-moderate stocks worldwide.
Data Availability Statement
The original contributions presented in the study are included in the article/Supplementary Material, further inquiries can be directed to the corresponding author/s.
Author Contributions
MR ran the simulation analysis and contributed to writing the paper. JC and CW consulted in the simulation analysis, ran the systematic data reduction, and contributed to writing the paper. JH consulted in the simulation and systematic data reduction analyses and secured funding for the project. All authors contributed to the article and approved the submitted version.
Funding
This study was funded by the NOAA Fishery Resource Analysis and Monitoring Division, Requisition number NFFP7410-19-03274, contract number 1333MF19PNFFP0245.
Conflict of Interest
MR was employed by the company Scaleability LLC, a single-member LLC in which she is the owner and sole member, and under where she consults as an independent scientific researcher.
The remaining authors declare that the research was conducted in the absence of any commercial or financial relationships that could be construed as a potential conflict of interest.
Publisher's Note
All claims expressed in this article are solely those of the authors and do not necessarily represent those of their affiliated organizations, or those of the publisher, the editors and the reviewers. Any product that may be evaluated in this article, or claim that may be made by its manufacturer, is not guaranteed or endorsed by the publisher.
Acknowledgments
We thank Owen Hamel and Melissa Haltuch for reviews of this draft, Andre Punt for chairing the SSC review of this work, and the Pacific Fishery Management Council SSC Groundfish subcommittee for reviewing this research.
Supplementary Material
The Supplementary Material for this article can be found online at: https://www.frontiersin.org/articles/10.3389/fmars.2021.663554/full#supplementary-material
References
Anderson, S. C., Monnahan, C. C., Johnson, K. F., Ono, K., and Valero, J. L. (2014). ss3sim: an R package for fisheries stock assessment simulation with Stock Synthesis. PLoS ONE 9:e92725. doi: 10.1371/journal.pone.0092725
Berger, A. M., Arnold, L., and Rodomsky, B. T. (2015). Status of Kelp Greenling (Hexagrammos decagrammus) Along the Oregon Coast in 2015. Portland, OR: Pacific Fishery Management Council.
Booth, A. J., and Quinn, T. J. II. (2006). Maximum likelihood and Bayesian approaches to stock assessment when data are questionable. Fish. Res. 80, 169–181. doi: 10.1016/j.fishres.2006.05.003
Carruthers, T. R., Punt, A. E., Walters, C. J., MacCall, A., McAllister, M. K., Dick, E. J., et al. (2014). Evaluating methods for setting catch limits in data-limited fisheries. Fish. Res. 153, 48–68. doi: 10.1016/j.fishres.2013.12.014
Carvalho, F., Punt, A. E., Chang, Y. J., Maunder, M. N., and Piner, K. R. (2017). Can diagnostic tests help identify model misspecification in integrated stock assessments? Fish. Res. 192, 28–40. doi: 10.1016/j.fishres.2016.09.018
Cope, J., Dick, E. J., MacCall, A., Monk, M., Soper, B., and Wetzel, C. (2013). Data-Moderate Stock Assessments for Brown, China, Copper, Sharpchin, Stripetail, and Yellowtail Rockfishes and English and Rex Soles in 2013. Portland, OR: Pacific Fishery Management Council.
Cope, J. M. (2013). Implementing a statistical catch-at-age model (Stock Synthesis) as a tool for deriving overfishing limits in data-limited situations. Fish. Res. 142, 3–14. doi: 10.1016/j.fishres.2012.03.006
Cope, J. M., Berger, A. M., Whitman, A. D., Budrick, J. E., Bosley, K. M., Tsou, T. S., et al. (2019). Assessing Cabezon (Scorpaenichthys marmoratus) Stocks in Waters off of California and Oregon, With Catch Limit Estimation for Washington State. Portland, OR: Pacific Fishery Management Council.
Cope, J. M., and Punt, A. E. (2009). Length-based reference points for data-limited situations: applications and restrictions. Mar. Coast. Fish. 1, 169–186. doi: 10.1577/C08-025.1
Cope, J. M., Sampson, D., Stephens, A., Key, M., Mirick, P. P., Stachura, M., et al. (2016). Assessments of California, Oregon, and Washington Stocks of Black Rockfish (Sebastes melanops) in 2015. Portland, OR: Pacific Fishery Management Council.
Cope, J. M., Thorson, J. T., Wetzel, C., and Devore, J. D. (2015). Evaluating a prior on relative stock status using simplified age-structured models. Fish. Res. 171, 101–109. doi: 10.1016/j.fishres.2014.07.018
Dichmont, C. M., Deng, R. A., Dowling, N., and Punt, A. E. (2021). Collating stock assessment packages to improve stock assessments. Fish. Res. 236:105844. doi: 10.1016/j.fishres.2020.105844
Dick, E. J., and MacCall, A. D. (2011). Depletion-Based Stock Reduction Analysis: a catch-based method for determining sustainable yields for data-poor fish stocks. Fish. Res. 110, 331–341. doi: 10.1016/j.fishres.2011.05.007
Dick, E. J., Monk, M., Taylor, I., Haltuch, M., Tsou, T. S., and Mirick, P. (2016). Status of China Rockfish off the U.S. Pacific Coast in 2015. Portland, OR: Pacific Fishery Management Council.
Francis, R. I. C. C. (2017). Revisiting data weighting in fisheries stock assessment models. Fish. Res. 192, 5–15. doi: 10.1016/j.fishres.2016.06.006
Free, C. M., Jensen, O. P., Anderson, S. C., Gutierrez, N. L., Kleisner, K. M., Longo, C., et al. (2020). Blood from a stone: Performance of catch-only methods in estimating stock biomass status. Fish. Res. 223:105452. doi: 10.1016/j.fishres.2019.105452
Gertseva, V., and Cope, J. M. (2017). Stock Assessment of the Yelloweye Rockfish (Sebastes ruberrimus) in the State and Federal Waters off California, Oregon, and Washington. Portland, OR: Pacific Fishery Management Council.
Haltuch, M. A., Wallace, J., Allen Akselrud, C., Nowlis, J., Barnett, L. A. K., Valero, J. L., et al. (2017). 2017 Lingcod Assessment. Portland, OR: Pacific Fishery Management Council.
Haltuch, M. A., Wallace, J., Allen Akselrud, C., Nowlis, J., Barnett, L. A. K., Valero, J. L., et al. (2018). 2017 Lingcod Stock Assessment. Portland, OR: Pacific Fishery Management Council.
Hamel, O. S. (2015). A method for calculating a meta-analytical prior for the natural mortality rate using multiple life history correlates. ICES J. Mar. Sci. 72, 62–69. doi: 10.1093/icesjms/fsu131
Hicks, A. C., and Wetzel, C. R. (2013). The Status of Dover Sole (Microstomus pacificus) Along the U.S. West Coast in 2011. Portland, OR: Pacific Fishery Management Council.
Maunder, M. N., Crone, P. R., Punt, A. E., Valero, J. L., and Semmens, B. X. (2017). Data conflict and weighting, likelihood functions and process error. Fish. Res. 192, 1–4. doi: 10.1016/j.fishres.2017.03.006
Maunder, M. N., and Piner, K. R. (2017). Dealing with data conflicts in statistical inference of population assessment models that integrate information from multiple diverse data sets. Fish. Res. 192, 16–27.
Methot, R. D., and Taylor, I. G. (2011). Adjusting for bias due to variability of estimating recruitments in fishery assessment models. Can. J. Fish. Aquat. Sci. 68, 1744–1760. doi: 10.1139/f2011-092
Methot, R. D., and Wetzel, C. R. (2013). Stock synthesis: a biological and statistical framework for fish stock assessment and fishery management. Fish. Res. 142, 86–99. doi: 10.1016/j.fishres.2016.04.022
Minte-Vera, C. V., Maunder, M. N., Aires-da-Silva, A. M., Satoh, K., and Uosaki, K. (2017). Get the biology right, or use size-composition data at your own risk. Fish. Res. 192, 114–125. doi: 10.1016/j.fishres.2017.01.014
Monk, M. H., and He, X. (2019). The Combined Status of Gopher (Sebastes carnatus) and Black-and-Yellow Rockfishes (Sebastes chrysomelas) in U.S. Waters off California in 2019. Portland, OR: Pacific Fishery Management Council.
Newman, D., Berkson, J., and Suatoni, L. (2015). Current methods for setting catch limits for data-limited fish stocks in the United State. Fish. Res. 164, 86–93. doi: 10.1016/j.fishres.2014.10.018
NOAA (2021). Setting an Annual Catch Limit. Available online at: https://www.fisheries.noaa.gov/insight/setting-annual-catch-limit (accessed June 11, 2021).
Ono, K., Punt, A. E., and Rivot, E. (2012). Model performance analysis for Bayesian biomass dynamics models using bias, precision and reliability metrics. Fish. Res. 125–126, 173–183. doi: 10.1016/j.fishres.2012.02.022
Parma, A. M., and Deriso, R. B. (1990). Dynamics of age and size composition in a population subject to size-selective mortality: effects of phenotypic variability in growth. Can. J. Fish. Aquat. Sci. 47, 274–289. doi: 10.1139/f90-030
Piner, K. R., Lee, H.-H., and Maunder, M. N. (2016). Evaluation of using random-at-length observations and an equilibrium approximation of the population age structure in fitting the von Bertalanffy growth function. Fish. Res. 180, 128–137. doi: 10.1016/j.fishres.2015.05.024
Pons, M., Cope, J. M., and Kell, L. T. (2020). Comparing performance of catch-based and length-based stock assessment methods in data-limited fisheries. Can. J. Fish. Aquat. Sci. 77, 1026–1037. doi: 10.1139/cjfas-2019-0276
Pons, M., Kell, L., Rudd, M. B., Cope, J. M., and Fredou, F. L. (2019). Performance of length-based data-limited methods in a multi-fleet context: application to small tunas, mackerels, and bonitos in the Atlantic Ocean. ICES J. Mar. Sci. 76, 960–973. doi: 10.1093/icesjms/fsz004
Punt, A. E. (2017). Some insights into data weighting in integrated stock assessments. Fish. Res. 192, 52–65. doi: 10.1016/j.fishres.2015.12.006
Punt, A. E., Hurtado-Ferro, F., and Whitten, A. R. (2014). Model selection for selectivity in fisheries stock assessments. Fish. Res. 158, 124–134. doi: 10.1016/j.fishres.2013.06.003
Rudd, M. B., and Thorson, J. T. (2018). Accounting for variable recruitment and fishing mortality in length- based stock assessments for data-limited fisheries. Can. J. Fish. Aquat. Sci. 75, 1019–1035. doi: 10.1139/cjfas-2017-0143
Sharma, R., Langley, A., Herrera, M., Geehan, J., and Hyun, S.-Y. (2014). Investigating the influence of length-frequency data on the stock assessment of Indian Ocean bigeye tuna. Fish. Res. 158, 50–62. doi: 10.1016/j.fishres.2014.01.012
Stephens, A., and Taylor, I. G. (2013). Stock Assessment and Status of Longspine Thornyhead (Sebastolobus altivelis) off California, Oregon, Washington in 2013. Portland, OR: Pacific Fishery Management Council.
Taylor, I. G., Gertseva, V., Stephens, A., and Bizzarro, J. (2019). Status of Big Skate (Beringraja binoculata) Off the U.S. Pacific Coast in 2019. Portland, OR: Pacific Fishery Management Council.
Thorson, J. T., and Cope, J. M. (2015). Catch curve stock-reduction analysis: an alternative solution to the catch equations. Fish. Res. 171, 33–41. doi: 10.1016/j.fishres.2014.03.024
Thorson, J. T., Rudd, M. B., and Winker, H. (2019). The case for estimating recruitment variation in data-moderate and data-poor age-structured models. Fish. Res. 217, 87–97. doi: 10.1016/j.fishres.2018.07.007
Wang, S.-P., and Maunder, M. N. (2017). Is down-weighting composition data adequate for dealing with model misspecification, or do we need to fix the model? Fish. Res. 192, 41–51. doi: 10.1016/j.fishres.2016.12.005
Wetzel, C. R., Cronin-Fine, L., and Johnson, K. F. (2017). Status of Pacific Ocean Perch (Sebastes alutus) Along the U.S. West Coast in 2017. Portland, OR: Pacific Fishery Management Council.
Keywords: fisheries stock assessment, integrated models, age-structured models, data-limited models, US west coast fisheries
Citation: Rudd MB, Cope JM, Wetzel CR and Hastie J (2021) Catch and Length Models in the Stock Synthesis Framework: Expanded Application to Data-Moderate Stocks. Front. Mar. Sci. 8:663554. doi: 10.3389/fmars.2021.663554
Received: 03 February 2021; Accepted: 21 July 2021;
Published: 17 August 2021.
Edited by:
Natalie Anne Dowling, Oceans and Atmosphere (CSIRO), AustraliaReviewed by:
Henning Winker, Department of Agriculture, Forestry and Fisheries, South AfricaValeria Mamouridis, Independent Researcher, Rome, Italy
Copyright © 2021 Rudd, Cope, Wetzel and Hastie. This is an open-access article distributed under the terms of the Creative Commons Attribution License (CC BY). The use, distribution or reproduction in other forums is permitted, provided the original author(s) and the copyright owner(s) are credited and that the original publication in this journal is cited, in accordance with accepted academic practice. No use, distribution or reproduction is permitted which does not comply with these terms.
*Correspondence: Merrill B. Rudd, bWVycmlsbHJ1ZGRAZ21haWwuY29t