
94% of researchers rate our articles as excellent or good
Learn more about the work of our research integrity team to safeguard the quality of each article we publish.
Find out more
ORIGINAL RESEARCH article
Front. Mar. Sci. , 15 July 2021
Sec. Physical Oceanography
Volume 8 - 2021 | https://doi.org/10.3389/fmars.2021.661250
 Elisabet R. Cruz1,2
 Rita Nolasco1
 Xosé A. Padin2
 Miguel Gilcoto2
 Jose M. F. Babarro3
 Jesús Dubert1*
 Fiz F. Pérez2
Estuarine exchange flow plays an important role in the biogeochemical properties exchange between the coastal ocean and the estuaries. Circulation patterns inside the Rias Baixas (NW Iberian Peninsula) have been widely studied, while the Ría de Pontevedra has received less attention. A high-resolution ROMS-AGRIF system configuration with three online two-way nesting domains was used and validated to enhance the knowledge about the circulation patterns of this Ría. Two representative estuarine circulation patterns were studied: a coastal upwelling event and a downwelling event associated with a maximum river runoff of 84 m3/s. An analysis using Empirical Orthogonal Functions (EOF) was applied to the horizontal subtidal velocity fields at the surface layer and at 20 m depth and to the subtidal normal velocity across vertical cross-sections. Upwelling events are characterized by a reinforcement of the positive estuarine circulation, in which the surface waters outflow and deep waters inflow at the main sill of the Ría, whilst full water column inflow (outflow) is observed at the northern (southern) openings. Conversely, downwelling events induce an opposite behavior, consisting of a negative estuarine circulation with the surface (deep) inflow (outflow) at the main sill of the Ría and outflow (inflow) at the northern (southern) openings. Evidences of a front splitting two vertical clockwise circulation cells were found. These cells are associated with the ocean water subduction that enters through the surface layer under downwelling favorable winds and this surface inflow opposes to the direction of the inner estuarine circulation. The EOF study confirms that shelf wind forcing has an important contribution to the variability of the velocity field, inducing positive or negative estuarine like circulation. The temporal principal components (PC) of EOF analysis present correlations of 0.92 between the meridional wind component and the first mode, and 0.77 between the zonal wind component and the second mode. Third EOF mode represents the circulation during transitional winds when some vorticity structures are visible. The realistic high-resolution simulation of the physical conditions at the Ría de Pontevedra provides new insights into the ocean-estuarine water exchanges and allow the visualization of recirculation processes and characteristic structures that have consequences in the marine ecosystem and in their productivity.
Estuarine systems are among the most active areas of the ocean. They provide critical habitat for species that are valued culturally, recreationally, and commercially, but they are under increased pressures, threatening the water and land integrities (Giddings and MacCready, 2017). Understanding estuarine dynamic is essential to understand these ecosystems. Hydrodynamics of estuaries located on Eastern Boundary Upwelling Systems (EBUS) are often driven by the coastal upwelling dynamics, forced by the alongshore winds that drive the offshore Ekman transport which, in turn, yields the upwelling along the coast (Largier, 2020). Upwelling estuaries or bays have an estuary-ocean exchange that influences the biogeochemical properties of the ecosystem.
The Ría de Pontevedra is an estuary located on the West Galician coast (NW Spain; Figure 1A), between latitudes 42.24° N and 42.44° N and longitudes 8.65° W and 9° W and is the second southernmost of the Rias Baixas (Figure 1B). It has a surface area of ∼147 km2 and a volume of ∼3.45 km3 (Aguiar Fernandez, 2016), and as the other Rias Baixas, it is characterized by a V-shaped coastline and bathymetry, which gets broader in the NE–SW direction. Lérez river is the main source of continental runoff in the Ría, with a characteristic average discharge of ∼23 m3/s. The inshore/offshore water exchange is influenced by the three openings defined by the Ría topography and bathymetry (Figure 1C). Ons island is separated from the continent by a shallow sill (northern opening) with a width of 3.65 km and a maximum depth of ∼10 m. The deeper (maximum depth ∼60 m) central estuary opening, spanning 11.6 km between Ons island to the north, and Cíes islands to the south, is the main pathway for estuarine-shelf exchange. The Cíes islands are separated from the continent by another sill (southern opening) with a width of 2.92 km and a maximum depth of ∼30 m. This latter opening is the natural connection that facilitates the exchange between the Ría de Vigo and the Ría de Pontevedra (Figure 1C). Even though fishing and aquaculture (e.g., mussel raft culture) resources are socially and economically important in the Ría, there are also industrial activities including a paper production factory and several small shipyards that release chemicals and effluents to the estuary.
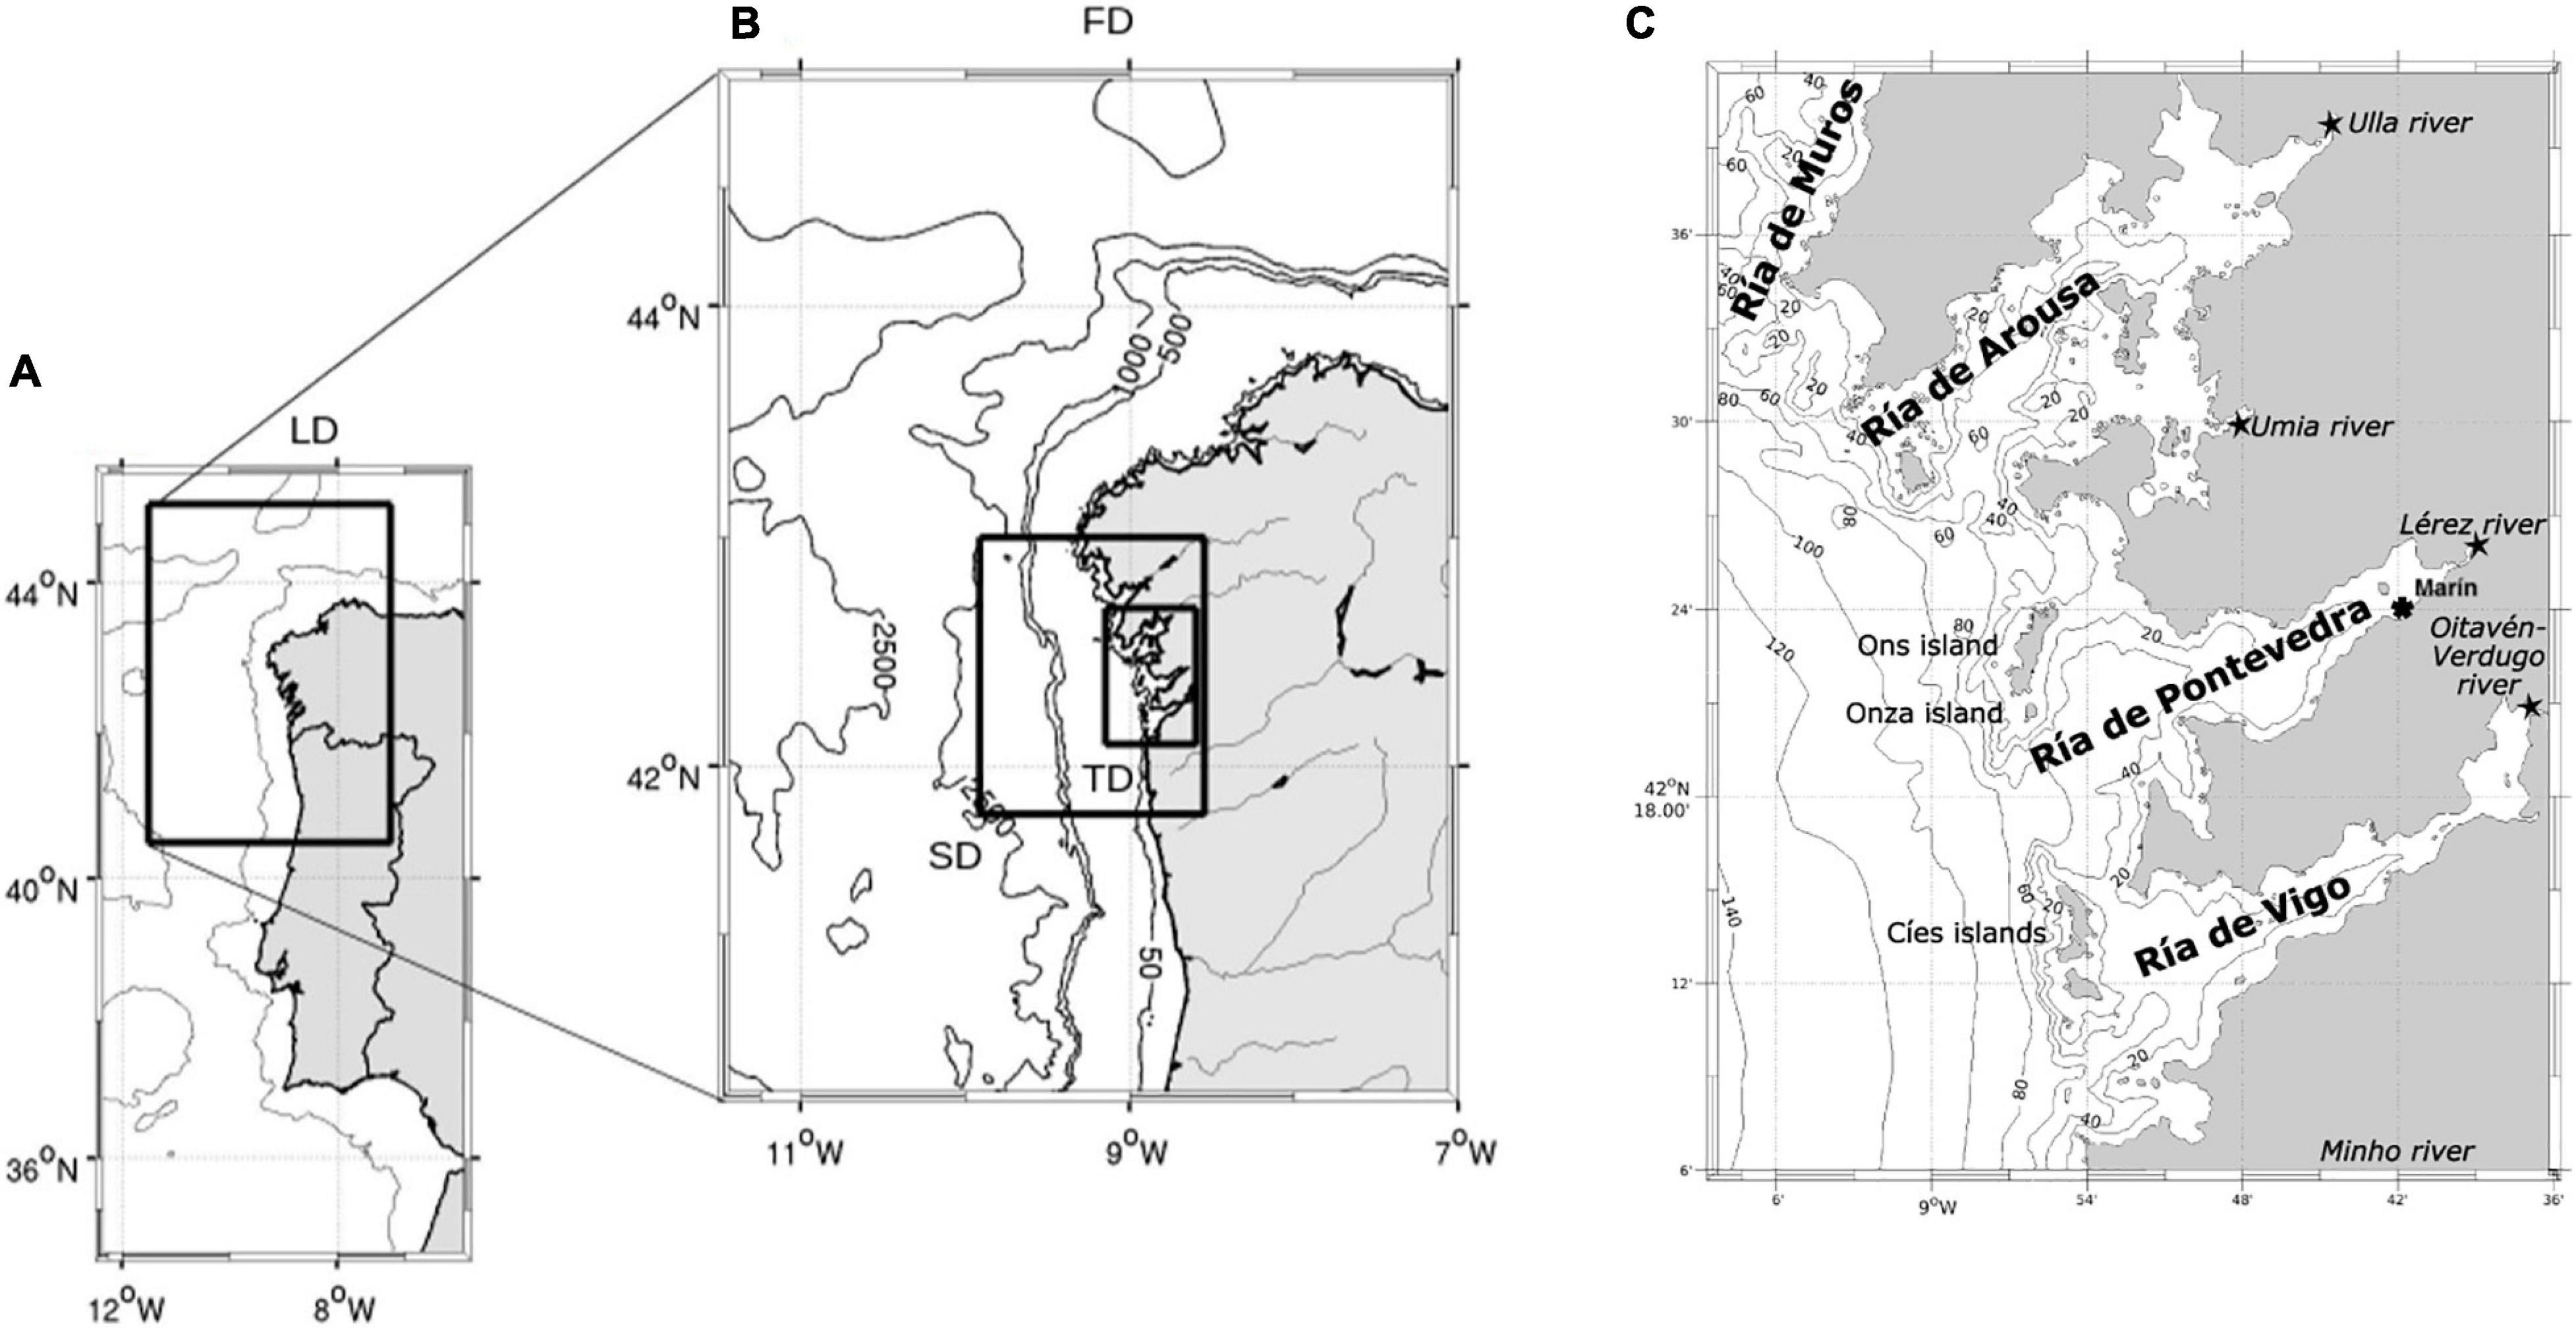
Figure 1. Geographic location of (A) the large (LD), (B) first (FD), second (SD), and third (TD) domains. The FD shows the 50, 500, 1,000, and 2,500 m bathymetric contours. (C) Map of Galician Rias Baixas with isobaths at 20 m intervals, NW of Iberian Peninsula, with names of Rias, main tributary rivers, islands, and (black asterisk) Marín location at the Ría de Pontevedra.
The studied Ría, Ría de Pontevedra, has been described as a partially mixed estuary (Ruiz-Villarreal et al., 2002) with a two-layered residual circulation pattern during most of the year, led mainly by wind forcing (Pardo et al., 2001). It is well recognized that in the Rias Baixas system, the circulation induced by shelf wind forcing overcomes estuarine circulation (Álvarez-Salgado et al., 2000). From April to October, predominant northerly winds cause upwelling events which reinforce positive estuarine circulation, that is surface outflow and bottom inflow of colder nutrient-rich subsurface water. This water mass that flows into the estuary is known as Eastern North Atlantic Central Water (ENACW; Wooster et al., 1976). During autumn and winter (September–May) southerly winds cause downwelling events which induce negative estuarine-like circulation, surface inflow and bottom outflow. Upwelling events are associated with the presence of a southward jet at the shelf and are characterized by stratification of the water column due to the heating at the surface during warmer periods (Pardo et al., 2001; Barton et al., 2015). Downwelling events are characterized by a northward shelf current and surface convergence (associated with Ekman transport) inducing vertical mixing that can generate thermal inversions (de Castro et al., 2000; Gómez-Gesteira et al., 2001; Pardo et al., 2001; Álvarez et al., 2003; Aguiar Fernandez, 2016; Barton et al., 2016). The response to coastal upwelling in the Rias Baixas is rapid. Observations recorded in the Ría de Vigo have shown that the residual circulation is influenced by the shelf and by local wind fluctuations within a few hours (Piedracoba et al., 2005). This rapid response is shorter than the inertial period and is explained by the combined effect of local wind-drag and Ekman transports on the shelf, driven by the synoptic wind fields, as discussed thoroughly by Gilcoto et al. (2017).
Along the eastern Portuguese coast, river plumes propagating northward principally from the Douro and Minho rivers, generate what is known as the Western Iberian Buoyant Plume (WIBP; Peliz et al., 2002), which flows along the coast, influencing surface layer dynamics (Mendes et al., 2016; Des et al., 2019). The behavior of the WIBP affects the density inside the Rias Baixas modifying circulation (de Castro et al., 2004). Previous studies report the presence of convergence fronts associated with the WIBP, both inside (Pardo et al., 2001) and beyond the mouth of the Ría de Pontevedra (Otero et al., 2008), as well as within the Ría de Vigo (Otero et al., 2008; Villacieros-Robineau et al., 2013). The dynamics of the Minho river plume and its influence on the Rias Baixas was analyzed by Sousa et al. (2014a,b,c) during an upwelling-downwelling event in May 1998. It was found that the plume responds rapidly to wind variations, with both wind and river discharge being the most important factors influencing plume size and shape. They emphasized that the Minho river plume may reverse the normal circulation and vertical density structure inside the Rias Baixas when downwelling-favorable winds prevail (Sousa et al., 2014b). Barton et al. (2015) describe the presence of the main circulation features within the Ría de Vigo: a cyclonic meandering inflow during downwelling events, and a cyclonic eddy at the middle Ría during relaxation of upwelling events. Piedracoba et al. (2016) studied the vorticity distribution of the surface circulation within the Ría de Vigo with high frequency radar (HF radar) and Acoustic Doppler Current Profiler (ADCP) data, finding dipolar structures formed by a counter-clockwise rotation at the northern outer Ría and a clockwise rotation at the southern outer Ría, during transition from upwelling to downwelling. Under moderate or intense upwelling events, the dipolar structure reversed with clockwise rotation at the northern outer Ría and counter-clockwise rotation at the southern outer Ría. A potential effect of this dipolar vorticity structure is the retention of plankton, fish larvae or pollutants inside bays (i.e., estuaries) e.g., Monterey Bay in California (Graham and Largier, 1997; Paduan et al., 2018), and Cape Columbine-St Helena Bay (Penven et al., 2000) in Western South Africa.
Bays influenced by coastal upwelling have been studied in Chile, where they seem to respond mainly to the local winds (Valle-Levinson et al., 2003, 2004). These bays are similar to the Rias Baixas, however their main axes are oriented nearly parallel to the Chilean coast while the Rias Baixas are oriented obliquely to the Iberian Atlantic coast. The coupling of residual circulation and coastal upwelling has also been reported in the South China Sea (Zu and Gan, 2015; Liu et al., 2018) and the South Atlantic Bight (Blanton, 1996) where the cross-shelf density-induced circulation is enhanced or reversed with upwelling or downwelling events. Also fjords, dynamically narrow and deep like Rias, share common circulation characteristics with the Rias Baixas, namely the two-layer model of Klinck et al. (1981) has been suggested to capture the main aspects of Rias Baixas dynamics (Blanton et al., 1984). Some fjords are subject to coastal upwelling (Erga et al., 2012) and the three layer circulation of fjords (Valle-Levinson et al., 2014) is sometimes present in the Rias Baixas (Alvarez-Salgado et al., 1998; Piedracoba et al., 2005).
Few 3D realistic numerical studies have been applied to the study of the Rias Baixas. The Ría de Muros was modeled by Carballo et al. (2009). Modeling studies of the Ría de Vigo were implemented by Taboada et al. (1998), Souto et al. (2001, 2003), Torres López et al. (2001), and Cerralbo et al. (2013). One 3D model with simplified physics has been applied to the Ría de Pontevedra (Ruiz-Villarreal et al., 2002), using the MOHID model with a horizontal resolution of 300 m, with 10 sigma vertical layers and applying no wind stress at the surface. Using this resolution, the MOHID model was unable to replicate island wake formations.
The aim of this paper is to characterize the circulation patterns of the Ría de Pontevedra using numerical experiments. Validation of the high-resolution numerical model employed for this study is described in section “Model Validation.” One upwelling event and one downwelling event associated with increased river runoff were analyzed to evaluate the different circulation patterns associated with these events and are presented in sections “Upwelling Event” and “Downwelling Event With River Inflow Increases.” Results of Empirical Orthogonal Functions (EOF) analysis applied to subtidal velocity fields are described in section “EOF Analysis.”
A high-resolution configuration of the Regional Ocean Modeling System model (ROMS; Shchepetkin and McWilliams, 2005) with embedded online two-way nesting domains capabilities and increasing resolution through Adaptive Grid Refinement In Fortran (AGRIF) package (Debreu et al., 2012) is used to simulate the circulation patterns at the Ría de Pontevedra during the year 2015. ROMS is a member of a general class of three-dimensional, split-explicit, free surface and a terrain-following s-coordinate numerical models, designed to resolve regional oceanic systems. ROMS solves the Reynolds-averaged Navier-Stokes equations using the Boussinesq and hydrostatic approximations, coupled with advection/diffusion equations for salinity and potential temperature, and the non-linear equation of state.
To investigate exchange processes between the Ría de Pontevedra and the coastal ocean, a multiple-nested grid with two-way nesting between first (FD), second (SD), and third (TD) domains was used (Figures 1A,B). An external large domain (LD) was implemented to properly solve the exchange between the Ría and the coastal ocean. The LD (Figure 1A) horizontal resolution is 1/27° (∼3 km in longitude), its boundary conditions are described in Nolasco et al. (2018). The LD domain also provides initial and boundary conditions, through offline nesting to the FD domain. The FD, SD, and TD domains (Figure 1B) have a horizontal resolution of 1/50° (∼1.6 km in longitude), 1/150° (∼0.550 km in longitude) and 1/450° (∼180 m in longitude), respectively, and are run with a timestep, dt, of 120 s for FD, 60 s for SD and 20 s for TD. SD was designed to solve inter-Ría and shelf circulation and TD solves simultaneously the three southernmost Galician Rias: Vigo, Pontevedra and Arousa (Figure 1C). Initial and boundary conditions for the SD, and TD domains are provided using two-way nesting with the FD and SD domains respectively.
The target domain, TD, has 30 sigma vertical levels employing stretching factors θb = 0 and θs = 5 to provide higher vertical resolution model outputs in the upper water column. The minimum depth (hmin) was set as 5 m. Bathymetry data were obtained from the RAIA observatory1. Near the slope, smoothing was applied such that model bathymetry satisfied the condition that grid cell slope (r = dh/2h) did not exceed 0.2 (Haidvogel and Beckmann, 1999). A non-local, K-profile parameterization (KPP) boundary layer scheme (Large et al., 1994) is used to parameterize the unresolved physical vertical subgrid-scale processes. For lateral subgrid-scale mixing, the Smagorinsky model is used to define the horizontal viscosity and diffusivity, implemented through a rotated diffusion operator, as detailed in Marchesiello et al. (2009).
Surface variables, (winds, shortwave and downward longwave radiations, precipitation, air temperature, and humidity) were used to force this configuration. They were extracted from the 4 km resolution operational domain of MeteoGalicia, for 2015, which was run using the Weather Research and Forecasting (WRF) hourly model. Outputs were provided by a thredds server2.
Hourly WRF model outputs from MeteoGalicia, described above, were interpolated onto the model grid to generate temporally and spatially variable wind forcing. WRF output data from a location representative of shelf wind was extracted at 42.30° N of latitude and 9.1° W of longitude (Figure 2; white cross). While wind data for 2015 is highly variable, southerly winds dominate during autumn/winter and northerly winds dominate during spring/summer (Figure 3B). Cross-shelf circulation responds to southerly/northerly winds at timescales faster than the inertial period (17.8 h), generating downwelling/upwelling events that last an average of ∼2.6/∼3.3 days (Gilcoto et al., 2017). During 2015, two long periods with nearly constant wind directions occur for several days (Figure 3B): one from mid-May to mid-June, with northerly winds blowing for approximately 27 days, intercepted by some short inversions of southerly winds; and another in December with southerly winds blowing for 17 days.
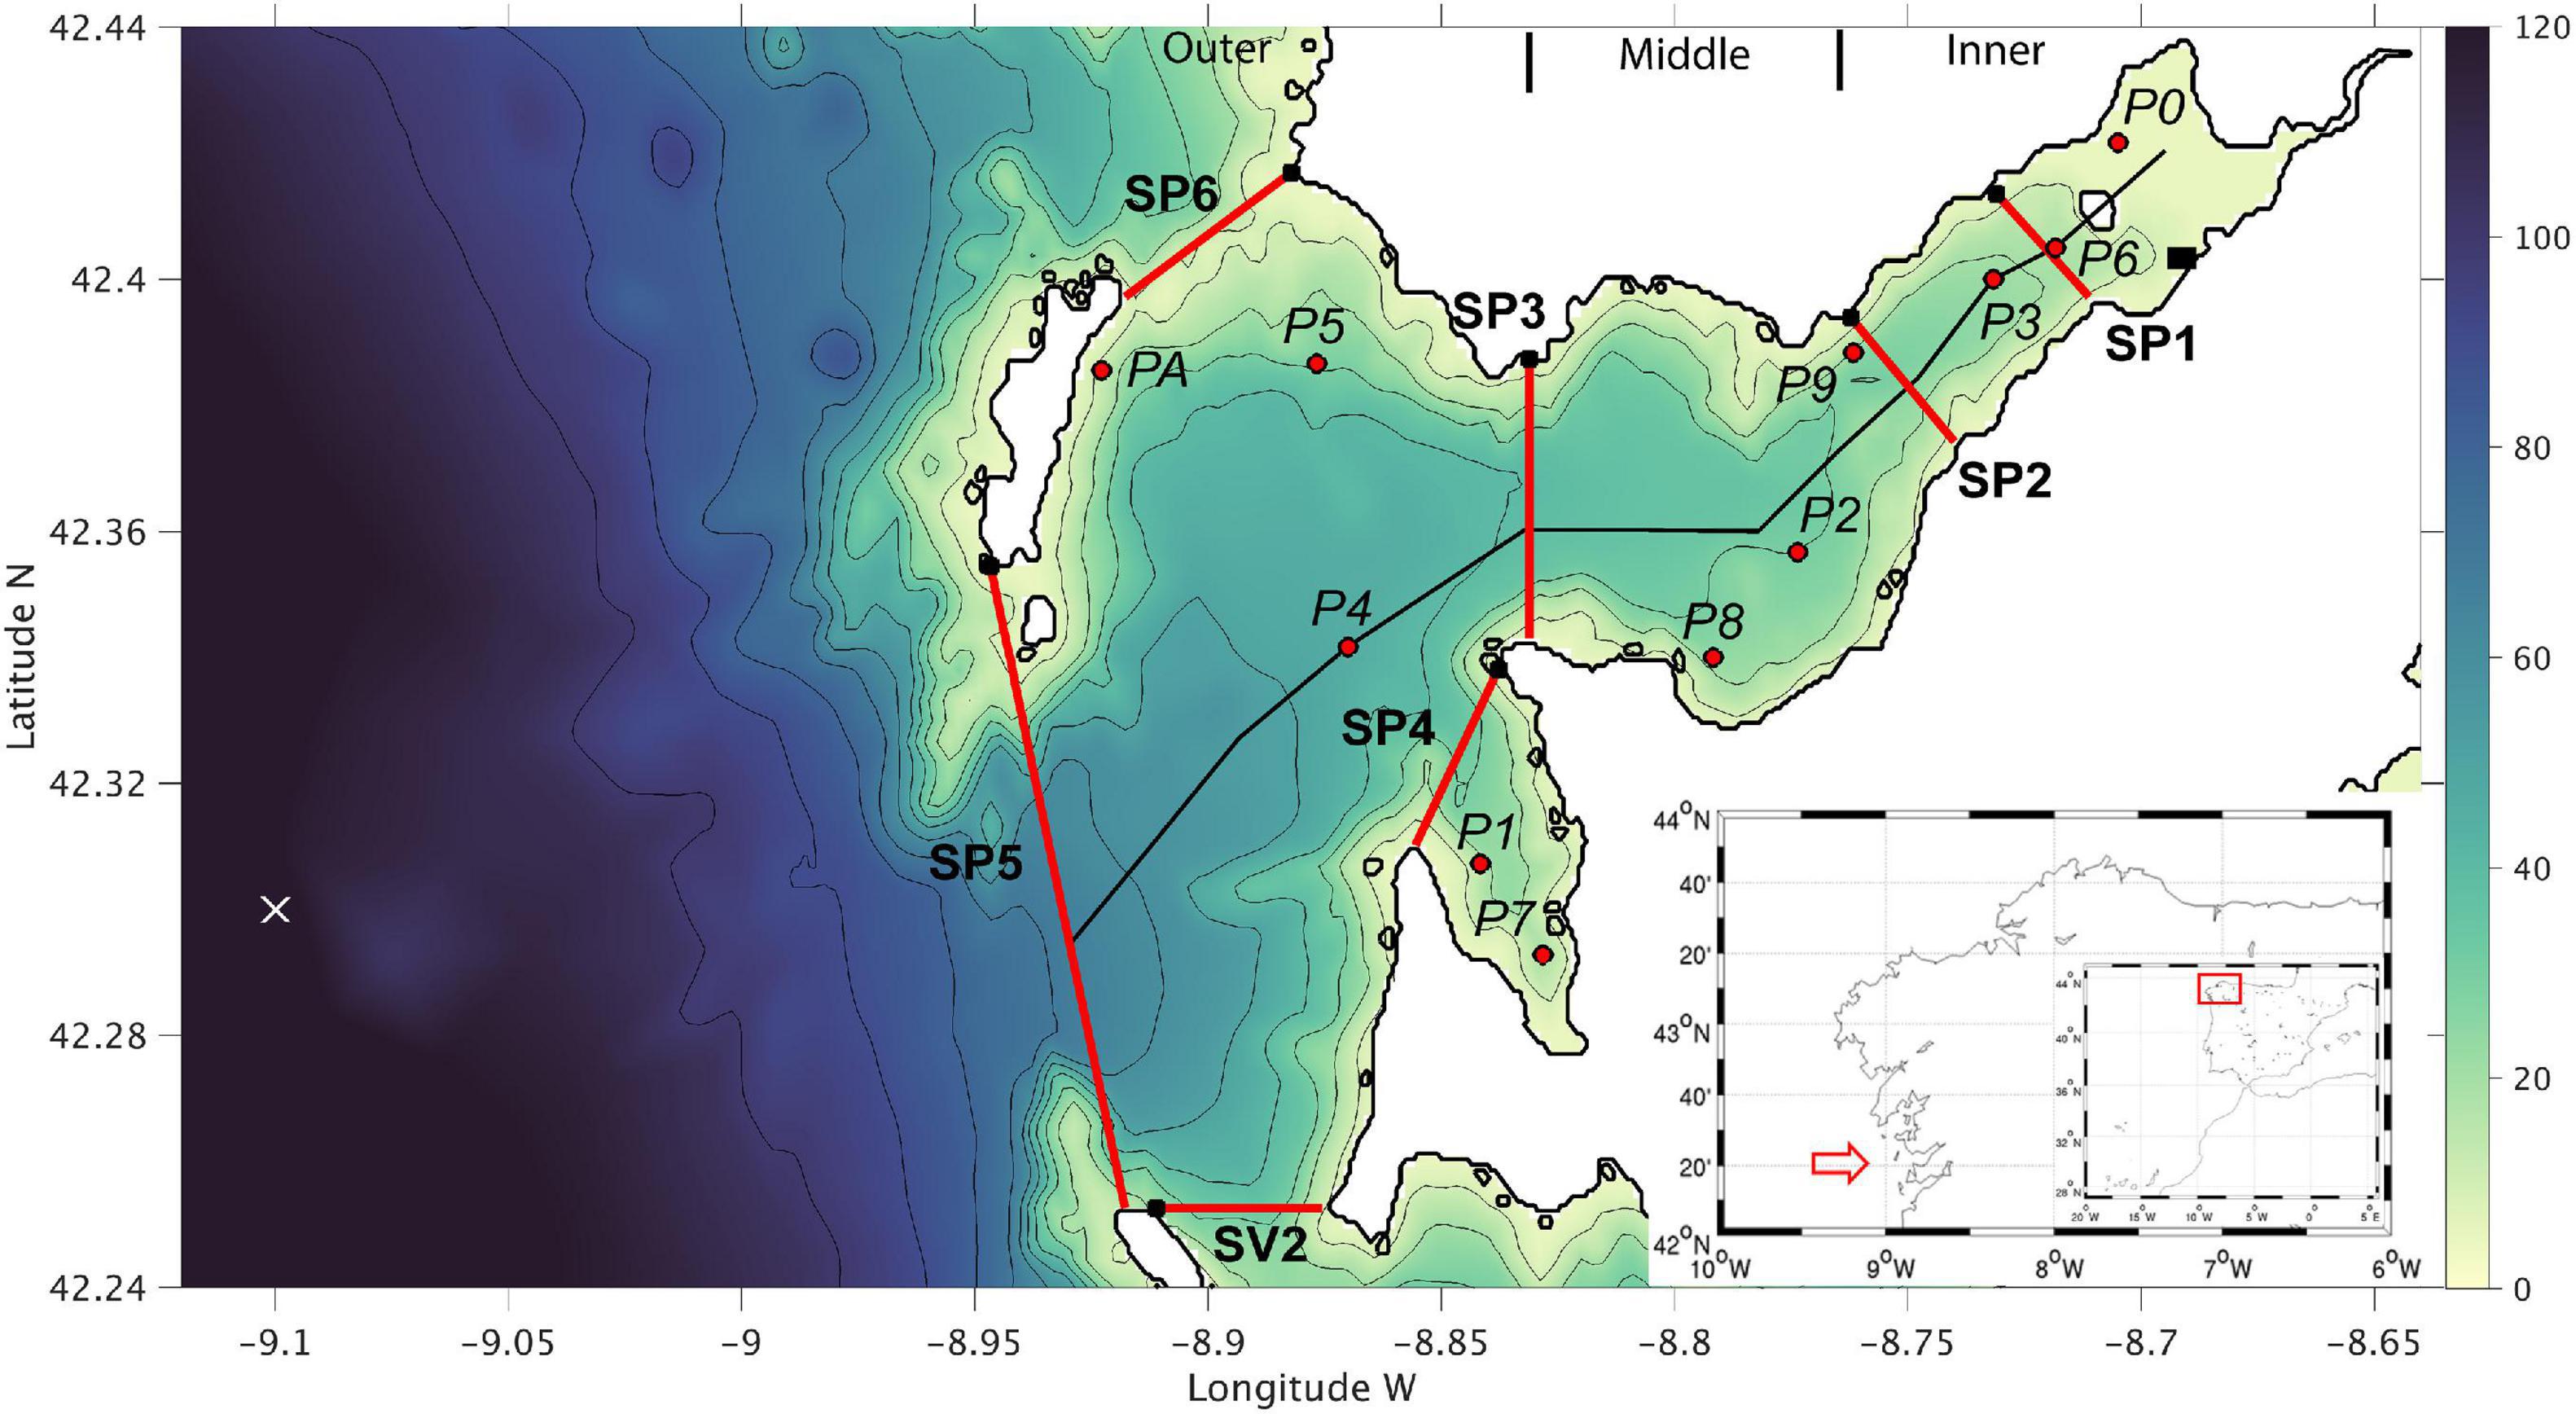
Figure 2. Bathymetry of the Ría de Pontevedra and surrounded shelf, with isobaths at 10 m intervals, cross-sections (red lines), INTECMAR CTD stations (red dots), and along-Ría section (black thin line) used below. Wind point data (white cross) is located offshore. Origin of vertical sections displayed in Figure 9 is designated by black small squares superimposed on red lines. Sea level gauge location is represented by a black square.
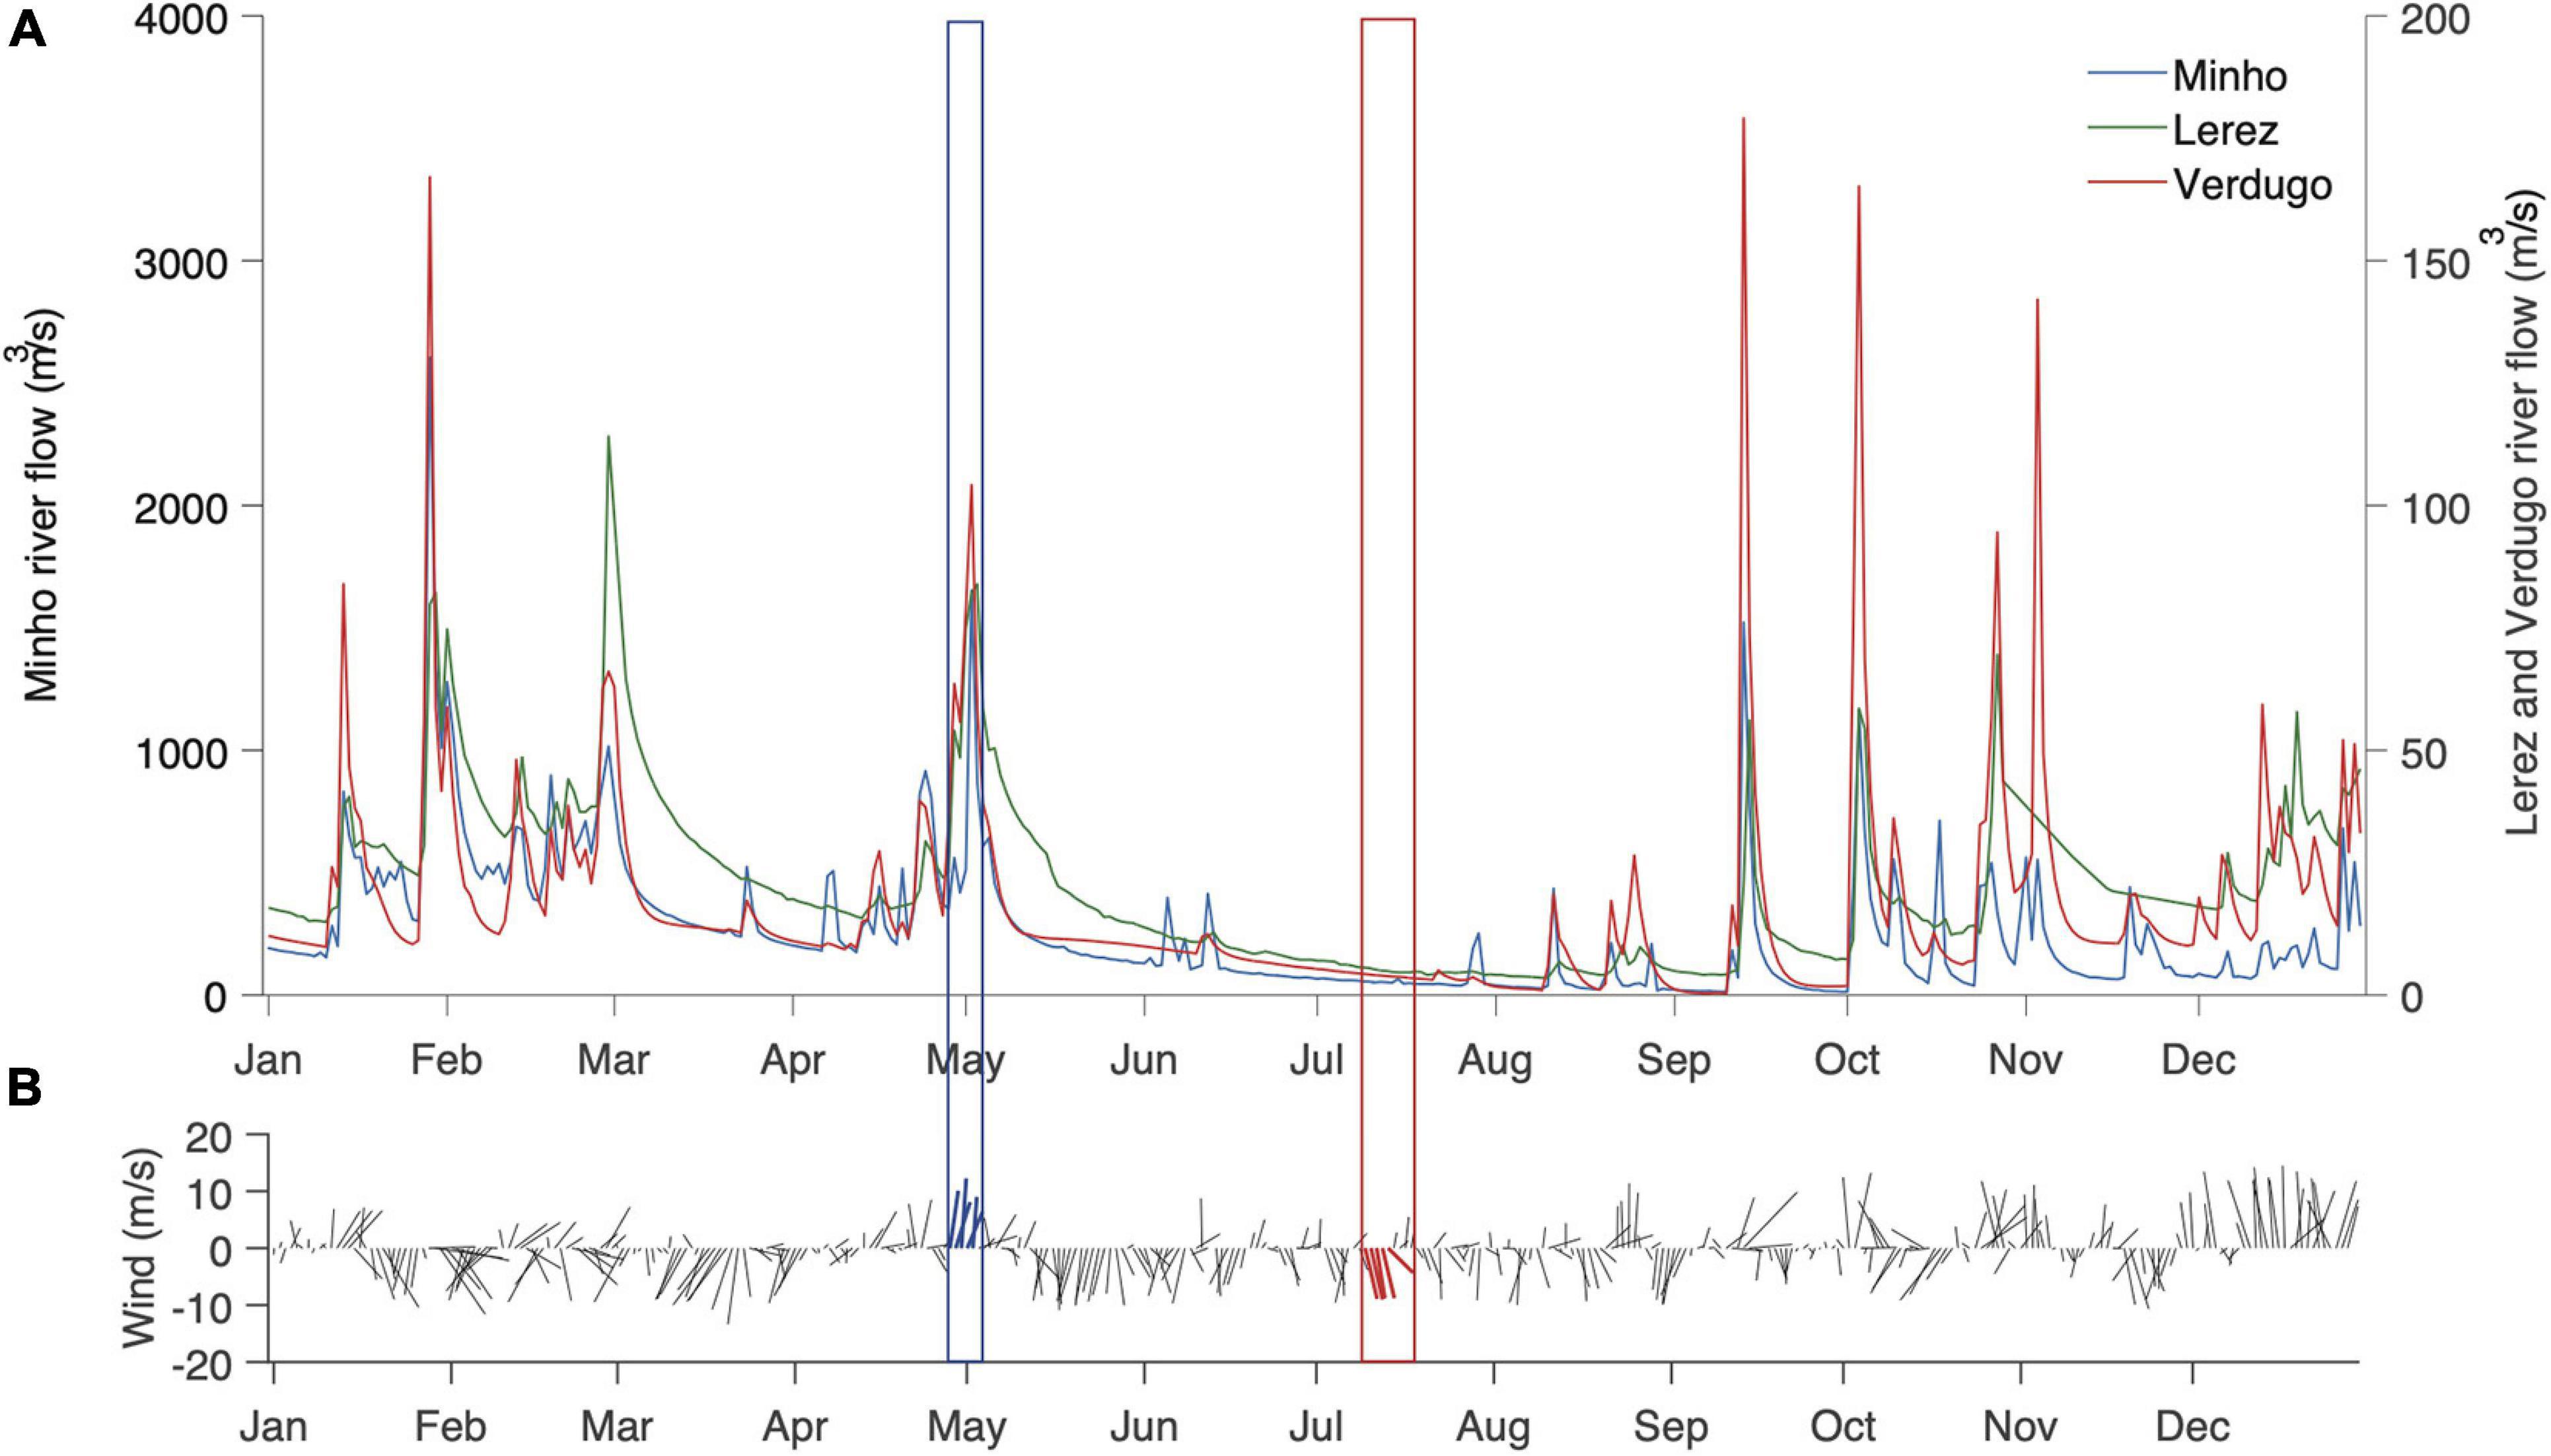
Figure 3. Time series of (A) rivers flow (m3/s) for Minho (blue), Lérez (green), and Oitavén-Verdugo (red) rivers with corresponding scales on both sides for Minho river at the left and for Lérez and Oitavén-Verdugo rivers at the right side. (B) Stickplot of daily mean wind directions and intensities (m/s): positives values indicate southerly winds (downwelling favorable winds), and negative values indicate northerly winds (upwelling favorable winds). Blue/red boxes and vectors represent the downwelling/upwelling events analyzed.
Tidal currents inputs were implemented in a similar way to the Marta-Almeida and Dubert (2006) study. In this way, ROMS was forced at the boundaries with tidal parameters, obtained from OSU TOPEX/Poseidon Global Inverse Solution, TPXO (Egbert and Erofeeva, 2002) global tidal model, for elevations (amplitudes and phases) and for current ellipses (semi-major axis, semi-minor axis, inclination, and phase) to solve tidal propagation and currents. Sea surface elevations and tidal currents were extracted for the main semi-diurnal (M2, S2, N2, K2) and diurnal (K1, O1, P1, Q1) constituents, with a resolution of 1/12° for the North Atlantic.
Freshwater riverine inflow (Figure 3A), together with winds are major drivers of subtidal estuarine circulation in the Ría de Pontevedra. Salinity within the Ría de Pontevedra is principally influenced by three rivers: Lérez river, which discharges directly into the Ría de Pontevedra, Oitavén-Verdugo river which discharges into the Ría de Vigo, and the Minho river which discharges into the open ocean approximately 30 km south of Rias Baixas (Figure 1C). Average annual river flow from the Minho river is ten times that from the Oitavén-Verdugo and Lérez rivers, and it plays an important role in the generation of the WIBP. The influence of all rivers within the FD, SD, and TD domains are accounted for by applying available runoff data in m3/s to model cells nearest river discharge locations. Freshwater discharge for the Minho and Douro rivers was obtained from Water Institute of Portugal (INAG). Discharge for the Ulla, Umia, Lérez, and Oitavén-Verdugo were obtained from MeteoGalicia. For periods where observations were not recorded freshwater discharges were calculated using the Soil and Water Assessment Tool (SWAT) from MeteoGalicia (see text footnote 2) (Costa et al., 2012).
A validation of the Sea Surface Height (SSH) was done by comparison of the modeled and observed results. For that purpose, the SSH field of the Marín sea level gauge (see Figure 2) was used, available at Puertos del Estado website3. The SSH field was decomposed into tidal (astronomical) and subtidal components for both modeled and observed fields. Other output variables of the model that contain high frequencies (T, S, u, v, w) were filtered using a low pass filter (with a 33 h cut-off period). In this way, results analyzed here are representative of the subtidal range. To validate the model output, salinity and temperature data are compared with field data from eleven CTD stations sampled weekly by the Instituto Tecnolóxico para o Control do Medio Mariño de Galicia (INTECMAR4) shown in Figure 2 (red dots). Model results extracted from the along-Ría transect shown in Figure 2 (black line) were analyzed to determine along-estuary circulation processes. Ocean model data (vertical resolution of 1 m) were extracted at cross-sections representing SP1-SP6 and SV2 (Figure 2; red lines), and INTECMAR stations (Figure 2; red dots), to determine 3D circulation regimes throughout the system. The Ría de Pontevedra is divided into three main basins (Figure 2) regarding the coastline geometry: the outer one (from SP5 to SP3 sections), strongly connected with the shelf, with a width scale of ∼17 km, the middle Ría (from SP3 to SP2 sections), which has a width scale of ∼7 km, and the inner Ría (from SP2 to up estuary) with a width scale of ∼3 km.
Several statistical estimators were used to compare observed and modeled data. The root mean square error (RMSE; Willmott, 1981) represents the sample standard deviation of the differences between modeled and measured values. The bias provides information about the model tendency to overestimate or underestimate the observed data, quantifying the systematic error of the model. The skill parameter (Willmott, 1981) is a measure of the quantitative agreement between the model and the observations. It considers the modeled and observed deviations around the observed mean, , to estimate the model representation, and varies between 0 (no agreement) and 1 (perfect agreement). These parameters are described as follow:
where Xmod and Xobs are the modeled and the measured data, respectively, and N is the number of analyzed data.
To examine the main modes of variability of the velocity fields, we perform an EOF analysis to these fields via singular value decomposition (SVD; Preisendorfer and Mobley, 1988). More details about the application of EOF methodology are provided in Supplementary Material.
Two different EOF analysis were applied to the hourly subtidal velocity fields, one at two horizontal layers: the surface and z = 20 m depth throughout the Ría de Pontevedra and another across the vertical cross-sections. The horizontal (vectorial) rvEOF analysis was computed for the meridional (V) and zonal (U) subtidal components of the surface velocity. The vertical (scalar) EOF analysis was applied to the normal component of the subtidal velocities obtained from the different cross-sections (Figure 2): the three openings at northern (SP6), central (SP5), and southern (SV2) cross-sections, and the middle (SP3) and inner (SP2 and SP1) cross-sections. Model output data down the water column was collected at vertical intervals of 1 m, every 300–400 m for across cross-sections SP1, SP2, SP4, SP5, SP6, and SV2, and every 182 m at SP3. The temporal PC from vertical and horizontal EOF analysis were compared with normalized meridional and zonal subtidal remote wind components.
First, model validation is presented through comparison of sea surface height, temperature and salinity data. Following model validation, results from simulations of one upwelling event and one downwelling/high river discharge event are analyzed. Results of horizontal and vertical EOF analysis investigating the relationship between wind and surface circulation are then presented.
Model accuracy was evaluated through statistical comparisons between field data obtained down the water column at eleven CTD-stations (Figure 2), a sea level gauge and model output, coinciding with field locations during the year 2015. Table 1 shows some statistical estimators (RMSE and skill) for the validation of total, tidal (astronomical) and residual sea surface height. RMSE is around 14–16 cm for total and tidal components and ∼8 cm for residual sea level. These RMSE scores for total and tidal components represent a small fraction of the mean tidal range (3.5 m). Skill scores are near one for total and tidal components, with exception of the residual component, 0.77. We can conclude that model output compares reasonably well with the sea level gauge data.
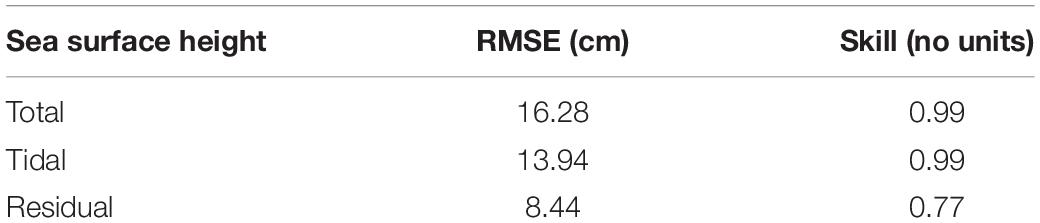
Table 1. Model-measured data comparison for total, tidal (astronomical), and residual sea surface height.
Table 2 summarizes the model accuracy in reproducing observed temperature (°C) and salinity data at eleven stations down the water column. Overall agreement between model and observed data is strong, with mean RMSE across the eleven stations 0.4 PSU and 0.8°C for temperature, mean bias 0.02 PSU and 0.3°C, and mean skill 0.9 and 0.95, for salinity and temperature, respectively. The highest disagreement with respect to salinity and temperature occurred at the most up-estuary site P0 (Table 2). While the lowest skill score was achieved for salinity at the most down-estuary site PA, located behind Ons Island (Figure 1C). Despite the differences between the model and measured data at some stations that are sheltered by the Ría topography, we can confirm that other nearby stations show good agreement.
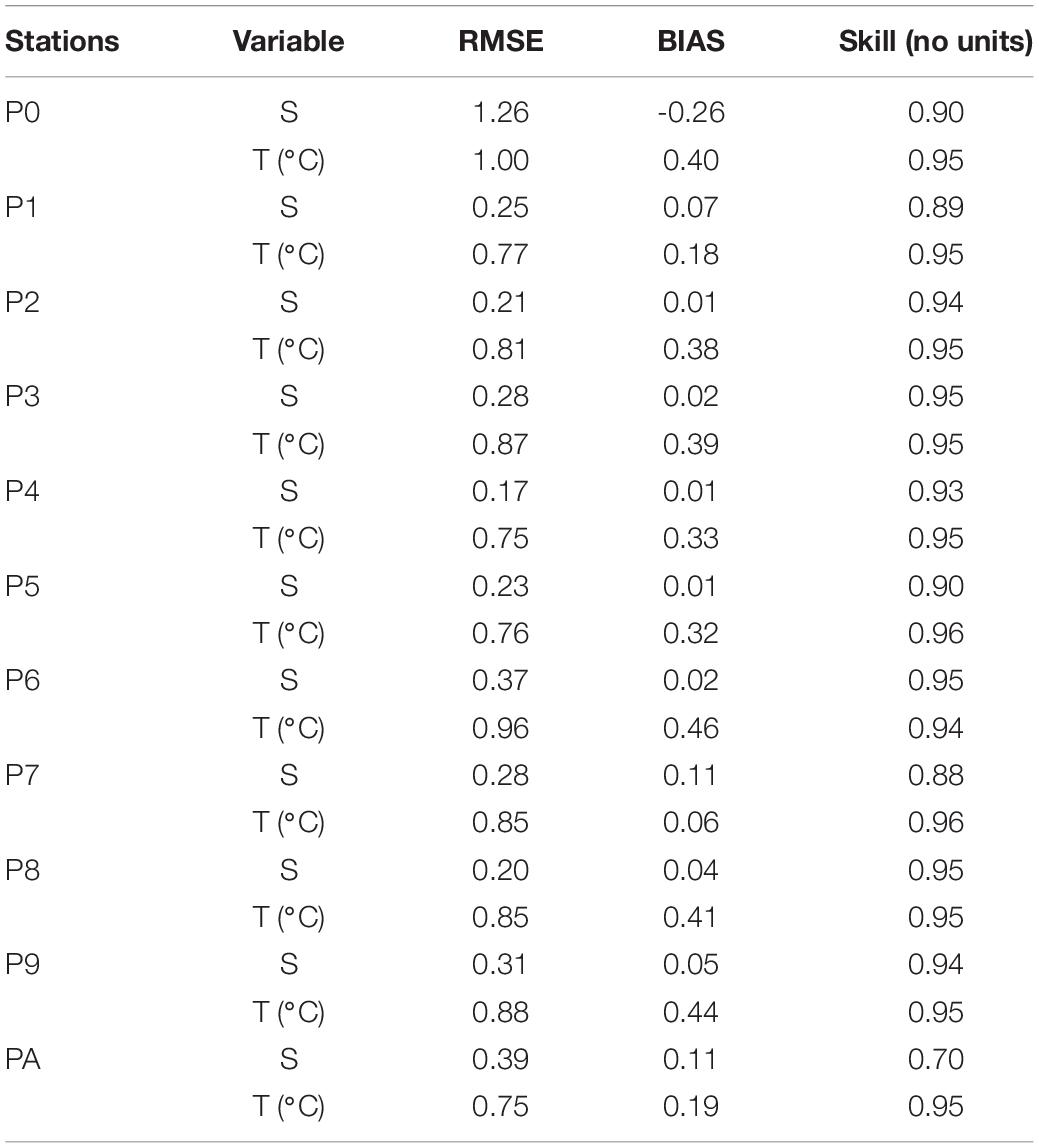
Table 2. Model-measured data comparison calculations for salinity (S) and temperature (T; °C) along all the water column.
Model results were compared with temperature and salinity data from two INTECMAR stations (Figure 2), for the year 2015. Comparison was done at 2 and 35 m depth for the outer Ría station, P4 (Figures 4A,C), and at 2 and 10 m depth for the inner Ría station, P3 (Figures 4B,D). Vertical salinity and temperature distributions were obtained at the outer Ría, P4 station (Figures 4E–H). Strong agreement between modeled and observed data was achieved throughout the seasonal cycle, at both depths (Figures 4A–D), as well as down the water column (Figures 4E–H). The model ability to replicate observed conditions is demonstrated by skill parameter values of 0.95 for salinity and temperature at P3 station, and 0.93 and 0.95 for salinity and temperature at P4 station. Temperature both near the surface (2 m) and at depth (10 and 35 m) (Figures 4A,B) shows nearly constant values of 12–13°C, from January to April. Variability in observed temperature and salinity during spring was well-reproduced, including temperature increases associated with the May downwelling event (Figures 4A,B). Reduction in salinity associated with the May 2015 downwelling/high rainfall event was well-reproduced at the outer Ría, P4 site. At the inner estuary site, P3, the model over-predicted the reduction in salinity in surface waters (Figure 4D, May). During summer and autumn months, the higher variability in surface and bottom temperatures is well represented by the model, including the reduction in temperature associated with the July 2015 upwelling event (Figures 4A,B,E,F). Vertical temperature stratification trends are also replicated, however bottom temperatures are typically over-predicted (higher than observed) (Figures 4A,B). From mid-November to the end of the year the characteristic cooling from late autumn to winter is also well reproduced by the model simulation (Figures 4A,B). Bottom salinity data (Figures 4C,D; red dashed line and dots) show little temporal variability throughout the year at both outer and inner Ría stations (Figures 4C,D) remaining at ∼35 and ∼35.5 PSU, respectively. Surface salinity is more variable, both temporally and spatially, with lower salinity (∼34.5 PSU at outer station and ∼33 PSU at inner station) associated with high river inflow. Surface salinity variability is well replicated by the model (Figures 4C,D,G,H). During the May 2015 downwelling event, a decrease in salinity is observed at both stations (Figures 4C–E,G) and at different depths. At the inner estuary, P3 station, the low salinity signal is due to high freshwater discharge from the Lérez river (Figure 3). At the outer Ría, P4 station, the low salinity signal is associated with water from the Ría de Vigo and the WIBP (Supplementary Video 1).
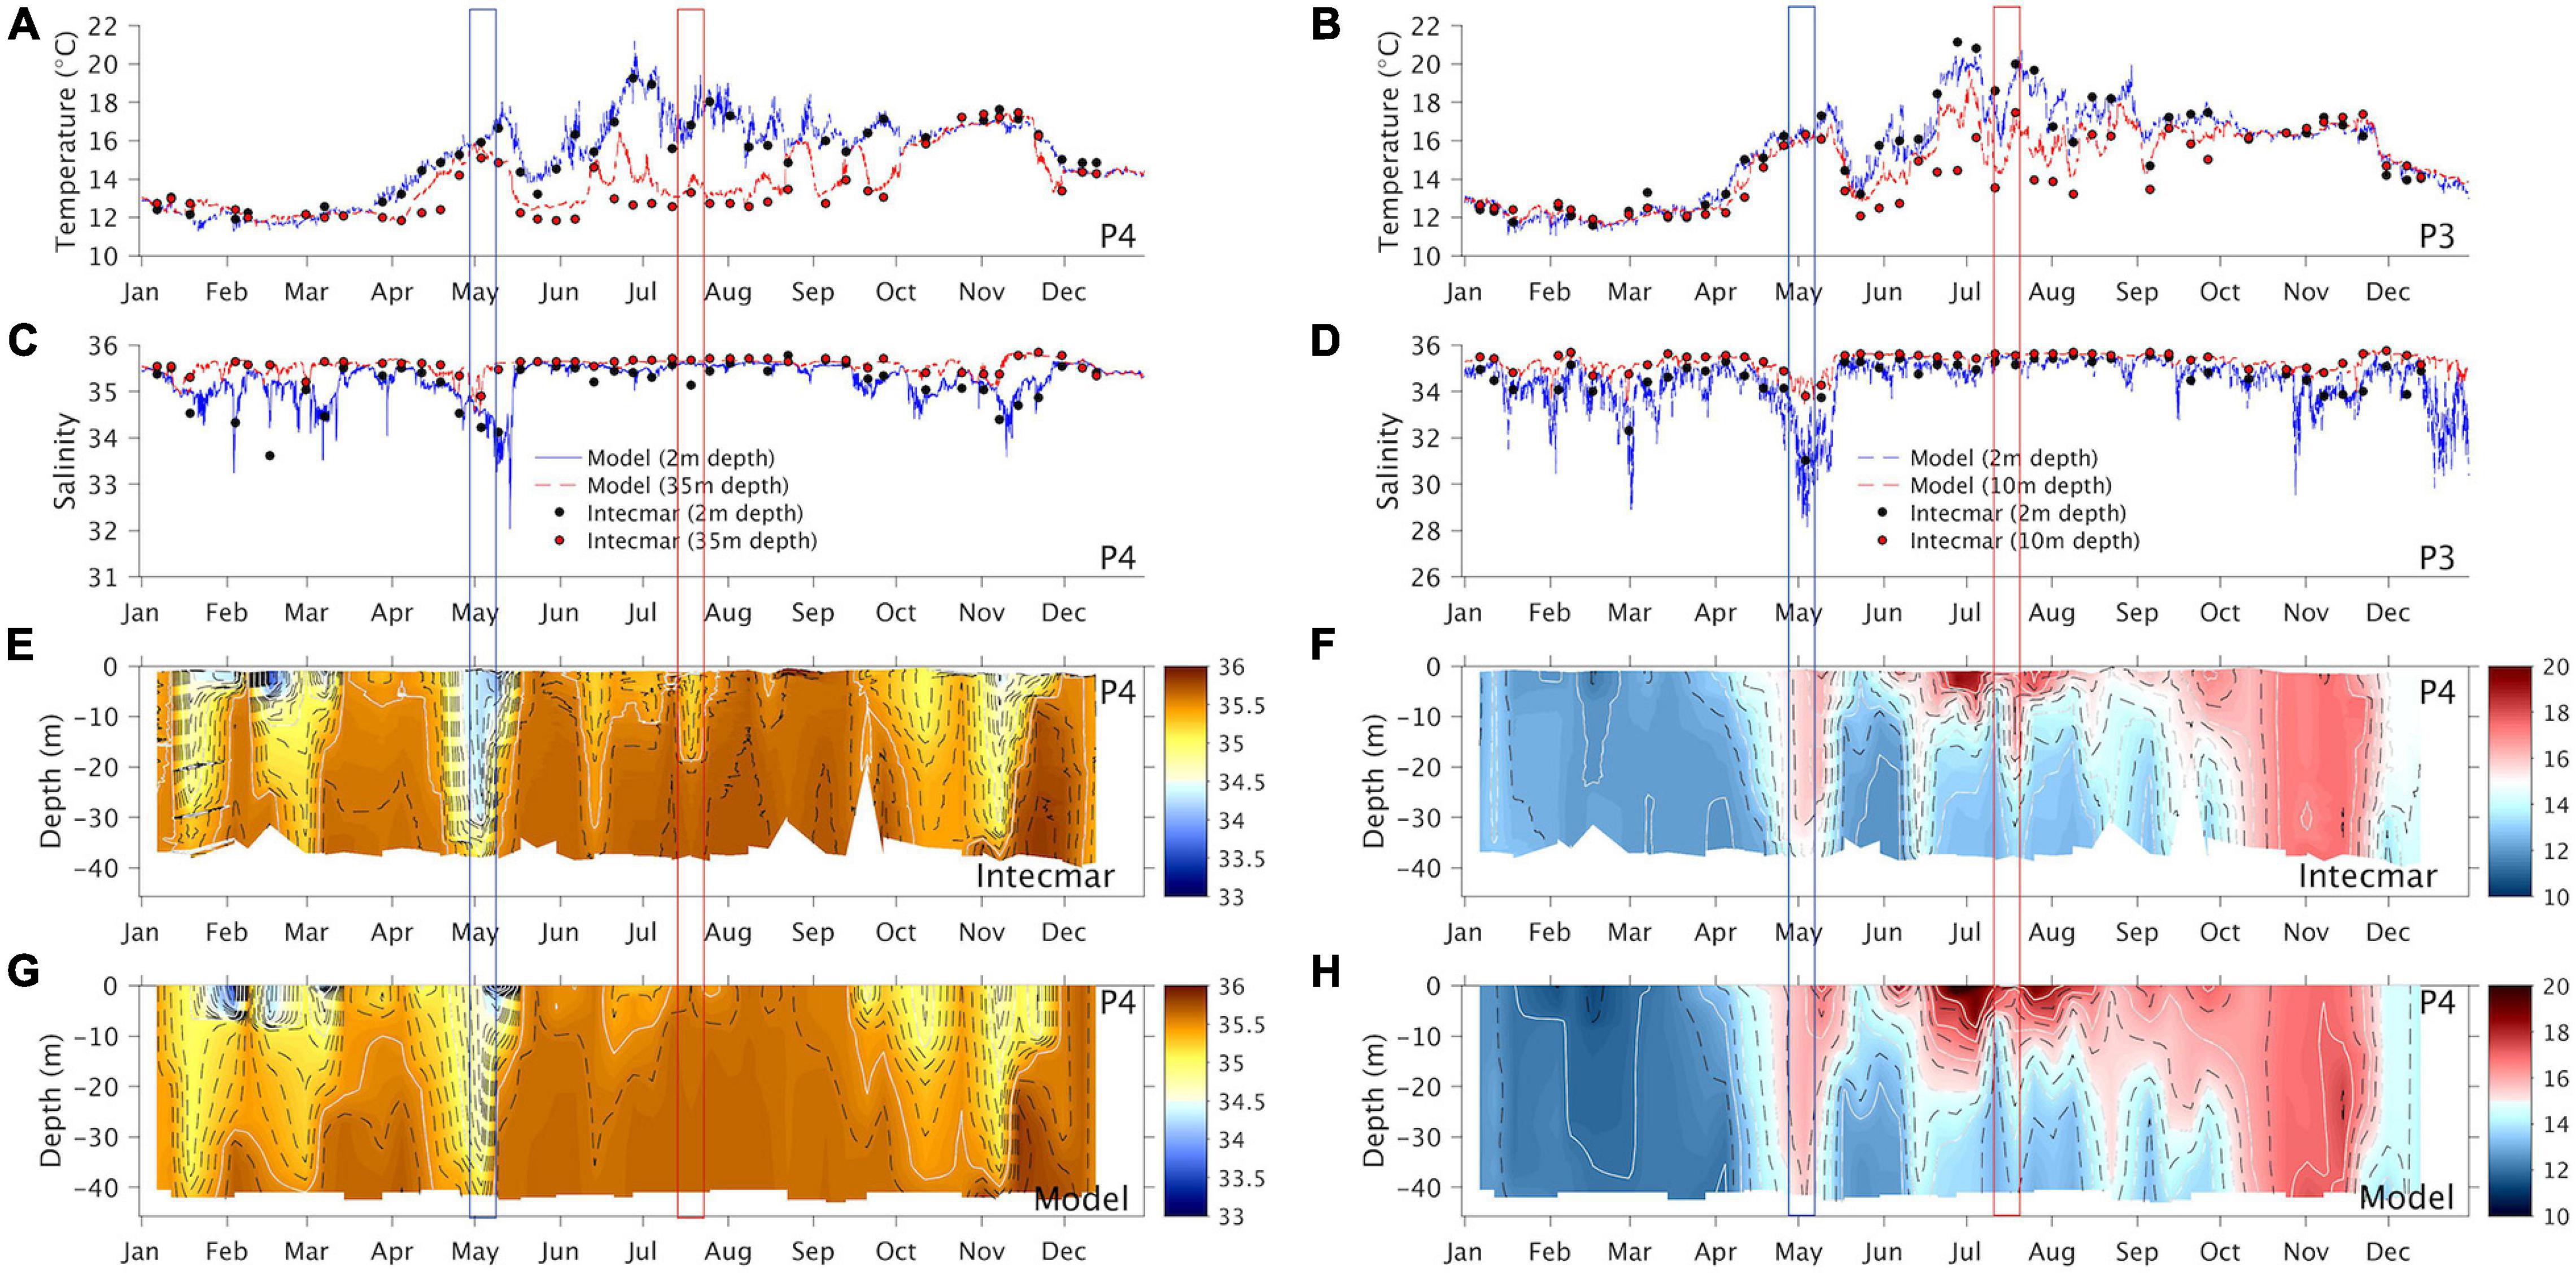
Figure 4. Comparison of modeled (dashed line) and measured (INTECMAR; dots) surface and deep temperature and salinity data for (A,C) P4 and (B,D) P3 INTECMAR stations (see Figure 2 for stations location). Comparison of 2015 yearly evolution of salinity vertical profile for (E) INTECMAR P4 station and (G) the modeled P4 station. (F,H) Same as (E,G) for temperature (°C). Blue/red boxes represent the downwelling/upwelling events analyzed.
To investigate the effect upwelling has on circulation in the Ría de Pontevedra, a northerly wind event in July 2015 was investigated. This event was selected, as it commenced after the development of typical summer stratification of the water column, and after riverine runoff had decreased to summer baseline levels (∼5 m3/s). As a consequence, changes in temperature and salinity distributions could be attributed to upwelling. The upwelling-favorable wind event began on July 5 lasting until July 15, with 5–10 m/s northerly winds blowing from July 5 to 9 and light southerly winds blowing on July 10, followed by ∼10 m/s northerly winds blowing from July 11 to 15. The effect of upwelling on the Ría circulation was investigated by analyzing model 3D current patterns extracted at 13:00 h, July 12, 2015 (Figure 5), at seven cross-estuary transects and at the outer Ría, P4 station (Figure 2). This day was selected to visualize Ría conditions, since on that day the upwelling signal had reached central and inner Ría sites. Daily mean currents were analyzed to determine the subtidal estuarine circulation patterns associated with the upwelling event, the results of which are plotted in Figure 6.
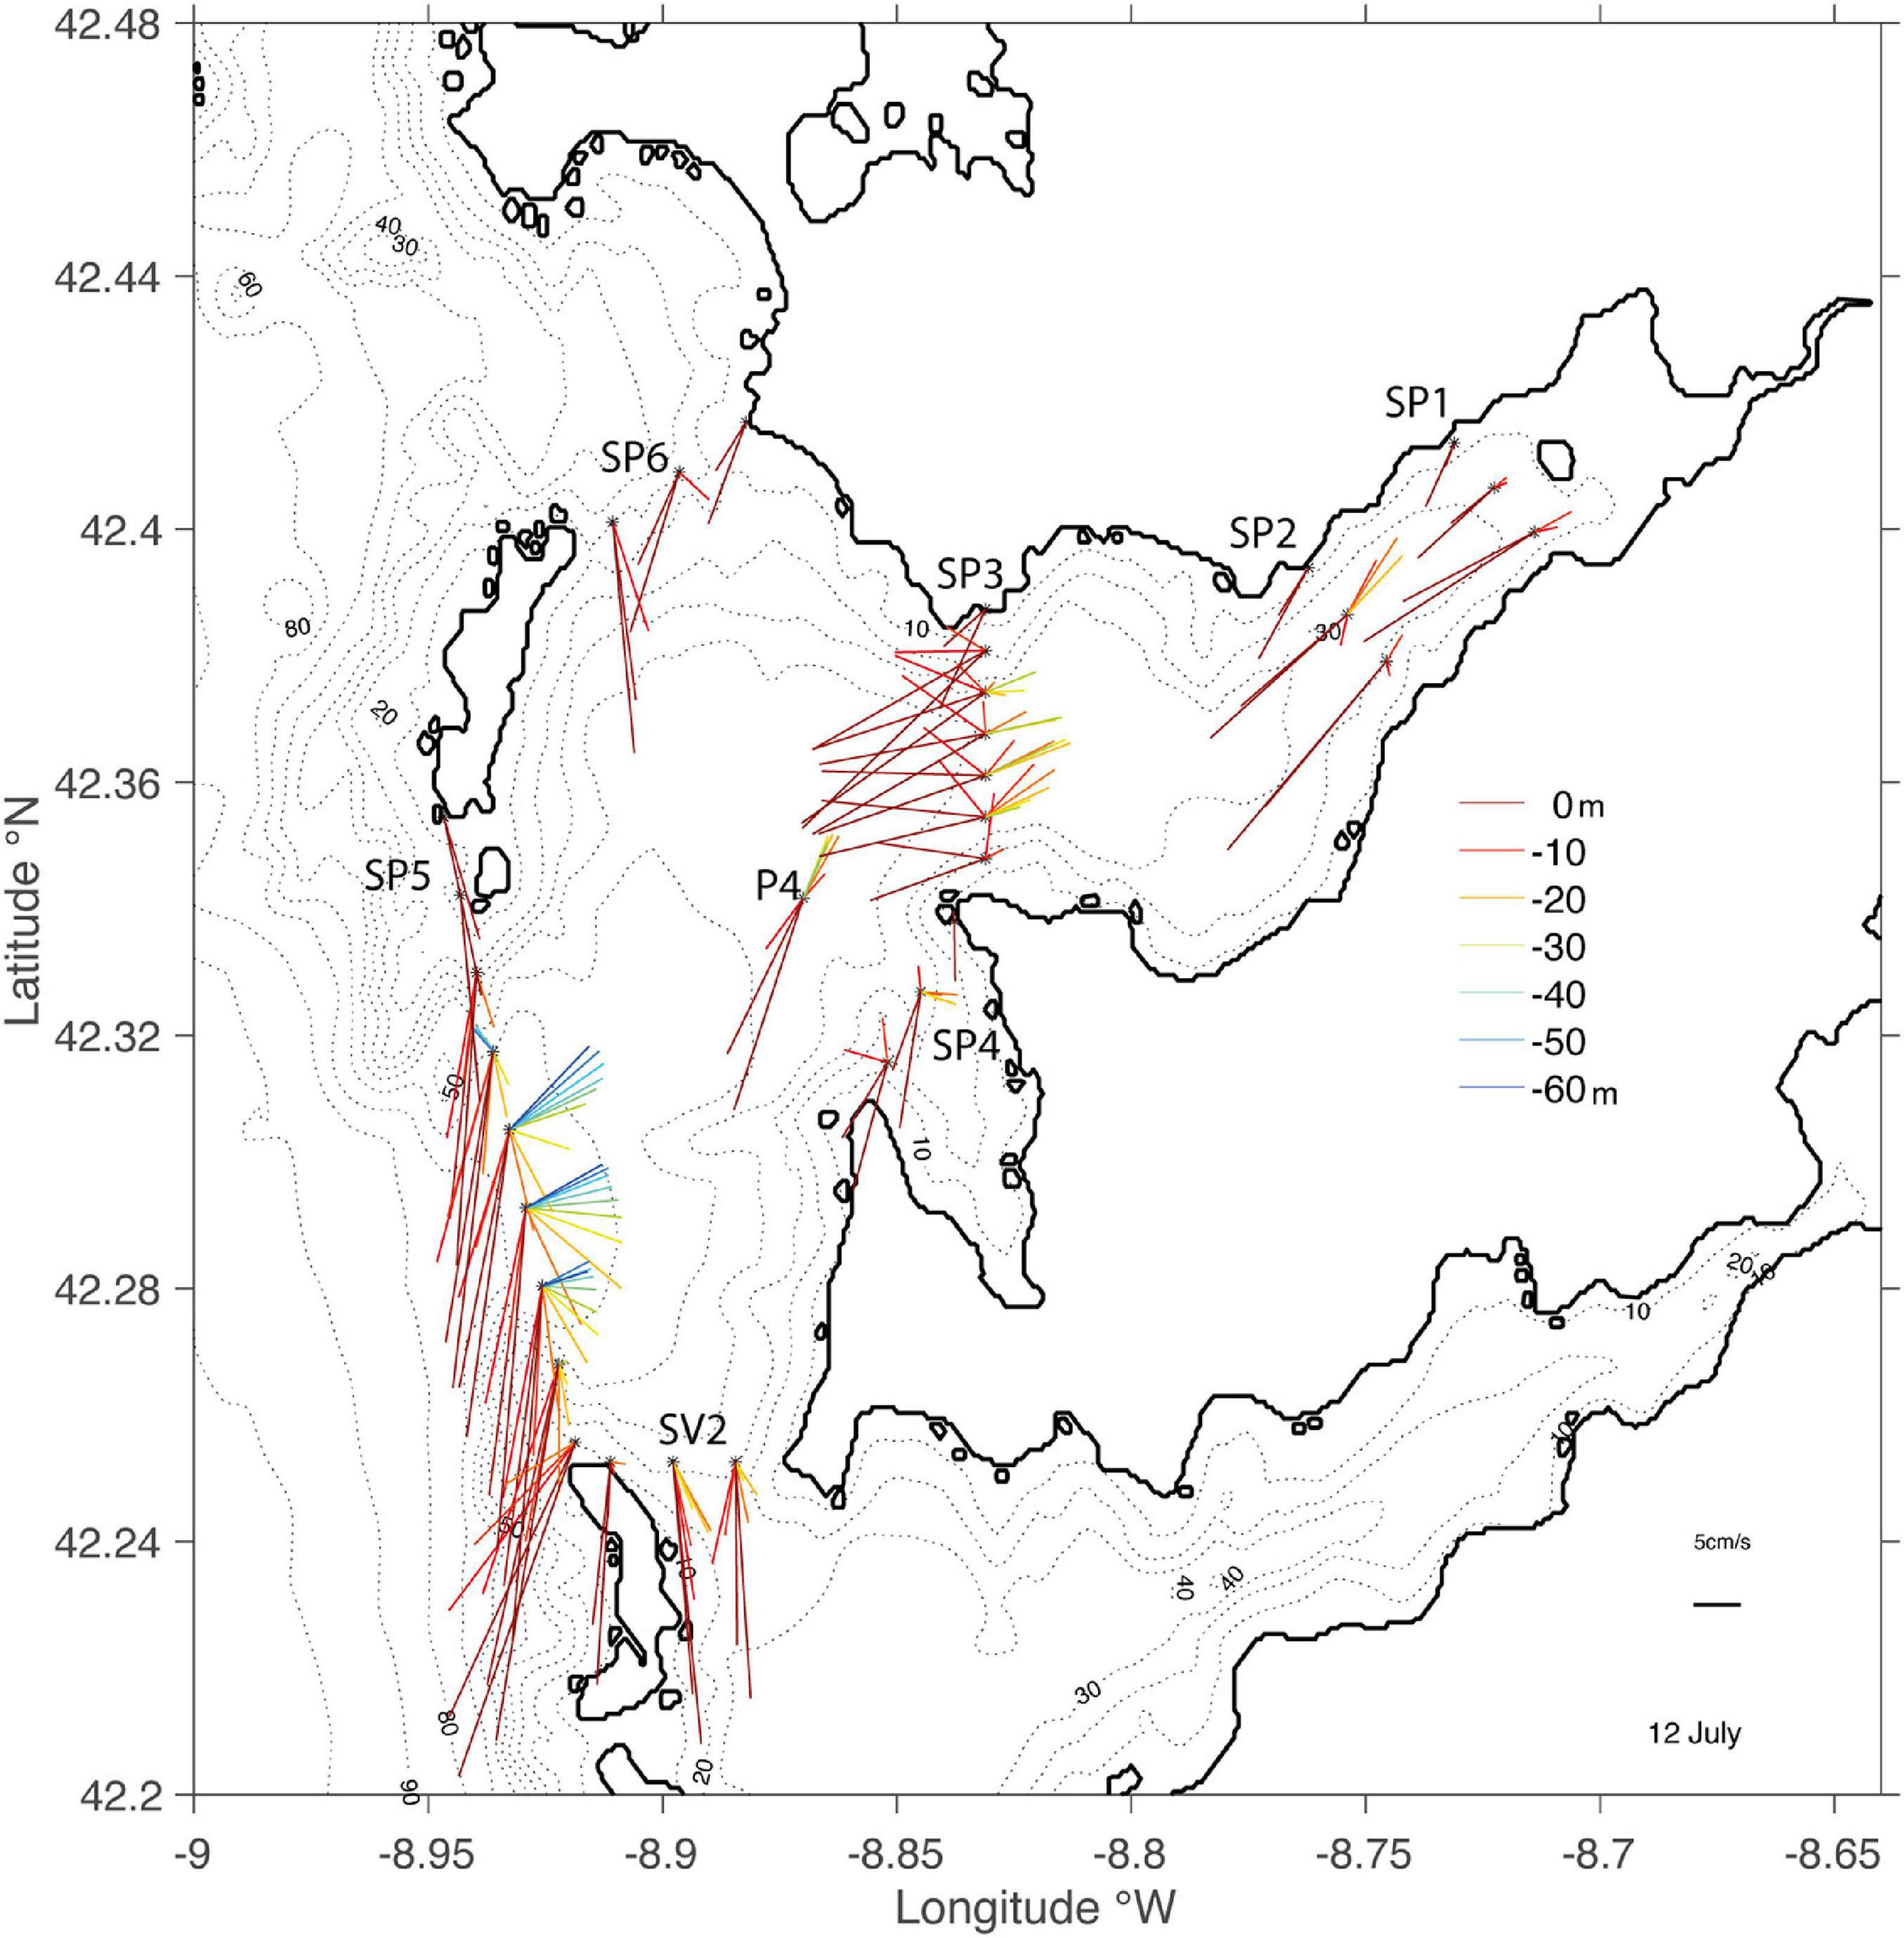
Figure 5. Subtidal velocities (cm/s) at cross-sections and P4 station for 12 July at 13 h. The scale of colors of the sticks corresponds to the depths depicted by the bar, inner cross-sections, SP2 and SP1, represent velocities with light red and yellow. The velocity scale is displayed at the lower right corner.
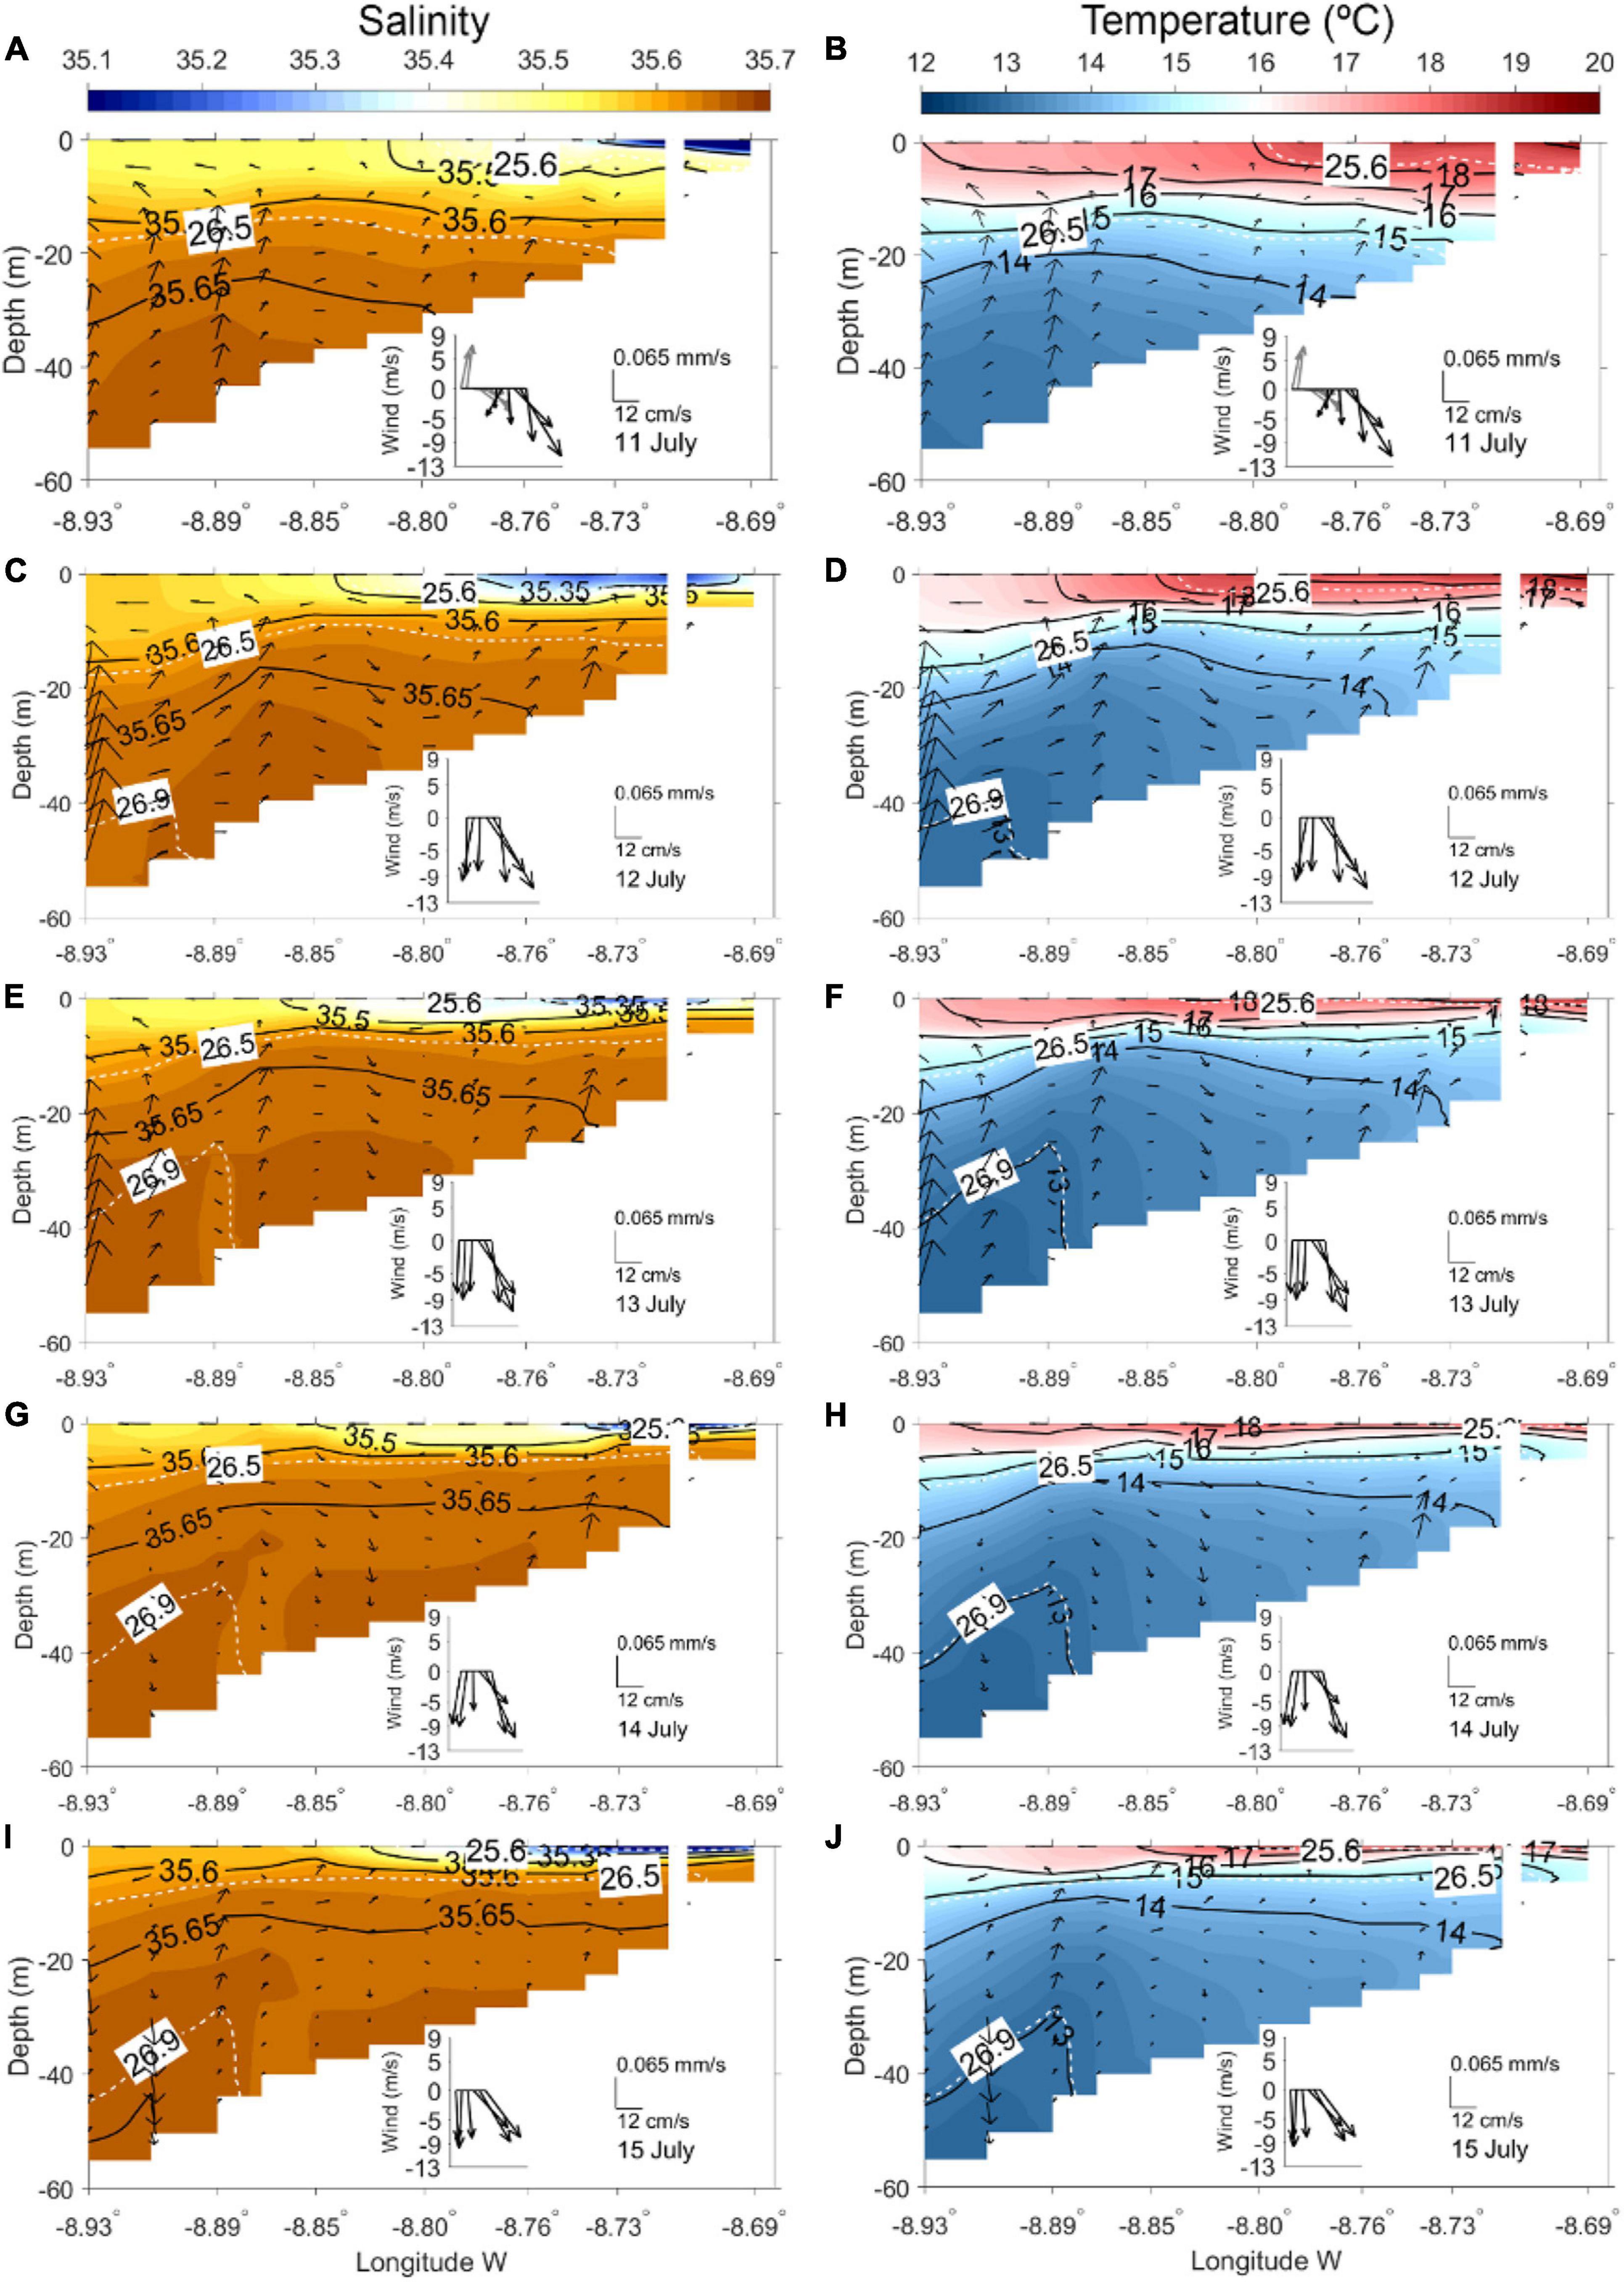
Figure 6. Along-Ría section displayed in Figure 2 for daily mean salinity (A,C,E,G,I) and temperature (°C); (B,D,F,H,J) superimposed by sigma-t isolines, and subtidal velocity for along section (cm/s) and vertical directions (mm/s) with the corresponding scale as shown on 11, 12, 13, 14, and 15 July. Stickplot of wind evolution for every day at 1, 4, 9, 13, 16, and 21 h are represented inside each graphic and wind before the first day of the event is represented in gray colors for the previous day of the event.
Modeled subtidal circulation at the three openings and at the middle and inner Ría revealed a two-layer circulation whereby surface currents flowed down the Ría, while near the bed currents flowed into the Ría (Figure 5; SP1, SP2, SP3, SP5). Between the outward, and inward flowing currents, a level of null currents occurs. The null level was located at depths of ∼20 and ∼10 m for SP5 and SP3, respectively, and at ∼5 m for both SP2 and SP1. Flow in/out of the estuary differed at the three different Ría openings. For the main Ría opening (SP5) outward flow was directed S/SW, driven by Ekman flow, while at depth inward flow was directed E/NE, aligning with the orientation of the main Ría channel. At both SP6 and SV2, which are shallower, narrower entrances, currents at the surface and at depth were dominated by the presence of the equatorward coastal upwelling jet, with currents flowing into the estuary via SP6, the northern opening, and out of the Ría, via SV2, to the south (Figure 5). In the central and inner Ría (SP3, SP2, and SP1), the direction of inward and outward currents appears to be influenced by both Ekman flow, and topographic steering, since the currents align with the estuary axis at these sites.
The typical estuarine pattern described above (Figure 5) with outflow (inflow) through the surface (deep) layers, was analyzed in more detail through the daily mean along-Ría section (Figure 2) over successive days. The time evolution of temperature, salinity, density and subtidal horizontal and vertical velocity fields, from July 11 to 15, 2015, are shown in Figure 6. Conditions inside the Ría indicate maintenance of the upwelling event over the five days investigated. On July 11 (Figures 6A,B), the river plume is confined to the inner part of the Ría, where salinity is relatively low (<35 PSU). In the inner Ría, horizontal velocities are low (<6 cm/s). Surface wind forcing, and the baroclinic pressure gradient induced by the low river flow, generates offshore transport in surface waters. At the same time, colder shelf waters flow into the Ría via the main opening at depth (below 20 m). This bottom inflow of colder shelf waters is observed by the rising of the isohaline 35.65 PSU (Figure 6A) and the isotherm 14°C (Figure 6B). On July 12 (Figures 6C,D), maximum wind velocities reached 10.9 m/s from the northeast. The setup of the Ekman flow at the surface in the outer Ría and adjacent shelf favors the offshore transport of the Lérez river plume. Inshore flow at depth is well established, as demonstrated by the upwelling of the isolines which rise up to 10 m/day. This corresponds with an estimated vertical velocity of 0.11 mm/s, which is comparable to the modeled velocities. Results from July 13 demonstrate increasing stratification between outward flowing, warmer surface waters and colder shelf waters flowing into the Ría at depth. The continued flow of cold water into the Ría causes isohalines to rise, confining the fresher, warmer water to the upper few meters (<10 m) of water column. On July 14, stratification continues, however velocities at the outer estuary decrease down the water column. By July 15 (Figures 6I,J), stratification in the outer estuary decreases, with surface water temperatures reducing relative to previous days. In the inner Ría, over successive days, bottom water temperatures reduced, and stratification with respect to temperature and salinity increased over successive days.
A vigorous spring downwelling event occurred from April 30 to May 4, 2015 in response to strong (∼10 m/s) southerly winds (Figure 3B). The downwelling-favorable winds coincided with high river runoff from the Lérez River (maximum 84 m3/s on May 4, 2015). In the days preceding the downwelling event, winds were variable, blowing from the northeast and south, with southerly winds coinciding with higher river flow (Figure 3).
Velocities at cross-sections during the downwelling event are depicted in Figure 7 for April 30 at 13 h, the first day of the event. As with the previously described upwelling event, two-layer circulation developed along the main Ría axis, however circulation was reversed, with surface currents flowing up-estuary despite high river flow, and currents at depth flowing down-estuary. At the southern entrance (SV2), currents flow into the Ría at all depths while at the northern opening (SP6) currents flow out of the estuary at all depths (Figure 7). The null level, where residual currents were essentially zero, were located between 30 and 40 m at SP5, ∼20 m at SP3 and at ∼5 m for both SP2 and SP1. The surface inflow during this downwelling events has a prevailing NE direction associated with the poleward coastal downwelling jet, whilst the bottom outflow has a W/SW direction.
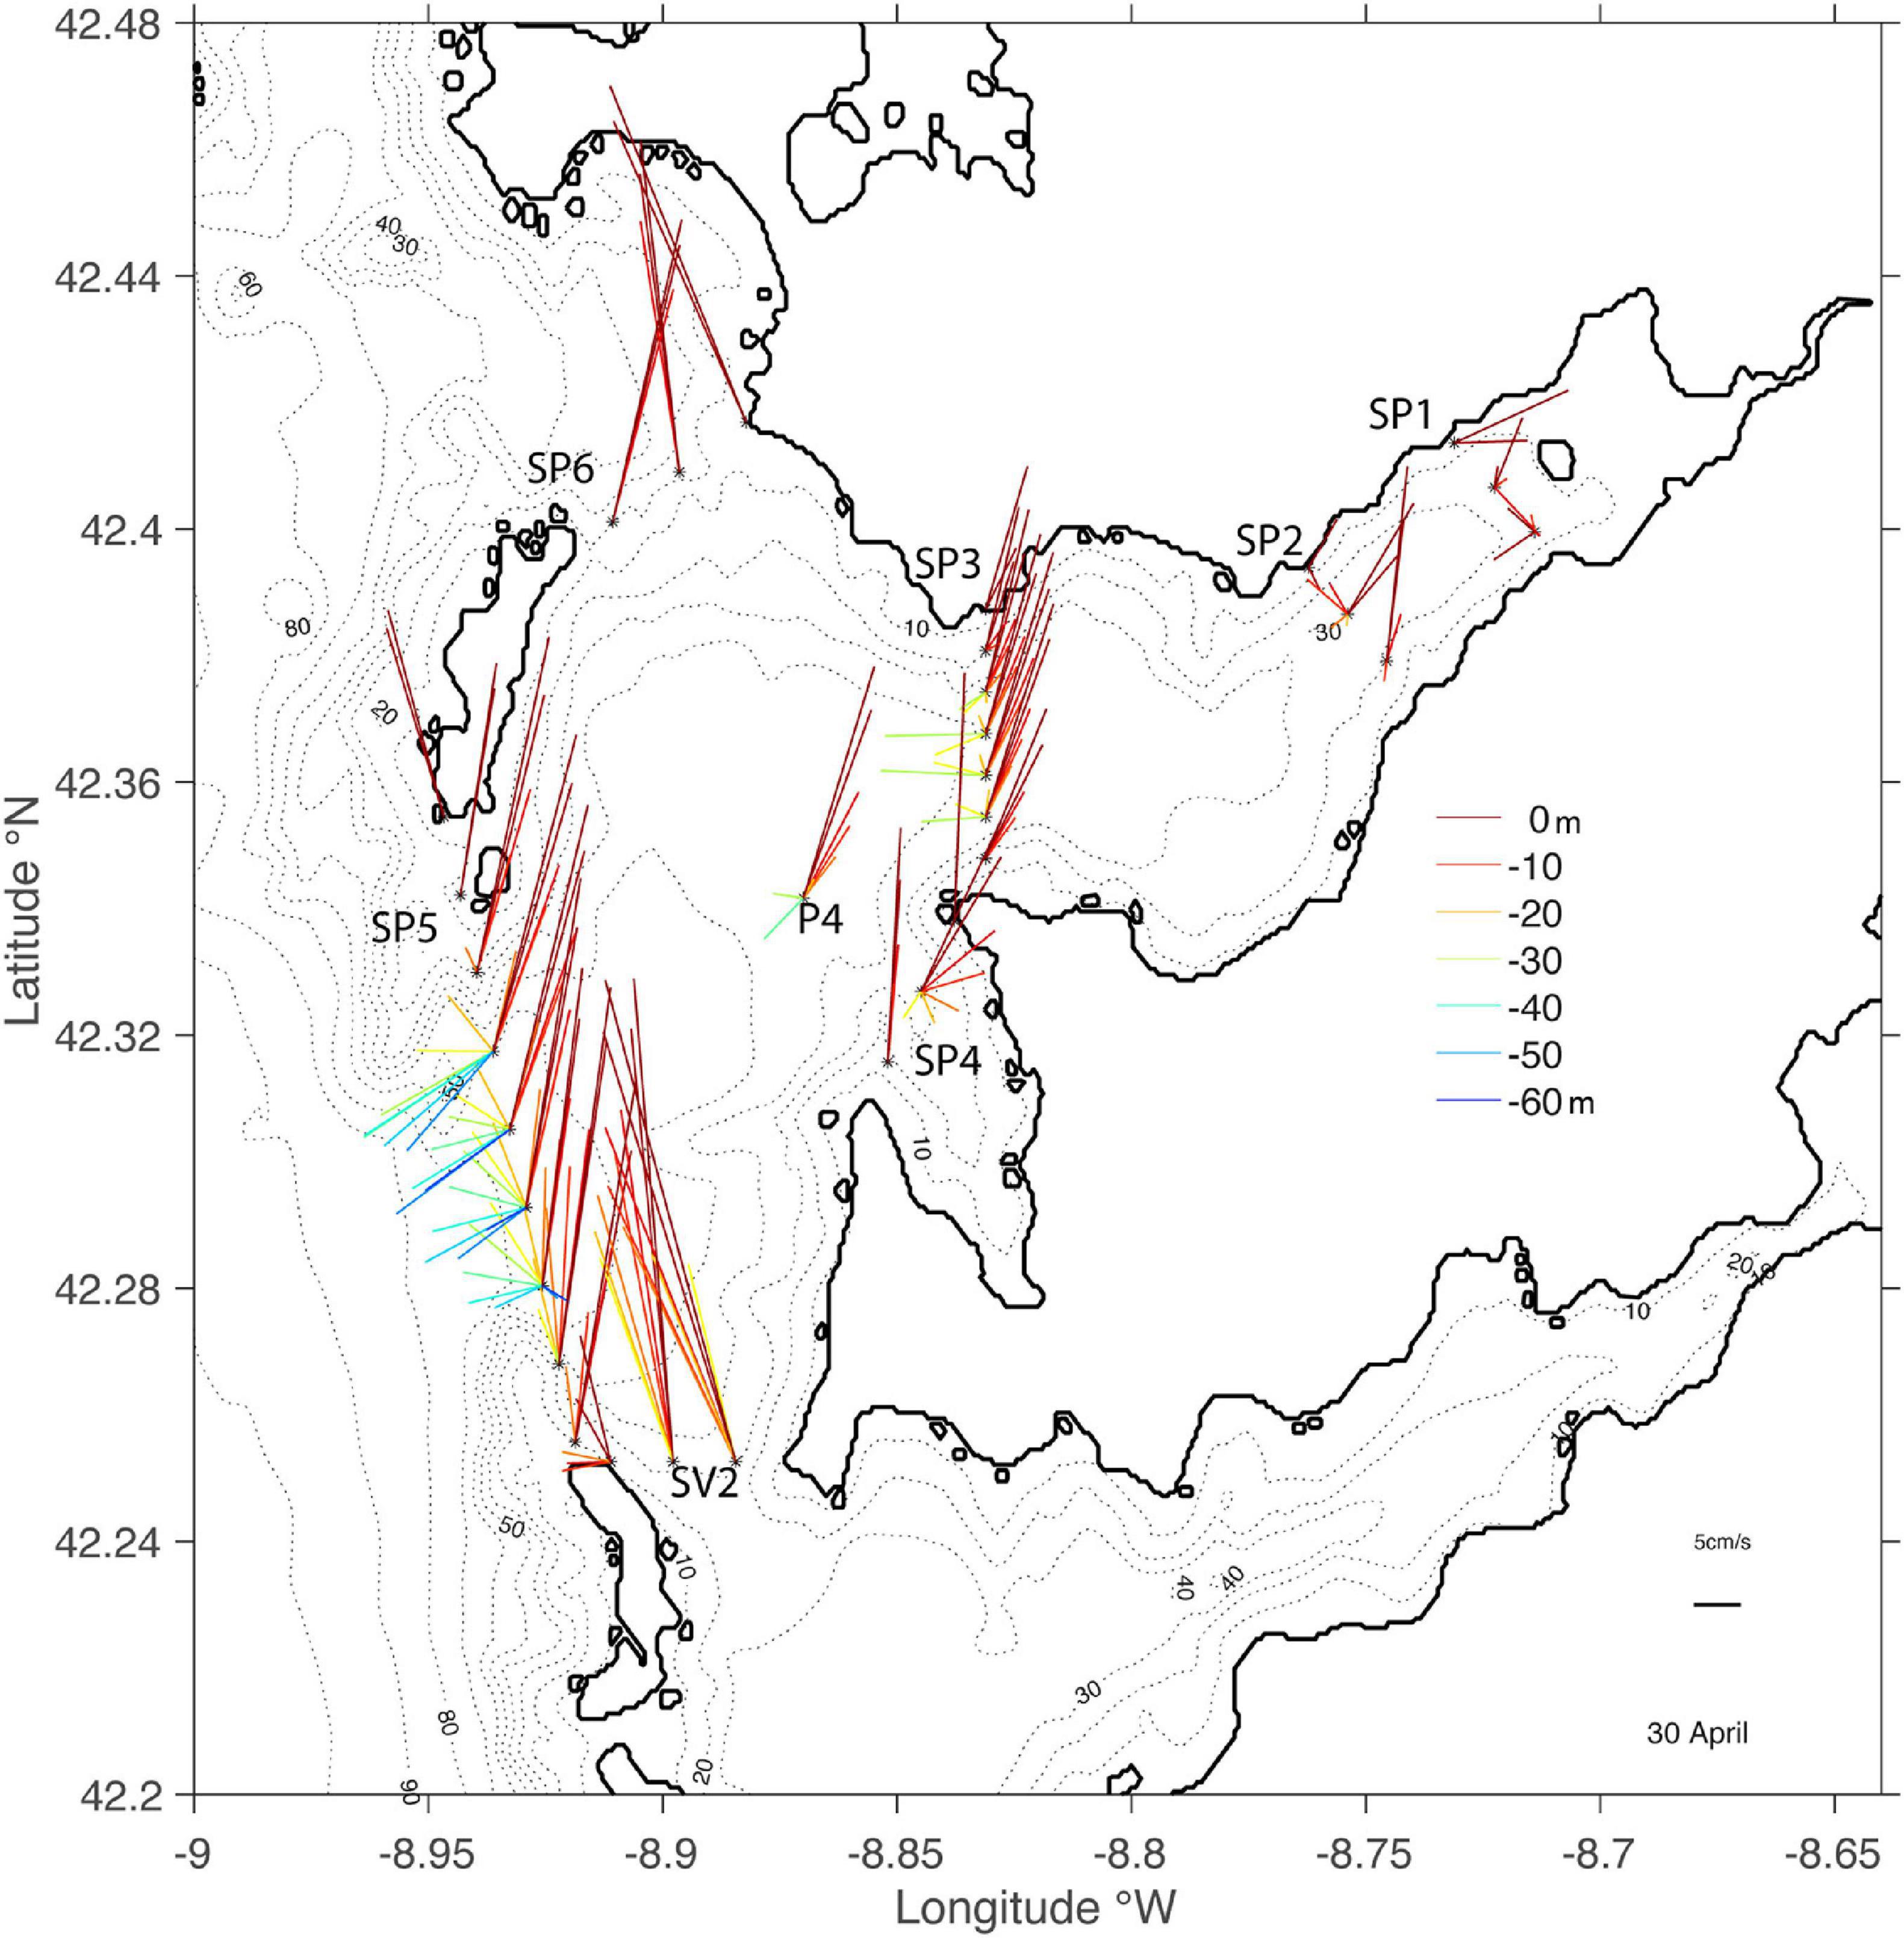
Figure 7. Same as Figure 5 for day 30 April.
Along the main Ría axis a well-established inverse estuarine circulation, characterized by surface up-estuary flow and down-estuary flow at depth, is evident from model results, replicating conditions on April 30, 2015 (Figures 8A,B). Lower-salinity waters associated with high river discharge from the Lérez are confined to the inner Ría, where salinity reduced to 30 PSU. On May 1 (Figures 8C,D), two vertical clockwise (CW) cells developed at the outer and middle Ría, with a negative estuarine circulation. Also, a transient counterclockwise (CCW) vertical cell, located below the river plume, establish a positive estuarine circulation at the inner Ría. In the outer Ría, the near bottom layer outflow generates ∼20 m downwelling of the 15.5°C and 35 PSU isolines (Figures 8C,D). This downwelling corresponds with an estimated vertical velocity of −0.23 mm/s, which is comparable to the modeled velocities. On May 2, the vertical cell at the outer Ría was displaced toward the head of the Ría, originating a mixing of the water column at the middle Ría. On May 3 (Figures 8G,H), strong vertical mixing continues, with vertical velocities exceeding 0.1 mm/s. σt isoline distributions follow the distribution of isotherms at the beginning of the event, but as river discharge increases they more closely follow isohalines. During the last day of the spring downwelling event, May 4 (Figures 8I,J), southerly wind speeds reached ∼12 m/s causing the river plume to spread offshore in the direction of the northern mouth (SP6; see Supplementary Video 1 for further details). Salinity stratification propagated to the outer Ría over time, with the strongest degree of stratification evident on the last day of the event (Figure 8I).
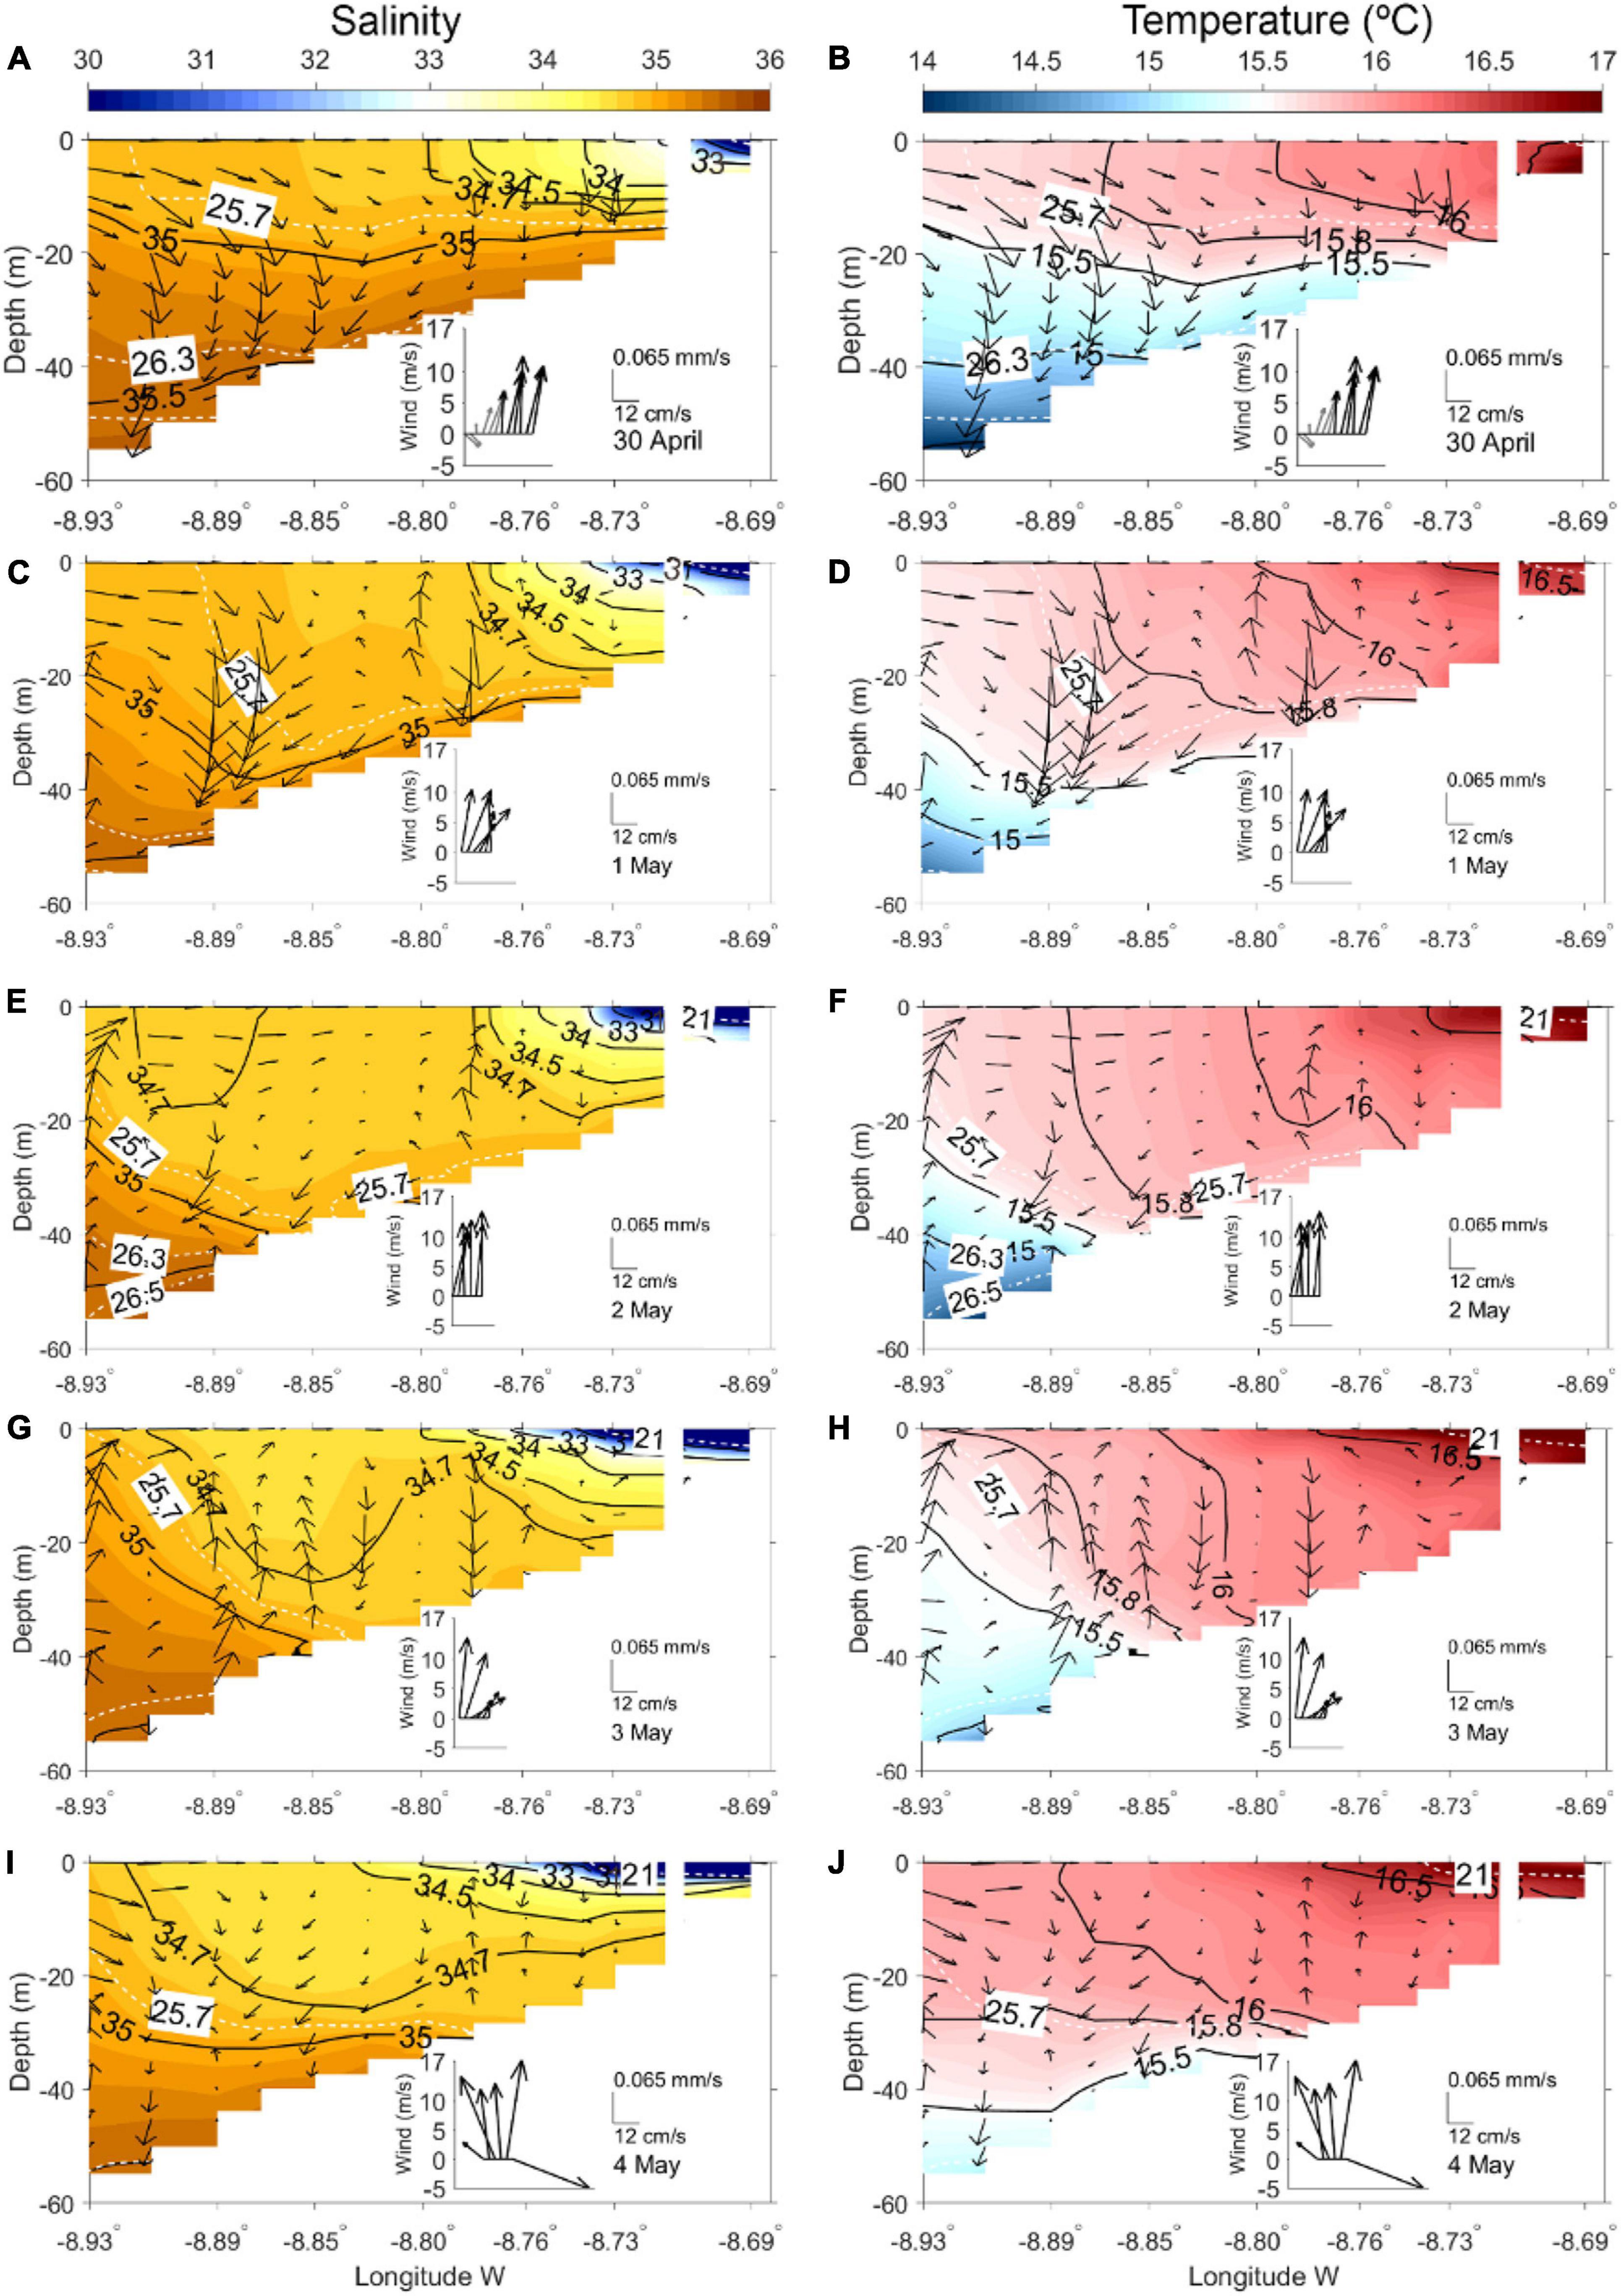
Figure 8. Same as Figure 6 for days 30 April, 1, 2, 3, and 4 May.
A rvEOF analysis at 0 and 20 m depths (horizontal EOF analysis; Figure 9), representative of a surface layer and deeper layer (usually surface and deep layers have opposite circulation patterns) was done, providing a synoptic overview. Figure 9 represents the spatial fields of the horizontal rvEOF analysis, starting with the average spatial fields (Figures 9A,B) at z = 0 and z = −20 m, followed by the three first rvEOF spatial modes, rvEOF1 (Figures 9C,D), rvEOF2 (Figures 9E,F), and rvEOF3 (Figures 9G,H), accounting for 66.1, 13.3, and 4.7% of the variance, respectively. Visualization of the temporal variability of the horizontal fields rvPCs series are shown in Supplementary Figure 1.
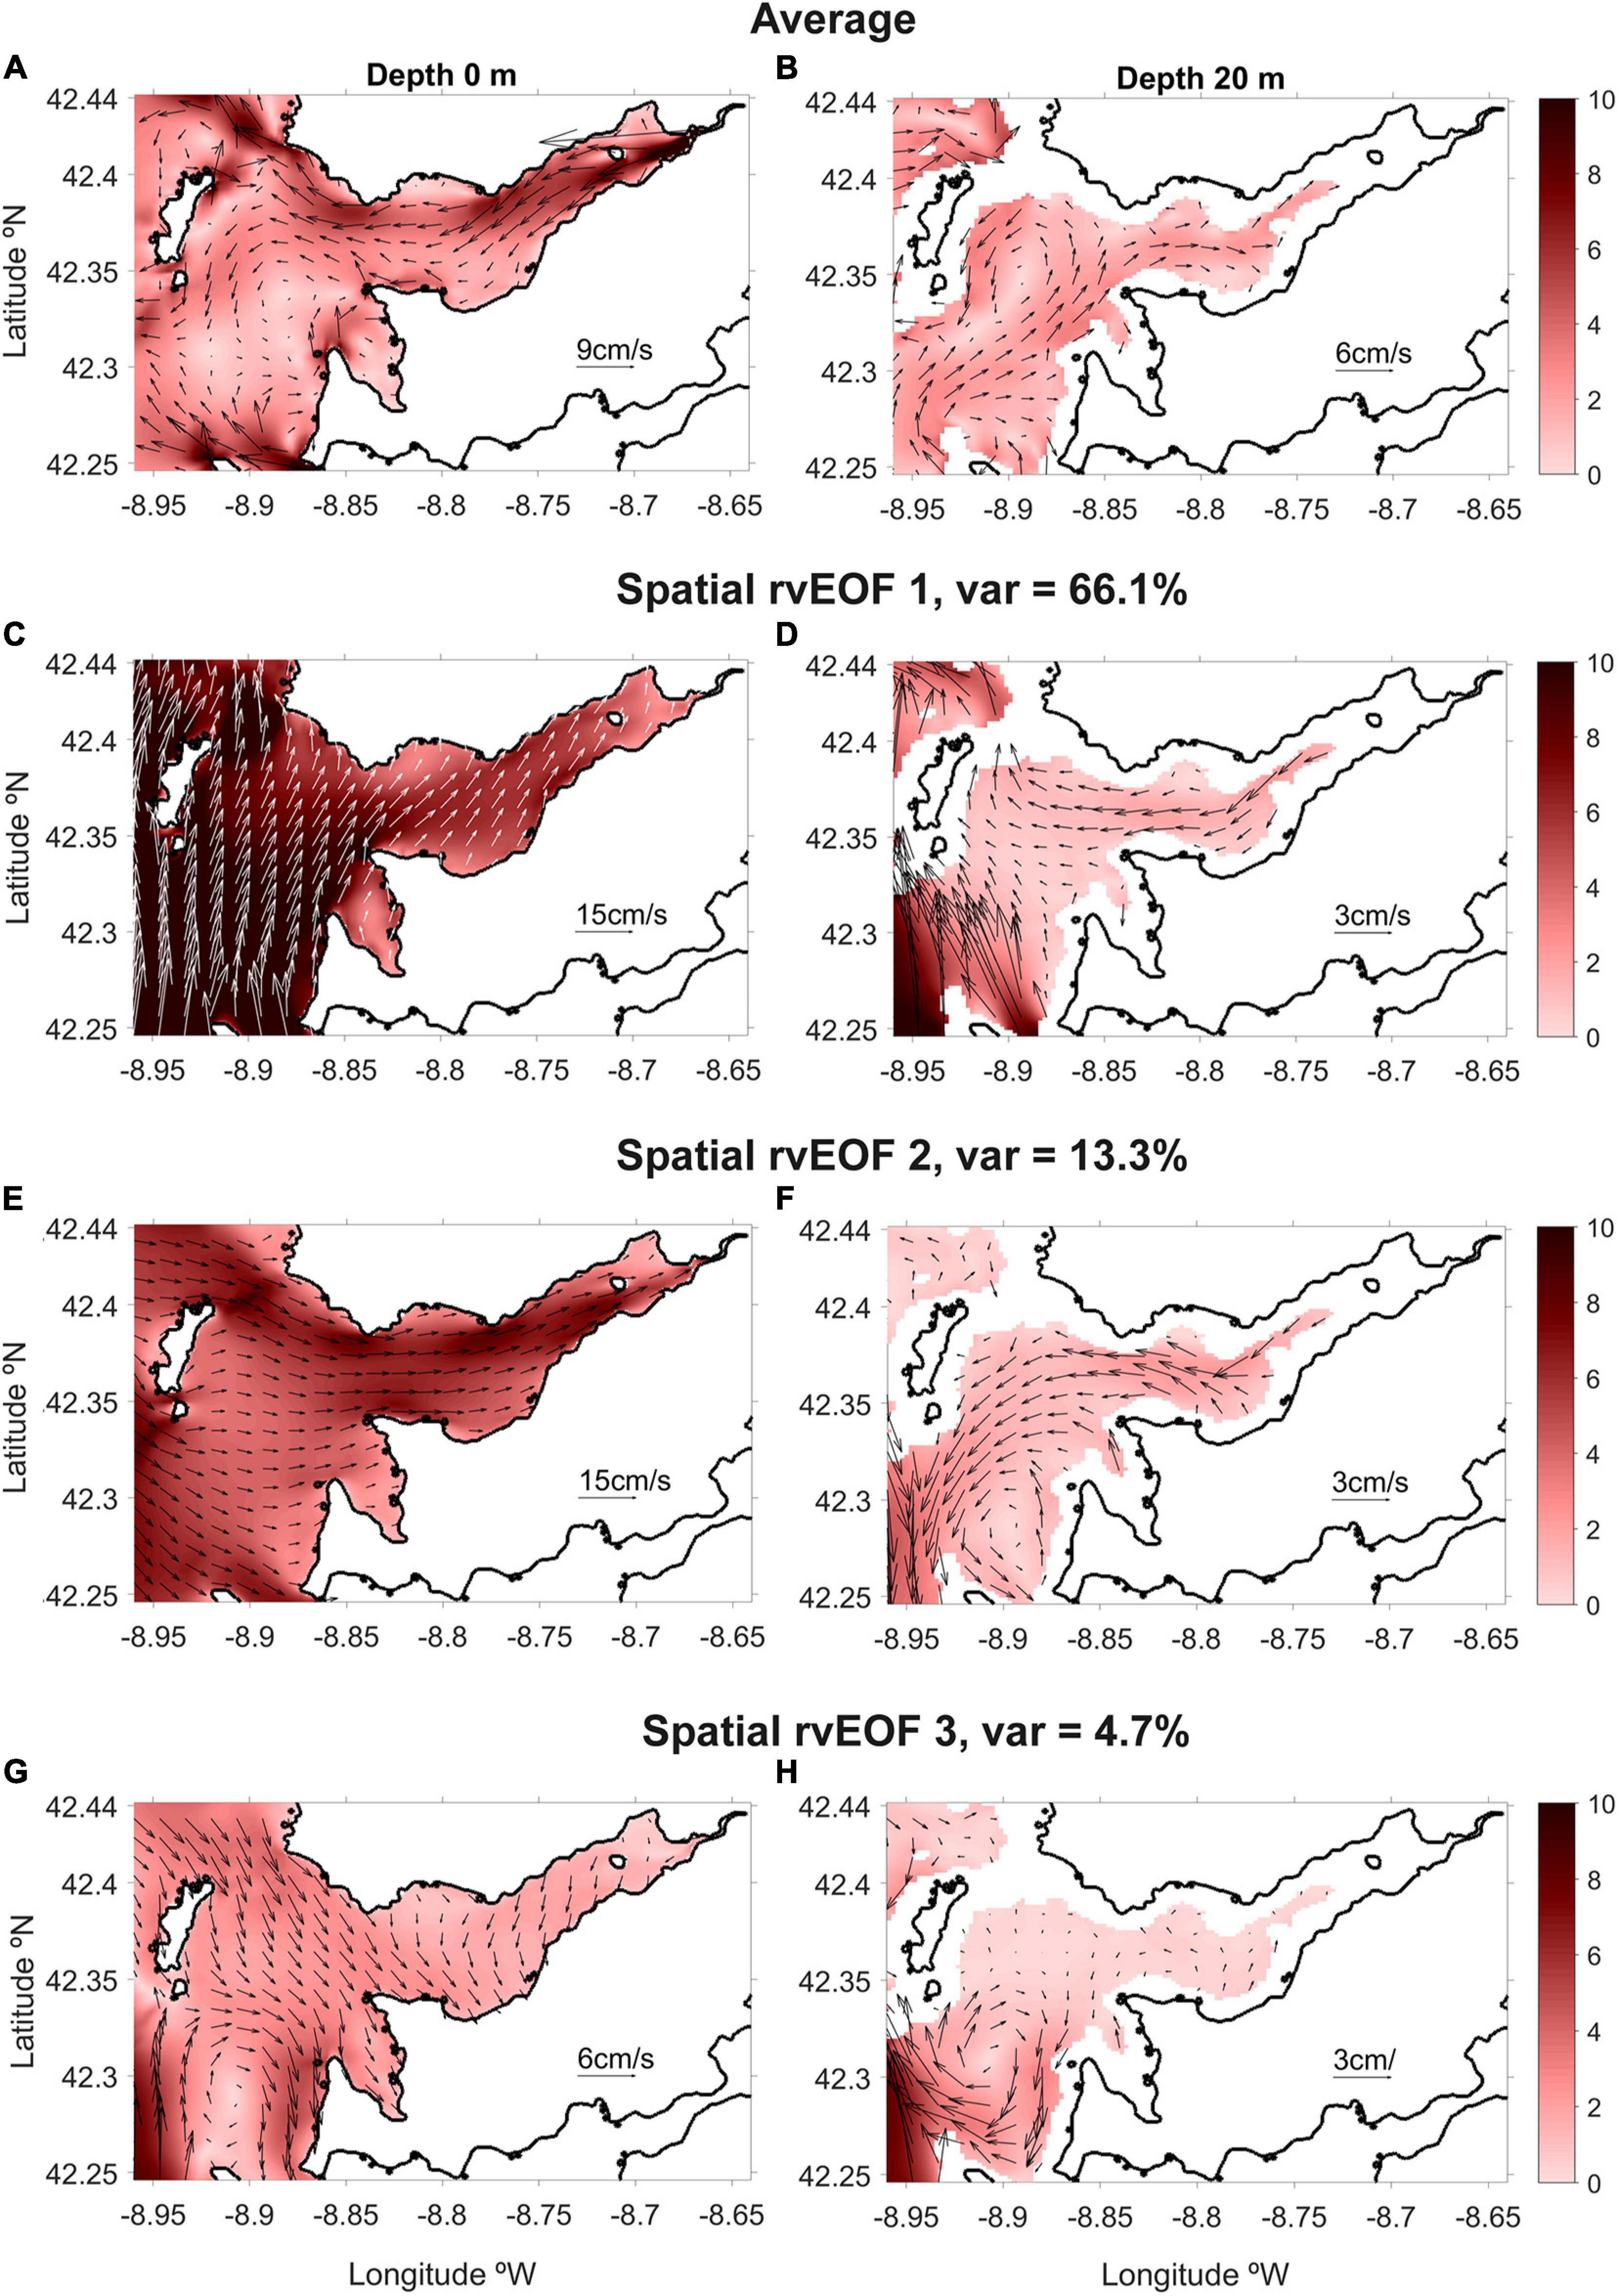
Figure 9. Spatial Real-vector EOF (rvEOF) of the meridional (V) and zonal (U) subtidal components of velocity at 0 and 20 m depths. (A,B) Average velocity for 2015 at the surface (z = 0) and at z = −20 m. Spatial rvEOF of (C,D) mode 1, (E,F) mode 2 and (G,H) mode 3. The velocity scales are depicted inside every graphic. The colorbar represents the module of the velocity.
An EOF analysis was also applied to subtidal velocities normal to the cross-sections SP6, SP5, SV2, SP3, SP2, and SP1 (vertical EOF analysis; Figure 10). Vertical EOF analysis, depicted in Figure 10, represents the EOF modes through the temporal principal component, PC1 (Figure 10A) and PC2 (Figure 10B), the average spatial fields (Figure 10C), and the spatial EOF1 (Figure 10D) and EOF2 (Figure 10E) that account for 60.8 and 12.5% of the variance, respectively.
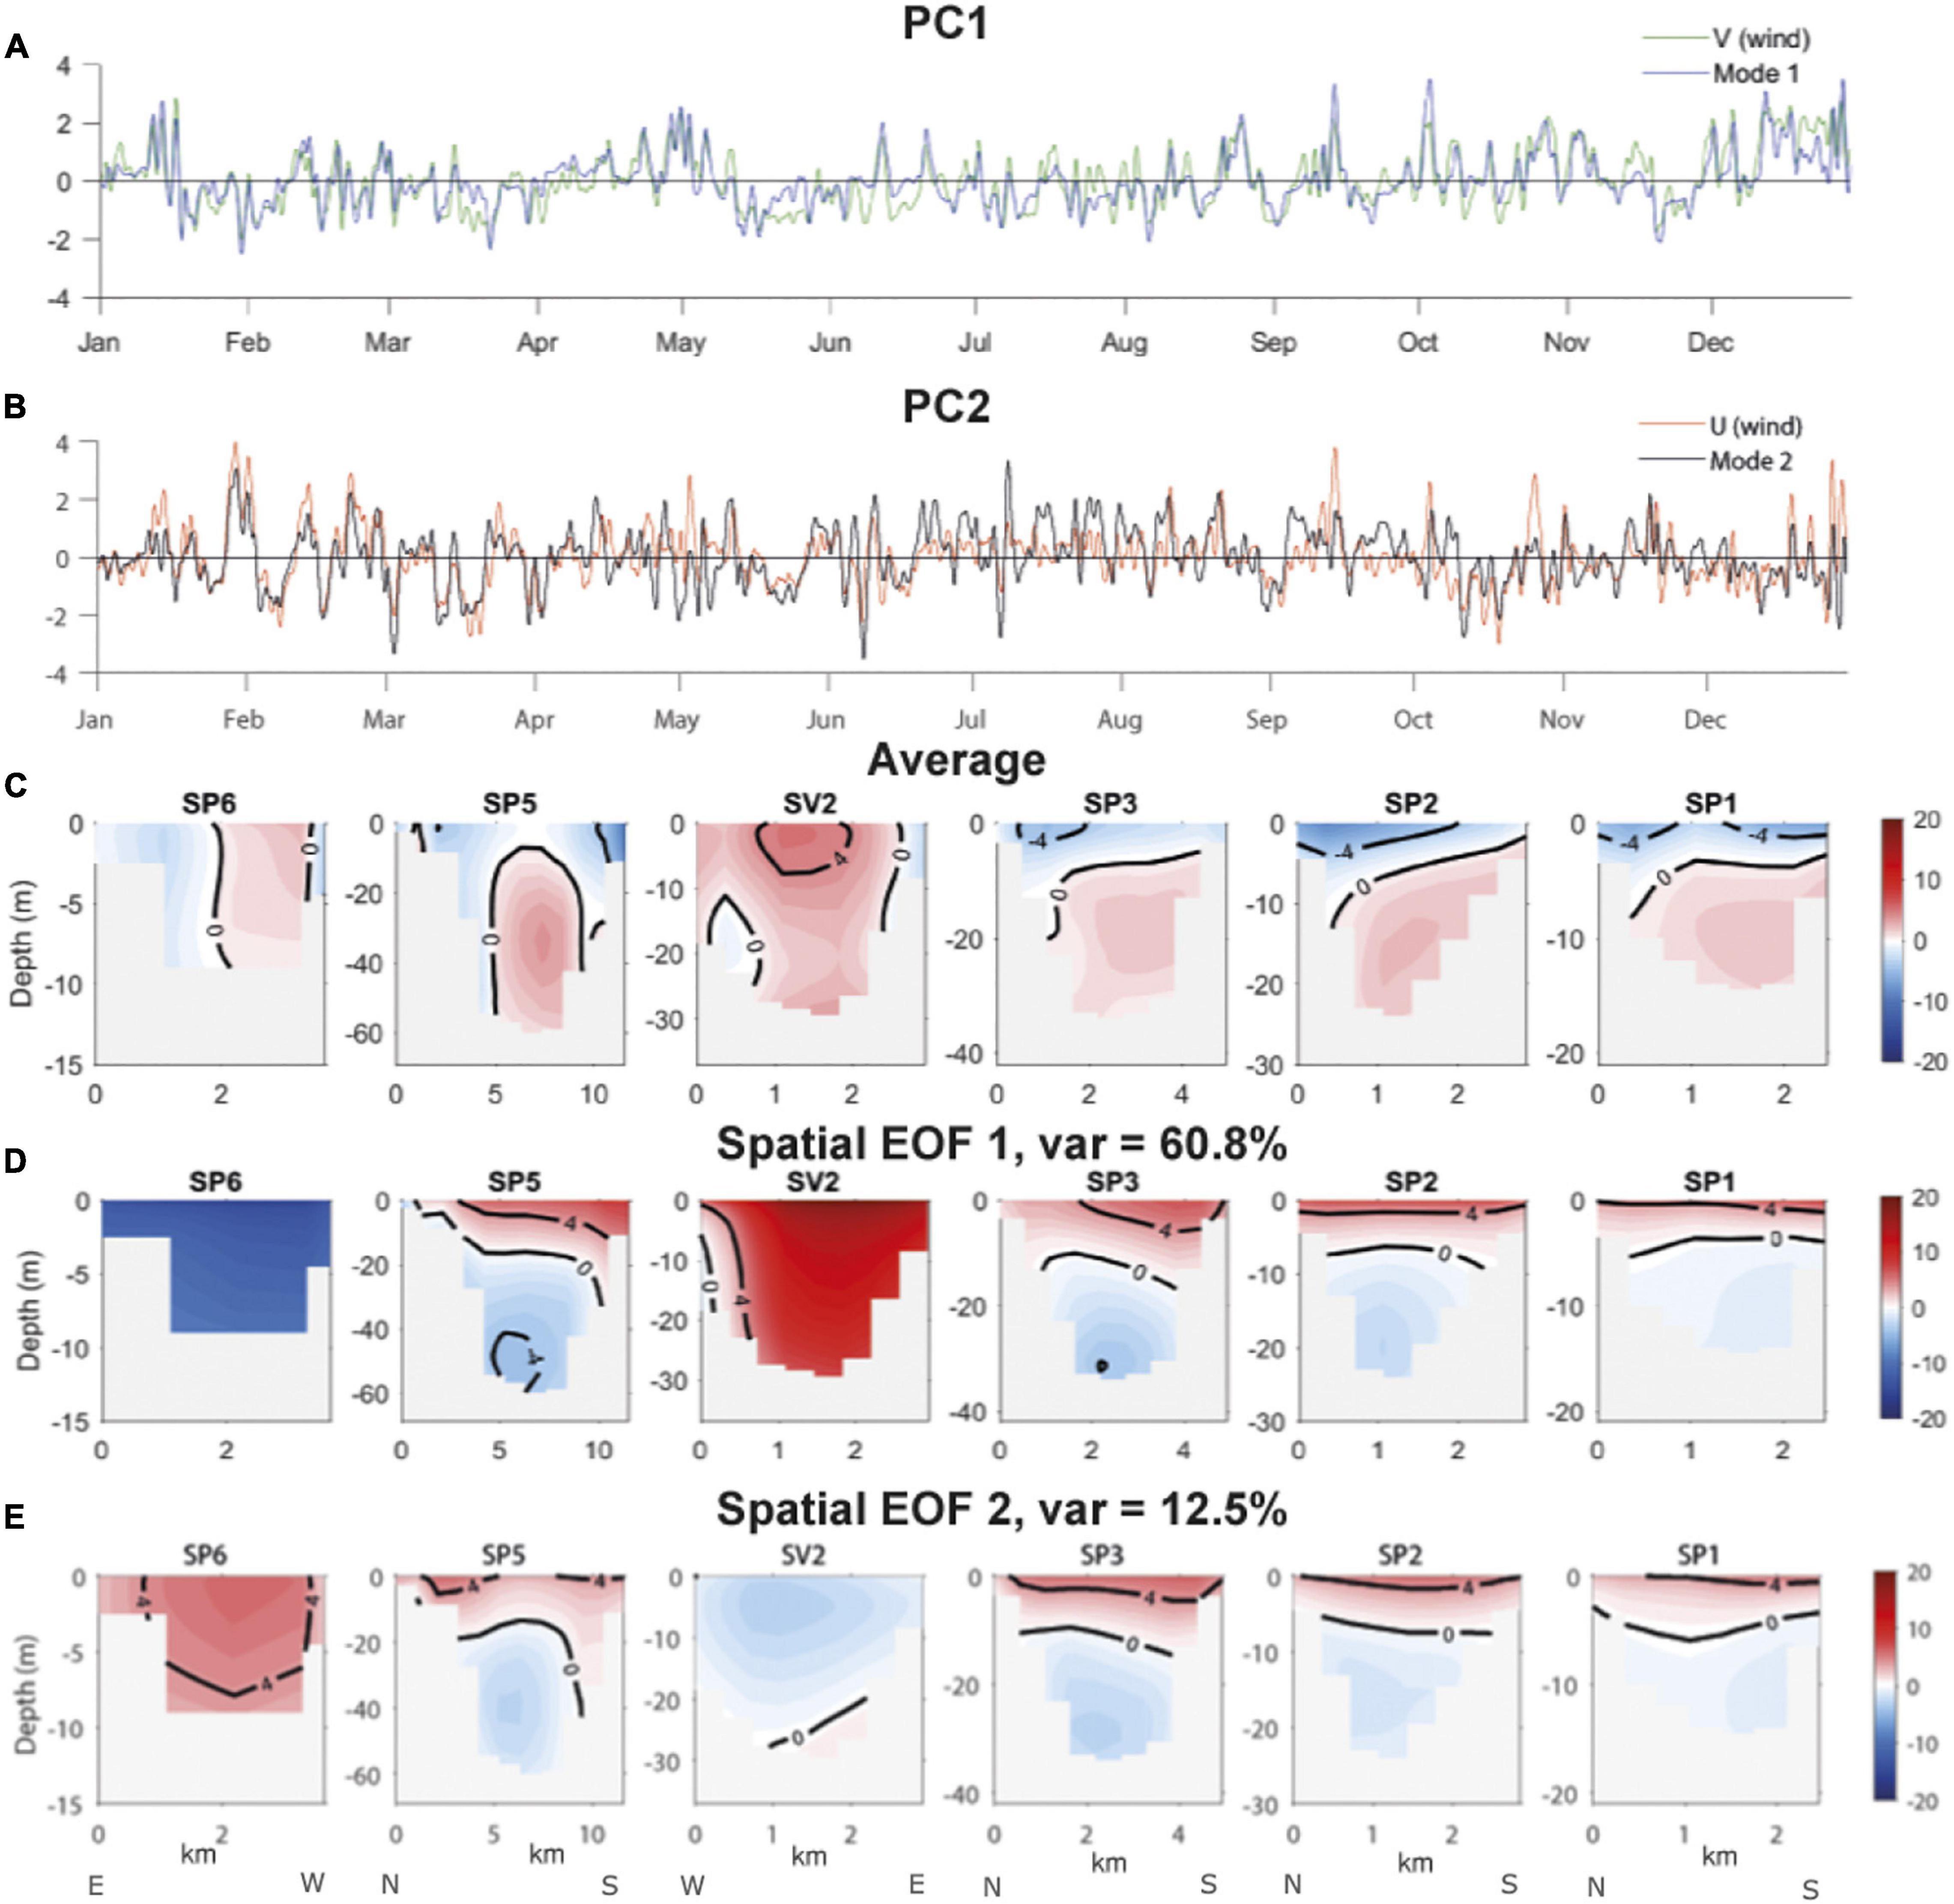
Figure 10. EOF at cross-sections for normal subtidal velocity (cm/s). PC time series of (A) normalized mode 1 (blue) superimposed on the normalized meridional (V) wind component (green) located at the wind point in Figure 2; (B) normalized mode 2 (black) superimposed on the normalized zonal (U) wind component (red) located at the wind point in Figure 2. (C) Time-averaged of normal subtidal velocity (cm/s) for the main cross-sections displayed in Figure 2. Spatial (D) first and (E) second EOF structure of the same cross-sections. Red positive (blue negative) values indicate inflow (outflow). Direction of cross-sections is indicated by northerly (N), southerly (S), westerly (W) and easterly (E) acronyms.
Average horizontal (z = 0 m and z = −20 m; Figures 9A,B) and cross-section (Figure 10C) velocity fields for the year 2015 are displayed. EOF results show that positive estuarine circulation represents mean annual circulation for 2015. From the head of the Ría, the surface outflow is more intense at the northern coast (Figure 9A), intruding further down the water column (Figure 10C; blue shadows), likely associated with the Lérez river flow. At the outer Ría, outflow is divided, with one pathway leaving through the northern opening (SP6) close to the eastern shoreline, and the other leaving near Onza island at the central opening (SP5). The opening linking Ría de Vigo and Ría de Pontevedra (SV2) has a net inflow, which is flowing out of the Ría de Vigo and splits around Cíes islands. This flow, partially flows offshore south of Cíes islands, and partially flows into the Ría de Pontevedra. Concerning the deep layer circulation (Figures 9B, 10C), the main modeled shelf inflow occur through the central opening (SP5) next to the Cíes islands and through the southern opening (SV2). Inside the Ría, this bottom inflow follows two paths (Figure 9B), one continues to the inner Ría, the other recirculates upon reaching the central Ría (Figure 2; near SP3 section), exiting close to Onza island (Figure 1C) along the northern side of the central opening (SP5). This recirculation may be a consequence of the shallower bathymetry near the northern opening (SP6), which acts as a barrier to the deeper circulation layers, preventing outflow through the northern opening (SP6).
The first EOF mode is described by the temporal rvPC1 (Supplementary Figure 1A) and PC1 (Figure 10A) and by the horizontal (Figures 9C,D) and vertical (Figure 10D) spatial rvEOF1, EOF1. The influence of the meridional (N-S) wind component on circulation can be analyzed by the comparison of the temporal PC1 and the time series of the meridional wind component, both normalized by removing the mean and dividing by the standard deviation (Figure 10A and Supplementary Figure 1A). Both series have similar patterns, with a linear correlation of R = 0.92 for the horizontal rvEOF and R = 0.84 for the vertical EOF. In this way, we can show that the positive (negative) values of the temporal PC1 correspond with southerly (northerly) wind directions. Hence, the meridional wind component is responsible for the primary circulation patterns at the Ría de Pontevedra, depicted by the spatial EOF1 structure and time evolution of the temporal PC1.
Horizontal and vertical spatial EOF1 show a prevalent one-layer circulation at the northern (SP6) and southern (SV2) openings. The surface circulation (Figure 9C) responds as an extension of the shelf circulation into the Ría de Pontevedra, associated with the upwelling (downwelling) favorable coastal jet with northerly (southerly) wind directions. Across the main along-Ría channel (SP5, SP3, SP2, and SP1 sections) the circulation consists of surface (deep) inflow (outflow) associated with southerly wind directions, represented by positive values of temporal PC1 (Figure 10A). Opposite, negative PC1 values indicate northerly winds with positive estuarine circulation, as discussed in detail in section “Upwelling Event.” Across the central opening (SP5) the surface circulation (Figures 9C, 10D) is strengthened on the southern side (north of Cíes islands) while circulation at depth is intensified south of Onza island. From the middle (SP3) to upper Ría (SP1), the circulation (Figure 10D) is also distributed in two vertical layers, with a level of null currents around 15 m depth for the middle cross-section (SP3) and around 5 m depth for the inner cross-sections (SP2 and SP1). This pattern agrees with the one described previously (section “Upwelling Event” and “Downwelling Event With River Inflow Increases”) for the upwelling and downwelling events, and is corroborated for the remainder of the analysis period.
The second EOF mode is associated with the zonal circulation driven by the zonal (E-W) wind component. The zonal wind and subsequent circulation also contribute to the first EOF mode, however its contribution is less significant, relative to the meridional wind. Both series, temporal PC2 and zonal wind component, have been normalized as described for the first EOF analysis. Comparison of these series show a similar pattern, with a linear correlation of R = 0.77 for the horizontal rvEOF (Supplementary Figure 1B) and R = 0.62 for the vertical EOF (Figure 10B). Positive values of the temporal PC2 correspond with westerly wind directions and negative values with easterly wind directions. Thus, the zonal wind was found to be principally responsible for the spatial EOF2 structure and for the time evolution of the temporal PC2 (Figures 9E,F, 10B,E and Supplementary Figure 1B).
Regarding the surface circulation (Figures 9E, 10E), the main inflow is observed through the northern opening (SP6), which continues mainly along the northern coast (Figure 9E). At the central opening (SP5), there is an inflow with an across-shore circulation. Inside the Ría, this circulation is split into two pathways, one flows toward the upper Ría and other leaves the Ría through the southern opening (SV2) and enters the Ría de Vigo. Concerning circulation at depth (below null level; Figures 9F, 10E) for spatial EOF2, it approximately opposes surface circulation, except near the northern and southern openings (SP6 and SV2), where the shallow bathymetry forces the water column to respond as bulk to the wind forcing. This circulation corresponds with westerly wind directions, so an opposite circulation can be expected under easterly wind directions.
Horizontal spatial rvEOF3 is depicted in Figure 9G at the surface layer and in Figure 9H at 20 m depth. At the surface (Figure 9G) there is an inflow through the northern opening (SP6) that is split into two flows, one continues to the middle part of the Ría, and another joins the inflow at the central opening (SP5) that rotates at ∼42.3 °N and leaves the Ría through the southern opening (SV2). This meander induces a closed circulation that extends down the water column (Figure 9H), generating a clockwise transient vorticity structure visible at 20 m depth, with outflow through the central opening (SP5). These structures are observed when sudden events of wind transition (from upwelling to downwelling favorable or vice versa) occur, in which the wind intensity is low, or almost null. Those situations/moments are coincident with positive/negative peaks in rvPC3 (see Supplementary Figure 1C), associated with clockwise/counterclockwise circulation referred to in this subsection. This circulation features will be later discussed in the next section.
In this work, a high-resolution 3D hydrodynamic model configuration, with realistic forcings and boundary conditions, is applied to the study of the subtidal circulation patterns at the Ría de Pontevedra.
The Ría de Pontevedra acts like a partially mixed estuary with a two-layer circulation (Klinck et al., 1981) throughout the year, driven principally by Ekman dynamics over gravitational circulation. This circulation pattern presents a null current level between these two layers, whose depth varies along the Ría. Gómez-Gesteira et al. (2001) observed and studied the displacement of this null level at the Ría de Pontevedra, and the null level they reported in the inner Ría are like those predicted by our model. At the outer central opening (SP5), Aguiar Fernandez (2016) located this null level at same depth (20 m depth) as we do. This depth can vary depending on wind intensities. For example, Barton et al. (2015) observed this level at a shallower depth, 15 m, at the outer Ría de Vigo. The Ría de Pontevedra has three openings that exchange waters with open ocean (denoted SP6, SP5, and SV2 in Figure 2), however it differs with neighboring Rías, Ría de Vigo and Ría de Arousa, which have two openings. The southern opening (SV2) of the Ría de Pontevedra coincides with northern opening of the Ría de Vigo. At these entrances, outer Ría circulation, behaves as a continuation of offshore shelf circulation (Largier, 2020) during upwelling and downwelling events, whilst at the middle and inner Ría, circulation patterns are driven by buoyancy gradients, local wind forcing, river inflow, and topographic steering (Álvarez-Salgado et al., 2000; Barton et al., 2015, 2016; Gilcoto et al., 2017). Shallower openings located at the North/South of the Ría de Pontevedra (SP6 and SV2), respond with a one-layer circulation, whilst the central opening (SP5) is deeper than the Ekman depth, and presents the characteristic two-layer upwelling/downwelling circulation (Souto et al., 2003; Gilcoto et al., 2007). This behavior is schematically summarized in Figure 11.
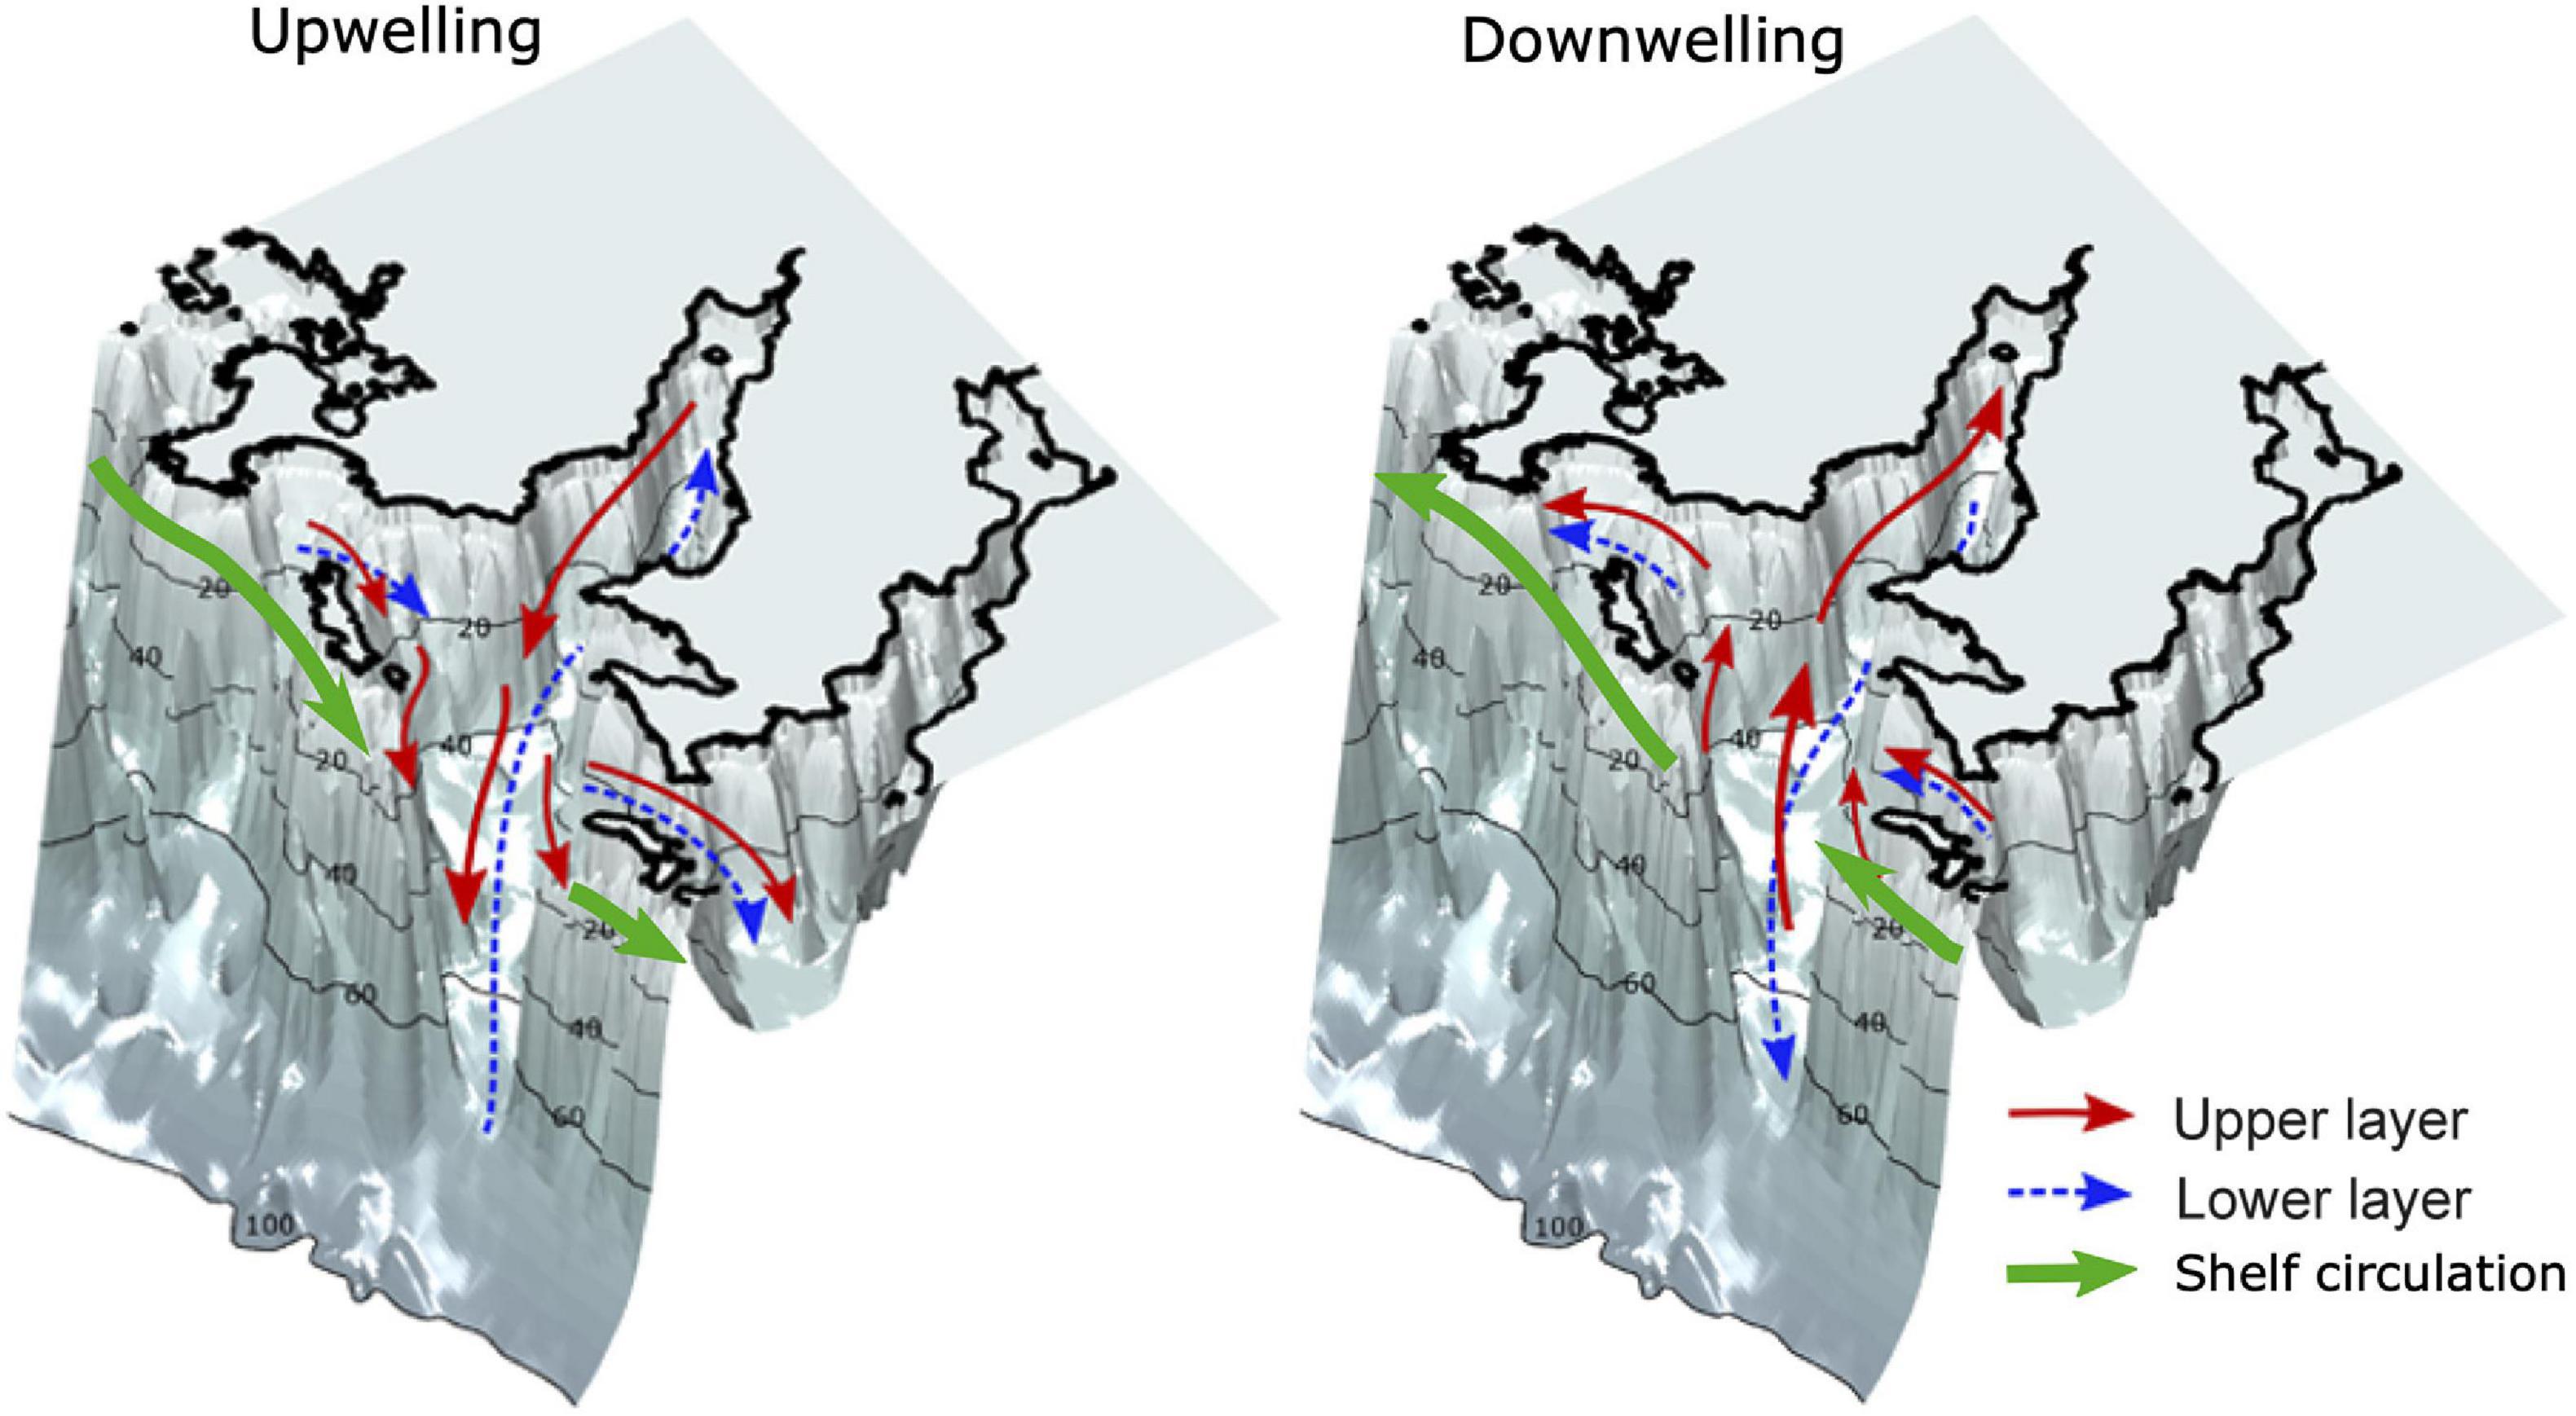
Figure 11. Scheme of the circulation patterns under upwelling and downwelling events. Colors of arrows are depicted in the legend (right bottom corner).
Concerning the alongshore transport in the inner shelf region, we remark that at shallower entrances, the coastal jet flows in through the northern (SP6) opening, and leaves through the southern (SV2) opening under northerly winds, and vice versa under southerly winds (detailed information about the circulation patterns are shown through video-animations of surface and deep circulation, as well as wind, available at Supplementary Videos 1, 2). Coastal jets are not generated under zonal wind components (Csanady, 1982). In the Rias Baixas, the coastal jet, driven by the alongshore wind component has elements of an upwelling shadow and upwelling trap, where the coastal jet splits flowing either side of the outer Ría islands (Barton et al., 2015; Aguiar Fernandez, 2016; Piedracoba et al., 2016; Largier, 2020). Coastal jets are described by Largier (2020) as one of the three primary drivers of circulation in upwelling bays, together with local wind stress, and bay-ocean differences in buoyancy and water level. As observed in Supplementary Videos 1, 2, under downwelling conditions coastal jets may also transport rivers plumes from neighbor rivers. This process contributes to the decrease of the Ría salinity and has an influence on the Ría density gradients, which reverse the circulation, allowing a rapid renewal of estuary waters (Barton et al., 2015; Largier, 2020). In addition, the presence of river plumes and its advection by the coastal jet increases the exchange of properties between the Ría and the shelf. This assumption needs further analysis through Lagrangian studies.
The narrow width and the shallower depths of the inner Ría, induces a response in the water column to the wind forcing, with a direct downwind transport in the surface layer, and an opposite motion at the bottom layer. This response is likely induced by along-Ría axis (approximately zonal) winds, as we described through its correlations with the second EOF mode. Westerly/easterly winds force surface water to flow in/out of the Ría, and hence a bottom outflow/inflow. Consequence of these opposite two-layer flow, the vertical stratification increases, reinforcing the ocean-Ría exchange (Gilcoto et al., 2017; Largier, 2020). de Castro et al. (2000) provide further evidence of this two-layer response, driven by zonal winds at the Ría de Pontevedra during April 1998. Also, in the Supplementary Videos, we can observed bilayer circulation patterns consequence of westerly winds from January 29 to 30 (Supplementary Video 1), August 13 and September 13 (Supplementary Video 2), and consequence of easterly winds from February 9 to 10 (Supplementary Video 1), October 18 and November 2 (Supplementary Video 2), for instance.
As a consequence of the increase of Lérez river inflow, river plumes spread along the northern coast (associated with Coriolis forces), after exiting the Ría through the northern opening (SP6; Figures 9A,E). Similar behavior has been observed at the Ría de Arousa (Rosón et al., 1997) and at the Ría de Vigo (Sousa et al., 2014b), whose plume penetrates into the Ría de Pontevedra through SV2 opening and leaves through the central opening (SP5; Figure 9A). These circulation patterns are in agreement with the observations discussed by Aguiar Fernandez (2016), based on ADCP and CTD surveys. Some episodic events, also modeled with our configuration (not shown), show intrusions of river plumes from the Douro and Minho rivers (WIBP), which originated south of the Ría de Vigo, as reported by Des et al. (2019) and Mendes et al. (2016).
A vertical flow may be enhanced during downwelling events, whilst upwelling events are characterized by a stratification of the water column (Largier, 2020). Evidence of these processes are illustrated by an elevation/sinking of the isohalines about 10–20 m per day at the outer Ría during the upwelling/downwelling events (Figures 6, 8). Pardo et al. (2001) observed the rising of the 35.5 PSU isohaline at the Ría de Pontevedra during a river flow increase and a relaxation of southerly winds, but they did not quantify it. At the Ría de Vigo, Barton et al. (2016) reported a sinking of isopleths, at inner and middle Ría stations, of 8 and 12 m/day, respectively, which are similar to the results reported in this study at the outer Ría de Pontevedra. This displacement, during downwelling events, generates a blocking of the horizontal circulation at the middle Ría, due to a front (Figures 8C,D,G,H) splitting two clockwise vertical circulation cells. We hypothesize that these two clockwise circulation cells or negative estuarine circulation, are closely associated to the presence of the different basins at the Ría de Pontevedra. One cell between SP5 and SP3 sections, is associated to the outer basin, and the other, located between SP3 and SP2 section, is associated to the middle basin. Evidence of a third vertical cell, with a counterclockwise rotation (Figure 8D), is located at the innermost basin of the Ría, associated to the influence of a high riverine flow (Figure 3A; blue box), that induces a positive estuarine circulation at this location. A similar distribution of vertical circulation patterns is discussed by Villacieros-Robineau et al. (2013) with two opposed vertical circulation cells during downwelling events with high river runoff, at the Ría de Vigo. On the other hand, Barton et al. (2016) refer that the convergence flow and the time evolution of the vertical circulation cells during downwelling events are strongly controlled by the wind-driven surface inflow from outside of the Ría and the strengths of accumulated freshwater outflow at the inner Ría.
Influence of local and remote winds have been thoroughly discussed by Gilcoto et al. (2017). These winds are highly correlated, leading to difficulties in the interpretation of the dynamic response of the induced circulation. However, they found that remote winds better explain subtidal residual circulation, relative to local winds. Regarding influences of local and remote winds, we note that our wind point is located at an intermediate location between the remote and local wind points used by Gilcoto et al. (2017), but since the resolution of WRF model run by MeteoGalicia is 4 km, remote winds are better captured by our model configuration.
Closed circulation features (Figures 9G,H), displayed in spatial third EOF mode are usually associated to recirculation processes, and consisting of cyclonic or anticyclonic vorticity structures. They are characterized as transient, with timescales of one or two days. The occurrence of these vorticity transient structures is mainly related to abrupt changes in wind intensity and direction. At the Supplementary Video 1 (i.e., February 16, April 12, June 15) and Supplementary Video 1 (July 3, September 18, October 8) we can observed these circulation features. At the Ría de Vigo, these structures have been thoroughly described by Piedracoba et al. (2016). Also, Barton et al. (2015) describe them as consisting in a cyclonic eddy behind Cíes islands during a downwelling event, and near the middle Ría during an upwelling event. In addition, Piedracoba et al. (2016) observed a dipolar vorticity structure in the Ría de Vigo, with positive vorticity in the northern outer region and negative vorticity in the southern region during downwelling conditions. During upwelling conditions, behavior reversed. Differences in the intensities of the vorticity structures, were shown to be related to variable strength of upwelling and downwelling events (Piedracoba et al., 2016).
Several circulation features (coastal jets, fronts, vertical cells, horizontal closed circulation, and circulation blocking) discussed above, are associated to exchange of water properties between the shelf and Ría (including biogeochemical properties and pollutants, among others), and/or retention of biological material (nutrients and phytoplankton, for instance).
The Ría de Pontevedra is strongly affected by Harmful Algal Blooms events, which lead to closure of raft mussel farms (227 ± 57 days/year during 1998–2006 according to Álvarez-Salgado et al., 2008). Closures cause serious financial difficulties for the harvesting mariculture industry and represent a challenge for the sustainability of mussel farming resources. As such, having tools capable of forecasting HABs events in the Rias Baixas, both under present and future conditions, would prove vitally important to the management of marine resources. Although the present study is not specifically focused on HABs forecast, the improved understanding of circulation processes presented in this study provide clues to better understand the physical mechanisms associated with its development. We applied EOF techniques to subtidal Ría velocities, which established a good correlation between the meridional and zonal wind components (main forcing of the circulation) and the first two EOF modes of the horizontal velocities, respectively. Thus, high-resolution modeling and statistical analysis, such as EOF, allow us to predict the ocean-Ría exchanges as well as the circulation inside the Ría, when wind forecasts are available. Future research will implement the findings from this study, along with additional model simulations to determine the physical Ría conditions that allow Harmful Algal Blooms to develop.
Circulation patterns at the Ría de Pontevedra were solved using a 3D high-resolution configuration of the ROMS-AGRIF model. The model accurately replicates the two-layer circulation patterns present along the main Ría axis, from the central opening to headwaters, during upwelling/downwelling events. One layer circulation in the shallower northern and southern entrances was also replicated. Additionally, EOF techniques were applied to subtidal velocities. The results obtained with the model have been successfully compared with eleven CTD salinity and temperature stations and one sea level gauge.
The main conclusions from model outputs are:
• During events where downwelling and high rainfall concurrently occur, complex vertical circulation develops consisting of two clockwise vertical circulation cells, associated to the outer and middle basins, respectively, separated by a front. Additionally, a transient counterclockwise vertical circulation cell develops below the freshwater river plume. These vertical processes act to block the down-Ría flow of fresher, lower density surface water, discharging from Ría headwaters.
• Horizontal transient circulation cells were detected at surface and bottom layers and were associated with periods when wind directions changed.
• Coastal jet observed both during upwelling and downwelling events, can be seen as a water exchange driver between the shelf and the Ría. It leads to the import from and export to the Ría, of shelf water properties (pollutants and other particles) along the surface layer.
• Deep circulation exchanges between the shelf and the Ría mainly occur through the central opening (SP5, with ∼60 m of depth), inducing a two-layer (positive or negative) estuarine circulation along the main channel of the Ría. This bilayer circulation is separated by a null current level whose depth decreases toward Ría headwaters.
• EOF techniques showed a good correlation between meridional and zonal remote wind components and the two first EOF modes. The third horizontal EOF mode, consisting in closed circulation feature at the outer Ría, is mainly associated with periods of sudden changes of wind directions and intensities.
This study provides important information for a better understanding of subtidal circulation processes in the Ría de Pontevedra, describing the different circulation patterns exhibited during upwelling and downwelling events, and the role of the shelf-Ría water exchanges of biogeochemical properties, pollutants, larvae, etc. Future work could leverage model outputs to drive Lagrangian process models, providing the capacity to investigate residence times, and the transport of constituents into and out of the Ría. The hydrodynamic model detailed in this study also has the capacity to be coupled with biogeochemical models, providing a foundational component for the development of predictive tools addressing events such as Harmful Algal Blooms.
The datasets presented in this article are not readily available because they have a high file size. Requests to access the datasets should be directed to JD, amR1YmVydEB1YS5wdA==.
EC and RN ran the model, developed the code, analyzed the modeling results, and discussed with assistance from JD. MG and FP contributed to the analysis of the results and discussion. JB and XP planned the study and contributed to the analysis of the results. EC and JD wrote the manuscript. All authors read and contributed to writing the manuscript.
The authors declare that the research was conducted in the absence of any commercial or financial relationships that could be construed as a potential conflict of interest.
This study was performed in the framework of MYTIGA project (AGL2013-45945-R) supported by the Spanish government through the Ministerio de Economía y Competitividad. This work contributes to HABWAVE project (LISBOA-01-0145-FEDER-031265), and CESAM_LA (UIDP/50017/2020 + UIDB/50017/2020), funded by FCT/MEC through national funds, and the co-funding by the FEDER, within the PT2020 Partnership Agreement and Compete 2020. This work also contributes to MarRisk project (0262_MARRISK_1_E) co-funded by European Regional Development Fund (FEDER) in the framework of Interreg V A España – Portugal (POCTEP) 2014-2020. The authors thank the Instituto Tecnolóxico para o Control do Medio Mariño de Galicia (INTECMAR), for the production and distribution of in situ salinity and water temperature data, MeteoGalicia for the distribution of wind and Spanish rivers discharge data, and the Water Institute of Portugal (INAG) for the distribution of Portuguese rivers discharge data. We thank to the editor and reviewers for their valuable comments and help with the work of English rephrasing.
The Supplementary Material for this article can be found online at: https://www.frontiersin.org/articles/10.3389/fmars.2021.661250/full#supplementary-material
Aguiar Fernandez, E. (2016). Circulation at the Transition Zone Between the Shelf and the Two Southernmost Rías Baixas (NW Spain). Doctoral Thesis. Pontevedra: University of Vigo.
Álvarez, I., DeCastro, M., Prego, R., and Gómez-Gesteira, M. (2003). Hydrographic characterization of a winter-upwelling event in the Ria of Pontevedra (NW Spain). Estuar. Coast. Shelf Sci. 56, 869–876. doi: 10.1016/S0272-7714(02)00309-8
Alvarez-Salgado, X. A., Figueiras, F. G., Villarino, M. L., and Pazos, Y. (1998). Hydrodynamic and chemical conditions during onset of a red-tide assemblage in an estuarine upwelling ecosystem. Mar. Biol. 130, 509–519. doi: 10.1007/s002270050271
Álvarez-Salgado, X. A., Gago, J., Míguez, B. M., Gilcoto, M., and Pérez, F. F. (2000). Surface waters of the NW Iberian margin: upwelling on the shelf versus outwelling of upwelled waters from the Rías Baixas. Estuar. Coast. Shelf Sci. 51, 821–837. doi: 10.1006/ecss.2000.0714
Álvarez-Salgado, X. A., Labarta, U., Fernández-Reiriz, M. J., Figueiras, F. G., Rosón, G., Piedracoba, S., et al. (2008). Renewal time and the impact of harmful algal blooms on the extensive mussel raft culture of the Iberian coastal upwelling system (SW Europe). Harmful Algae 7, 849–855. doi: 10.1016/j.hal.2008.04.007
Barton, E. D., Largier, J. L., Torres, R., Sheridan, M., Trasviña, A., Souza, A., et al. (2015). Coastal upwelling and downwelling forcing of circulation in a semi-enclosed bay: ria de Vigo. Prog. Oceanogr. 134, 173–189. doi: 10.1016/j.pocean.2015.01.014
Barton, E. D., Torres, R., Figueiras, F. G., Gilcoto, M., and Largier, J. (2016). Surface water subduction during a downwelling event in a semienclosed bay. J. Geophys. Res. Ocean. 121, 1063–1084. doi: 10.1002/2015JC010796.Received
Blanton, J. (1996). “Reinforcement of gravitational circulation by wind,” in Buoyancy Effects on Coastal and Estuarine Dynamics, eds D. G. Aubrey and C. T. Friedrichs (Washington, DC: American Geophysical Union), 47–58.
Blanton, J. O., Atkinson, L. P., Castillejo, F., and Montero, A. L. (1984). Coastal upwelling of the Rias Bajas, Galicia, northwest Spain, I; hydrographic studies. Rapp.P.V. Reun. Cons. Int. Explor. Mer. 183, 79–90.
Carballo, R., Iglesias, G., and Castro, A. (2009). Residual circulation in the Ría de Muros (NW Spain): a 3D numerical model study. J. Mar. Syst. 75, 116–130. doi: 10.1016/j.jmarsys.2008.08.004
Cerralbo, P., Grifoll, M., Espino, M., and López, J. (2013). Predictability of currents on a mesotidal estuary (Ria de Vigo, NW Iberia). Ocean Dyn. 63, 131–141. doi: 10.1007/s10236-012-0586-9
Costa, P., Gómez, B., Venâncio, A., Pérez, E., and Pérez-Muñuzuri, V. (2012). Using the regional ocean modelling system (ROMS) to improve the sea surface temperature predictions of the MERCATOR ocean system. Sci. Mar. 76, 165–175. doi: 10.3989/scimar.03614.19E
de Castro, M., Gómez-Gesteira, M., Alvarez, I., and Prego, R. (2004). Negative estuarine circulation in the Ria of Pontevedra (NW Spain). Estuar. Coast. Shelf Sci. 60, 301–312. doi: 10.1016/j.ecss.2004.01.006
de Castro, M., Gómez-Gesteira, M., Prego, R., Taboada, J. J., Montero, P., Herbello, P., et al. (2000). Wind and tidal influence on water circulation in a galician ria (NW Spain). Estuar. Coast. Shelf Sci. 51, 161–176. doi: 10.1006/ecss.2000.0619
Debreu, L., Marchesiello, P., Penven, P., and Cambon, G. (2012). Two-way nesting in split-explicit ocean models: algorithms, implementation and validation. Ocean Model. 49–50, 1–21. doi: 10.1016/j.ocemod.2012.03.003
Des, M., DeCastro, M., Sousa, M. C., Dias, J. M., and Gómez-Gesteira, M. (2019). Hydrodynamics of river plume intrusion into an adjacent estuary: the Minho River and Ria de Vigo. J. Mar. Syst. 189, 87–97. doi: 10.1016/j.jmarsys.2018.10.003
Egbert, G. D., and Erofeeva, S. Y. (2002). Efficient inverse modeling of barotropic ocean tides. J. Atmos. Ocean. Tech. 19, 183–204.
Erga, S. R., Ssebiyonga, N., Frette, Ø, Hamre, B., Aure, J., and Strand, Ø, et al. (2012). Dynamics of phytoplankton distribution and photosynthetic capacity in a western Norwegian fjord during coastal upwelling: effects on optical properties. Estuar. Coast. Shelf Sci. 97, 91–103. doi: 10.1016/j.ecss.2011.11.034
Giddings, S. N., and MacCready, P. (2017). Reverse estuarine circulation due to local and remote wind forcing, enhanced by the presence of along-coast estuaries. J. Geophys. Res. Ocean. 122, 10184–10205. doi: 10.1002/2016JC012479
Gilcoto, M., Largier, J. L., Barton, E. D., Piedracoba, S., Torres, R., Graña, R., et al. (2017). Rapid response to coastal upwelling in a semienclosed bay. Geophys. Res. Lett. 44, 2388–2397. doi: 10.1002/2016GL072416
Gilcoto, M., Pardo, P. C., Álvarez-Salgado, X. A., and Pérez, F. F. (2007). Exchange fluxes between the Ría de Vigo and the shelf: a bidirectional flow forced by remote wind. J. Geophys. Res. Ocean. 112, 1–21. doi: 10.1029/2005JC003140
Gómez-Gesteira, M., de Castro, M., Prego, R., and Pérez-Villar, V. (2001). An unusual two layered tidal circulation induced by stratification and wind in the Ria of Pontevedra (NW Spain). Estuar. Coast. Shelf Sci. 52, 555–563. doi: 10.1006/ecss.2001.0781
Graham, W. M., and Largier, J. L. (1997). Upwelling shadows as nearshore retention sites: the example of northern Monterey Bay. Cont. Shelf Res. 17, 509–532. doi: 10.1016/S0278-4343(96)00045-3
Haidvogel, D. B., and Beckmann, A. (1999). Numerical Ocean Circulation Modeling. London: Imperial College Press.
Kaihatu, J. M., Handler, R. A., Marmorino, G. O., and Shay, L. K. (1998). Empirical orthogonal function analysis of ocean surface currents using complex and real-vector methods. J. Atmos. Ocean. Technol. 15, 927–941.
Klinck, J. M., O’Brien, J. J., and Svendsen, H. (1981). A simple model of fjord and coastal circulation interaction. J. Phys. Oceanogr. 11, 1612–1626.
Large, W. G., McWilliams, J. C., and Doney, S. C. (1994). Oceanic vertical mixing: a review and a model with a nonlocal boundary layer parameterization. Rev. Geophys. 32, 363–403. doi: 10.1029/94RG01872
Largier, J. L. (2020). Upwelling Bays: how coastal upwelling controls circulation, habitat, and productivity in Bays. Ann. Rev. Mar. Sci. 12, 20.1–20.33.
Liu, Z., Gan, J., and Wu, X. (2018). Coupled summer circulation and dynamics between a bay and the adjacent shelf around hong kong: observational and modeling studies. J. Geophys. Res. Ocean. 123, 6463–6480. doi: 10.1029/2018JC013830
Marchesiello, P., Debreu, L., and Couvelard, X. (2009). Spurious diapycnal mixing in terrain-following coordinate models: the problem and a solution. Ocean Model. 26, 156–169. doi: 10.1016/j.ocemod.2008.09.004
Marta-Almeida, M., and Dubert, J. (2006). The structure of tides in the Western Iberian region. Cont. Shelf Res. 26, 385–400. doi: 10.1016/j.csr.2005.11.011
Mendes, R., Sousa, M. C., deCastro, M., Gómez-Gesteira, M., and Dias, J. M. (2016). New insights into the Western iberian buoyant plume: interaction between the Douro and Minho River plumes under winter conditions. Prog. Oceanogr. 141, 30–43. doi: 10.1016/j.pocean.2015.11.006
Nolasco, R., Gomes, I., Peteiro, L., Albuquerque, R., Luna, T., Dubert, J., et al. (2018). Independent estimates of marine population connectivity are more concordant when accounting for uncertainties in larval origins. Sci. Rep. 8, 1–16. doi: 10.1038/s41598-018-19833-w
Otero, P., Ruiz-Villarreal, M., and Peliz, A. (2008). Variability of river plumes off Northwest Iberia in response to wind events. J. Mar. Syst. 72, 238–255. doi: 10.1016/j.jmarsys.2007.05.016
Paduan, J. D., Cook, M. S., and Tapia, V. M. (2018). Patterns of upwelling and relaxation around Monterey Bay based on long-term observations of surface currents from high frequency radar. Deep Res. Part II Top. Stud. Oceanogr. 151, 129–136. doi: 10.1016/j.dsr2.2016.10.007
Pardo, P. C., Gilcoto, M., and Pérez, F. F. (2001). Short-time scale coupling between termohaline and meteorological forcing in the Ría de Pontevedra. Sci. Mar. 65, 229–240. doi: 10.3989/scimar.2001.65s1229
Peliz, Á, Rosa, T. L., Santos, A. M. P., and Pissarra, J. L. (2002). Fronts, jets, and counter-flows in the Western Iberian upwelling system. J. Mar. Syst. 35, 61–77. doi: 10.1016/S0924-7963(02)00076-3
Penven, P., Roy, C., Colin De Verdière, A., and Largier, J. (2000). Simulation of a coastal jet retention process using a barotropic model. Oceanol. Acta 23, 615–634. doi: 10.1016/S0399-1784(00)01106-3
Piedracoba, S., Álvarez-Salgado, X. A., Rosón, G., and Herrera, J. L. (2005). Short-timescale thermohaline variability and residual circulation in the central segment of the coastal upwelling system of the R??a de Vigo (northwest Spain) during four contrasting periods. J. Geophys. Res. C Ocean. 110, 1–15. doi: 10.1029/2004JC002556
Piedracoba, S., Rosón, G., and Varela, R. A. (2016). Origin and development of recurrent dipolar vorticity structures in the outer Ría de Vigo (NW Spain). Cont. Shelf Res. 118, 143–153. doi: 10.1016/j.csr.2016.03.001
Preisendorfer, R. W., and Mobley, C. D. (1988). Principal Component Analysis in Meteorology and Oceanography. Amsterdam: Elsevier.
Rosón, G., Alvarez-Salgado, X. A., and Pérez, F. F. (1997). A non-stationary box model to determine residual fluxes in a partially mixed estuary, based on both thermohaline properties: application to the Ria de Arousa (NW Spain). Estuar. Coast. Shelf Sci. 44, 249–262. doi: 10.1006/ecss.1996.0127
Ruiz-Villarreal, M., Montero, P., Taboada, J. J., Prego, R., Leitao, P. C., and Perez-Villar, V. (2002). Hydrodynamic Model Study of the Ria de Pontevedra Under Estuarine Conditions. Estuar. Coast. Shelf Sci. 54, 101–113. doi: 10.1006/ecss.2001.0825
Shchepetkin, A. F., and McWilliams, J. C. (2005). The regional oceanic modeling system (ROMS): a split-explicit, free-surface, topography-following-coordinate oceanic model. Ocean Model. 9, 347–404. doi: 10.1016/j.ocemod.2004.08.002
Sousa, M. C., Mendes, R., Alvarez, I., Vaz, N., Gomez-Gesteira, M., and Dias, J. M. (2014a). Unusual circulation patterns of the rias baixas induced by minho freshwater intrusion (NW of the Iberian Peninsula). PLoS One 9:e0112587. doi: 10.1371/journal.pone.0112587
Sousa, M. C., Vaz, N., Alvarez, I., Gomez-Gesteira, M., and Dias, J. M. (2014b). Influence of the minho river plume on the rias baixas (nw of the iberian peninsula). J. Mar. Syst. 139, 248–260. doi: 10.1016/j.jmarsys.2014.06.012
Sousa, M. C., Vaz, N., Alvarez, I., Gomez-Gesteira, M., and Dias, J. M. (2014c). Modeling the Minho River plume intrusion into the Rias Baixas (NW Iberian Peninsula). Cont. Shelf Res. 85, 30–41. doi: 10.1016/j.csr.2014.06.004
Souto, C., Fariña-Busto, E., Alvarez, L., and Rodríguez, I. (2001). Wind and tide current prediction using a 3D finite difference model in the Ría de Vigo (NW Spain). Sci. Mar. 65, 269–276. doi: 10.3989/scimar.2001.65s1269
Souto, C., Gilcoto, M., Fariña-Busto, L., and Pérez, F. F. (2003). Modeling the residual circulation of a coastal embayment affected by wind-driven upwelling: circulation of the Ría de Vigo (NW Spain). J. Geophys. Res. 108:3340. doi: 10.1029/2002JC001512
Taboada, J. J., Prego, R., Ruiz-Villarreal, M., Gómez-Gesteira, M., Montero, P., Santos, A. P., et al. (1998). Evaluation of the seasonal variations in the residual circulation in the Ria of Vigo (NW Spain) by means of a 3D Baroclinic model. Estuar. Coast. Shelf Sci. 51, 661–670. doi: 10.1006/ecss.1998.0385
Torres López, S., Varela, R. A., and Delhez, E. (2001). Residual circulation and thermohaline distribution of the Ría de Vigo: a 3-D hydrodynamical model. Sci. Mar. 65, 277–289. doi: 10.3989/scimar.2001.65s1277
Valle-Levinson, A., Atkinson, L. P., Figueroa, D., and Castro, L. (2003). Flow induced by upwelling winds in an equatorward facing bay: Gulf of Arauco, Chile. J. Geophys. Res. Ocean. 108, 1–14. doi: 10.1029/2001jc001272
Valle-Levinson, A., Caceres, M. A., and Pizarro, O. (2014). Variations of tidally driven three-layer residual circulation in fjords. Ocean Dyn. 64, 459–469. doi: 10.1007/s10236-014-0694-9
Valle-Levinson, A., Schneider, W., Sobarzo, M., Bello, M., Bravo, L., Castillo, M., et al. (2004). Wind-induced exchange at the entrance to Concepción Bay, an equatorward facing embayment in central Chile. Deep Res. Part II Top. Stud. Oceanogr. 51, 2371–2388. doi: 10.1016/j.dsr2.2004.08.010
Villacieros-Robineau, N., Herrera, J. L., Castro, C. G., Piedracoba, S., and Roson, G. (2013). Hydrodynamic characterization of the bottom boundary layer in a coastal upwelling system (R{í}a de Vigo, NW Spain). Cont. Shelf Res. 68, 67–79. doi: 10.1016/j.csr.2013.08.017
Willmott, C. J. (1981). On the validation of models. Phys. Geogr. 2, 184–194. doi: 10.1080/02723646.1981.10642213
Wooster, W. S., Bakun, A., and McLain, D. R. (1976). The seasonal upwelling cycle along the eastern boundary of the north atlantic. J. Mar. Res. 34, 131–141.
Keywords: 3D model, residual circulation, gyres, Ría de Pontevedra, NW Spain
Citation: Cruz ER, Nolasco R, Padin XA, Gilcoto M, Babarro JMF, Dubert J and Pérez FF (2021) A High-Resolution Modeling Study of the Circulation Patterns at a Coastal Embayment: Ría de Pontevedra (NW Spain) Under Upwelling and Downwelling Conditions. Front. Mar. Sci. 8:661250. doi: 10.3389/fmars.2021.661250
Received: 30 January 2021; Accepted: 02 June 2021;
Published: 15 July 2021.
Edited by:
Ming Li, University of Maryland Center for Environmental Science (UMCES), United StatesReviewed by:
Takeyoshi Nagai, Tokyo University of Marine Science and Technology, JapanCopyright © 2021 Cruz, Nolasco, Padin, Gilcoto, Babarro, Dubert and Pérez. This is an open-access article distributed under the terms of the Creative Commons Attribution License (CC BY). The use, distribution or reproduction in other forums is permitted, provided the original author(s) and the copyright owner(s) are credited and that the original publication in this journal is cited, in accordance with accepted academic practice. No use, distribution or reproduction is permitted which does not comply with these terms.
*Correspondence: Jesús Dubert, amR1YmVydEB1YS5wdA==
Disclaimer: All claims expressed in this article are solely those of the authors and do not necessarily represent those of their affiliated organizations, or those of the publisher, the editors and the reviewers. Any product that may be evaluated in this article or claim that may be made by its manufacturer is not guaranteed or endorsed by the publisher.
Research integrity at Frontiers
Learn more about the work of our research integrity team to safeguard the quality of each article we publish.