 Amelia E. H. Bridges
 David K. A. Barnes
 James B. Bell
 Rebecca E. Ross
 Kerry L. Howell
- 1School of Biological and Marine Sciences, University of Plymouth, Plymouth, United Kingdom
- 2British Antarctic Survey, NERC, Cambridge, United Kingdom
- 3Centre for Environment, Fisheries and Aquaculture Science, Lowestoft, United Kingdom
- 4Benthic Communities and Coastal Interactions Research Group, Institute of Marine Research (IMR), Bergen, Norway
Seamounts and oceanic islands rise from the seafloor and provide suitable habitat for a diverse range of biological assemblages including Vulnerable Marine Ecosystems (VMEs). Whilst they have been the focus of some work globally, there has been little description of the biological and physical environments of seamounts in the South Atlantic Ocean. In this study, we characterized benthic assemblage composition from 13 seamounts and oceanic islands spanning 8–40°S within the exclusive economic zones (EEZs) of Ascension Island, Saint Helena and Tristan da Cunha. Drop camera imagery was collected between 170 and 1000 m. All fauna present in images were identified and quantified, and multivariate statistics were used to describe biological assemblages and identify their environmental drivers. Benthic communities of temperate regions (Tristan da Cunha archipelago) were shown to be distinct from those found in the tropics, with latitude and depth identified as key environmental drivers of assemblage composition. Our results are consistent with the current understanding of the biogeography of the South Atlantic, both in terms of the distinction between tropical and temperate regions, and the influence of depth and water mass structure on assemblage distribution. Faunal assemblages are similar to those observed in the North Atlantic in terms of functional groups. VMEs are present within the EEZs of all three territories and are potentially protected from some threats by large marine protected areas (MPAs). Our imagery, data and analyses provide a baseline for south Atlantic seamounts so that future monitoring can establish whether existing protected status is sufficient to conserve both unique biodiversity and considerable potential for vital ecosystem services.
Introduction
Seamounts are features generally defined as rising more than 1000 m off the surrounding seabed and are found in all ocean basins (Clark et al., 2010). Estimates of their number vary based on methods of identification and detection, but recent studies propose values between 25,000 and 35,000 (Kim and Wessel, 2011; Yesson et al., 2011). If seamounts break the surface, they are referred to as oceanic islands, many of which are very isolated. In the South Atlantic, the United Kingdom Overseas Territory (UKOT) of Saint Helena, Ascension and Tristan da Cunha is made up of three geographically separated islands/island groups spanning ∼8 to ∼40°S. These islands function similarly to seamounts in the sense that they provide a hard substrate habitat in an otherwise largely soft substrate deep sea (Rogers, 1994), as well as providing benthic habitat in areas that would otherwise be pelagic and thus are important in sustaining populations of benthic fauna, particularly when they are part of mid-ocean ridge systems (Priede et al., 2013). Seamounts are also associated with increased production in surface waters due to the trapping of diurnally migrating zooplankton over the summit (Clark et al., 2010). This attracts subsequent activity from organisms further up the trophic chain, all resulting in increased carbon flux to depth, which facilitates higher species richness and supports increased benthic biomass (Samadi et al., 2006).
Seamount benthic macrofauna is typically dominated by sessile, filter feeding fauna (Samadi et al., 2007; Rogers, 2018), with the flank regions often home to large, fragile cold-water coral (CWC) reefs (Roberts, 2002; Rogers et al., 2007). Seamounts in the South Atlantic are understudied (Clark et al., 2010), particularly with regards to the structure of benthic assemblages. The Vitória-Trindade seamount chain (VTC) found off the coast of Brazil in the southwest Atlantic has been the focus of a number of studies. However, most either study the shallower mesophotic communities (e.g., Pereira-Filho et al., 2012; Meirelles et al., 2015), or only consider certain taxa (Leal and Bouchet, 1991; Santos et al., 2020). O’Hara et al. (2010) investigated the environmental drivers of assemblages across the VTC, but data are based on presence-absence at the species level and therefore cannot be used to compare biological descriptions of assemblages. They do however provide a list of the six invertebrate phyla recorded, all of which are common to seamounts.
Caselle et al. (2018) carried out surveys to investigate the assemblage structure at Tristan da Cunha in the southeast Atlantic, although this largely focused on deep water vertebrates; Supplementary Material lists records of habitat forming organisms in deep water including gorgonians, antipatharians and sea pens. Seamounts on the Walvis Ridge in the southeast Atlantic are known to contain diverse assemblages of both fish and benthic invertebrates including CWC reefs (FAO, 2016). With a subset of the data used in this study, Barnes et al. (2019) describe deep water assemblages around Ascension Island as often dominated by ophiuroids and corals, and assemblages on the surrounding seamounts being dominated by sessile suspension feeders.
There are many environmental factors that can influence both the composition and distribution of benthic assemblages on seamounts and oceanic islands, as well as their overall species richness. These include, but are not limited to, depth (Boschen et al., 2015), biogeographic region (McClain et al., 2009), local hydrodynamic regime (Levin and Thomas, 1989), surface productivity (Hernández-León et al., 2020; Bridges et al., in review), particulate organic carbon (POC) flux to depth (Morgan et al., 2019), temperature (O’Hara and Tittensor, 2010; Woolley et al., 2016), and topography and substrate type (Lundsten et al., 2009). In the South Atlantic, O’Hara et al. (2010) identified distance from shore, temperature, dissolved oxygen and POC as important environmental predictors of assemblage composition along the VTC. Depth, and/or covariate environmental parameters such as temperature, are known to play a significant role in structuring assemblages in the deep-sea (Howell et al., 2002; McClain et al., 2010; Long and Baco, 2014). However, the magnitude of the effect of depth and associated environmental variables varies, as does the effect when focusing on specific taxa versus full assemblages. Howell et al. (2002) investigated the depth-related distribution and abundance of seastars in the Porcupine Seabight area of the North Atlantic, and found that there was ∼ 20% turnover every 1000 m descended, although rate of turnover varies with depth. Focusing on broader megafaunal community structure, McClain et al. (2010) reported a 50% change in assemblage composition with every ∼1500 m descended on Davidson Seamount in the Northeast Pacific, whilst Long and Baco (2014) reported a 93% species turnover with a depth change of ∼200 m in the Makapu’u coral bed off Hawaii.
Despite their importance as biodiverse ecosystems and as being essential feeding hotspots for pelagic predators and seabirds (Hosegood et al., 2019; Requena et al., 2020), seamounts face anthropogenic threats. Perhaps the most obvious human-induced pressure on seamounts comes in the form of fisheries, with Clark et al. (2007) reporting that in the late 1960s, at least 2 million metric tons of deep-sea species were trawled from seamounts globally. Their significance as fishing grounds is somewhat due to the presence of large coral and sponge gardens and reefs (Rogers et al., 2007) which provide essential nursery habitat for many commercial fish species (Baillon et al., 2012). Benthic trawling damages, or, in the worst case, removes these habitats, as well as the target species within them. Although particularly vulnerable to overexploitation (Watson et al., 2007), some seamount fisheries are considered to be sustainable; typically for high-value species at low quantities (Clark, 2009). In addition to fishing pressure, many seamounts are also considered prospective deep-sea mining sites due to the high concentrations of desirable metals found within the crust that forms on seamounts (Hein et al., 2000), and exposed to increasing pollution in the form of marine plastics (Barnes et al., 2018).
The vulnerability of fragile ecosystems often found in high concentration on seamounts, combined with the observed negative impacts of bottom trawling (Clark et al., 2016) prompted calls from the United Nation General Assembly (UNGA) to address issues surrounding the management of deep-sea fisheries, leading to the adoption of UN resolution 61/105, and subsequent resolutions, to protect Vulnerable Marine Ecosystems (VMEs) such as CWC reefs. This resolution requires that all Regional Fisheries Management Organisations (RFMOs) that manage fisheries in Areas Beyond National Jurisdiction (ABNJ) adopt a precautionary principle so as to mitigate any significant adverse impacts to VMEs (including those found on seamounts). Although measures implemented by some RFMOs have been effective, others require additional scientific and legal support to meet this objective (Bell et al., 2019). This resolution, combined with the subsequent development of the International Guidelines for the Management of Deep-sea Fisheries in the High Seas (FAO, 2009), mean that in some scenarios, a level of protection is applied to seamounts in ABNJ.
Although the vast majority of seamounts fall in ABNJ, some states, particularly small-island nations and territories like the UKOTs, have multiple seamounts within their exclusive economic zones (EEZs) (Yesson et al., 2011), and therefore offer a chance to significantly advance the conservation of seamounts. Those within the EEZs of Ascension Island, Saint Helena and Tristan da Cunha are now managed as part of large marine protected areas (MPAs) and/or a combination of fishing and no take zones in the South Atlantic. In order to fully understand the conservation significance of these large MPAs and to support future management plans, it is important to characterize seamounts, and understand the ecology, distribution and environmental drivers of the species and habitats in the region (Ardron, 2008). This will allow managers to ensure the correct tools (e.g., area based management tools such as MPAs) are employed in the optimal locations. For example, regional ecological and environmental characterization is important to ensure population connectivity is maintained (Christie et al., 2010; Sundblad et al., 2011; Ross et al., 2017; Balbar and Metaxas, 2019), and an understanding of species and/or habitat distribution is important in making sure representative areas are protected as opposed to atypical ones (Rice and Houston, 2011; Sundblad et al., 2011). With this in mind, this paper aims to: (1) identify the broadscale environmental drivers of seamount benthic assemblage structure in the South Atlantic; (2) characterize the benthic assemblages of South Atlantic seamounts; and (3) identify VMEs protected by each large MPA to support future spatial management.
Materials and Methods
Study Area
Saint Helena, Ascension Island, and Tristan da Cunha (henceforth referred to as St. Helena, Ascension and Tristan) make up a single UKOT in the South Atlantic Ocean (Figure 1). These oceanic islands have steep, shelving sides and the seabed descends into deep water (200 m+) very close to shore. Ascension forms part of the mid-Atlantic Ridge (MAR), St. Helena forms part of the Guinea seamount chain, and both are located within the tropics. Tristan is at the most westerly point of the Walvis Ridge and is therefore temperate. In all cases, over 90% of the EEZ is comprised of waters deeper than 1000 m.
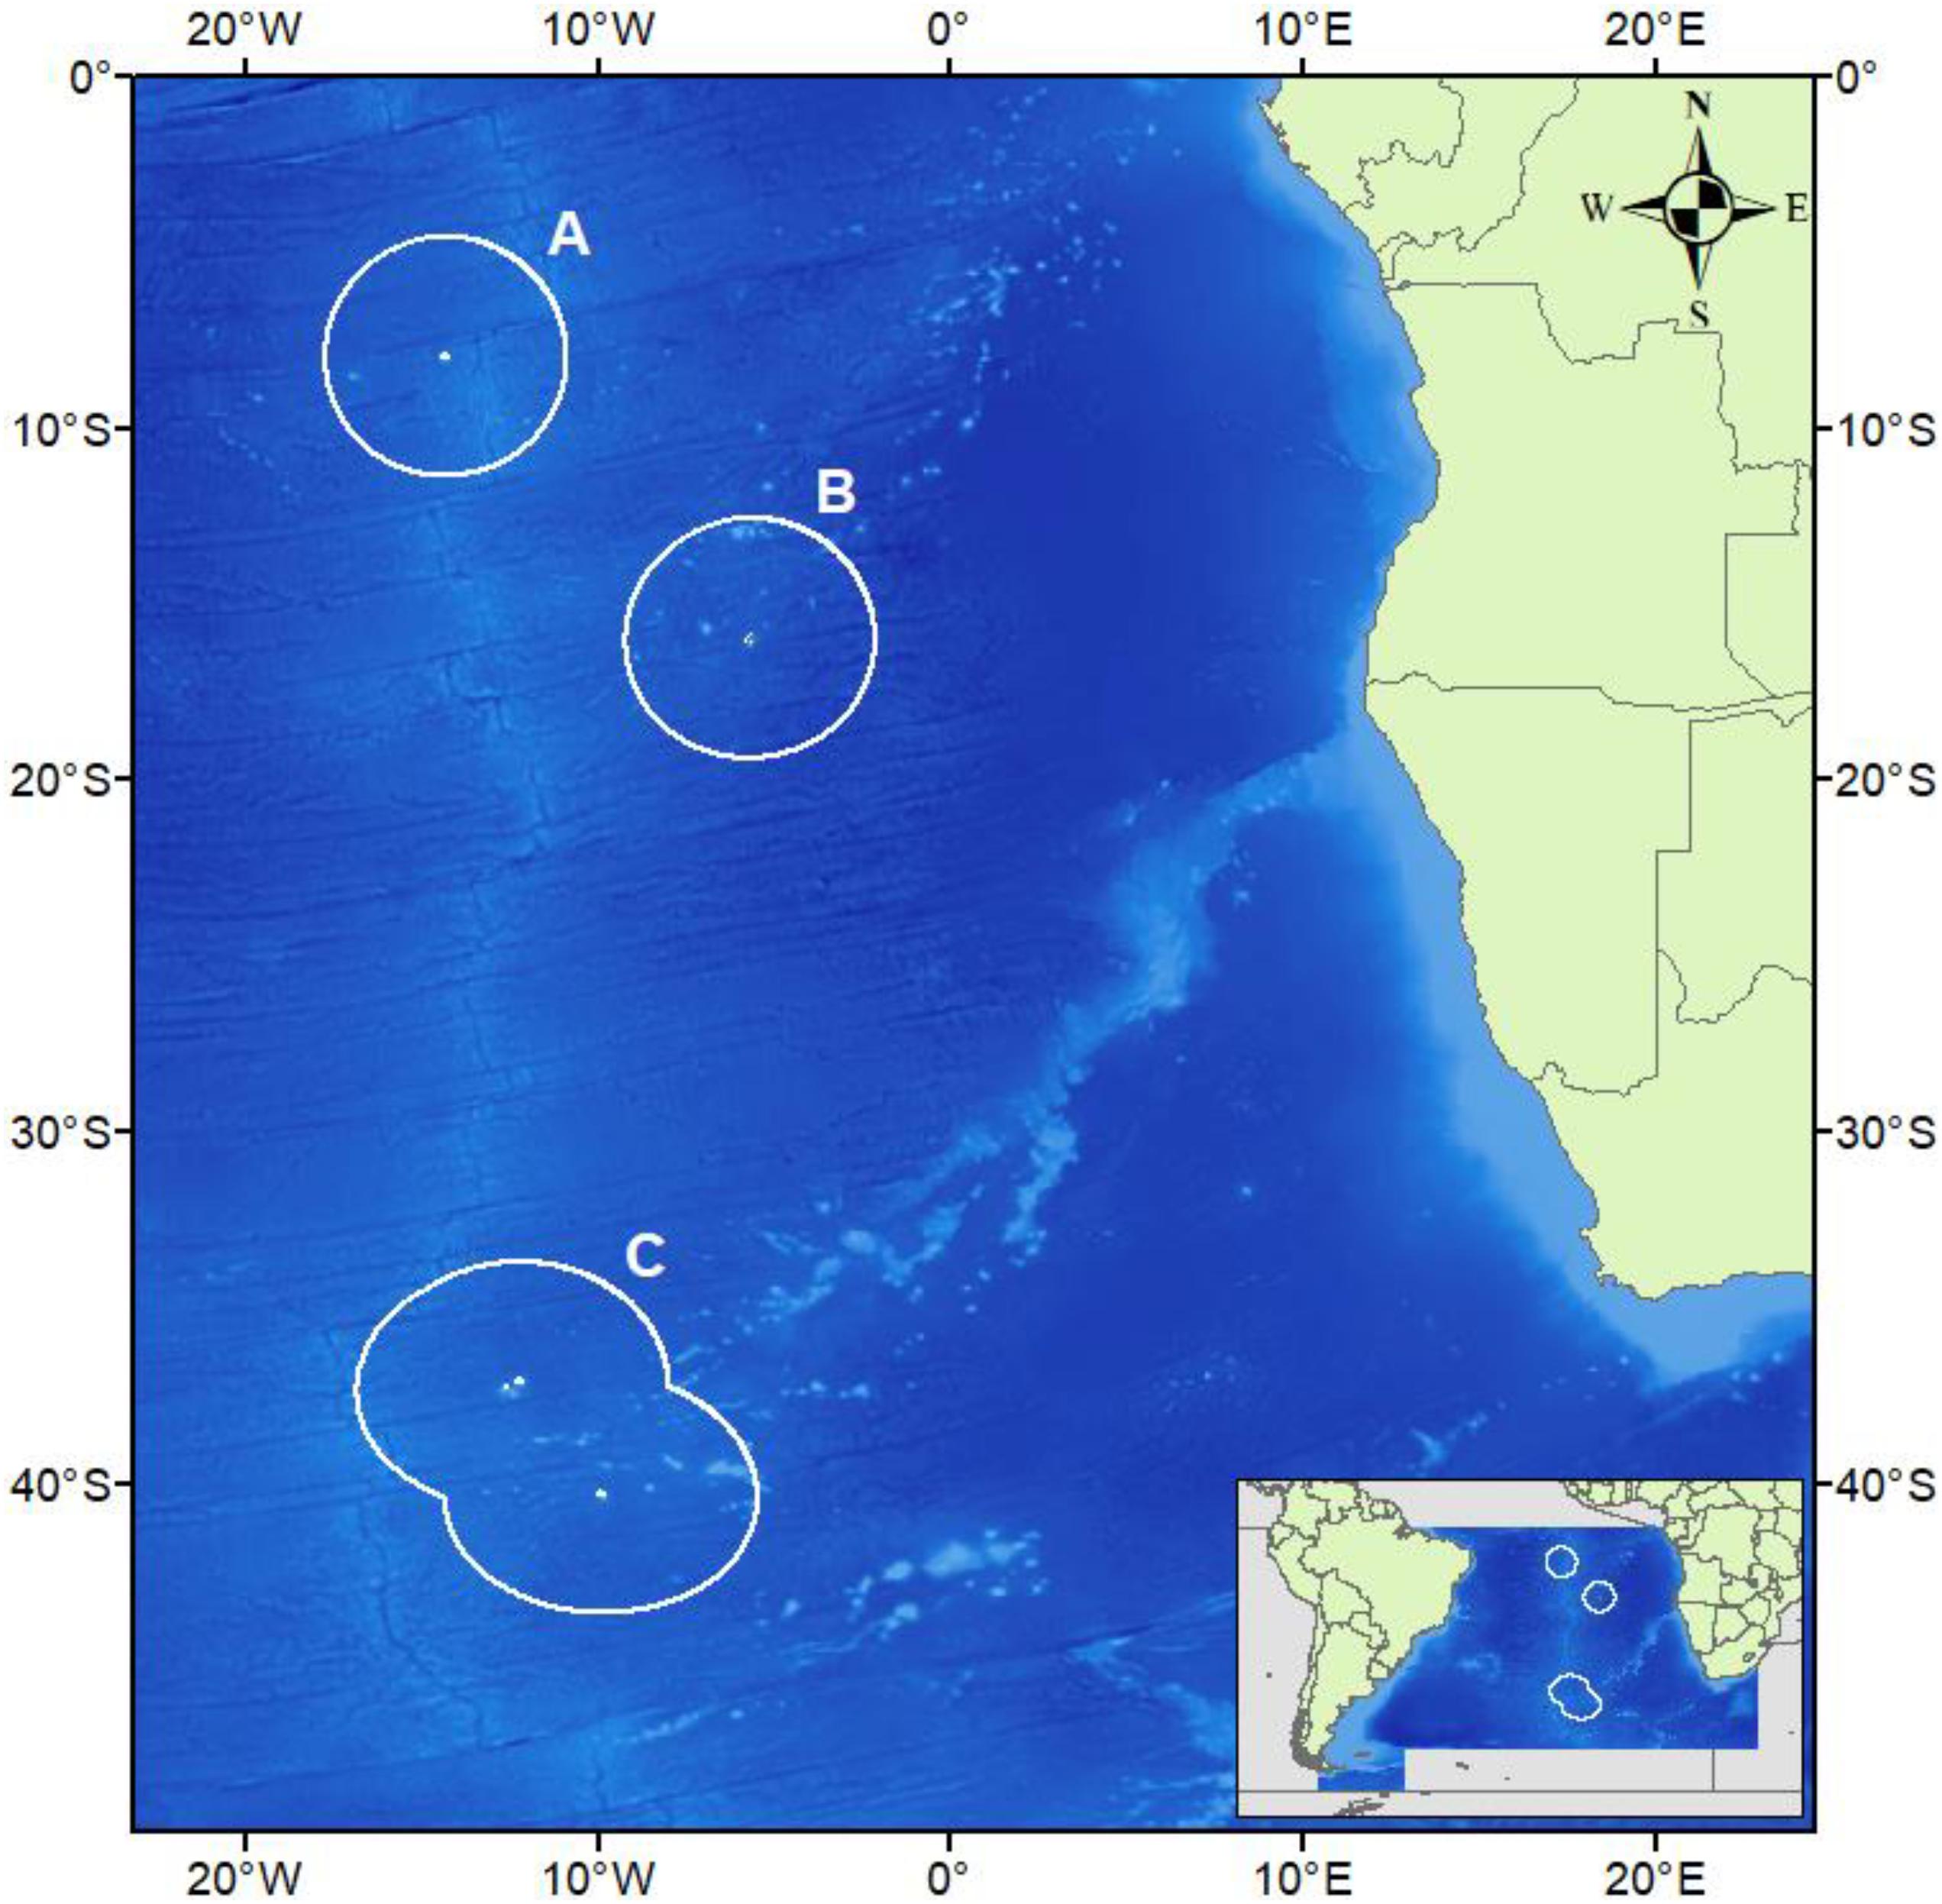
Figure 1. The South-east Atlantic Ocean with the Exclusive Economic Zones of Ascension Island (A), Saint Helena (B), and Tristan da Cunha (C) are drawn in white and correspond to Figures 3A–C. Underlying bathymetry is cropped for the region from General Bathymetric Chart of the Oceans (GEBCO_2014 Grid, version 20150318). Map drawn in WGS84.
All three islands have implemented marine protection regimes in their EEZs that range in protection level.1 The Ascension Island MPA covers the whole EEZ at just over 440,000 km2 and was designated in 2019; within the MPA, both commercial fishing and mining are prohibited. St. Helena designated their whole 451,000 km2 EEZ an IUCN Category VI MPA in 2016, allowing for “sustainable use of natural resources.” Whilst commercial fishing is allowed on a permit basis, non-scientific bottom trawling is prohibited throughout the whole MPA. In late 2020, Tristan da Cunha announced the designation of their Marine Protection Zone (MPZ). Unlike the other two islands, the MPZ is sectioned into “fully protected” (i.e., no-take) and “sustainable fishing” zones; the latter surround the two island groups and sections of four seamounts. Again, non-scientific bottom trawling is banned throughout the whole EEZ.
Sampling Methods
A bespoke camera lander [Shallow Underwater Camera System (SUCS), Figure 2] was used to collect image data from between 170 and 1000 m in cluster transects (n = 74) across 13 different seamounts and oceanic islands. Cluster transects refer to groups of images, haphazardly spaced between 5 and 10 m of each other, with all images from an individual transect taken within 100 m of each other to capture relevant environmental heterogeneity. The SUCS tripod design allows the lander to settle perpendicular to the sea floor using weights to steady itself, and capture high-resolution images (mean of 18.9 per transect, see Supplementary Material for full breakdown) of 0.14 m2 area using a five megapixel Allied Vision Prosilica GC2450 camera, a Fujinon HF12.5SA-1 lens and twin variable intensity lights, all controlled from a desktop computer on ship. Whilst the SUCS is appropriate for the collection of imagery to characterize benthic assemblages, some areas of extremely high slope cannot be sampled. An Ultra Short Base Line (USBL) beacon mounted on the camera lander allowed for an accurate Global Positioning System (GPS) position to be obtained.
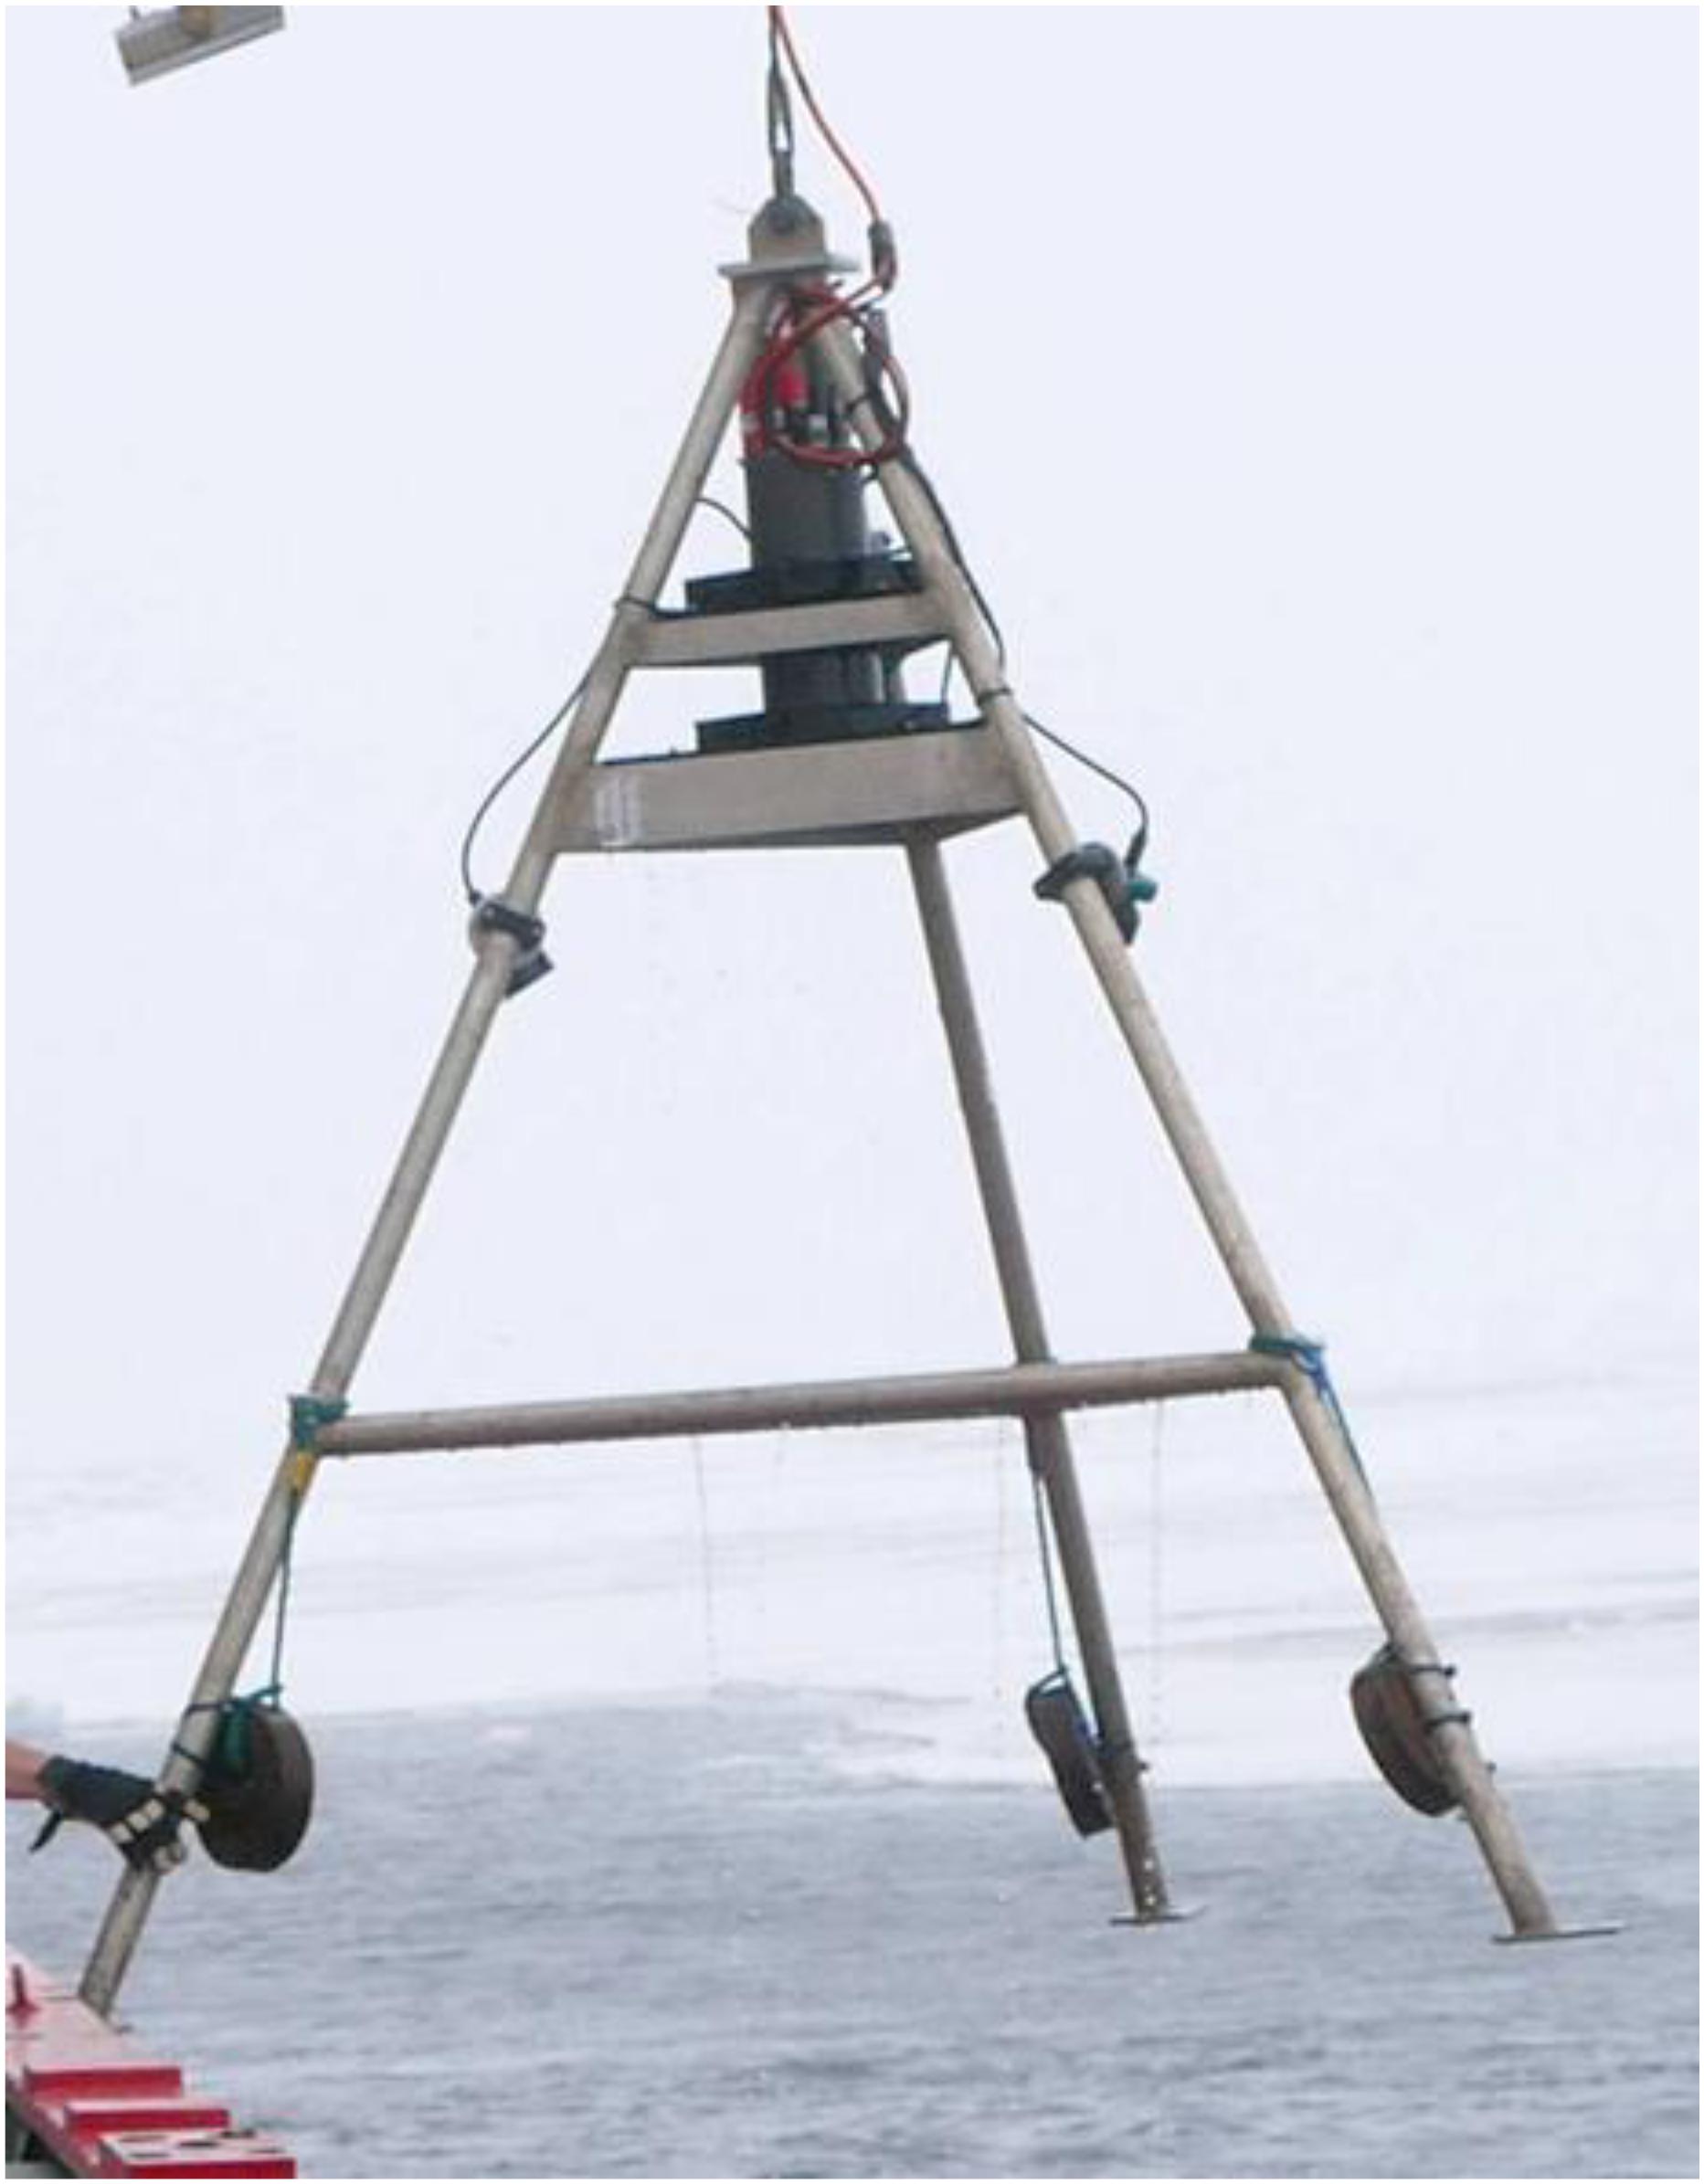
Figure 2. British Antarctic Survey’s Shallow Underwater Camera System (SUCS). Photo credit: David Barnes.
All data were collected during the 2013 [JR287, Barnes et al. (2013)], 2015 [JR864, Barnes et al. (2015)], 2017 [JR16-NG, Barnes et al. (2019)], and 2018 [JR17-004, Morley et al. (2018)] cruises of the RRS James Clark Ross, and a 2019 cruise on the RRS Discovery [DY100, Whomersley et al. (2019)]. Two cruises visited each of Ascension and Tristan, with sampling targeted toward the oceanic islands themselves in 2013 and 2015, and offshore seamounts in 2017 and 2018 (Figures 3A,C). Due to a mechanical fault with the SUCS, deployments were only made in the St. Helena EEZ in 2019 but targeted both the main island itself and two offshore seamounts (Figure 3B). Transects within each UKOT EEZ (henceforth referred to as territories) were collected from multiple seamounts/islands (henceforth referred to as sites). A breakdown of the sampling structure is presented in Table 1 with transect depths available in the Supplementary Material.
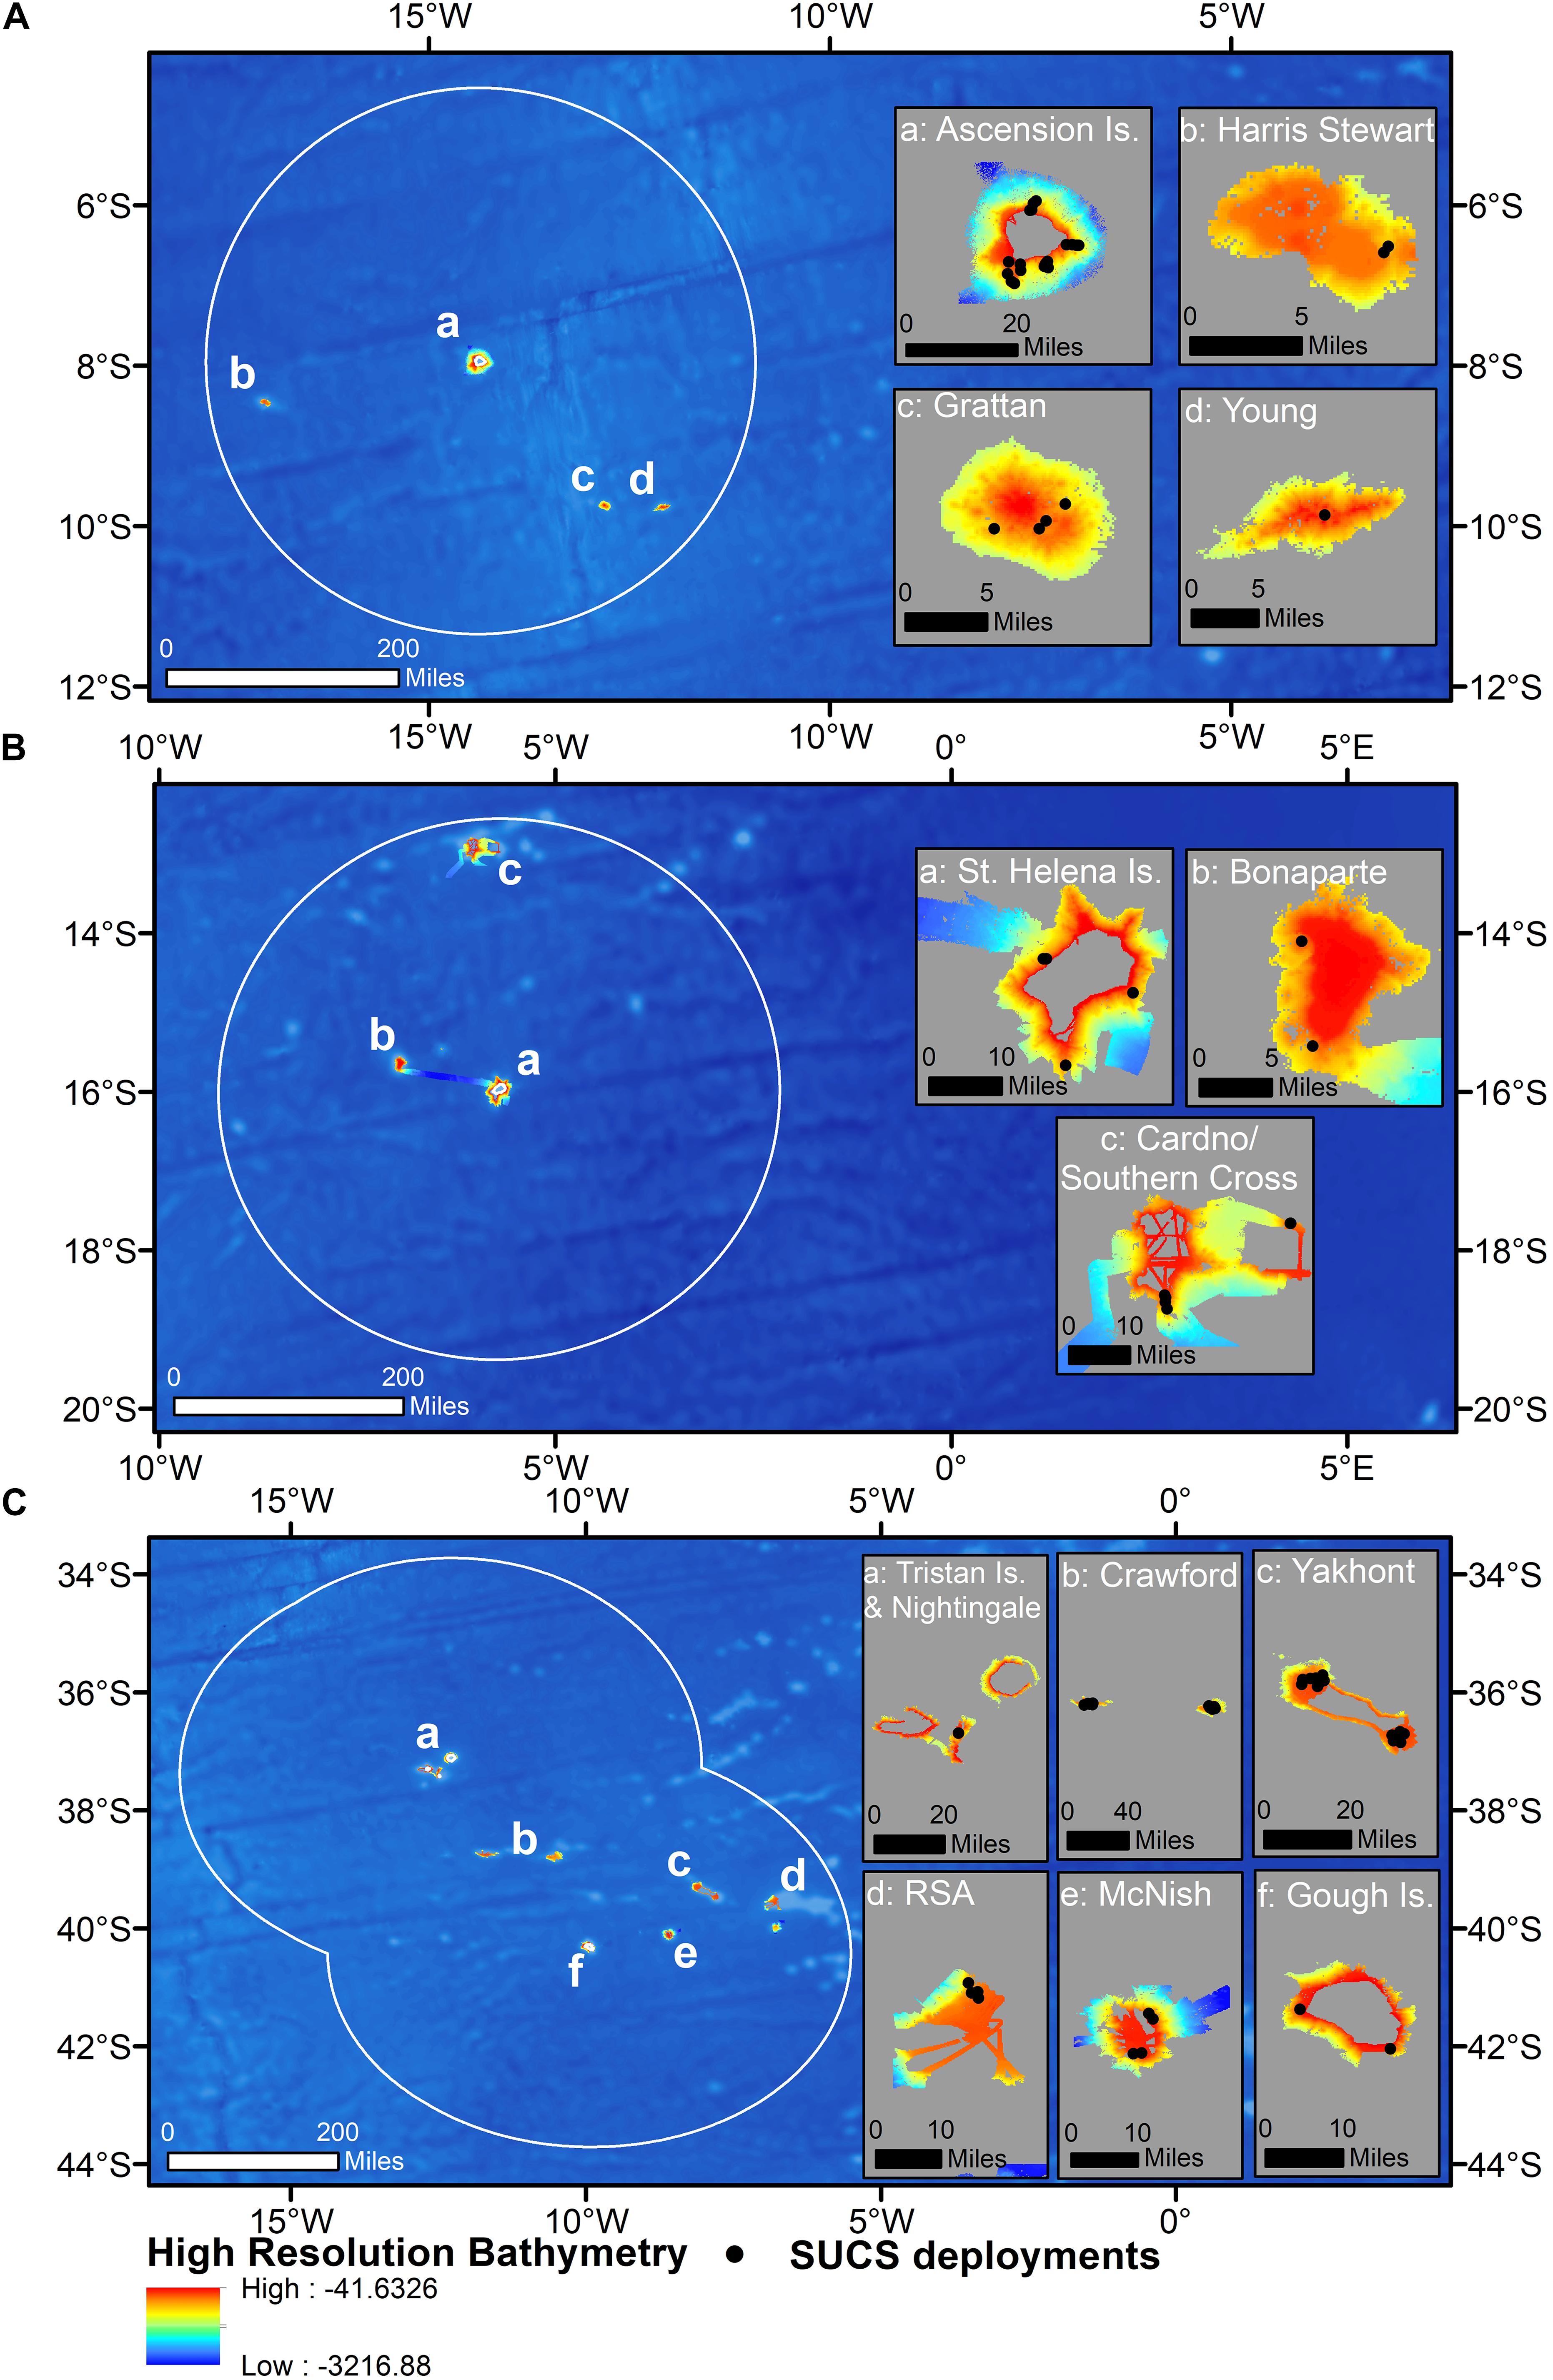
Figure 3. Camera deployments plotted on high-resolution bathymetry across: (A) all four sites within the Ascension Island EEZ, (B) all three sites within the Saint Helena EEZ, and (C) all six sites within the Tristan da Cunha EEZ. Insets show each of the bathymetric features sampled in each territory. Underlying bathymetry from General Bathymetric Chart of the Oceans (GEBCO_2014 Grid, version 20150318). Map drawn in WGS84.
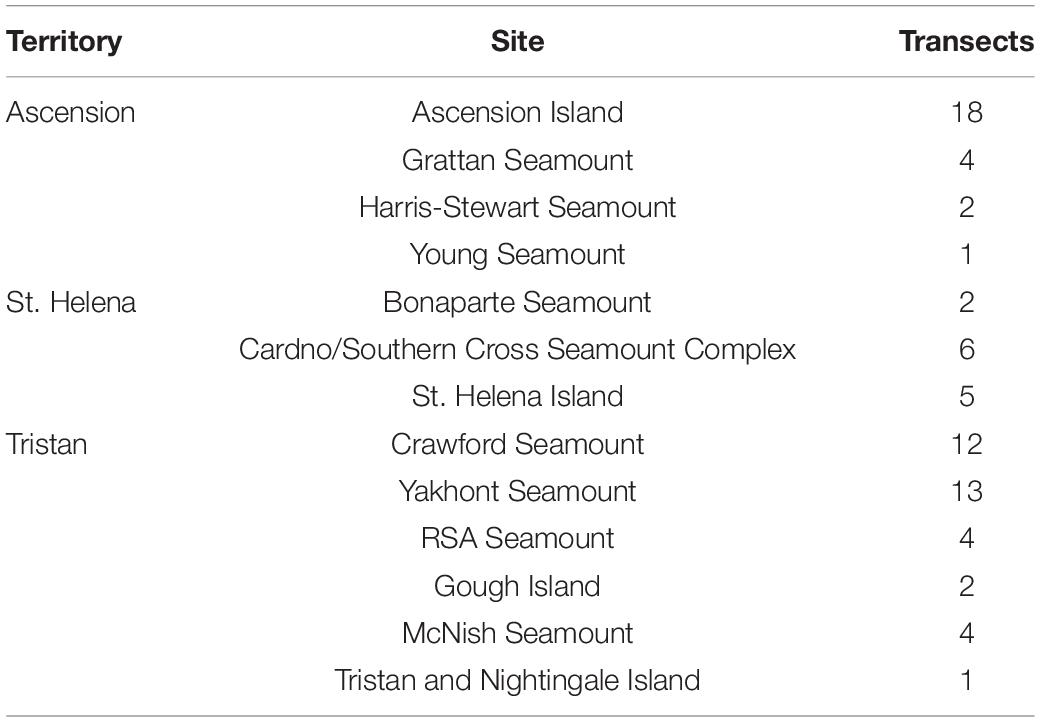
Table 1. Breakdown of transects (n = 74) per site (n = 13) and per territory.
Multibeam seabed mapping using Kongsberg EM122 and EM710 multibeam echosounders allowed for characterization of the sites prior to equipment deployments to ensure suitability for the SUCS. Agassiz trawls were used to collect physical specimens for laboratory-based identification, and temperature and oxygen profiles were recorded using a CTD at each transect.
Image Analysis
A total of 1,398 images were quantitatively analyzed using a combination of ImageJ (Schneider et al., 2012) and BIIGLE, the latter of which is an online platform designed for the annotation of images (Langenkämper et al., 2017). All organisms identified as distinct morphospecies were assigned an operational taxonomic unit (OTU). OTUs were identified to the highest taxonomic resolution possible, facilitated through comparison of image data with physical specimens collected (by mini-Agassiz trawl), and the Howell et al. (2017) deep-sea species image catalog. All individuals were counted up to 100, with some encrusting and reef-forming species recorded as percentage cover. For these OTUs values used were either 1% (as most were only present in very small abundances per image), or between 10 and 100% in 10% increments.
Primary and secondary substrate type(s) were recorded using the following categories based on Wentworth (1922): bedrock, reef framework, live reef, cobbles, coral rubble, pebbles, coral gravel, gravel, and sand (Supplementary Material). Images were also assigned a substrate hardness score based on the types and proportions of each substrate observed in the image on a six point scale where 1 would equate to 100% sand and 6–100% bedrock. For example, if 50% of the image was comprised of sand and 50% comprised of rock, the hardness score would be 3 to weight each substrate appropriately.
The Food and Agriculture Organization (FAO) developed the International Guidelines for the Management of Deep-Sea Fisheries in the High Seas (FAO, 2009) which lists five characteristics that lead to the designation of marine ecosystems as VMEs: (1) uniqueness or rarity; (2) functional significance of the habitat; (3) fragility; (4) life-history traits of component species that make recovery difficult; and (5) structural complexity. Transects were assessed as to whether authors considered them VMEs based on whether they meet any of the five criteria above, presence of the list of VME indicators provided by the South East Atlantic Fisheries Organisation (SEAFO) and habitat types listed in ICES (2016). There is currently no accepted framework from which to designate VMEs from imagery, although efforts are underway to propose both a classification and density thresholds (e.g., ICES, 2020; Rowden et al., 2020). It has however been confirmed that expert opinion can often determine VME status based on a single image, particularly when considering coral reef structures (Baco-Taylor et al., 2020).
Environmental Data Preparation
Raw multibeam files were cleaned, gridded at 25 m cell size in QPS Qimera v2.1.1 and projected from the native projection into Goode Homolosine Ocean in ArcGIS v10.7. The Benthic Terrain Modeler plugin (Walbridge et al., 2018) was used to derive rugosity, slope, fine-scale bathymetry position index (FBPI), broad-scale bathymetric position index (BBPI) and curvature. The inner and outer radii for BBPI and FBPI were 8 and 40 and 1 and 8, respectively, facilitating identification of megahabitats >1 km (e.g., banks and plateaus) and mesohabitats <1 km [e.g., gulleys and reefs; Greene et al. (1999)].
Particulate organic carbon flux to depth values at a five arcmin resolution (approximately 9.2 km at the equator) taken from Lutz et al. (2007) were resampled and re-projected to a 25 m resolution in Goode Homolosine Ocean. Mean surface primary productivity data were downloaded from Bio-Oracle, an online database of environmental variables for ecologists, and also resampled and re-projected from five arcmin to 25 m (Assis et al., 2018). It is important to note that this resampling does not alter the resolution of the underlying data, it simply splits grid cells into smaller cells to allow for raster stacking in mapping programs.
Statistical Analysis
To allow for single combined analysis of OTUs, abundance and percent cover datasets need to be brought onto the same scale by dividing one dataset by a selected value so as to equal the range of the other [as per Howell et al. (2010)]. The two datasets were checked and their distributions deemed similar enough to combine; both also ranged from 0 to 100, therefore no division was required, but data were square-rooted to account for high abundances of certain OTUs (namely reef-associated ophiuroids). A Bray-Curtis similarity matrix was created in Primer v.6 (Clarke and Gorley, 2006) for the 74 transects. Similarity/dissimilarity between samples was visualized using hierarchical cluster analysis (CLUSTER) with a SIMPROF test (at p = 0.05). Two Similarity Percentage Routines (SIMPER) were performed to determine: (1) the dominant taxa driving the distinction between SIMPROF clusters, and (2) the taxa that characterize each territory. These were run using a 50% cumulative cut-off.
Environmental data (latitude, longitude, surface primary productivity, depth, rugosity, curvature, slope, FBPI, BBPI, substrate hardness and POC flux to depth) were visualized using Draftsman’s Plots and rugosity was log-transformed as the raw distribution was skewed. A distance-based linear model (DistLM) from the PERMANOVA + software (Anderson et al., 2008) was run in Primer v.6 with all 11 variables to ascertain whether they were individually significant predictors of assemblage structure, requiring the analysis to also print a correlation matrix (Supplementary Material). Correlations >0.7 were considered strong and therefore one of each correlated pair was removed for further analysis based on the ecological relevance of the correlate, and their individual performance in DistLM marginal tests. A DistLM using the final variables was then run on the assemblage composition matrix. This determined which potential environmental drivers could best describe the relationship between assemblage structure and the environmental data using Akaike information criterion (AIC) as the selection criterion and a step-wise selection procedure, with 9,999 permutations to test significance. Distance-based redundancy analysis (dbRDA) plots were used to visualize the DistLM results in 2 dimensions.
Results
Environmental Drivers of Assemblage Structure
The correlation matrix with the 11 environmental variables revealed one correlation coefficient > ± 0.7 (surface primary productivity and latitude), and exploration of variable contribution and significance using DistLM marginal tests revealed both correlates were individually significant. Latitude was selected over surface primary productivity for further analysis as it can be assumed a proxy for other variables. Therefore, the following 10 variables were taken forward for analysis in the DistLM: latitude, longitude, depth, rugosity, curvature, slope, FBPI, BBPI, substrate hardness, and POC flux to depth. The optimum solution from the DistLM routine produced a model with an AIC of 603.65 and is detailed in Table 2. The five selected variables combined explain approximately 27% (R2 0.268) of the variation in the assemblage structure across the three territories. Latitude was the only variable that individually accounted for >5%. Substituting latitude for surface primary productivity in the available variables list did not significantly change the proportion of variance explained by the five selected variables, although it did alter the order of longitude and FBPI (results available in Supplementary Material).
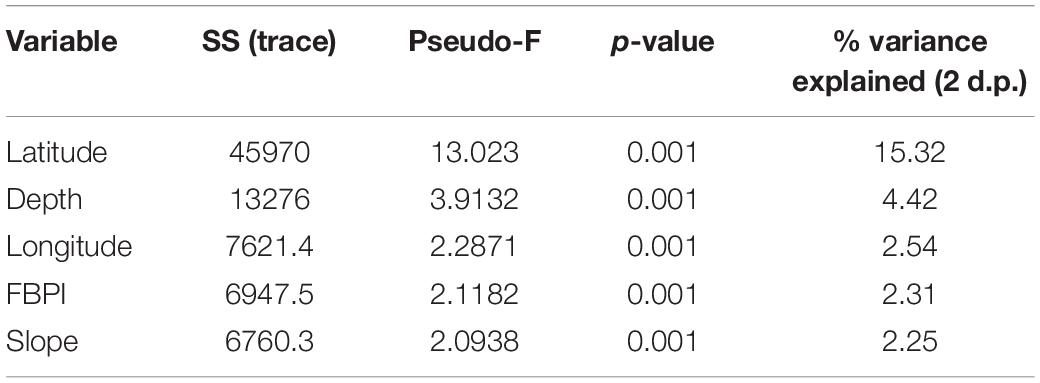
Table 2. The primary environmental drivers of benthic assemblage structure identified by DistLM with associated metrics.
Distance-based redundancy analysis plots allow visualization of the DistLM results for each significant environmental variable (Figure 4). Decreased latitude (poleward movement) drives the separation between Ascension and St. Helena transects and those from Tristan. Increased slope also appears important in separating the tropical from the temperate, although the variance in the biological data that it explains was relatively minor. Depth was important for structuring communities at all territories. The dbRDA plotted by SIMPROF clusters is available in the Supplementary Material.
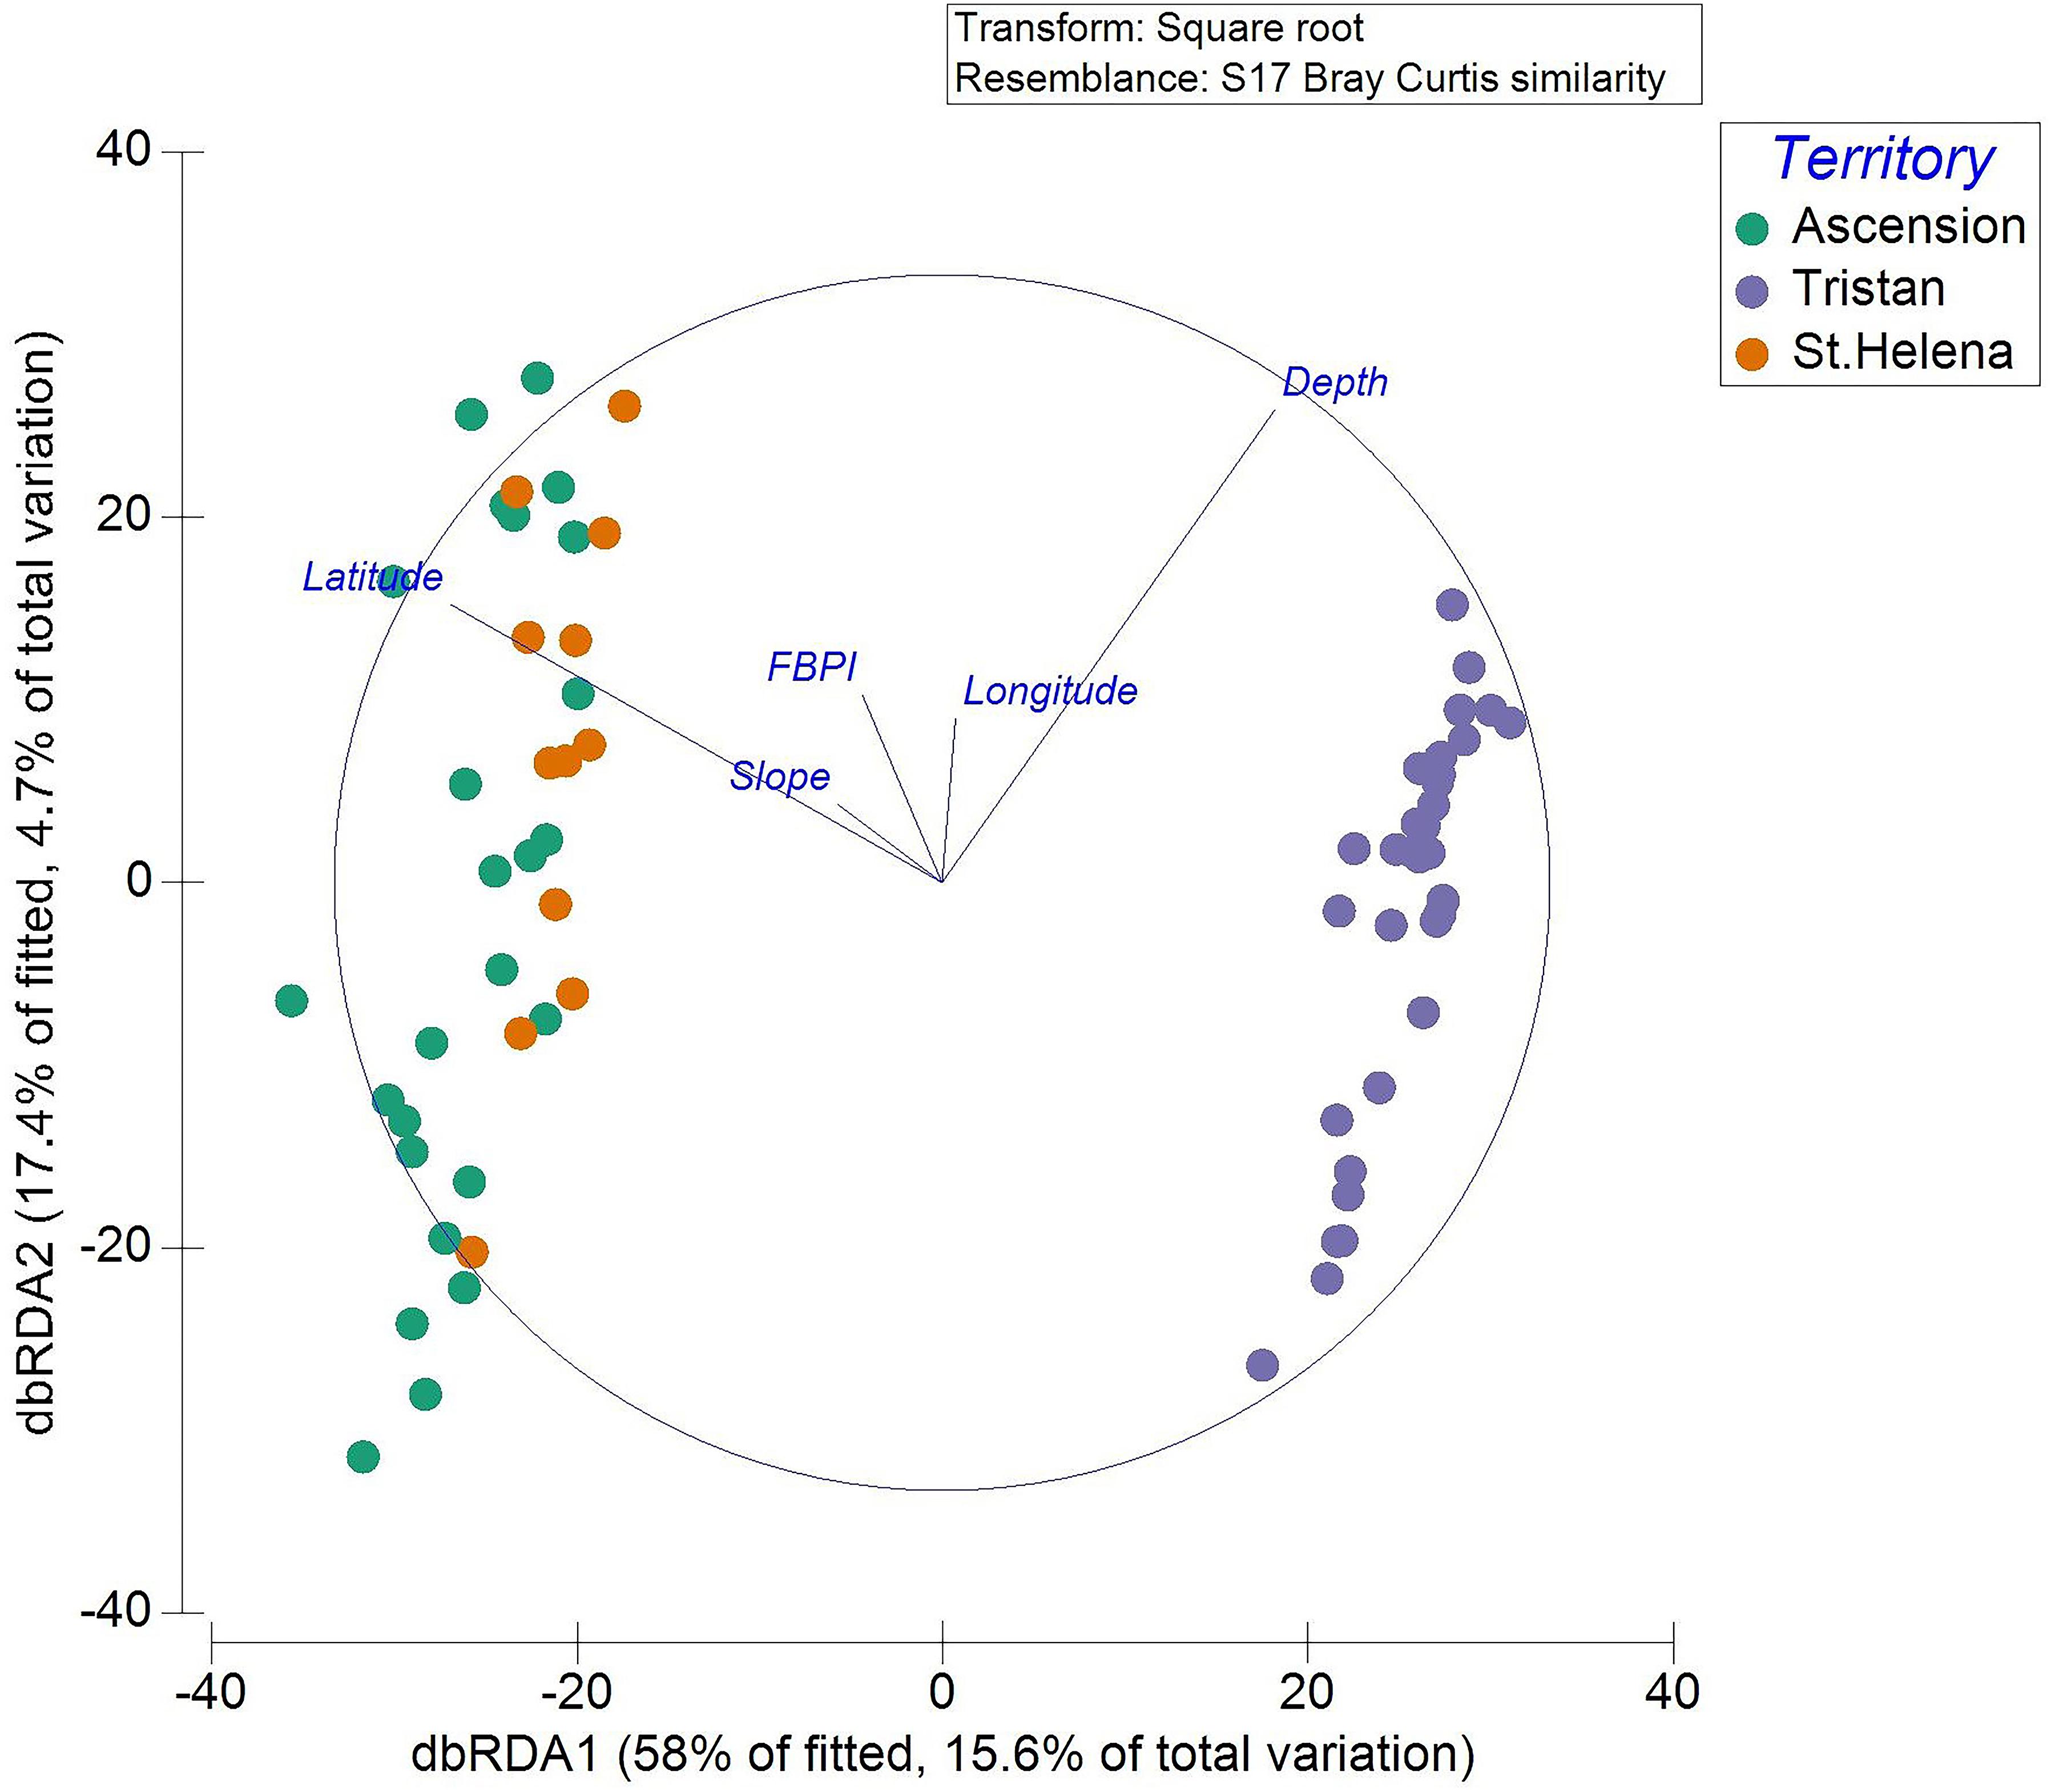
Figure 4. Transects are displayed on the dbRDA plot allowing visualization of the DistLM. Each individual transect is plotted with colors representing the territory in which they occur.
Biological Assemblages
A SIMPROF routine identified 22 biologically distinct assemblages labeled alphabetically from a to v (Supplementary Material); environmental characteristics of these are presented in Table 3. Sixteen of the assemblages comprise transects exclusively from Tristan, whilst the remaining six clusters contain transects from Ascension and St. Helena mixed together. A collapsed version of the dendrogram at 22% similarity is seen in Figure 5. After the latitudinally driven split at ∼5% similarity, depth appears to become a driving factor (see Supplementary Material for transect depth values). Alternative visualization of the SIMPROF clustering is presented in the Supplementary Material. Nine clusters (a, b, d, e, f, l, o, p, and r) contained only one transect. Some of these were deemed outliers due to emptiness; for example, the transect listed as assemblage “r” contains very few live taxa and is unlike any other area imaged. Others represent the only transect from a specific site, for example, assemblage “b” contains the only transect from around Nightingale Island in the Tristan EEZ but is ∼45% similar to other temperate island transects (Figure 5). Full environmental characterization for all clusters (including those containing only one transect) and example images can be found in the Supplementary Material.
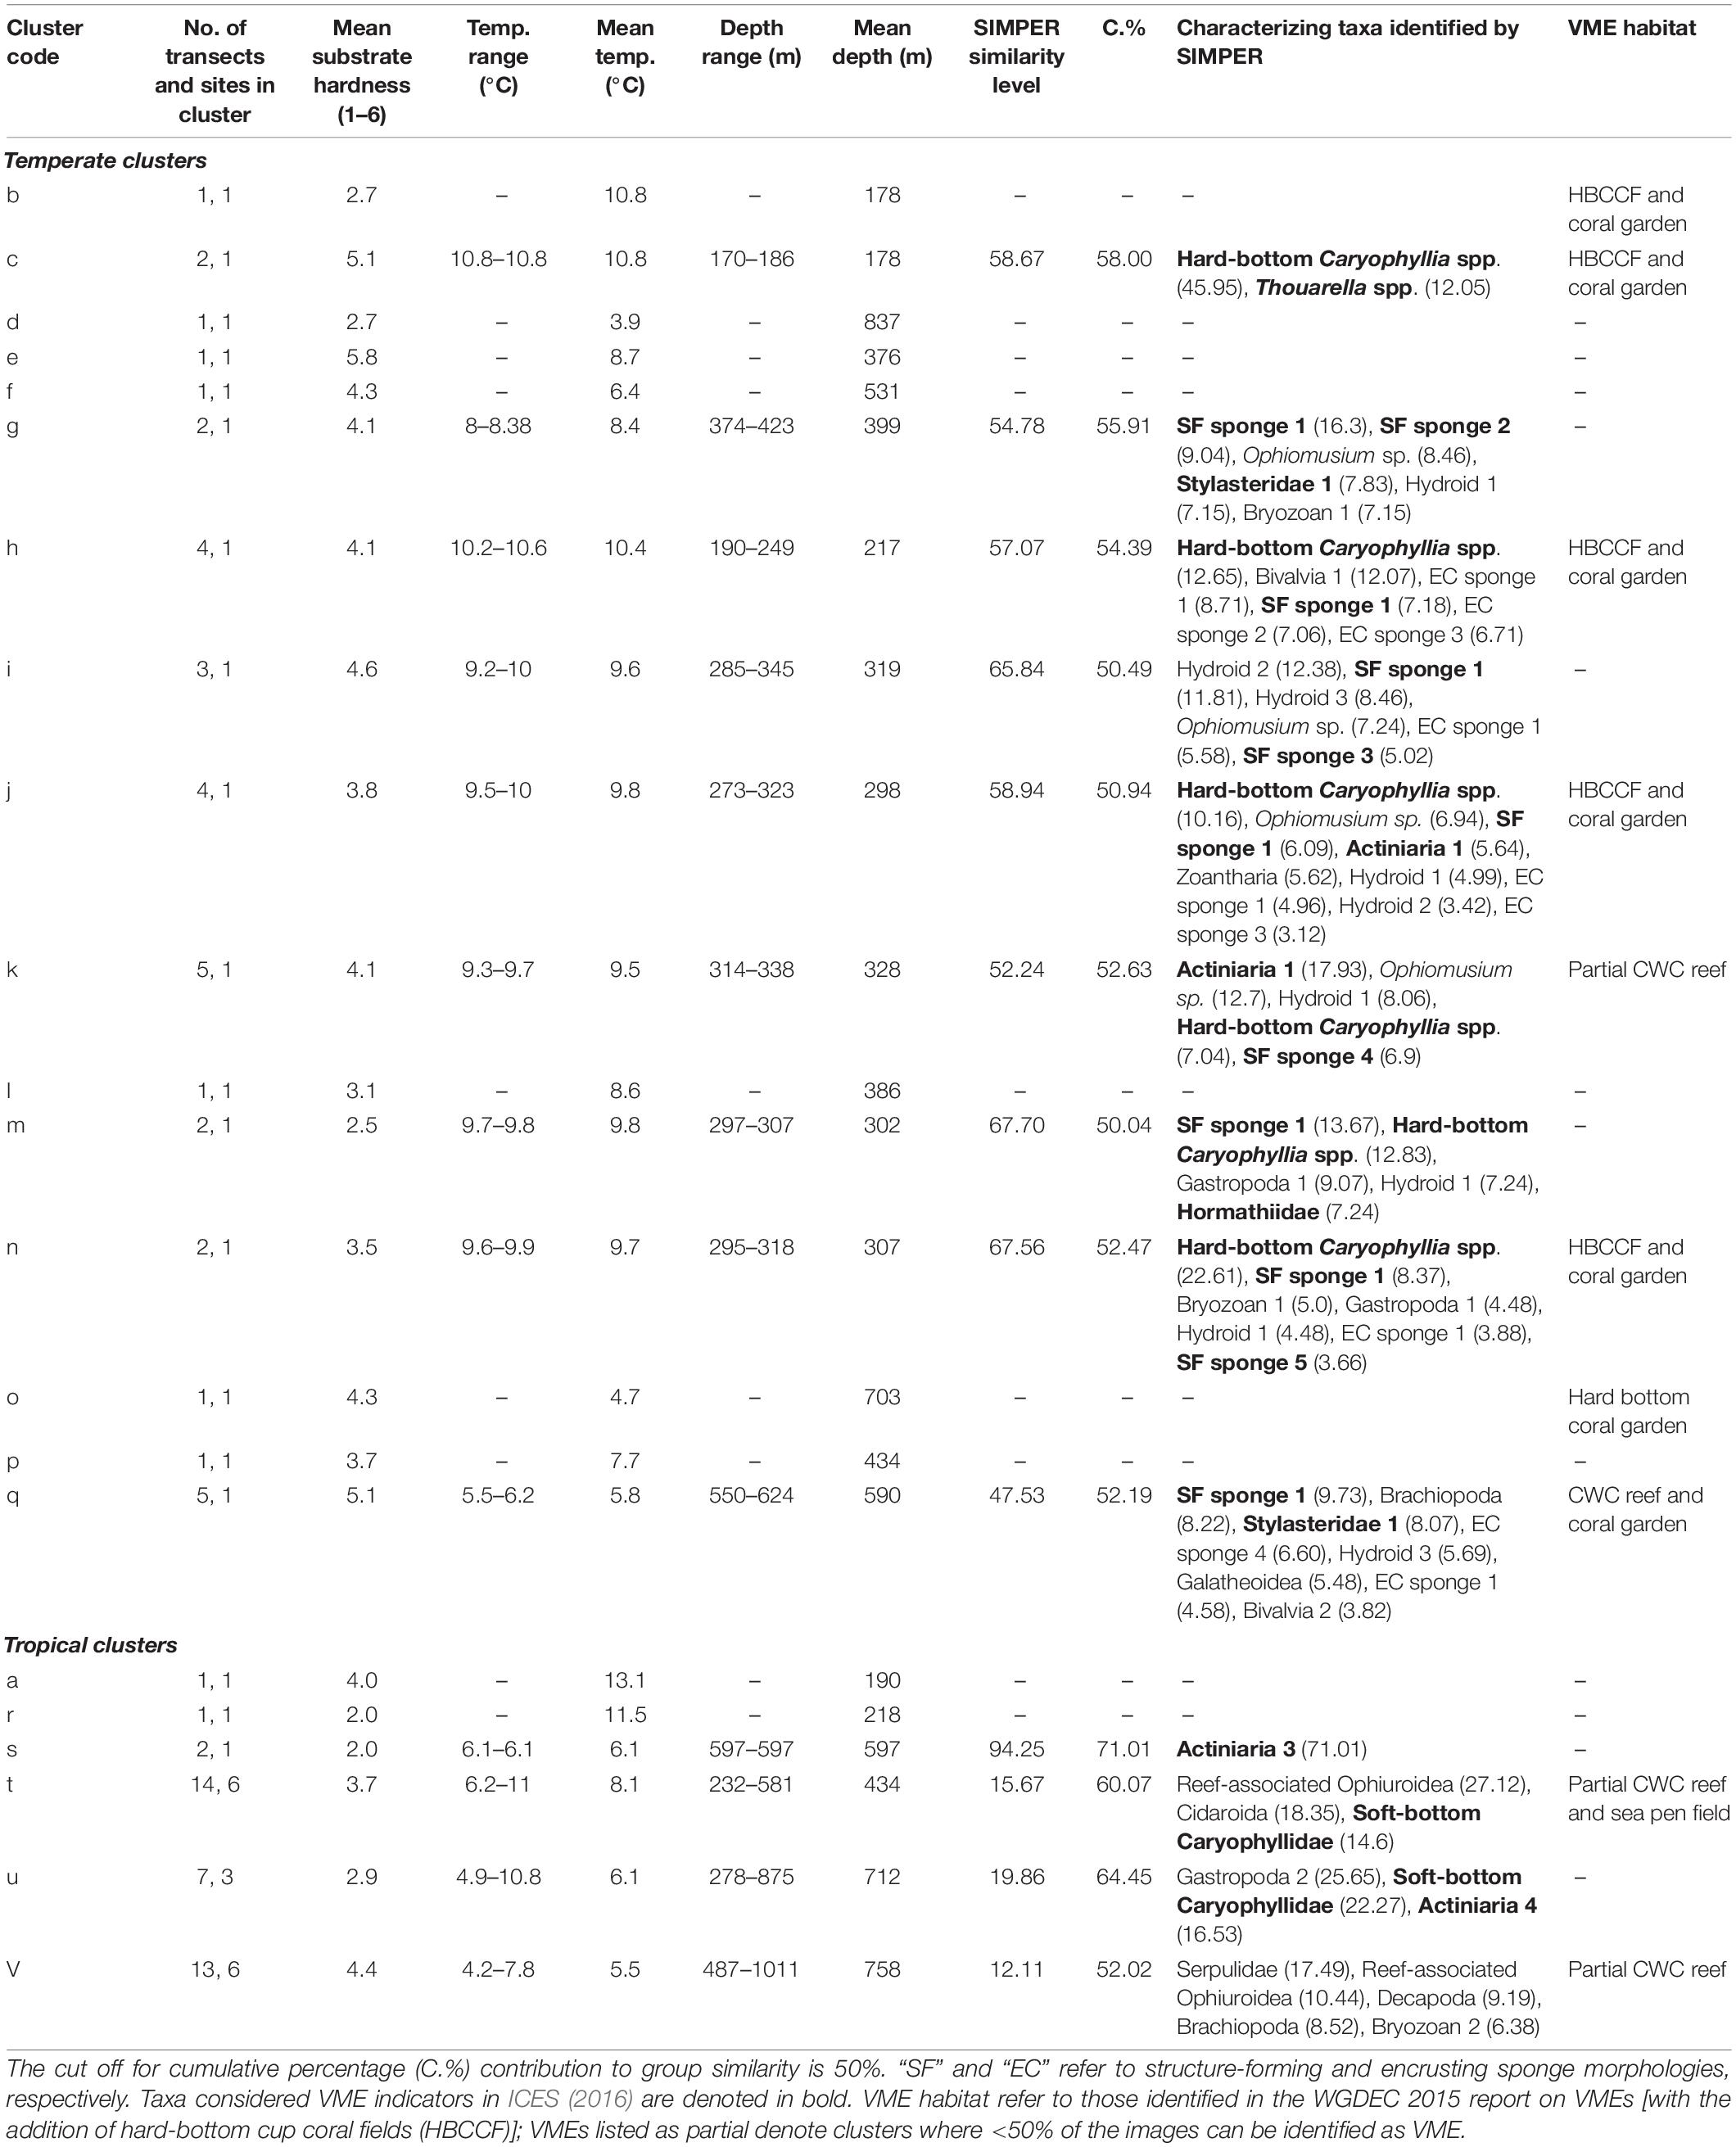
Table 3. Overview of environmental data, suggested VME classification and taxon composition (determined by SIMPER) of individual SIMPROF clusters.
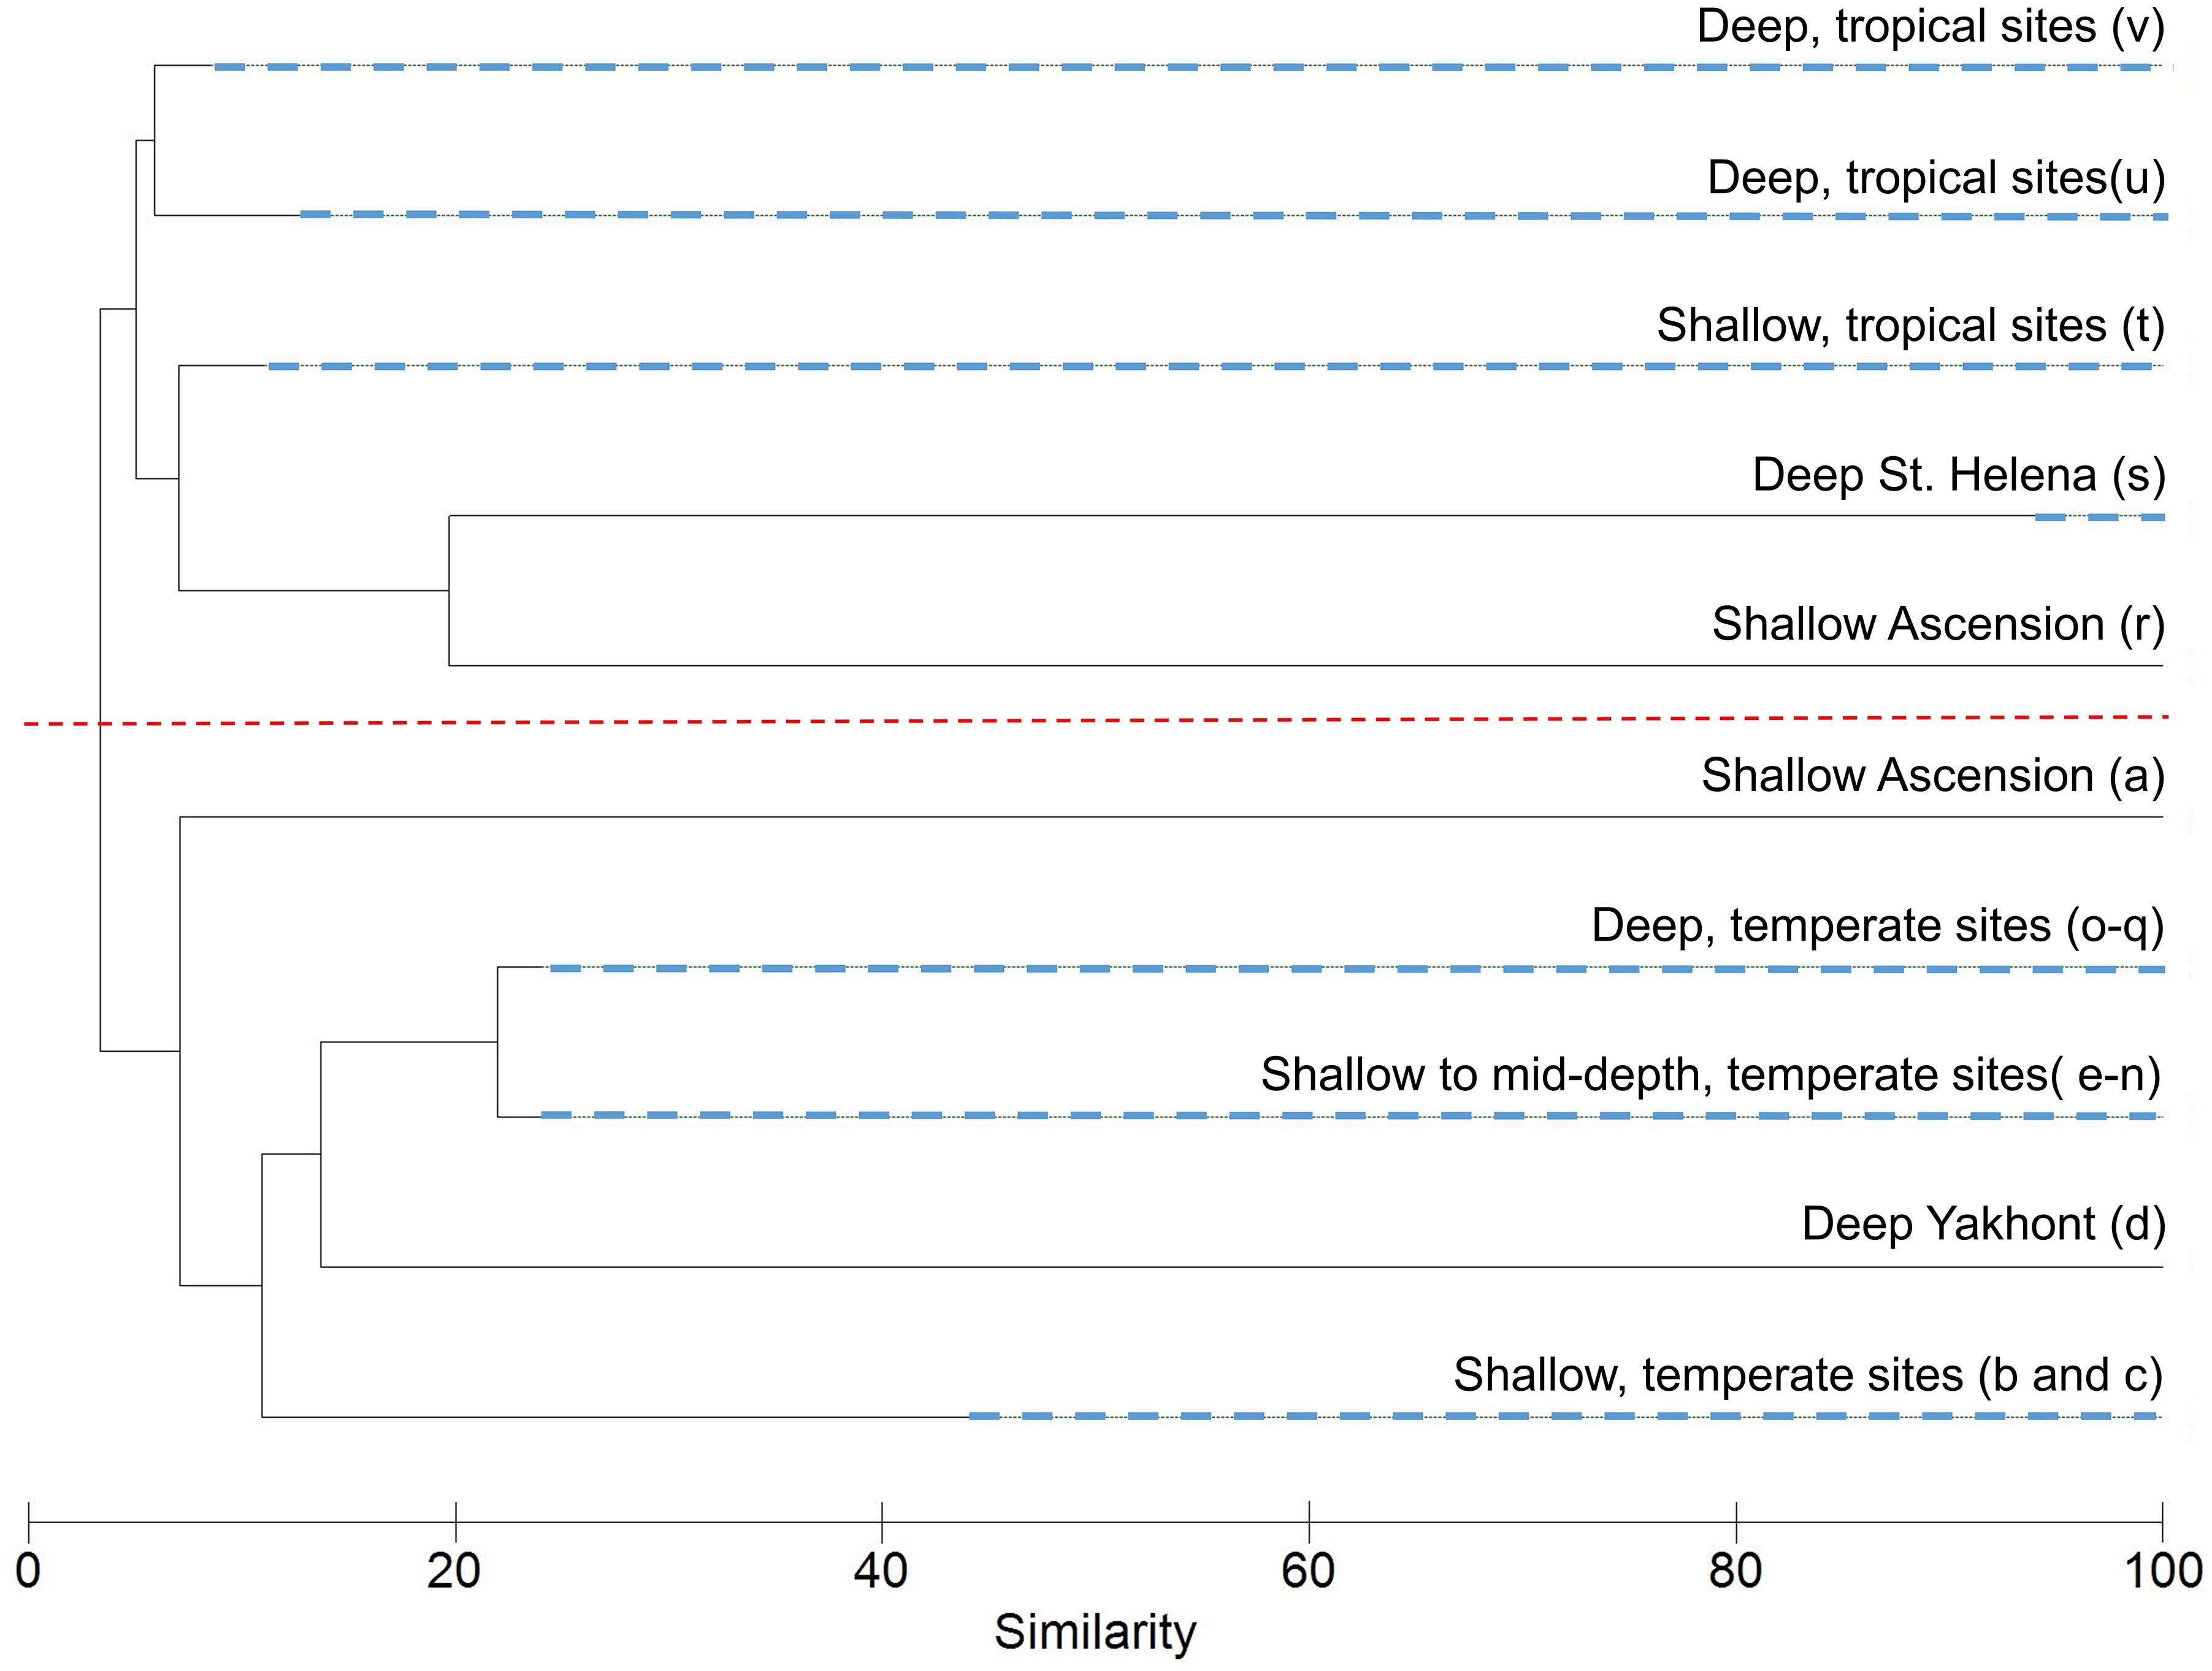
Figure 5. Cluster dendrogram from the Similarity Profile Analysis (SIMPROF) routine on the assemblage composition of each transect revealed 22 statistically significant biological assemblages. These have been collapsed at 22% similarity into major groupings with descriptions and SIMPROF cluster labels in brackets (refer to Supplementary Material for transect descriptions, or Table 3 for cluster descriptions). Nodes containing multiple, distinct clusters are denoted by dashed, blue lines. The dashed red line depicts the latitudinally driven split at ∼5% with the tropical clusters positioned above the line (excluding cluster a), and the temperate below. Supplementary Material gives an alternative visualization.
Transects from Ascension and St. Helena split into three main clusters (t–v, Figure 5). Cluster t contains 14 shallower transects and is characterized by a range of substrates both hard and soft, reflected in an average substrate hardness of 3.7/6 (Table 3). The remaining two large clusters (u and v) have similar average depths (Table 3), but are much more homogenous in their substrate, with the first containing all soft substrate transects and the second largely hard substrate transects, again reflected in their average substrate hardness scores (Table 3). These tropical clusters contain transects from multiple seamounts across both territories suggesting similar assemblages across the EEZs of Ascension and St. Helena.
Transects from Tristan cluster in smaller groupings (b–q), also appearing to cluster initially by depth (Figure 5), however this is followed by further splitting based largely on individual sites (Table 3), suggesting a larger diversity of communities among seamounts at this location.
Faunal Comparisons at the Territory Level
Faunal similarity between the territories is variable. Tristan is the most distinct with 3.17 and 4.13% similarity with Ascension and St. Helena, respectively, and is characterized by encrusting sponges, hard-bottom Caryophyllia spp. cup corals, massive structure-forming sponges, hydroids and non-reef-associated ophiuroids (Ophiomusium sp.). Tristan transects also share the highest within-group similarity at 27.48% (Table 4).

Table 4. Taxon composition (determined by SIMPER) of territories.
The within-group similarities for Ascension and St. Helena transects are substantially lower at 8.68 and 9.33%, respectively. Ascension is characterized by CWC reef-associated ophiuroids, soft-bottom cup corals from the Caryophyllidae family and prawns; St. Helena is characterized largely by cidarid urchins and CWC reef-associated ophiuroids (Table 4). A reef-building scleractinian coral (Desmophyllum pertusum, formerly Lophelia pertusa) is also present throughout numerous transects but in very low abundances in both territories.
Of the 36 transects from the Tristan EEZ, 53% were determined as VMEs based on the habitat types listed in ICES (2016) and assessment against the FAO criteria (FAO, 2009). This was substantially higher than the 24 and 23% from Ascension and St. Helena, respectively (Table 5). There was also a higher number of different VME types observed at Tristan compared to the other two territories.
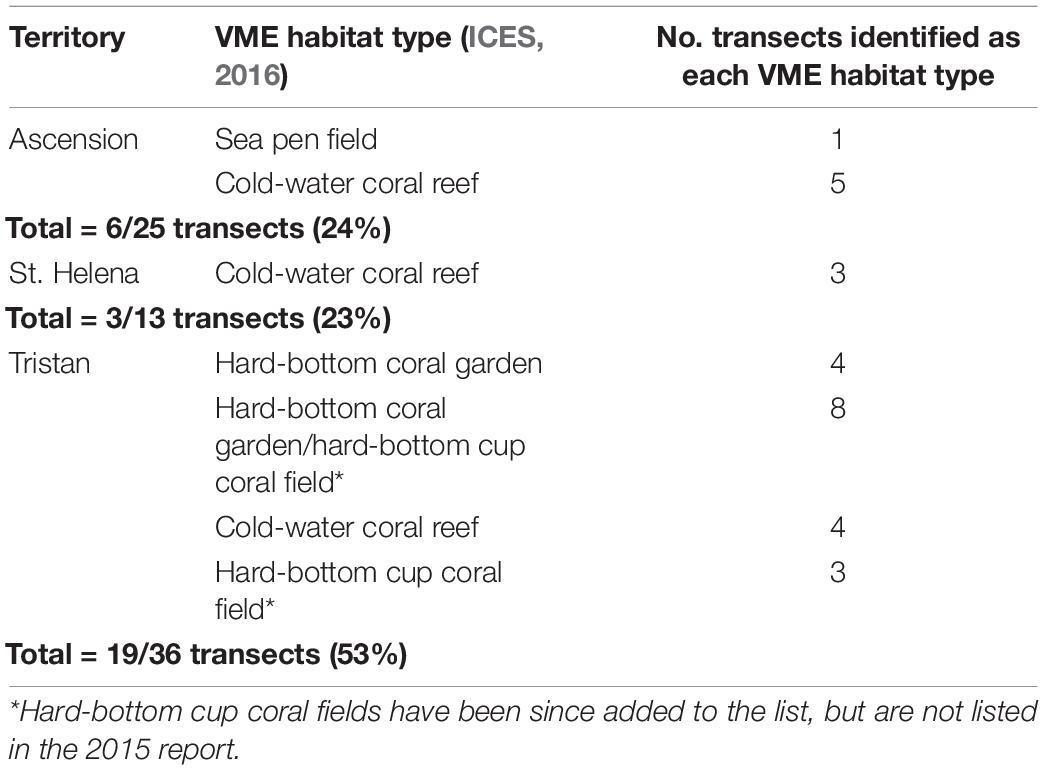
Table 5. Number of transects per territory deemed Vulnerable Marine Ecosystems [as listed in ICES (2016)], some of which present as a mosaic of >1 type.
Faunal Comparisons Between Clusters
In the tropics mid-depth transects (cluster t) were characterized by CWC reef-associated ophiuroids, cidarid urchins and soft-bottom cup corals (Table 3). D. pertusum reef is a VME habitat and was observed in 6 of the 14 transects within this cluster, and a sea pen field was also recorded. The remaining two deeper tropical clusters (u and v) appear to split based on their substrate, with the hard-bottom cluster being characterized by serpulid worms, decapods and brachiopods, and their soft-bottom counterparts characterized by soft-bottom cup corals and gastropods (Table 3). Solenosmilia variabilis reef (a VME habitat type) was present in 2 of the 13 transects in cluster v; cluster u contains no VME habitat types. All three tropical clusters have comparatively fewer characterizing taxa than temperate clusters, with a higher dominance of some taxa leading to decreased diversity (Bridges et al., in review).
The nodes at which clusters split into distinct communities for the Tristan groups are located at much higher values along the similarity axis, suggesting differences between the assemblages in temperate latitudes are more subtle. Shallower (ca. 170–300 m) communities (clusters c, h, j, m, and n) are characterized by structure-forming and encrusting sponges and hard-bottom Caryophyllia spp., with four of the five assemblages considered coral garden VMEs, with antipatharians, stylasterids and gorgonians present. Mid-depth (ca. 330–500 m) communities (clusters g and k) are characterized by small hydroids, structure-forming sponges and often Ophiomusium sp., and of the five transects that constitute cluster k, one of these contains D. pertusum reef. For many of the Tristan clusters, the environmental conditions are similar, except for the fact they are on different seamounts/different sides of the same seamount. In these clusters, the characterizing taxa are often the same/similar, but the relative abundances are different, resulting in separate clustering. The deeper temperate assemblage (cluster q) is characterized more by sponges and brachiopods that represent the associated fauna of coral gardens and S. variabilis reef.
Discussion
Environmental Drivers
Our observations suggest that the major large-scale drivers of seamount benthic assemblage structure in the South Atlantic include latitude, depth, longitude, FBPI, and slope (Table 2). This concurs with the current understanding that variables correlated with latitude and depth are strong drivers of epifaunal community composition on seamounts (McClain and Lundsten, 2015; Du Preez et al., 2016; De la Torriente et al., 2018, 2019; Morgan et al., 2019), as well as in other deep-sea ecosystems (Rowe and Menzies, 1969; Rex, 1981; Billett et al., 2001; Ruhl and Smith, 2004).
Latitude in itself is not ecologically relevant, but it acts as a proxy for other variables. Surface primary productivity typically increases with distance from the equator; it was strongly correlated with latitude (−0.99), and when used in the DistLM, yields the same results of ∼15% variation explained. Food availability has been found to strongly influence community structure in deep-sea ecosystems (Billett et al., 2001; Ruhl and Smith, 2004; Smith et al., 2008; Leduc et al., 2014). Varying levels of resource (food) availability impacts the abundance of most groups of taxa, leading to differences in assemblage structure (this is further explored in relation to specific biological assemblages observed in section “Biological Communities”).
The orientation of depth in Figure 4, as well as the clustering patterns in Figure 5, show that it is heavily involved in structuring the communities within each territory. Depth is commonly assessed as a key driver of faunal composition in the deep sea (Rex et al., 1997; Levin et al., 2001; Howell et al., 2002; Stuart and Rex, 2009; Rex and Etter, 2010), but it is the correlated variables that are more ecologically relevant, including temperature and water mass structure among others. Temperature is key in driving species distributions because it is an important regulator of metabolism. It is therefore likely that some of the importance attributed to depth in shaping benthic assemblages actually reflects the importance of temperature.
Water mass structure has been found to be a key determinant of faunal composition in the deep sea (Tyler and Zibrowius, 1992; Koslow, 1993; Bett, 2001; Howell et al., 2002). In this study the effect of water mass structure on driving the distinction and distribution of biological communities is particularly evident when focusing on the clustering patterns of the Tristan transects. Tristan da Cunha comprises four oceanic islands: three (Tristan, Nightingale, and Inaccessible) are in the northern section of the EEZ around 37°S and the fourth, Gough Island, lies to the south at ∼40°S. The Subtropical Convergence Front (STCF) lies between the two island groups and refers to where the warmer, temperate waters of the South Atlantic Gyre (SAG) meet the colder waters of the Subtropical Convergence Zone (Smythe-Wright et al., 1998). The exact location of the STCF fluctuates temporally, shifting north in the austral summer and south in the austral winter. The island group in the north always falls within the SAG meaning it receives warmer, temperate waters all year round, and Gough Island always sits in the Subtropical Convergence Zone meaning it is always surrounded by cooler water. Gough used to be subject to colder fronts that traveled further north than present day, hence the presence of sub-Antarctic bryozoans (Barnes and Griffiths, 2007). In contrast, the seamounts between the island groups are subject to large variations in temperature and salinity (and therefore water mass structure) depending on the time of year. This dynamic oceanographic regime means that dependent on where a feature is within the Tristan EEZ, it could be in one of three separate oceanographic systems (because the far south of the EEZ falls within the subantarctic frontal region), and thus support different faunal communities. In order to further explore this, temporal monitoring of water properties at the Tristan sites would be beneficial to map water mass movement. Contrastingly, the EEZs of Ascension and St. Helena are characterized by less complex water mass structures, with less variability in water mass characteristics, potentially driving less divergence in faunal communities (Peterson and Stramma, 1991).
Topographic variables including slope and bathymetric position index (BPI) are, as our results support, often identified as key drivers of benthic assemblages in the deep sea, both at the inter- and intra-seamount level (Boschen et al., 2015; Morgan et al., 2019). Slope and BPI can be used to infer the geomorphology of a region (Greene et al., 1999), which in turn can provide insight into the hydrodynamics, and thus substrate types observed within an area (Stephens and Diesing, 2015).
Steeply sloping areas such as those sampled at Ascension (and to a lesser extent St. Helena) are typically characterized by fast flowing bottom currents that can scour the seabed, in some cases revealing the bedrock (Stephens and Diesing, 2015). CWC reefs built of species such as D. pertusum (examples of which were recorded in all territories) are thought to favor these locations due to the increased food supply available to filter from the faster bottom currents. In much of our imagery from the tropical transects, the CWC reef was dead resulting in assemblages strongly dominated by reef-associated ophiuroids (cluster t). This link between the distinct ophiuroid-dominated assemblages and high slope areas that were once home to live CWC reefs may somewhat explain the identification of slope as a significant driver of benthic assemblage structure in the South Atlantic. The wide range of FBPI values at Ascension and St. Helena suggest the seabed is relatively “bumpy,” with parts that sit above or below surrounding areas such as gulleys and reefs. These seabed depressions allow for the accumulation of sediments within them, hence the identification of some soft substrate assemblages within the tropical data (e.g., cluster u), providing a link between geomorphology and substrate type. However, the sampling restrictions of the SUCS under-represent steeper areas and cliffs, and thus potentially miss additional biodiversity (Huvenne et al., 2011).
More gently sloping areas can also be found on seamounts, typically around the summit region. These areas are generally subject to slower currents that allow for the build-up of sediment to create soft substrate environments, or allow for the accumulation of cobbles that are not swept away (as frequently observed at Tristan). These rocks increase substrate heterogeneity that has been shown to increase the macrofaunal diversity of an area due to required adaptations (Taylor and Wilson, 2003; Bergmann et al., 2011; Roy et al., 2014), and slower currents may also mean a wider range of filter feeding taxa can survive here without the risk of delicate feeding appendages being damaged by fast flows. This is evidenced by the wide range of small, filter-feeding taxa observed in many communities at Tristan (e.g., cluster h, Tables 3, 4).
Whilst average substrate hardness was not identified as a significant driver in the final DistLM, it was identified as individually significant in the preliminary marginal tests. It is possible that the importance of substrate type in driving assemblage structure within this dataset is represented in the identification of slope (steeper areas lead to more exposed hard substrate and CWC reef communities) and FBPI (depressions become filled with soft substrate) as significant drivers. This would concur with studies such as Serrano et al. (2017) who identified depth and substrate type as a primary driver of soft substrate benthic assemblage distribution, and slope as a key determinants in the distribution of hard substrate assemblages. Our results report the significance of variables that Serrano et al. (2017) used to predict the distribution of both hard and soft substrate assemblages, thus suggesting our results capture the variability in drivers between substrates across the basin.
The majority of previous studies focusing on benthic assemblages on seamounts investigate individual seamounts (McClain and Lundsten, 2015; Victorero et al., 2018; Morgan et al., 2019). Those that have investigated assemblage structure and/or its drivers over multiple seamounts (Howell, 2010; O’Hara et al., 2010; Boschen et al., 2015; Clark and Bowden, 2015) have done so from the same geological feature/ridge system, and therefore often only present data from a single biogeographic region. This study compares a total of 13 seamounts/oceanic islands across 32 degrees of latitude, from different biogeographic regions (Zezina, 1973, 1997; Sutton et al., 2017). Despite this, as previously detailed, the five variables identified as significant drivers of assemblage structure are similar to the results yielded in studies focusing on smaller regions or individual seamounts. This similarity suggests that results obtained in this study are representative of reality and are not an artifact of data structure. Because the five variables identified here as significant are so over the vast latitudinal range of the data, individual site-specific drivers, such as small-scale local hydrographic features, have likely been overlooked because they are not representative of the whole dataset. In this sense, we have been able to identify common variables across the basin, and therefore those that are likely to influence many seamounts (at least in tropical and temperate areas). Whilst this represents a significant progression in the understanding of seamounts in the South Atlantic, it is important to continue to assume a precautionary stance when generalizing these ecosystems.
Biological Communities
The SIMPROF test identified a large number of assemblages present at Tristan (16 out of 22) in comparison to the six clusters containing all transects from Ascension and St. Helena (Figure 5), suggesting that assemblage diversity is higher at Tristan than the other territories. Spatial and seasonal differences in water mass structure, as outlined above, across the Tristan EEZ likely explain why the biological data from Tristan splits into many distinct assemblages; there will be taxa acclimated to the warmer waters around the northern island group, some to the cooler waters around Gough Island and a number of assemblages on the seamounts that can tolerate fluctuations in temperature and salinity throughout the seasons. Although increased productivity due to frontal proximity may explain high numbers of assemblages in temperate latitudes, it is important to note that six sites (i.e., seamounts and oceanic islands) were sampled at Tristan in comparison to the three at St. Helena and four at Ascension. The disparity in the number of different sites sampled per EEZ is likely somewhat responsible for the higher numbers of assemblages observed at Tristan, also possibly confounded by the fact that the Tristan EEZ forms a larger area than the EEZs of the other territories due to the location of the southern island group.
Tristan’s benthic assemblages are characterized largely by filter-feeding taxa such as sponges (both structure-forming and encrusting) and hard-bottom Caryophyllia cup coral species. Contrastingly, tropical benthic assemblages found at Ascension and St. Helena are frequently dominated by scavenging and/or detritivorous taxa including CWC reef-associated Ophiuroidea (brittle stars) and cidarid sea urchins (Table 3). Surface primary productivity is thought to drive diversity patterns in the deep sea (e.g., Sun et al., 2006; Woolley et al., 2016; Bridges et al., in review), but less work has focused on the effect it may have on community structure. Benthic taxa inhabiting the seafloor below oligotrophic, low productivity surface waters such as those in the tropics are likely to have developed strategies to help cope with the sporadic food (energy) supply, and/or are less likely to have feeding strategies that heavily/solely depend on sinking organic matter. Due to the specialist strategies employed by successful species in these low productivity regions, communities may be more likely to display high levels of dominance by fewer, more specialist taxa that are able to thrive. This description is reflective of the patterns and communities observed at Ascension and St. Helena. In contrast, Tristan is surrounded by high-productivity waters and the deep-sea benthic taxa here are likely accustomed to relatively plentiful sinking organic matter upon which suspension and deposit-feeding taxa heavily rely. The greater food supply may, support more ecological niches, leading to communities at Tristan that: (a) are comprised of different taxa to those found in lower productivity areas resulting in separate SIMPROF clusters, and (b) have a higher species richness, with less dominance by few, specialist taxa. This is evidenced by the higher number of characterizing taxa (and thus more even communities) counted in the 16 Tristan assemblages (Table 3), as well as the dominance of filter-feeding taxa (sponges, hydroids, corals etc.). Similar results linking high variability in community structure to surface chlorophyll-α concentration are described by Clark and Bowden (2015) for a seamount chain in the Ross Sea, Antarctica. Although their surface productivity metric is slightly different to the surface primary productivity data used in this study, both relate to the photosynthetic activity, and induced productivity in surface waters above deep-sea benthic assemblages. Given this explanation, it is surprising that POC flux to depth is not considered a significant driver of assemblage structure. We believe this is because of the relatively shallow bathymetric range from which the data are collected for this study (170–1010 m). Both Bridges et al. (in review), using a subset of the data presented here, and Woolley et al. (2016) found that in the upper ocean (down to 1000 and 2000 m, respectively), variables linked to solar energy input were better predictors of diversity than particulate POC flux to depth. The data extracted for each transect for POC flux to depth comes from Lutz et al.’s (2007) model that uses depth as a function. Using satellite-derived, surface primary productivity data for these shallower ranges, represents better productivity data than Lutz et al. (2007) and therefore explains why it is not a selected variable in the DistLM best solution. However, another possible reason may be the mismatch of scale between the biological data, and the resolution at which both surface primary productivity and POC flux to depth are available. Productivity datasets were only available at 9.2 km resolution and therefore would not facilitate intra-site comparisons. This said, they do allow for inter-site and inter-territory comparisons and ultimately represent the best available data.
Vulnerable Marine Ecosystems
Seamounts contain VMEs, and the seamounts of the South Atlantic are no exception, with VMEs being recorded in all three territories. Significantly more, both in terms of abundance and richness, were observed at Tristan, where 53% of transects were considered VMEs. Whilst the epifaunal communities of the CWC reefs in the South Atlantic are likely characterized by different species to those on reefs in the North Atlantic, there does seem to be a strong crossover in the functional similarity and overall ecology of assemblages found in each basin on both D. pertusum and S. variabilis reefs. However, there is less similarity between the coral garden and sea pen field assemblages. Descriptions of each VME type are found below.
Cold-water coral reef
In our study, both D. pertusum and S. variabilis reefs were recorded, but only the former was found in all three territories. D. pertusum is a reef-building scleractinian known to have a ubiquitous distribution and has been recorded in reefs across the South Atlantic, in both the Namibian and Brazilian EEZs (Hanz et al., 2019; Kitahara et al., 2020).
At Tristan, D. pertusum reef is recorded in one transect within cluster k that shows dense, living reef with a few attached, epifaunal taxa present (namely CWC reef-associated ophiuroids and some decapods), and multiple serranid fish (Lepidoperca coatsii). Live reef is thought to support few attached epifauna because the coral itself is successful in preventing biofouling (Freiwald et al., 2004). This transect may therefore correspond to the living summit region of the reef system (Mortensen et al., 1995). When focusing on the mobile epifauna, this assemblages bears similarity with L. pertusa reefs described in Howell et al. (2010) in the North Atlantic that also had decapods and ophiuroids among the key epifaunal taxa. However, due to the limited images of this reef within the transect, more data is required to fully interrogate this comparison.
There is less literature describing assemblages associated with S. variabilis, but its presence is known in the South Atlantic [see Raddatz et al. (2020) for compiled presences]. Cluster q contains deeper S. variabilis reef from Tristan, although much of the structure is dead with very few small patches of live coral. Frequently observed epifaunal framework taxa in our images consist of CWC reef-associated ophiuroids, encrusting sponges, squat lobsters and hydroids. Davies et al. (2014) describe an “ophiuroids and Munida sarsi associated with coral rubble” biotope with which cluster q is similar to in some respects. Parallels can be drawn between the strong presence of ophiuroids and squat lobsters, but their study describes this assemblage as corresponding to the “Lophelia rubble zone” [sensu Mortensen et al. (1995)]. However, if the ophiuroids and squat lobsters simply require dead framework as opposed to live reef, it may not be significant as to whether the reef is intact or in rubble form. Mortensen et al. (1995) and Roberts et al. (2009) describe dead framework as being characterized by sponges, gorgonians and hydroids. This is similar to the epifaunal assemblage observed here, although it is on a different species of reef-building scleractinian coral.
For Ascension and St. Helena, all the D. pertusum reef clusters together in t, where 6 of the 14 transects within the cluster were deemed to be this VME, although again much of the reef framework is dead with only small, infrequent patches of live coral. Coral framework is thought to facilitate higher diversity than areas of the living reef (Jensen and Frederiksen, 1992), often supporting suspension feeders and other coral species (Mortensen et al., 1995). The notion of higher diversity associated with coral framework appears to hold true for the D. pertusum reef in cluster t. Frequently observed epifaunal taxa on the reef framework consist of a bright orange anemone, multiple species of the sponge genus Aphrocallistes, dense mats of ophiuroids, and small patches of live Madrepora oculata, another species of reef-building scleractinian. Reef is interspersed with soft sediment areas providing habitat for the same soft-bottom dwelling taxa (typically Cidaris sp., soft-bottom Caryophyllidae cup corals and often the large anemone, Actinauge richardi) as the wider expanses on soft sediment found within the same cluster; this is likely why D. pertusum reef does not cluster individually. Frequent patches of soft sediment within reef framework are also described in the “predominantly dead low-lying coral framework” biotope from Davies et al. (2014), as are live patches of M. oculata.
Cluster v is comprised of transects found significantly deeper than the above clusters, and is the only assemblage containing S. variabilis reef. Images show a mixture of dead framework and coral rubble, suggesting this transect may represent the transition zone between the dead framework slope and rubble apron (Mortensen et al., 1995). Much of the dead reef and surrounding rubble in cluster v provides habitat for brachiopods, encrusting sponges or small ophiuroids. In areas where the framework is more intact, there are aggregations of brisingids and antipatharians. This description seems to reflect parts of the description of the epifaunal communities on dead framework in Freiwald et al. (2004). The cluster also contains large areas of exposed bedrock that support the same/similar taxa as those found on the framework. The exposed bedrock suggests the presence of reasonable currents in the area which may explain the higher diversity of filter feeding epifauna in cluster v.
Hard-bottom cup coral fields and/or coral gardens
Hard-bottom cup coral fields and coral gardens were only observed within the Tristan EEZ. The substrate in these areas typically consisted of cobbles and boulders, on which the corals were growing. Clusters b, c, h and n were all identified as being mosaic assemblages representing both cup coral fields and coral gardens dominated by gorgonians (often Thouarella spp.), multiple stylasterid taxa and occasionally antipatharians. Despite their protected habitat status, there are few descriptions of the assemblages that often form coral gardens to compare our findings to. Davies et al. (2015) describe multiple types of coral garden in the North Atlantic and identify high numbers of Caryophyllia spp. cup corals and sponges in their coral gardens; both of these are true for Tristan coral gardens also. However, the North Atlantic coral gardens also appear to be dominated by larger corals such as Keratoisis spp. or patches of reef-building scleractinians [this is similar to coral gardens in the Mediterranean that harbor large individuals (Bo et al., 2012)]. Although they were not classed as coral gardens because they were too sparse, Bullimore et al. (2013) do describe coral-dominated assemblages but similarly to Davies et al. (2015), stylasterids are not listed as a typical taxa; at Tristan, lace corals are present in most of the coral garden clusters. The distinct lack of large individuals and the presence of numerous small stylasterids in the coral gardens at Tristan is perhaps driven by the substrate in the coral gardens at Tristan being unfixed, and therefore unable to support larger (heavier) corals. Multiple sponge species are acknowledged as being associated with coral gardens in both the similar coral garden assemblages from Davies et al. (2015), and are considered characterizing taxa of the Tristan coral gardens (Table 3). The disparities in the morphologies of key taxa when comparing Tristan’s coral gardens to those found elsewhere suggest those found at Tristan may not be widespread in the North Atlantic.
Sea pen fields
Only one sea pen field was recorded in the data, located in cluster t (alongside the D. pertusum reef). The fields were comprised of two morphospecies of sea pen and appeared to be located around the edges of the D. pertusum reef in soft sediment alongside cidarid urchins. Unfortunately, there has been no confirmed identification of the sea pens beyond the rank of order (Pennatulacea), although one appears similar to species in the Protoptilum genus. Despite the habitat being suitable for other taxa such as cerinathids and other soft-bottom fauna, the area appears to only support sea pens and urchins. This is unlike the sea pen fields described by Davies et al. (2014) and Howell et al. (2010) that both describe populations of cerinathids within sea pen fields. Sea pens are known to enhance the biodiversity of an area by increasing habitat heterogeneity (Buhl-Mortensen et al., 2010) however, it is not possible to record epifaunal communities on the sea pens from this dataset due to the downward facing angle of the camera. Due to the single occurrence of this VME, and the clustering with other VMEs, it is difficult to distinguish the characterizing taxa of the sea pen field itself, although visual inspection suggests the sea pens themselves dominate and potentially outcompete other taxa.
Management Implications
Some suggested management strategies for a number of deep-sea industries such as fishing and seabed mining propose areas to be set aside and excluded from exploitation activities to facilitate the conservation of biodiversity in a specific region, as well as to provide a baseline against which to interpret data on the environmental impacts of industry activities (e.g., Areas of Particular Environmental Interest designated by the International Seabed Authority). We have found high assemblage diversity at Tristan, and we suggest this may be linked to the high environmental variability as a result of temporal and spatial changes in water mass structure associated with the STCF. When designing management strategies, it is therefore not wise to assume that close geographical proximity infers similarity in the biological assemblages of features. Our results suggest it is important to consider the environmental variability of the region, particularly in terms of the water mass structure and oceanographic conditions. In this respect, a bioregionalization approach [sensu Howell (2010)] could be important in helping to identify areas of high environmental variability, and ultimately to support effective management decisions. However, it is important to note that further investigation should be undertaken of bioregionalization approaches to ensure they adequately capture variability, and that this environmental variability is linked to different assemblages.
The governments of each UKOT island from which our data were collected have all developed marine management plans and offered varying levels of protection within their EEZ. Bottom trawling is a method of fishing for demersal species by towing nets and other mobile gear along the seabed. Evidence suggests that bottom trawling significantly reduces the benthic biomass of seamounts (Koslow et al., 2001), and that benthic megafaunal communities have little resilience against this practice (Clark et al., 2019). All three territories have prohibited non-scientific bottom trawling within their MPAs, a measure that will undoubtedly strengthen the protection of VMEs. This dataset provides important information on the distribution of VMEs within the UKOT of St. Helena, Ascension and Tristan da Cunha, but it is now important to understand the wider distribution of VMEs across the Atlantic. Few biological surveys have been undertaken in ABNJ in the South Atlantic, although seamounts within the Convention Area of the South East Atlantic Fisheries Organisation (SEAFO) were the target of two surveys in 2015 and 2019. Data collected contributed toward the closure of bottom fisheries on a number of features along the Walvis Ridge (CM 30/15, 2015) to protect VMEs (FAO, 2016). The prevailing current in this region flows in an easterly direction as the southern arm of the SAG (Peterson and Stramma, 1991; Smythe-Wright et al., 1998). The protection afforded to seamounts within the Tristan EEZ may therefore have a positive knock-on effect on VMEs on seamount in ABNJ [e.g., by way of increased larval recruitment, Ross et al. (2017)], but this is not substantiated as of yet. Ascension and St. Helena are connected to other ridge systems (MAR and Guinea seamount chain, respectively) and therefore similar effects may be felt should MPAs/fisheries closures be designated in the northern southeast Atlantic. Investment in furthering our understanding on the health and connectivity of VME populations across EEZs and ABNJ in South Atlantic will facilitate incorporation of these principles into broadscale sustainable management, and ultimately make management plans more robust (sensu Friedlander et al., 2021). It will also allow insight into the conservation significance of the existing large MPAs in the South Atlantic and allow for assessment of the ecological coherence of the South Atlantic MPA network as a whole (Foster et al., 2017; Ross et al., 2017).
Conclusion
Our data highlight variability in the megafaunal benthic assemblages of seamounts and oceanic islands across the South Atlantic Ocean basin. Assemblage heterogeneity is true for seamounts that are separated by large distances (i.e., in different biogeographic regions), but in the case of temperate latitudes, features in relatively close proximity also appear to harbor distinct communities, and we suggest this is linked to varying levels of environmental variability. Multiple biological assemblages observed within this dataset constitute VMEs under UNGA 61/105. Some of these, namely CWC reefs, bear similarities with assemblages identified in the North Atlantic, whilst the coral garden VMEs identified within the Tristan EEZ are more distinct. Our results evidence the importance of accounting for environmental variability of the region when designing management plans, as well as highlighting the need for further research into the distribution of VMEs across the South Atlantic, and the effects that current protection measures are having.
Data Availability Statement
The original contributions presented in the study are included in the article/Supplementary Material, further inquiries can be directed to the corresponding author/s.
Author Contributions
AB carried out the image analysis, statistical analysis, participated in conception and design of the study, and drafted the manuscript. KH participated in conception and design of the study and critically reviewed the manuscript. DB and JB designed the at sea survey, participated in data collection, assisted with aspects of the image analysis, and critically reviewed the manuscript. RR assisted with aspects of the image analysis and critically reviewed the manuscript. All authors gave final approval for publication.
Funding
This work was funded by the UK Foreign and Commonwealth Development Office “Blue Belt” program, the British Antarctic Survey National Capability Program, under the UK’s Official Development Assistance provisions (NERC grant NE/R000107/1), the Cefas Seedcorn Program [SCN775], and the University of Plymouth, United Kingdom.
Conflict of Interest
The authors declare that the research was conducted in the absence of any commercial or financial relationships that could be construed as a potential conflict of interest.
Publisher’s Note
All claims expressed in this article are solely those of the authors and do not necessarily represent those of their affiliated organizations, or those of the publisher, the editors and the reviewers. Any product that may be evaluated in this article, or claim that may be made by its manufacturer, is not guaranteed or endorsed by the publisher.
Acknowledgments
We would like to thank the governments of Ascension Island, St. Helena, and Tristan da Cunha for permission to use the data in this study and their general support of the work. We would also like to thank the crew of all research cruises that collected the data.
Supplementary Material
The Supplementary Material for this article can be found online at: https://www.frontiersin.org/articles/10.3389/fmars.2021.660648/full#supplementary-material
Footnotes
References
Anderson, M., Gorley, R. N., and Clarke, R. K. (2008). PERMANOVA+ for PRIMER: Guide to Software and Statistical Methods. Plymouth: PRIMER-E.
Ardron, J. A. (2008). “The challenge of assessing whether the OSPAR network of marine protected areas is ecologically coherent,” in Challenges to Marine Ecosystems, eds J. Davenport, G. Burnell, T. Cross, M. Emmerson, R. McAllen, R. Ramsay, et al. (Dordrecht: Springer), 45–53. doi: 10.1007/978-1-4020-8808-7_4
Assis, J., Tyberghein, L., Bosch, S., Verbruggen, H., Serrão, E. A., and De Clerck, O. (2018). Bio-ORACLE v2.0: extending marine data layers for bioclimatic modelling. Glob. Ecol. Biogeogr. 27, 277–284. doi: 10.1111/geb.12693
Baco-Taylor, A., Ross, R., Althaus, F., Bridges, A., Brix, S., Colaço, A., et al. (2020). “A community consensus on designating vulnerable marine ecosystems from imagery,” in Proceedings of the Ocean Sciences, San Diego, CA.
Baillon, S., Hamel, J. F., Wareham, V. E., and Mercier, A. (2012). Deep cold-water corals as nurseries for fish larvae. Front. Ecol. Environ. 10:351–356. doi: 10.1890/120022
Balbar, A. C., and Metaxas, A. (2019). The current application of ecological connectivity in the design of marine protected areas. Glob. Ecol. Conserv. 17:e00569. doi: 10.1016/j.gecco.2019.e00569
Barnes, D. K. A., and Griffiths, H. J. (2007). Biodiversity and biogeography of southern temperate and polar bryozoans. Glob. Ecol. Biogeogr. 17, 84–99. doi: 10.1111/j.1466-8238.2007.00342.x
Barnes, D. K. A., Convey, P., Dömel, J., Edmonston, J., Enderlein, P., Goodall-Copestake, W., et al. (2013). Cruise Report RRS James Clark Ross JR287. South Atlantic Wilderness; Assessment of Tristan da Cunha’s Seabed Biodiversity. British Antarctic Survey. Available online at: https://www.bodc.ac.uk/data/information_and_inventories/cruise_inventory/report/jr287.pdf (accessed November 5, 2020.).
Barnes, D. K. A., Morley, S. A., Bell, J., Brewin, P., Brigden, K., Collins, M., et al. (2018). Marine plastics threaten giant Atlantic Marine Protected Areas. Curr. Biol. 28, R1137–R1138. doi: 10.1016/j.cub.2018.08.064
Barnes, D. K. A., Sands, C. J., Richardson, A., and Smith, N. (2019). Extremes in benthic ecosystem services; blue carbon natural capital shallower than 1000 m in isolated, small, and young ascension Island’s EEZ. Front. Mar. Sci. 6:663. doi: 10.3389/fmars.2019.00663
Barnes, D., Brown, J., Brickle, P., Downes, K., Enderlein, P., Gowland, E., et al. (2015). Marine Biodiversity of Ascension Island’s Shelf; Scientific Support for a Marine Protected Area. Cambridge: British Antarctic Survey
Bell, J. B., Guijarro-Garcia, E., and Kenny, A. (2019). Demersal fishing in areas beyond national jurisdiction: a comparative analysis of regional fisheries management Organisations. Front. Mar. Sci. 6:596. doi: 10.3389/fmars.2019.00596
Bergmann, M., Langwald, N., Ontrup, J., Soltwedel, T., Schewe, I., Klages, M., et al. (2011). Megafaunal assemblages from two shelf stations west of Svalbard. Mar. Biol. Res. 7, 525–539. doi: 10.1080/17451000.2010.535834
Bett, B. J. (2001). UK Atlantic margin environmental survey: introduction and overview of bathyal benthic ecology. Cont. Shelf Res. 21, 917–956. doi: 10.1016/S0278-4343(00)00119-9
Billett, D. S. M., Bett, B. J., Rice, A. L., Thurston, M. H., Galéron, J., Sibuet, M., et al. (2001). Long-term change in the megabenthos of the Porcupine Abyssal Plain (NE Atlantic). Prog. Oceanogr. 50, 325–348. doi: 10.1016/S0079-6611(01)00060-X
Bo, M., Bertolino, M., Bavestrello, G., Canese, S., Giusti, M., Angiolillo, M., et al. (2012). Role of deep sponge grounds in the Mediterranean Sea: a case study in southern Italy. Hydrobiologia 687, 163–177. doi: 10.1007/s10750-011-0964-1
Boschen, R., Rowden, A., Clark, M., Barton, S., Pallentin, A., and Gardner, J. (2015). Megabenthic assemblage structure on three New Zealand seamounts: implications for seafloor massive sulfide mining. Mar. Ecol. Prog. Ser. 523, 1–14. doi: 10.3354/meps11239
Bridges, A. E. H., Barnes, D. K. A., Bell, J. B., Ross, R. E., and Howell, K. L. (in review). Depth and latitudinal gradients of diversity in seamount benthic communities. J. Biogeogr.
Buhl-Mortensen, L., Vanreusel, A., Gooday, A. J., Levin, L. A., Priede, I. G., Buhl-Mortensen, P., et al. (2010). Biological structures as a source of habitat heterogeneity and biodiversity on the deep ocean margins. Mar. Ecol. 31, 21–50. doi: 10.1111/j.1439-0485.2010.00359.x
Bullimore, R. D., Foster, N. L., and Howell, K. L. (2013). Coral-characterized benthic assemblages of the deep Northeast Atlantic: defining “Coral Gardens” to support future habitat mapping efforts. ICES J. Mar. Sci. 70, 511–522. doi: 10.1093/icesjms/fss195
Caselle, J. E., Hamilton, S. L., Davis, K., Thompson, C. D. H., Turchik, A., Jenkinson, R., et al. (2018). First quantification of subtidal community structure at Tristan da Cunha Islands in the remote South Atlantic: from kelp forests to the deep sea. PLoS One 13:e0195167. doi: 10.1371/journal.pone.0195167
Christie, M. R., Tissot, B. N., Albins, M. A., Beets, J. P., Jia, Y., Ortiz, D. M., et al. (2010). Larval connectivity in an effective network of marine protected areas. PLoS One 5:e15715. doi: 10.1371/journal.pone.0015715
Clark, M. (2009). Deep-sea seamount fisheries: a review of global status and future prospects. Latin Am. J. Aquat. Res. 37, 501–512. doi: 10.3856/vol37-issue3-fulltext-17
Clark, M. R., Althaus, F., Schlacher, T. A., Williams, A., Bowden, D. A., and Rowden, A. A. (2016). The impacts of deep-sea fisheries on benthic communities: a review. ICES J. Mar. Sci. 73(suppl. 1), i51–i69. doi: 10.1093/icesjms/fsv123
Clark, M. R., and Bowden, D. A. (2015). Seamount biodiversity: high variability both within and between seamounts in the Ross Sea region of Antarctica. Hydrobiologia 761, 161–180. doi: 10.1007/s10750-015-2327-9
Clark, M. R., Bowden, D. A., Rowden, A. A., and Stewart, R. (2019). Little evidence of benthic community resilience to bottom trawling on seamounts after 15 years. Front. Mar. Sci. 6:63. doi: 10.3389/fmars.2019.00063
Clark, M. R., Rowden, A. A., Schlacher, T., Williams, A., Consalvey, M., Stocks, K. I., et al. (2010). The ecology of seamounts: structure, function, and human impacts. Annu. Rev. Mar. Sci. 2, 253–278. doi: 10.1146/annurev-marine-120308-081109
Clark, M., Vinnichenko, V., Gordon, J., Beck-Bulat, G., Kukharev, N., and Kakora, A. (2007). “Large-scale distant-water trawl fisheries on seamounts,” in Seamounts: Ecology, Fisheries and Conservation: Fisheries and Aquatic Resources Series, eds T. J. Pitcher, T. Morato, P. J. B. Hart, M. R. Clark, N. Haggan, and R. S. Santos (Oxford: Blackwell), 361–399.
Clarke, K., and Gorley, R. (2006). PRIMER v6: User Manual/Tutorial (Plymouth Routines in Multivariate Ecological Research). Plymouth: PRIMER-E.
CM 30/15 (2015). “Conservation measure on bottom fishing activities and vulnerable marine ecosystems in the SEAFO convention area,” in Conservation Measure on Bottom Fishing Activities and Vulnerable Marine Ecosystems in the SEAFO Convention Area (No. 30/15), (SEAFO). Available online at: https://www.informea.org/en/legislation/conservation-measure-bottom-fishing-activities-and-vulnerable-marine-ecosystems-seafo (accessed November 5, 2020).
Davies, J. S., Howell, K. L., Stewart, H. A., Guinan, J., and Golding, N. (2014). Defining biological assemblages (biotopes) of conservation interest in the submarine canyons of the South West Approaches (offshore United Kingdom) for use in marine habitat mapping. Deep Sea Res. Part II Top. Stud. Oceanogr. 104, 208–229. doi: 10.1016/j.dsr2.2014.02.001
Davies, J. S., Stewart, H. A., Narayanaswamy, B. E., Jacobs, C., Spicer, J., Golding, N., et al. (2015). Benthic assemblages of the Anton Dohrn seamount (NE Atlantic): defining deep-sea biotopes to support habitat mapping and management efforts with a focus on vulnerable marine ecosystems. PLoS One 10:e0124815. doi: 10.1371/journal.pone.0124815
De la Torriente, A., González-Irusta, J. M., Aguilar, R., Fernández-Salas, L. M., Punzón, A., and Serrano, A. (2019). Benthic habitat modelling and mapping as a conservation tool for marine protected areas: a seamount in the western Mediterranean. Aquat. Conserv. Mar. Freshw. Ecosyst. 29, 732–750. doi: 10.1002/aqc.3075
De la Torriente, A., Serrano, A., Fernández-Salas, L. M., García, M., and Aguilar, R. (2018). Identifying epibenthic habitats on the Seco de los Olivos Seamount: species assemblages and environmental characteristics. Deep Sea Res. Part I Oceanogr. Res. Pap. 135, 9–22. doi: 10.1016/J.DSR.2018.03.015
Du Preez, C., Curtis, J. M. R., and Clarke, M. E. (2016). The structure and distribution of benthic communities on a shallow seamount (Cobb Seamount, Northeast Pacific Ocean). PLoS One 11:e0165513. doi: 10.1371/JOURNAL.PONE.0165513
FAO (2009). International Guidelines for the Management of Deep-Sea Fisheries in the High Seas. Rome. Available online at: http://www.fao.org/in-action/globefish/publications/details-publication/en/c/346096/ (accessed November 3, 2020).
FAO (2016). Investigations of vulnerable marine ecosystems (VMEs), fisheries resources and biodiversity in the Convention Area of the South East Atlantic Fisheries Organisation (SEAFO), 15 January–12 February 2015. FAO–NORAD Project No: GCP/INT/003/NOR. Cruise Report. Rome. Available online at: http://www.seafo.org/media/0e1b52cf-d53e-4f58-a995-730cae47ab17/SEAFOweb/pdf/Publications/SEAFO Nansen Cruise Report OCT2016_pdf (accessed November 8, 2020).
Foster, N. L., Rees, S., Langmead, O., Griffiths, C., Oates, J., and Attrill, M. J. (2017). Assessing the ecological coherence of a marine protected area network in the Celtic Seas. Ecosphere 8:e01688. doi: 10.1002/ecs2.1688
Freiwald, A., Fossa, J. H., Grehan, A., Koslow, T., and Roberts, J. M. (2004). Cold-Water Coral Reefs: Out of Sight-No Longer Out of Mind. Cambridge: UNEP-WCMC.
Friedlander, A. M., Goodell, W., Giddens, J., Easton, E. E., and Wagner, D. (2021). Deep-sea biodiversity at the extremes of the Salas y Gómez and Nazca ridges with implications for conservation. PLoS One 16:e0253213. doi: 10.1371/JOURNAL.PONE.0253213
Greene, H. G., Yoklavich, M. M., Starr, R. M., O’Connell, V. M., Wakefield, W. W., Sullivan, D. E., et al. (1999). A classification scheme for deep seafloor habitats. Oceanol. Acta 22, 663–678. doi: 10.1016/S0399-1784(00)88957-4
Hanz, U., Wienberg, C., Hebbeln, D., Duineveld, G., Lavaleye, M., Juva, K., et al. (2019). Environmental factors influencing benthic communities in the oxygen minimum zones on the Angolan and Namibian margins. Biogeosciences 16, 4337–4356. doi: 10.5194/bg-16-4337-2019
Hein, J. R., Koschinsky, A., Bau, M., Manheim, F. T., Kang, J. K., and Roberts, L. (2000). “Cobalt-rich ferromanganese crusts in the Pacific,” in Handbook of Marine Mineral Deposits, ed. D. S. Cronan (Abingdon: Taylor & Francis).
Hernández-León, S., Koppelmann, R., Fraile-Nuez, E., Bode, A., Mompeán, C., Irigoien, X., et al. (2020). Large deep-sea zooplankton biomass mirrors primary production in the global ocean. Nat. Commun. 11:6048. doi: 10.1038/s41467-020-19875-7
Hosegood, P. J., Nimmo-Smith, W. A. M., Proud, R., Adams, K., and Brierley, A. S. (2019). Internal lee waves and baroclinic bores over a tropical seamount shark “hot-spot”. Prog. Oceanogr. 172, 34–50. doi: 10.1016/j.pocean.2019.01.010
Howell, K. L. (2010). A benthic classification system to aid in the implementation of marine protected area networks in the deep/high seas of the NE Atlantic. Biol. Conserv. 143, 1041–1056. doi: 10.1016/j.biocon.2010.02.001
Howell, K. L., Billett, D. S. M., and Tyler, P. A. (2002). Depth-related distribution and abundance of seastars (Echinodermata: Asteroidea) in the Porcupine Seabight and Porcupine Abyssal Plain, N.E. Atlantic. Deep Sea Res. Part I Oceanogr. Res. Pap. 49, 1901–1920. doi: 10.1016/S0967-0637(02)00090-0
Howell, K. L., Davies, J. S., and Narayanaswamy, B. E. (2010). Identifying deep-sea megafaunal epibenthic assemblages for use in habitat mapping and marine protected area network design. J. Mar. Biol. Assoc. U.K 90, 33–68. doi: 10.1017/S0025315409991299
Howell, K. L., Davies, J. S., and van den Beld, I. (2017). Deep-Sea Species Image Catalogue. University of Plymouth, Ifremer, NOAA. Available online at: http://www.deepseacatalogue.fr/ On-line version 3, 2017
Huvenne, V. A. I., Tyler, P. A., Masson, D. G., Fisher, E. H., Hauton, C., Hühnerbach, V., et al. (2011). A picture on the wall: innovative mapping reveals cold-water coral refuge in submarine canyon. PLoS One 6:e28755. doi: 10.1371/journal.pone.0028755
ICES (2016). Report of the Workshop on Vulnerable Marine Ecosystem Database (WKVME). Peterborough: ICES.
Jensen, A., and Frederiksen, R. (1992). The fauna associated with the bank-forming deepwater coral lophelia pertusa (scleractinaria) on the faroe shelf. Sarsia 77, 53–69. doi: 10.1080/00364827.1992.10413492
Kim, S. S., and Wessel, P. (2011). New global seamount census from altimetry-derived gravity data. Geophys. J. Int. 186, 615–631. doi: 10.1111/j.1365-246X.2011.05076.x
Kitahara, M. V., Cordeiro, R. T. S., Barbosa, R. V., Pires, D., de, O., and Sumida, P. Y. G. (2020). “Brazilian Deep-Sea Corals,” in Brazilian Deep-Sea Biodiversity, 1st Edn, eds P. Y. G. Sumida, A. F. Bernardino, and F. C. De Léo (Cham: Springer), 73–107. doi: 10.1007/978-3-030-53222-2_4
Koslow, J. (1993). Community structure in North Atlantic deep-sea fishes. Prog. Oceanogr. 31, 321–338. doi: 10.1016/0079-6611(93)90005-X
Koslow, J., Gowlett-Holmes, K., Lowry, J., O’Hara, T., Poore, G., and Williams, A. (2001). Seamount benthic macrofauna off southern Tasmania: community structure and impacts of trawling. Mar. Ecol. Prog. Ser. 213, 111–125. doi: 10.3354/meps213111
Langenkämper, D., Zurowietz, M., Schoening, T., and Nattkemper, T. W. (2017). BIIGLE 2.0 – browsing and annotating large marine image collections. Front. Mar. Sci. 4:83. doi: 10.3389/fmars.2017.00083
Leal, J. H., and Bouchet, P. (1991). Distribution patterns and dispersal of Prosobranch gastropods along a seamount chain in the Atlantic Ocean. J. Mar. Biol. Assoc. 71, 11–25.
Leduc, D., Rowden, A. A., Nodder, S. D., Berkenbusch, K., Probert, P. K., and Hadfield, M. G. (2014). Unusually high food availability in Kaikoura Canyon linked to distinct deep-sea nematode community. Deep Sea Res. Part II Top. Stud. Oceanogr. 104, 310–318. doi: 10.1016/j.dsr2.2013.06.003
Levin, L. A., and Thomas, C. L. (1989). The influence of hydrodynamic regime on infaunal assemblages inhabiting carbonate sediments on central Pacific seamounts. Deep Sea Res. Part A Oceanogr. Res. Pap. 36, 1897–1915. doi: 10.1016/0198-0149(89)90117-9
Levin, L. A., Etter, R. J., Rex, M. A., Gooday, A. J., Smith, C. R., Pineda, J., et al. (2001). Environmental influences on regional deep-sea species diversity. Annu. Rev. Ecol. Syst. 32, 51–93. doi: 10.1146/annurev.ecolsys.32.081501.114002
Long, D. J., and Baco, A. R. (2014). Rapid change with depth in megabenthic structure-forming communities of the Makapu’u deep-sea coral bed. Deep Sea Res. Part II Top. Stud. Oceanogr. 99, 158–168. doi: 10.1016/j.dsr2.2013.05.032
Lundsten, L., Barry, J., Cailliet, G., Clague, D., DeVogelaere, A., and Geller, J. (2009). Benthic invertebrate communities on three seamounts off southern and central California, USA. Mar. Ecol. Prog. Ser. 374, 23–32. doi: 10.3354/meps07745
Lutz, M. J., Caldeira, K., Dunbar, R. B., and Behrenfeld, M. J. (2007). Seasonal rhythms of net primary production and particulate organic carbon flux to depth describe the efficiency of biological pump in the global ocean. J. Geophys. Res. Oceans 112:C10011. doi: 10.1029/2006JC003706
McClain, C. R., and Lundsten, L. (2015). Assemblage structure is related to slope and depth on a deep offshore Pacific seamount chain. Mar. Ecol. 36, 210–220. doi: 10.1111/maec.12136
McClain, C. R., Lundsten, L., Barry, J., and DeVogelaere, A. (2010). Assemblage structure, but not diversity or density, change with depth on a northeast Pacific seamount. Mar. Ecol. 31, 14–25. doi: 10.1111/j.1439-0485.2010.00367.x
McClain, C. R., Lundsten, L., Ream, M., Barry, J., and DeVogelaere, A. (2009). Endemicity, biogeography, composition, and community structure on a northeast pacific seamount. PLoS One 4:e4141. doi: 10.1371/journal.pone.0004141
Meirelles, P. M., Amado-Filho, G. M., Pereira-Filho, G. H., Pinheiro, H. T., de Moura, R. L., Joyeux, J., et al. (2015). Baseline assessment of mesophotic reefs of the vitória-trindade seamount chain based on water quality, microbial diversity, benthic cover and fish biomass data. PLoS One 10:e0130084. doi: 10.1371/journal.pone.0130084
Morgan, N. B., Goode, S., Roark, E. B., and Baco, A. R. (2019). Fine scale assemblage structure of benthic invertebrate Megafauna on the north pacific seamount Mokumanamana. Front. Mar. Sci. 6:715. doi: 10.3389/fmars.2019.00715
Morley, S., Collins, M. A., Barnes, D. K. A., Sands, C., Bell, J. B., Walmsley, S., et al. (2018). Helping Tristan da Cunha and St Helena Manage their Marine Environments: JR17-004 Cruise Report. Cambridge: British Antarctic Survey.
Mortensen, P. B., Hovland, M., Brattegard, T., and Farestveit, R. (1995). Deep water bioherms of the scleractinian coral Lophelia pertusa (L.) at 64° n on the Norwegian shelf: structure and associated megafauna. Sarsia North Atlantic Mar. Sci. 80, 145–158. doi: 10.1080/00364827.1995.10413586
O’Hara, T. D., and Tittensor, D. P. (2010). Environmental drivers of ophiuroid species richness on seamounts. Mar. Ecol. 31, 26–38. doi: 10.1111/j.1439-0485.2010.00373.x
O’Hara, T. D., Consalvey, M., Lavrado, H. P., and Stocks, K. I. (2010). Environmental predictors and turnover of biota along a seamount chain. Mar. Ecol. 31, 84–94. doi: 10.1111/j.1439-0485.2010.00379.x
Pereira-Filho, G. H., Amado-Filho, G. M., de Moura, R. L., Bastos, A. C., Guimarães, S. M. P. B., Salgado, L. T., et al. (2012). Extensive Rhodolith beds cover the summits of southwestern Atlantic ocean seamounts. J. Coast. Res. 279, 261–269. doi: 10.2112/11T-00007.1
Peterson, R. G., and Stramma, L. (1991). Upper-level circulation in the South Atlantic Ocean. Prog. Oceanogr. 26, 1–73. doi: 10.1016/0079-6611(91)90006-8
Priede, I. G., Bergstad, O. A., Miller, P. I, Vecchione, M., Gebruk, A., Falkenhaug, T., et al. (2013). Does presence of a mid-ocean ridge enhance biomass and biodiversity?. PLoS One 8:e61550. doi: 10.1371/journal.pone.0061550
Raddatz, J., Titschack, J., Frank, N., Freiwald, A., Conforti, A., Osborne, A., et al. (2020). Solenosmilia variabilis-bearing cold-water coral mounds off Brazil. Coral Reefs 39, 69–83. doi: 10.1007/s00338-019-01882-w
Requena, S., Oppel, S., Bond, A. L., Hall, J., Cleeland, J., Crawford, R. J. M., et al. (2020). Marine hotspots of activity inform protection of a threatened community of pelagic species in a large oceanic jurisdiction. Anim. Conserv. 23, 585–596. doi: 10.1111/acv.12572
Rex, M. A. (1981). Community structure in the deep-sea benthos. Annu. Rev. Ecol. Syst. 12, 331–353. doi: 10.1146/annurev.es.12.110181.001555
Rex, M. A., Etter, R. J., and Stuart, C. T. (1997). “Large-scale patterns of species diversity in the deep-sea benthos,” in Marine Biodiversity, eds R. F. G. Ormond, J. D. Gage, and M. V. Angel (Cambridge: Cambridge University Press), 94–121. doi: 10.1017/cbo9780511752360.006
Rice, J., and Houston, K. (2011). Representativity and networks of marine protected areas. Aquat. Conserv. Mar. Freshw. Ecosyst. 21, 649–657. doi: 10.1002/aqc.1232
Roberts, C. M. (2002). Deep impact: the rising toll of fishing in the deep sea. Trends Ecol. Evol. 17, 242–245. doi: 10.1016/S0169-5347(02)02492-8
Roberts, J. M., Wheeler, A., Freiwald, A., and Cairns, S. (2009). Cold-Water Corals: The Biology and Geology of Deep-Sea Coral Habitats. New York, NY: Cambridge University Press.
Rogers, A. D. (1994). “The biology of seamounts,” in Advances in Marine Biology, eds J. Blaxter and B. Douglas (Cambridge: Academic Press), 305–350. doi: 10.1016/S0065-2881(08)60065-6
Rogers, A. D. (2018). “The biology of seamounts: 25 years on,” in Advances in Marine Biology, 79th Edn, ed. C. Sheppard (Cambridge, MA: Academic Press).
Rogers, A., Baco, A., Griffiths, H., Hart, T., and Hall-Spencer, J. (2007). “Corals on seamounts,” in Seamounts: Ecology, Fisheries & Conservation, eds T. J. Pitcher, T. Morato, P. J. B. Hart, M. R. Clark, N. Haggan, and R. S. Santos (Oxford: Blackwell Publishing Ltd), 1–527. doi: 10.1002/9780470691953
Ross, R. E., Nimmo-Smith, W. A. M., and Howell, K. L. (2017). Towards “ecological coherence”: assessing larval dispersal within a network of existing Marine Protected Areas. Deep Sea Res. Part I Oceanogr. Res. Pap. 126, 128–138. doi: 10.1016/J.DSR.2017.06.004
Rowden, A. A., Pearman, T. R. R., Bowden, D. A., Anderson, O. F., and Clark, M. R. (2020). Determining coral density thresholds for identifying structurally complex vulnerable marine ecosystems in the deep sea. Front. Mar. Sci. 7:95. doi: 10.3389/FMARS.2020.00095
Rowe, G. T., and Menzies, R. J. (1969). Zonation of large benthic invertebrates in the deep-sea off the Carolinas. Deep Sea Res. Oceanogr. Abstr. 16, 531–537. doi: 10.1016/0011-7471(69)90041-2
Roy, V., Iken, K., and Archambault, P. (2014). Environmental drivers of the canadian arctic megabenthic communities. PLoS One 9:e100900. doi: 10.1371/journal.pone.0100900
Ruhl, H. A., and Smith, K. L. (2004). Shifts in deep-sea community structure linked to climate and food supply. Science 305, 513–515. doi: 10.1126/science.1099759
Samadi, S., Bottan, L., Macpherson, E., De Forges, B. R., and Boisselier, M. C. (2006). Seamount endemism questioned by the geographic distribution and population genetic structure of marine invertebrates. Mar. Biol. 149, 1463–1475. doi: 10.1007/s00227-006-0306-4
Samadi, S., Thomas, S., and De Forges, B. R. (2007). “Seamount benthos,” in Seamounts: Ecology, Fisheries & Conservation, eds T. J. Pitcher, T. Morato, P. J. B. Hart, M. R. Clark, N. Haggan, and R. S. Santos (Oxford: Blackwell Publishing).
Santos, M. E. A., Faria-Junior, E., Aued, A. W., Peluso, L., Kitahara, M. V., Pires, D. O., et al. (2020). Benthic Cnidaria community in the oceanic archipelago of Trindade and Martin Vaz, Southwestern Atlantic Ocean. Reg. Stud. Mar. Sci. 33:100895. doi: 10.1016/j.rsma.2019.100895
Schneider, C. A., Rasband, W. S., and Eliceiri, K. W. (2012). NIH Image to ImageJ: 25 years of image analysis. Nat. Methods 9, 671–675. doi: 10.1038/nmeth.2089
Serrano, A., González-Irusta, J. M., Punzón, A., García-Alegre, A., Lourido, A., Ríos, P., et al. (2017). Deep-sea benthic habitats modeling and mapping in a NE Atlantic seamount (Galicia Bank). Deep Sea Res. Part I Oceanogr. Res. Pap. 126, 115–127. doi: 10.1016/j.dsr.2017.06.003
Smith, C. R., De Leo, F. C., Bernardino, A. F., Sweetman, A. K., and Arbizu, P. M. (2008). Abyssal food limitation, ecosystem structure and climate change. Trends Ecol. Evol. 23, 518–528. doi: 10.1016/j.tree.2008.05.002
Smythe-Wright, D., Chapman, P., Duncombe Rae, C., Shannon, L. V., and Boswell, S. M. (1998). Characteristics of the South Atlantic subtropical frontal zone between 15°W and 5°E. Deep Sea Res. Part I Oceanogr. Res. Pap. 45, 167–192. doi: 10.1016/S0967-0637(97)00068-X
Stephens, D., and Diesing, M. (2015). Towards quantitative spatial models of seabed sediment composition. PLoS One 10:e0142502. doi: 10.1371/journal.pone.0142502
Stuart, C. T., and Rex, M. A. (2009). Bathymetric patterns of deep-sea gastropod species diversity in 10 basins of the Atlantic Ocean and Norwegian Sea. Mar. Ecol. 30, 164–180. doi: 10.1111/j.1439-0485.2008.00269.x
Sun, X., Corliss, B. H., Brown, C. W., and Showers, W. J. (2006). The effect of primary productivity and seasonality on the distribution of deep-sea benthic foraminifera in the North Atlantic. Deep Sea Res. Part I Oceanogr. Res. Pap. 53, 28–47. doi: 10.1016/j.dsr.2005.07.003
Sundblad, G., Bergström, U., and Sandström, A. (2011). Ecological coherence of marine protected area networks: a spatial assessment using species distribution models. J. Appl. Ecol. 48, 112–120. doi: 10.1111/j.1365-2664.2010.01892.x
Sutton, T. T., Clark, M. R., Dunn, D. C., Halpin, P. N., Rogers, A. D., Guinotte, J., et al. (2017). A global biogeographic classification of the mesopelagic zone. Deep Sea Res. Part I Oceanogr. Res. Pap. 126, 85–102. doi: 10.1016/j.dsr.2017.05.006
Taylor, P. D., and Wilson, M. A. (2003). Palaeoecology and evolution of marine hard substrate communities. Earth Sci. Rev. 62, 1–103. doi: 10.1016/S0012-8252(02)00131-9
Tyler, P. A., and Zibrowius, H. (1992). Submersible observations of the invertebrate fauna on the continental-slope southwest of Ireland (NE Atlantic Ocean). Oceanol. Acta 15, 211–226.
Victorero, L., Robert, K., Robinson, L. F., Taylor, M. L., and Huvenne, V. A. I. (2018). Species replacement dominates megabenthos beta diversity in a remote seamount setting. Sci. Rep. 8:4152. doi: 10.1038/s41598-018-22296-8
Walbridge, S., Slocum, N., Pobuda, M., and Wright, D. J. (2018). Unified geomorphological analysis workflows with benthic terrain modeler. Geosciences 8:94. doi: 10.3390/geosciences8030094
Watson, R., Kitchingman, A., and Cheung, W. (2007). “Catches from world seamount fisheries,” in Seamounts: Ecology, Fisheries & Conservation, eds T. J. Pitcher, T. Morato, P. J. B. Hart, M. R. Clark, N. Haggan, and R. S. Santos (Oxford: Blackwell Publishing Ltd).
Wentworth, C. K. (1922). A scale of grade and class terms for clastic sediments. J. Geol. 30, 377–392.
Whomersley, P., Morley, S., Bell, J., Collins, M., Pettafor, A., Campanella, F., et al. (2019). RRS Discovery 100 survey report: Marine Biodiversity of Tristan da Cunha and St Helena. Lowestoft: Centre for Environment, Fisheries and Aquaculture Science.
Woolley, S. N. C., Tittensor, D. P., Dunstan, P. K., Guillera-Arroita, G., Lahoz-Monfort, J. J., Wintle, B. A., et al. (2016). Deep-sea diversity patterns are shaped by energy availability. Nature 533, 393–396. doi: 10.1038/nature17937
Yesson, C., Clark, M. R., Taylor, M. L., and Rogers, A. D. (2011). The global distribution of seamounts based on 30 arc seconds bathymetry data. Deep Sea Res. Part I Oceanogr. Res. Pap. 58, 442–453. doi: 10.1016/j.dsr.2011.02.004
Zezina, O. N. (1973). Biogeographical division of the benthic area of ocean by brachiopods. Proc. All Union Res. Inst. Mar. Fish. Oceanogr. 84, 166–180.
Keywords: deep sea, benthic ecology, assemblage composition, oceanic island, vulnerable marine ecosystem (VME)
Citation: Bridges AEH, Barnes DKA, Bell JB, Ross RE and Howell KL (2021) Benthic Assemblage Composition of South Atlantic Seamounts. Front. Mar. Sci. 8:660648. doi: 10.3389/fmars.2021.660648
Received: 29 January 2021; Accepted: 27 September 2021;
Published: 22 October 2021.
Edited by:
Caren Barceló, Office of Science and Technology, NOAA Fisheries, United StatesReviewed by:
Ana De La Torriente, Spanish Institute of Oceanography (IEO), SpainChristopher Thompson, University of Western Australia, Australia
Copyright © 2021 Bridges, Barnes, Bell, Ross and Howell. This is an open-access article distributed under the terms of the Creative Commons Attribution License (CC BY). The use, distribution or reproduction in other forums is permitted, provided the original author(s) and the copyright owner(s) are credited and that the original publication in this journal is cited, in accordance with accepted academic practice. No use, distribution or reproduction is permitted which does not comply with these terms.
*Correspondence: Amelia E. H. Bridges, YW1lbGlhLmJyaWRnZXNAcGx5bW91dGguYWMudWs=