 Yang Liu
 Xinmei Xia
 Yongjun Tian
 Irene D. Alabia
 Shuyang Ma
 Peng Sun
 Sei-Ichi Saitoh
- 1Laboratory of Fisheries Oceanography, Fishery College, Ocean University of China, Qingdao, China
- 2The Key Laboratory of Mariculture, Ministry of Education, Ocean University of China, Qingdao, China
- 3Frontiers Science Center for Deep Ocean Multispheres and Earth System, Ocean University of China, Qingdao, China
- 4Arctic Research Center, Hokkaido University, Sapporo, Japan
Japanese flying squid (Todarodes pacificus) is one of the most commercially important resources in the Pacific Ocean and its abundance is largely affected by environmental conditions. We examined the influence of environmental factors in potential spawning grounds of the winter cohort, approximated from Japanese and South Korean catch and catch per unit effort (CPUE) data of Japanese flying squid. Annual spawning ground dynamics were constructed using sea surface temperature (SST), submarine elevation and mean Kuroshio axis data from 1979 to 2018. Based on these information, we generated a suite of spawning ground indices including suitability SST-weighted area of potential spawning ground (SSWA), mean values (January–April) of suitable SST (MVSS), and the meridional position (MP) of SST isolines (18–24°C). Comparable interannual-decadal variability patterns were detected between the squid abundance and spawning ground indices, with abrupt shifts around 1990/1991 and in recent decades. In particular, the Pacific Decadal Oscillation is negatively correlated with spawning ground indices, suggesting its role in regulating the environmental dynamics in the area. Further, the gradient forest model underpinned the importance of SSWA, SSWA_Lag1 and MVSS_Lag1 on squid abundance. The CPUE is also shown to be a better abundance index than the annual catch in modeling the species’ response to environmental variability in its spawning grounds. Our findings suggest that it is imperative to pay more and timely attention to the relationship between the abundance of Japanese flying squid and environmental changes, especially under adverse environmental conditions.
Introduction
Japanese flying squid (Todarodes pacificus) is distributed in the northwest Pacific between 20°N and 60°N, particularly in the Japan Sea, the Pacific Coast of Japan, and the East China Sea (Yu et al., 2018). Based on the different peaks of spawning season, the Japanese flying squid can be divided into three groups: summer, autumn, and winter spawners, and fishing vessel mainly catch the latter two spawners (Murata, 1990; Sakurai et al., 2000). The abundance of the winter cohort was about 1.4 times higher than that of the autumn cohort in the past 10 years.1 The winter cohort is regarded as the most important group due to its large biomass (Kawabata et al., 2006), thus, here we focused on its abundance distributions. From January to April, the winter cohort spawns mainly in the East China Sea from Kyushu to Taiwan (Murata, 1989; Sakurai et al., 2000) and migrates to its northern feeding grounds around the waters of Japan (Sakurai et al., 2013).
Because of its high economic value, fishing vessels from various countries (e.g., China, Japan, and South Korea) catch Japanese flying squid (Sakurai et al., 2013). In particular, Japan and South Korea have recorded average catch weight-per-fishing boat-per-day (CPUE; tons per net) and catch data throughout the fishing season. The main fishing period for the winter cohort is between October and January (Rosa et al., 2011). The annual catch has increased from 300,000 to 400,000 tons in the 1990s while the total catch throughout the entire area has declined significantly from 234,000 to 45,000 tons after 2013 (Figure 1). In particular, the Japanese catch dropped to 22,829 tons in 2018, which is the lowest catch since 1979 (Figure 1). The recent large decline in the squid catch have raised concerns for Scientists and fishermen, yet factors driving this decline remained insufficiently understood. To better predict the abundance of Japanese flying squid and thereby effectively develop sustainable fishery, the reasons underlying the fluctuations in winter cohort abundance need to be more clearly elucidated.
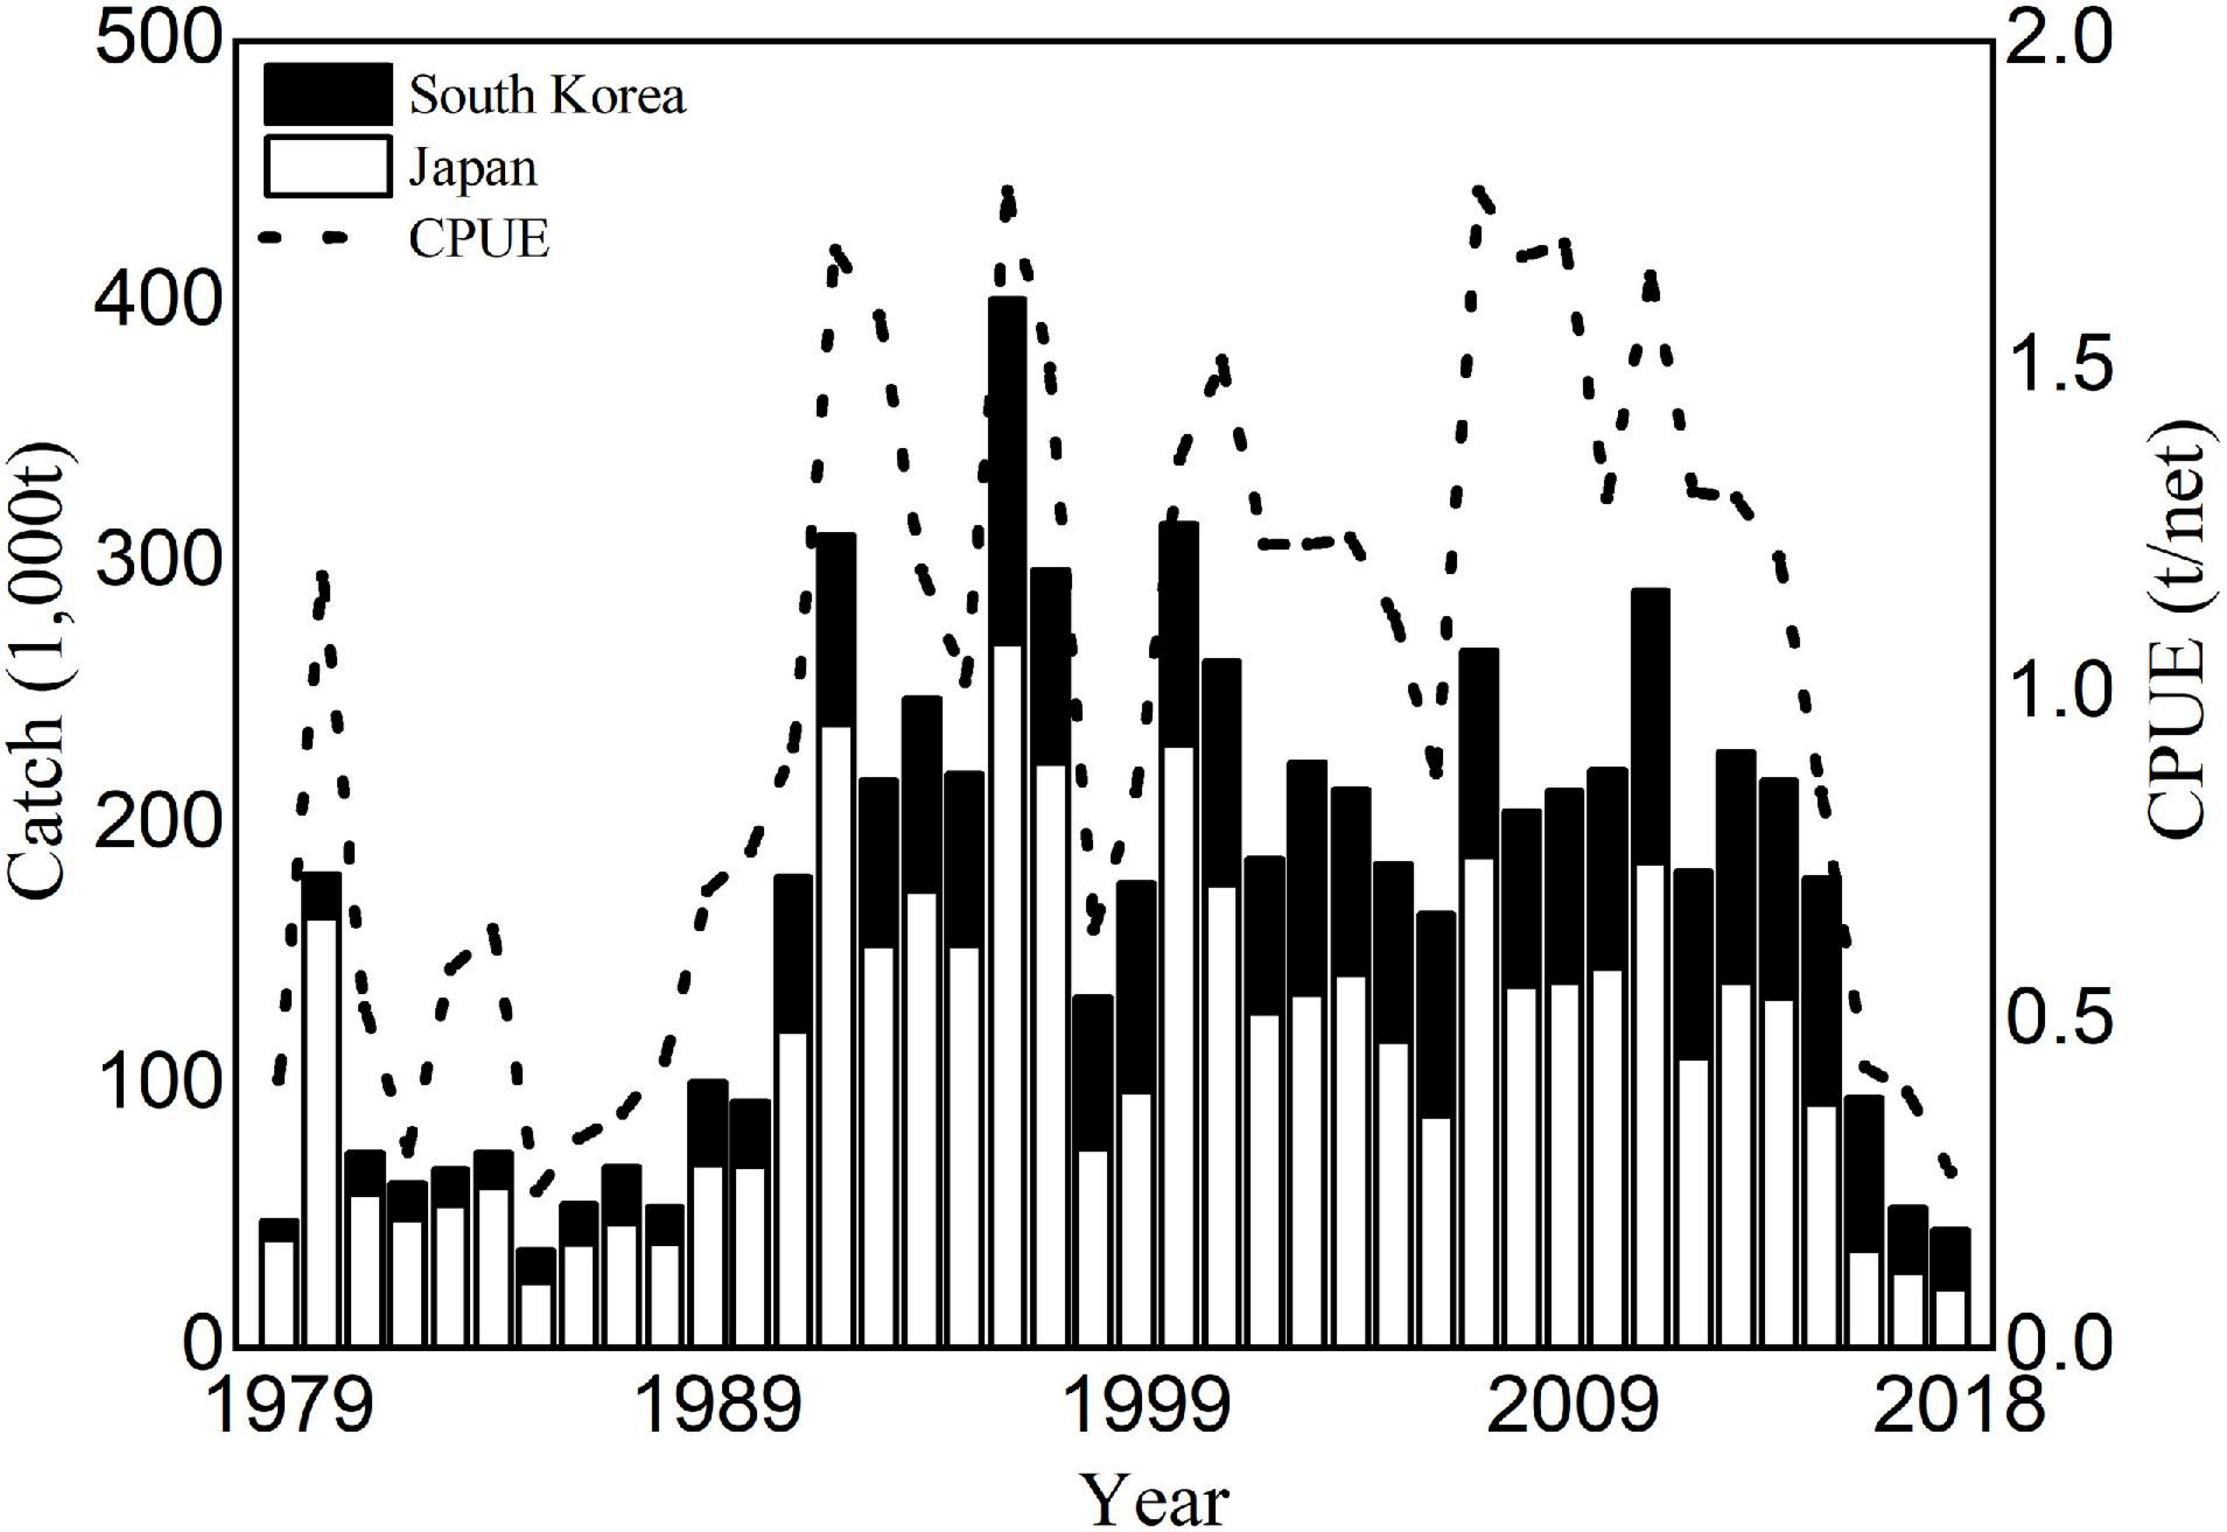
Figure 1. Annual catch and CPUE of the Japanese flying squid winter cohort for each country from 1979 to 2018 (http://abchan.fra.go.jp).
To date, there are increasing studies on Japanese flying squid’s life history (Bower and Sakurai, 1996; Sakurai et al., 1996; Kidokoro and Sakurai, 2008; Yamamoto et al., 2012; Takahara et al., 2017; Puneeta et al., 2018), spatial distributions (Bower et al., 1999; Sakurai et al., 2000; Kawabata et al., 2006; Rosa et al., 2011; Alabia et al., 2016; Zhang et al., 2017), and abundance (Murata, 1989; Sakurai et al., 2002; Rosa et al., 2011; Yu et al., 2018). Japanese flying squid is not only a predator on zooplankton and small fish, but also a vital prey for marine mammals and large fish. As an intermediate-trophic-level component of food webs in the northwest Pacific, Japanese flying squid plays a crucial role in the ecosystem (Sakurai et al., 2013). Therefore, it is essential for the maintenance of overall ecosystem homeostasis to study the potential reasons behind the fluctuations in winter cohort abundance. As a short-lived species, the variation in its abundance depends largely on recruitment (Sakurai et al., 2000). Studies on spawning dynamics have suggested that the recruitment success is determined by environmental conditions at the spawning ground (Sakurai et al., 2000, 2002; Rosa et al., 2011; Liu et al., 2019). For instance, temperature affects many biological aspects of the Japanese flying squid, such as spawning process (Sakurai et al., 2000; Sakurai, 2006), lifespan (Takahara et al., 2017), and gonadal development (Kidokoro and Sakurai, 2008). The suitable spawning temperature range is between 18 and 24°C, promoting higher hatchlings survival rates and swimming activities (Sakurai, 2006). Spawning occurs above the continental shelf and slope (Sakurai et al., 2000, 2002; Rosa et al., 2011) where bottom trawls surveys often collected exhausted and weakened females that have spawned at depths within 100–500 m (Hamabe, 1966). Previous studies (Bower et al., 1999) have demonstrated that largest paralarval catches were situated near the Kuroshio front and higher hatching rates were observed west of the Kuroshio axis. The mean Kuroshio axis also limits the spawning area and is used to analyze the zones where spawning is most likely to occur (Rosa et al., 2011). Thus, it is assumed as a geographic boundary of the squid spawning grounds in this study.
Large-scale climate variability in the Pacific Ocean significantly affects pelagic fish stocks by controlling the oceanographic environmental conditions (Tian et al., 2004, 2012, 2014; Lehodey et al., 2006; Overland et al., 2010; Ma et al., 2019). Earlier studies have also emphasized the impact of climate change on stock fluctuations, especially for annual changes of winter-spawning areas related to regime shifts (Sakurai et al., 2002; Rosa et al., 2011). Likewise, it has been demonstrated that spawning ground indices could explain variations in marine fish abundance and assess the environmental suitability of spawning grounds (Cui et al., 2019; Liu et al., 2019). These are often based on sea surface temperature (SST; Bower and Sakurai, 1996; Sakurai et al., 1996, 2000; Sakurai, 2006; Kidokoro and Sakurai, 2008; Yamamoto et al., 2012; Ji et al., 2020), suitable spawning area (Sakurai et al., 2002; Rosa et al., 2011; Yu et al., 2018), and chlorophyll a concentration (Yu et al., 2018).
In this study, we developed annual dynamic potential spawning ground indicators to better clarify the potential drivers of the fluctuation in squid abundance. Specifically, our aims are: (1) to improve spawning ground indices across the squid spawning zones; (2) to examine the relationships between indices and winter cohort abundance; and (3) to discuss possible linkages between spawning ground dynamics and abundance fluctuations of winter cohort.
Materials and Methods
Fishery Data
Fishery information, such as annual catch and catch per unit effort (CPUE) for Japanese flying squid winter cohort from 1979 to 2018, were obtained from the Japanese Fisheries Agency.2 CPUE is often positively related to the availability of fisheries and regarded as an indicator of fish abundance (Sakurai et al., 2000; Yu et al., 2018; Liu et al., 2019). Therefore, we used the catch and CPUE data to represent the abundance of Japanese flying squid in this study. As China and Russia have respective reported annual catches only from 2012 to 2017 and 2012 to 2018, with Japanese and South Korean catches accounting for more than 93% of the total catches (Kaga et al., 2019), we limit our analyses using Japanese catch, South Korean catch and a combination of Japanese and South Korean CPUE data to represent the winter cohort abundance of the Japanese flying squid.
Environmental Data
Previous studies have shown that the most suitable spawning SST of Japanese flying squid is from 18 to 24°C, promoting higher hatchlings survival rates and swimming activities (Sakurai, 2006; Sakurai et al., 2013). The reproductive hypothesis suggests that spawning usually occurs on the continental shelf and continental slope at depths within 100-500 m (Sakurai et al., 2000; Sakurai, 2006). Therefore, we used SST, submarine elevation data, and position of the mean Kuroshio axis within the potential squid spawning ground (21°–40°N and 121°–142°E). Monthly SST data were derived from the Cosmic Background Explorer (COBE)3 (1979--2002) and Moderate-resolution imaging Spectroradiometer (MODIS)4 (2003–2018) at spatial resolutions of 1° × 1° (latitude × longitude) and 4 km, respectively. For consistent spatial resolution, we resampled MODIS-SST data into a 1° × 1° resolution (latitude × longitude).
Submarine elevation data were derived from the ETOPO1 Global Relief Model5 and were also resampled to the same spatial resolution. The specific position of the mean Kuroshio axis was sourced from previous studies (Yamashiro, 1993; Liu and Gan, 2012).
Climate Index
Pacific Decadal Oscillation (PDO) index is a long-term mode of climate variability in the Pacific (Miller et al., 2004). Monthly PDO data were derived from the National Centers for Environmental Information.6 As the most prominent climate variability signal in the northwestern Pacific Ocean occurs between December and February (Overland et al., 2008), we only used the winter-averaged PDO index.
Construction of Dynamic Potential Spawning Ground
The annual dynamic potential spawning ground of the Japanese flying squid in the northwest Pacific from 1979 to 2018 was defined by using three parameters: suitable SST range, submarine elevation and mean Kuroshio axis. The suitable SST was set from 18 to 24°C (Sakurai, 2006), the submarine elevation range for spawning was set from 100 to 500 m, and the average position of the Kuroshio axis with offset from the mean and seasonal variability from 100 to 500 m depth was used (Yamashiro, 1993; Liu and Gan, 2012, Yu et al., 2019; Figure 2). Briefly, the dynamic potential spawning ground index was calculated using 18–24°C SST range, 100–500 m elevation range, and mean Kuroshio axis.
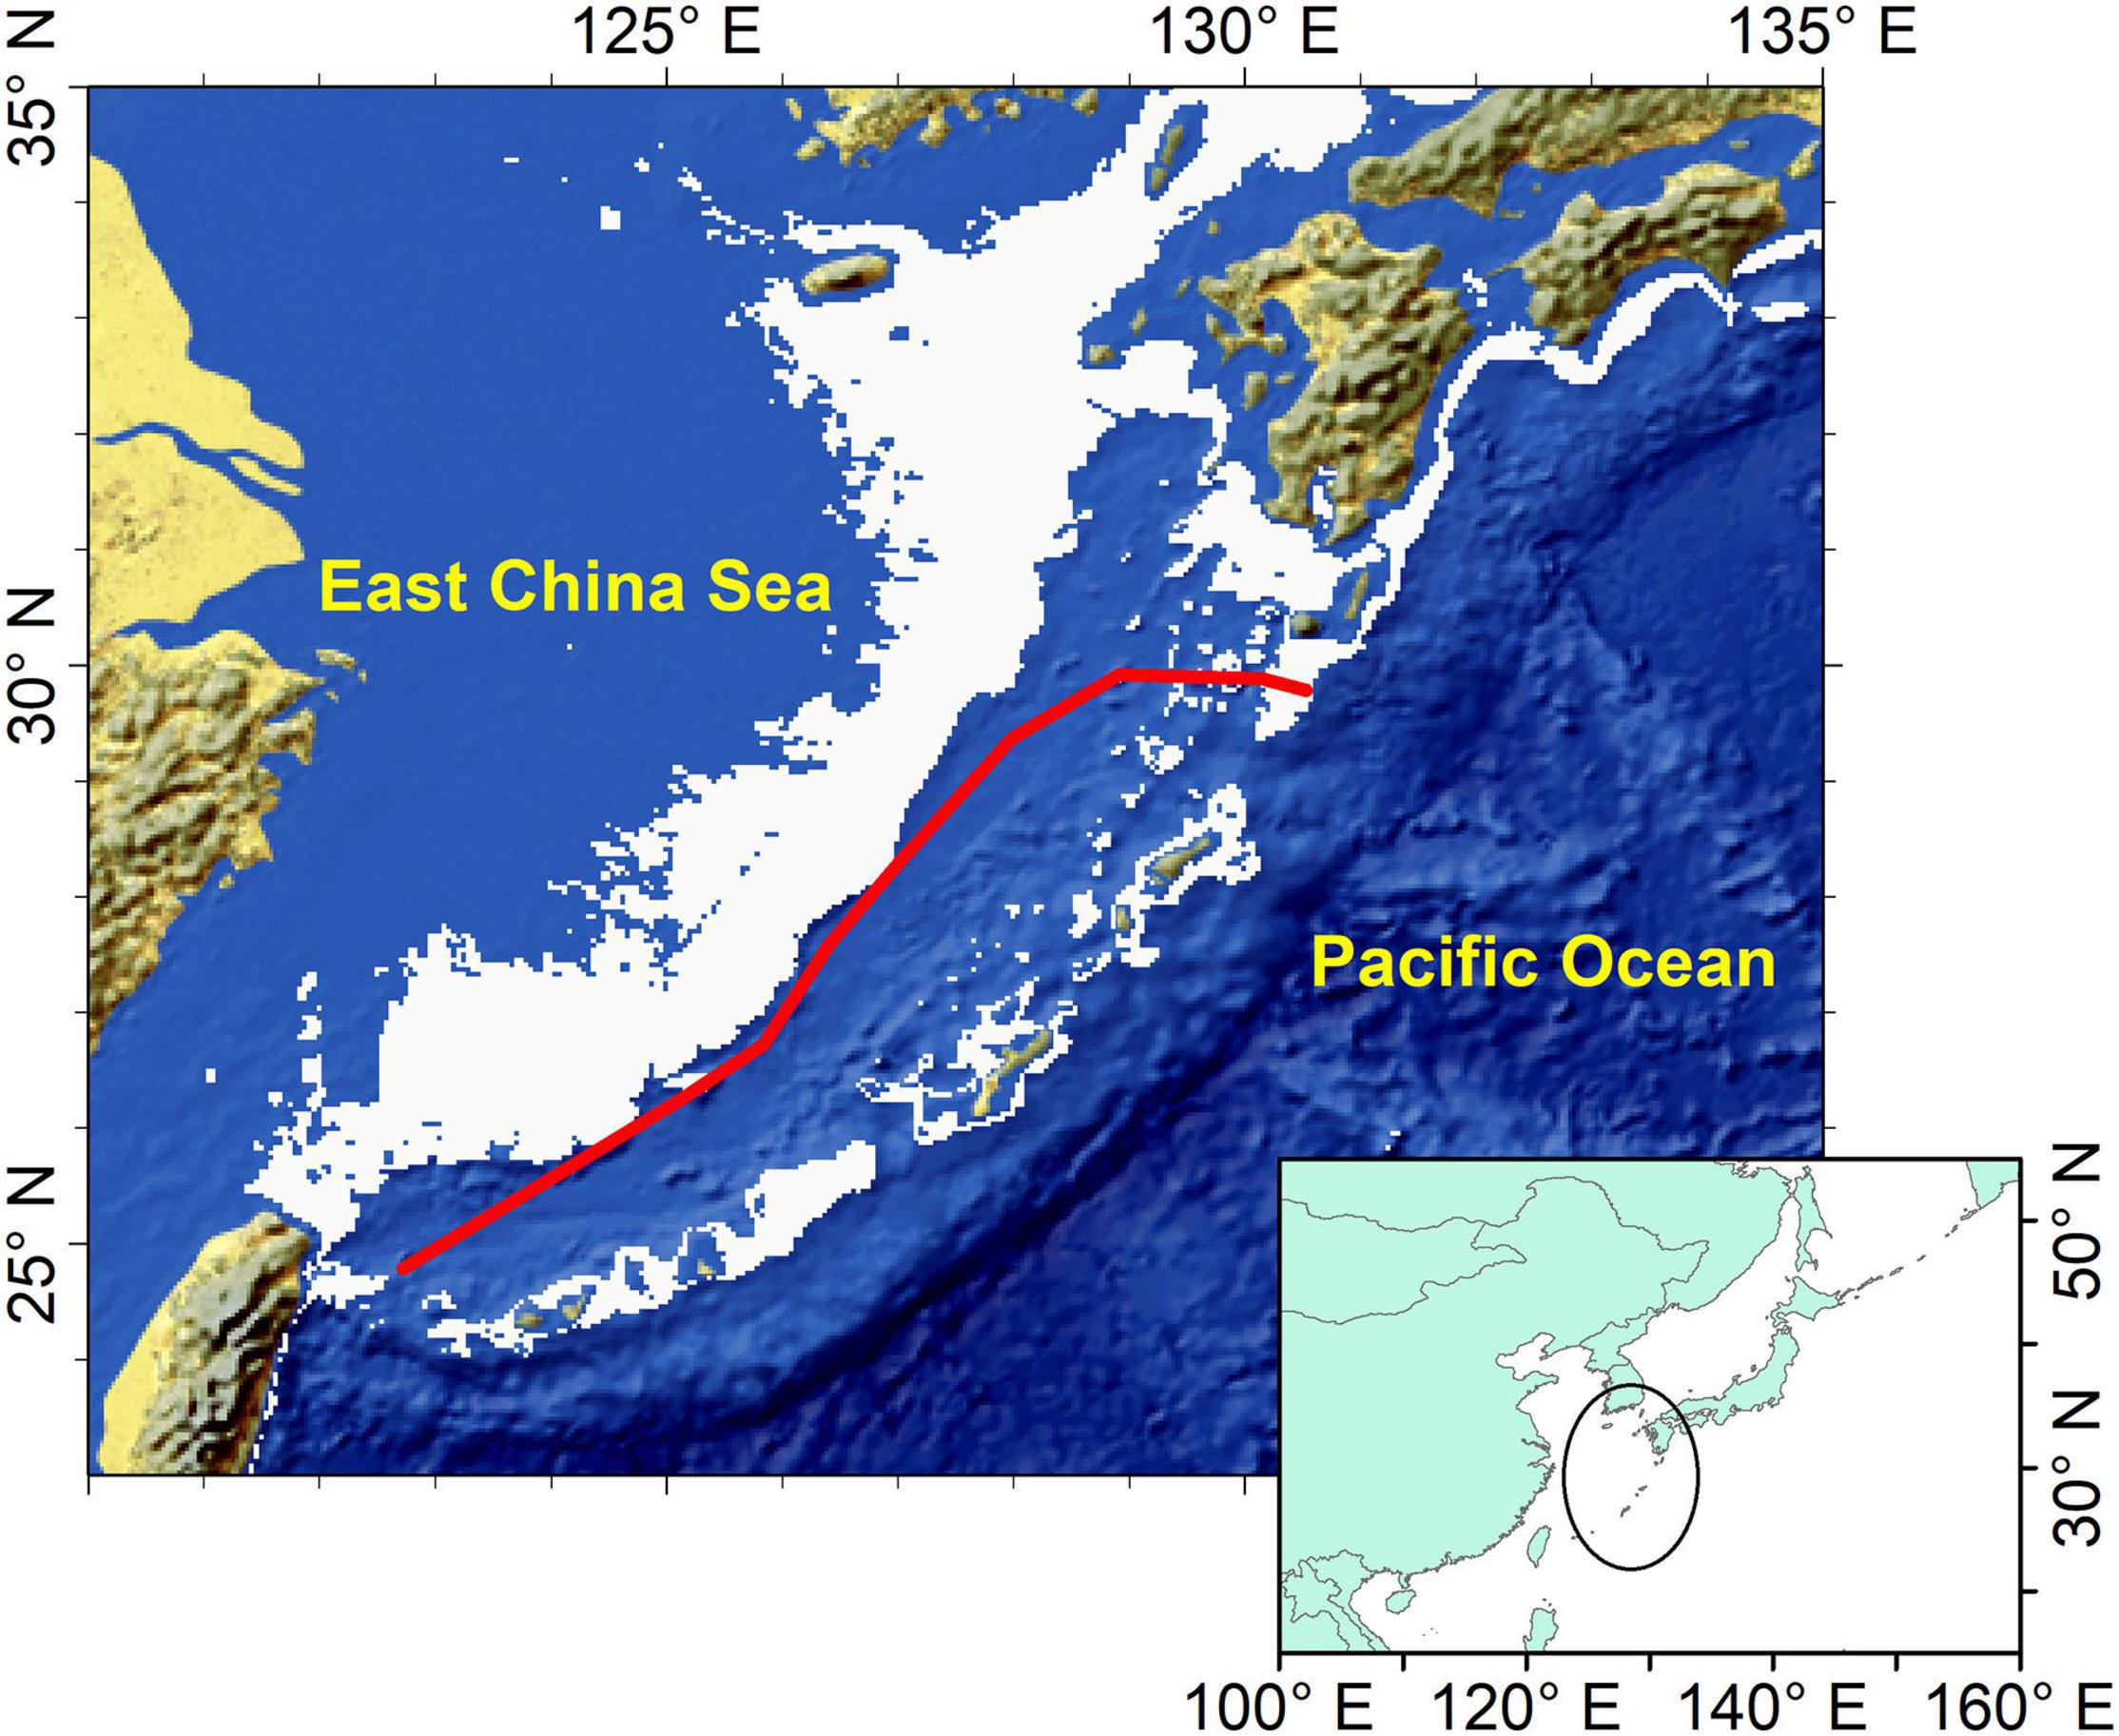
Figure 2. Location of potential spawning grounds of winter cohort of Japanese flying squid. Red line represents the average position of the Kuroshio axis and the gray area represents regions with submarine elevation between 100 and 500 m.
Spawning Ground Indices
To analyze the mechanisms for the variations in winter cohort abundance of Japanese flying squid, we calculated three spawning ground indices. Suitability SST- weighted area of dynamic potential spawning ground (SSWA) was used to describe the spatial and temporal variation of annual dynamic potential spawning ground. Previous studies on the suitable spawning area (SSA) of Japanese flying squid has been restricted to the sum of suitable SST area or SST-suitability-weighted on fixed spawning ground that considered comprehensive effects of SST variation on spawning and survival rates (Rosa et al., 2011; Liu et al., 2019). Combined with the above factors, we used the SSWA to weigh the effective SSA on dynamic potential spawning grounds (Liu et al., 2019). The annual SSWA is calculated using the following equation:
where Ni is the grid number of SST between 18 and 24°C in the dynamic potential spawning ground in year i; Si is the size of grid j at 1° x 1° (latitude x longitude) resolution; and TSIj is the temperature suitability index of grid j computed as follows:
where μ is the average SST (21°C); σ = 1.5 with approximately 95% of the area being within 18–24°C.
The mean value of suitable SST on dynamic potential spawning ground (MVSS) was used to describe the spatial and temporal variation of average SST from January to April, covering the entire spawning period of the winter cohort (Sakurai et al., 2000; Rosa et al., 2011).
A series of meridional position indices (MP) were also computed and interpreted as the meridional position of SST isolines between 18 and 24°C on potential spawning ground (MP18, MP19, MP20, MP21, MP22, MP23, and MP24) and reflect the variation in the entire position of the potential spawning ground of the winter cohort.
Sequential Regime Shift Detection
The Sequential t-test Analysis of Regime Shift (STARS), downloaded from an online repository,7 was used to identify the trends and regime shifts in the time series (Rodionov, 2004). Later, the method was renamed to the Sequential Regime Shift Detection (SRSD) method (Rodionov, 2005). SRSD results consist of the target significance level (P), the cutoff length (L) and the Huber’s weight parameter (H). The first two parameters control the magnitude and scale of the regimes to be detected and the last parameter affects the weights assigned to the outliers. In this study, SRSD was used to detect the regime shifts on abundance and spawning ground indices with L set to 10, H to 1, and significant level to 5%. In addition, the cumulative sum (CuSum) of the anomalies in the time series was used to visualize the trends of all indices (Beamish et al., 1999).
Correlation Analysis
Correlation analyses with significance tests computed using 1,000 permutations were used to examine the relationships between the catch and CPUE and between spawning ground indices and PDO. A machine learning method based on the gradientForests R package (R Core Team, 2017) was also used to quantify the relationships between indices and winter cohort abundance. The gradientForests is an extension of the random forest approach (Ellis et al., 2012), designed to analyze variable importance and identify complex relationships between predictor and response variables. The analyses provide information on mean R2 weighted importance and cumulative importance of covariates. Here, gradientForests was used to examine the relative importance of various spawning ground indices to the winter cohort abundance.
Results
Variations in Catch and CPUE
Similar annual variations were detected from the annual catches of winter squid cohort by Japan, South Korean and their total catches (Figure 1), showing periodic high (1991–2014) and low (1979–1990; 2015–2018) catches. The correlation coefficients between the CPUE and catches (Japanese, South Korean, and total catches) were r = 0.91, r = 0.79, and r = 0.92 at p < 0.01, respectively (Table 1). Long-term variation in the winter cohort abundance was detected by SRSD. Before 1990, catch and CPUE were lower than the average from 1979 to 2018 (Figure 3). Japanese and South Korean catches, total catch, and CPUE showed significant regime shift in 1990/1991 with increasing abundance trends (Figure 3). After 2014, Japanese catches and CPUEs were lower than the average from 1979 to 2018 (Figures 3A,D). The total catch and South Korean catch were lower than the average after 2015 and 2016, respectively (Figures 3B,C). Japanese catch and CPUE captured a regime shift in 2014/2015 with decreasing abundance trends (Figures 3A,D). Meanwhile, the South Korean catch and total catch showed a regime shift in 2015/2016 of similar declines in abundance (Figures 3B,C).
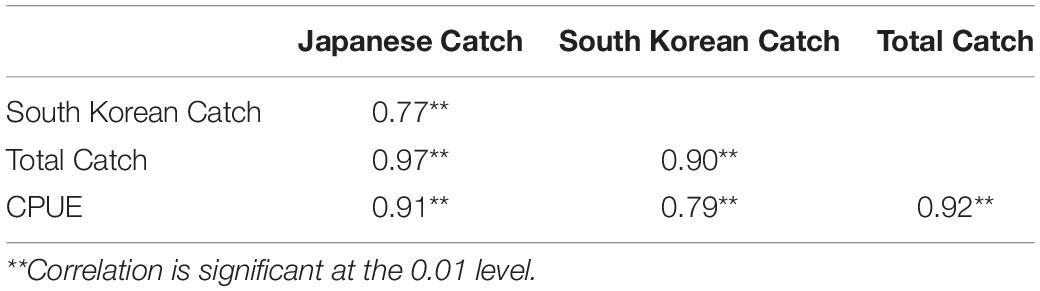
Table 1. Correlations analyses among Japanese catch, South Korean catch, total catch and CPUE.
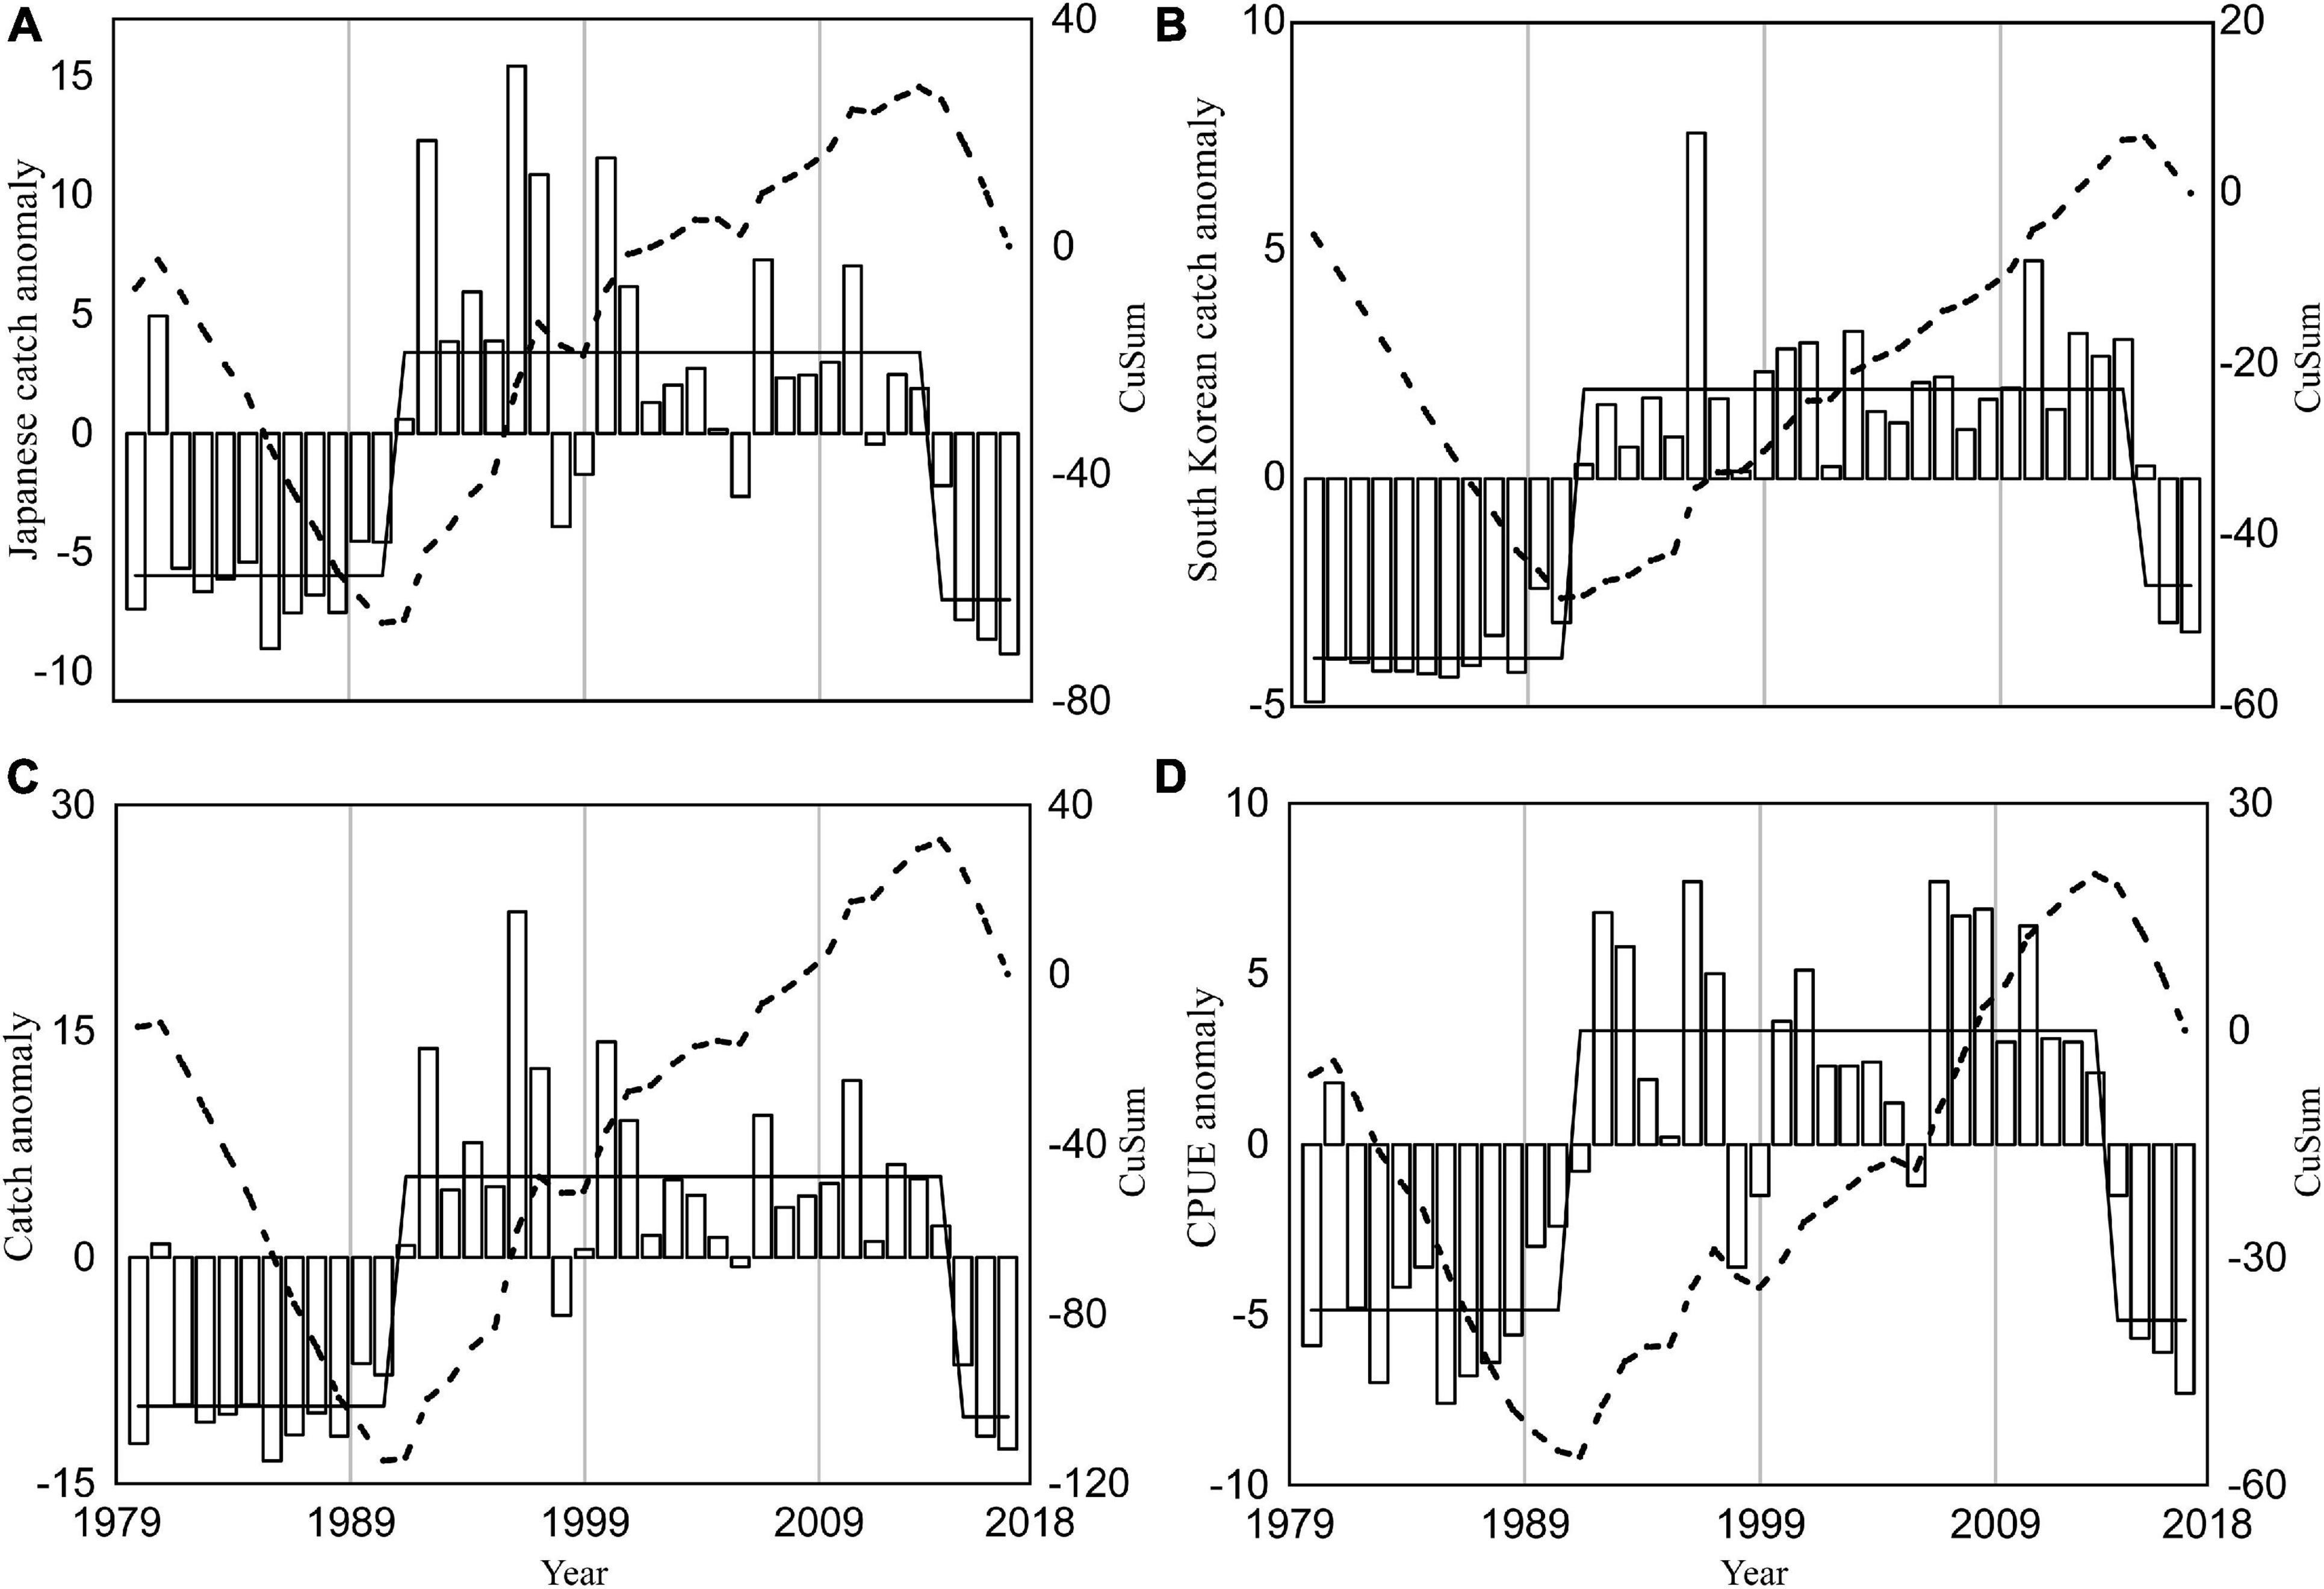
Figure 3. Annual anomalies (white bars) for Japanese catch (A), South Korean catch (B), total catch (C) and a combination of Japanese and South Korean CPUE (D) of winter cohort of Japanese flying squid from 1979 to 2018. The black dash line shows the cumulative sum (CuSum) of anomalies and black solid line represents the regime shifts detected by SRSD.
Variation in Dynamic Potential Spawning Ground
The dynamic potential spawning grounds from 1979 to 2018 was defined by suitable SST range, submarine elevation, and Kuroshio axis. These were mainly distributed in the East China Sea from the northern waters of Chinese Taiwan to the Pacific coast of Japan (Figure 2). The spatial and temporal distributions of dynamic potential spawning grounds from January to April, 1979–2018 were shown in Figures 4, 5. The annual areal extent of potential spawning ground varies with temperature. Low areal extents were shown in 1982, 1984–1986, 1988, 2003, 2006, 2016, and 2017 (Table 2). In contrast, larger potential spawning grounds were observed in 1991, 1997–1999, 2001–2004, 2009 (Table 2). The area within the upper temperature range limit (24°C) also varied with the position of the Kuroshio axis, and showed an increasing trend in the recent decades (2013–2014 and 2017–2018). In addition, there is a general increase in SST since 1999.
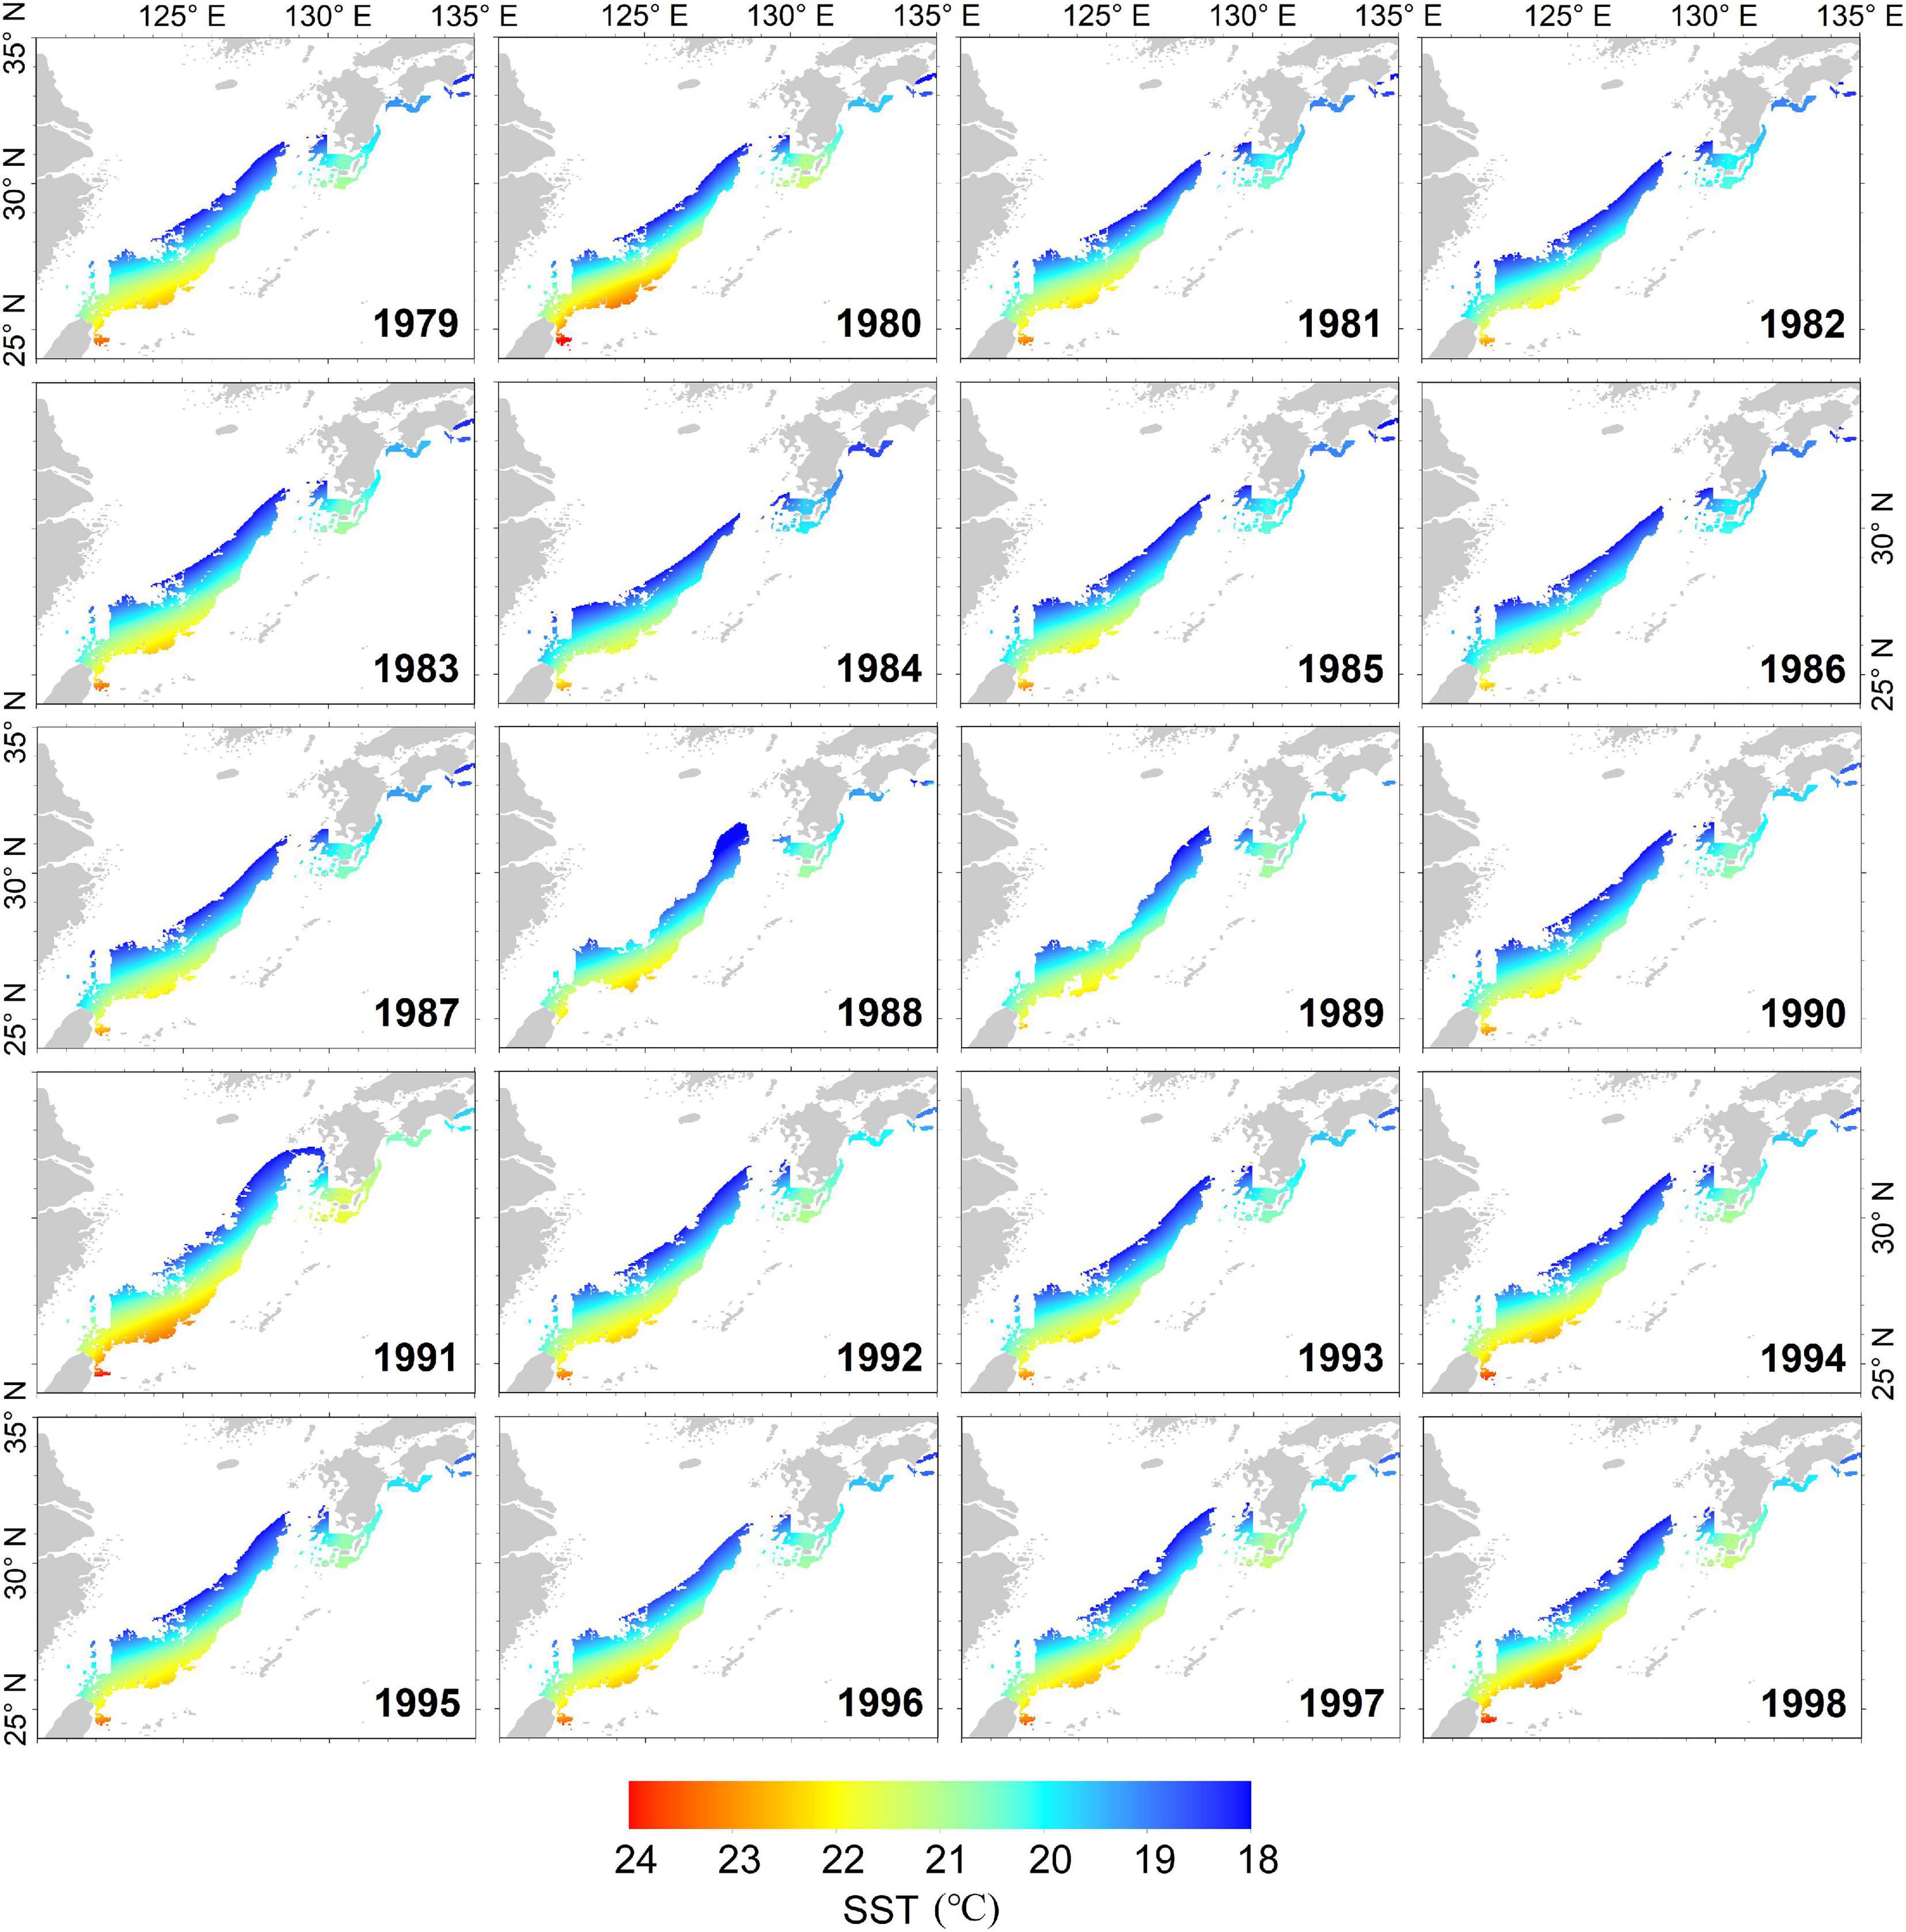
Figure 4. The annual dynamic potential spawning ground of winter cohort of Japanese flying squid from 1979 to 1998.
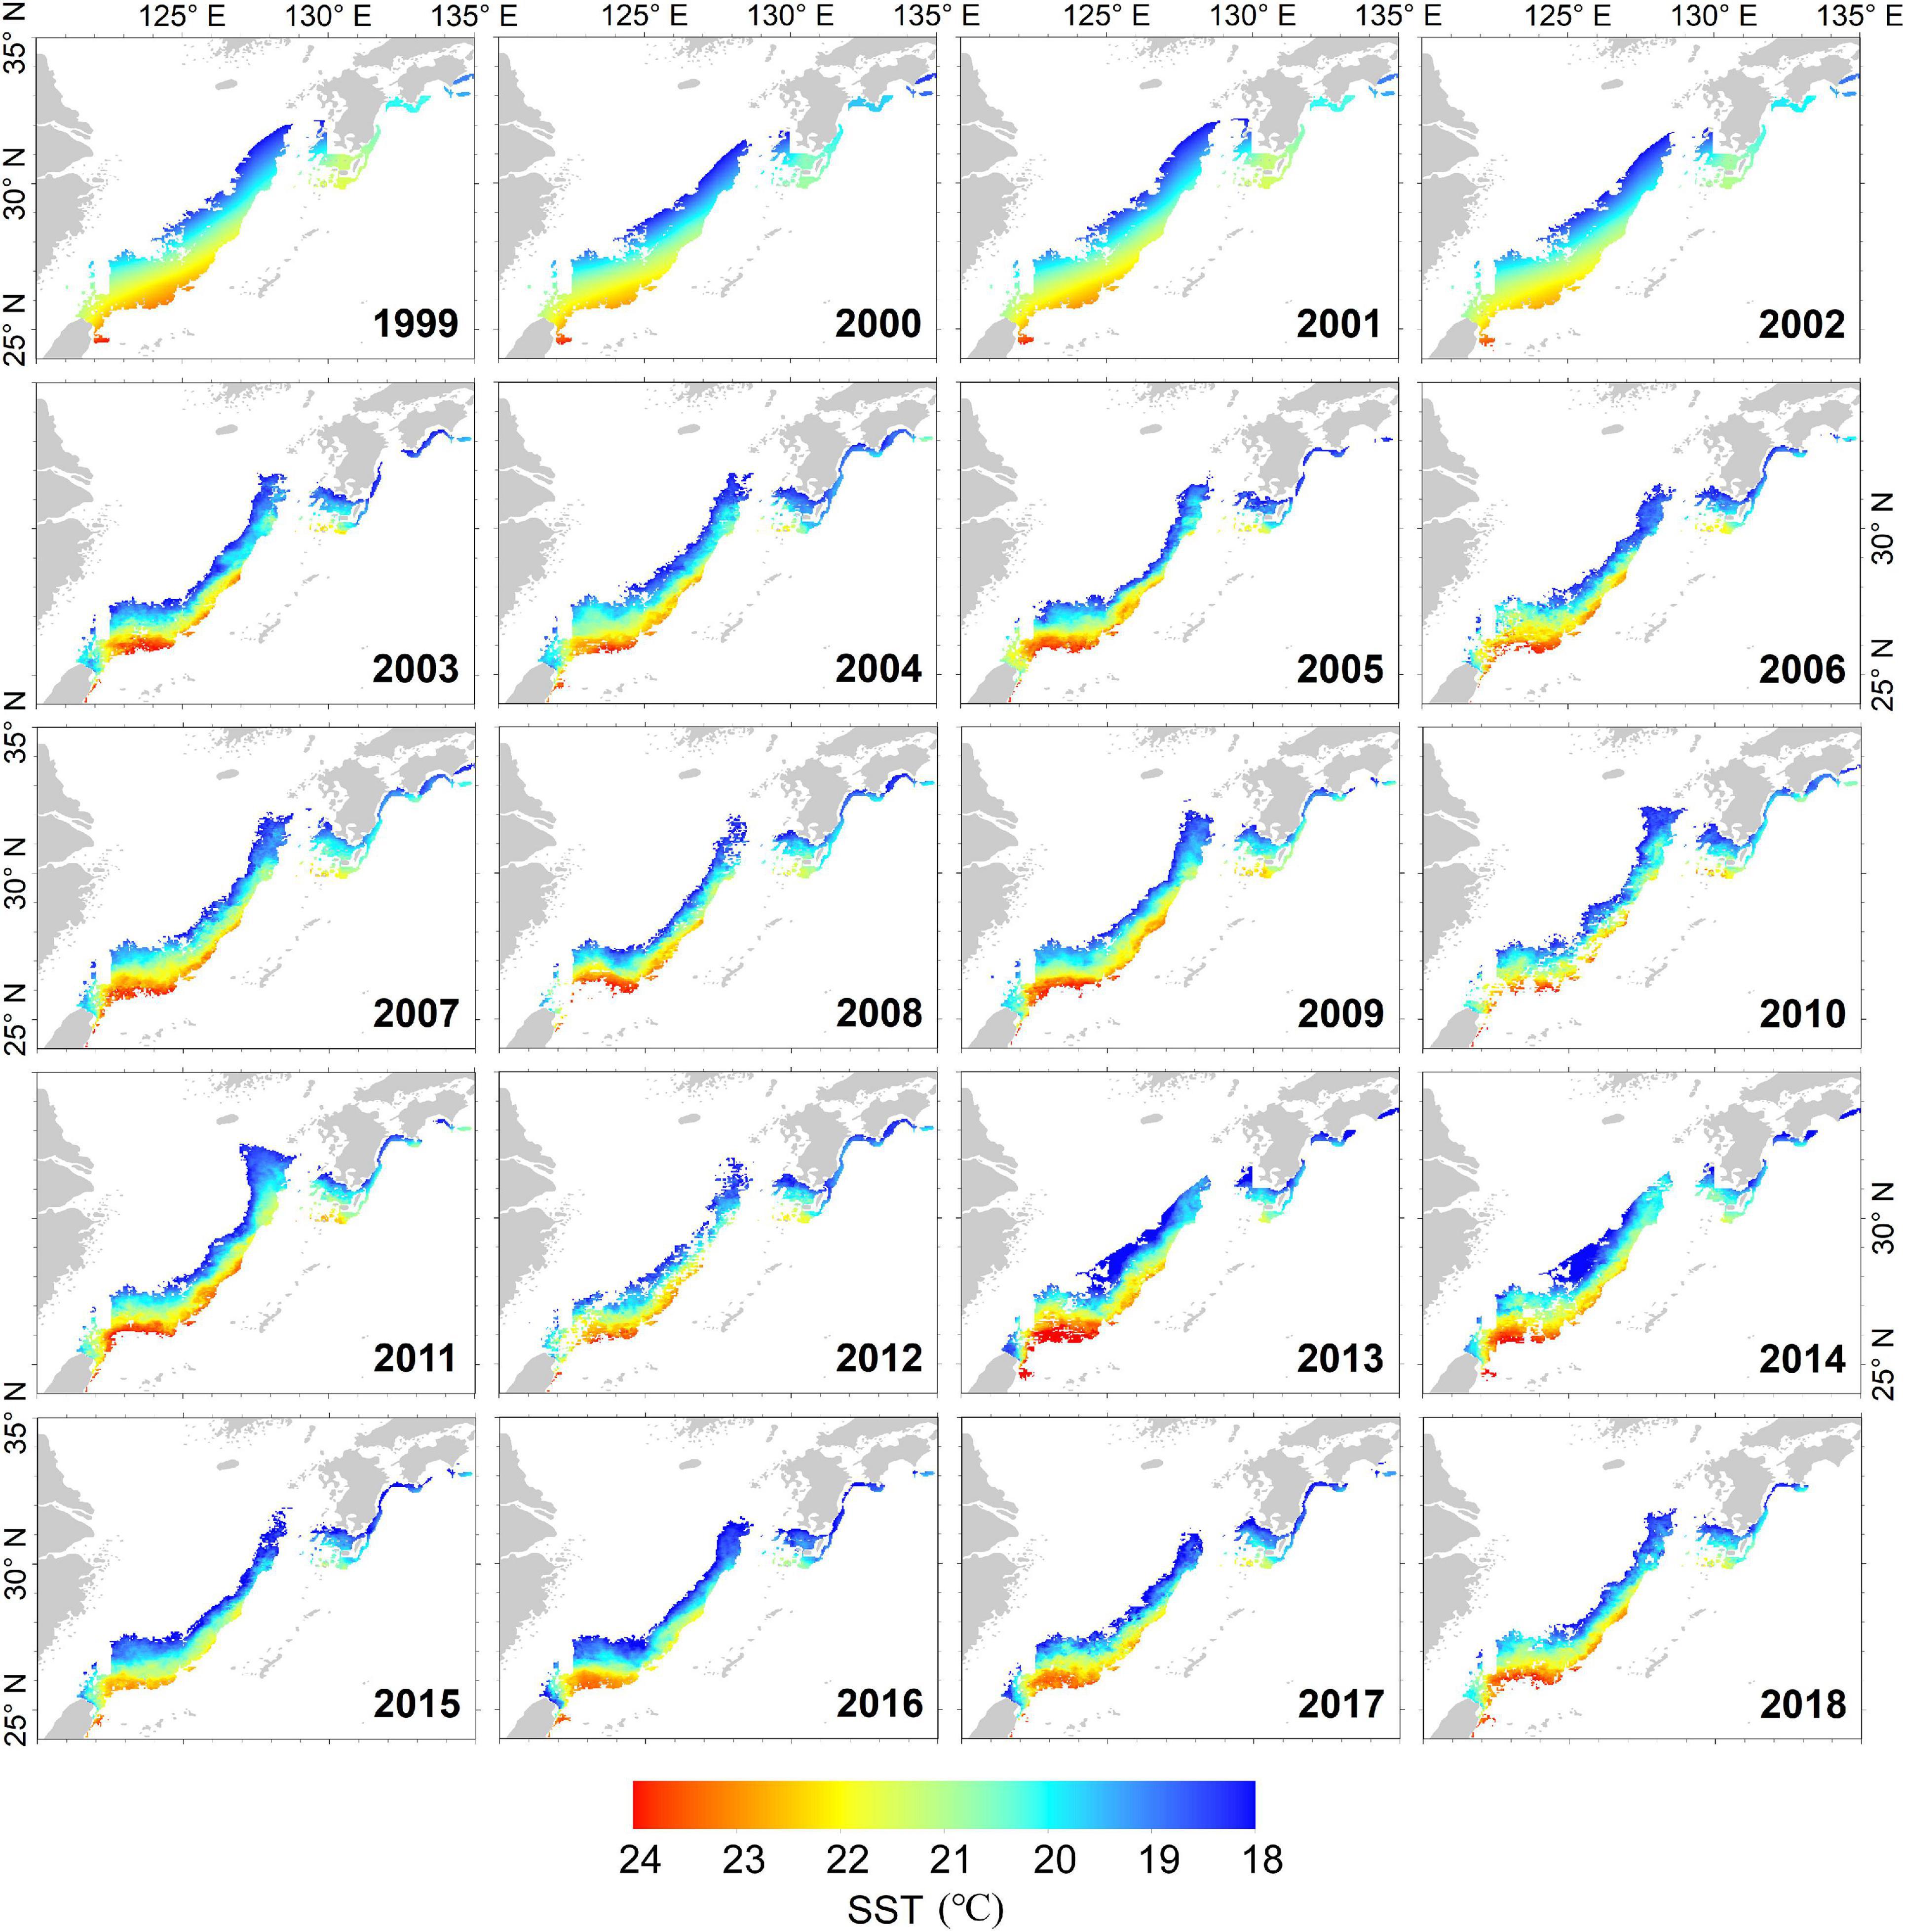
Figure 5. The annual dynamic potential spawning ground of winter cohort of Japanese flying squid from 1999 to 2018.
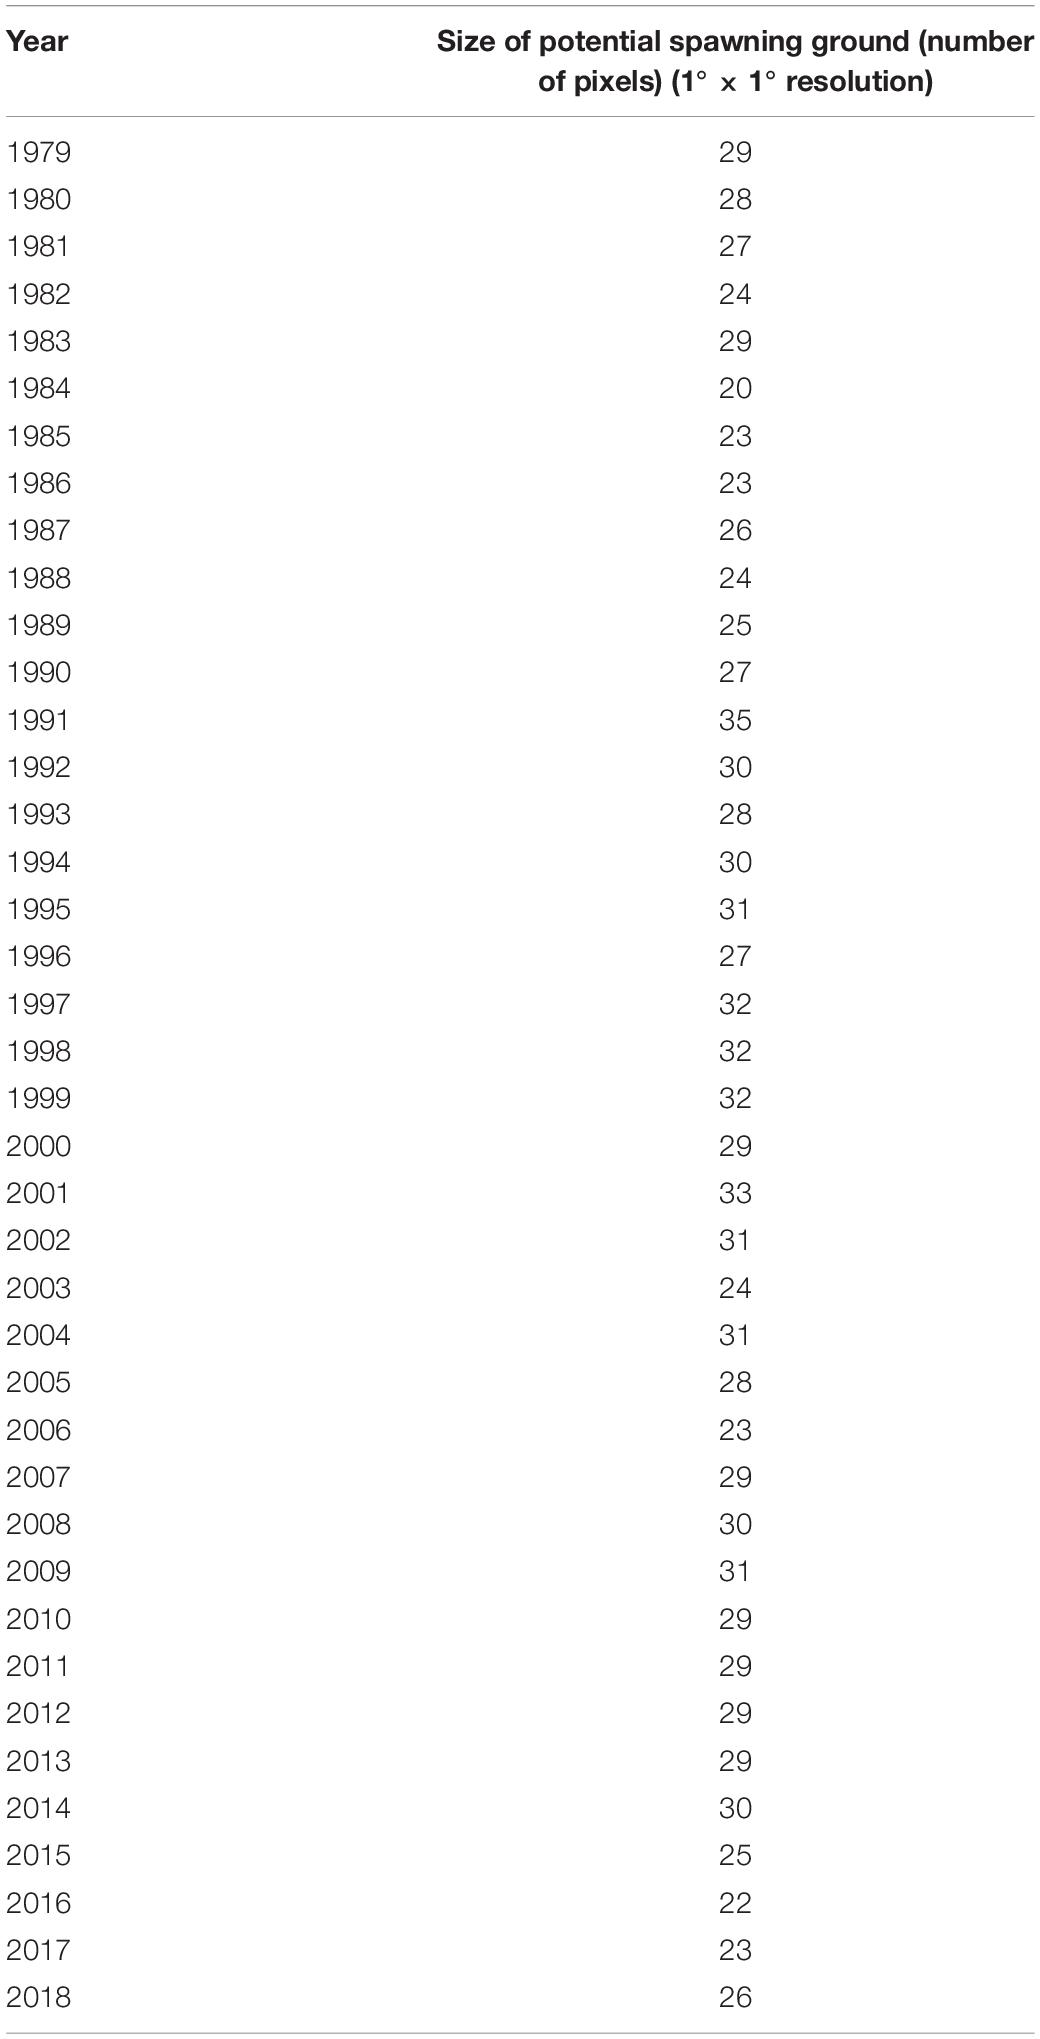
Table 2. The annual size of potential spawning ground of winter cohort of Japanese flying squid from 1979 to 2018, based on the total number of 1° × 1° pixels.
Regime Shifts in Spawning Ground Indices
Regime shifts were not detected in MP18, MP22, MP23, and MP24, thus, only three (MP19, MP20, and MP21) spawning ground indices were subsequently utilized. The interannual variations in SSWA displayed a slightly upward trend with maximum and minimum SSWA in 1991 and 1984 (Figure 6A1), respectively. However, an obvious upward trend with a peak at 20.64°C in 1991 and a dip at 19.69°C was observed in 1984 (Figure 6B1). The variations in MP19 (r = 0.75, p < 0.01), MP20 (r = 0.73, p < 0.01), and MP21 (r = 0.65, p < 0.01) were similar to those with MVSS. The southernmost positions of MP19, MP20 and MP21 all appeared in 1984, reaching 29.5° N, 27.9°N and 26.5°N, respectively (Figures 6C1,D1,E1). The northernmost latitudinal position of MP19 reached 31.3°N in 1999, MP20 reached 30.5°N in 1998 and MP21 reached 28.9°N in 2003 (Figures 6C1,D1,E1).
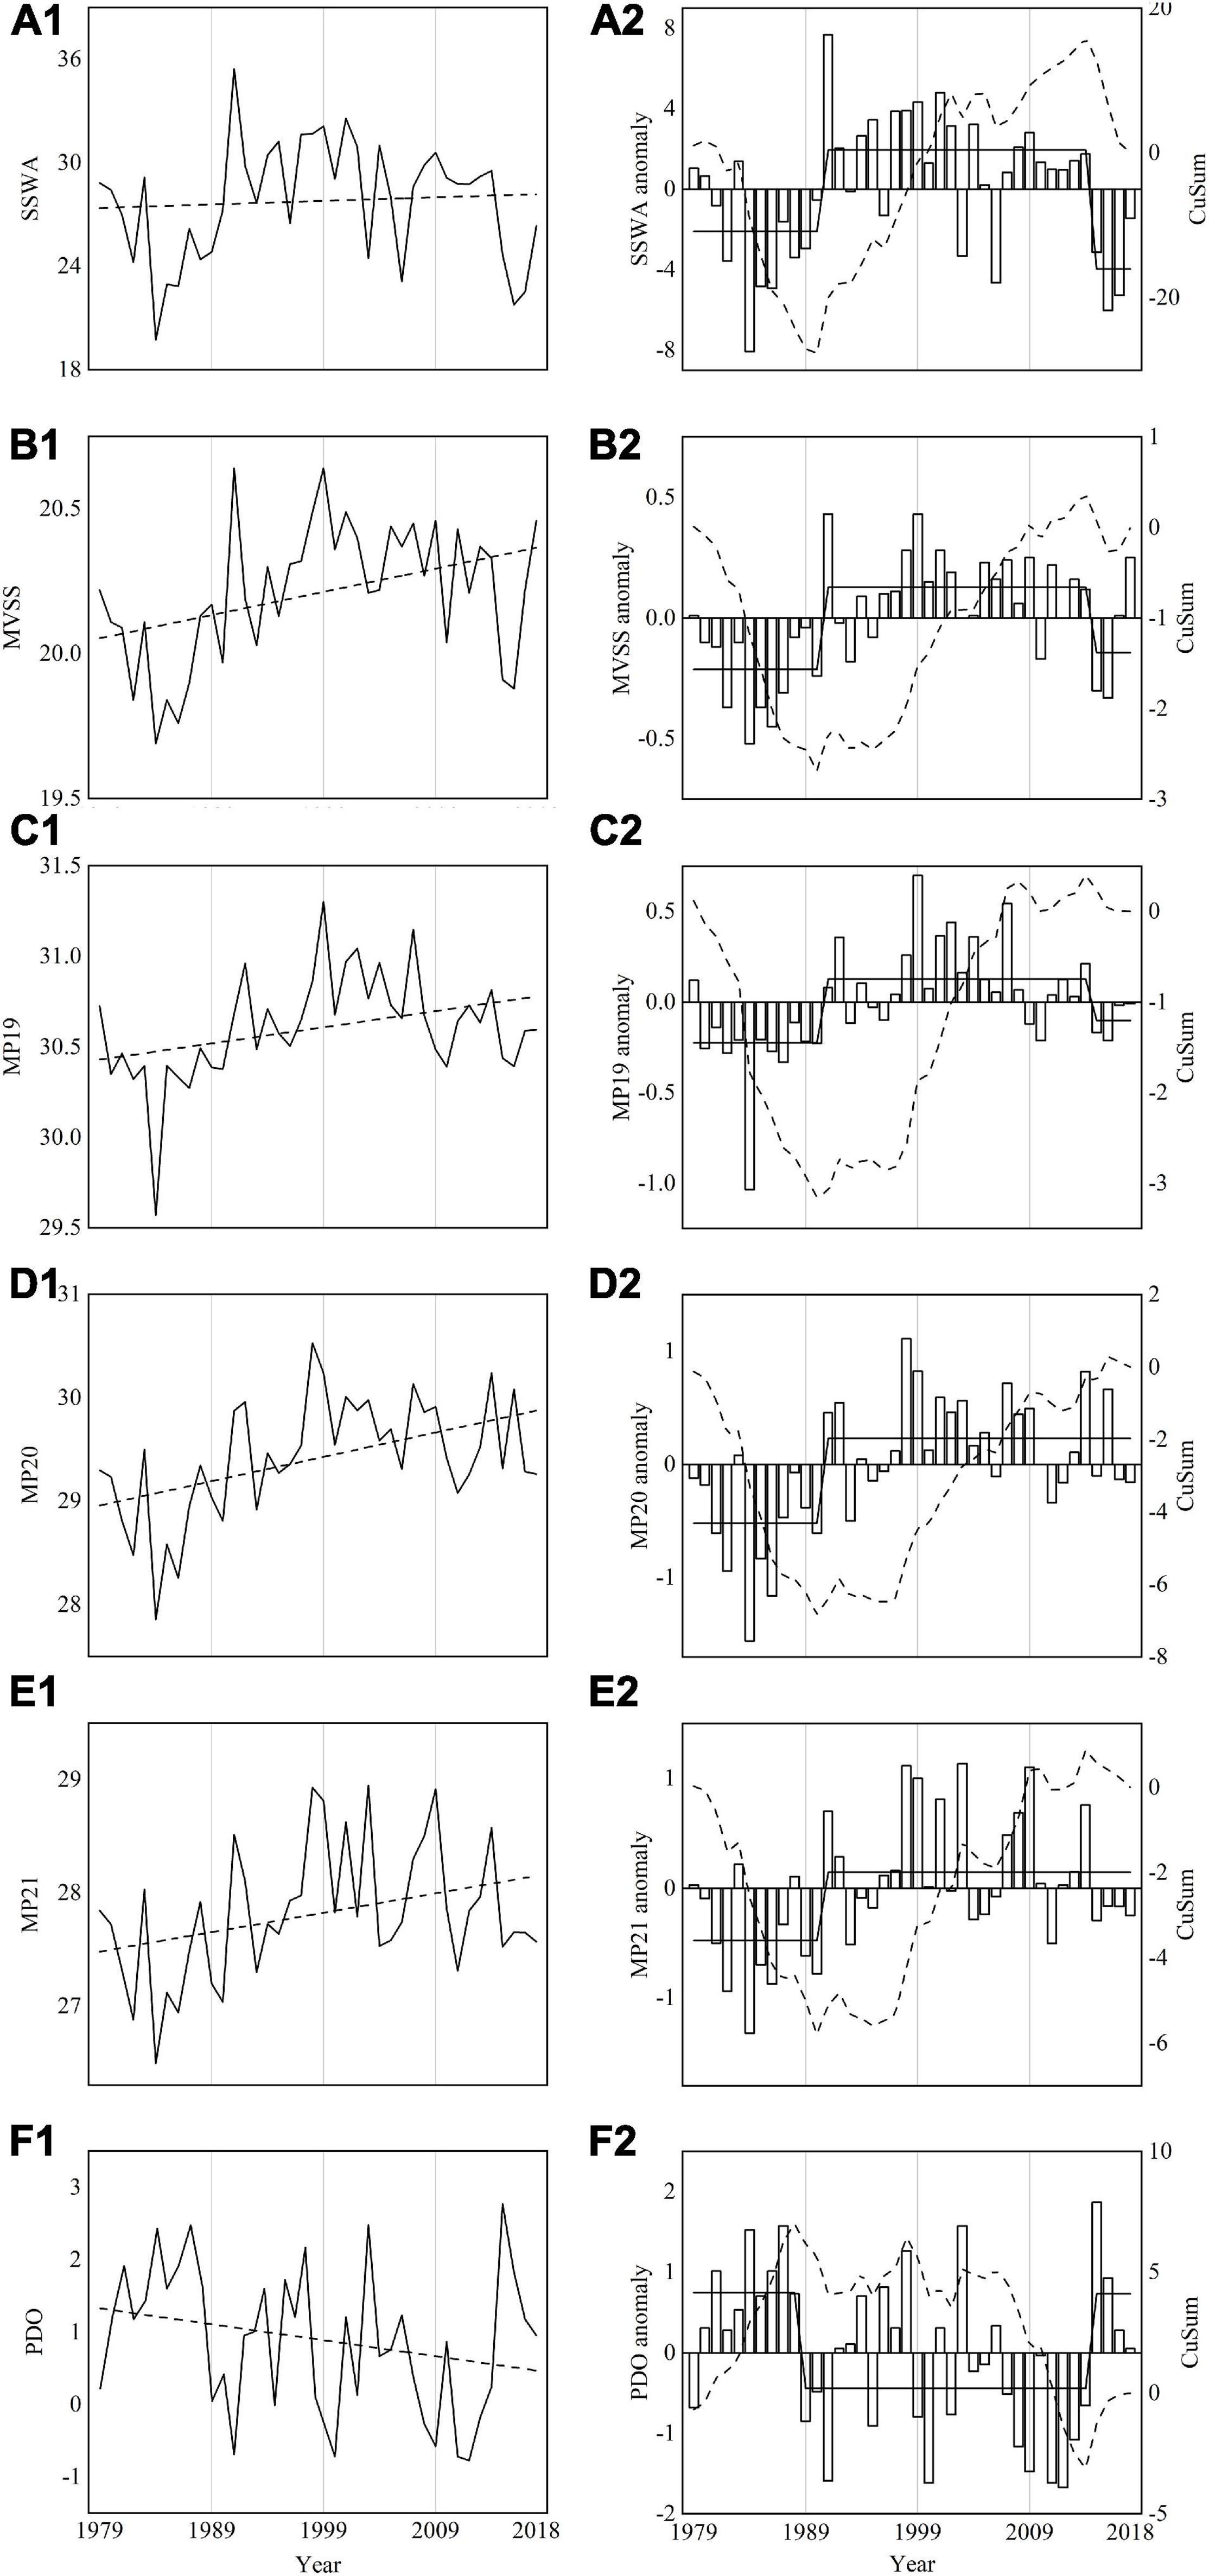
Figure 6. Annual variations (solid lines) and anomalies (white bars) of SSWA (A1,A2), MVSS (B1,B2), MP19 (C1,C2), MP20 (D1,D2), MP21 (E1,E2), and PDO (F1,F2) from 1979 to 2018. The black dash lines in A1 to E1 represent linear trends. Dash and solid lines in panels (A2–F2) represent cumulative sum (CuSum) of anomalies and regime shifts detected by SRSD, respectively. SSWA, suitability SST-weighted area of potential spawning ground; MVSS, mean values (January–April) of suitable SST; MP19, the meridional position of 19°C SST isoline; MP20, the meridional position of 20°C SST isoline; MP21, the meridional position of 21°C SST isoline; and PDO, the winter-averaged Pacific Decadal Oscillation.
SSWA, MVSS, MP19, MP20, MP21 all highlighted regime shifts with significant increasing trends during 1990/1991 within the dynamic potential spawning grounds (Figures 6A2–E2). SSWA showed regime shift with decreasing trends in 2014/2015 (Figure 6A2) while regime shift was not detected in MP20 and MP21 in 2015/2016 (Figures 6D2–E2).
Relationship Between Spawning Ground Indices and Climate Index
The PDO index showed a decreasing trend over time (Figure 6F1). The regime shifts in the winter PDO index were detected by SRSD in 1988/1999 and 2014/2015 (Figure 6F2), which corresponded well with observed signals in spawning ground indices. Winter PDO and three spawning ground indices all showed significant negative correlations (Table 3). The variations in SSWA (r = −0.55, p < 0.01), MVSS (r = −0.55, p < 0.01), MP19 (r = −0.39, p < 0.01), were similar to those in winter PDO. However, relationships between winter PDO with MP20 and MP21 showed weak correlations.
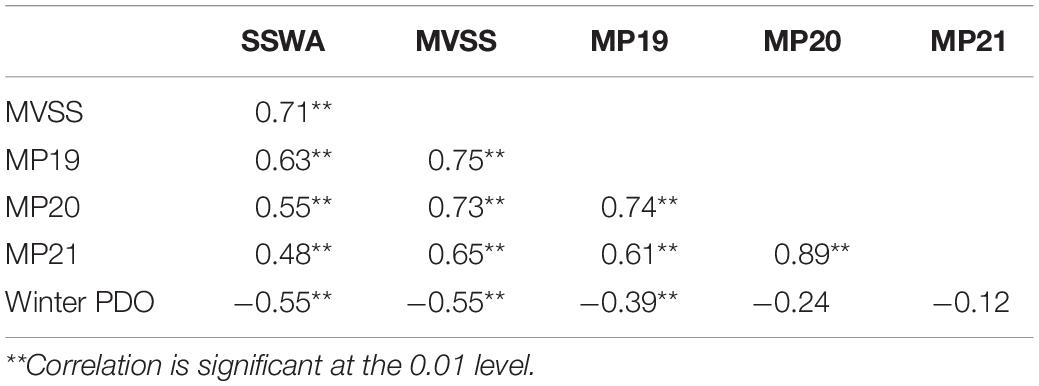
Table 3. Correlations analyses between winter (December–February) PDO (Pacific Decadal Oscillation), and spawning ground indices (SSWA: suitability SST-weighted area of potential spawning ground, MVSS: mean values of suitable SST on dynamic potential spawning ground, MP: the meridional position of suitable SST isoline (e.g., MP19, MP20, and MP21).
Importance of Spawning Ground Indices Analyses
GradientForest analyses showed the relative importance of spawning ground indices along with their one-year lagged time series to catch and CPUE of winter squid cohort (Figure 7). In addition, the Japanese catch proportion gradually decreased from 90% in the 1980s to about 60% in the 2010s, while the South Korean catch proportion increased from 10% in the 1980s to about 40% in the 2010s (Figure 1). To make the data analysis clearer, we use only the total catch and a combination of Japanese and South Korean CPUE data as indicators for gradientForests in this study. Based on the analyses, SSWA was shown as the most important predictor of both catch and CPUE, followed by SSWA_Lag1, MVSS_Lag1, MP19_Lag1, MP19, and MVSS.
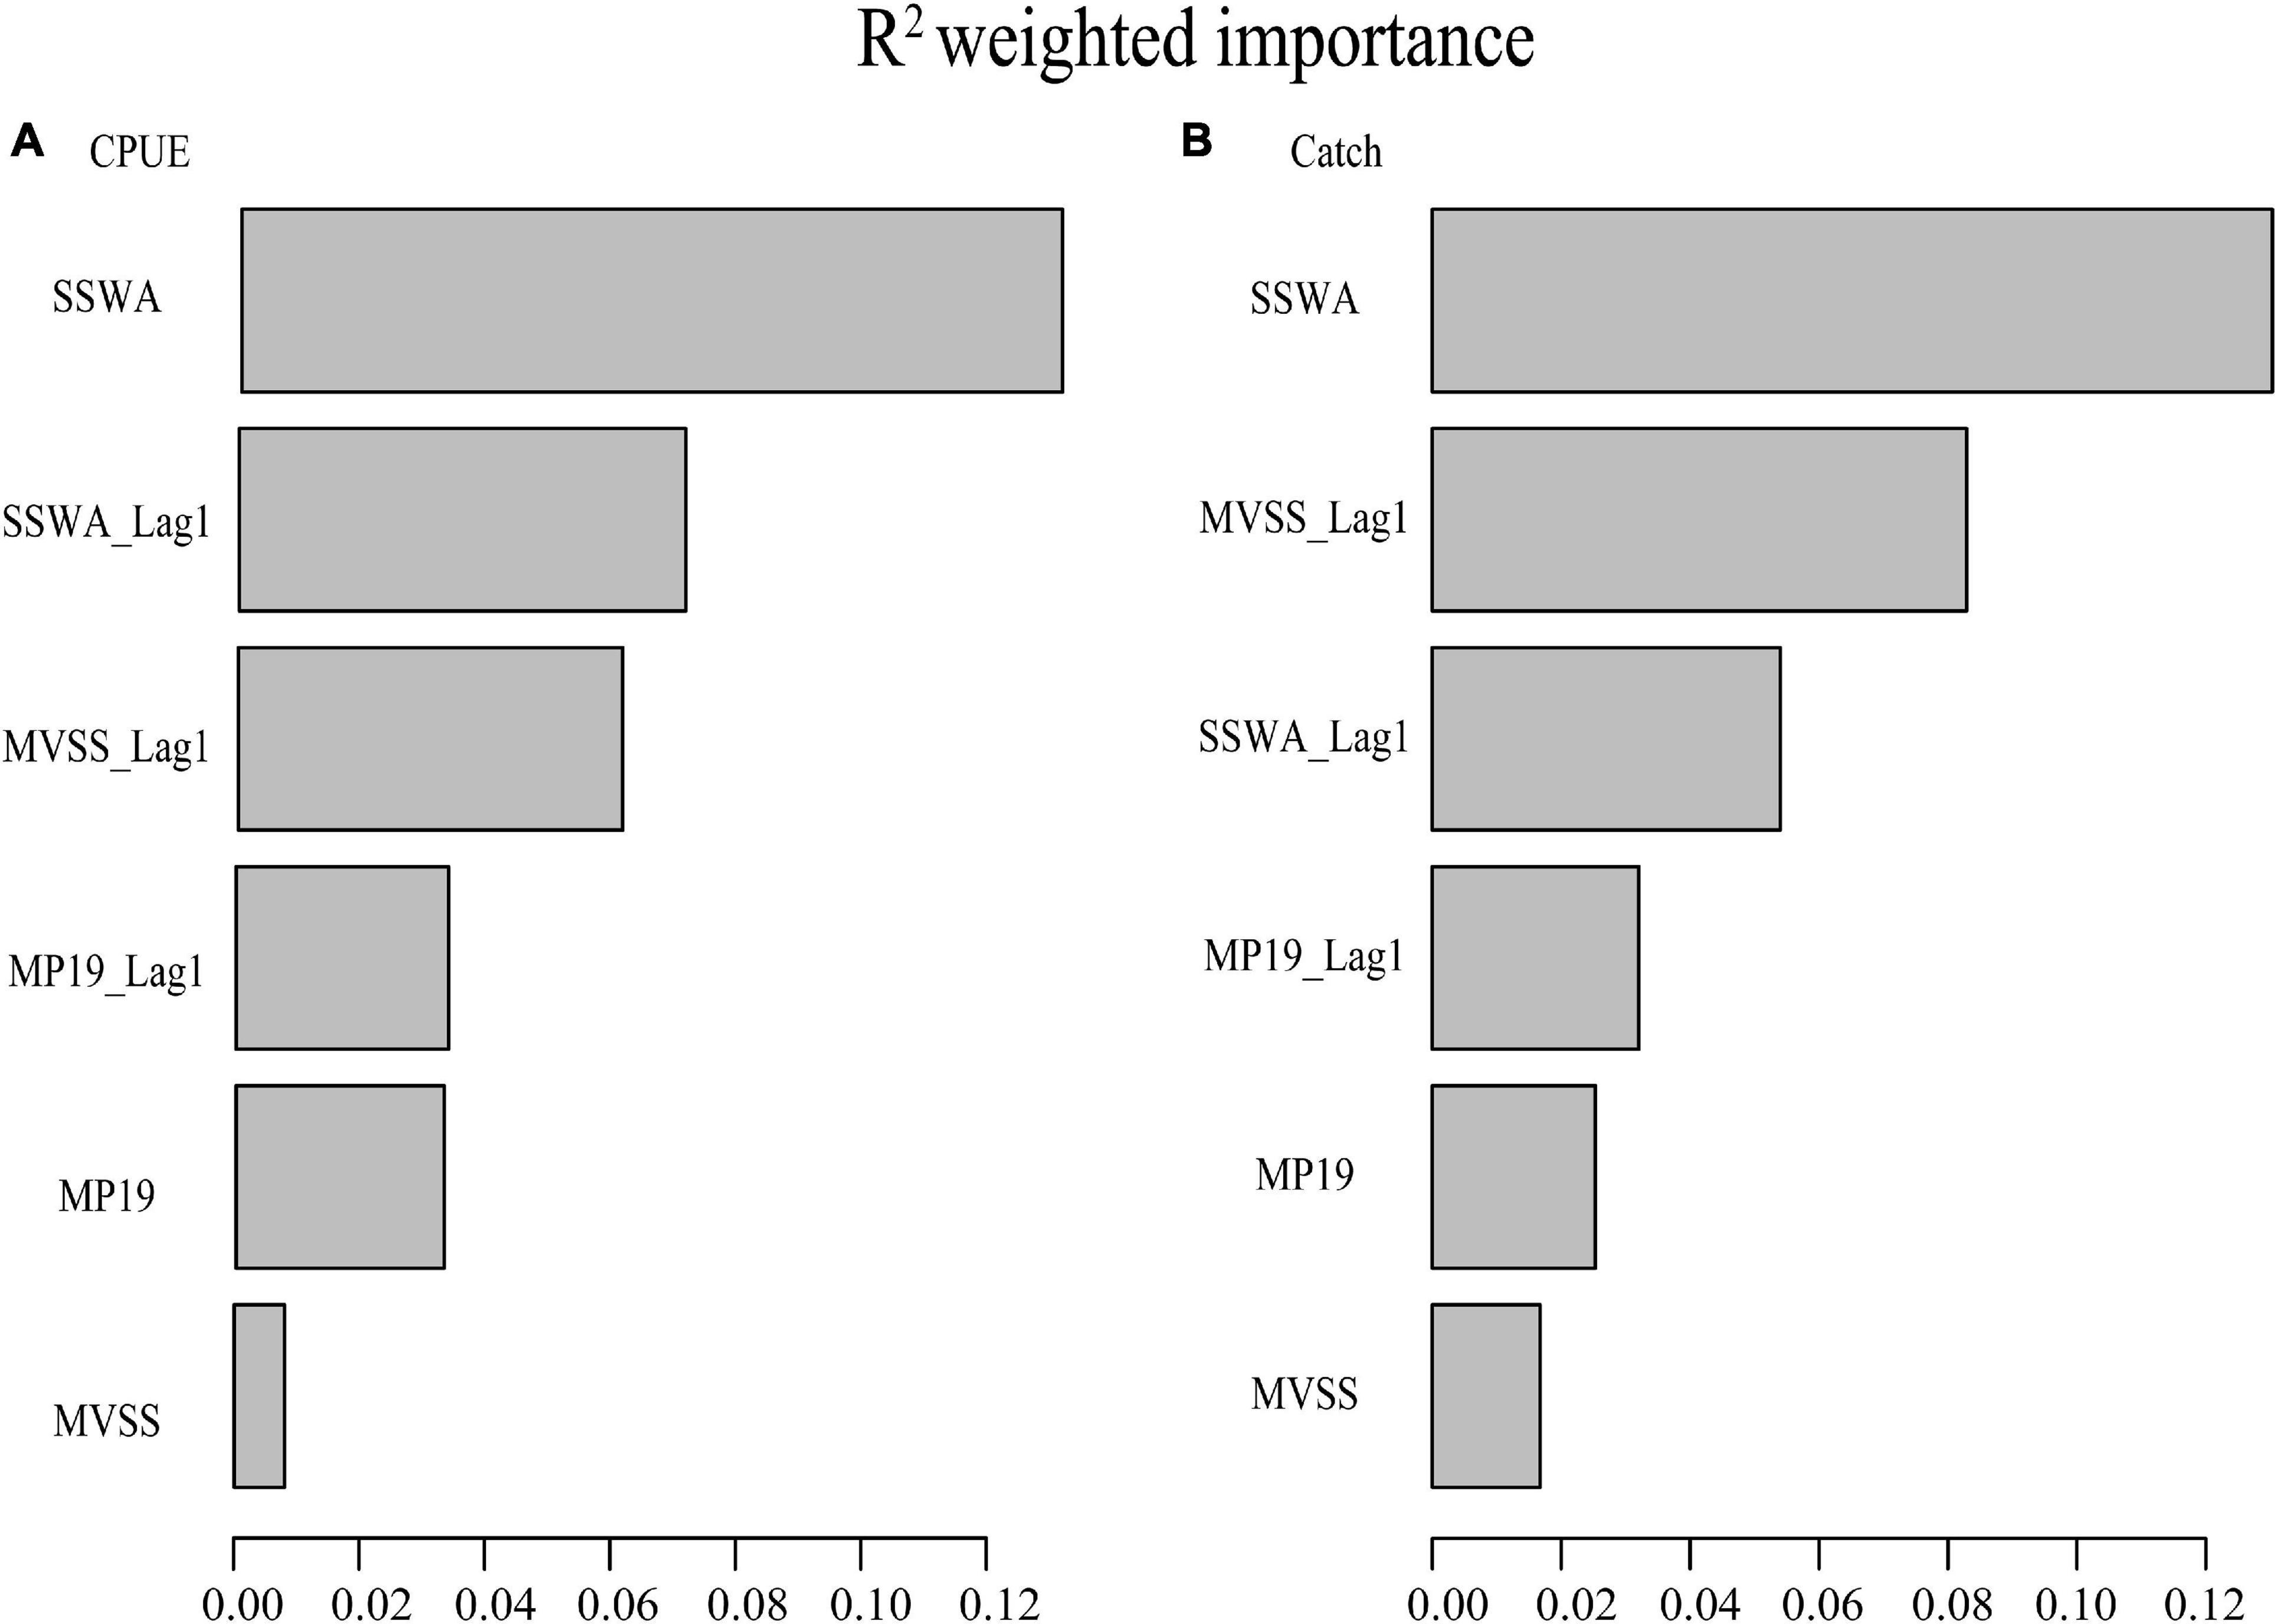
Figure 7. Importance of spawning ground indices (SSWA, MVSS, MP19, MP20 and MP21) and their one-year lagged time series on CPUE (A) and Catch (B) from the gradientForest analyses.
Further, based on the cumulative important analysis (Figure 8), catch and CPUE of winter cohort exhibited a strong response when SSWA and SSWA_Lag1 were >26, MVSS_Lag1 was >20°C and MP19_Lag1 was >30.4°N (Figure 8). However, the catch was not as sensitive as the CPUE in MVSS and MP19. Therefore, CPUE appears to be a better proxy than catches.
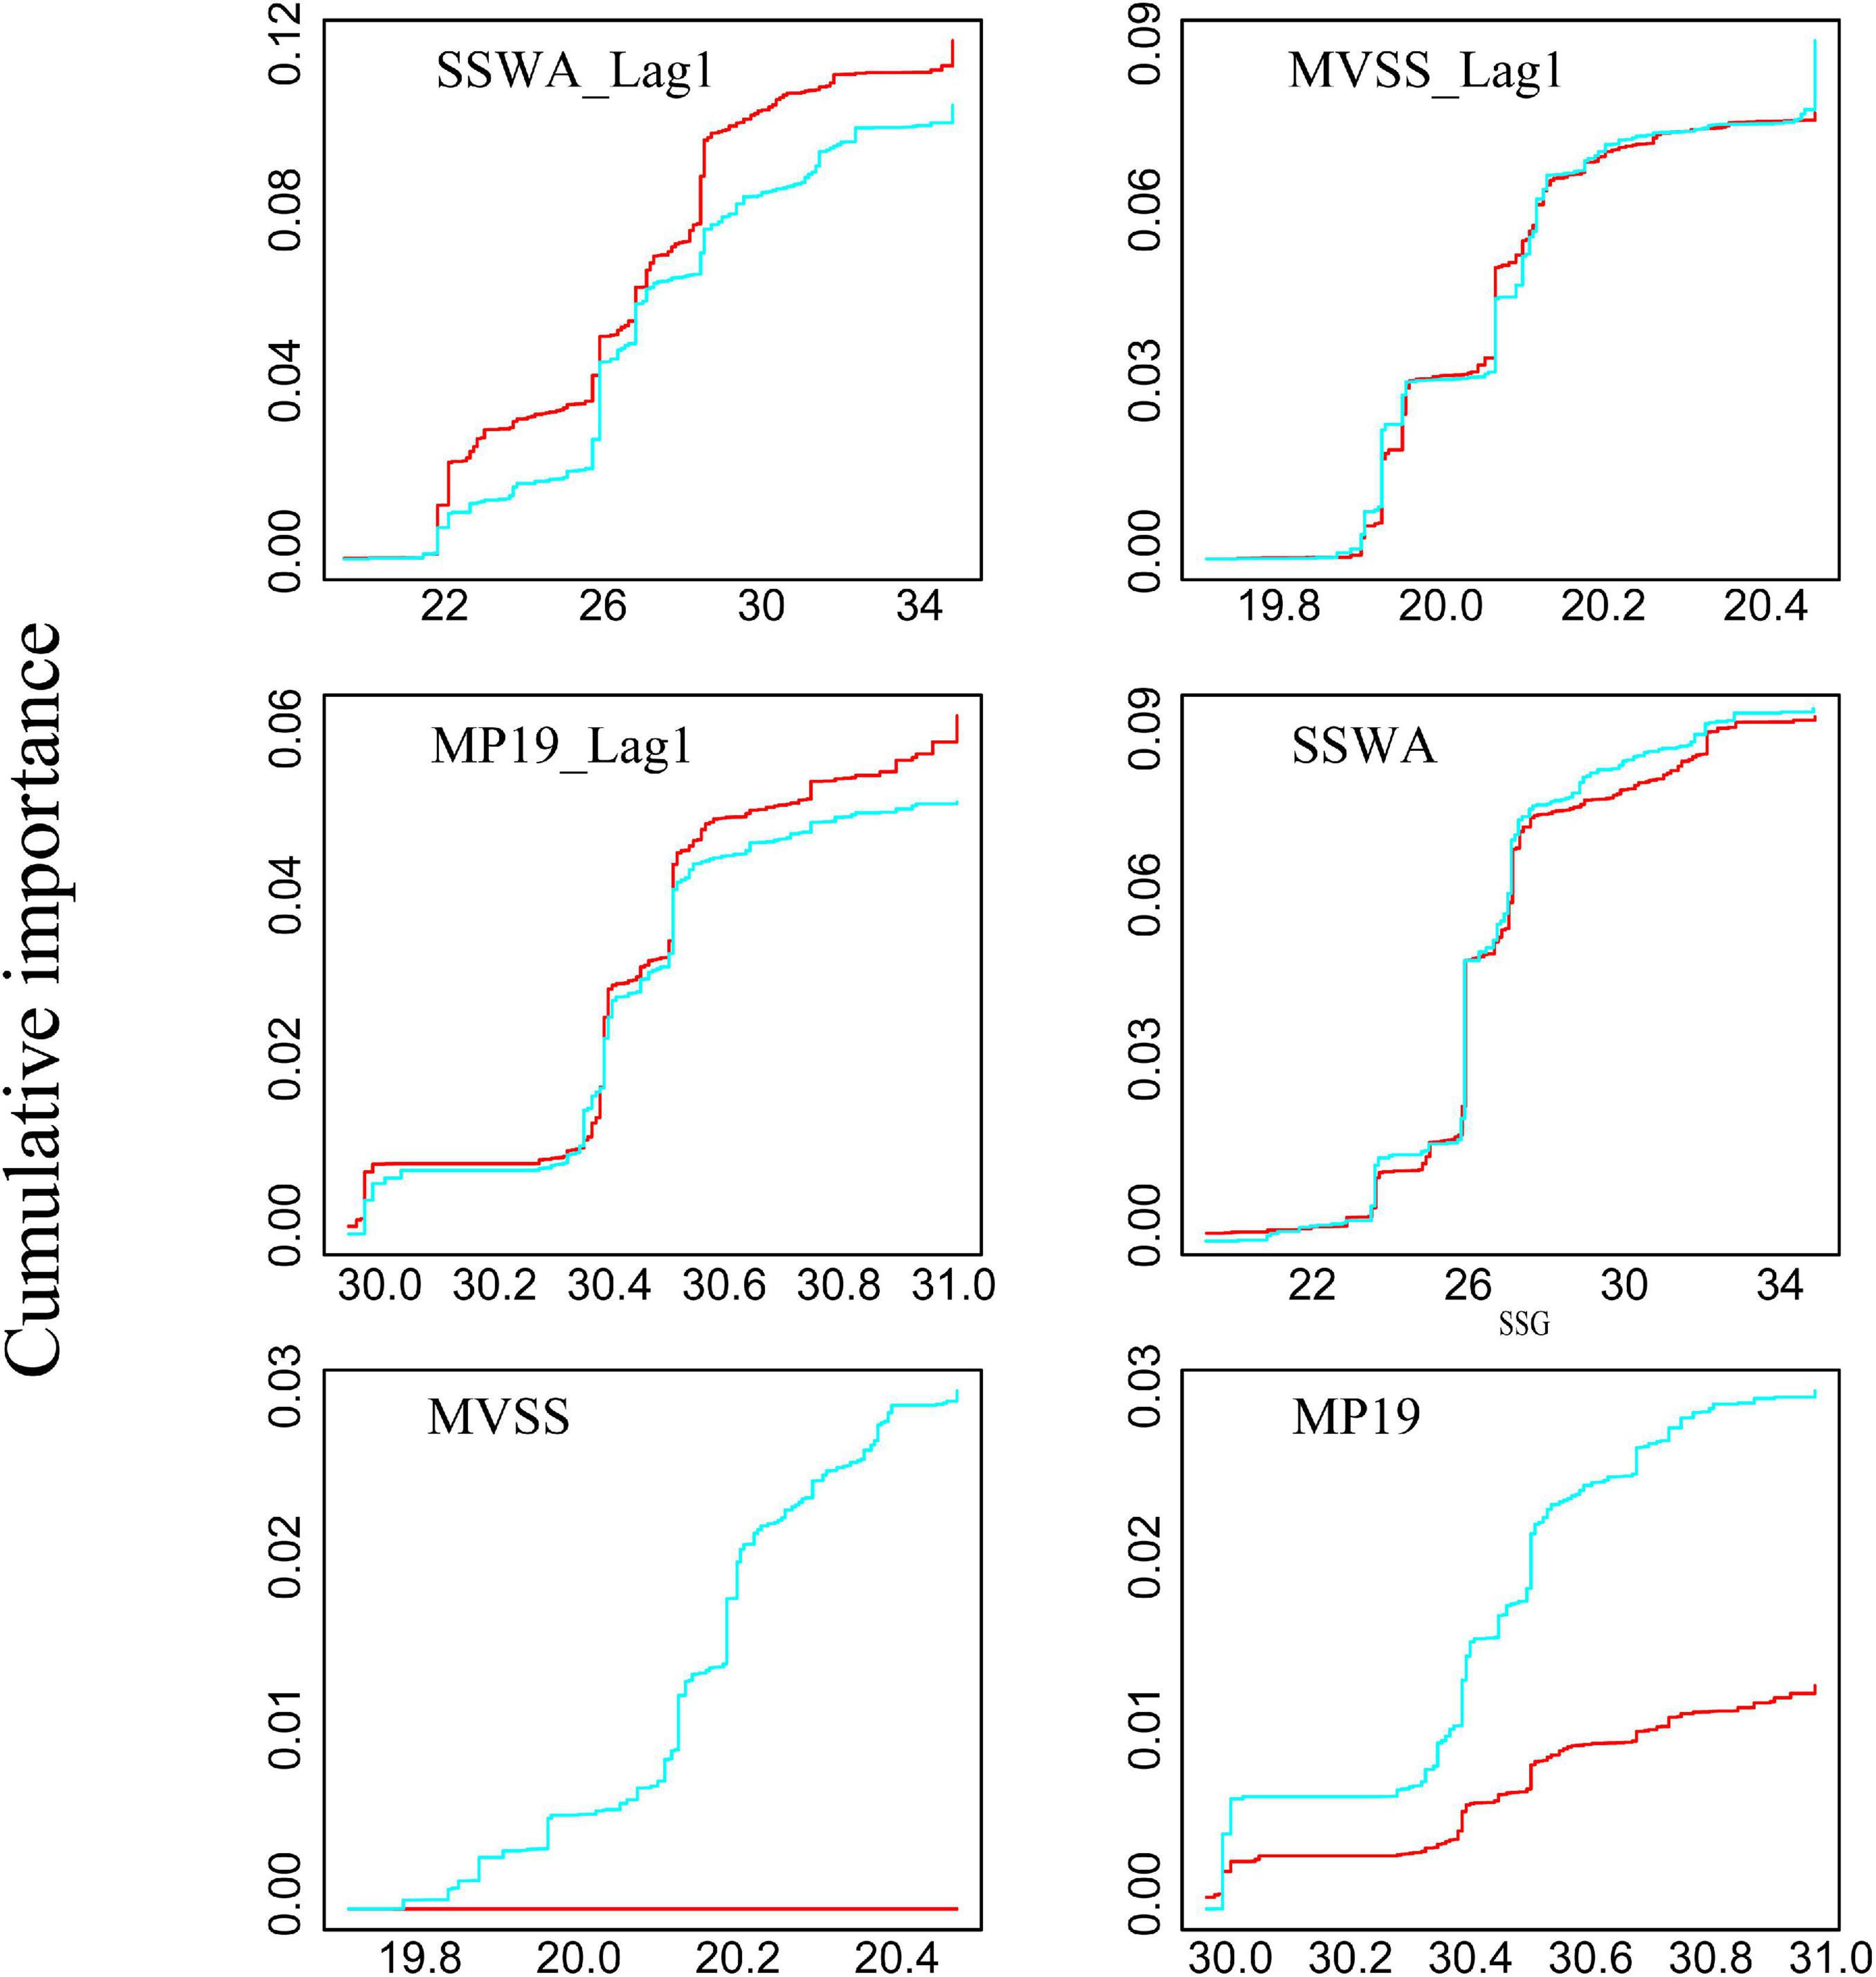
Figure 8. Cumulative importance of catch (red line) and CPUE (blue line) in response to spawning ground indices.
Discussion
Effects of Spawning Ground Dynamics on Japanese Flying Squid
The spawning period of Japanese flying squid lasted from summer to winter, of which the winter cohort is the most important due to its large biomass (Kawabata et al., 2006). In this study, the spawning ground indices represented different aspects of its dynamic potential spawning ground. In particular, the size and spatial distributions of SSA were shown to potentially impact the winter cohort abundance of Japanese flying squid (Sakurai et al., 2002; Rosa et al., 2011; Yu et al., 2018). Such studies, however, have not addressed the effects of SST variability on squid’s spawning and survival rates. Therefore, we used the modified SSWA to represent the spatial-temporal variation of dynamic potential spawning ground. SSWA showed a synchronous increasing trend with the winter cohort abundance of Japanese flying squid in 1990/1991 (Figures 3, 6A2 and Table 4), implying that the abundance accrued when the SSWA contracted. The most prominent signal in SSWA is the simultaneous decline during 2014/2015 with Japanese catch and CPUE (Figures 3, 6A2, Table 4), indicating that stocks decreased when the SSWA contracted. Synchronous regime shifts suggested that the increase in SSWA could be favorable to enhance the winter squid cohort abundance, and vice versa.
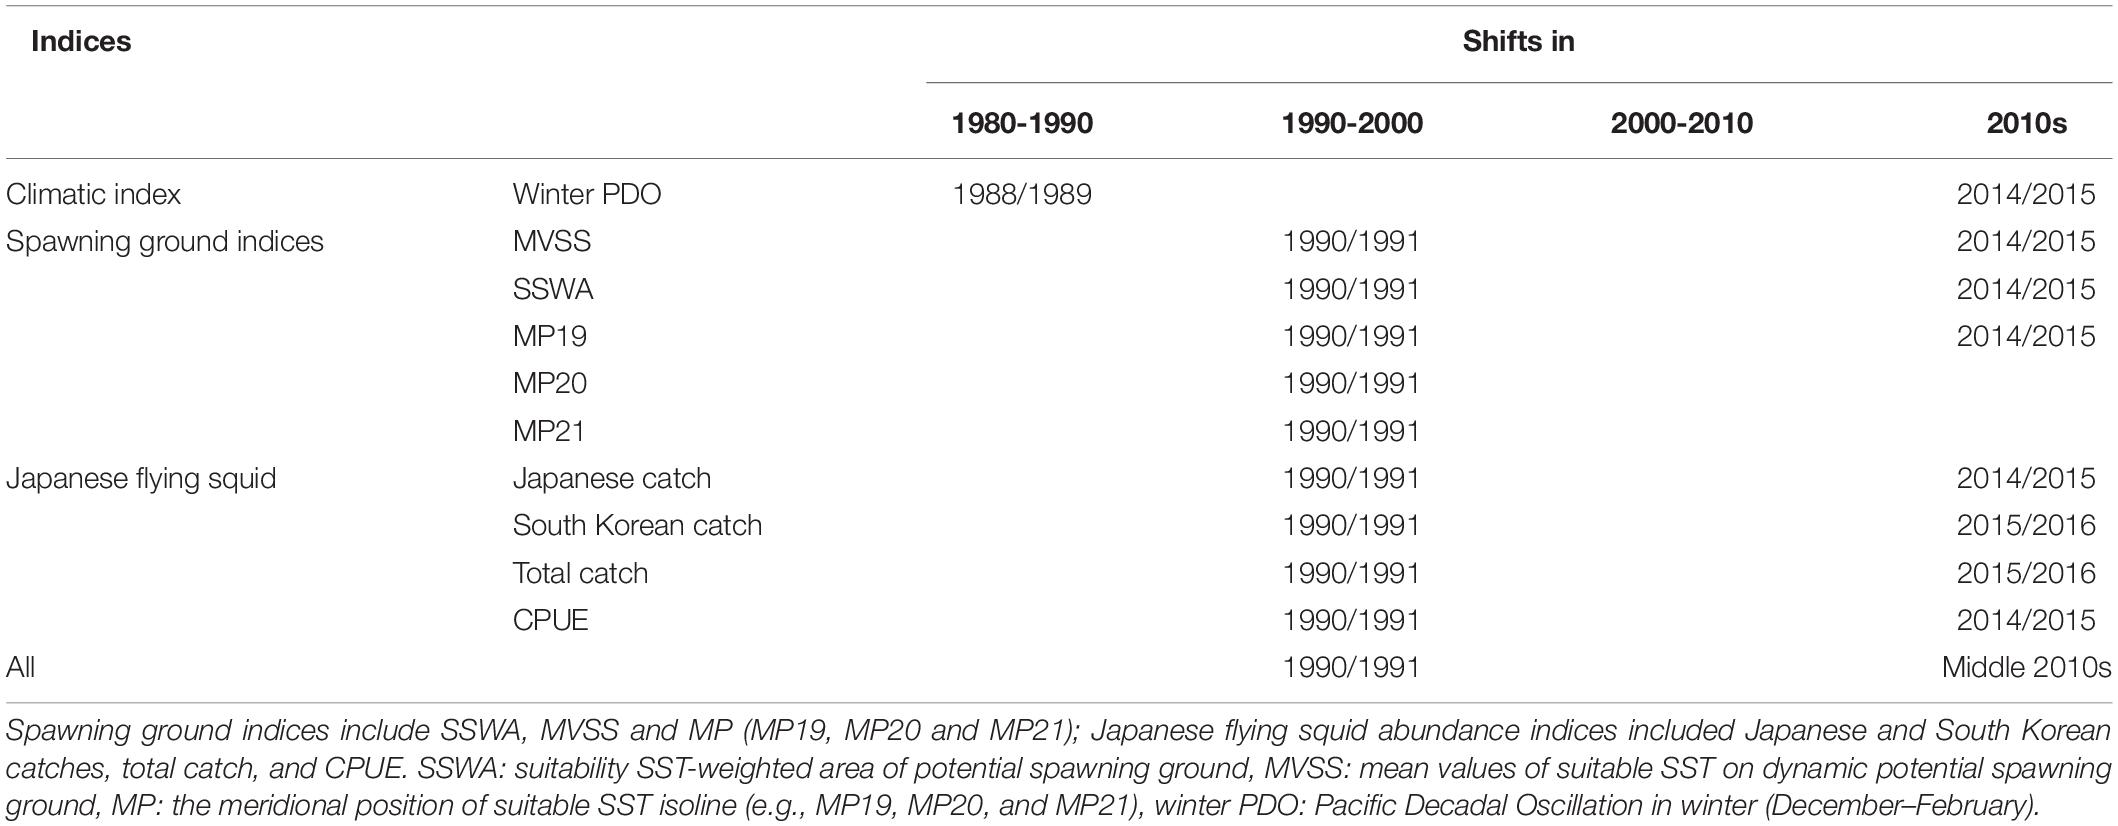
Table 4. List of regime shifts detected by SRSD in various indices during 1979 to 2018.
GradientForest analyses clearly showed that SSWA is the most important predictor of the squid’s relative abundance (Figure 7). The cumulative importance analysis also highlighted that the robust threshold responses for CPUE in SSWA and SSWA_Lag1 occurred between 26 and 28. CPUE was significantly more sensitive than catch in the SSWA, suggesting that SSWA can better predict CPUE (Figure 8). This is in agreement with the results of the regime shift analysis (Table 4). Besides, CPUE of adult squid, a potential proxy for spawning-stock biomass (SSB) and fishing mortality (F) (Probst and Oesterwind, 2014), is positively correlated with the abundance of larvae in the following year (Okutani and Watanabe, 1983). Thus, CPUE appears to be a more suitable abundance index than catches (Sakurai et al., 2000).
The spatial distribution of dynamic potential spawning ground revealed a slight decline in the winter squid cohort abundance when the discontinuity of the spawning ground in the East China Sea in 1990 was minimized in 1991 (Figure 5), consistent with results of an earlier study (Rosa et al., 2011). However, another regime shift (i.e., 2015/2016) was not observed in SSWA, suggesting that SSWA fluctuation could not completely account for the variation in winter cohort abundance.
Japanese flying squid abundance depends largely on recruitment success, regulated by environmental conditions in the potential spawning grounds (Sakurai et al., 2000). Likewise, spawning stock abundance also affects recruitment in the following year. For example, if the abundance of spawning parental squid was low in the previous year, the recruitment abundance will also be low in the subsequent year. Besides, targeted fishing intensity along the spawning migration route is also a vital factor affecting recruitment. SST is considered an important factor to squid abundance as it affects its life history, particularly its spawning and survival rates (Bower and Sakurai, 1996; Sakurai et al., 1996, 2000; Sakurai, 2006; Kidokoro and Sakurai, 2008; Yamamoto et al., 2012; Ji et al., 2020). An earlier study of spawning ground indices emphasized the important influence of SST on abundance changes within a fixed range of spawning ground (Liu et al., 2019). However, it was not able to incorporate information on the effect of temperature changes to the size of the squid spawning ground (Sakurai et al., 2000). Our results highlighted that the range of potential spawning grounds varied with SST, submarine elevation and spawning period with synchronous abundance changes during 1990/1991, 2014/2015 (Figures 3, 6B2 and Table 4). Moreover, both CPUE and catch responded to the change in MVSS_Lag1 (Figure 7), potentially due to the one-year lag between spawning to fishing (Rosa et al., 2011). These results revealed that an increase in MVSS enhanced winter cohort abundance, and vice versa. It also coincided with results of earlier studies where catches increased and decreased during warm and cold regimes, respectively (Minobe, 1997; Sakurai et al., 2000, 2002; Ji et al., 2020). The simultaneous increase of SST and survival rates in the former resulted to an enhanced stock size of T. pacificus (Ji et al., 2020). Significant positive correlation between MVSS and SSWA suggests similar fluctuation patterns (Table 3).
We also applied a series of MP indices to elucidate variations of the entire potential spawning ground of winter squid cohort. The northward advance of the three MP indices (MP19, MP20, and MP21) is coincident with the increase in winter cohort abundance during 1990/1991, albeit MP19 is accompanied with a drop in abundance in 2014/2015 (Figures 3, 6C2–E2 and Table 4). These suggest that northward shifts in MP indices enhance the abundance of winter squid cohort. CPUE and catch also responded well to changes in both MP19_Lag1 and MP19 while CPUE was slightly more sensitive than catch (Figure 8). These findings are consistent with those from previous studies reporting CPUE as a better abundance index for winter cohort than annual catches (Okutani and Watanabe, 1983; Murata, 1989, 1990). Significant positive correlations among all the spawning ground indices in the potential spawning ground (Table 3) indicated that increases in both SSWA and MVSS resulted to the northward shift of suitable SST isotherm. This resulted to a northward movement of potential squid spawning ground. As the Japanese flying squid migrates north to its feeding area around Hokkaido after spawning and hatching (Kasahara, 1978), northward shifts of MP indices could facilitate the migration of juveniles to their feeding grounds through the northward-flowing current (Ji et al., 2020), thereby increasing feeding success and recruitment.
Over all, the spawning ground indices corresponded well with fluctuations in the winter cohort abundance, capturing the pronounced increasing trend in 1990/1991 and decreasing trends in recent years. Due to the lack of optimal spawning temperature, it seems most likely that a series of MP indices reflected the variations of potential spawning ground rather than the optimal position.
Possible Controlling Mechanism of Climate-Ocean Effect on Abundance
Being an opportunistic and climate-sensitive species, squid abundance and distribution are highly influenced by climate change (Rodhouse, 2001). Earlier studies have shown that the PDO influences the abundance and recruitment of marine taxa such as the North Pacific albacore (Thunnus alalunga), Pacific sardine (Sardinops sagax), market squid (Doryteuthis opalescens), and spear squid (Loligo bleekeri) (Mantua et al., 1997; Koslow and Allen, 2011; Tian et al., 2013; Phillips et al., 2014; Zwolinski and Demer, 2014). However, based on the gradientForest analyses, the relative importance of the PDO index to squid catch and CPUE was negligible, indicating that a single PDO index could not fully account for the fluctuation of the winter cohort abundance of Japanese flying squid. Regime shifts in catch and CPUE of winter squid cohort from 1979 to 2018 were observed during 1990/1991 and 2014/2015. However, potential spawning ground showed larger and continuous spatial extents during positive regime shift years (1991–2014) across the different periods (1979–1990, 1991–2014, and 2015–2018; Figure 9). The connection of East China Sea to the southern coasts of Japan is considered as one of the most important factors to the squid stock recruitment (Sakurai et al., 2000). In contrast, potential spawning ground is discontinuous during negative regime shift years (1979–1990, 2015–2018), characterized by low squid catch and CPUE. Additionally, SST shifts are also crucial manifestations of climate-driven change along with Kuroshio axis variations (Liu et al., 2019). Thus, we constructed a series of spawning ground indices using SST with PDO to propose a possible mechanism controlling the changes in squid abundance. The gradientForest analysis showed that spawning ground indices (i.e., SSWA, MVSS, and MP19) were indeed essential predictors of changes in winter cohort abundance (Figure 7). Simultaneous regime shifts (Table 4) and strong correlations (Table 3) were observed in winter squid cohort abundance and indices (e.g., PDO and spawning ground indices) from 1979 to 2018. From these observations, we proposed a potential control mechanism explaining the fluctuations in the abundance of Japanese flying squid. PDO-based climate regimes led to SST changes, modifying the size and location of dynamic potential spawning ground crucial for spawning and recruitment success, consequently impacting the abundance of the Japanese flying squid. Hence, fluctuations in catch and CPUE from 1979 to 2018 could be largely explained by the changes in the spawning ground indices.
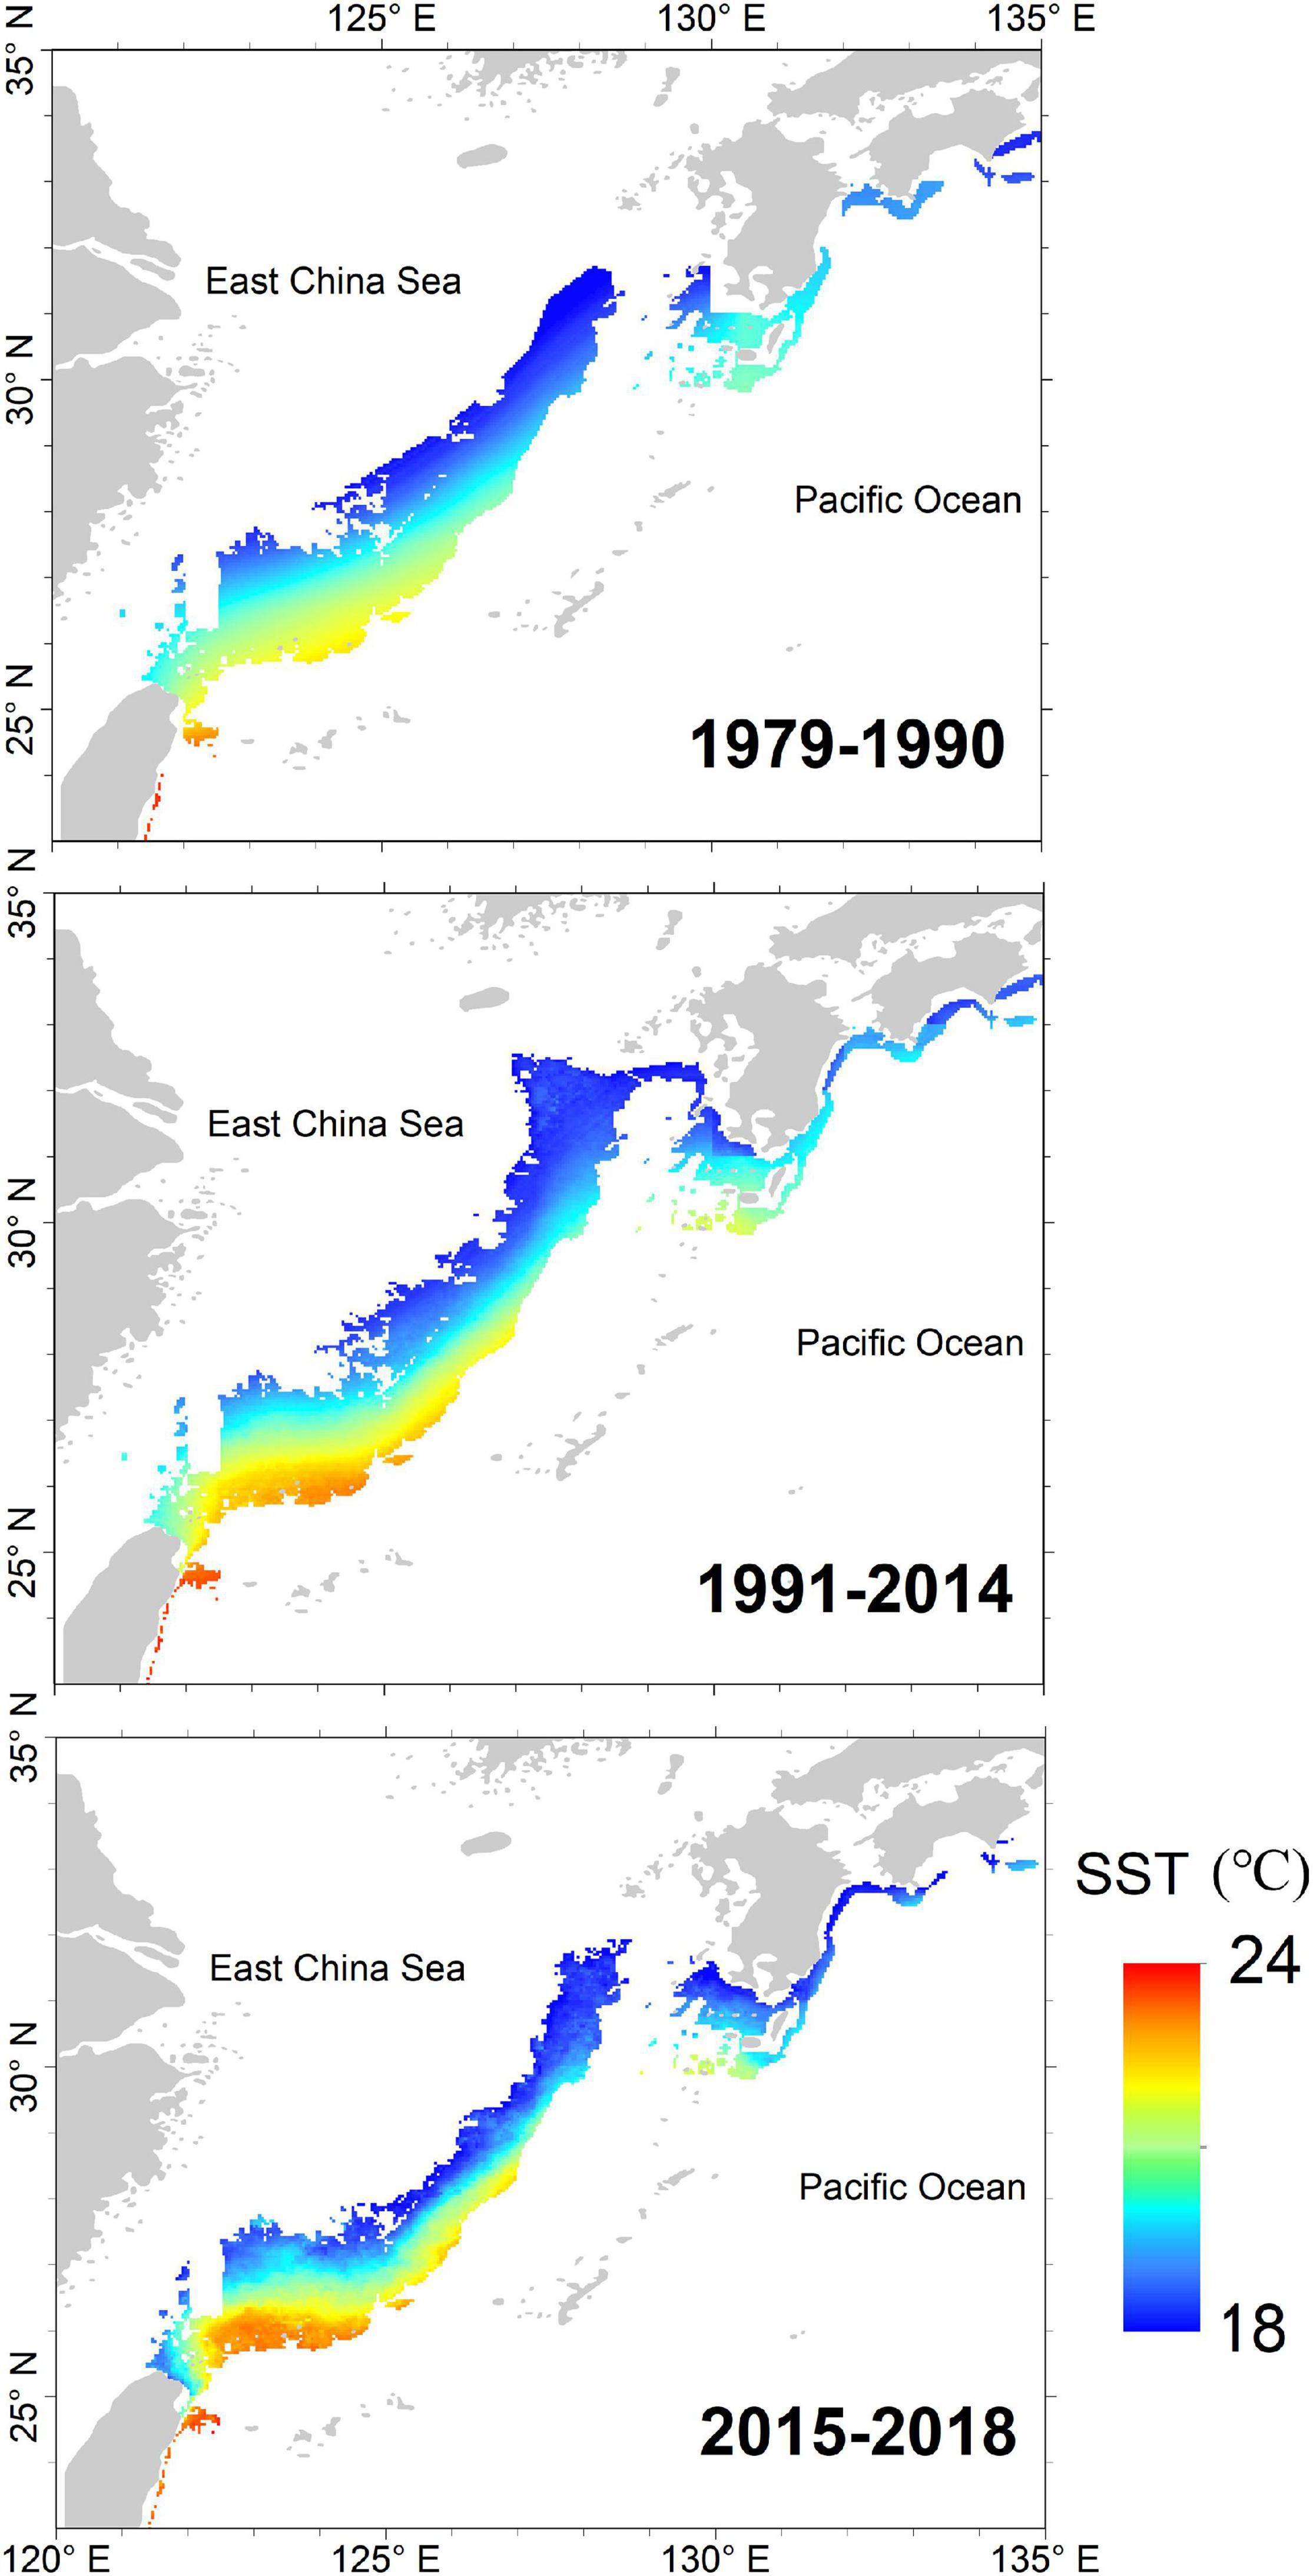
Figure 9. The average potential spawning ground of winter cohort of Japanese flying squid during the three identified regimes: 1979–1990, 1991–2014, and 2015–2018.
Further, it is worth noting that Russian and Chinese catch data were excluded from this study due to their short data series and small percentage of contribution to squid fishery. However, these data may still have a contribution to the abundance variation of the winter cohort of Japanese flying squid.
It has become clear that not only environmental conditions but also fishing pressure affect the abundance of Japanese flying squid. With overfishing and the increase of fishing vessels with squid-jigging and large freezing machines, the winter cohort abundance remained low throughout the 1980s. After taking appropriate management measures (e.g., total allowable catch management plan) and improving environmental conditions, the winter cohort abundance has gradually recovered. However, the winter cohort abundance is again at a low level in recent years. Therefore, sustainable development of squid fishery must balance an understanding of the fishing effort and environmental conditions since both fishing and environmental pressures can cause fluctuations in stock size.
In the future, resource managers could predict squid production in the Japan Sea by monitoring the change of spawning ground indices, and will allow them to adjust the size of fishing areas and the magnitude of fishing intensity. Fishery managers could further use the results of this study to estimate the appropriate stock size and propose appropriate management measures to promote resource recovery.
Conclusion
To clarify the mechanism behind the long-term variability of winter cohort abundance of Japanese flying squid, we constructed a series of spawning ground indices based on the annual dynamic potential spawning ground, incorporating the diverse aspects of its spawning site. Synchronized regime shifts were identified in abundance, spawning ground, and climate indices in 1990/1991 and in recent years. These spawning ground indices significantly accounted for changes in winter cohort abundance of Japanese flying squid, characterized by an increase and decrease in abundance in 1990/1991 and in recent years, respectively. Consequently, our study provided an explanation on the sharp abundance decline of the Japanese flying squid in the Northwestern North Pacific, potentially caused by unfavorable conditions in its spawning grounds.
Our proposed annual dynamic potential spawning ground indices were identified using multiple environmental parameters (SST, bottom topography data and mean Kuroshio axis). However, inclusion of more physical variables (e.g., Chl a concentration, mixed layer depth, and wind stress) to the model could further improve its predictive performance and should be explored in constructing spawning ground indices in the future.
Data Availability Statement
The raw data supporting the conclusions of this article will be made available by the authors, without undue reservation.
Author Contributions
YL conceived the idea for the study and analyses and wrote the manuscript. XX performed the data analyses and wrote the manuscript. IA reviewed and edited the earlier versions of the manuscript. SM and PS edited the manuscript. S-IS and YT reviewed and edited the manuscript. All authors listed have made a direct and substantial contribution to this work.
Funding
This study was supported by National Key R&D Program of China (2018YFD0900902) and National Natural Science Foundation of China (41930534 and 41976210).
Conflict of Interest
The authors declare that the research was conducted in the absence of any commercial or financial relationships that could be construed as a potential conflict of interest.
Footnotes
- ^ http://abchan.fra.go.jp
- ^ http://abchan.fra.go.jp/index1.html
- ^ https://psl.noaa.gov/
- ^ https://oceancolor.gsfc.nasa.gov/
- ^ https://www.ngdc.noaa.gov/
- ^ https://www.ncdc.noaa.gov/teleconnections
- ^ https://sites.google.com/site/climatelogic/
References
Alabia, I. D., Dehara, M., Saitoh, S. I., and Hirawake, T. (2016). Seasonal habitat patterns of japanese common squid (Todarodes Pacificus) inferred from satellite-based species distribution models. Remote Sens. 8:921. doi: 10.3390/rs8110921
Beamish, R. J., Noakes, D. J., McFarlane, G. A., Klyashtorin, L., Ivanov, V. V., and Kurashov, V. (1999). The regime concept and natural trends in the production of Pacific salmon. Can. J. Fish. Aquat. Sci. 56, 516–526. doi: 10.1139/cjfas-56-3-516
Bower, J. R., and Sakurai, Y. (1996). Laboratory observations on Todarodes pacificus (Cephalopoda: Ommastrephidae) egg masses. Am. Malacol. Bull. 13, 65–71.
Bower, J. R., Nakamura, Y., Mori, K., Yamamoto, J., Isoda, Y., and Sakurai, Y. (1999). Distribution of Todarodes pacificus (Cephalopoda Ommastrephidae) paralarvae near the Kuroshio off southern Kyushu. Jpn. Mar. Biol. 135, 99–106.
Cui, K.-C., Liu, W., Gao, W.-Y., Li, P.-L., Wang, J.-L., and Tang, F.-J. (2019). Suitability index construction and weight analysis for the spawning ground of Oncorhynchus keta. Shengtaixue Zazhi 38, 3762–3770. doi: 10.13292/j.1000-4890.201912.031
Ellis, N., Smith, S. J., and Pitcher, C. R. (2012). Gradient forests: calculating importance gradients on physical predictors. Ecology 93, 156–168. doi: 10.1890/11-0252.1
Hamabe, M. (1966). Ecological studies on the common squid Todarodes pacificus STEENSTRUP, mainly in the southwestern waters of the Japan Sea. Bull. Jpn. Sea Reg. Fish. Res. Lab. 16, 13–55.
Ji, F., Guo, X., Wang, Y., and Takayama, K. (2020). Response of the Japanese flying squid (Todarodes pacificus) in the Japan Sea to future climate warming scenarios. Clim. Chang. 159, 601–618. doi: 10.1007/s10584-020-02689-3
Kasahara, S. (1978). Descriptions of offshore squid angling in the Sea of Japan, with special reference to the distribution of common squid (Todarodes pacificus Steenstrup); and on the techniques for forecasting fishing conditions. Bull. Jpn. Sea Reg. Fish. Res. Lab. 29, 179–199.
Kawabata, A., Yatsu, A., Ueno, Y., Suyama, S., and Kurita, Y. (2006). Spatial distribution of the Japanese common squid. Todarodes Pacificus, During Northward Migration Western North Pacific Ocean. Fish. Oceanogr. 15, 113–124. doi: 10.1111/j.1365-2419.2006.00356.x
Kidokoro, H., and Sakurai, Y. (2008). Effect of water temperature on gonadal development and emaciation of Japanese common squid Todarodes pacificus (Ommastrephidae). Fish. Sci. 74, 553–561. doi: 10.1111/j.1444-2906.2008.01558.x
Koslow, J. A., and Allen, C. (2011). The influence of the ocean environment on the abundance of market squid, doryteuthis (loligo) opalescens, paralarvae in the southern California bight. Calif. Coop. Ocean. Fish. Invest. Rep. 52, 205–213.
Lehodey, P., Alheit, J., Barange, M., Baumgartner, T., Beaugrand, G., Drinkwater, K., et al. (2006). Climate variability, fish, and fisheries. J. Clim. 19, 5009–5030. doi: 10.1175/jcli3898.1
Liu, S., Liu, Y., Fu, C., Yan, L., Xu, Y., Wan, R., et al. (2019). Using novel spawning ground indices to analyze the effects of climate change on Pacific saury abundance. J. Mar. Syst. 191, 13–23. doi: 10.1016/j.jmarsys.2018.12.007
Liu, Z., and Gan, J. (2012). Variability of the Kuroshio in the East China Sea derived from satellite altimetry data. Deep Sea Res. Part I Oceanogr. Res. Pap. 59, 25–36. doi: 10.1016/j.dsr.2011.10.008
Ma, S., Cheng, J., Li, J., Liu, Y., Wan, R., and Tian, Y. (2019). Interannual to decadal variability in the catches of small pelagic fishes from China Seas and its responses to climatic regime shifts. Deep Sea Res. Part Ii Top. Stud. Oceanogr. 159, 112–129. doi: 10.1016/j.dsr2.2018.10.005
Mantua, N. J., Hare, S. R., Zhang, Y., Wallace, J. M., and Francis, R. C. (1997). A Pacific interdecadal climate oscillation with impacts on salmon production. Bull. Am. Meteorol. Soc. 78, 1069–1079. doi: 10.1175/1520-04771997078<1069:Apicow>2.0.Co;2
Miller, A. J., Chai, F., Chiba, S., Moisan, J. R., and Neilson, D. J. (2004). Decadal-scale climate and ecosystem interactions in the North Pacific Ocean. J. Oceanogr. 60, 163–188. doi: 10.1023/b:Joce.0000038325.36306.95
Minobe, S. (1997). A 50-70 year climatic oscillation over the North Pacific and North America. Geophys. Res. Lett. 24, 683–686. doi: 10.1029/97gl00504
Kaga, T., Yamashita, N., Okamoto, S., and Hamatsu, Y. (2019). Report of Evaluation of the Resources of the Winter Cohort of Todarodes pacificus in 2019. Sapporo, Hokkaido: Central Fisheries Research Institute, 27.
Murata, M. (1989). “Population assessment, management and fishery forecasting for the Japanese common squid, Todarodes pacificus,” in Marine Invertebrate Fisheries: Their Assessment and Managemen, ed. J. F. Caddy (Hoboken NJ: John Wiley & Sons, Ltd).
Murata, M. (1990). Oceanic resources of squids. Mar. Behav Physiol. 18, 19–71. doi: 10.1080/10236249009378779
Okutani, T., and Watanabe, T. (1983). Stock Assessment by Larval Surveys of the Winter Population of Todarodes pacificus Steenstrup (Cephalopoda: Ommastrephidae), with a Review of Early Works. Biol. Oceanog. 2, 401–431.
Overland, J., Rodionov, S., Minobe, S., and Bond, N. (2008). North Pacific regime shifts: Definitions, issues and recent transitions. Prog. Oceanogr. 77, 92–102. doi: 10.1016/j.pocean.2008.03.016
Overland, J. E., Alheit, J., Bakun, A., Hurrell, J. W., Mackas, D. L., and Miller, A. J. (2010). Climate controls on marine ecosystems and fish populations. J. Mar. Syst. 79, 305–315. doi: 10.1016/j.jmarsys.2008.12.009
Phillips, A. J., Ciannelli, L., Brodeur, R. D., Pearcy, W. G., and Childers, J. (2014). Spatio-temporal associations of albacore CPUEs in the Northeastern Pacific with regional SST and climate environmental variables. ICES J. Mar. Sci. 71, 1717–1727. doi: 10.1093/icesjms/fst238
Probst, N. W., and Oesterwind, D. (2014). How good are alternative indicators for spawning-stock biomass (SSB) and fishing mortality (F)? ICES J. Mar. Sci. 71, 1137–1141. doi: 10.1093/icesjms/fst207
Puneeta, P., Vijai, D., Yamamoto, J., and Sakurai, Y. (2018). Orientation patterns of japanese flying squid Todarodes pacificus embryos within egg masses and responses of paralarvae to light. Zool. Sci. 35, 293–298. doi: 10.2108/zs170199
R Core Team (2017). R: A Language and Environment for Statistical Computing. Vienna, Australia: R Foundation for Statistical Computing. Available online at: http://www.R-project.org/
Rodhouse, P. G. (2001). Managing and forecasting squid fisheries in variable environments. Fish. Res. 54, 3–8. doi: 10.1016/s0165-7836(01)00370-8
Rodionov, S. N. (2005). “A sequential method for detecting regime shifts in the mean and variance,” in Large-scale Disturbances (Regime Shifts) and Recovery in Aquatic Ecosystems: Challenges for Management Toward Sustainability, eds V. Velikova and N. Chipev (Varna: UNESCO), 68–72.
Rodionov, S. N. (2004). A sequential algorithm for testing climate regime shifts. Geophys. Res. Lett. 31:L09204. doi: 10.1029/2004gl019448
Rosa, A. L., Yamamoto, J., and Sakurai, Y. (2011). Effects of environmental variability on the spawning areas, catch, and recruitment of the Japanese common squid, Todarodes pacificus (Cephalopoda: Ommastrephidae), from the 1970s to the 2000s. ICES J. Mar. Sci. 68, 1114–1121. doi: 10.1093/icesjms/fsr037
Sakurai, Y. (2006). “How climate change might impact squid populations and ecosystems: a case study of the Japanese common squid, Todarodes pacificus,” in The Role of Squid in Open Ocean Ecosystems eds Olson, J. R., and Young, J. W. (Honolulu, Hawaii, USA: GLOBEC), 33–34.
Sakurai, Y., Bower, J. R., Nakamura, Y., Yamamoto, S., and Watanabe, K. (1996). Effect of temperature on development and survival of Todarodes pacificus embryos and paralarvae. Am. Malacol. Bull. 13, 89–95.
Sakurai, Y., Kidokoro, H., Yamashita, N., Yamamoto, J., Uchikawa, K., and Takahara, H. (2013). “Todarodes pacificus, Japanese Common Squid,” in Advances in Squid Biology, Ecology and Fisheries: Part II-Oegopsid Squids, eds R. Rui, O. D. Ron, and P. Graham (New York NY: Nova Science Publishers Inc), 249–275.
Sakurai, Y., Kiyofuji, H., Saitoh, S.-I., Yamamoto, J., Goto, T., Mori, K., et al. (2002). Stock fluctuations of the Japanese common squid, Todarodes pacificus, related to recent climate changes. Fish. Sci. 68, 226–229. doi: 10.2331/fishsci.68.sup1_226
Sakurai, Y., Kiyofuji, H., Saitoh, S., Goto, T., and Hiyama, Y. (2000). Changes in inferred spawning areas of Todarodes pacificus (Cephalopoda : Ommastrephidae) due to changing environmental conditions. ICES J. Mar. Sci. 57, 24–30. doi: 10.1006/jmsc.2000.0667
Takahara, H., Kidokoro, H., and Sakurai, Y. (2017). High temperatures may halve the lifespan of the Japanese flying squid, Todarodes pacificus. J. Nat. History 51, 2607–2614. doi: 10.1080/00222933.2016.1244297
Tian, Y., Kidokoro, H., Watanabe, T., Igeta, Y., Sakaji, H., and Ino, S. (2012). Response of yellowtail, Seriola quinqueradiata, a key large predatory fish in the Japan Sea, to sea water temperature over the last century and potential effects of global warming. ICES J. Mar. Sci. 91, 1–10. doi: 10.1016/j.jmarsys.2011.09.002
Tian, Y., Nashida, K., and Sakaji, H. (2013). Synchrony in the abundance trend of spear squid Loligo bleekeri in the Japan Sea and the Pacific Ocean with special reference to the latitudinal differences in response to the climate regime shift. ICES J. Mar. Sci. 70, 968–979. doi: 10.1093/icesjms/fst015
Tian, Y., Uchikawa, K., Ueda, Y., and Cheng, J. (2014). Comparison of fluctuations in fish communities and trophic structures of ecosystems from three currents around Japan: synchronies and differences. ICES J. Mar. Sci. 71, 19–34. doi: 10.1093/icesjms/fst169
Tian, Y., Ueno, Y., Suda, M., and Akamine, T. (2004). Decadal variability in the abundance of Pacific saury and its response to climatic/oceanic regime shifts in the northwestern subtropical Pacific during the last half century. J. Mar. Syst. 52, 235–257. doi: 10.1016/j.jmarsys.2004.04.004
Yamamoto, J., Miyanaga, S., Fukui, S. I., and Sakurai, Y. (2012). Effect of temperature on swimming behavior of paralarvae of the Japanese common squid Todarodes pacificus. Bull. Jpn. Soc. Fish. Oceanogr. 76, 18–23.
Yamashiro, T. (1993). Mean position and deviation of the Kuroshio axis in the East China Sea. Umi Sora 69, 125–134.
Yu, W., Zhang, Y., Chen, X., Yi, Q., and Qian, W. (2018). Response of winter cohort abundance of Japanese common squid Todarodes pacificus to the ENSO events. Acta Oceanol. Sin. 37, 61–71. doi: 10.1007/s13131-018-1186-4
Yu, Z., Metzger, E. J., Hurlburt, H. E., and Smedstad, O. M. (2019). What controls the extreme flow through the Kerama Gap: a global HYbrid Coordinate Ocean Model reanalysis point of view. Ocean. Dyn. 69, 899–911. doi: 10.1007/s10236-019-01284-0
Zhang, X., Saitoh, S.-I., and Hirawake, T. (2017). Predicting potential fishing zones of Japanese common squid (Todarodes pacificus) using remotely sensed images in coastal waters of south-western Hokkaido, Japan. Int. J. Remote Sens. 38, 6129–6146. doi: 10.1080/01431161.2016.1266114
Keywords: Japanese flying squid, abundance, spawning ground indices, PDO, regime shifts, SST
Citation: Liu Y, Xia X, Tian Y, Alabia ID, Ma S, Sun P and Saitoh S-I (2021) Influence of Spawning Ground Dynamics on the Long-Term Abundance of Japanese Flying Squid (Todarodes pacificus) Winter Cohort. Front. Mar. Sci. 8:659816. doi: 10.3389/fmars.2021.659816
Received: 29 January 2021; Accepted: 04 May 2021;
Published: 26 May 2021.
Edited by:
Eduardo Almansa, Spanish Institute of Oceanography (IEO), SpainReviewed by:
Daniel Oesterwind, Thünen-Institut, GermanyDharmamony Vijai, National Centre for Biological Sciences, India
Copyright © 2021 Liu, Xia, Tian, Alabia, Ma, Sun and Saitoh. This is an open-access article distributed under the terms of the Creative Commons Attribution License (CC BY). The use, distribution or reproduction in other forums is permitted, provided the original author(s) and the copyright owner(s) are credited and that the original publication in this journal is cited, in accordance with accepted academic practice. No use, distribution or reproduction is permitted which does not comply with these terms.
*Correspondence: Yongjun Tian, eWp0aWFuQG91Yy5lZHUuY24=; Irene D. Alabia, aXJlbmVhbGFiaWFAYXJjLmhva3VkYWkuYWMuanA=