 Dong-Jiing Doong
 Yang-Ming Fan
 Jin Yih Chen3
95% of researchers rate our articles as excellent or good
Learn more about the work of our research integrity team to safeguard the quality of each article we publish.
Find out more
ORIGINAL RESEARCH article
Front. Mar. Sci. , 16 April 2021
Sec. Coastal Ocean Processes
Volume 8 - 2021 | https://doi.org/10.3389/fmars.2021.657569
This article is part of the Research Topic Coastal Extension of CMEMS Products. Models, Data and Applications View all 24 articles
A service platform (referred to as Taiwan Marine Environment Monitoring Service) was designed to integrate marine environmental parameters, including wind, wave, tide, current and temperature components, from in-situ and remote sensing observations, ship reports and numerical models to support the safety of various marine-related activities in Taiwanese waters. Independent modules were developed and plugged into the platform to facilitate advanced analyses via the safe sea, particle tracking module, extreme waves, oil spill simulation, tsunami warning (TW), sea level rise, dangerous swell warning (DSW), and SST drop modules. This paper introduces the service platform and DSW and TW module analysis methods. A real-time analysis method for tsunami height is developed and validated; a criterial analysis of hazardous swells is also performed. This service platform is now in operation and has served more than 10 governmental institutions and numerous members of the public in Taiwan.
The demand for oceanographic data has dramatically increased in recent years. They are widely used for various objectives, such as engineering design, environmental protection, hazard mitigation, navigation, and fishery industry application, etc. Oceanographic data are collected using both in-situ methods and remote sensing. In recent decades, various numerical models have also provided an enormous amount of simulation data covering large areas and long durations. When such data are well organized, processed or analyzed, they become meaningful information and can be used by end users. In order to present the information in a friendly and visualization environment, the geographical information systems (GIS) enable users to process and better portray the oceanographic data in an efficient and rapid manner (Barszczynska et al., 2005; Dyras and Serafin-Rek, 2005; Shareef, 2014).
There are many data centers established by governmental institutions, universities or research organizations worldwide. For example, the UNESCO IOC (Intergovernmental Oceanographic Commission) established the International Oceanographic Data and Information Exchange program1 in 1961 to enhance marine research and development by enabling the exchange of oceanographic data and information between different countries; the United States National Oceanographic Data Center2, created by National Oceanic and Atmospheric Administration (NOAA), acquires, processes, preserves, and disseminates oceanographic data and was merged to form the National Centers for Environmental Information in 2015 (Sun, 2018). The British Oceanographic Data Centre3 maintains and develops a national oceanographic database, which consists of a collection of marine datasets originating mainly from United Kingdom research establishments. Black Sea Observing and Forecasting System was developed in the region of Black Sea under the support of EU project (Palazov et al., 2019). The European Union Framework seven project NETMAR (Open Service Network for Marine Environmental Data), established in 2010, aimed to develop a European Marine Information System for searching, downloading and integrating satellite, in-situ and model data from ocean and coastal areas. NETMAR also enables further processing of such data to generate composite products and statistics suitable for decision-making in diverse marine application domains (Leadbetter et al., 2014). The European Commission has set up the Copernicus Marine Environment Monitoring Service (CMEMS) in 2015 to deliver near real-time data on the physical state, variability and dynamics of ocean and marine ecosystems on a global level to help better understand earth-ocean dynamics and sustainably manage the environment (Aznar et al., 2016; Mason et al., 2019; Storto et al., 2019; Traon et al., 2019). The data are based on both satellite and in-situ observations, which are mainly derived from ground-based, sea-borne, or air-borne monitoring systems. The CMEMS monitors past and current marine conditions and provides short-term forecasts to service various marine applications, including marine safety, marine resources, coastal and marine environments and weather, and climate forecasting.
Taiwan is surrounded by the Pacific Ocean to the east, the East China Sea to the north, and the South China Sea to the southeast and has a coastline covering 1,988 km. More than 90% of inhabitants live within 100 km of the coast. The developments in economic, traffic and recreational activities in Taiwan are strongly linked with the surrounding oceans. However, Taiwan is one of the most vulnerable areas in the world and frequently suffers from natural disasters (Dilley et al., 2005). Sea-related hazards are mainly triggered by monsoons in winter and typhoons (tropical cyclones) in summer, including extreme waves (EW), storm surges, destructive swells, coastal flooding, and SST drop (SD; Doong et al., 2015; Hsu et al., 2015; Chen and Liu, 2016; Chang et al., 2018; Yu Y.-C. et al., 2019; Hsiao S.-C. et al., 2020; Huang et al., 2020; Kuo et al., 2020). The potential risk maps for typhoon-induced waves have been used to identify vulnerable areas along the coast of Taiwan (Chien et al., 2012; Huang et al., 2018; Shih et al., 2018). Taiwan is also located in an earthquake-prone area. Earthquakes cause displacement of the sea floor and generate tsunamis, which acts as another threat to Taiwan (Ando et al., 2015; Cheng et al., 2016). People cannot stop the occurrence of natural hazards; however, warning systems could reduce the effects of such disasters (Lin et al., 2015; Necmioglu, 2016; Smith and Juria, 2019; Rahayu et al., 2020). A coastal ocean monitoring network was established in 1998 in Taiwanese waters to provide real-time oceanographic data for disaster mitigation applications (Doong et al., 2007; Doong et al., 2012; Chen, 2019). With the prosperity of various marine activities and industries, the frequency of disasters has also increased, so that government departments must do something to make marine activities safer. Therefore, the motivation of this study is to provide scientific information for government departments responsible for disaster prevention in a short time and relief as a decision reference for warning and response to marine disasters. A platform for marine environment monitoring services including not only self-measured data but also data collected worldwide was established in 2020. In addition to the direct use of data, several warning subsystems are plugged into the platform for data processing and analysis to provide additional information. The purpose of this paper is to report the design of the service platform and describe the establishment of warning subsystems for ocean long waves, which include tsunamis and destructive swells.
The objective the Taiwan Marine Environment Monitoring Service (TwMEMS) is enhancing maritime safety, informing coastal and marine hazard services, and supporting climate services. TwMEMS is an integrated operational system. The structure of TwMEMS is shown in Figure 1. The observations (in-situ and remote sensing) and model results (analyses and forecasts) of the physical elements of the ocean, such as wind, waves, currents, tides (sea level) and temperature, are imported into the system, as shown in the data integration part of Figure 1. These data (remote sensing and model) cover the range of the Northwest Pacific, which from 110 degrees to 160 degrees east longitude and 5 degrees to 40 degrees north latitude. And the location of field stations is displayed on the web page whether it is a fixed stations or ships within above area. These data will be removed from unreasonable data through quality control before application. The wide coverage of real-time data has already supported several services, such as navigation, ocean recreation, such as surfing, diving and sea canoeing, and fishing. Real-time data can also support the construction of sub- warning systems, including safe sea (SS), the particle tracking module (PTM), EW, oil spill simulation (OSS), tsunami warning (TW), sea level rise (SLR), dangerous swell warning (DSW), and SD and systems. The PTM is used to forecast possible locations at which people who drop into the sea from the coasts or ships could be. The potential users of PTM include rescue authorities such as the Coastal Guard. A similar module, the OSS, was specifically designed for OSS. The Environmental Protection Agency (EPA) and Harbor Bureaus urgently needs simulation results when oil-related accidents occur. The TW system is used to analyze sea level fluctuations triggered by tsunamis. The DSW system was developed to warn the appropriate parties of hazardous swells. This information is helpful for the safe navigation of cruise ships and other coastal activities.
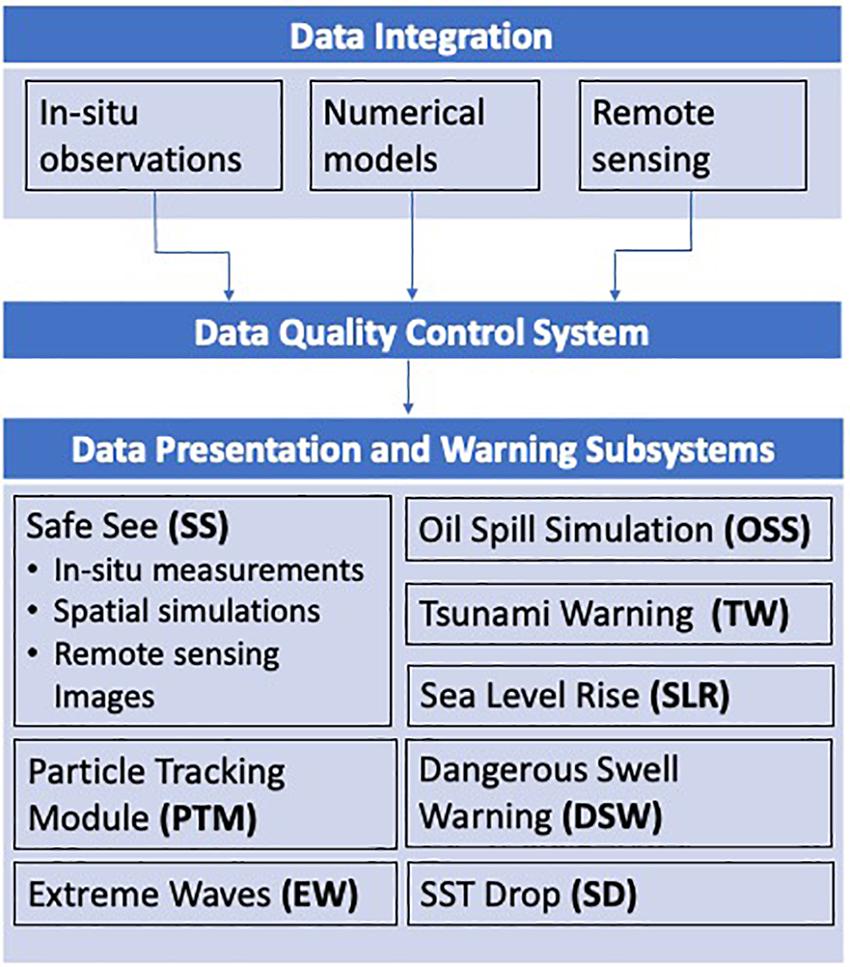
Figure 1. Schematic diagram of the system.
The TwMEMS utilizes a web service that was built on the Red Hat Enterprise Linux Server release 5.5 with the Apache Web Server v2.0. Several of the latest IT tools or languages, including PHP, JavaScript, SHELL, Fortran and Python, have been used to develop the data display, query and online analysis function based on GIS. The database was constructed in MySQL. This is the first generation and has been continuously developed since 2020. The next generation will be developed considering user feedback and requests from authorities.
Taiwan Marine Environment Monitoring Service was developed by the Central Weather Bureau (CWB) of Taiwan. The service integrates in-situ data from 55 field stations (buoys and tide stations) set up by different authorities in Taiwan, 13 Tsunami DART buoys from the United States NOAA, over 100 ship reports and a large number of Argo drifting buoys from the WMO. In-situ data include wind (gust, mean wind speed, and direction), wave (significant wave height, period, direction, and spectrum), current (speed and direction), and tidal parameters, as well as sea surface temperature (SST), sea surface height (SSH), pressure and other marine weather elements. Most of the data are transmitted to the system in real time every hour. Table 1 shows the list of data imported into TwMEMS.
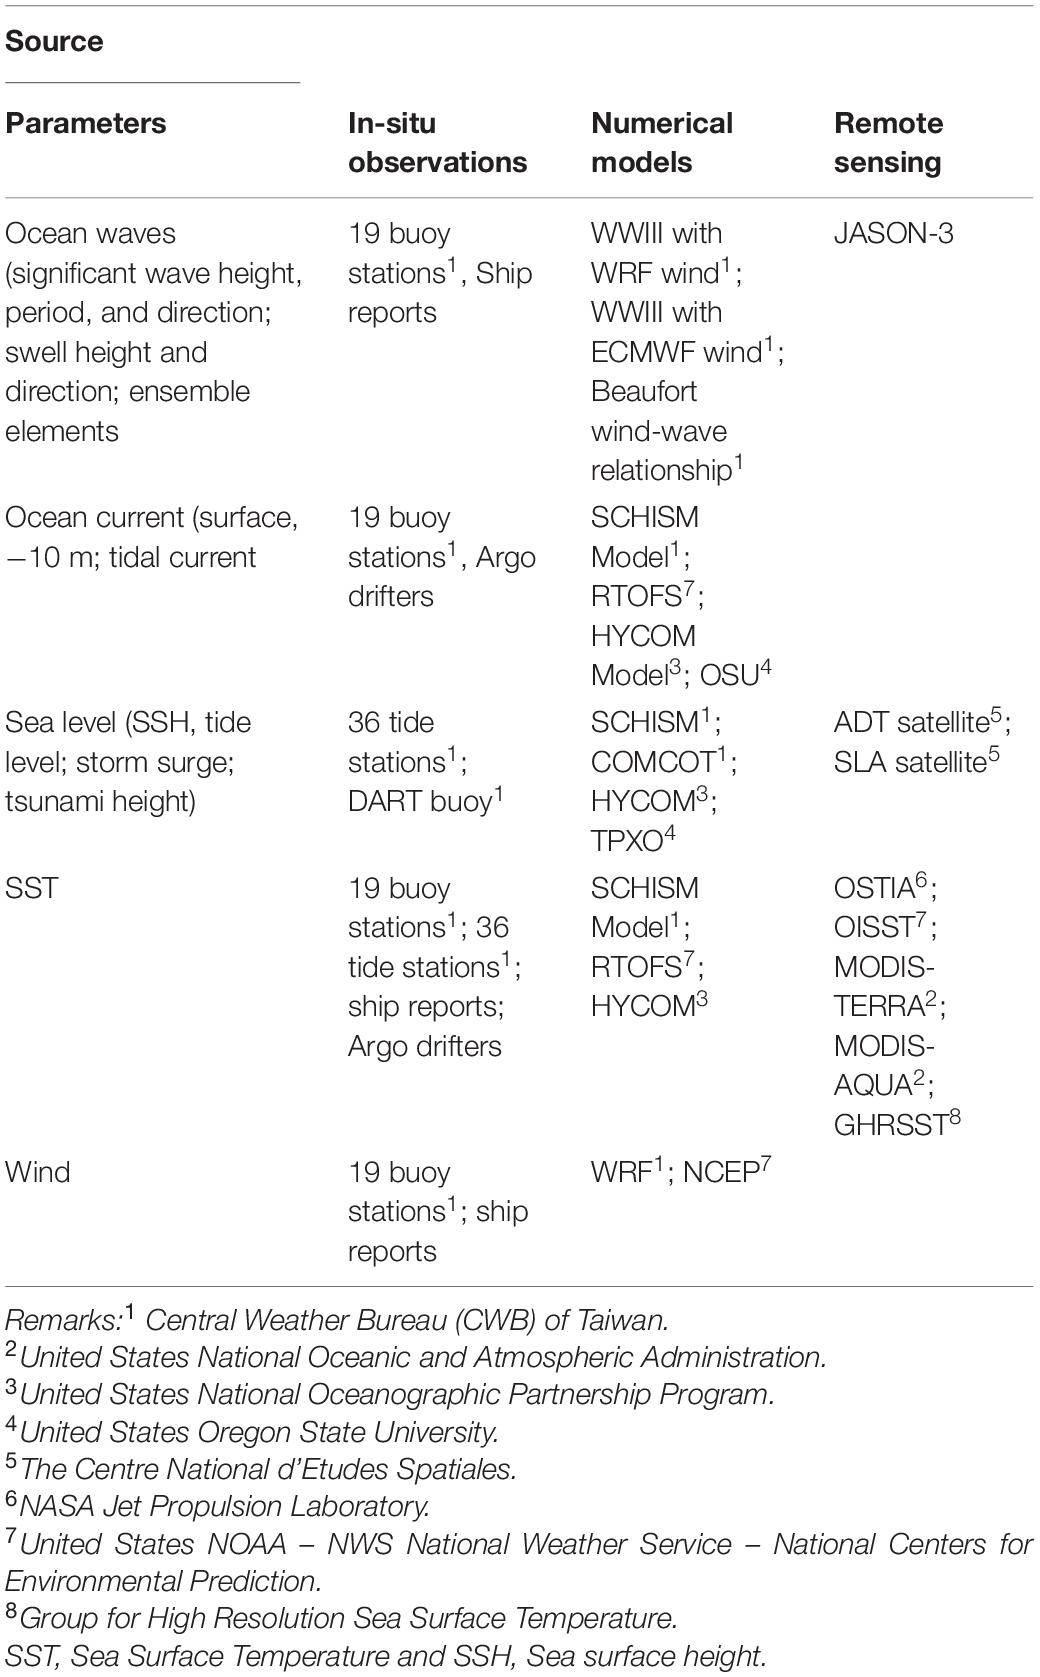
Table 1. The list of data (in-situ, remote sensing and model results) that have been imported into TwMEMS.
In-situ data show the real-time conditions of sea states; however, they lack spatial coverage. Data from numerical models are another important part of TwMEMS. TwMEMS imports all ocean-related model results from the CWB. The CWB uses the WAVEWATCH III (WWIII) model to simulate the wave distribution of the eastern Asian area (110°–160°E; 5°–40°N; Lee et al., 2009). Both wind fields from the CWB-developed WRF (Weather Research Forecasting; Hsiao L.-F. et al., 2020) and ECMWF models are used to drive the WWIII model. It forecasts the significant parameters of wave and swell information for the following 84 h with a temporal resolution of 1 h and a spatial resolution of 10 km and is updated 4 times per day. The CWB also runs the ocean model SCHISM (Semi-implicit Cross-scale Hydroscience Integrated System Model) to forecast the ocean current, SSH and SST for the next 84 h with a temporal resolution of 1 h and a spatial resolution of 1/40° but is updated only 1 time per day (Yu H. et al., 2019). During typhoon seasons, the CWB runs the COMCOT (Cornell Multi-grid Coupled Tsunami Model) to simulate storm surge (Wu et al., 2017). It has been developed using the operational process approach and is coupled with the dynamic atmospheric WRF model and global tidal TPXO model with the resolution of 200 meters at coastal regions. In addition to self-running models provided by the CWB, TwMEMS also imports several open-access model results from other institutions. TwMEMS receives ocean current, SSH, SST, and salinity data from the HYCOM (HYbrid Coordinates Ocean Model; Bleck, 2002), which is run by the National Ocean Partnership Program of the United States Global Ocean Data Assimilation Experiment. The model results for the eastern Asian area are extracted and imported into TwMEMS. The data are updated daily with a 3 hourly time resolution and a 1/12° spatial resolution (Smedstad et al., 2010). Another source of ocean currents and SSTs is the global operational RTOFS (Real-Time Ocean Forecast System; Garraffo et al., 2020), which is run by the United States National Centers for Environmental Prediction. The outputs from the ocean tidal model TPXO (Egbert et al., 1994; Dushaw et al., 1997) run by United States Oregon State University are also imported. TPXO uses eight primary (M2, S2, N2, K2, K1, O1, P1, and Q1), two long period (Mf and Mm), and 3 non-linear (M4, MS4, and MN4) harmonic constituents to generate the sea surface elevation and current estimates (Egbert and Erofeeva, 2002).
The main page of TwMEMS is shown in Figure 2. The left panel of the page contains the available service items, and data sources can be selected in the right panel. The middle window shows the results, including a direct data presentation (in-situ observations and spatial distributions from models) with a time bar at the bottom. The vector data (wind, wave, and current) in the system are shown by floating arrows used to evaluate the dynamics of these data. The service platform is password protected. Public users do not need passwords, but the functions are limited. The main services are reserved for more than 10 governmental institutions, including the CWB, Coastal Guard Agency, EPA, Water Resources Agency, Ocean Affair Council, and Tourism Bureau. Private enterprises can also apply to use these services.
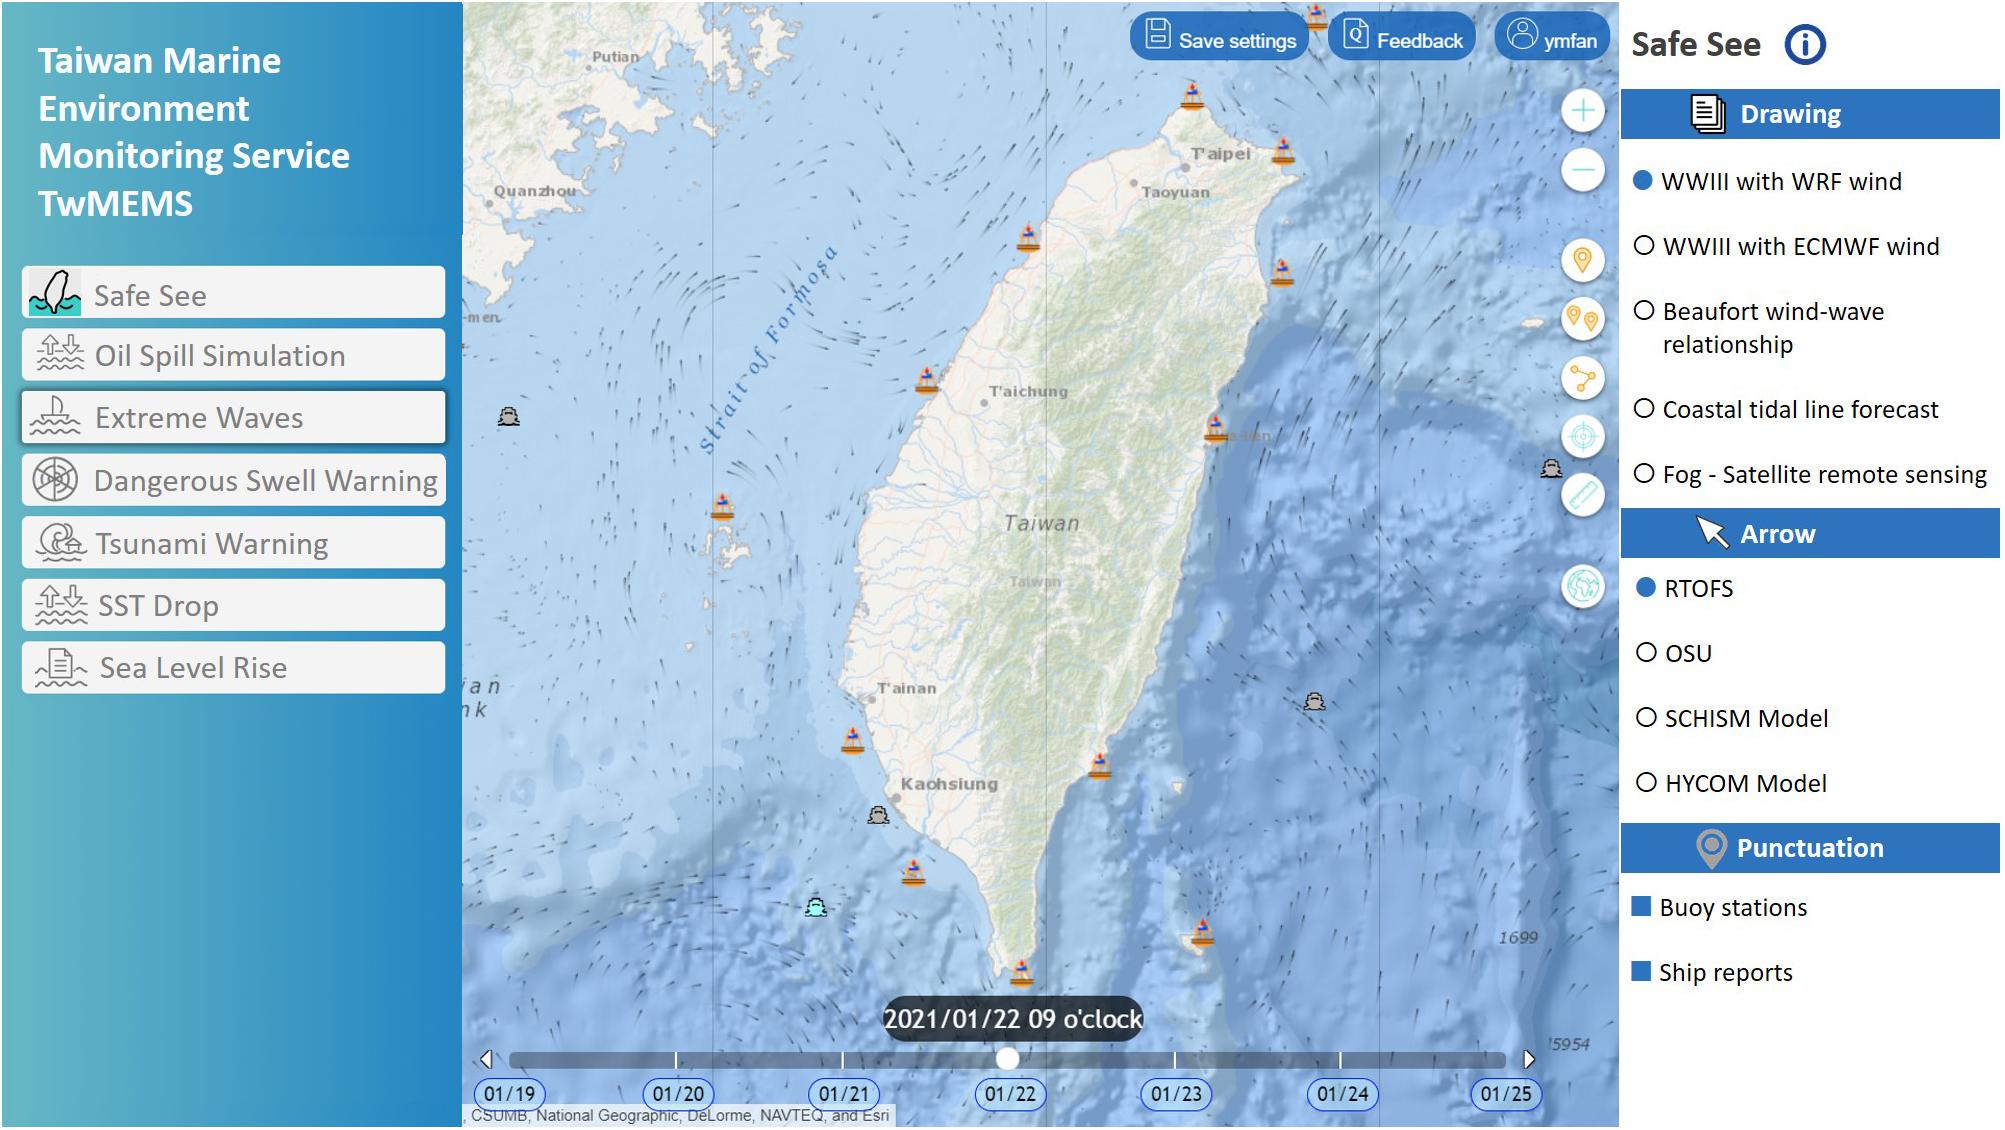
Figure 2. Main page of TwMEMS (TwMEMS is a Chinese language system. For international publication, part of the pages is translated to English).
Marine traffic is busy between the main island of Taiwan and its offshore islands. Ocean recreation activities, such as swimming, diving, surfin, and canoeing, are also very popular. The fishery industry is fullly developed in Taiwan. TwMEMS provides safe information for those participants. The direct display of the data in an accessible form is already sufficient for most of those users. Advanced functions, such as providing sea state conditions on cruise routes, are popular for certain users as they are able to define cruise routes as shown in Figure 3, and the wind, wave, and current status of the route for the next 72 h can be obtained, as shown in Figure 4. A feedback function is designed to invite the user to assess the bias of real conditions with forecasted (model) results if the Internet can be accessed. Figure 5 shows the services available for divers. All data are presented at the assigned locations. The current conditions and tidal changes are specifically shown because of their importance to divers. The users can also self-define a warning threshold, and the TwMEMS will give an alarm when the forecast exceeds it.
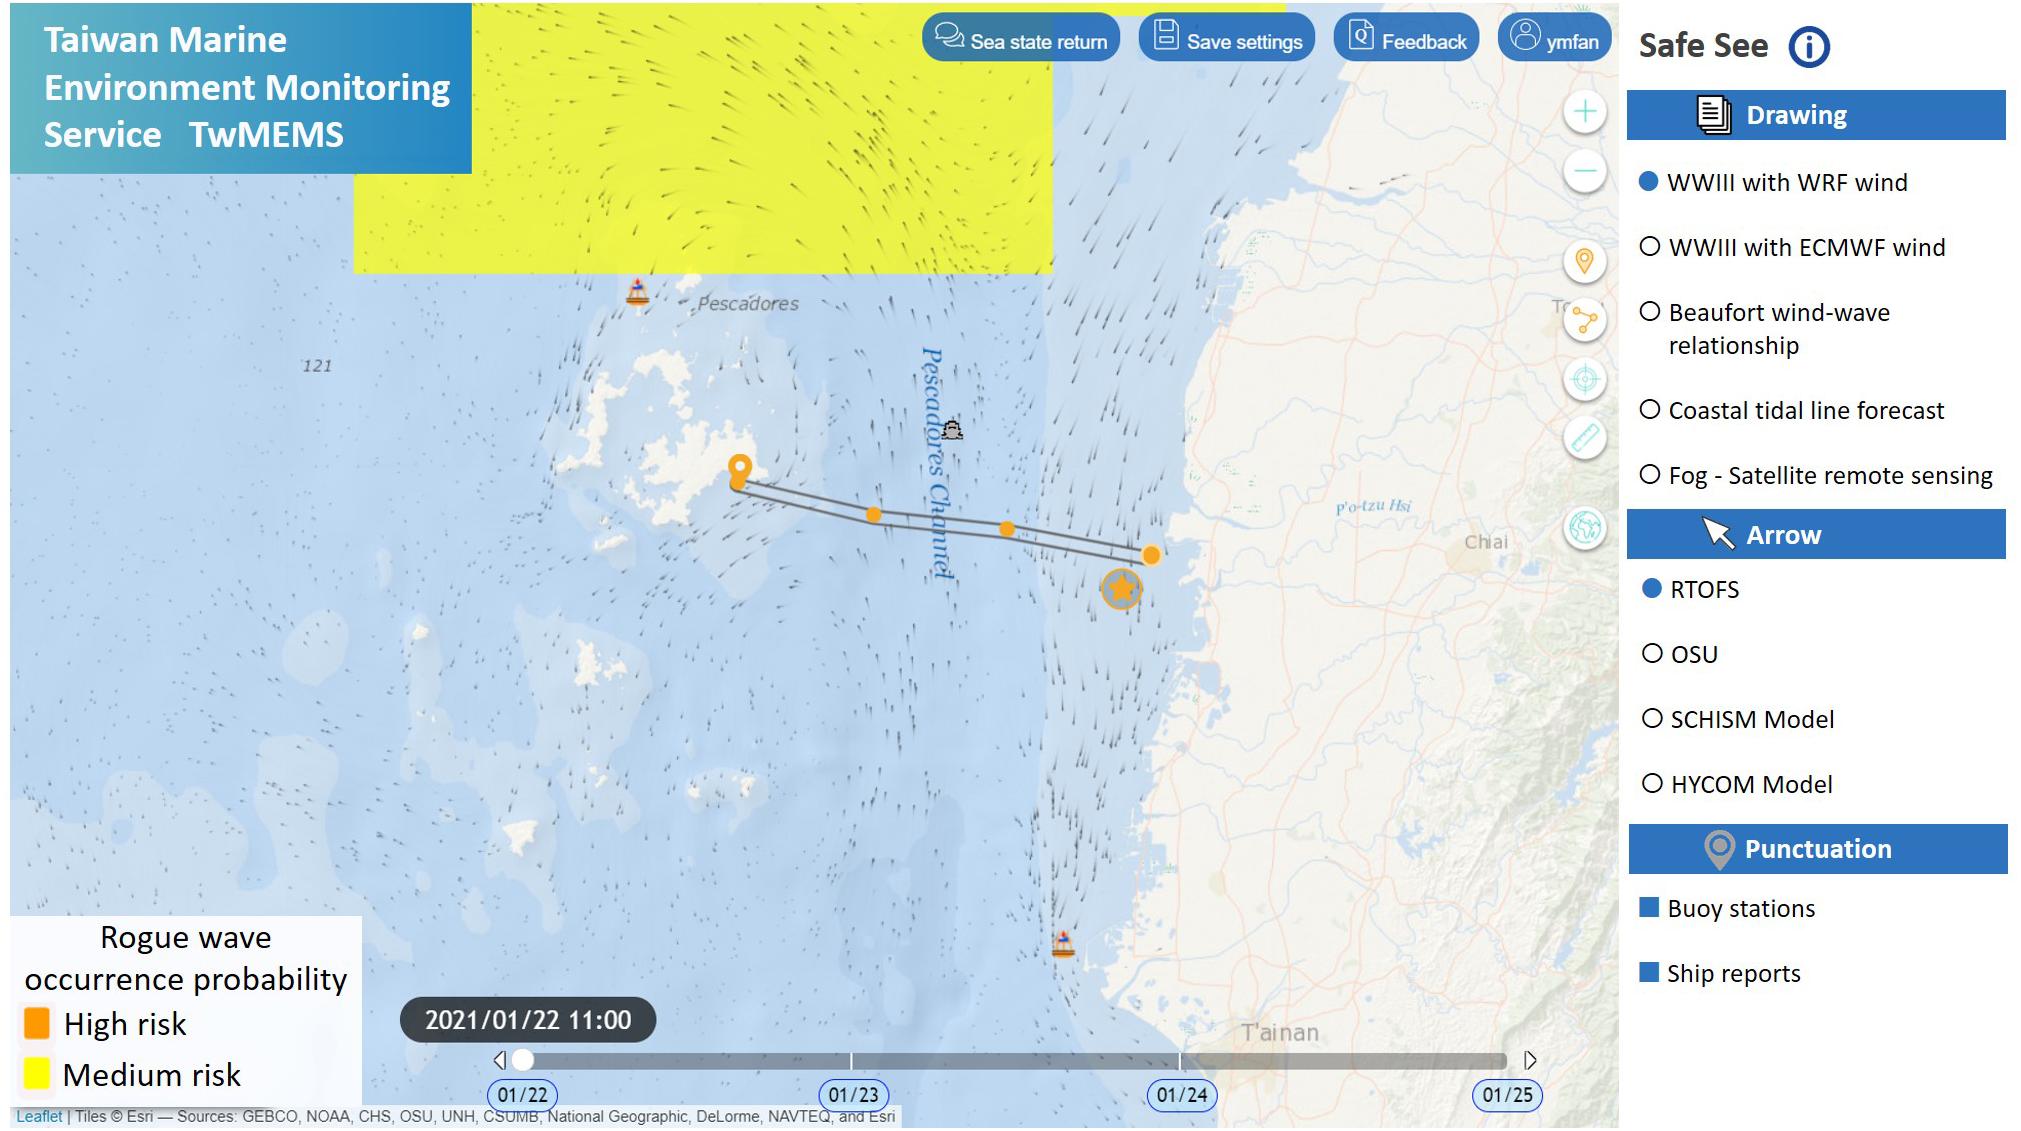
Figure 3. Snapshot of using the service for self-defined cruise sea states in the TwMEMS Safe Sea function.
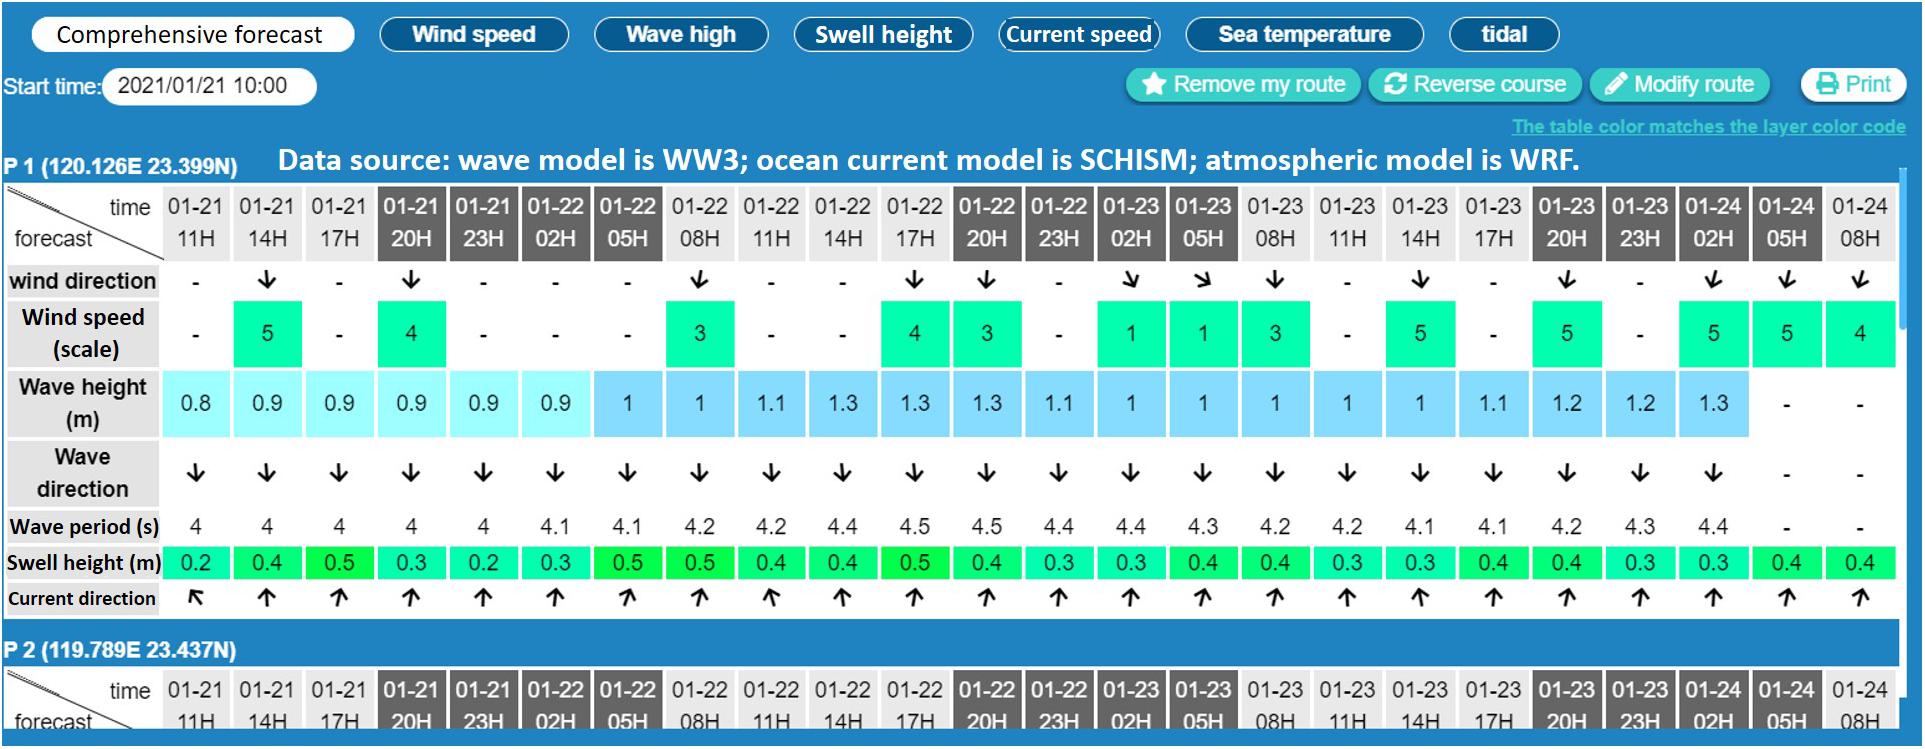
Figure 4. List of sea states (wind, wave, current, and temperature) in the self-defined cruise. Data for next 72 h are shown. Figures of the data can be obtained when clicking the bottoms in the upper panel.
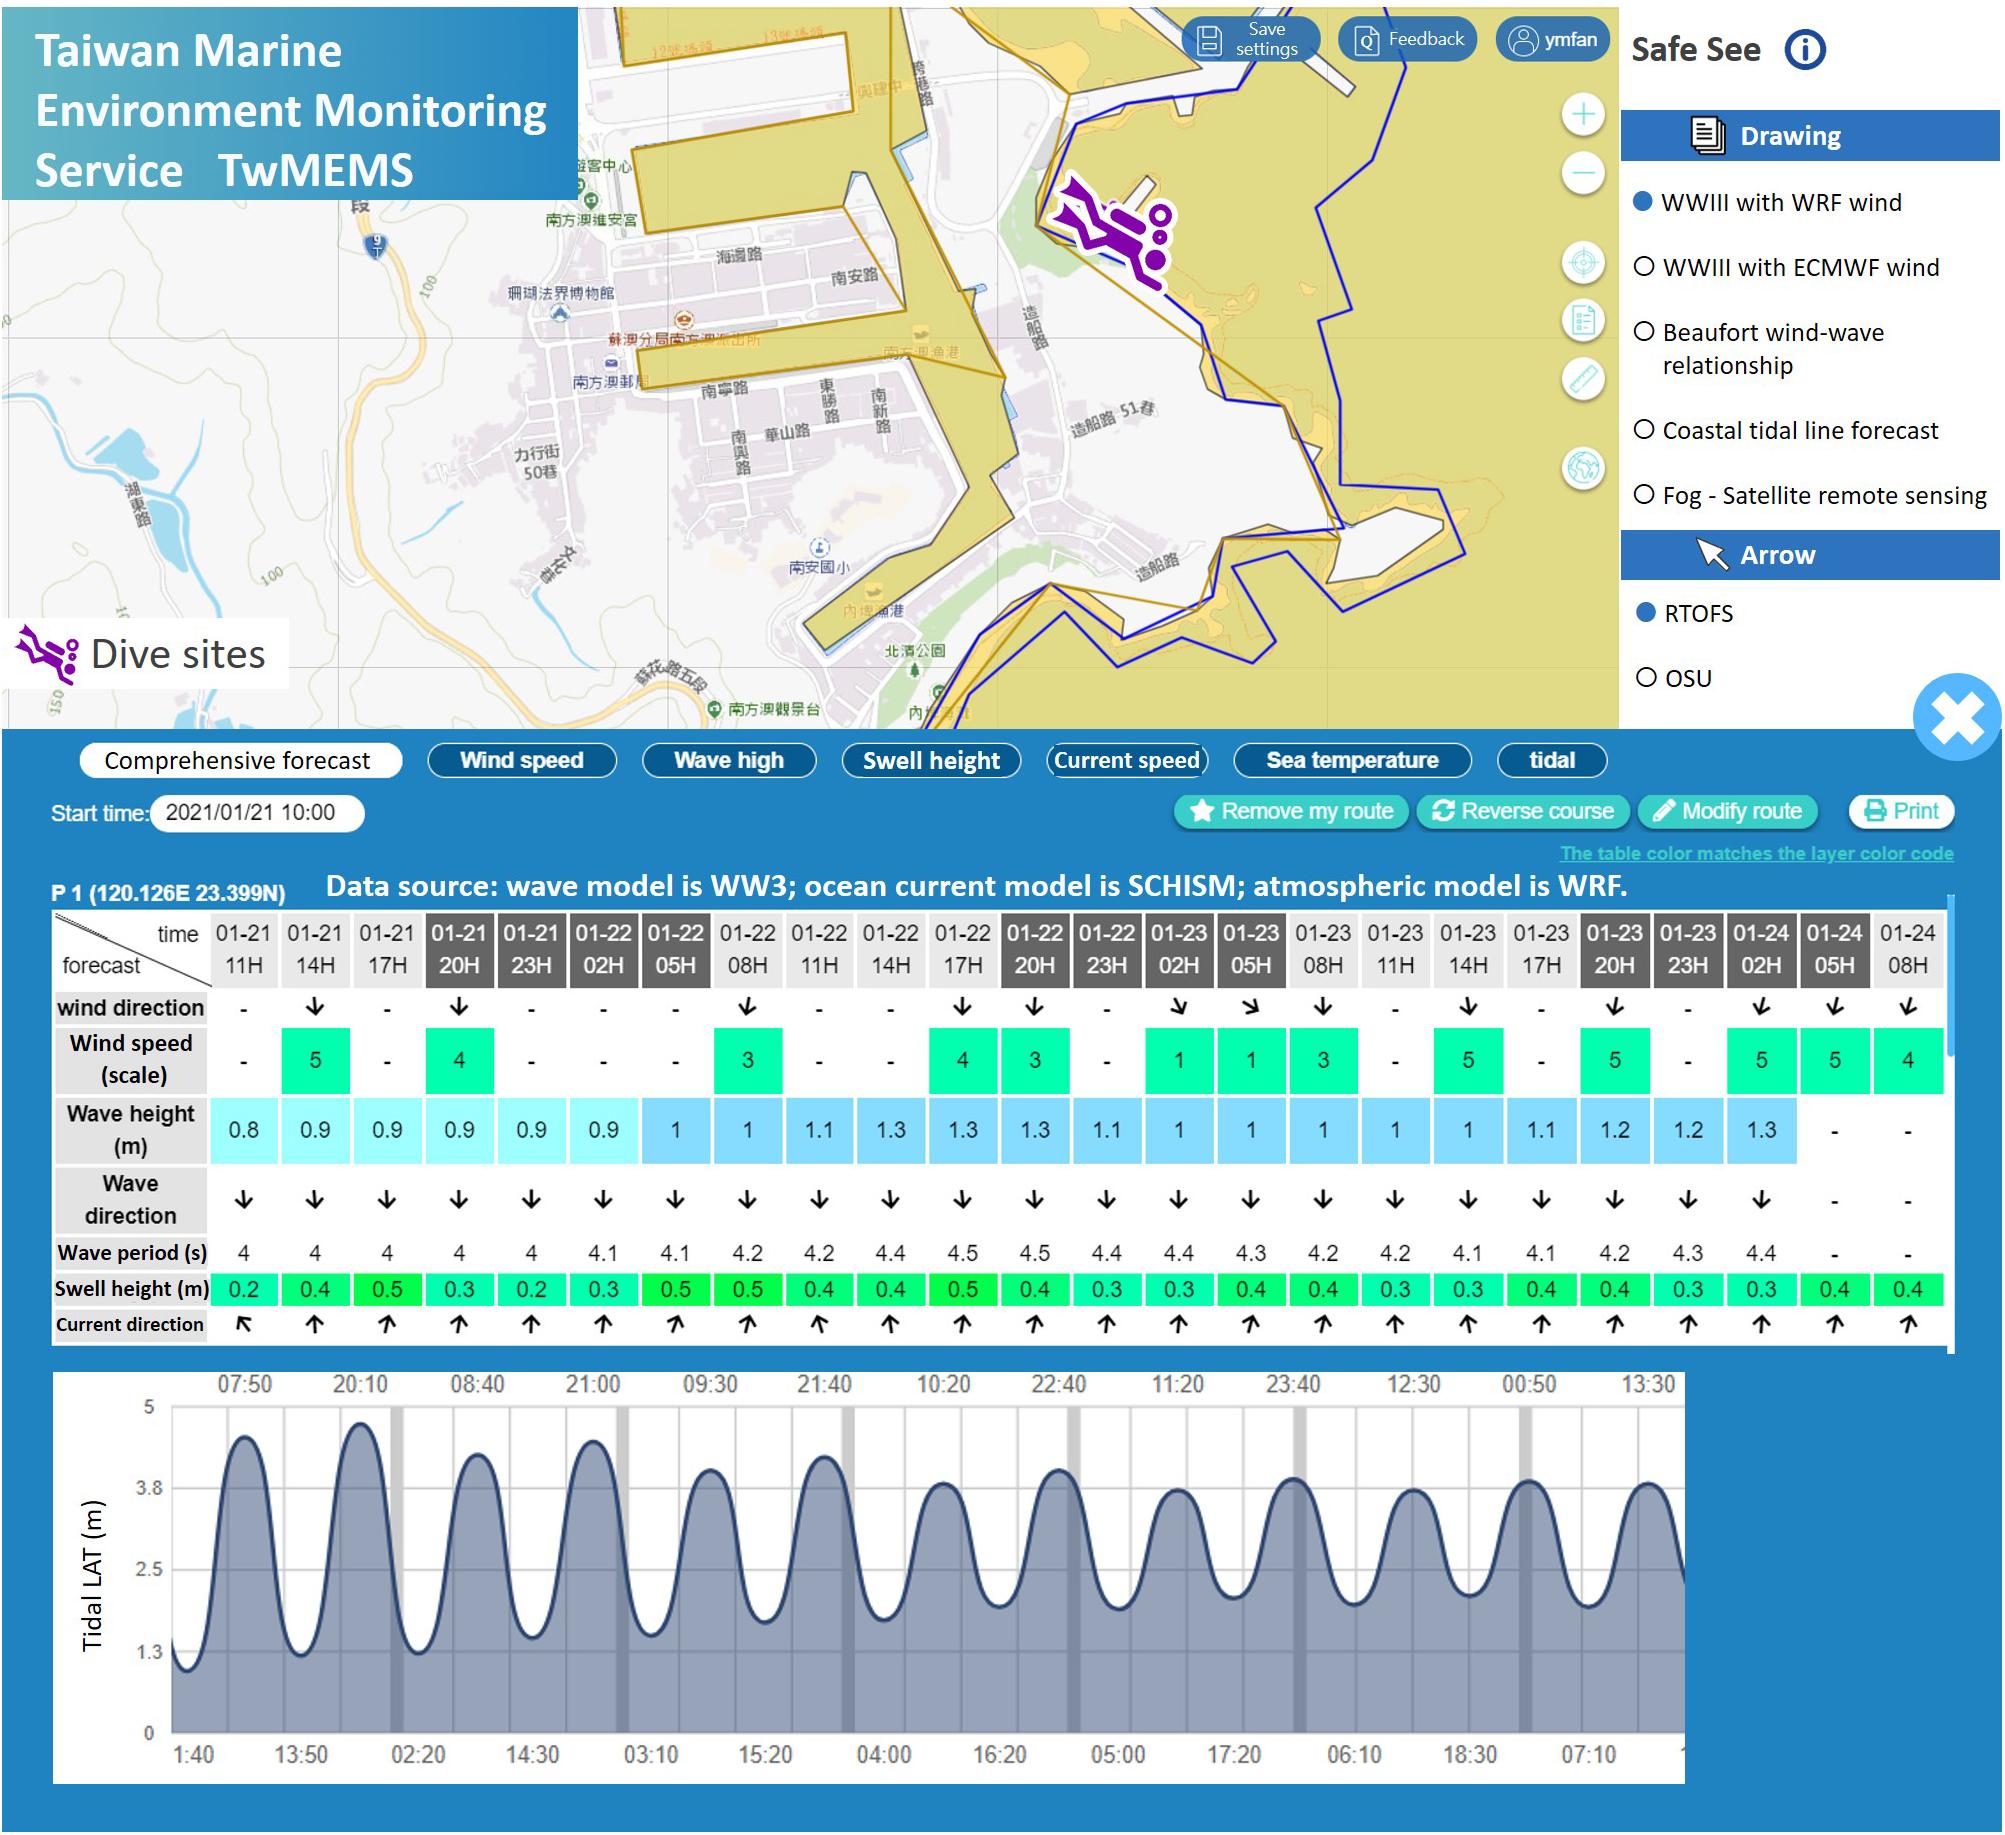
Figure 5. Snapshot of the services for the divers. All data are presented for the next 72 h. The tidal changes that are important for divers are directly shown in the service subwindow.
In addition to the direct presentation of the in-situ and model data, TwMEMS encompasses several warning modules for servicing different users. The modules currently include SS, PTM, EW, OSS, TW, DSW, SD, and SLR. Figure 6 shows the results of the OSS service. A probabilistic model is used to simulate oil spill areas a few days following an accident by using the ocean current, wind and wave data collected in TwMEMS. EPA users can update the results regularly and implement necessary cleaning action. Figure 7 shows the module for climate change research. It dispays the trends of SLR at Taiwanese coasts.
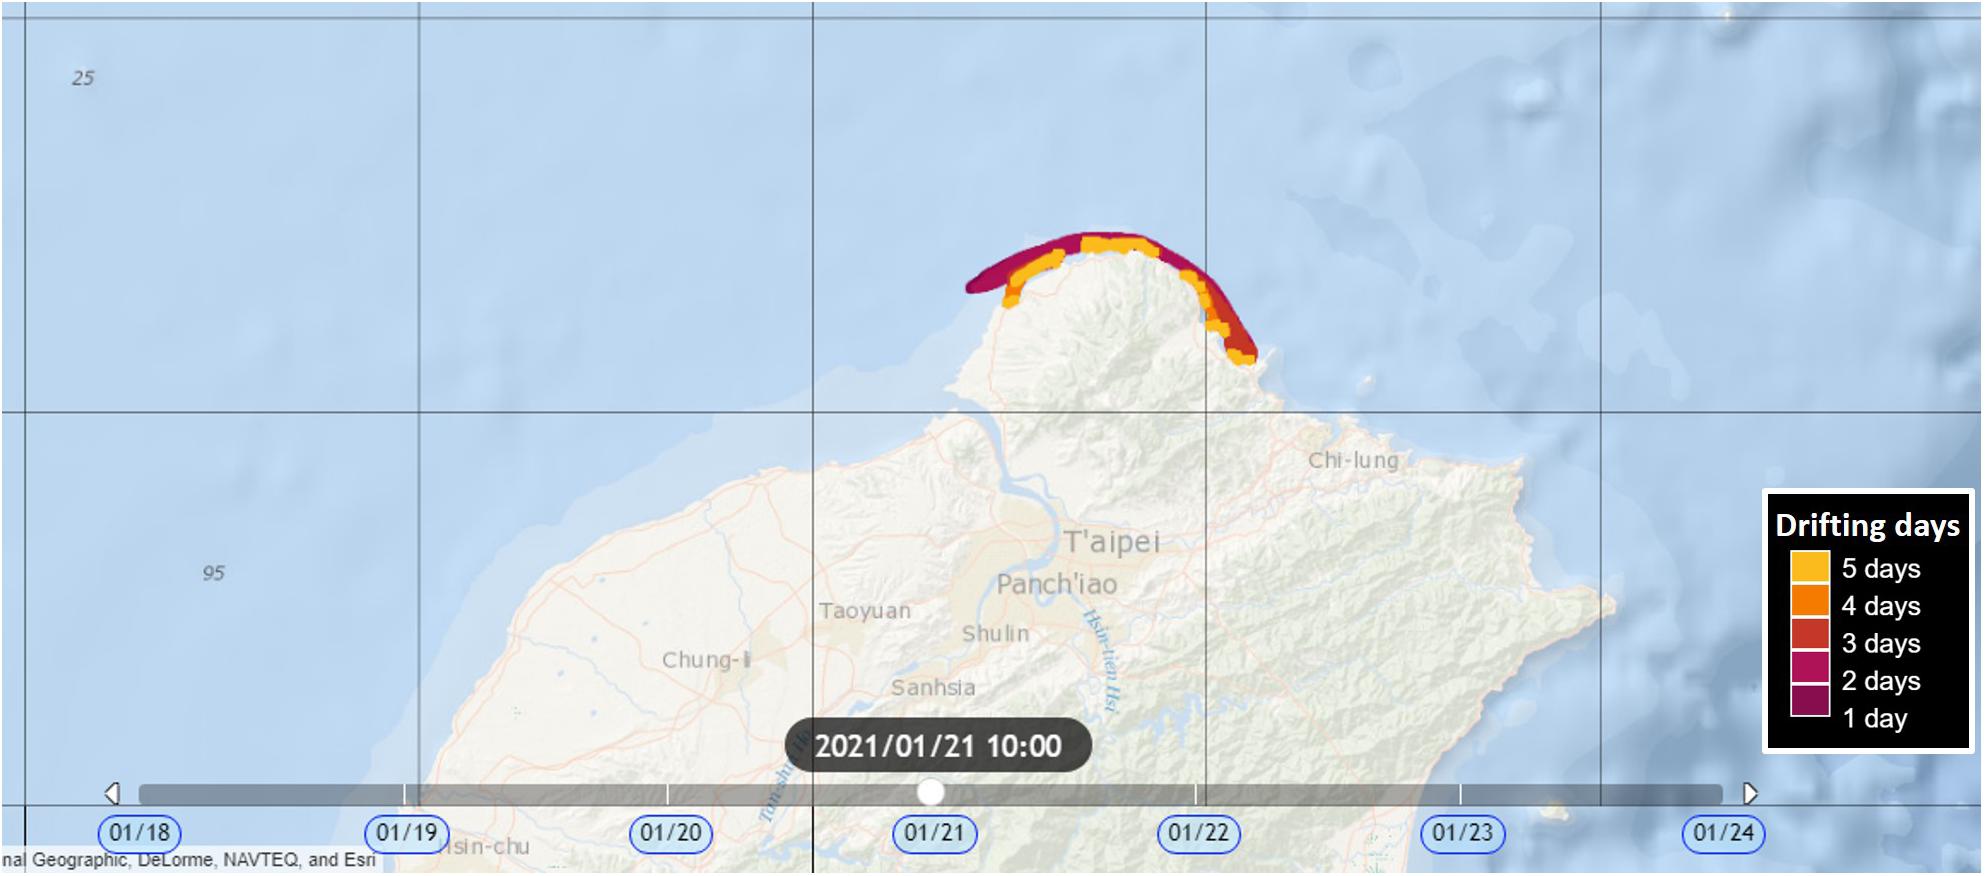
Figure 6. Oil spill simulation obtained by the OSS module of TwMEMS.
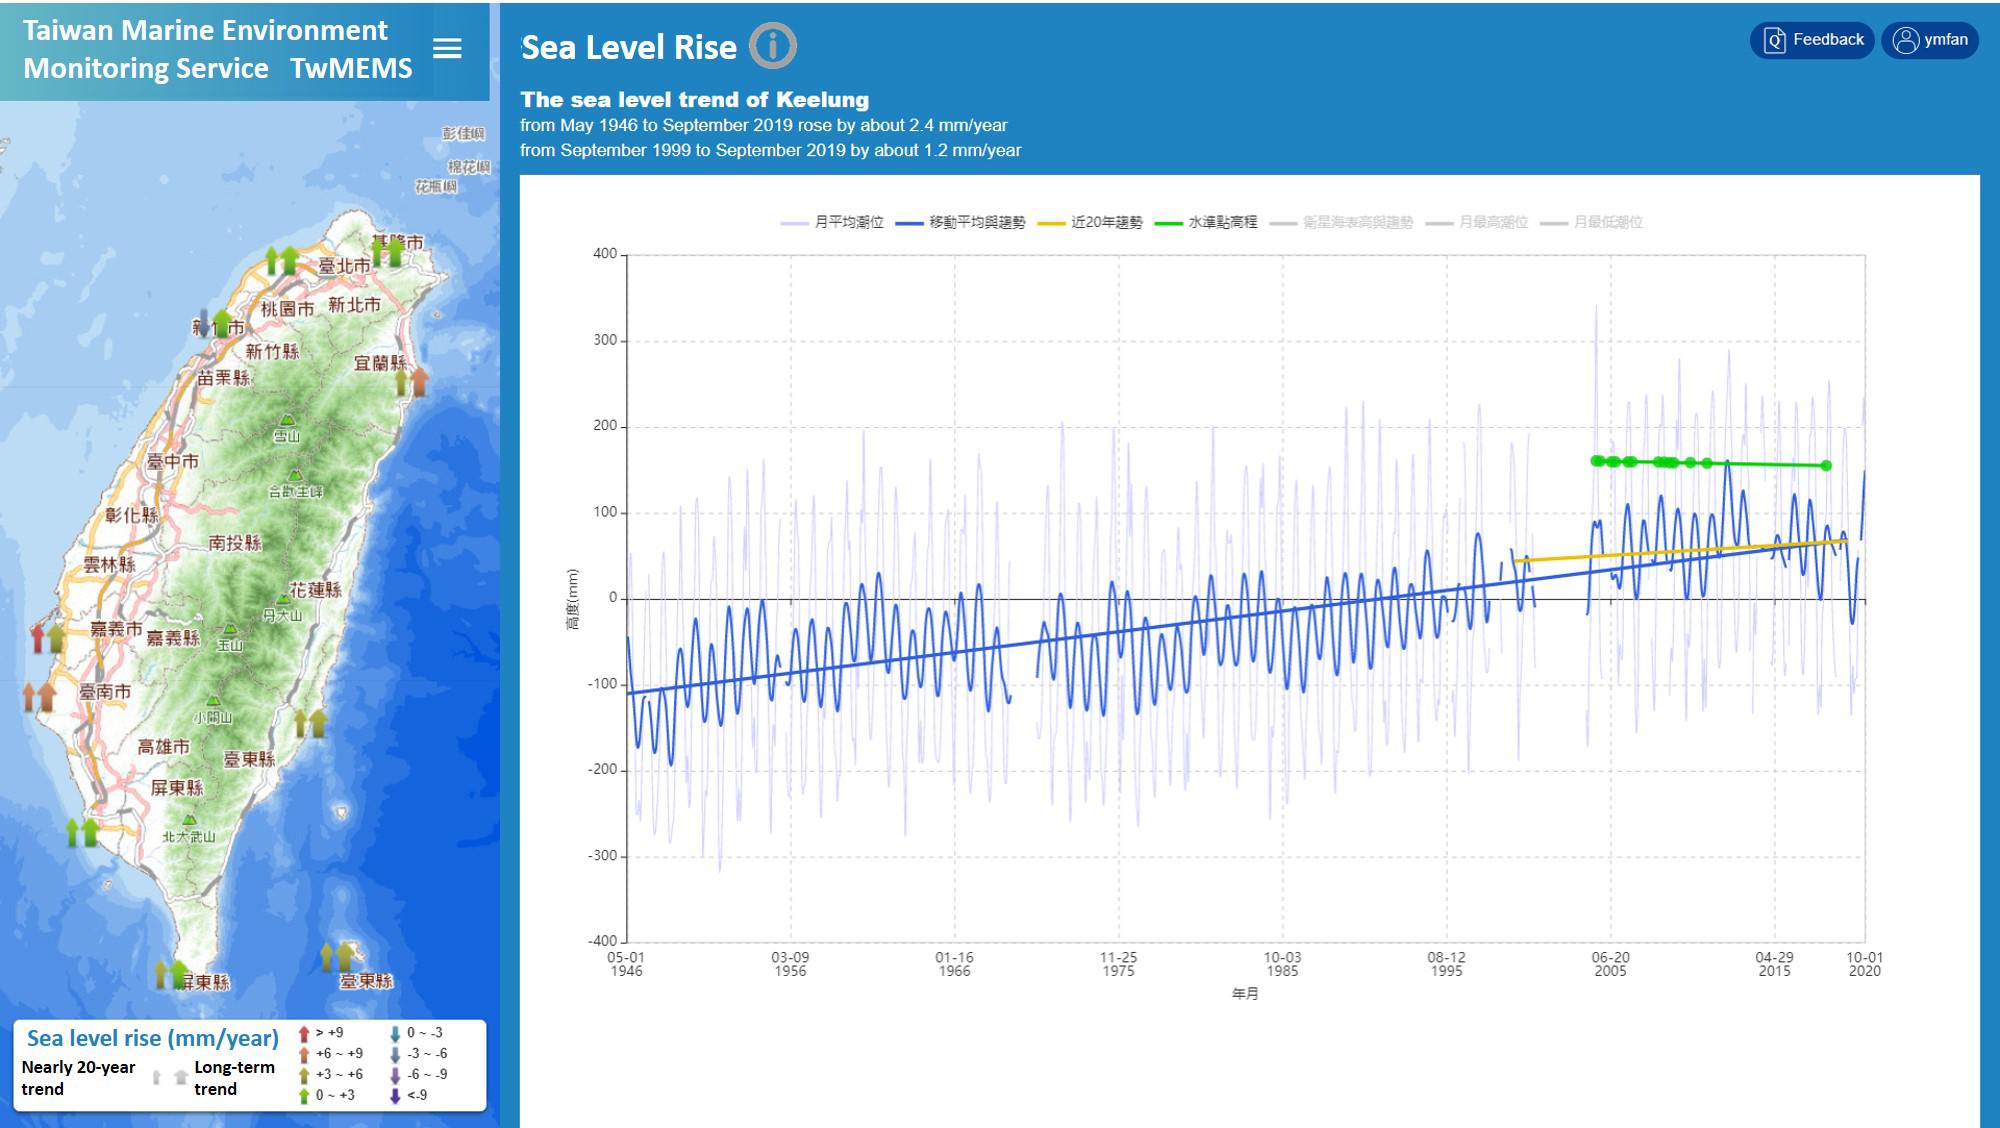
Figure 7. Analysis of the trend of sea level rise by tide stations along the coast of Taiwan. This is a snapshot of the screen of the SLR module of TwMEMS.
There are specific hazards assoicated with Taiwanese waters induced by hazardous long-period waves, including swells and tsunamis. Swells are not inherently hazadrous waves. However, when they are triggered by winter monsoons or typhoons, long-period waves with large momentums always induce high splashing in coastal areas, and people are often swept into the sea. Swell warnings, especially for those used by fishers, are necessary (Chen and Liu, 2016; Chang et al., 2018; Yu Y.-C. et al., 2019; Hsiao S.-C. et al., 2020). This paper presents the analysis of such long-period waves.
The Deep-ocean Assessment and Reporting of Tsunamis (DART) system consists of a buoy-type instrument installed in the deep sea to monitor tsunamis and a tidal station setup along the coasts. DART detects tsunami fluctuations through a bottom-mount pressure sensor and transmits the data to the shore via its surface buoy unit. When DART is installed far from the shore, its warning provides enough time for evacuation. Tide stations are normally equipped with acoustic or pressure sensors for surface displacement measurements. Since tidal stations are located at the coast, they do not provide sufficient time for evacuation; however, their results may provide useful information for other nearby countries, which are critical for guiding the issuance of TWs and for canceling warnings when non-destructive tsunamis are observed (Merrifield et al., 2005). For example, the United States Pacific TW Center, NOAA (Mungov et al., 2013), IOC (Intergovernmental Oceanographic Commission, 1999), and Japan’s NOWPHAS (Nationwide Ocean Wave information network for Ports and HAbourS; Kawai et al., 2014), Indonesia’s InnaTEWS (Indonesian Tsunami Early Warning System; Schoene et al., 2011) all monitor and analyze water levels for TW.
The tidal station records a surface elevation time series at its location. The elevation is contributed to by astronomical tides, storm surges, and unknown local effects. Elevation sometimes spikes due to abnormal instrumental electric currents or voltage fluctuations. These effects should be removed to avoid the misidentification of tsunami signals. Doong et al. (2007) adopted the continuous data idea to remove such spikes. In this study, a 1-min moving average is obtained from the measured data to calculate the residual Dm(t) of the time series shown in Eq. (1). Then, the 60-min moving average (C) of Dm is calculated shown in Eq. (2). Finally, a new residual is obtained by subtracting C from Dm shown in Eq. (3). By subtracting the average value of the 60-min difference, the impact of long-period waves can be removed.
where Dm(t) is the residual between observation of 1-min moving average and prediction. y(t’) is tidal data, where t’ is in 15 s. P(t) is astronomical tide. C is the 60-min moving average. is the new residual.
Figure 8A shows the results of residuals for a 1-day at a tide station in 2019. The reference for the difference change is not located at the zero water level and contains short-period waves before applying the spike removal process. Figure 8B shows that the 3 obvious spikes have been removal, and the reference water level is closer to zero after processing.
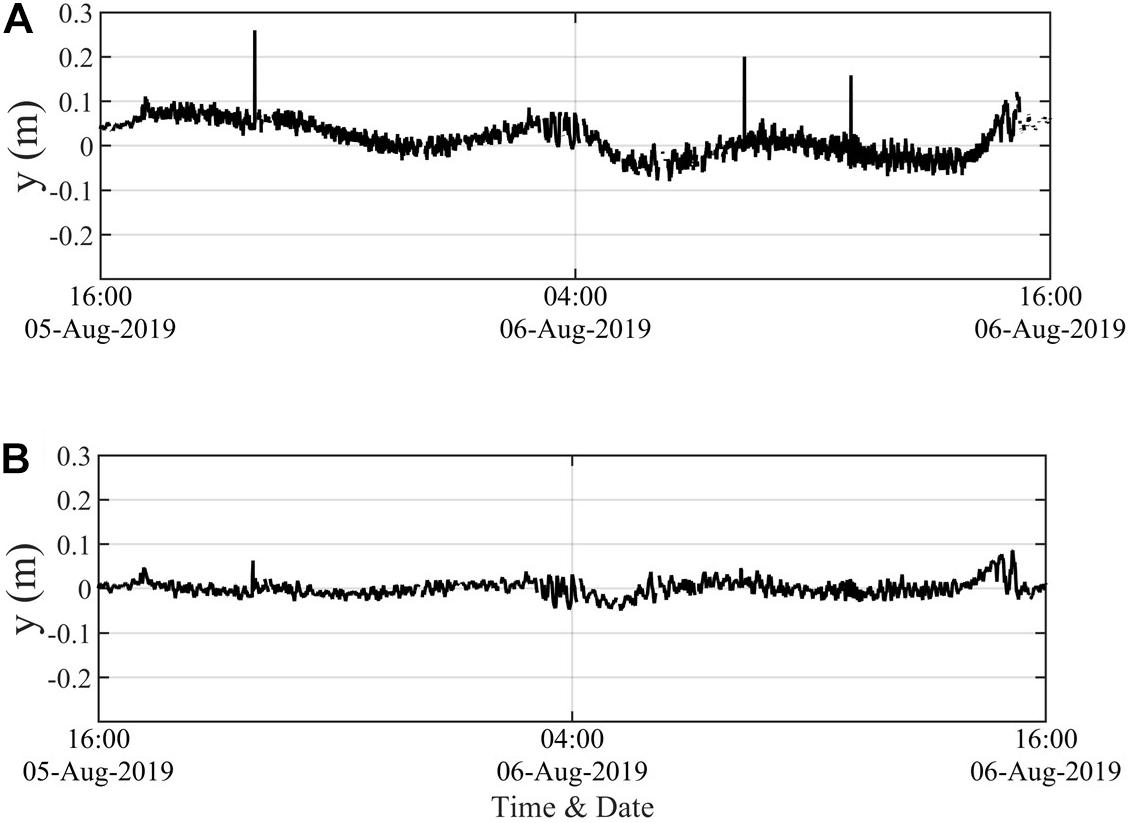
Figure 8. Comparative results of the tidal records (A) before, and (B) after applying the spike removal process.
Taiwan Marine Environment Monitoring Service is an operational system. All modules need to satisfy the real-time analysis target. There are numerous studies currently focused on tsunami analysis (Pattiaratchi and Wijeratne, 2009; Barriot et al., 2012; Heidarzadeh and Satake, 2013; Percival et al., 2015; Voronina et al., 2019; Amjadi and Mokhtari, 2020). Although they mostly include historical data analyses using wavelets, and least-squares, etc., but they point out tsunami information, such as periods, and duration. This study shows a real-time analysis of the water level to obtain the tsunami height. Once the tsunami height exceeds a defined warning threshold, a warning alarm will be shown in TwMEMS. Three approaches, including data filtering, tidal pattern analysis, and harmonic analysis, are used to analyze the tsunami signal based on the surface displacement data measured by tide stations.
To capture the tsunami signal, the CWB’s tidal stations were upgraded to detect surface displacement every 15 s. The low, high and bandpass filtering methods are applied to the tsunami signal, as shown in Figure 9. It shows that the analysis results of low-pass filtering (blue line) are quite different from the analysis results of high-pass filtering (black line) and band-pass filtering (red line), and the low-pass filter does not fully remove other longwave period signals. Further, the high-pass filter generates a high-frequency noise and may extract shorter period signals, which makes it unable to determine tsunami height. To avoid misdiagnosis of tsunami signals, the bandpass filter is used and validated as a proper method for tsunami analysis. Although the bandpass filter is applicable for historical data analysis, abnormal values (blue line) occur when the real-time water elevations are input, as shown in Figure 10. The reason is that the filter method needs to use real-time water level, it is also necessary to have a historical data for at least 3 h. Thus, the filtering method is therefore rejected for real-time tsunami analysis but used for historical data analysis.
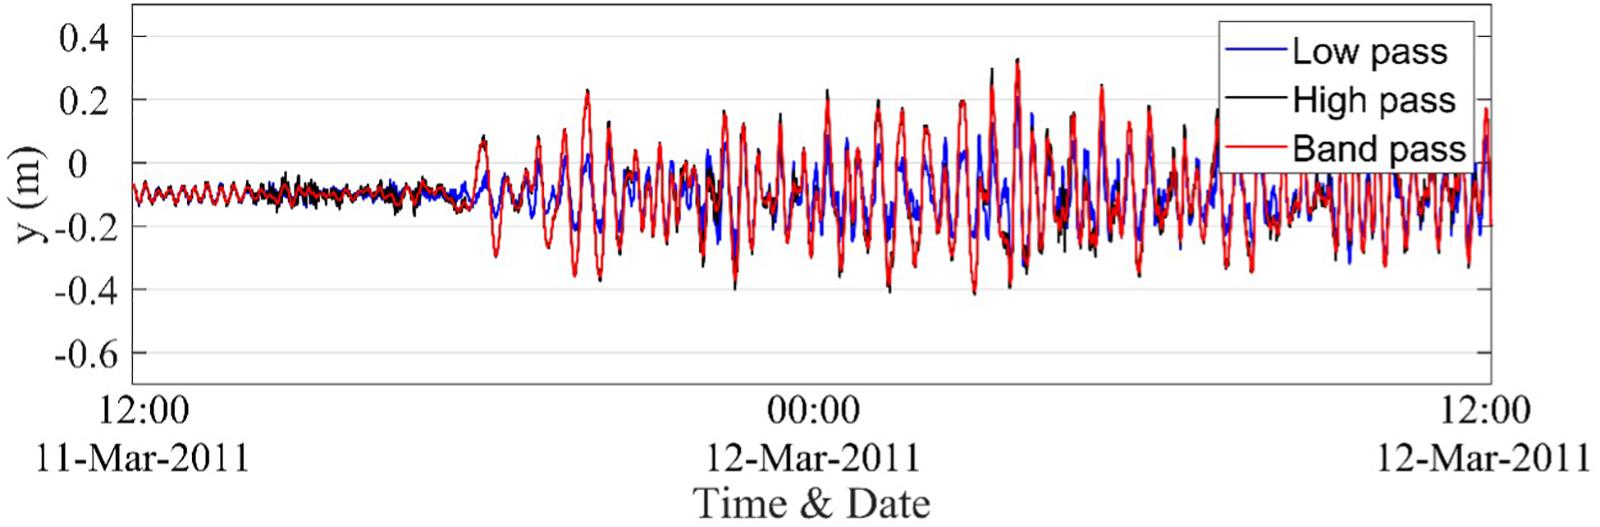
Figure 9. Comparison of three filtering methods applied to a tsunami record.
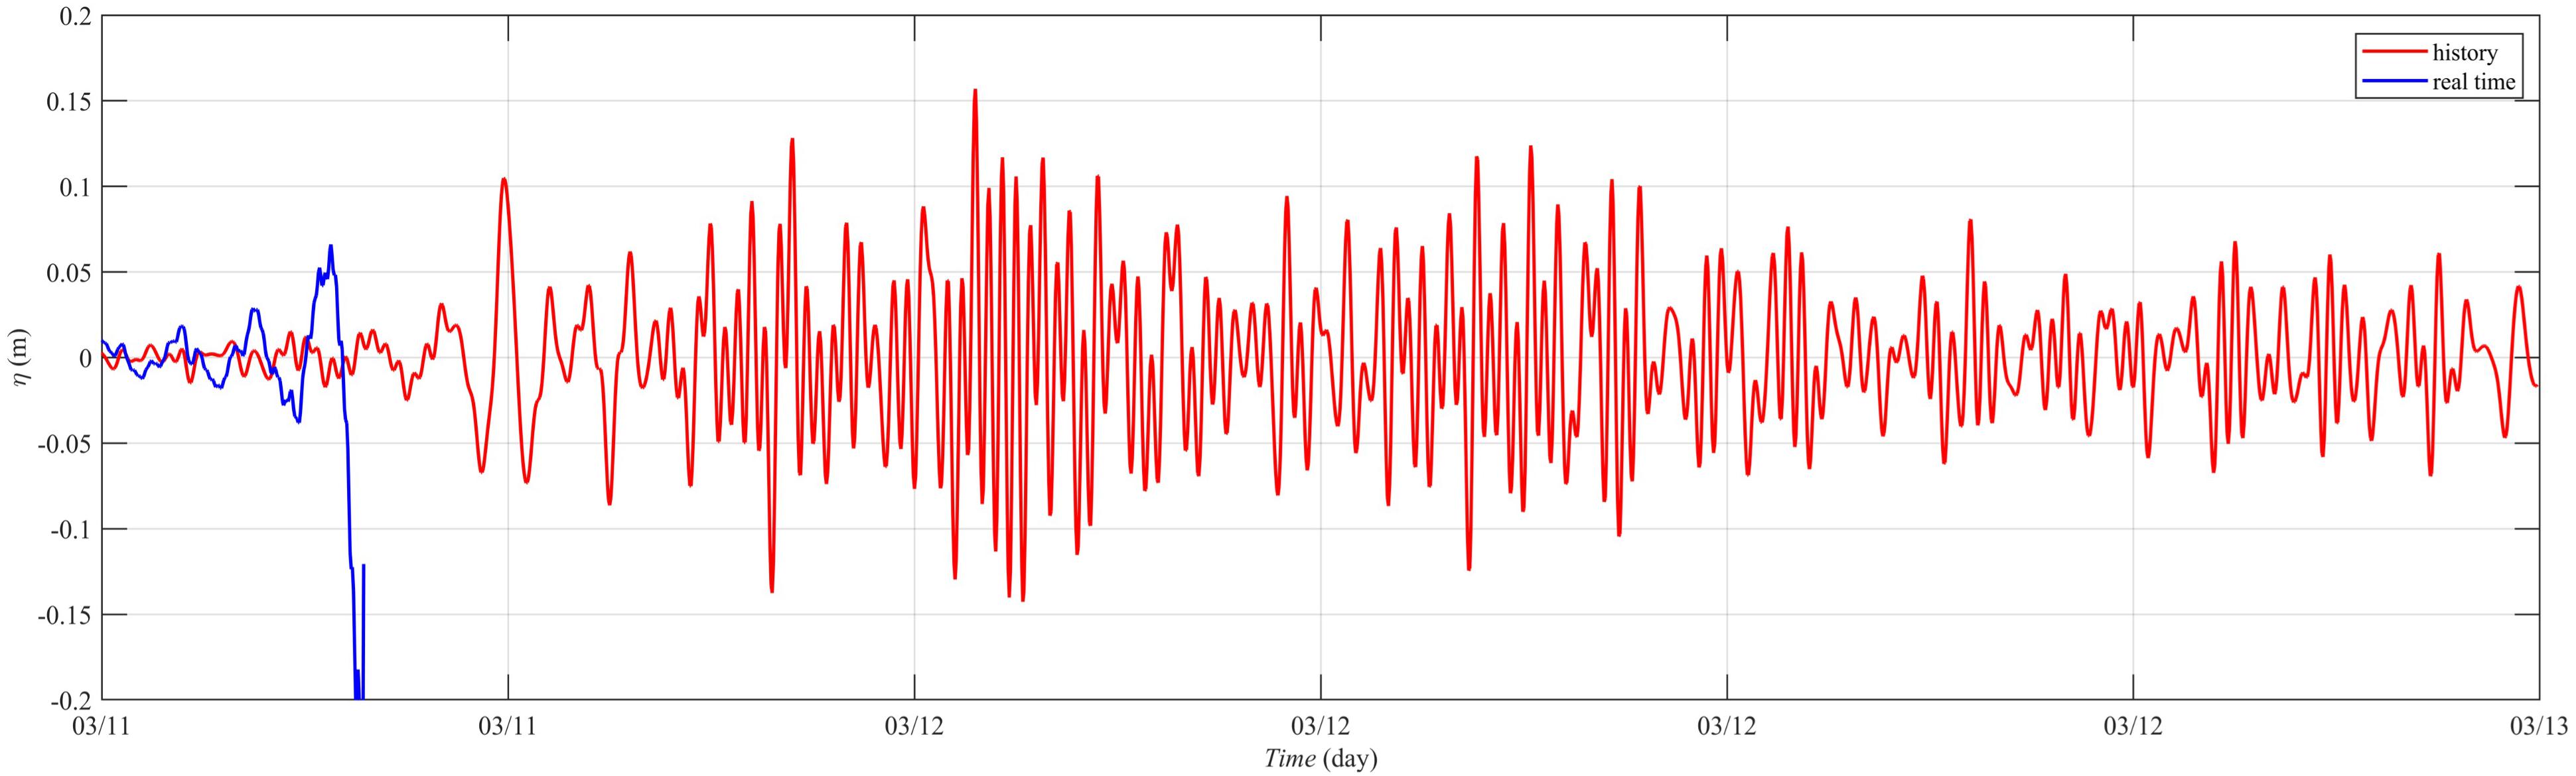
Figure 10. Band pass filtering method is used to analyze the comparison results of observation data and historical data in real time.
An alternative method to obtain the tsunami signal is using the bias between tidal records and astronomical tidal patterns. The tidal pattern is composed of constituent amplitudes and phases obtained from the NAO99b ocean tide model. NAO99b has a better performance in assembling tidal patterns in deep sea areas; however, the results may be poor for coastal areas because of the influences of bathymetry and topography. Calibration with observation data for the coastal application of NAO99b is necessary. Figure 11 shows the comparative results of the tsunami height derived from the tidal pattern method with the filtering approach. Here assume the results of band-pass filtering is reference result as the bandpass filter method used for historical data analysis can obtained a reasonable tsunami height. The results show that the tidal pattern method successfully extracts tsunami heights even with real-time inputs of field data. The non-dimensional root mean square error of tsunami height derived from the tidal pattern method is 9% upon using the bandpass filtering method as the reference result.
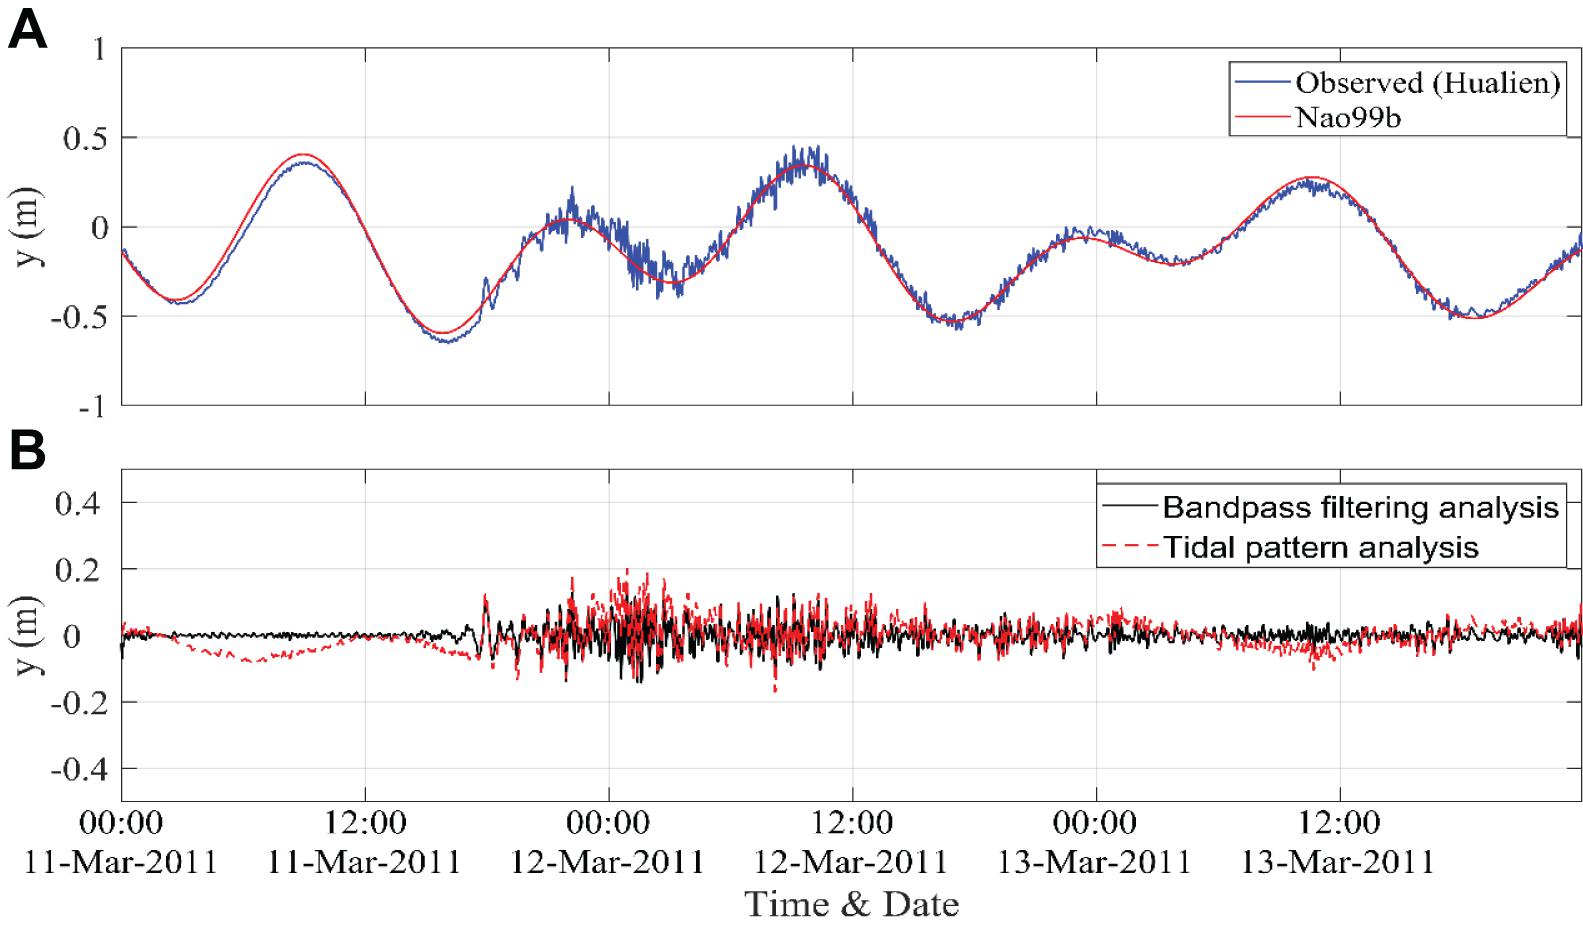
Figure 11. Comparison of tsunami height extraction by the bandpass filtering method and tidal pattern analysis. (A) The time series of surface elevation including a tsunami; (B) The extraction of tsunami heights by two methods.
The harmonic analysis method uses a Fourier series to represent tidal characteristics. It is a station-based method. A minimum of 1-year of tide records is needed for this method. Suppose we have a tidal data series y(t), where t is in hours, we can model the series with N harmonic constituents (sinusoids) using the prediction shown in Eq. (4).
where Hn is an amplitude, ωn is is an angular speed, and Gn is a phase lag on the Equilibrium Tide, which in the context of tidal analysis is referred to as the speed of the tidal component. Tsunami height is then obtained from the difference in the measured tide record with the prediction by harmonic components.
The 2006 Hengchun earthquake occurred on December 26 at 20:25 local time off the southwest coast of Taiwan in the Luzon Strait with the Richter magnitude scale 7.0. The earthquake caused a slight tsunami in Taiwan. Figure 12 shows the comparative results of the tsunami height estimated by harmonic analysis and the bandpass filtering method during the 2006 Hengchun earthquake. The results show that harmonic analysis is not only able to predict astronomical tides in real time but can also obtain abnormal water level occurrence times and heights. The non-dimensional root mean square error of the tsunami height derived by harmonic analysis is 5%, showing a higher accuracy than the tidal pattern method.
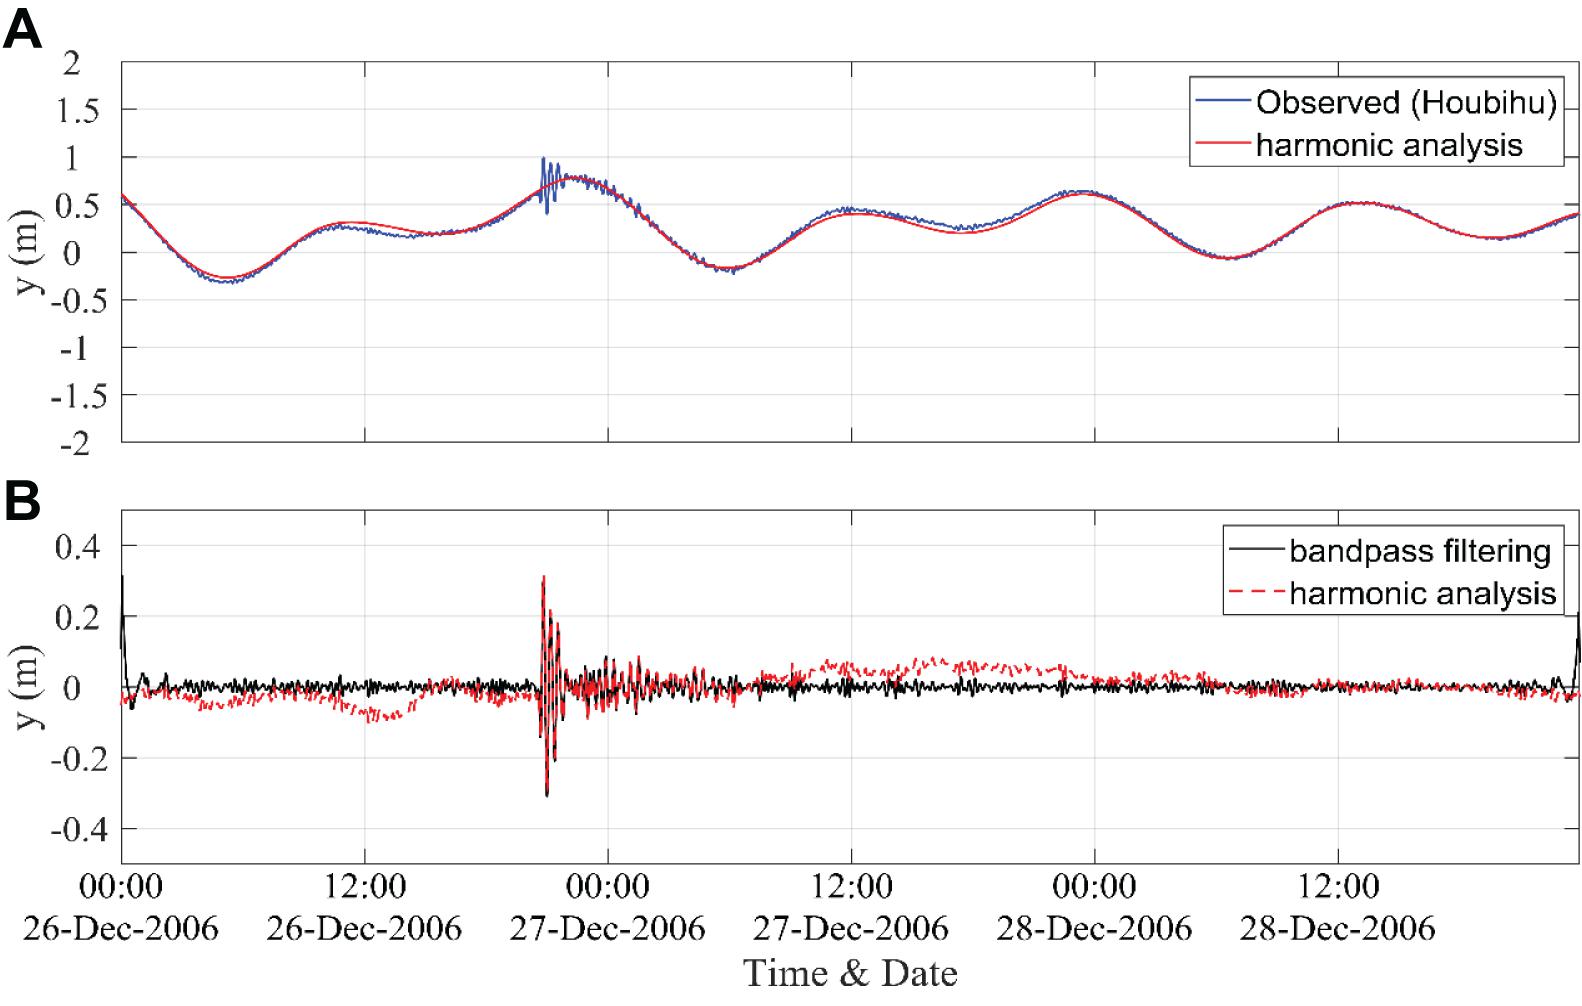
Figure 12. Comparison of the tsunami height extraction by the bandpass filtering method and harmonic analysis. (A) The time series of surface elevation including a tsunami; (B) The extraction of tsunami heights by two methods.
All three methods introduced in the paper can separated tsunami heights from a tidal record. However, the bandpass filtering method is not successful for used in real-time analysis. The tidal pattern method and harmonic analysis can be applied for real-time data input. Since the results of harmonic analysis show a lower root mean square error, it is adopted in TwMEMS for tsunami analysis.
Swells occurs as waves propagate out of the wind fetch. This is expected by surfers because swells creates the best environment for surfing. However, swells sometime introduces risks to people, especially when they are too large (Lin-Ye et al., 2016; Yuk et al., 2016). In Taiwan, swells mainly appear during winter and typhoon seasons. An unexpected large splash at the coast appears when swell propagates to the shore and interacts with rock or coastal structures (Doong et al., 2018). Every year, many tourists are swept into the sea by such splash events. In addition, swells can travel long distances with large energy fluxes and high transmission speeds. When swells interact with local wind waves, the crossing sea state can be a dangerous environment that causes shipwrecks (Trulsen et al., 2015). Swell warnings are necessary in Taiwan, although many services in the world provide swell information for surfing. To develop swell warnings, a threshold needs to be defined first. The meteorological division in the Solomon Islands issues swell alerts when swell heights exceed 2.5 m and are expected to impact the coast within 48 h. Swells cannot be observed directly by instruments, but they can be obtained from the separation of the wave spectrum (Hanson and Philip, 2001). Swell forecast data are mainly obtained by numeral wave models (Lee et al., 2011).
Taiwan’s CWB currently defines a dangerous swell when its wave height exceeds 1.5 m and its period is longer than 8 s. However, this is an experience-based assumption. This paper studies the criteria for dangerous swells. The sea parameter values at times when shipwrecks occur are used in this study. These include wave height, swell period, and wind wave parameters. Toffoli et al. (2005) found that most wave heights are less than 4 m when shipwrecks occur, and shipwrecks are most likely to occur when wind and waves coexist and the crossing wave is at a certain angle or when the sea state grows rapidly. Zhang and Li (2017) reported that although shipwreck incidents are prone to occur during strong wind and wave events, more than half of these incidents have occurred when the wave heights were small. They further found that shipwrecks readily occur when the direction and frequency of swells and sea winds are not significantly different. Tao et al. (2017) analyzed the characteristics of swells in the East China Sea and found that swells coexist with wind seas for more than half of the year. They found that swell heights are mostly less than 1.2 m, and swell periods are mostly less than 12 s.
There are many coastal activities along the coast of Taiwan waters every day (except for typhoon period), such as fishing operations, however, there are always have incidents of casualties caused by huge waves. Therefore, this study collects 49 shipwrecks that occurred due to weather influences, exclude caused by human Factors and mechanical problems from 2008 to 2017 in the coast of Taiwan waters. The ship types including sampan, fishing raft, and fishing boat, etc. The wave parameters at the time of the shipwrecks are obtained from the validated WWIII model. However, the wave height and period alone cannot fully represent dangerous sea states (Niclasen et al., 2010). The wave steepness, direction, frequency and angle difference between swells and sea winds sea should be considered (Toffoli et al., 2005; Tamura et al., 2009; Waseda et al., 2012). To explore the influence of various sea state parameters in inducing shipwrecks, this study analyses various parameter combinations.
The analysis shows that the swell height of the 49 shipwrecks fell within 0.5–1 m, and 57% of the swell periods fell within 5–7 s. Doong et al. (2018) showed that the angle and period differences between swells and sea winds are critical factors driving shipwrecks. A bivariate normal distribution is applied to fit the joint distribution of the angle difference between the swells and wind seas (dD) using the swell mean period (Tm02s) and the period difference between the swells and wind seas (dT). The probability density function of the bivariate normal distribution is expressed as follows:
where μ is the average vector and Σ is the covariance matrix.
The upper and lower bounds of each parameter can be obtained from the distribution range covering a 60% probability, as shown by the green line in Figure 13. Therefore, the swell alert criteria are defined as a swell mean period greater than 4.3 s and a wave period and angle difference between swells and sea winds less than 4.8 s and 77.6 degrees, respectively. Three shipwrecks that occurred in coast of Taiwan water, and the length of boats about 10 m are used for verification. This study uses the observation data from buoys near the shipwreck site, and selects the observation data of the current and the previous few hours for analysis. The results as shown in Table 2, it show that the observation data of the current and the previous few hours have all reached proposed the criteria, which means the sea conditions at this time are dangerous for the small boat.
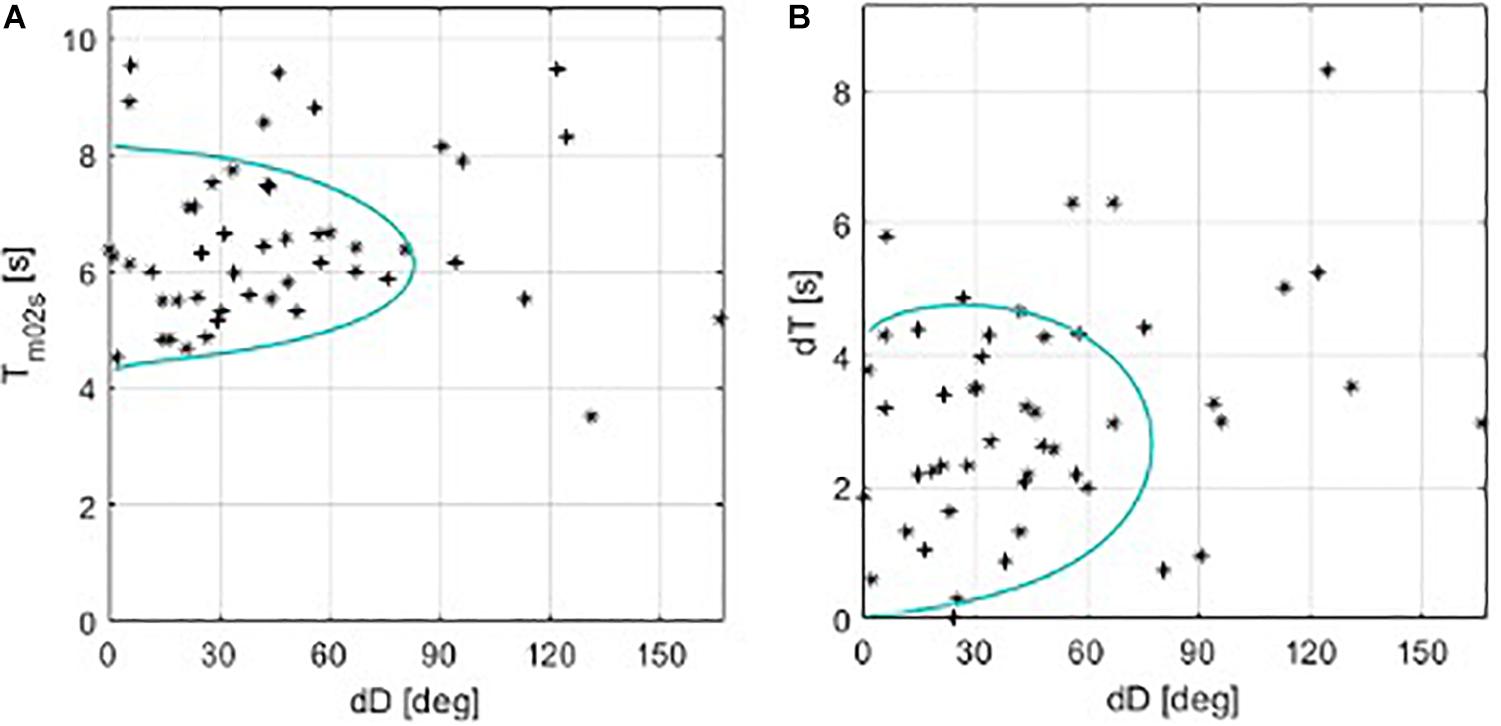
Figure 13. Scatter diagram of the direction difference with the (A) swell peak period, and (B) direction difference.
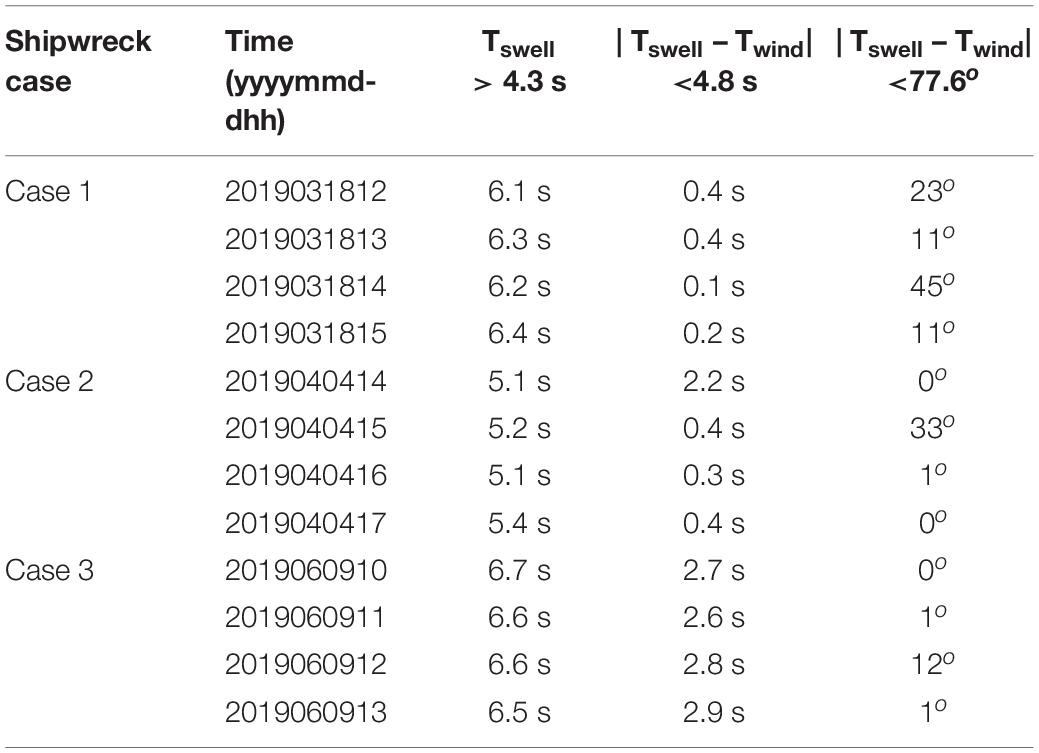
Table 2. The verification of swell alert criteria with shipwrecks in 2019.
Ocean monitoring networks exist worldwide. Many observations have been collected in the database managed by various institutions and are openly accessible. This has provided great assistance for scientists and engineers. In recent decades, the development of high-resolution numerical modeling techniques has further extended the database from single point measurements to encompassing larger spatial coverages. Proper use of the database and sufficient system design to service the public may improve various phases, including safety. The fishery and tourism industries, as well as traffic patterns and the economy, in Taiwan are highly linked with the ocean. A service platform entitled TwMEMS was developed since 2020 by Taiwan’s CWB based on field observations and modeling. And the rolling revisions have been made at any time based on the opinions of all parties to meet the expectations of users. In addition, in order to ensure the normal operation of the system, in addition to automatically sending error messages to the system administrator, there are also dedicated personnel for regular checks.
TwMEMS receives mainly oceanographic parameters (wind, wave, current, and temperature) in real time from almost all in-situ stations in Taiwanese waters. The operational atmospheric and ocean model results run by CWB as well as imports from other countries provide forecasted sea statuses for the domain covered by TwMEMS. Web-based systems with user-friendly interfaces have served 12 governmental institutions and numerous public members. Its most popular function is the direct SAFE SEA data presentation. Numerous members of the public, including divers, surfers, and captains, browse the page regularly. The plugged-in modules are designed mainly for governmental institutions, including that of the OSS, particle tracking modeling, EW and freak wave warning, SLR, low SST warning, and swell and TW systems. This paper reports an analysis of tsunami heights recorded at various tide stations. The filtering methods are the same as the methods of wavelets and least-squares, it shows good results for historical data analysis but are not proper for real-time analysis. Both the tidal pattern method and harmonic analysis are capable of tsunami analysis, but harmonic analysis has a higher accuracy and is adopted by TwMEMS. Another functionality of the system includes swell warning, as swells induce life and property losses along the coasts and in the sea. Due to the complex influencing factors of disasters caused by destructive waves, this study uses composite parameters instead of only single wave parameters as the thresholds. This study analyzes the wave data of shipwrecks and uses a bivariate normal distribution to define the thresholds of dangerous swells. The warning modules of the two long-period waves will trigger an alarm when the values (tsunami height and swell parameters) exceed the defined thresholds. TwMEMS has been continuously developed since 2020 and will be upgraded to the next generation by considering user feedback and requests. For example, all the information is provided passively and will be actively making push notifications through APP or communication software in the future.
The original contributions presented in the study are included in the article/supplementary material, further inquiries can be directed to the corresponding author/s.
JYC and CCK conceived of the presented idea. D-JD and Y-MF developed the theory and performed the computations. All authors discussed the results and contributed to the final manuscript.
This study was supported by the Central Weather Bureau and Ministry of Science and Technology of Taiwan (MOST 108-2923-E-006-1244007-MY4).
The authors declare that the research was conducted in the absence of any commercial or financial relationships that could be construed as a potential conflict of interest.
The authors would like to thank all colleagues who contributed to this study. Special thanks go to Prof. Shih-Chun Hsiao of National Cheng Kung University and Prof. Chih-Min Hsieh of National Kaohsiung University of Science and Technology for help with the project.
Amjadi, A. A., and Mokhtari, M. (2020). Application of wavelets for specifying tsunami from tide: a comprehensive study on the 1945 Makran tide gauge records. Phys. Earth Planet. Inter. 299:106425. doi: 10.1016/j.pepi.2019.106425
Ando, M., Tu, Y., and Lin, C. H. (2015). Generation-to-generation transmitted tsunami-like wave sightings along the east coast of Taiwan. Terrest. Atmos. Ocean. Sci. 26, 355–359. doi: 10.3319/tao.2015.03.02.01(t)
Aznar, R., Sotillo, M. G., Cailleau, S., Lorente, P., Levier, B., Amo-Baladrón, A., et al. (2016). Strengths and weaknesses of the CMEMS forecasted and reanalyzed solutions for the Iberia–Biscay–Ireland (IBI) waters. J. Mar. Syst. 159, 1–14. doi: 10.1016/j.jmarsys.2016.02.007
Barriot, J. P., Serafini, J., Sichoix, L., Reymond, D., and Hyvernaud, O. (2012). The tsunami of Marcn 11, 2011 as observed by the network of tide gauges of French Polymesia. J. Mar. Sci. Technol. 20, 639–646. doi: 10.6119/JMST-012-0430-1
Barszczynska, M., Kubacka, D., and Madej, P. (2005). Developing GIS applications for the national hydro-meteorological service in Poland. Meteorol. Appl. 12, 23–27. doi: 10.1017/s1350482705001532
Bleck, R. (2002). An oceanic general circulation model framed in hybrid isopycnic-Cartesian coordinates. Ocean Model. 37, 55–88. doi: 10.1016/s1463-5003(01)00012-9
Chang, C.-H., Shih, H.-J., Chen, W.-B., Su, W.-R., Lin, L.-Y., Yu, Y.-C., et al. (2018). Hazard assessment of typhoon-driven storm waves in the nearshore waters of Taiwan. Water 10:926. doi: 10.3390/w10070926
Chen, S. T. (2019). Probabilistic forecasting of coastal wave height during typhoon warning period using machine learning methods. J. Hydroinform. 21, 343–358. doi: 10.2166/hydro.2019.115
Chen, W.-B., and Liu, W.-C. (2016). Assessment of storm surge inundation and potential hazard maps for the southern coast of Taiwan. Nat. Hazards 82, 591–616. doi: 10.1007/s11069-016-2199-y
Cheng, S. N., Shaw, C. F., and Yeh, Y. T. (2016). Reconstructing the 1867 Keelung Earthquake and Tsunami Based on Historical Documents. Terrest. Atmos. Ocean. Sci. 27, 431–449. doi: 10.3319/tao.2016.03.18.01(tem)
Chien, L. K., Chi’u, S. Y., Tseng, W. C., and Hsu, C. H. (2012). “The study of coastal risk assessment of planning and management for coastal area in Taiwan,” in Proceedings of the Twenty-second International Offshore and Polar Engineering Conference, Rhodes.
Dilley, M., Chen, R. S., Deichmann, U., Lerner-Lam, A. L., Arnold, M., Agwe, J., et al. (2005). Natural Disaster Hotspots: A Global Risk Analysis. Washington, DC: World Bank, doi: 10.1007/978-3-322-82113-3_1
Doong, D. J., Chen, S. H., Kao, C. C., and Lee, B. C. (2007). Data quality check procedures of an operational coastal ocean monitoring network. Ocean Eng. 34, 234–246. doi: 10.1016/j.oceaneng.2006.01.011
Doong, D. J., Chuang, L. Z. H., Wu, L. C., Fan, Y. M., Kao, C. C., and Wang, J. H. (2012). Development of an operational coastal flooding early warning system. Nat. Hazards Earth Syst. Sci. 12, 379–390. doi: 10.5194/nhess-12-379-2012
Doong, D. J., Peng, J. P., and Chen, Y. C. (2018). Development of a warning model for coastal freak wave occurrences using an artificial neural network. Ocean Eng. 169, 270–280. doi: 10.1016/j.oceaneng.2018.09.029
Doong, D. J., Tsai, C. H., Chen, Y. C., Peng, J. P., and Huang, C. J. (2015). Statistical analysis on the long-Term observations of typhoon waves in the Taiwan sea. J. Mar. Sci. Technol. 23, 893–900.
Dushaw, B. D., Egbert, G. D., Worcester, P. F., Cornuelle, B. D., Howe, B. M., and Metzger, K. (1997). A Topex/Poseidon global tidal model (TPXO.2) and barotropic tidal currents determined from long-range acoustic transmissions. Prog. Oceanogr. 40, 337–367. doi: 10.1016/s0079-6611(98)00008-1
Dyras, I., and Serafin-Rek, D. (2005). The application of GIS technology forprecipitation mapping. Meteorol. Appl. 12, 69–75. doi: 10.1017/s135048270400146x
Egbert, G. D., Bennett, A. F., and Foreman, M. G. G. (1994). TOPEX/Poseidon tides estimated using a global inverse model. J. Geophys. Res. 99, 24821–24852. doi: 10.1029/94jc01894
Egbert, G. D., and Erofeeva, S. Y. (2002). Efficient inverse modeling of barotropic ocean tides. J. Atmos. Ocean. Technol. 19, 183–204. doi: 10.1175/1520-0426(2002)019<0183:eimobo>2.0.co;2
Garraffo, Z. D., Cummings, J. A., Paturi, S., Hao, Y., Iredell, D., Spindler, T., et al. (2020). “RTOFS-DA: real time ocean-sea ice coupled three dimensional variational global data assimilative ocean forecast system,” in Research Activities in Earth System Modelling, ed. E. Astakhova (Geneva: World Climate Research Programme),Google Scholar
Hanson, J. L., and Philip, O. M. (2001). Automated analysis of ocean surface direction wave spectra. J. Atmos. Ocean. Technol. 18, 277–293. doi: 10.1175/1520-0426(2001)018<0277:aaoosd>2.0.co;2
Heidarzadeh, M., and Satake, K. (2013). Waveform and spectral analyses of the 2011 Japan tsunami records on tide gauge and DART stations across the Pacific Ocean. Pure Appl. Geophys. 170, 1275–1293. doi: 10.1007/s00024-012-0558-5
Hsiao, L.-F., Chen, D.-S., Hong, J.-S., Yeh, T.-C., and Fong, C.-T. (2020). Improvement of the Numerical Tropical Cyclone Prediction System at the Central Weather Bureau of Taiwan: TWRF (Typhoon WRF). Atmosphere 11:657. doi: 10.3390/atmos11060657
Hsiao, S.-C., Chen, H., Wu, H.-L., Chen, W.-B., Chang, C.-H., Guo, W.-D., et al. (2020). Numerical simulation of large wave heights from super typhoon nepartak (2016) in the Eastern Waters of Taiwan. J. Mar. Sci. Eng. 8:217. doi: 10.3390/jmse8030217
Hsu, T. W., Shih, D. S., and Chen, W. J. (2015). Destructive flooding induced by broken embankments along Linbian Creek, Taiwan, during Typhoon Morakot. J. Hydrol. Eng. ASCE 20:05014025. doi: 10.1061/(ASCE)HE.1943-5584.0001069
Huang, C. C., Chang, Y. C., Tai, S. C., Lin, C. Y., Lin, Y. P., Fan, Y. M., et al. (2020). Operational monitoring and forecasting of wave run-up on seawalls. Coast. Eng. 161:103750. doi: 10.1016/j.coastaleng.2020.103750
Huang, W. P., Hsu, J. C., Chen, C. S., and Ye, C. J. (2018). The study of the coastal management criteria based on risk assessmeant: a case study on Yunlin Coast, Taiwan. Water 10:988. doi: 10.3390/w10080988
Intergovernmental Oceanographic Commission (1999). ITSU Tsunami Warning System in the Pacific Master Plan, 2 Edn. Paris: UNESCO, 34.
Kawai, H., Satoh, M., Kawaguchi, K., and Seki, K. (2014). 2010 Chile and 2011 Tohoku tsunami profiles measured by GPS buoys and coastal wave and tide gauges in a Nationwide Ocean Wave Information Network for ports and harbors. J. Waterway Port Coast. Ocean Eng. 140, 135–145. doi: 10.1061/(ASCE)WW.1943-5460.0000235
Kuo, Y. C., Lee, M. A., and Chang, Y. (2020). Satellite observations of typhoon-induced sea surface temperature variability in the upwelling region off Northeastern Taiwan. Rem. Sens. 12:3321. doi: 10.3390/rs12203321
Leadbetter, A. M., Lowry, R. K., and Clements, D. O. (2014). Putting meaning into NETMAR – the open service network for marine environmental data. Int. J. Digit. Earth 7, 811–828. doi: 10.1080/17538947.2013.781243
Lee, B. C., Fan, Y. M., Chen, J. M., Terng, C. T., and Chu, C. H. (2011). “Verification on swell simulation of WAVEWATCH III wave modeling,” in Proceedings of the Twenty-first International Offshore and Polar Engineering Conference, Maui.
Lee, B. C., Fan, Y. M., Chuang, L. Z.-H., and Kao, C. C. (2009). Parametric sensitivity analysis of the WAVEWATCH III model. Terrest. Atmos. Ocean. Sci. 20, 425–432. doi: 10.3319/TAO.2008.04.25.01(Oc)
Lin, S. C., Wu, T. R., Yen, E., Chen, H. Y., Hsu, J., Tsai, Y. L., et al. (2015). Development of a tsunami early warning system for the South China Sea. Ocean Eng. 100, 1–18. doi: 10.1016/j.oceaneng.2015.02.003
Lin-Ye, J., Garcia-Leon, M., Gracia, V., and Sanchez-Arcilla, A. (2016). A multivariate statistical model of extreme events: an application to the Catalan coast. Coast. Eng. 117, 138–156. doi: 10.1016/j.coastaleng.2016.08.002
Mason, E., Ruiz, S., Bourdalle-Badie, R., Reffray, G., García-Sotillo, M., and Pascual, A. (2019). New insight into 3-D mesoscale eddy properties from CMEMS operational models in the western Mediterranean. Ocean Sci. 15, 1111–1131. doi: 10.5194/os-15-1111-2019
Merrifield, M. A., Firing, Y. L., Aarup, T., Agricole, W., Brundrit, G., Chang-Seng, D., et al. (2005). Tide gauge observations of the Indian Ocean tsunami, December 26, 2004. Geophys. Res. Lett. 32:L09603. doi: 10.1029/2005GL022610
Mungov, G., Eble, M., and Bouchard, R. (2013). DART(A(R)) tsunameter retrospective and real-time data: a reflection on 10 years of processing in support of tsunami research and operations. Pure Appl. Geophys. 170, 1369–1384. doi: 10.1007/s00024-012-0477-5
Necmioglu, O. (2016). Design and challenges for a tsunami early warning system in the Marmara Sea. Earth Planets Space 68:13. doi: 10.1186/s40623-016-0388-2
Niclasen, B. A., Simonsen, K., and Magnusson, A. K. (2010). Wave forecasts and small-vessel safety: a review of operational warning parameters. Mar. Struct. 23, 1–21. doi: 10.1016/j.marstruc.2010.02.001
Palazov, A., Ciliberti, S., Peneva, E., Gregoire, M., Staneva, J., Lemieux-Dudon, B., et al. (2019). Black sea observing system. Front. Mar. Sci. Ocean Observ. 19:315. doi: 10.3389/fmars.2019.00315
Pattiaratchi, C. B., and Wijeratne, E. M. (2009). Tide Gauge Observations of 2004-2007 Indian Ocean Tsunamis from Sri Lanka and Western Australia. Pure Appl. Geophys. 166, 233–258. doi: 10.1007/978-3-0346-0064-4_12
Percival, D. B., Denbo, D. W., Eble, M. C., Gica, E., Huang, P. Y., Mofjeld, H. O., et al. (2015). Detiding DART(A(R)) buoy data for real-time extraction of source coefficients for operational tsunami forecasting. Pure Appl. Geophys. 172, 1653–1678. doi: 10.1007/s00024-014-0962-0
Rahayu, H. P., Comfort, L. K., Haigh, R., Amaratunga, D., and Khoirunnisa, D. (2020). A study of people-centered early warning system in the face of near-field tsunami risk for Indonesian coastal cities. Int. J. Disast. Resil. Built Environ. 11, 241–262. doi: 10.1108/IJDRBE-10-2019-0068
Schoene, T., Illigner, J., Manurung, P., Subarya, C., Khafid, Zech, C., et al. (2011). GPS-controlled tide gauges in Indonesia - a German contribution to Indonesia’s Tsunami Early Warning System. Nat. Hazards Earth Syst. Sci. 11, 731–740. doi: 10.5194/nhess-11-731-2011
Shareef, M. M. (2014). Effective use of GIS for visualizing forecasted meteorological and marine data. Meteorol. Appl. 21, 340–349. doi: 10.1002/met.1343
Shih, H. J., Chen, H., Liang, T. Y., Fu, H. S., Chang, C. H., Chen, W. B., et al. (2018). Generating potential risk maps for typhoon-induced waves along the coast of Taiwan. Ocean Eng. 163, 1–14. doi: 10.1016/j.oceaneng.2018.05.045
Smedstad, O. M., Cummings, J. A., Metzger, E. J., Hurlburt, H. E., Wallcraft, A. J., Franklin, D. S., et al. (2010). The 1/12 degree Global HYCOM Nowcast/Forecast System. EGU Gen. Assembly 2010:2839.
Smith, G., and Juria, N. (2019). Diagnosis of historical inundation events in the Marshall Islands to assist early warning systems. Nat. Hazards 99, 189–216. doi: 10.1007/s11069-019-03735-9
Storto, A., Masina, S., Simoncelli, S., Iovino, D., Cipollone, A., Drevillon, M., et al. (2019). The added value of the multi-system spread information for ocean heat content and steric sea level investigations in the CMEMS GREP ensemble reanalysis product. Clim. Dyn. 53, 287–312. doi: 10.1007/s00382-018-4585-5
Sun, C. (2018). US DOC/NOAA/NESDIS National Centers for Environmental Information. NCEI Standard Product: Global Ocean Currents Database (GOCD). Silver Spring: NOAA.
Tamura, H., Waseda, T., and Miyazawa, Y. (2009). Freakish sea state and swell-windsea coupling: Numerical study of the Suwa-Maru incident. Geophys. Res. Lett. 36:L01607. doi: 10.1029/2008GL036280
Tao, A., Yan, J., Pei, Y., Zheng, J., and Mori, N. (2017). Swells of the East China Sea. J. Ocean Univ. China 16, 674–682. doi: 10.1007/s11802-017-3406-5
Toffoli, A., Lefe‘vre, J. M., Bitner-Gregersen, E., and Monbaliu, J. (2005). Towards the identification of warning criteria: Analysis of a ship accident database. Appl. Ocean Res. 27, 281–291. doi: 10.1016/j.apor.2006.03.003
Traon, P. Y. L., Reppucci, A., Fanjul, E. A., Aouf, L., Behrens, A., Belmonte, M., et al. (2019). From observation to information and users: the copernicus marine service perspective. Front. Mar. Sci. 6:234. doi: 10.3389/fmars.2019.00234
Trulsen, K., Nieto Borge, J. C., Gramstad, O., Aouf, L., and Lefevre, J. M. (2015). Crossing sea state and rogue wave probability during the Prestige accident. J. Geophys. Res. Oceans 120, 7113–7136. doi: 10.1002/2015JC011161
Voronina, T. A., Voronin, V. V., and Cheverda, V. A. (2019). The 2015 Illapel Tsunami source recovery by inversion of DART Tsunami Waveforms using the R-Solution Method. Pure Appl. Geophys. 176, 2985–2993. doi: 10.1007/s00024-019-02100-y
Waseda, T., Tamura, H., and Kinoshita, T. (2012). Freakish sea index and sea states during ship accidents. J. Mar. Sci. Technol. 17, 305–314. doi: 10.1007/s00773-012-0171-4
Wu, T.-R., Tsai, Y.-L., and Terng, C.-T. (2017). The recent development of storm surge modeling in Taiwan. Proc. IUTAM 25, 70–73. doi: 10.1016/j.piutam.2017.09.011
Yu, H., Zhang, Y. J., Yu, J. C. S., Chu, C. H., and Terng, C. T. (2019). Ocean Forecast System Around Taiwan and Upcoming Data Assimilation Development. American Geophysical Union, Fall Meeting 2019, abstract #OS11D-1497. Washington, DC: American Geophysical Union.
Yu, Y.-C., Chen, H., Shih, H.-J., Chang, C.-H., Hsiao, S.-C., Chen, W.-B., et al. (2019). Assessing the potential highest storm tide hazard in Taiwan based on 40-year historical typhoon surge Hindcasting. Atmosphere 10:346. doi: 10.3390/atmos10060346
Yuk, J. H., Kim, K. O., Jung, K. T., and Choi, B. H. (2016). Swell prediction for the Korean coast. J. Coast. Res. 32, 131–141. doi: 10.2112/JCOASTRES-D-14-00208.1
Keywords: marine environment monitoring service (MEMS), hazardous waves, tsunami, swell, the warning modules
Citation: Doong D-J, Fan Y-M, Chen JY and Kao CC (2021) Analysis of Long-Period Hazardous Waves in the Taiwan Marine Environment Monitoring Service. Front. Mar. Sci. 8:657569. doi: 10.3389/fmars.2021.657569
Received: 23 January 2021; Accepted: 26 March 2021;
Published: 16 April 2021.
Edited by:
Manuel Espino Infantes, Polytechnic University of Catalonia, SpainReviewed by:
Umesh P. A., University of Bologna, ItalyCopyright © 2021 Doong, Fan, Chen and Kao. This is an open-access article distributed under the terms of the Creative Commons Attribution License (CC BY). The use, distribution or reproduction in other forums is permitted, provided the original author(s) and the copyright owner(s) are credited and that the original publication in this journal is cited, in accordance with accepted academic practice. No use, distribution or reproduction is permitted which does not comply with these terms.
*Correspondence: Yang-Ming Fan, eW1mYW5AbWFpbC5uY2t1LmVkdS50dw==
Disclaimer: All claims expressed in this article are solely those of the authors and do not necessarily represent those of their affiliated organizations, or those of the publisher, the editors and the reviewers. Any product that may be evaluated in this article or claim that may be made by its manufacturer is not guaranteed or endorsed by the publisher.
Research integrity at Frontiers
Learn more about the work of our research integrity team to safeguard the quality of each article we publish.