 Hector Lobeto
 Melisa Menendez
 Iñigo J. Losada
94% of researchers rate our articles as excellent or good
Learn more about the work of our research integrity team to safeguard the quality of each article we publish.
Find out more
BRIEF RESEARCH REPORT article
Front. Mar. Sci. , 20 May 2021
Sec. Global Change and the Future Ocean
Volume 8 - 2021 | https://doi.org/10.3389/fmars.2021.655490
This article is part of the Research Topic Advances in Sea State Modeling and Climate Change Impacts View all 19 articles
Based on a novel approach, present-day and future spectral wind-wave conditions in a high-emission scenario from a seven-member wave climate projection ensemble are compared. The spectral analysis at the selected locations aids in understanding the propagation of swell projected changes from the generation areas across the ocean basins. For example, a projected increase in the energy from Southern Ocean swells can be observed in all ocean basins and both hemispheres, which is especially relevant in the west coast of North America due to the penetration of these swells beyond 30°N. Similarly, a consistent decrease in the energy of large northern Atlantic swells is noted close to the equator. This work provides evidence that assessments based on only integrated wave parameters (e.g., significant wave height and mean wave period) can mask information about the sign, magnitude, and robustness of the actual wave climate changes due to the offset of positive and negative variations within the spectrum, leading to a significant underestimation of the change associated with certain wave systems.
The sea surface elevation spectrum constitutes the most complete way to describe wind waves as a stochastic process. This spectrum represents the distribution of energy resulting from the contributions of several superimposed waves with different periods and directions that reach a particular location (Holthuijsen, 2007), and it is essential for assessing coastal processes and engineering designs. The distribution and magnitude of the energy within the spectrum provide information about the number of wave systems it contains, as well as their degree of development. Two are the main ways to represent the spectral energy: in terms of the wave frequency (hereinafter known as frequency spectrum) and in terms of wave frequency and wave propagation direction (hereinafter known as directional spectrum). The frequency spectrum has been used extensively by fitting observations to parametric spectral forms (e.g., JONSWAP and Pierson-Moskowitz). Directional spectra provide additional information by characterizing how wave energy is spread along directional sectors, enabling us to undertake a more detailed analysis of the wave climatology in a particular location (Espejo et al., 2014; Shimura and Mori, 2019) and to identify the different wave systems reaching it (Portilla-Yandún et al., 2015). More recently, directional spectra have been utilized to develop studies at global scale, assessing the wave climate seasonality through the identification of wave modes and their variations throughout the year (Echevarria et al., 2019), as well as their relation with climate teleconnection patterns (Echevarria et al., 2020).
The prominent role of wind-generated waves in ocean sea surface dynamics (Cavaleri et al., 2012) implies that changes in magnitude, direction, and frequency may have a notable impact on offshore related economic activities (e.g., offshore industry and shipping routes) and in coastal areas, affecting processes such as shoreline erosion (Toimil et al., 2020) and flooding (Hemer et al., 2012a; Melet et al., 2018; Kirezci et al., 2020). Projected changes in wind-generated waves induced by climate change have thus been widely studied, especially during the last decade (e.g., Hemer et al., 2013; Mori et al., 2013), to assess both the magnitude of future variations and associated uncertainty (Morim et al., 2019). The numerous studies that have been conducted are usually developed on the outputs of general circulation model (GCM)-based wave climate projection ensembles, covering different greenhouse-gas (GHG) concentrations scenarios and temporal horizons. The GCMs are characterized by systematic biases caused by factors such as the spatial resolution or the simplifications introduced by the parametrization of physical processes (Maraun et al., 2017), hence also inducing biases in projections of wind waves (Hemer et al., 2012b). Despite bias correction (BC) is usual practice in climatic variables such as precipitation or temperature, its application in wave climate ensembles is relatively recent. In this regard, since its need was demonstrated (Lemos et al., 2020a), BC has been applied in various wave climate studies (Lemos et al., 2020b; Meucci et al., 2020; Lobeto et al., 2021). All these researches apply BC to ensembles of integrated wave parameters, not existing, to the best of our knowledge, any study applying BC to wave spectra.
Despite the wave spectrum fully describes the wind wave climate, almost all the studies on changes in wave climate due to climate change assess the projected variations in representative integrated wave parameters. The reasons behind this simplification lie in the huge storage capacity demanded by directional spectra and the extended use of integrated parameters in multiple formulations related to the design of marine structures and coastal processes. In particular, the usual approach relates the expected changes in wave climate with future changes in significant wave height (Hs; e.g., Fan et al., 2013; Wang et al., 2014), which have led to a consensus about the expected changes in annual and seasonal mean Hs in some regions along the global ocean. In this regard, there exist agreement on an increase in Hs in the Southern Ocean and tropical eastern Pacific and a decrease in the North Atlantic Ocean, northwestern Pacific, and Mediterranean Sea (Morim et al., 2018; Oppenheimer et al., 2019). Nonetheless, a deeper understanding of these future variations needs the study of a wider number of variables, such as period and direction, especially considering the notable role their changes may have in coastal impacts (e.g., van Gent et al., 2008; Harley et al., 2017). The assessment of changes in period and direction through parameters, such as mean wave period (Tm) and mean wave direction (Dirm), is now common practice (e.g., Casas-Prat et al., 2018), which offers a closer vision to the expected change in the full wave spectrum. In the same vein, there is an increasing interest in evaluating the effect of climate change in variables that integrate different parameters and provide more complete information about wave climate. For example, the wave energy flux (e.g., Mentaschi et al., 2017), a variable that integrates wave height and wave period, has been proven to be a valid indicator of global warming (Reguero et al., 2019) and provided robust changes in areas where Hs changes alone have great uncertainty (Lemos et al., 2019). However, none of the described studies provide any information about the projected changes in the different wave systems reaching a certain location as it can only be derived from directional spectra.
Based on the above information and to gain a broader understanding of how the global wave climate will be affected by climate change, as well as its consequences for impact assessments, this study attempts to explore the future changes in directional spectra under a high-emission scenario across all ocean regions. We aim to show the added value offered by a novel approach that explore simultaneously the effect of climate change on the energy, period, and direction of the waves, unraveling as well the differences with respect to the standard use of projected integrated wave parameters.
Global wave climate projections are generated using the third-generation numerical wave model WaveWatch III v4.18 (Tolman, 2014). Surface-wind fields and ice coverage outputs from CMIP5 GCMs are considered as inputs to develop a seven-member ensemble (further information in Supplementary Material). Present-day and future wave conditions are characterized through 20-year time slices (1986–2005 and 2081–2100, respectively). The RCP8.5 greenhouse gas (GHG) emission scenario, one of the representative concentration pathways (RCPs) covered in the Fifth Assessment Report (AR5) from the International Panel on Climate Change (IPCC; Cubasch et al., 2013), is selected to conduct the research. This scenario represents a concentration trajectory characterized by a radiative forcing of 8.5 W/m2 by 2100 in the absence of a drastic reduction in GHG emission rates. In addition, GOW2 wave hindcast (Perez et al., 2017) is used as reference data for the present-day wave climate, both to analyze the mean wave climatology and to assess the magnitude of the systematic biases in the projections by comparing the annual mean wave spectrum (Supplementary Material).
The projected changes from directional spectra are analyzed at 14 selected locations according to geographical and physical criteria (Figure 1). Concerning the former, we choose a representative sample of regional wave conditions along the global coast. Thus, six points are selected in the Pacific basin, three along the east coast (P2, P11, and P12) and another three along the west coast (P1, P9, and P10). Six points are also analyzed in the Atlantic basin, three in the west coast (P3, P4, and P13) and three more along the east coast (P5, P6, and P7). Finally, two more points are selected in the Indian basin (P8 and P14). Physical criteria account, first, for a multimodal wave climate at the target locations (Echevarria et al., 2019), i.e., reached by multiple wave systems. Second, the selected locations should be at a distance to the coast higher than 30 km to avoid local diffraction and/or non-linear processes due to propagation in shallow waters.
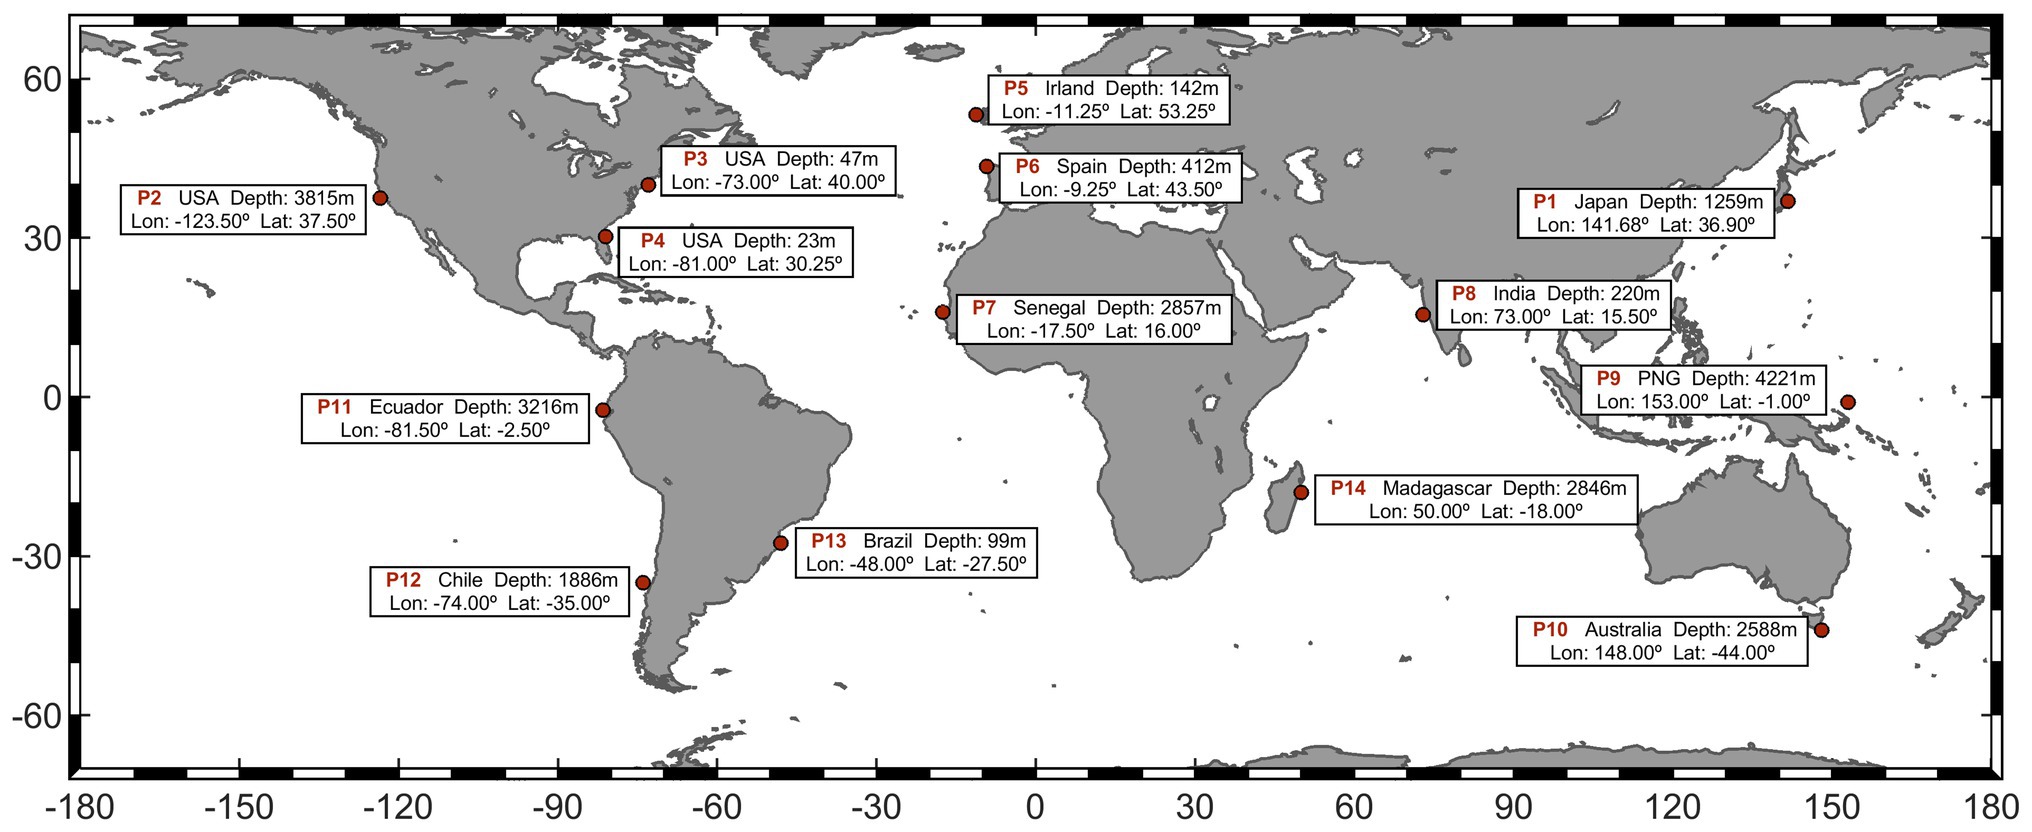
Figure 1. Target points selected to develop the analysis. For each location, the closest country, coordinates, and depth are shown.
As a result of the simulations, hourly time series of directional spectra are stored at the target locations (Figure 1), discretized in 32 frequency bins, exponentially distributed from 0.0373 to 0.7159 Hz (i.e., from 1.4 to 26.8 s) and 24 directional sectors of 15° each, i.e., each spectrum is divided into 768 frequency-direction spectral bins (hereinafter spectral bins).
The projected change for each GCM is obtained as the difference between the annual mean spectrum of future and present-day wave climate. The ensemble mean change is then calculated as the average of the individual changes for each GCM (Eq. 1), i.e., we assume equal contributions from all the ensemble members.
where N is the number of models, is the projected ensemble mean change, is the mean wave spectrum for the present climate (1986–2005), and is the mean wave spectrum for the future climate (2081–2100).
The uncertainty of the projected change is assessed based on a method proposed in the AR5 report (Tebaldi et al., 2011; Collins et al., 2013), which consists in the analysis of its significance first and then considering the agreement in the sign of change between the members of the wave climate projection ensemble. Nevertheless, as the number of selected models is notably smaller than in the study defining the method (21 vs. 7), we require a stricter agreement between members to consider the changes to be robust. Namely, more than 80% of the models (≥6) must present a statistically significant change, and at least 80% of them must agree on the sign of change. The statistical significance is calculated by applying a Welch’s t-test to the mean of the reference and future periods at the 95% confidence level. The consideration of an unequal variance t-test lies in the possible shift of the energy along the frequency and direction axes in the future, hence causing a change in the energy variance at each spectral bin with respect to the present-day climate. Spectral bins in which the change is found to be robust are highlighted. Only changes above 1% of the maximum change within the spectrum are highlighted to ease the understanding of the results.
The spectral approach enables the detailed study of future changes in wave energy, providing the variations at each spectral bin. Similarly, it is possible to assess how the bulk of the energy moves along the frequency axis. To this end, for each direction, we calculate the range of periods within which the energy interquartile range is concentrated at present and in the future, and then we determine its shift. Nevertheless, an accurate analysis of wave climate spectral changes at each of these locations also requires specific study of local wind conditions and the geometry of the coast to account for reflections. Considering the main purpose of this work, we focus on only the main wave systems that reach the target points, neglecting the small changes related to local wind seas, which represent a very small percentage of the total energy in the spectrum.
Below, we provide a brief description of the present-day wave climate at each location (Figure 2) and the main projected changes by the end of the century under the RCP8.5 scenario (Figure 3). For completeness, the shift in the energy interquartile range for each direction is shown (Figure 4). The information provided by the assessment of the directional spectra that cannot be obtained from integrated wave parameters is highlighted.
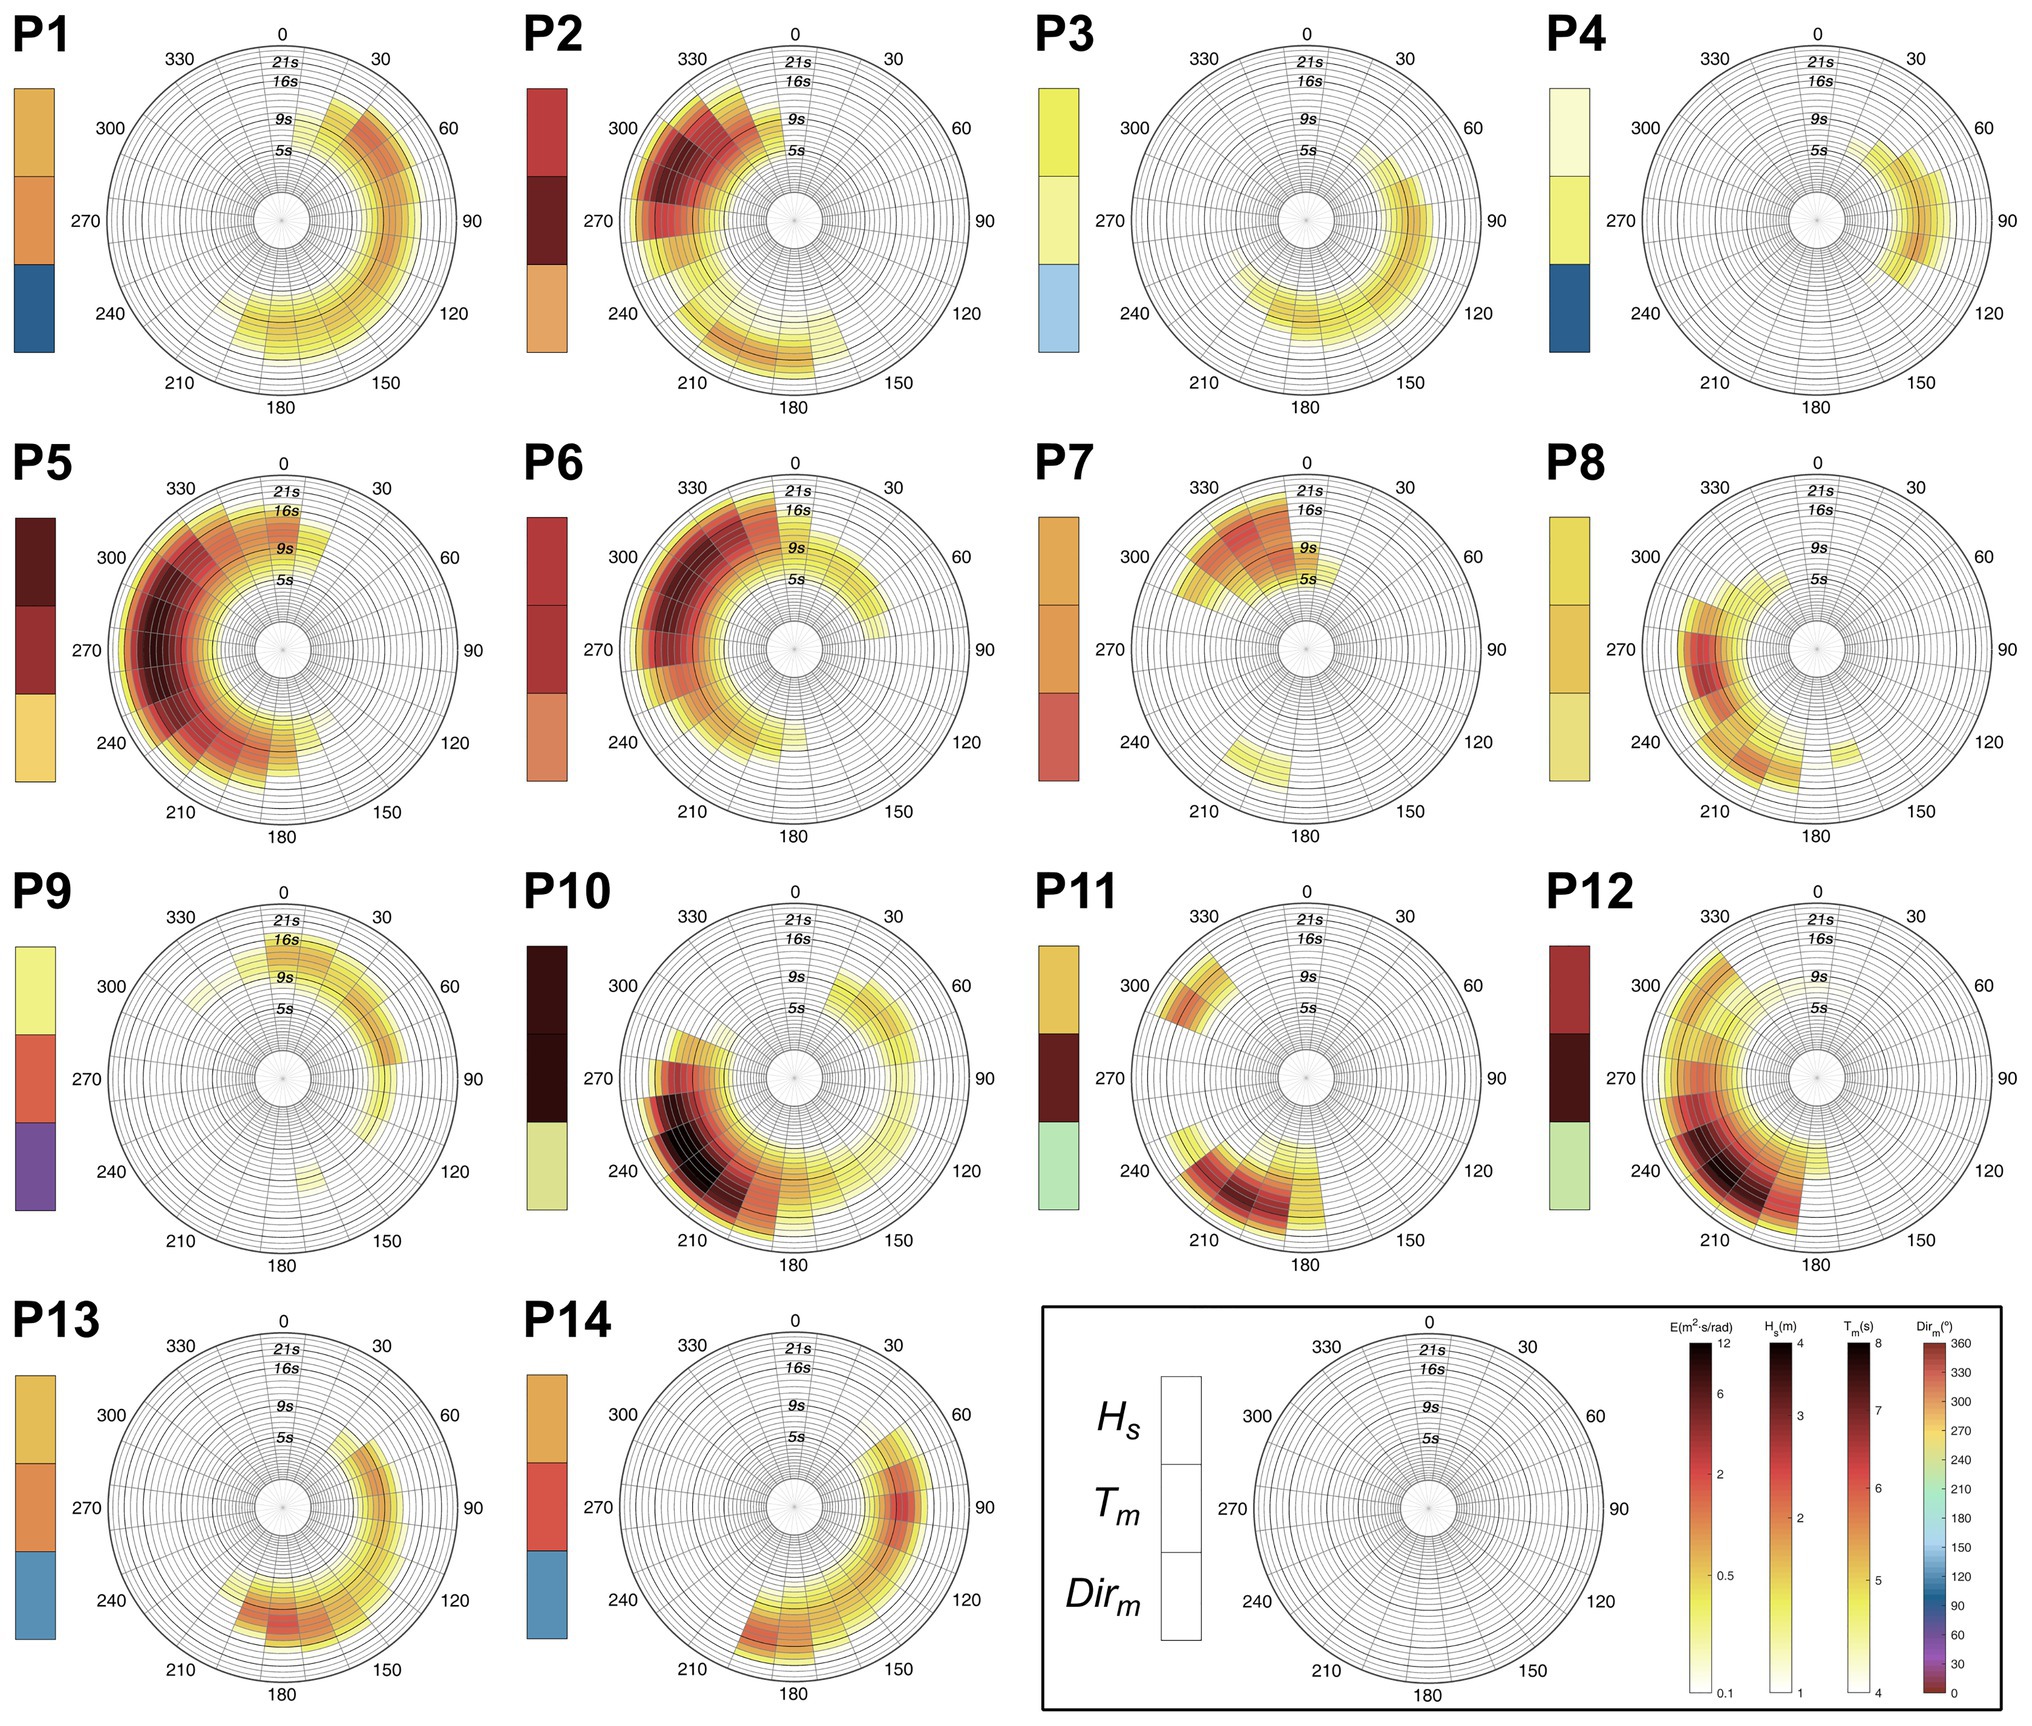
Figure 2. Present-day (1986–2005) mean wave climate at the analyzed locations from GOW2 hindcast. Polar plots: annual mean spectral energy. Left boxes (from top to bottom): annual mean significant wave height (Hs), mean wave period (Tm), and mean wave direction (Dirm). The color bars used to represent each variable are displayed in the bottom-right part of the panel. From left to right: energy (m2 s/rad), Hs (m), Tm (s), and Dirm (°).
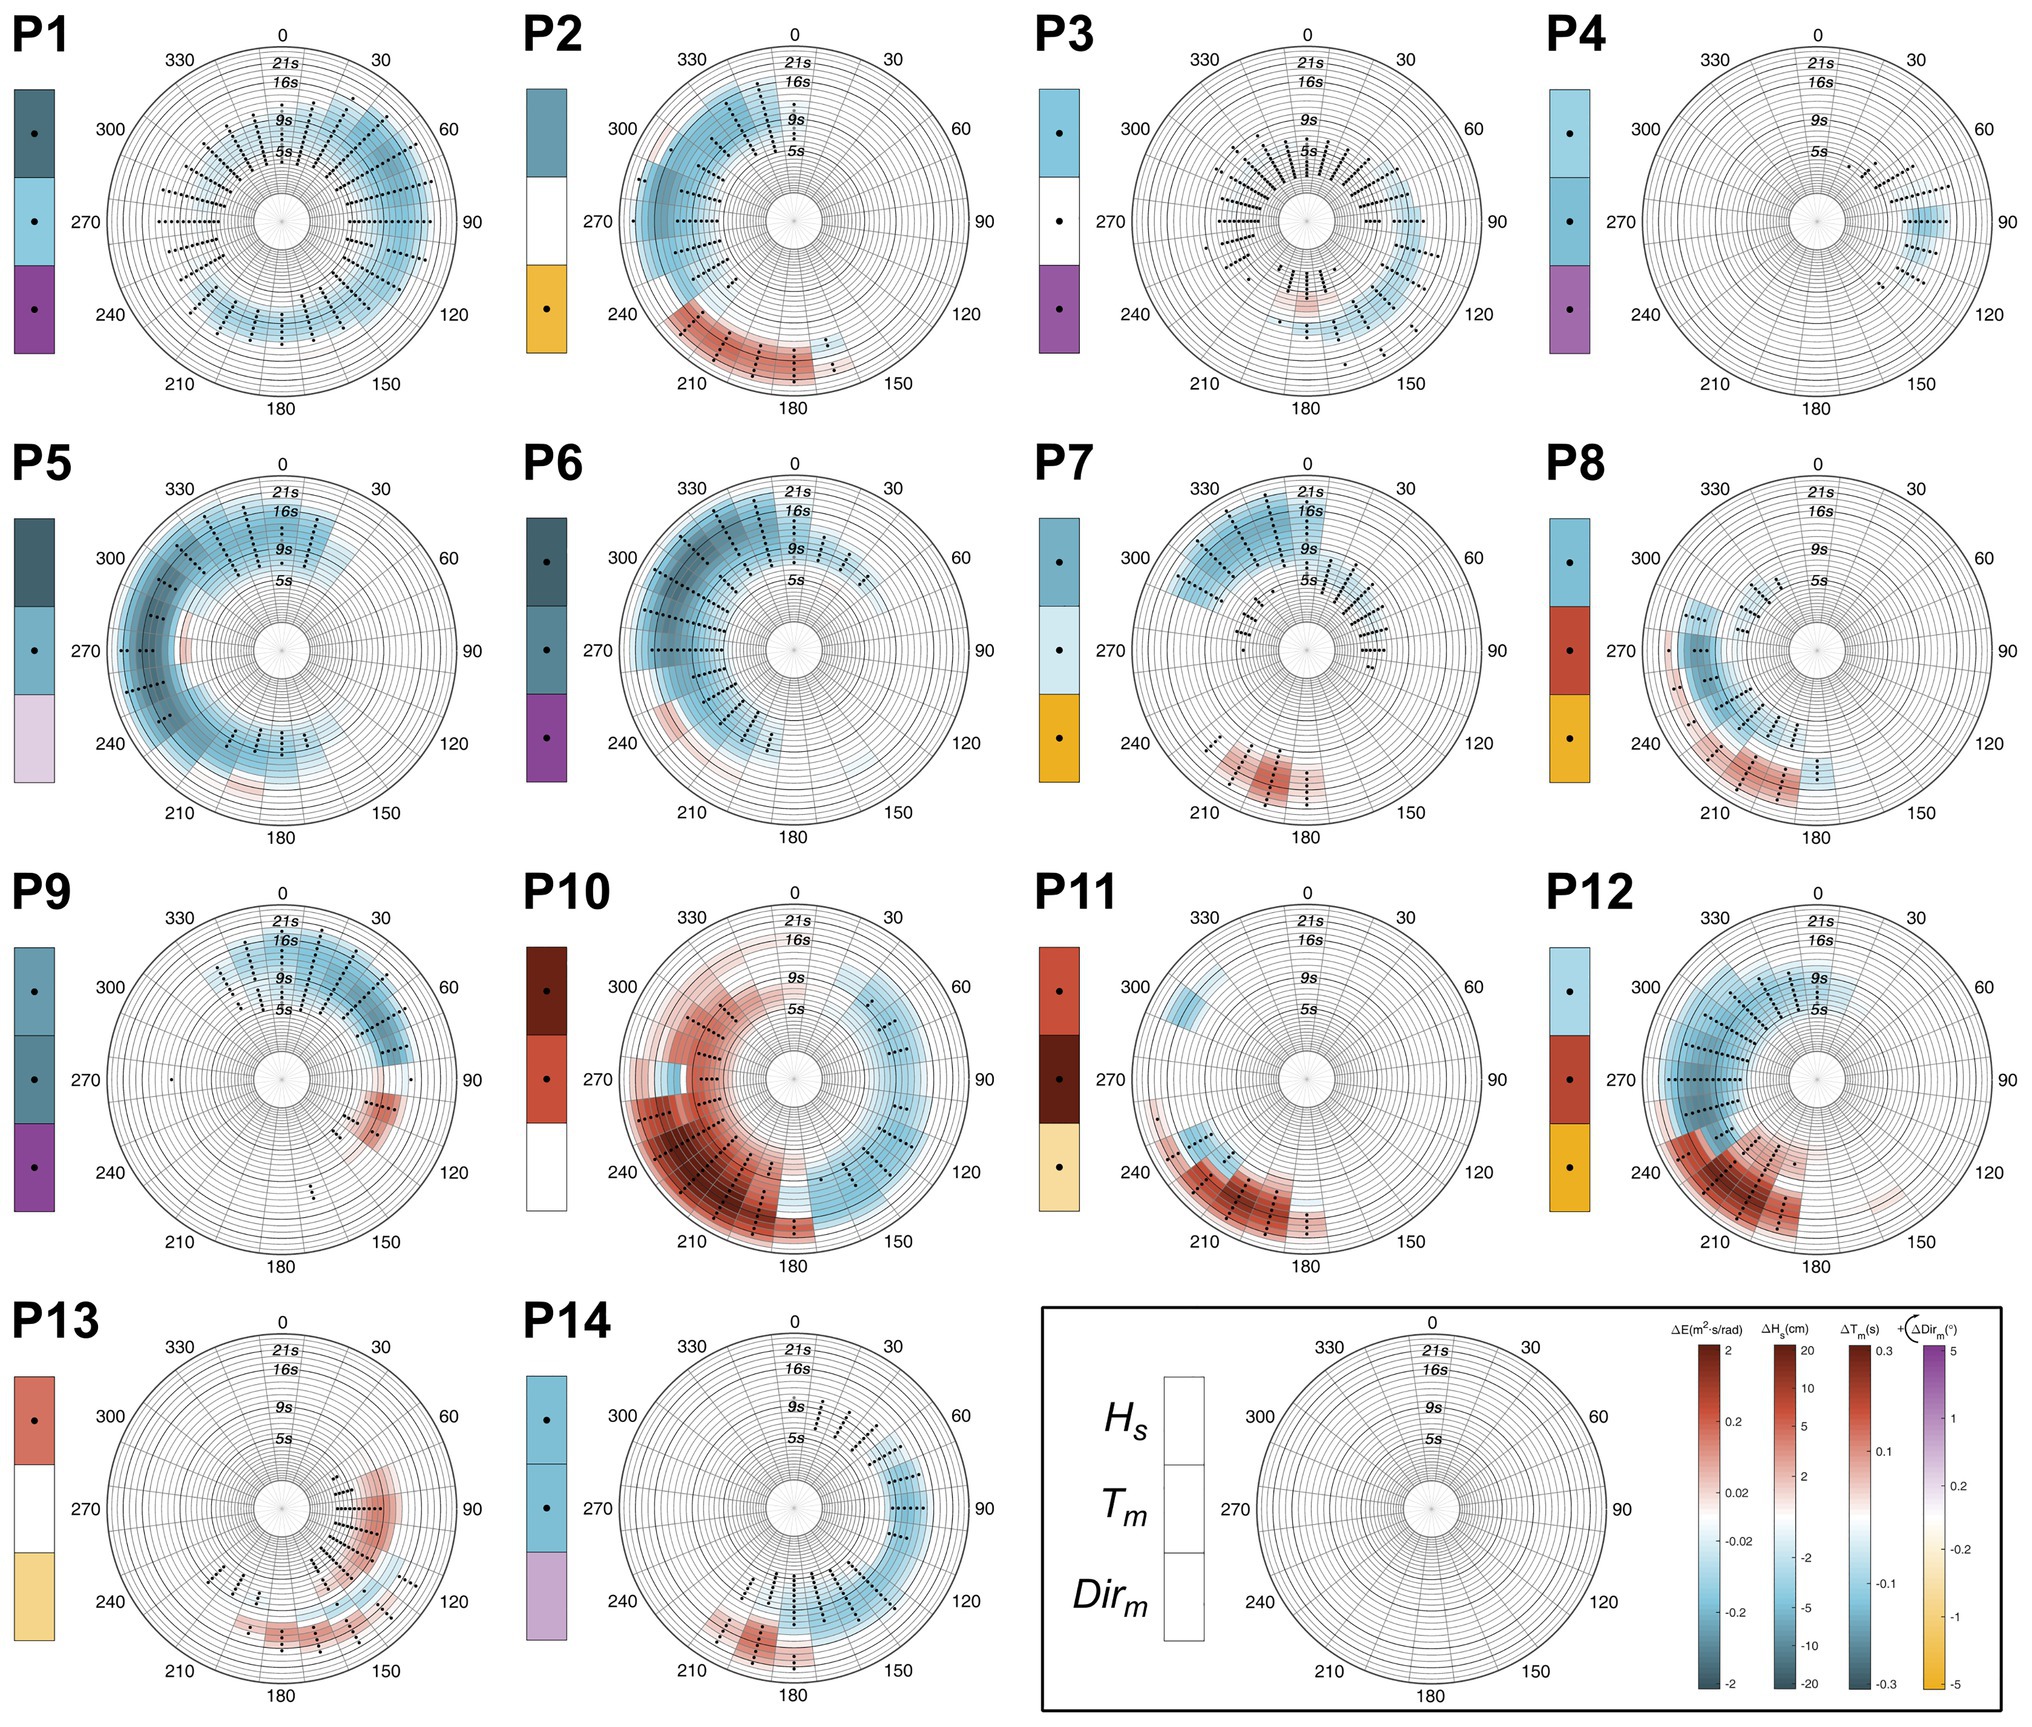
Figure 3. Projected changes at the analyzed locations by the end of the century (2081–2100) under the RCP8.5 scenario with respect to present-day wave climate (1986–2005). Polar plots: multimodel ensemble mean change in annual mean spectral energy. Left boxes (from top to bottom): multimodel ensemble mean changes in annual mean significant wave height (Hs), mean wave period (Tm), and mean wave direction (Dirm). Stippling denotes statistically significant change and agreement in the sign of change in at least 80% of the models. The color bars used to represent the change in each variable are displayed in the bottom-right part of the panel. From left to right: energy (m2 s/rad), Hs (cm), Tm (s), and Dirm (°).
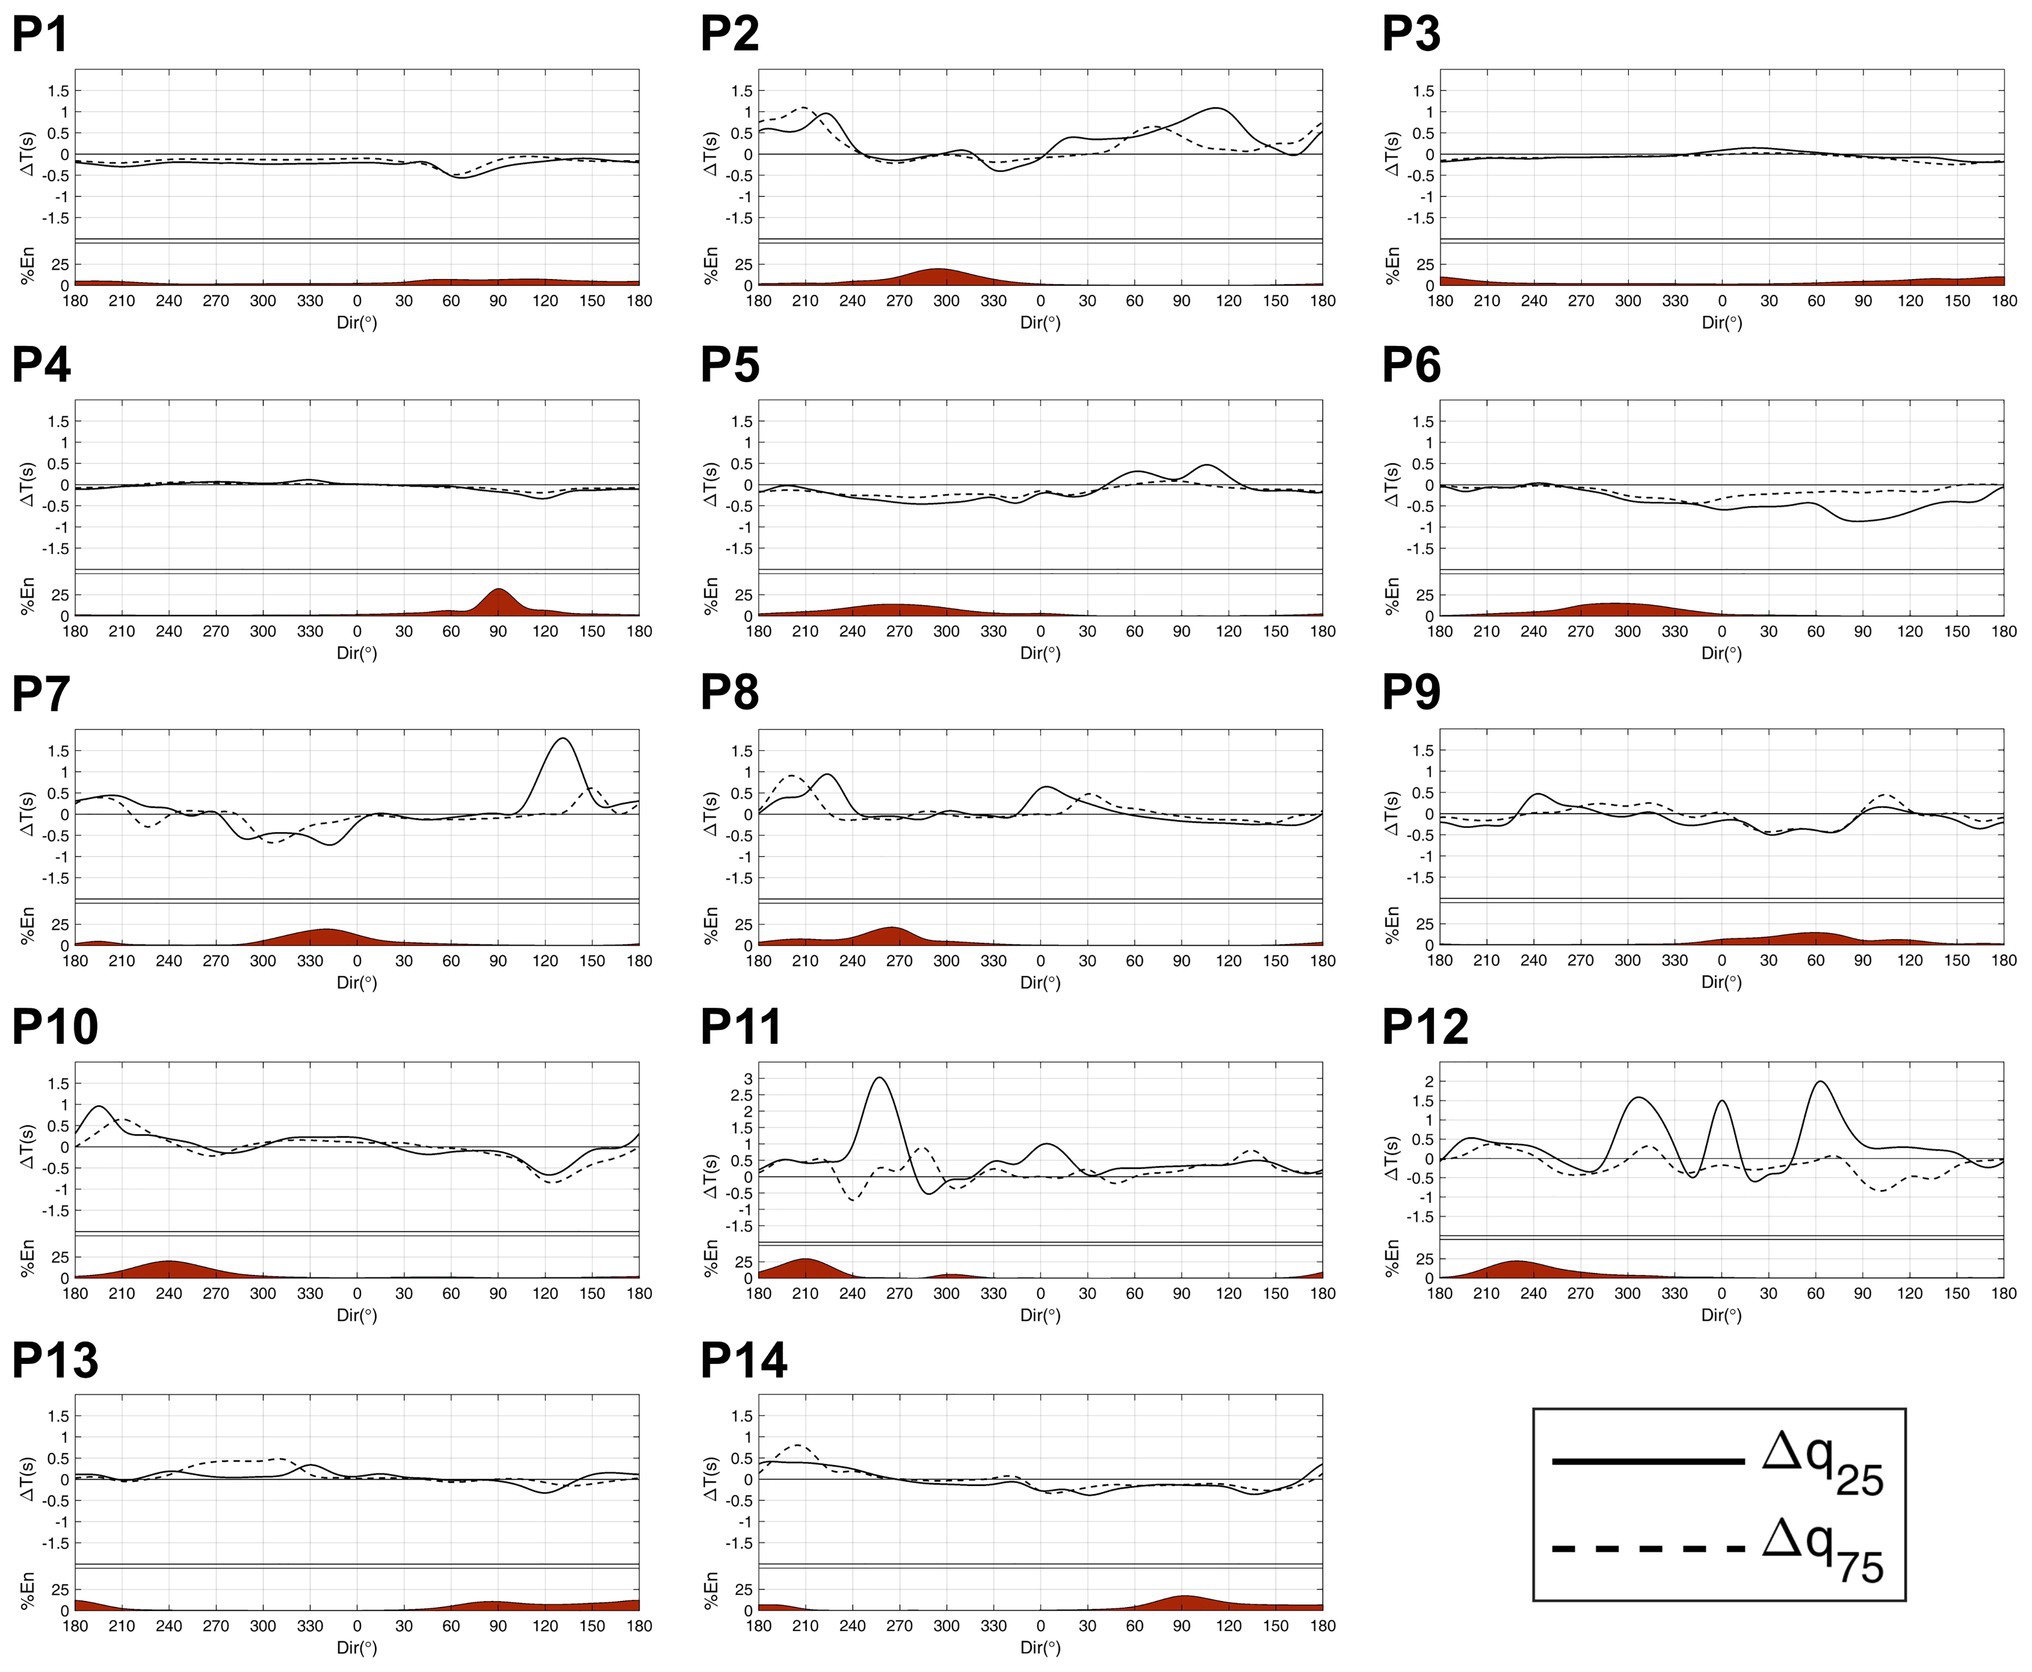
Figure 4. Shift in the energy interquartile range between the present (1986–2005) and the end of the century (2086–2100) under RCP8.5 scenario. For each panel: shift in seconds of the quantile 0.25 (solid line) and the quantile 0.75 (dashed line) of the energy for each direction. Percentage of energy coming from each direction (in red).
P5 and P6 are in the northeastern Atlantic on the European coast. Most of the wave energy at these points is carried by swells propagating from the west at P5 and northwest at P6, which are generated under extratropical storms crossing the northernmost Atlantic Ocean (Camus et al., 2014; Pérez et al., 2014). These points show the greatest decrease in energy among all the locations analyzed (Figure 3), as well as a shift to lower periods (Figure 4). A closer look at P5 also highlights an expected robust negative change in the low-energetic swells coming from the north and the wind seas from the south. Analogously, the results at P6 also show a future decrease in the wind seas coming from the northeast and southwest. This negative pattern at both points agrees with the expected decrease in Hs and with the results obtained in previous studies regarding projected changes in wave height along the European Atlantic coast (Bricheno and Wolf, 2018). Although P7 is also located in the northeastern Atlantic, its lower latitude (16° north) causes it to not only be affected by swells generated in the Northern Hemisphere (NH) but also by swells that travel from the Southern Hemisphere (SH) that cross the equator, especially during austral winter (Semedo et al., 2011; Supplementary Figure 1). This point is also reached by the wind seas coming from the northeast and northwest with a mean period of approximately 8 s (Figure 2). Therefore, the robust decreases in Hs and Tm integrate the variations in these four wave systems, concealing the nonuniform behavior of the spectral projected changes (i.e., there are spectral bins with both signs of change). Thus, while an increase and displacement to higher periods are expected for swells generated in the SH, a decrease is projected in the energy carried by swells and wind seas from the North Atlantic Ocean, which agrees with the results at P5 and P6.
The North Atlantic west coast is represented by P3 and P4, which are low energy locations affected by low-period waves. Most of the energy that reaches P4 comes from waves generated by trade winds in the tropical North Atlantic that propagate from the east with a mean period of approximately 9 s. The results show a robust decrease in this energy and a shift to lower periods, agreeing with the projected decreases in Hs and Tm. P3 is mainly affected by swells generated in the tropical-north trade wind region coming from the southeast and two local wind-wave systems that propagate from the south and east. Spectral results show a generalized projected decrease and a negligible shift in the energy that is consistent with the decrease expected in Hs and the almost null decrease in Tm. P13 is located on the coast of Brazil in the tropical southwestern Atlantic. The mean wave climate indicates that it is mainly affected by swells generated in the Southern Ocean that propagate from the south, swells generated in the tropical south Atlantic coming from the east and wind waves propagating from a direction of approximately 200°. The projected increase in Hs agrees with the change expected for the energy carried by southern and eastern swells. However, while a displacement of the energy to higher periods is expected for swells from the Southern Ocean, the opposite is obtained for eastern waves, which likely causes the very low projected change found in Tm.
P2 is located on the west coast of North America, so it is mainly affected by the swells generated by extratropical storms in the North Pacific. This point is also affected by wind seas coming from the northwest and by mature energetic swells generated in the Southern Ocean that penetrate the NH mostly during austral winter (Young, 1999; Semedo et al., 2011; Supplementary Figure 2). The results show a robust projected increase in southern swells with periods between 14 and 22 s. Nevertheless, a consistent change is not found for the largest swells generated in the northernmost Pacific, as has been found in the Atlantic (i.e., periods above 14 s). Figure 4 displays a notable shift in the southern energy to higher periods and an almost null shift in the north Pacific energy. The integration of all these spectral changes leads to an uncertain decrease in Hs and a very small increase in Tm that mask the important increase expected for long southern swells.
The southeastern Pacific wave climate is studied at locations P11 and P12. The main energy contributors to the total energy at these points are swells generated in the Southern Ocean. Despite their southern latitude, both points still receive a low amount of energy during boreal winter carried by very long swells from the NH (Supplementary Figures 3, 4); together with P2, this provides evidence of the seasonal displacement of the swell front in the eastern Pacific (Young, 1999). Regarding P11, a bipolar change pattern in the energy coming from southern mid-latitudes can be observed, showing a robust increase in the swells generated below approximately 40°S and a consistent decrease in waves from higher latitudes. The shift to higher periods and the large changes expected for the energy carried by the southernmost swells induce a projected increase in Hs and Tm. The results at P12 exhibit the same robust bipolar pattern as at P11 and an increase in wind seas propagating from the south. The balance between spectral energy variations with different signs is clearly the cause of the low negative change expected in Hs, which is not reflecting, as it occurs at P2, the notable increase expected for very energetic Southern Ocean swells. Finally, a robust decreasing signal is not found for long swells coming from the NH at P11 and P12, corroborating the results at P2.
The northwestern Pacific coast is represented by a point located on the east coast of Japan (P1). This point is affected by the energetic swells generated in the northernmost Pacific, swells coming from the east, and swells from the south. The projected spectral changes highlight a robust decrease in energy and a remarkable shift to lower periods that is consistent with the projected negative changes in Hs and Tm. P9 is close to the equator (latitude 1°S) and is sheltered from the Southern Ocean swells due to the presence of Australia and multiple islands. Therefore, most of the energy arriving at this point is carried by the waves originating in the NH, namely swells coming from the north and northeast. However, a swell system generated in the tropical south Pacific propagating from the southeast is still discernible. Regarding the projected changes, an energy increase with a slight shift to higher periods likely related to the found intensification of southeasterly trades (Timmermann et al., 2010), is expected for southern waves, and in line with the results at P1, a robust decrease with a shift to lower periods can be observed in the wave systems generated in the NH. The preponderant role of northern wave systems induces negative projected changes in Hs and Tm, precluding the possibility of reaching any conclusion about future variations in energy from SH waves. Finally, the southwestern Pacific wave climate is studied at P10, a point located in the Southern Ocean and affected by highly energetic swells generated by southern westerly winds. In addition, it is also reached by swells coming from the southeast and northeast and wind seas coming from the west. Projected spectral changes show a robust bipolar pattern characterized by an increase in wave systems with a western component and a decrease in wave systems coming from the eastern directional sectors. Therefore, the consistent increase obtained in Hs involves a great loss of information since it cannot account for the important projected decrease in waves coming from the east. Moreover, Figure 4 shows a shift in energy to higher periods for swells propagating from the southwest and the opposite for waves coming from the east, resulting in a robust projected increase in Tm that masks the existent energy shift to lower periods.
Changes in the wave conditions in the Indian basin are studied at P14 and P8. The mean wave climate shows that P14 is mainly reached by three wave systems: the Southern Ocean swells from the south and the southeast and the tropical-north swells from the northeast. While a robust increase is obtained in swells from the south, a consistent decrease is seen for the other two wave systems. In addition, a shift to lower periods is observed for waves coming from the east, and in agreement with previous locations, a shift to higher periods is observed for the Southern Ocean energy. Although robust decreases in Hs and Tm are obtained, the consideration of changes from integrated parameters prevents the derivation of the clear increase found for southern swells. Regarding P8, although it is located in tropical northern Indian, it is still affected by swells generated in the Southern Ocean that travel beyond the equator. This point also receives waves generated in the tropical Indian Ocean propagating from the west that are especially strong during the summer monsoon season (Portilla-Yandún, 2018) and wind waves from the northwest. A projected uncertain decrease is observed for tropical swells with no clear energy shift. By contrast, a robust increase in the energy carried by swells generated in the Southern Ocean with a shift to higher periods is found. Integrated wave parameters indicate a consistent decrease in Hs, which conceals the change in southern swells, as seen at P14.
The assessment of the projected changes at each location independently provides us a global overview of the spectral changes and allows us to draw some conclusions about the future behavior of energetic swells (large-period swells) along the world’s coasts. Results evidence a robust increase in the energy carried by swells generated by extratropical cyclone activity in the Southern Ocean below approximately 40°S that can be observed at points located in the Southern Pacific (e.g., P11 and P12), Atlantic (P13), and Indian basins (P14). Similarly, the propagation of these swells beyond the equator makes it feasible to note this consistent increase in northern locations, such as on the west coast of North America, Senegal, and India (P2, P7, and P8, respectively). This positive change may be related to the increase in energy transferred to the ocean surface due to the expected intensification of surface westerly winds in the roaring forties and furious fifties regions (Swart and Fyfe, 2012) and could also be favored by the fetch increase caused by the expected reduction in ice coverage in high latitudes (Thomson and Rogers, 2014). Regarding changes in northern energetic swells, a clear decrease in the energy carried by swells generated by extratropical storms in the northernmost Atlantic can be observed at points located in Europe (P5 and P6) and with a lower magnitude along the tropical coast of Africa (P7). Nonetheless, a robust change cannot be found in the energetic swells (periods above 14 s) coming from the northernmost Pacific on the coast of North America (P2) or at points located in the SH that still receive northern mature swells during boreal winter (P11 and P12).
The assessment of projected wave climate changes from directional spectra provides information that cannot be obtained from the commonly used method based on integrated wave parameters. While the spectral approach allows us to separately analyze the sign and magnitude of change from different swells and seas that reach a certain location, the consideration of changes from integrated wave parameters necessarily overlooks the existence of positive and negative variations within the spectrum. Similarly, the analysis of wave climate changes following the standard approach may entail an underestimation of the actual changes due to the integration of variations with opposite sign from different wave systems. The results on the coast of Chile (P12; Figure 3) are clear evidence for this statement. Notwithstanding that the projected change from integrated parameters indicates a low decrease in significant wave height, future changes from directional spectra show a clear bipolar change pattern characterized by positive and negative variations with a high magnitude (increase for southwestern swells and decrease for western swells). This issue can also be seen in other locations, such as the west coast of North America (P2) and southwestern Indian (P14).
Moreover, the uncertainty assessment of the projected changes denotes that the spectral analysis can provide consistent results for some of the wave systems that integrate the spectrum, even when the projected changes from integrated wave parameters exhibit a lack of robustness. This can be observed at points in both the Pacific (P2) and Atlantic (P5) basins. In this regard, although changes in significant wave height are not robust in the northwestern Pacific coast, spectral changes indicate that the future variations in large swells propagating from the Southern Ocean at P2 are still robust. Similarly, a strong conclusion about the future behavior of northern swells and southern seas can be derived at P5 on the British coast from the spectral approach despite the great uncertainty associated with the change in significant wave height.
The spectral analysis also shows a misleading climate change signal from the mean wave period. Again, there can be an offset of variations with opposite sign that can drive a deceptive change, making it unfeasible to observe the existence of negative and positive variations and more importantly, to see the actual magnitude of the projected change associated to each wave system. From the number of locations analyzed, a clear increase in periods in the Southern Ocean energetic swells can be seen. Nevertheless, the assessment from integrated parameters masks this projected increase when these swells are not the main energy contributor at the location of analysis. The points located in the tropical eastern Atlantic (P7) and southeastern Pacific (P12) are two examples of this issue.
The use of integrated wave parameters can have severe implications in locations where an increase and shift in the energy carried by recurrent wave systems to higher periods are masked. In other words, although a decrease can be projected for integrated parameters, such as the mean period or significant wave height, the spectral approach can show a notable increase in wave systems periodically reaching a certain location. Separately assessing the projected changes in the most severe wave systems that reach the coast, especially at coastal stretches affected by a multimodal wave climate, can help to more accurately determine the impacts derived from changes in wave conditions in view of the significant influence that wave period and direction have on coastal processes.
The present study is developed without correcting the existing systematic bias of the wave climate projections (Supplementary Figures 5–18). In this regard, despite BC has recently been shown to be optimal to obtain more accurate projected changes in integrated wave parameters (Lemos et al., 2020a), its application to directional spectra is yet to be addressed. Furthermore, the way of application of BC to integrated wave parameters (e.g., quantile mapping) cannot be directly extrapolated to directional spectra. As previously seen, future changes do not only apply to the energy magnitude within the spectrum, since shifts along the frequency and direction axes may also occur. The energy in a certain spectral bin at present could move to another one in the future, therefore, introducing an important error if we correct the bias equally in both time periods. In addition, the bias assessment indicates a heterogeneous bias pattern within the spectrum for some locations (e.g., P7 and P10), precluding a proportional correction based on the comparison of an integrated parameter such as the total energy. Despite the lack of BC, since its application do not alter the sign of the projected changes (Lemos et al., 2020a), and we are comparing ensemble changes of integrated parameters and wave directional spectra from the same models (i.e., affected by the same GCM biases), the obtained results can be considered as a reliable evidence of the added value offered by the spectral approach. Nevertheless, further research is needed to raise a BC technique applicable to spectra that accounts for the described issues and helps to provide more accurate changes.
We consider that the results presented in this study offer a clear vision of the potential contribution of directional spectra within the understanding of wave climate projected changes and their implications, which is evidence of a misleading climate change signal in some cases according to the standard approach based on integrated wave parameters. These insights, together with the technological progress that boosts storage in larger databases, encourage the development of deeper studies that are not constrained to a limited number of locations and the annual mean climate, opening the door to a much more advanced comprehension of the future behavior of wind waves in entire regions.
The raw data supporting the conclusions of this article will be made available by the authors, without undue reservation.
HL, MM, and IL designed the research, analyzed the results, and wrote the paper. HL performed the research. All authors contributed to the article and approved the submitted version.
HL and MM acknowledge the support by the Spanish Ministry of Science and Innovation (MICINN, grants FPU17/06203 and RYC-2014-16469, respectively). This work is funded by EXCEED (grant RTI2018-096449-B-I00) from the Spanish State Research Agency.
The authors declare that the research was conducted in the absence of any commercial or financial relationships that could be construed as a potential conflict of interest.
The Supplementary Material for this article can be found online at: https://www.frontiersin.org/articless/10.3389/fmars.2021.655490/full#supplementary-material
Bricheno, L. M., and Wolf, J. (2018). Future wave conditions of Europe, in response to high-end climate change scenarios. J. Geophys. Res. Oceans 123, 8762–8791. doi: 10.1029/2018JC013866
Camus, P., Menéndez, M., Méndez, F. J., Izaguirre, C., Espejo, A., Cánovas, V., et al. (2014). A weather-type statistical downscaling framework for ocean wave climate. J. Geophys. Res. Oceans 119, 7389–7405. doi: 10.1002/2014JC010141
Casas-Prat, M., Wang, X. L., and Swart, N. (2018). CMIP5-based global wave climate projections including the entire Arctic Ocean. Ocean Model. 123, 66–85. doi: 10.1016/j.ocemod.2017.12.003
Cavaleri, L., Fox-Kemper, B., and Hemer, M. (2012). Wind waves in the coupled climate system. Bull. Am. Meteorol. Soc. 93, 1651–1661. doi: 10.1175/BAMS-D-11-00170.1
Collins, M., Knutti, R., Arblaster, J., Dufresne, J.-L., Fichefet, T., Friedlingstein, P., et al. (2013). “Long-term climate change: projections, commitments and irreversibility,” in Climate Change 2013: The Physical Science Basis. Contribution of Working Group I to the Fifth Assessment Report of the Intergovernmental Panel on Climate Change. eds. T. F. Stocker, D. Quin, G.-K. Plattner, M. Tignor, S. K. Allen, and J. Boschung, et al. (Cambridge, United Kingdom and New York, NY, USA: Cambridge University Press).
Cubasch, U., Wuebbles, D., Chen, D., Facchini, M. C., Frame, D., Mahowald, N., et al. (2013). “Introduction,” in Climate Change 2013: The Physical Science Basis. Contribution of Working Group I to the Fifth Assessment Report of the Intergovenermnetal Panel on Climate Change. eds. T. F. Stocker, D. Quin, G.-K. Plattner, M. Tignor, S. K. Allen, and J. Boschung, et al. (Cambridge, United Kingdom and New York, NY, USA: Cambridge University Press).
Echevarria, E. R., Hemer, M. A., and Holbrook, N. J. (2019). Seasonal variability of the global spectral wind wave climate. J. Geophys. Res. Oceans 124, 2924–2939. doi: 10.1029/2018JC014620
Echevarria, E. R., Hemer, M. A., Holbrook, N. J., and Marshall, A. G. (2020). Influence of the Pacific-South American modes on the global spectral wind-wave climate. J. Geophys. Res. Oceans 125, 1–16. doi: 10.1029/2020JC016354
Espejo, A., Camus, P., Losada, I. J., and Méndez, F. J. (2014). Spectral Ocean wave climate variability based on atmospheric circulation patterns. J. Phys. Oceanogr. 44, 2139–2152. doi: 10.1175/JPO-D-13-0276.1
Fan, Y., Held, I. M., Lin, S. J., and Wang, X. L. (2013). Ocean warming effect on surface gravity wave climate change for the end of the twenty-first century. J. Clim. 26, 6046–6066. doi: 10.1175/JCLI-D-12-00410.1
Harley, M. D., Turner, I. L., Kinsela, M. A., Middleton, J. H., Mumford, P. J., Splinter, K. D., et al. (2017). Extreme coastal erosion enhanced by anomalous extratropical storm wave direction. Sci. Rep. 7:6033. doi: 10.1038/s41598-017-05792-1
Hemer, M. A., Fan, Y., Mori, N., Semedo, A., and Wang, X. L. (2013). Projected changes in wave climate from a multi-model ensemble. Nat. Clim. Chang. 3, 471–476. doi: 10.1038/nclimate1791
Hemer, M. A., McInnes, K. L., and Ranasinghe, R. (2012a). Climate and variability bias adjustment of climate model-derived winds for a southeast Australian dynamical wave model. Ocean Dyn. 62, 87–104. doi: 10.1007/s10236-011-0486-4
Hemer, M. A., Wang, X. L., Weisssse, R., and Swail, V. R. (2012b). Advancing wind-waves climate science: The COWCLIP project. Bull. Am. Meteorol. Soc. 93, 791–796. doi: 10.1175/BAMS-D-11-00184.1
Holthuijsen, L. H. (2007). Waves in Oceanic and Coastal Waters. Cambridge: Cambridge University Press.
Kirezci, E., Young, I. R., Ranasinghe, R., Muis, S., Nicholls, R. J., Lincke, D., et al. (2020). Projections of global-scale extreme sea levels and resulting episodic coastal flooding over the 21st century. Sci. Rep. 10:11629. doi: 10.1038/s41598-020-67736-6
Lemos, G., Menendez, M., Semedo, A., Camus, P., Hemer, M., Dobrynin, M., et al. (2020a). On the need of bias correction methods for wave climate projections. Glob. Planet. Chang. 186:103109. doi: 10.1016/j.gloplacha.2019.103109
Lemos, G., Semedo, A., Dobrynin, M., Behrens, A., Staneva, J., Bidlot, J. R., et al. (2019). Mid-twenty-first century global wave climate projections: results from a dynamic CMIP5 based ensemble. Glob. Planet. Chang. 172, 69–87. doi: 10.1016/j.gloplacha.2018.09.011
Lemos, G., Semedo, A., Dobrynin, M., Menendez, M., and Miranda, P. M. A. (2020b). Bias-corrected cmip5-derived single-forcing future wind-wave climate projections toward the end of the twenty-first century. J. Appl. Meteorol. Climatol. 59, 1393–1414. doi: 10.1175/JAMC-D-19-0297.1
Lobeto, H., Menendez, M., and Losada, I. J. (2021). Future behavior of wind wave extremes due to climate change. Sci. Rep. 11:7869. doi: 10.1038/s41598-021-86524-4
Maraun, D., Shepherd, T. G., Widmann, M., Zappa, G., Walton, D., Gutiérrez, J. M., et al. (2017). Towards process-informed bias correction of climate change simulations. Nat. Clim. Chang. 7, 764–773. doi: 10.1038/nclimate3418
Melet, A., Meyssignac, B., Almar, R., and Le Cozannet, G. (2018). Under-estimated wave contribution to coastal sea-level rise. Nat. Clim. Chang. 8, 234–239. doi: 10.1038/s41558-018-0088-y
Mentaschi, L., Vousdoukas, M. I., Voukouvalas, E., Dosio, A., and Feyen, L. (2017). Global changes of extreme coastal wave energy fluxes triggered by intensified teleconnection patterns. Geophys. Res. Lett. 44, 2416–2426. doi: 10.1002/2016GL072488
Meucci, A., Young, I. R., Hemer, M., Kirezci, E., and Ranasinghe, R. (2020). Projected 21st century changes in extreme wind-wave events. Sci. Adv. 6, 7295–7305. doi: 10.1126/sciadv.aaz7295
Mori, N., Shimura, T., Yasuda, T., and Mase, H. (2013). Multi-model climate projections of ocean surface variables under different climate scenarios-future change of waves, sea level and wind. Ocean Eng. 71, 122–129. doi: 10.1016/j.oceaneng.2013.02.016
Morim, J., Hemer, M., Cartwright, N., Strauss, D., and Andutta, F. (2018). On the concordance of 21st century wind-wave climate projections. Glob. Planet. Chang. 167, 160–171. doi: 10.1016/j.gloplacha.2018.05.005
Morim, J., Hemer, M., Wang, X. L., Cartwright, N., Trenham, C., Semedo, A., et al. (2019). Robustness and uncertainties in global multivariate wind-wave climate projections. Nat. Clim. Chang. 9, 711–718. doi: 10.1038/s41558-019-0542-5
Oppenheimer, M., Glavovic, B., Hinkel, J., van de Wal, R., Magnan, A. K., Abd-Elgawad, A., et al. (2019). Sea level rise and implications for low lying islands, coasts and communities. In IPCC Special Report on the Ocean and Cryosphere in a Changing Climate.
Pérez, J., Méndez, F. J., Menéndez, M., and Losada, I. J. (2014). ESTELA: a method for evaluating the source and travel time of the wave energy reaching a local area. Ocean Dyn. 64, 1181–1191. doi: 10.1007/s10236-014-0740-7
Perez, J., Menendez, M., and Losada, I. J. (2017). GOW2: a global wave hindcast for coastal applications. Coast. Eng. 124, 1–11. doi: 10.1016/j.coastaleng.2017.03.005
Portilla-Yandún, J. (2018). The global signature of ocean wave spectra. Geophys. Res. Lett. 45, 267–276. doi: 10.1002/2017GL076431
Portilla-Yandún, J., Cavaleri, L., and Van Vledder, G. P. (2015). Wave spectra partitioning and long term statistical distribution. Ocean Model. 96, 148–160.
Reguero, B. G., Losada, I. J., and Méndez, F. J. (2019). A recent increase in global wave power as a consequence of oceanic warming. Nat. Commun. 10:205. doi: 10.1038/s41467-018-08066-0
Semedo, A., SušElj, K., Rutgersson, A., and Sterl, A. (2011). A global view on the wind sea and swell climate and variability from ERA-40. J. Clim. 24, 1461–1479. doi: 10.1175/2010JCLI3718.1
Shimura, T., and Mori, N. (2019). High-resolution wave climate hindcast around Japan and its spectral representation. Coast. Eng. 151, 1–9. doi: 10.1016/j.coastaleng.2019.04.013
Swart, N. C., and Fyfe, J. C. (2012). Observed and simulated changes in the Southern Hemisphere surface westerly wind-stress. Geophys. Res. Lett. 39, 6–11. doi: 10.1029/2012GL052810
Tebaldi, C., Arblaster, J. M., and Knutti, R. (2011). Mapping model agreement on future climate projections. Geophys. Res. Lett. 38, 1–5. doi: 10.1029/2011GL049863
Thomson, J., and Rogers, W. E. (2014). Swell and sea in the emerging Arctic Ocean. Geophys. Res. Lett. 41, 3136–3140. doi: 10.1002/2014GL059983
Timmermann, A., McGregor, S., and Jin, F. F. (2010). Wind effects on past and future regional sea level trends in the southern Indo-Pacific. J. Clim. 23, 4429–4437. doi: 10.1175/2010JCLI3519.1
Toimil, A., Camus, P., Losada, I. J., Le Cozannet, G., Nicholls, R. J., Idier, D., et al. (2020). Climate change-driven coastal erosion modelling in temperate sandy beaches: methods and uncertainty treatment. Earth Sci. Rev. 202:103110. doi: 10.1016/j.earscirev.2020.103110
Tolman, H. L. (2014). Development GroupUser Manual and System Documentation of WAVEWATCH III® version 4.18. Technical Note 316, NOAA/NWS/NCEP/MMAB, 282.
van Gent, M. R. A., van Thiel de Vries, J. S. M., Coeveld, E. M., de Vroeg, J. H., and van de Graaff, J. (2008). Large-scale dune erosion tests to study the influence of wave periods. Coast. Eng. 55, 1041–1051. doi: 10.1016/j.coastaleng.2008.04.003
Wang, X. L., Feng, Y., and Swail, V. R. (2014). Changes in global ocean wave heights as projected using multimodel CMIP5 simulations. Geophys. Res. Lett. 41, 1026–1034. doi: 10.1002/2013GL058650
Keywords: ocean waves, wave climate projections, wave energy, swell, wind-wave spectrum
Citation: Lobeto H, Menendez M and Losada IJ (2021) Projections of Directional Spectra Help to Unravel the Future Behavior of Wind Waves. Front. Mar. Sci. 8:655490. doi: 10.3389/fmars.2021.655490
Edited by:
Giovanni Besio, University of Genoa, ItalyReviewed by:
Lorenzo Mentaschi, Joint Research Centre (JRC), BelgiumCopyright © 2021 Lobeto, Menendez and Losada. This is an open-access article distributed under the terms of the Creative Commons Attribution License (CC BY). The use, distribution or reproduction in other forums is permitted, provided the original author(s) and the copyright owner(s) are credited and that the original publication in this journal is cited, in accordance with accepted academic practice. No use, distribution or reproduction is permitted which does not comply with these terms.
*Correspondence: Hector Lobeto, bG9iZXRvaEB1bmljYW4uZXM=
Disclaimer: All claims expressed in this article are solely those of the authors and do not necessarily represent those of their affiliated organizations, or those of the publisher, the editors and the reviewers. Any product that may be evaluated in this article or claim that may be made by its manufacturer is not guaranteed or endorsed by the publisher.
Research integrity at Frontiers
Learn more about the work of our research integrity team to safeguard the quality of each article we publish.