 Lixin Zhu
 Changzi Ge1
 Gang Hou
94% of researchers rate our articles as excellent or good
Learn more about the work of our research integrity team to safeguard the quality of each article we publish.
Find out more
ORIGINAL RESEARCH article
Front. Mar. Sci., 30 November 2021
Sec. Marine Fisheries, Aquaculture and Living Resources
Volume 8 - 2021 | https://doi.org/10.3389/fmars.2021.652293
This article is part of the Research TopicData-limited Research in Stock Assessment to Increase the Understanding of Fisheries Resources and Inform and Improve Management EffortsView all 23 articles
This paper presents a framework for quantifying uncertainty in per-recruit analysis for small yellow croaker (Larimichthys polyactis) fisheries in China, in which credible estimates of life history parameters from Bayesian inference were used to generate the distribution for a quantity of interest. Small yellow croakers were divided into five spatial groups. The status of each group was examined using a yield-per-recruit (YPR) model and a spawning stock biomass-per-recruit (SSBPR) model. The optimal length at first capture (Lcopt) was proposed to recover the biomass. The maximum observed age in the current stocks (3 years) and the maximum recorded age (≥20 years) were adopted in per-recruit analysis. Our results suggest that the framework can quantify uncertainty well in the output of per-recruit analysis for small yellow croaker. It is suited to other fish species. The SSBPR at FMSY (SSBPRMSY) is a better benchmark than the spawning potential ratio (SPR) at FMSY because SSBPRMSY had a unimodal distribution. The SSBPR analysis can lead to a more conservative Lcopt than the YPR analysis. The key factor influencing the assessment conclusions may be the growth parameters rather than the natural mortality rate for a stock with a younger maximum age. Overfishing likely occurred for all groups and recruitment overfishing may not occur if the maximum age is maintained at 3 years. Increasing lengths at first capture to the recommended values can help this population recover. However, Fcur is too high for small yellow croakers to attain the maximum recorded age. Both reducing fishing mortality rate and increasing length at first capture are needed to attain the maximum recorded age.
Per-recruit models such as the yield-per-recruit (YPR) model and the spawning stock biomass-per-recruit (SSBPR) model are commonly used in fish stock assessments. These models can produce YPR and SSBPR at a fishing mortality rate (F), and biological reference points. Per-recruit models are defined mainly by fish life history parameters, such as the parameters on growth, length–weight relationship (LWR), and natural mortality. Thus, the output of a per-recruit model is primarily dependent on a combination of different types of life history parameters (Restrepo and Fox, 1988). The inherent uncertainty surrounding life history parameters can lead to uncertainty in per-recruit analysis (Chang et al., 2009). Incorrect estimates of biological reference points may be derived if uncertainty in parameters is ignored. Consequently, conclusions about the status of fish stock will be inaccurate (Helser et al., 2001; Chen and Wilson, 2002; Lin et al., 2015). Quantifying uncertainty in assessment results can enhance decision making for fishery resource management and help determine the best harvest strategies (Gavaris, 1993; Doll et al., 2017).
Random values from the distributions of input parameters must be generated to quantify uncertainty in the outcome of per-recruit analysis. Conventionally, these random values are produced by introducing random errors into each subset model with a set of particular estimates. A coefficient of variation (CV) or standard deviation (SD) is often specified for a subset model according to the available knowledge of parameter uncertainty (e.g., Chen and Wilson, 2002; Grabowski and Chen, 2004; Jiao et al., 2005; Chang et al., 2009). The estimated SDs from the observed data can also be used to introduce random errors (Lin et al., 2015). For correlated parameters, random errors can be introduced using the estimated standard errors and the correlation (Hart, 2013), and the covariance matrix constructed by the estimated SDs and the correlation (Lin et al., 2010). For instance, Hart (2013) took the standard error of 0.004 for K and 0.4 for L∞, and the correlation of −0.6 to simulate the negatively correlated parameters K and L∞ in the von Bertalanffy growth model (von Bertalanffy, 1938). Recent advances in Bayesian estimation provide a new method to obtain random values for life history parameters. Bayesian analysis can incorporate multiple sources of information to reduce uncertainty in life history parameter estimates and obtain more realistic estimates of uncertainty (Pulkkinen et al., 2011; Froese et al., 2014; Romakkaniemi, 2015; Zhu et al., 2020). Possible parameter estimates derived from Bayesian inference are given as samples drawn from its posterior distribution using the Markov chain Monte Carlo (MCMC) technique. MCMC samples are a number of estimates for an independent parameter or pairs of estimates for the correlated parameters. MCMC samples can generate distributions for the output of a per-recruit model. Doll et al. (2017) demonstrated that uncertainty in YPR estimates could be measured using the posterior distributions of growth parameters, LWR parameters, and natural mortality rate (M) when a combination of exploitation rate and minimum length limit was given.
Small yellow croaker (Larimichthys polyactis) is a warm-temperate demersal fish species that is distributed throughout the northwest Pacific Ocean (Ma et al., 2017). It is a commercially valuable species in China and inhabits the Bohai Sea, Yellow Sea, and East China Sea (Figure 1). Biological characteristics of the stocks have significantly changed; average body size is smaller and individuals become mature at an earlier age (Jin, 1996; Li et al., 2011; Lin et al., 2011). The maximum age decreased from 21–23 years in the 1960s (Mao et al., 1987; Guo et al., 2006) to 5–7 years in the early and mid-1980s (Mao et al., 1987; Liu et al., 1999; Shui, 2003; Lin et al., 2004; Guo et al., 2006), to 2–4 years in the 1990s and mid-2000s (Liu et al., 1999; Shui, 2003; Lin et al., 2004; Guo et al., 2006; Yan et al., 2006; Chen et al., 2010; Shan et al., 2017). Changes in life history traits of small yellow croaker have been attributed to increased fishing effort (Shan et al., 2013). The population has been at high risk of being overfished in recent years (Ma et al., 2020). Fishing effort needs to be reduced to recover the population to biomass level that supports maximum sustainable yield (MSY) (Ma et al., 2020). However, it is difficult to control fishing effort in China (Shen and Heino, 2014). The fishing effort of small yellow croaker increased each year from 1968 to 2015, with the exception of 1991 (Ma et al., 2020). Measures are urgently needed to reduce fishing pressure on this population. In addition, it is unclear if recruitment overfishing has occurred.
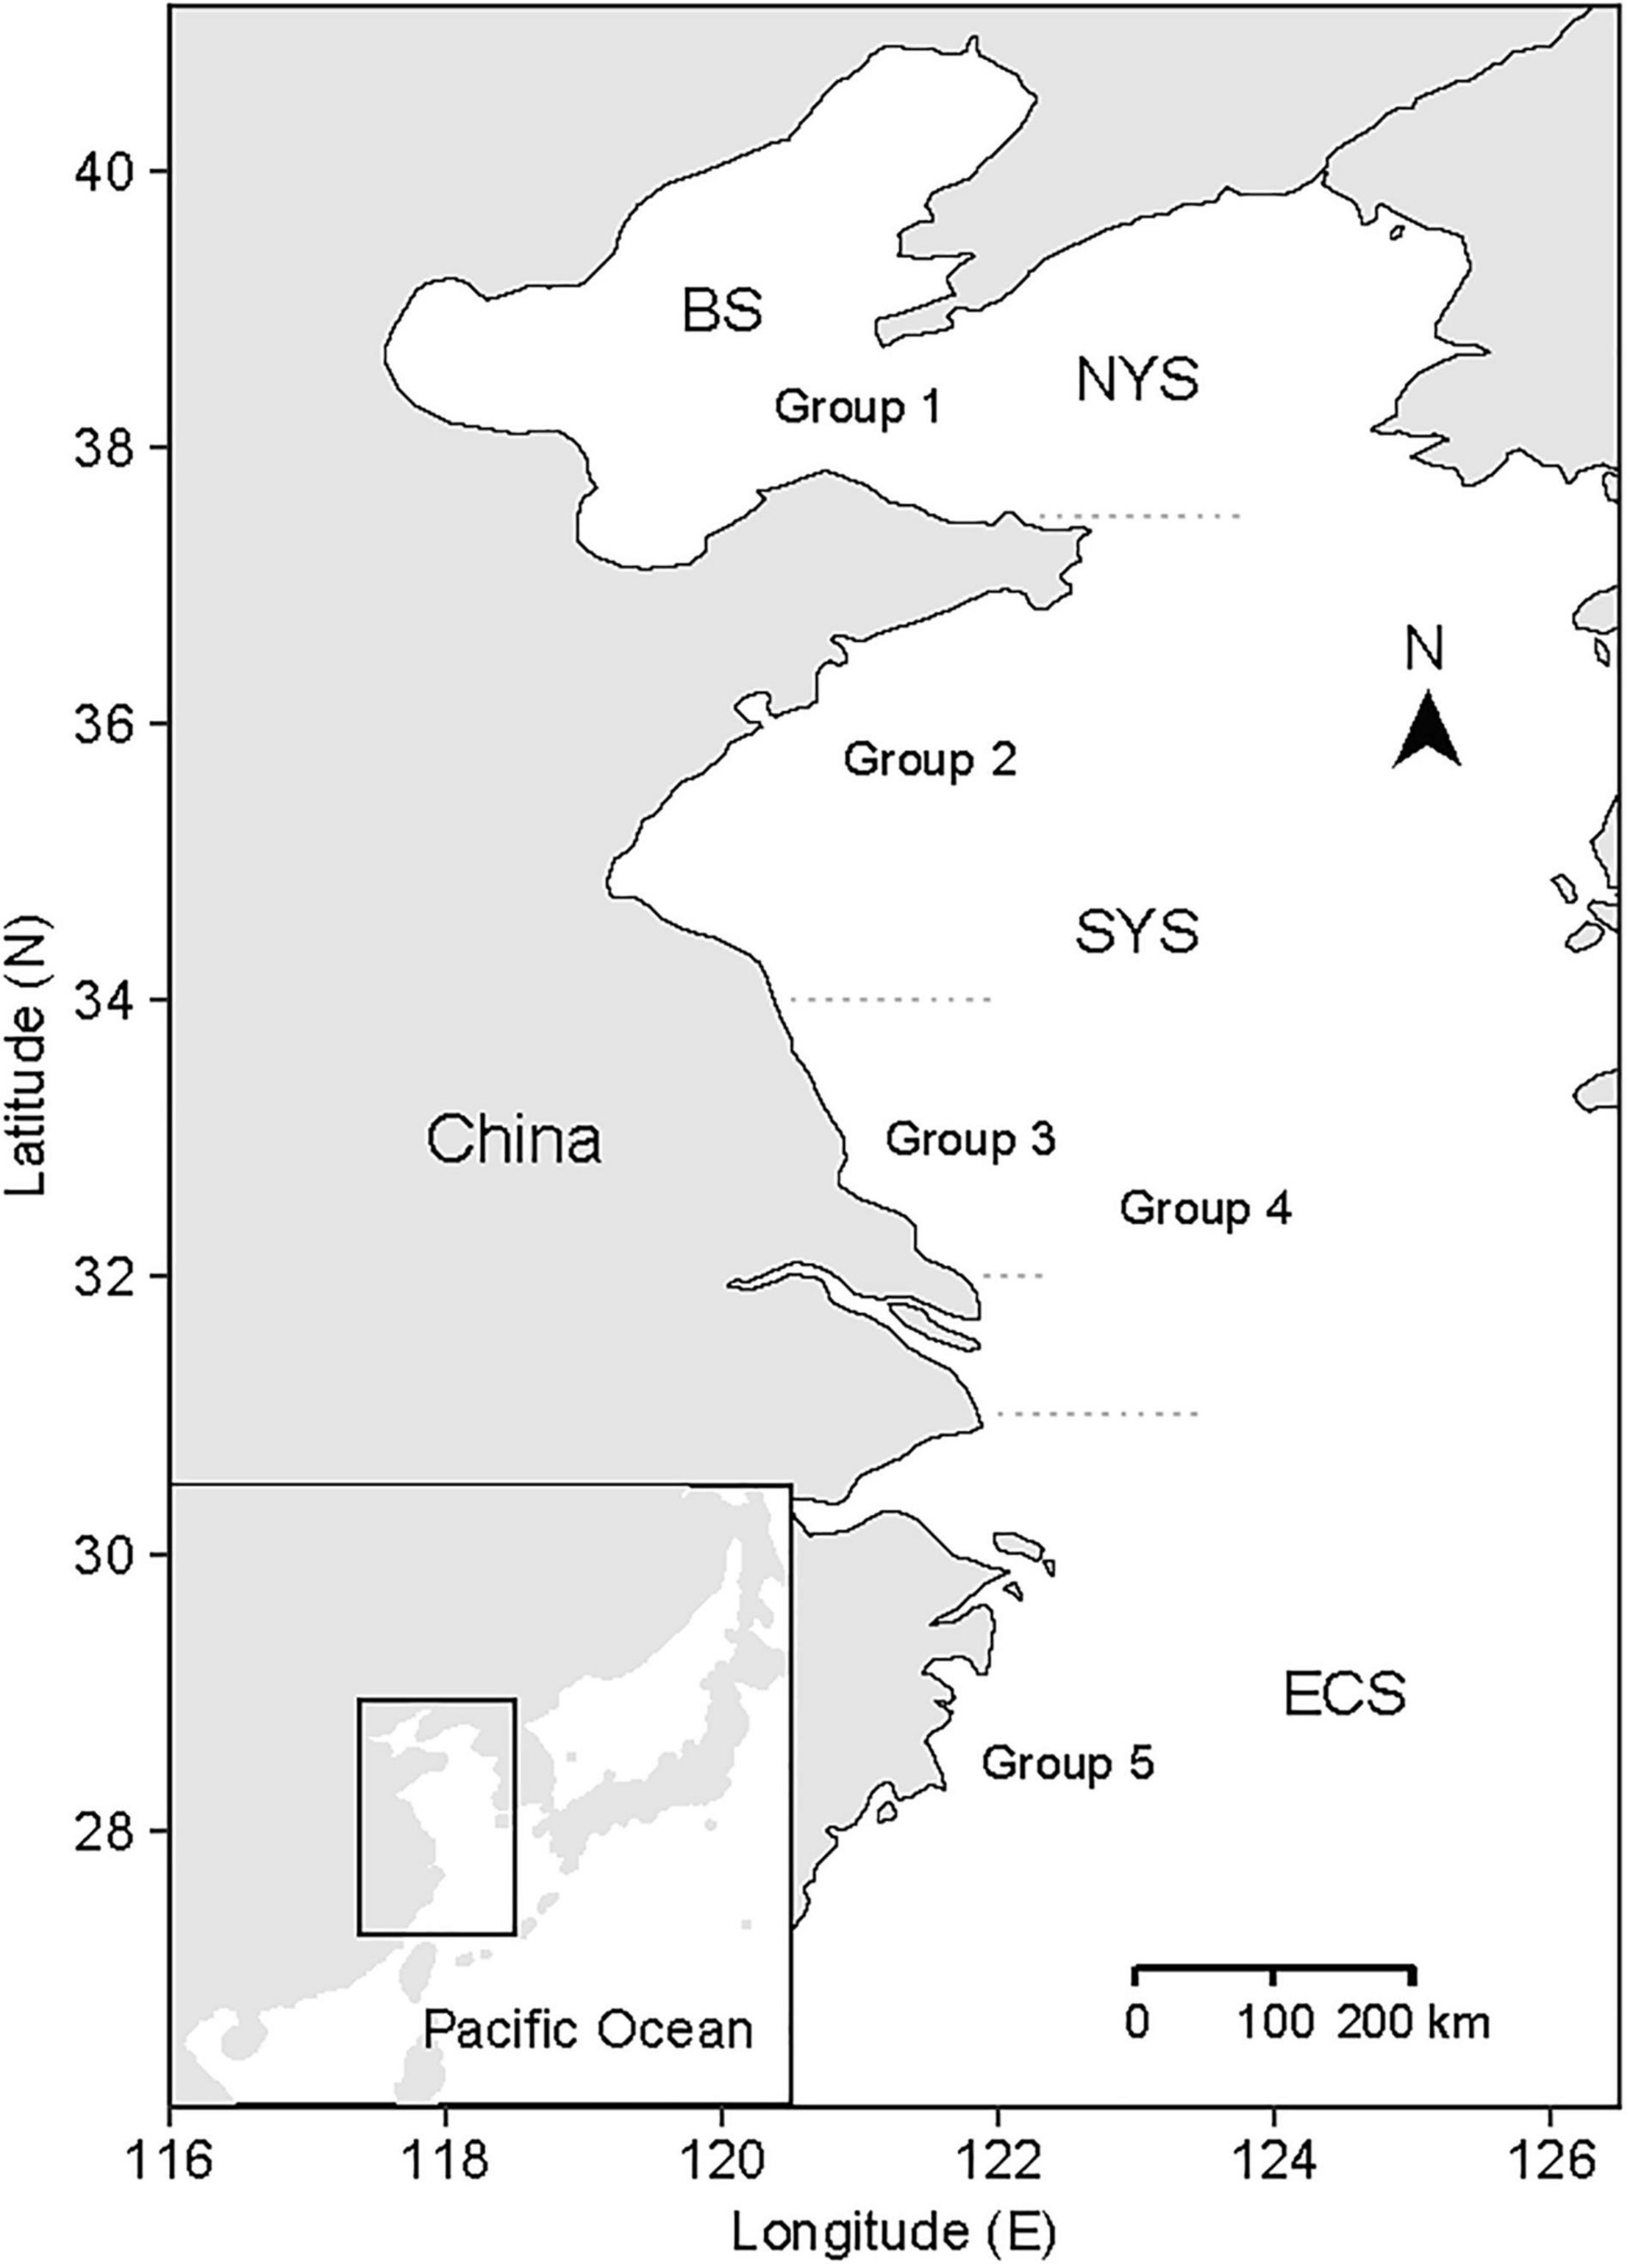
Figure 1. Map of the Bohai Sea (BS), Yellow Sea, and a part of East China Sea (ECS), and the division of groups for small yellow croakers. Yellow Sea consists of North Yellow Sea (NYS) and South Yellow Sea (SYS). The figure was adapted from Zhu et al. (2020).
Trawl selectivity experiments demonstrated that enlarging mesh size could reduce fishing pressure on small yellow croaker, especially for juveniles (Chen et al., 2018). Thus, increasing length at first capture (Lc) may be an efficient measure to recover the population of small yellow croaker. Researchers have recommended the optimal age (tcopt) or length (Lcopt) at first capture for small yellow croaker in different regions based on the results from the YPR model (Jin, 1996; Liu et al., 1999; Lin et al., 2006; Zhang et al., 2010a; Gao et al., 2019). However, uncertainty in input parameters was not considered. The derived Lcopt varied among these studies. In addition, Zhou et al. (2020) suggested the fishing mortality rate to achieve MSY (FMSY) or the spawning potential ratio (SPR) at FMSY (SPRMSY) as the benchmark because the surplus production model takes into account population dynamics from one generation to the next. Thus, there may be a gap between Lcopt derived from the YPR analysis and the SSBPR analysis.
In a previous study, the probability distributions of life history parameters were estimated using the Bayesian hierarchical approach for five groups of small yellow croakers (Zhu et al., 2020). Based on this work, a framework was presented that quantified uncertainty in per-recruit analysis for small yellow croaker and examined the status of each group of small yellow croakers using the YPR model and the SSBPR model by incorporating uncertainty in parameters. Lcopt was estimated when SSBPR at FMSY (SSBPRMSY) was regarded as the management goal. The objective of this study was: (1) to establish a procedure for quantifying uncertainty in per-recruit analysis for small yellow croaker based on Bayesian inference and (2) to further check the status of small yellow croaker and to recommend management measures by considering both the yield and the spawning stock biomass.
Previous studies have recommended to consider spatial heterogeneity in the studies for small yellow croaker due to the existence of geographic subpopulations for this species (Ying et al., 2011; Ma et al., 2020). However, division of the subpopulation for small yellow croakers is a controversial issue (Liu et al., 2013). Lin et al. (1965) divided small yellow croakers into three subpopulations based on body morphometrics in which the boundaries were 32.0 and 34.0°N (Figure 1). Based on this division, Liu (1990) proposed a fourth subpopulation in the central Yellow Sea (between 34.0 and 37.5°N) according to sex gland, which was supported by Wang et al. (2016) based on analysis of stable isotopic composition of otoliths. However, Xu and Chen (2010) argued that only two subpopulations exist according to their migration trajectory, and they defined a boundary of 34.0°N. Zhang et al. (2014) proposed another division of four subpopulations according to otolith features and the boundaries were about 35.5, 30.0, and 27.0°N.
In response to the controversy, small yellow croakers were divided into five groups according to the intensive investigation regions (Zhu et al., 2020), in which Group 3 was included in Group 4 (Figure 1). Some researchers studied small yellow croaker in the region between 32.0 and 34.0°N (e.g., Zhang et al., 2010a; Liu et al., 2013) according to the subpopulation divisions proposed by Lin et al. (1965), whereas some investigated the population in the area between 31.0 and 34.0°N (e.g., Lin et al., 2004; Yan et al., 2006). Thus, Groups 3 and 4 were regarded as two independent groups since it is unclear whether they belong to the same subpopulation (Zhu et al., 2020). Zhu et al. (2020) used the Bayesian hierarchical models to estimate life history parameters and their uncertainty for each group based on 25 growth curves, 41 LWRs, and 16 natural mortality rates collected from the literature (Supplementary Table 1). The resulting estimates of each type of life history parameter were 30,0000 sets of MCMC samples for each of the five groups. Growth parameters, LWR parameters, and natural mortality rate were summarized and are shown in Supplementary Tables 2–4, in which highest density interval (HDI) that gave the span of the most credible values (Kruschke, 2014) was used to summarize the uncertainty of a parameter.
Based on this work, we developed a procedure for quantifying uncertainty in per-recruit analysis for small yellow croakers (Figure 2). It consisted of two steps: estimating the posterior probability distributions for life history parameters and conducting per-recruit analysis. In the first step, already developed and undertaken by Zhu et al. (2020), the posterior distributions of life history parameters are first obtained using Bayesian approaches by combining the priors and the existing estimates, which were used to conduct per-recruit analysis when newly observed data were not collected. Otherwise, the resulting posteriors served as the priors to update the parameters by combining with new data. Then, the latest knowledge about life history parameters was used to carry out per-recruit analysis. For the second, novel step, the credible MCMC samples of each parameter generated from the first step were used to conduct per-recruit analysis and to calculate the quantities of interest by combining with fishery parameters, such as F and Lc.
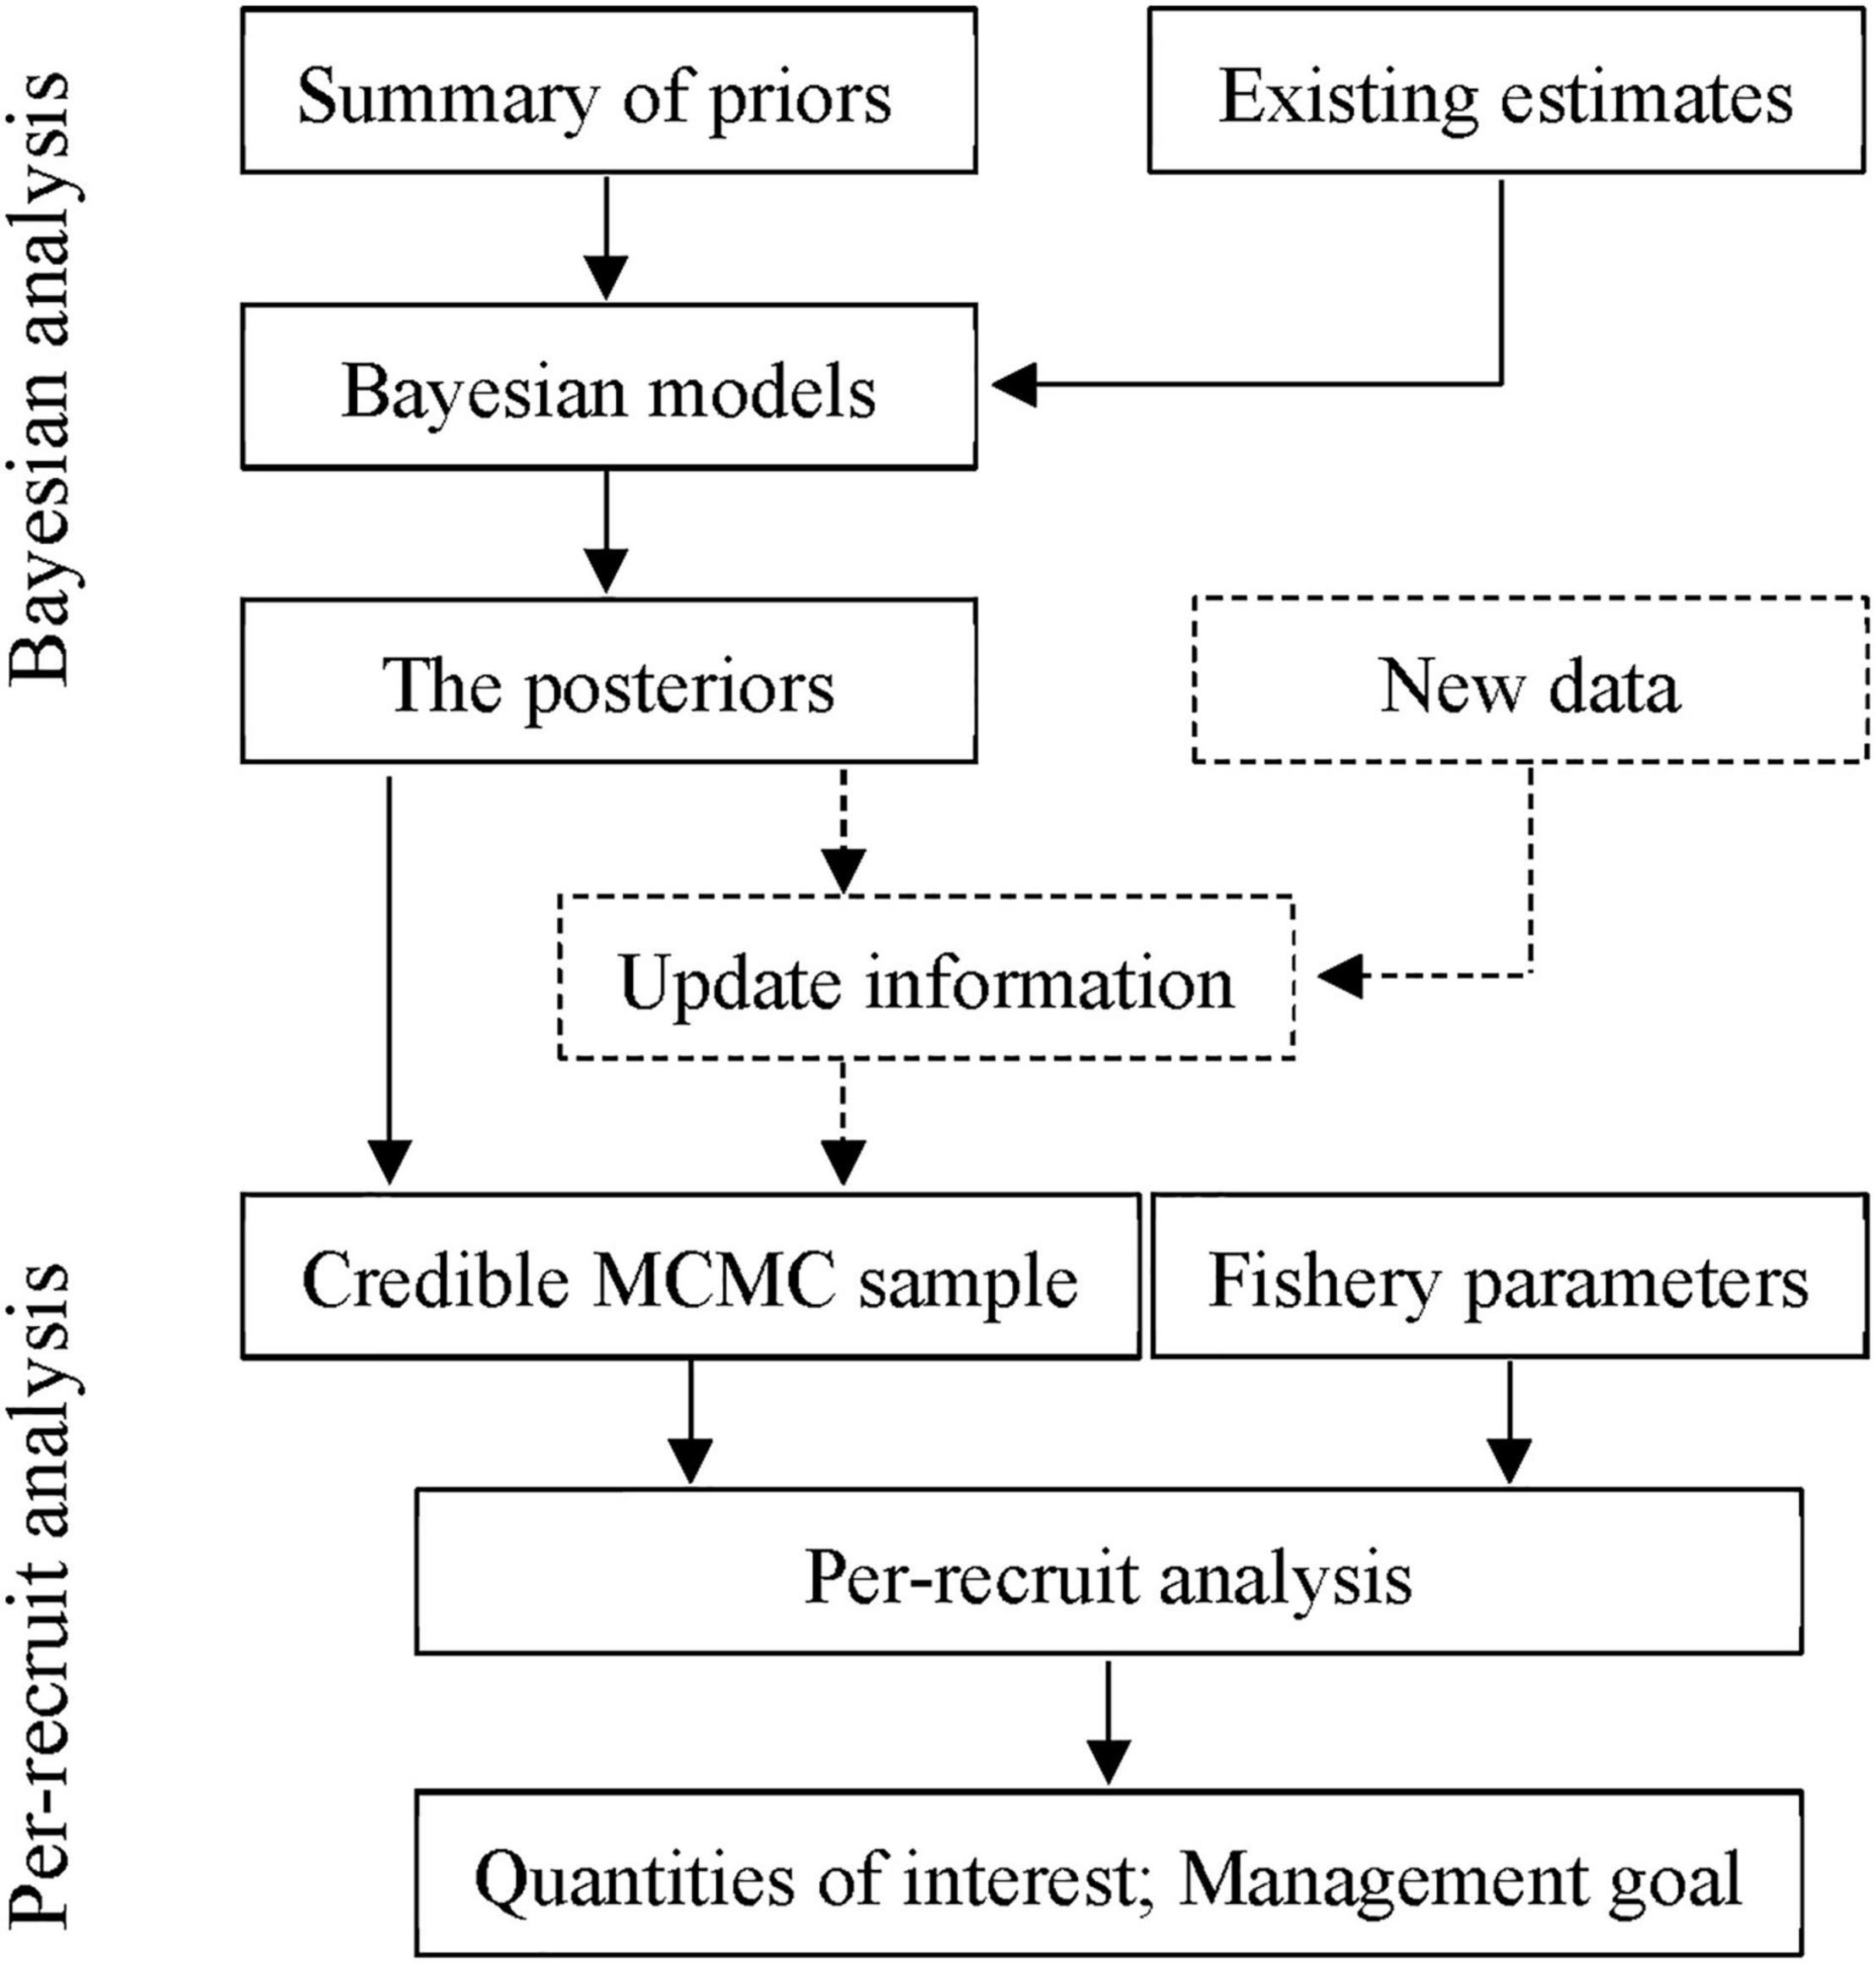
Figure 2. Flowchart quantifying uncertainty for outputs of per-recruit analysis based on Bayesian inference.
We used the parameter values that had been obtained from the first step to undertake the second step. New data for estimating the growth parameters, LWR parameters, and natural mortality rate were not collected because almost all the recent estimates have been incorporated in Bayesian analysis in our previous work (Zhu et al., 2020). The MCMC samples inside the 95% HDI were taken as credible estimates to avoid the impact of extremely high or low values on per-recruit analysis. For the correlated parameters, a pair of estimates were taken together if the estimate of each parameter was located in its 95% HDI. The number of credible MCMC samples was different for different types of parameters. The same number of MCMC samples was taken according to the minimum number of credible MCMC samples among three types of parameters for a group. The number of parameter sets was enough to obtain the possible distributions for the output of a per-recruit model (Table 1).
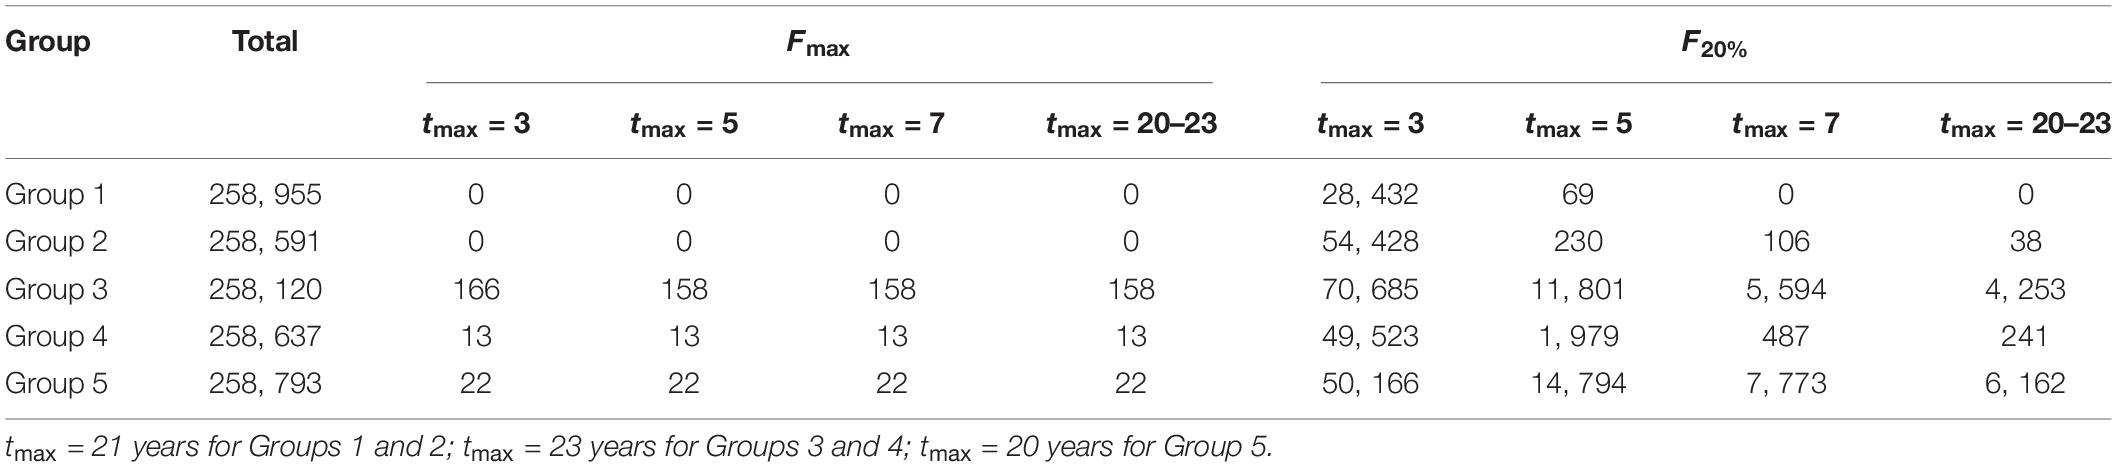
Table 1. Number of the total parameter sets in per-recruit analysis and number of the parameter sets failing to define Fmax and F20%.
Considering implementation of summer-fishing-closed-season policy in China, a discrete YPR model and a discrete SSBPR model were constructed for small yellow croaker fisheries based on the work of Govender et al. (2006). YPR (expressed in mass g) was expressed as
where Y is the attained yield, R is the number of the recruit, and tmax is the maximum age in the fishery in months aw and bw are LWR parameters (W = awLbw). Lt is the predicted length at age t, which was calculated using von Bertalanffy growth model (von Bertalanffy, 1938). j is used to produce the cumulative sum of fishing mortality rate and natural mortality rate at each stage, and this term exists when t ≥ 2. Here, R was assumed to be the number at 1 month old and set to 1. SLt is the gear selectivity at length Lt and was assumed to be knife-edged.
At indicated whether a particular month corresponding to age t was open to fishing or not (Govender et al., 2006). It was 1 when the month was open to fishing. Otherwise, it was 0.
Spawning stock biomass-per-recruit (expressed in mass g) was expressed as
where Gt was the fraction of mature fish at age t and was also assumed to be knife-edged (Govender et al., 2006).
where tm was the age at 50% maturity.
Spawning potential ratio is the ratio of SSBPR at a fishing mortality rate to the maximum SSBPR under unfished conditions (Goodyear, 1993). It was expressed as
Spawning potential ratio has a maximum value of unity and declines toward zero with an increase in fishing mortality rate (Goodyear, 1993). Similarly, SPRMSY was expressed as (Zhou et al., 2020)
Biological reference points derived from per-recruit models are expressed as fishing mortality rates, which are metrics of stock status (Gabriel and Mace, 1999). Fmax and F0.1 are reference points derived from the YPR model. Fmax is the fishing mortality rate maximizing YPR and F0.1 is where the slope of the YPR curve is 10% of the maximum slope (Grabowski and Chen, 2004). The reference point from the SSBPR model is expressed as Fx% representing the fishing mortality rate that reduces SSBPR to x% of the maximum SSBPR in an unexploited state (Gabriel and Mace, 1999). Fx% is exactly the value of SPR at a fishing mortality rate according to Eq. 5. Mace and Sissenwine (1993) advocated F20% as a recruitment overfishing threshold for species with high and medium resilience and F30% as a recruitment overfishing threshold for species with low resilience. Generally, small yellow croaker grows slowly, matures at an older age (2–3 years), and has low resilience (Ye, 1991; Jin and Deng, 2000). However, its resilience may increase when it matures earlier. At present, FishBase1 gives the resilience of small yellow croaker as medium. Thus, we took F20% as a recruitment overfishing threshold for small yellow croaker. We calculated Fmax, F0.1, and F20% to examine stock status and check the impact of uncertainty in life history parameters on per-recruit analysis.
To examine the impact of a type of history life parameter on uncertainty in per-recruit analysis, reference points were calculated under four scenarios. We used credible MCMC samples of all types of life history parameters to calculate reference points in Scenario 1. Credible MCMC samples of the growth parameters, LWR parameters, and natural mortality rate were adopted in Scenarios 2, 3, and 4, respectively, and point estimates were taken for other types of parameters. The variation in biological reference points in Scenarios 2, 3, and 4 was caused by the uncertainty of a type of life history parameter.
The maximum age may have not exceeded 3 years for each group of small yellow croakers since the mid-2000s (Lin et al., 2004; Guo et al., 2006; Chen et al., 2010; Yan et al., 2014; Hu et al., 2015; Shan et al., 2017). It was 2 years in some years (Lin et al., 2004; Guo et al., 2006; Yan et al., 2014; Hu et al., 2015). In this study, a maximum age of 3 years was used in per-recruit analysis for all groups. The maximum age influences YPR and SSBPR for a given F according to Eqs 1, 3, and may further affect the derived reference points. We set tmax = 3, 5, and 7 years to test the effect of maximum age. At present, it is unclear if small yellow croaker would reach an age of 21–23 years in the absence of fishing. The optimal maximum age (toptmax) was 21 years for Groups 1 and 2, 23 years for Groups 3 and 4, and 20 years for Group 5 (Gao et al., 2019). We calculated reference points and derived Lcopt when tmax = toptmax to further check the status of small yellow croaker and to explore management measures.
In past studies, the YPR contour was often used to determine tcopt, which was transformed to Lcopt. In the YPR isopleth, age at first capture (tc) was the vertical axis and F the horizontal axis. One line representing maximum YPR for a given F and the other line representing maximum YPR for a given tc were plotted in the contour (Caddy, 1984). At the current fishing mortality rate, any tc located between these two lines can be chosen as tcopt. Thus, tcopt has a range and one value is usually chosen subjectively. In this study, we chose SPRMSY and SSBPRMSY as the target reference points to which to aim to recover the biomass of small yellow croakers and calculated their distributions. As shown in Figure 2, Lcopt was found to achieve these distributions.
Fishing mortality rate has an increasing trend for small yellow croaker fisheries which is in accordance with increasing fishing effort (Supplementary Table 5). Considering that fishing effort has consistently increased and fishing mortality rate also has a level of uncertainty, current fishing mortality rates (Fcur) were assigned the mean of the latest two estimates for Group 1 (1.73 year–1) and Group 5 (2.73 year–1). Fcur took the latest estimate for Group 2 (1.56 year–1), Group 3 (2.38 year–1), and Group 4 (2.38 year–1) because other values were estimated four or more years ago for those groups. Groups 3, 4, and 5 had much higher fishing mortality rates than Groups 1 and 2, which is consistent with fishing activities (Ma et al., 2020). FMSY was time-varying and ranged from 0.15 to 1.07 year–1 for Groups 1 and 2, and from 0.15 to 1.32 year–1 for Groups 3, 4, and 5 between 1968 and 2015 (Ma et al., 2020). We took the values in 1968 and 2015 for small yellow croakers with the optimal maximum age and the current maximum age, respectively.
We assumed that small yellow croakers grew up to 1 month older in May for Group 5 and in June for other groups according to the spawning time of each group (Jin, 1996; Cheng et al., 2004; Zhang et al., 2010b). Lc was set to 12 cm for all groups, which is the length at 50% retention for the trawl net and the canvas stow net with the minimum allowable mesh size of 54.0 mm (You et al., 2017; Chen et al., 2018; Xu et al., 2019). Heavy fishing pressures have resulted in earlier maturity for small yellow croaker. The proportion of the population that matures at age 1 has been over 90% since 2011 (Yan et al., 2014). The fractions of mature fish at spawning time were assumed to be 1 for all age classes of each group. Currently, the areas where small yellow croakers are distributed are closed to fishing in the summer. The seas to the north of 35.0°N are closed to fishing from May 1 to August 31 and those to the south of 35.0°N are closed from May 1 to September 16.
Generally, biological reference points Fmax, F0.1, and F20% were well defined by credible MCMC samples. F0.1 existed for all set of credible MCMC samples of each group. However, some sets of MCMC samples could not produce Fmax and F20% (Table 1). Some extremely high values were also derived for F20% from some sets of parameter estimates (Figure 3). Fcur was significantly higher than FMSY for each group because it was greater than the upper limit of 95% credible interval (Table 2). It was also significantly higher than F0.1 for Groups 1, 3, 4, and 5 when tmax = 3 years. But Fcur was not significantly greater than Fmax and F20% for each group. It even had a high probability of being lower than Fmax and F20% for Group 2 (Figure 4). The probability of Fcur being greater than F0.1, P (Fcur > F0.1), approximated 1 for all groups except Group 2 (92%). In contrast, P (Fcur > Fmax) and P (Fcur > F20%) were relatively low and not greater than 74%. However, Fcur was greater than F0.1, Fmax, and F20% with a high probability for all groups (85–97%) when tmax = toptmax.
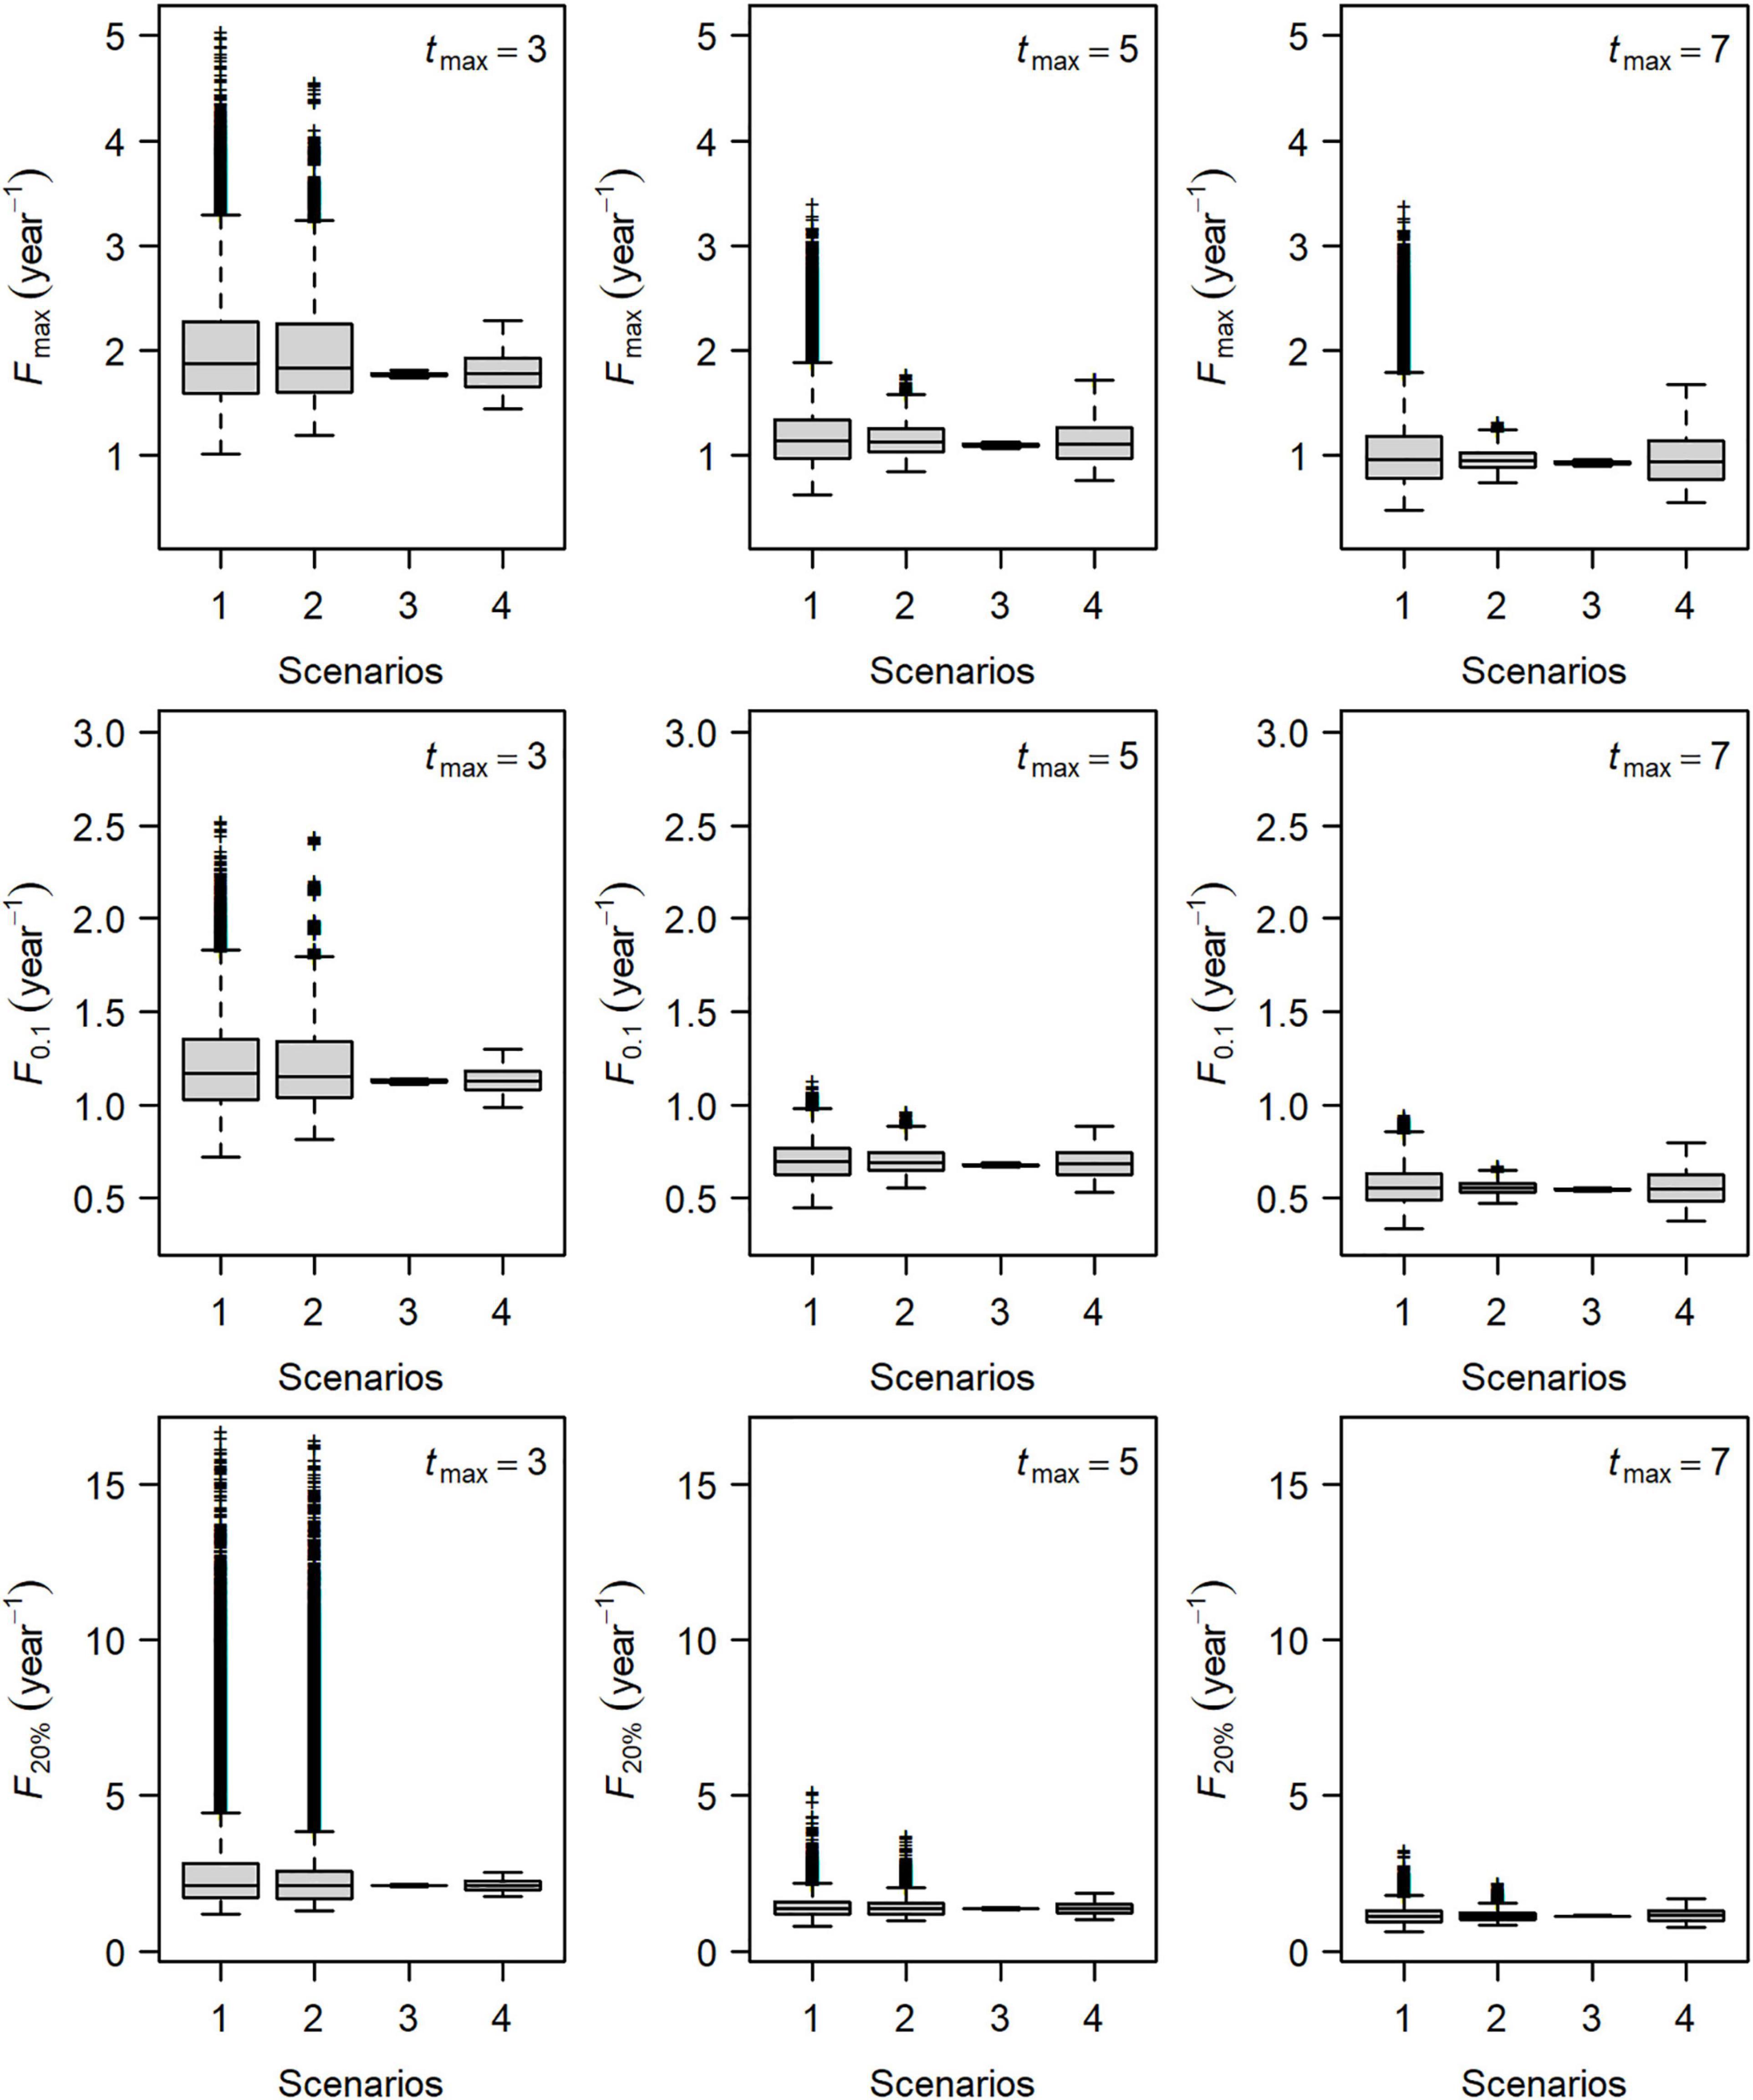
Figure 3. Boxplot of biological reference points Fmax, F0.1, and F20% in four scenarios for Group 1 of small yellow croakers. Scenario 1 denoted the variation in all types of life history parameters. Scenarios 2, 3, and 4 denoted the variation in growth parameters, length–weight relationship parameters, and natural mortality rate, respectively.
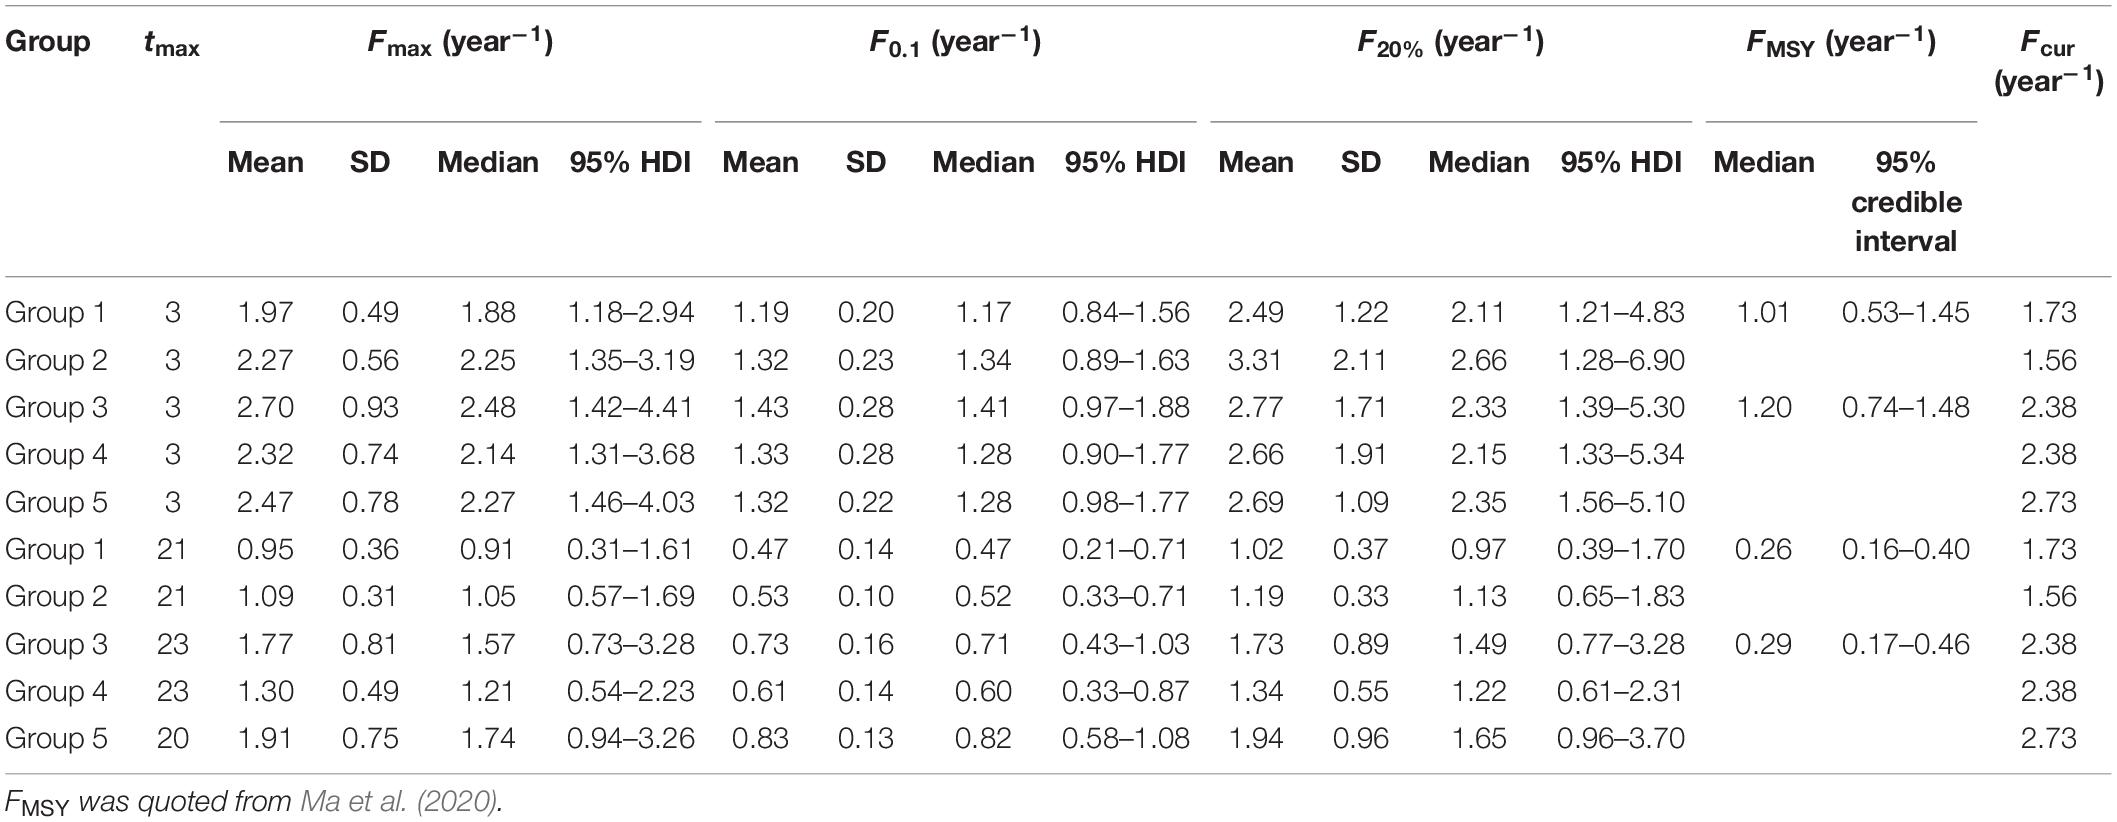
Table 2. Biological reference points and current fishing mortality rates for each group of small yellow croakers.
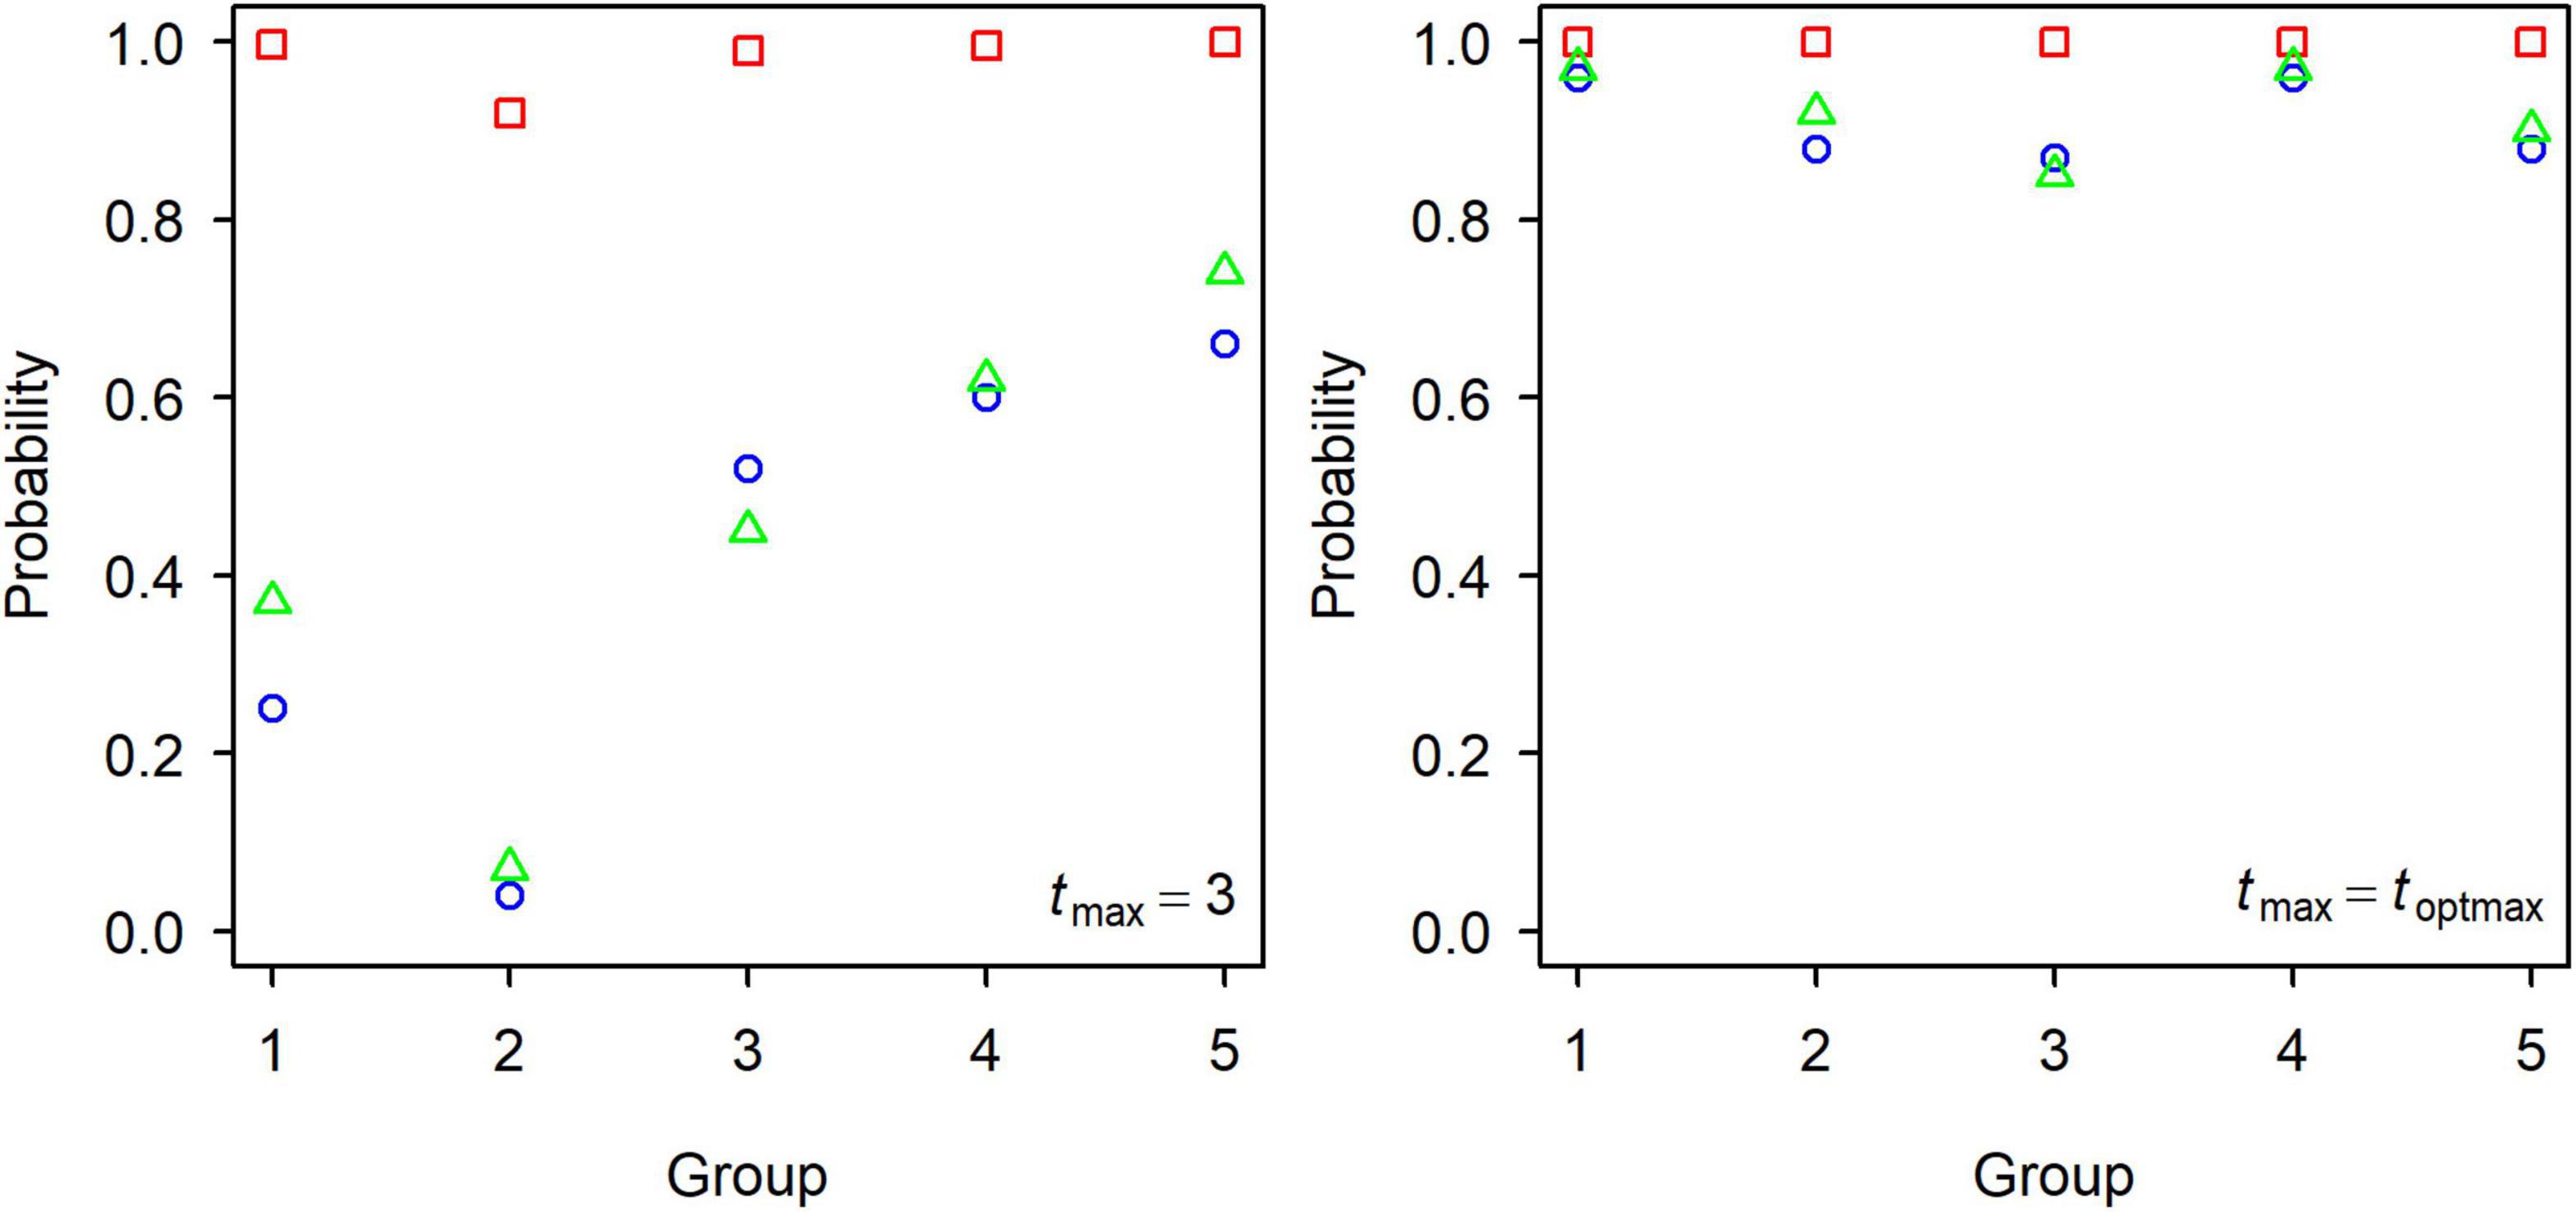
Figure 4. The probability of Fcur being greater than the biological reference points Fmax (green triangle), F0.1 (red square), and F20% (blue circle) for each group of small yellow croakers.
Figure 3 shows the distributions of Fmax, F0.1, and F20% for Group 1 in four scenarios when tmax = 3, 5, and 7 years. Reference points of the other four groups had a similar distribution pattern. Uncertainty about each reference point was largest for Scenario 1 at a given maximum age, in which all three types of parameters varied. For Scenarios 2, 3, and 4, the variation in the growth parameters (Scenario 2) led to the largest uncertainty in the estimates of each reference point when tmax = 3 years. This indicated that the uncertainty of these reference points was caused mainly by uncertainty surrounding the growth parameters.
The number of the parameter sets that could not define F20% decreased with an increase in tmax (Table 1). Relative importance of life history parameters also changed as tmax increased (Figure 3). The effect of natural mortality rate (Scenario 4) on the uncertainty of reference points became stronger than growth parameters when tmax = 5 years. Uncertainty in the natural mortality rate dominated the variation in each reference point when tmax = 7 years. The LWR parameters had less influence on the uncertainty of the reference points in all cases.
Both the YPR curve and the SPR curve were variable for each group due to uncertainty in the life history parameters (Figures 5, 6). They also varied among groups, depending on parameter estimates of each group and the level of their uncertainty. Maximum YPR ranged from 25.54 g (median value) to 34.20 g when Lc = 12.0 cm for small yellow croakers and was significantly different among groups when the exploitation pattern was similar (p < 0.001, Figure 7). The median of maximum YPR was greatest for Group 1, followed by that of Groups 4, 2, 5, and 3. However, the SPR curve of Group 1 was the lowest, whereas the SPR curves of Groups 2, 3, and 5 were relatively high (Figure 6). Median SPR at Fcur (SPRcur) was lower than median SPRMSY for each group. The upper limit of 95% HDI was even lower than 40% for Groups 3, 4, and 5. The distribution of SPR at a fishing mortality rate was different at two maximum ages (Figure 8). SPRcur and SPRMSY had a bimodal distribution or a multimodal distribution when tmax = 3 years, whereas they had a unimodal distribution for each group when tmax = toptmax. But the pattern of the SSBPR at a fishing mortality was not affected by the maximum age (Figure 9). Median SPRcur was very low (10–15%) for small yellow croakers with the optimal maximum age due to the high fishing mortality rate. A high SPRMSY (55–66%, median value) was needed to attain MSY. Conversely, SPRcur was relatively high when tmax = 3 years and a relatively low SPRMSY was needed.
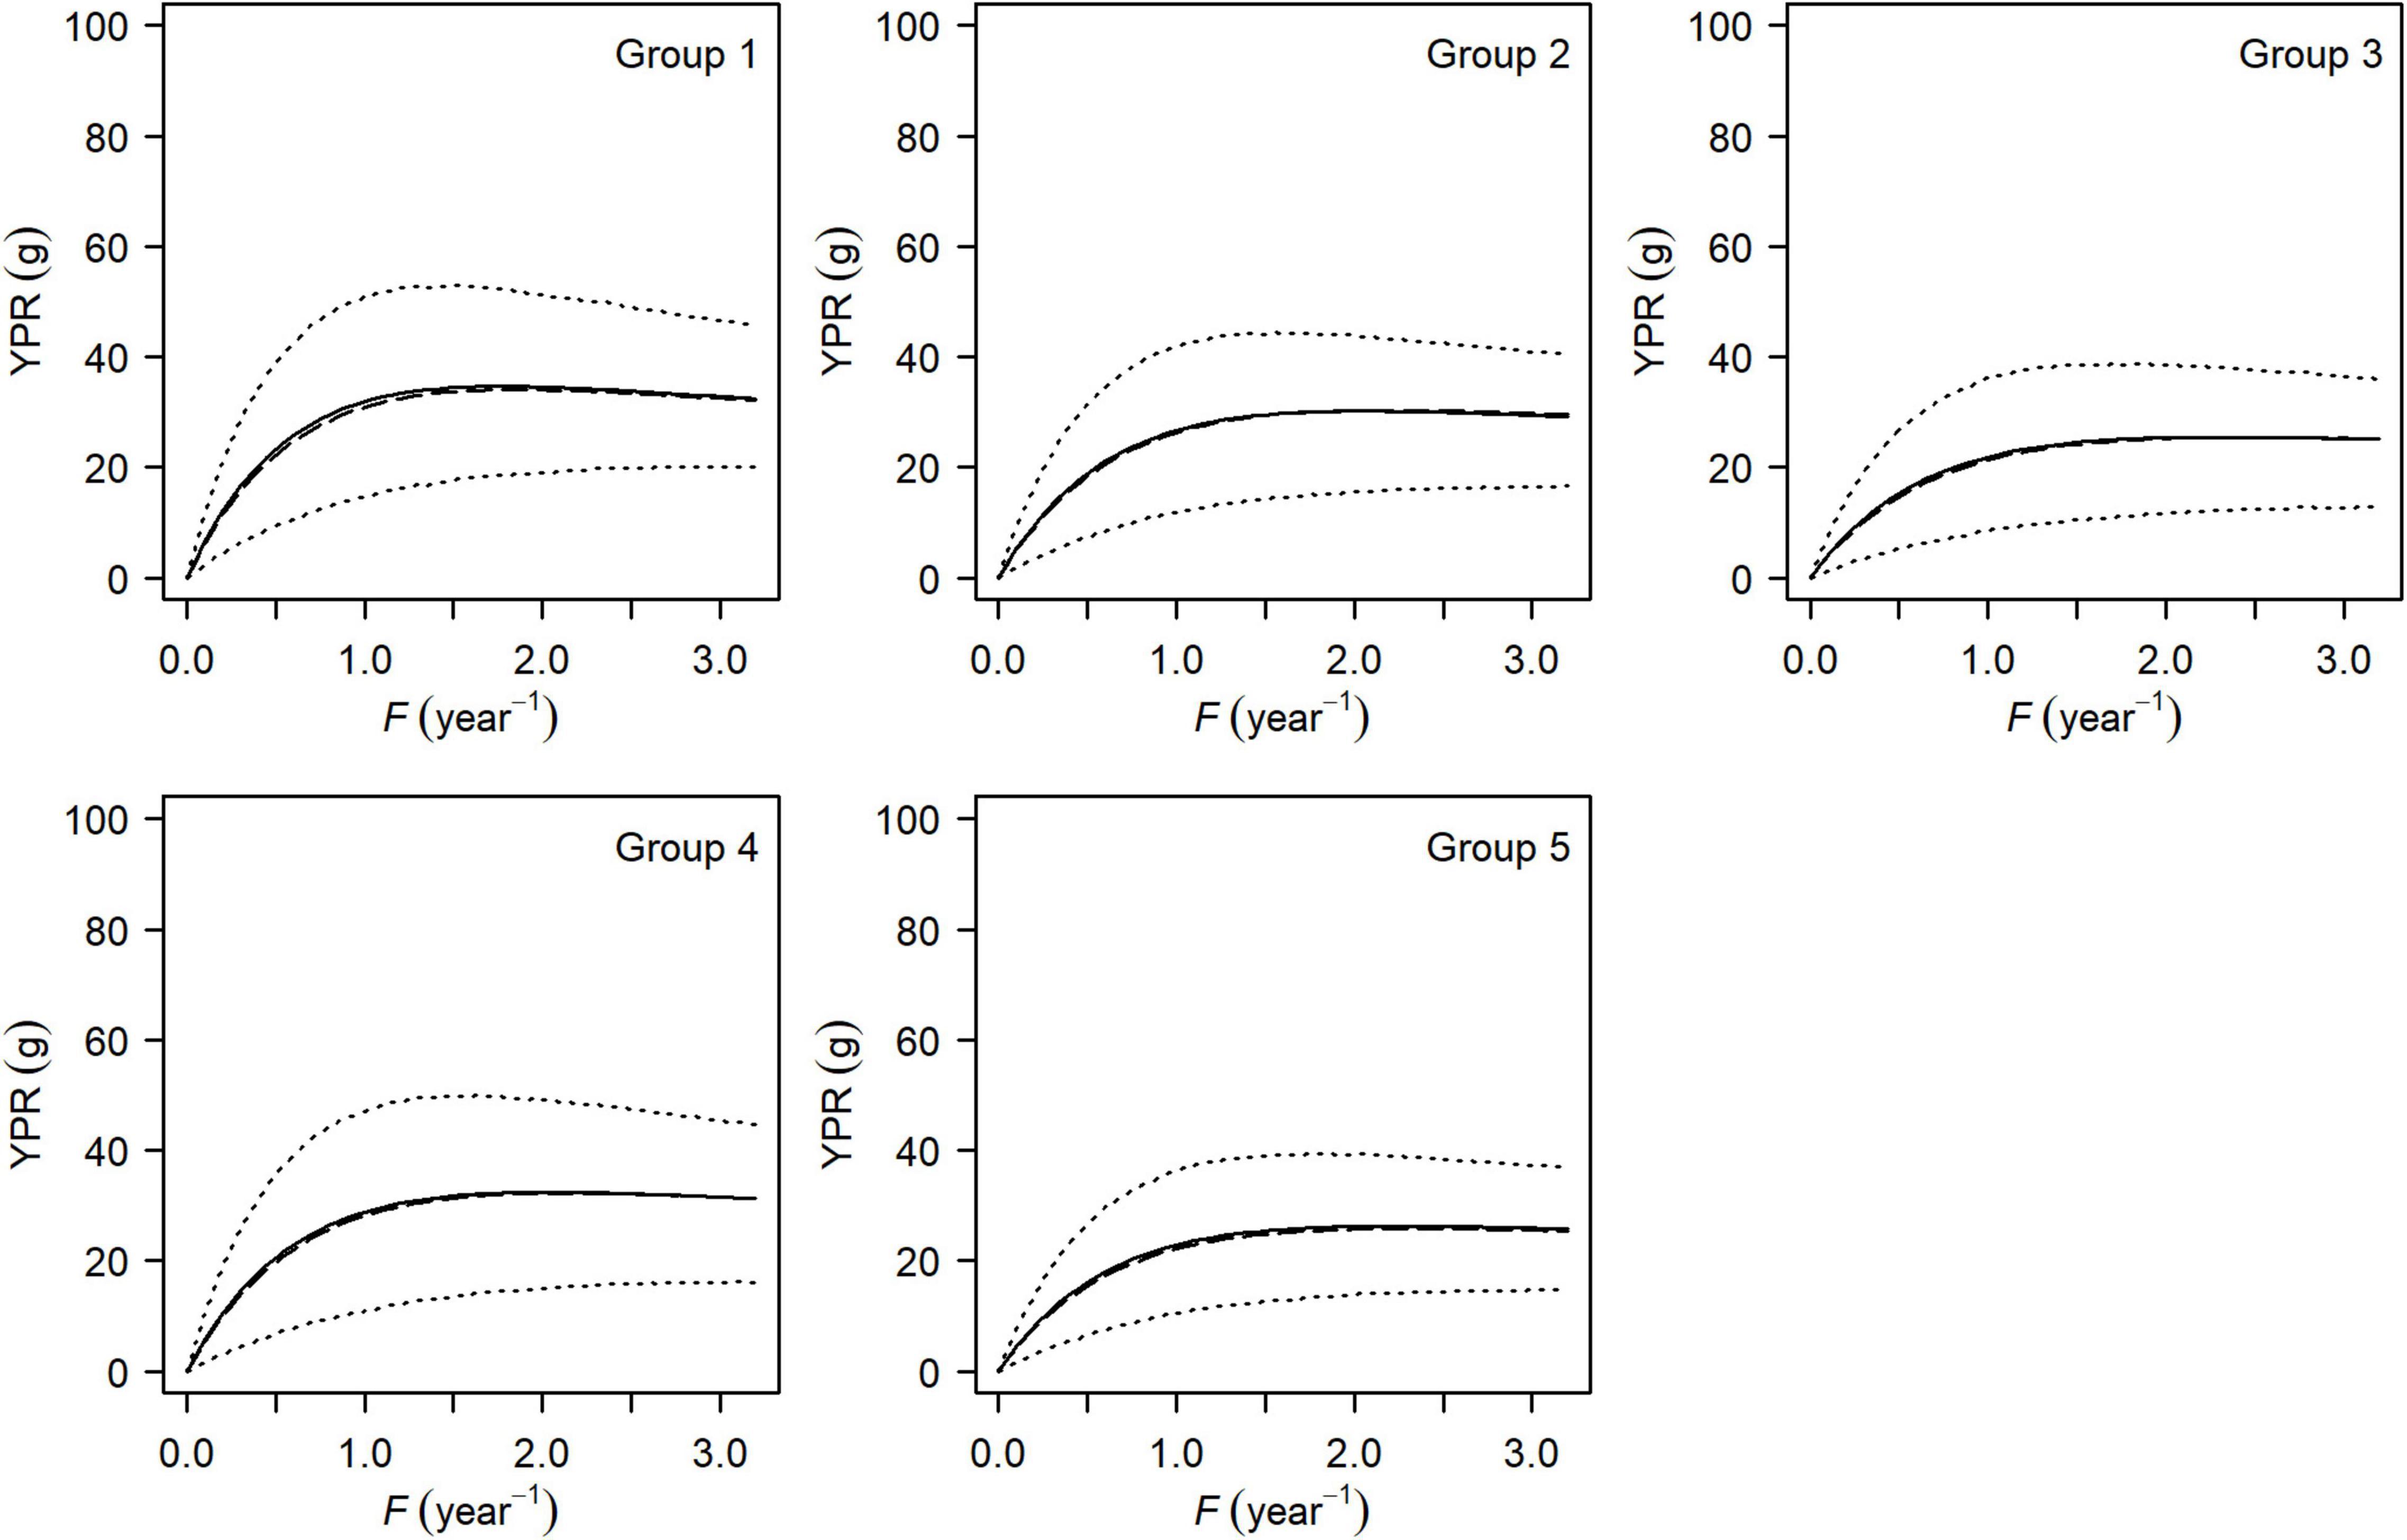
Figure 5. Mean (solid line), median (long-dashed line), and the 95% HDI (dotted line) of yield-per-recruit curves for each group of small yellow croakers when tmax = 3 years.
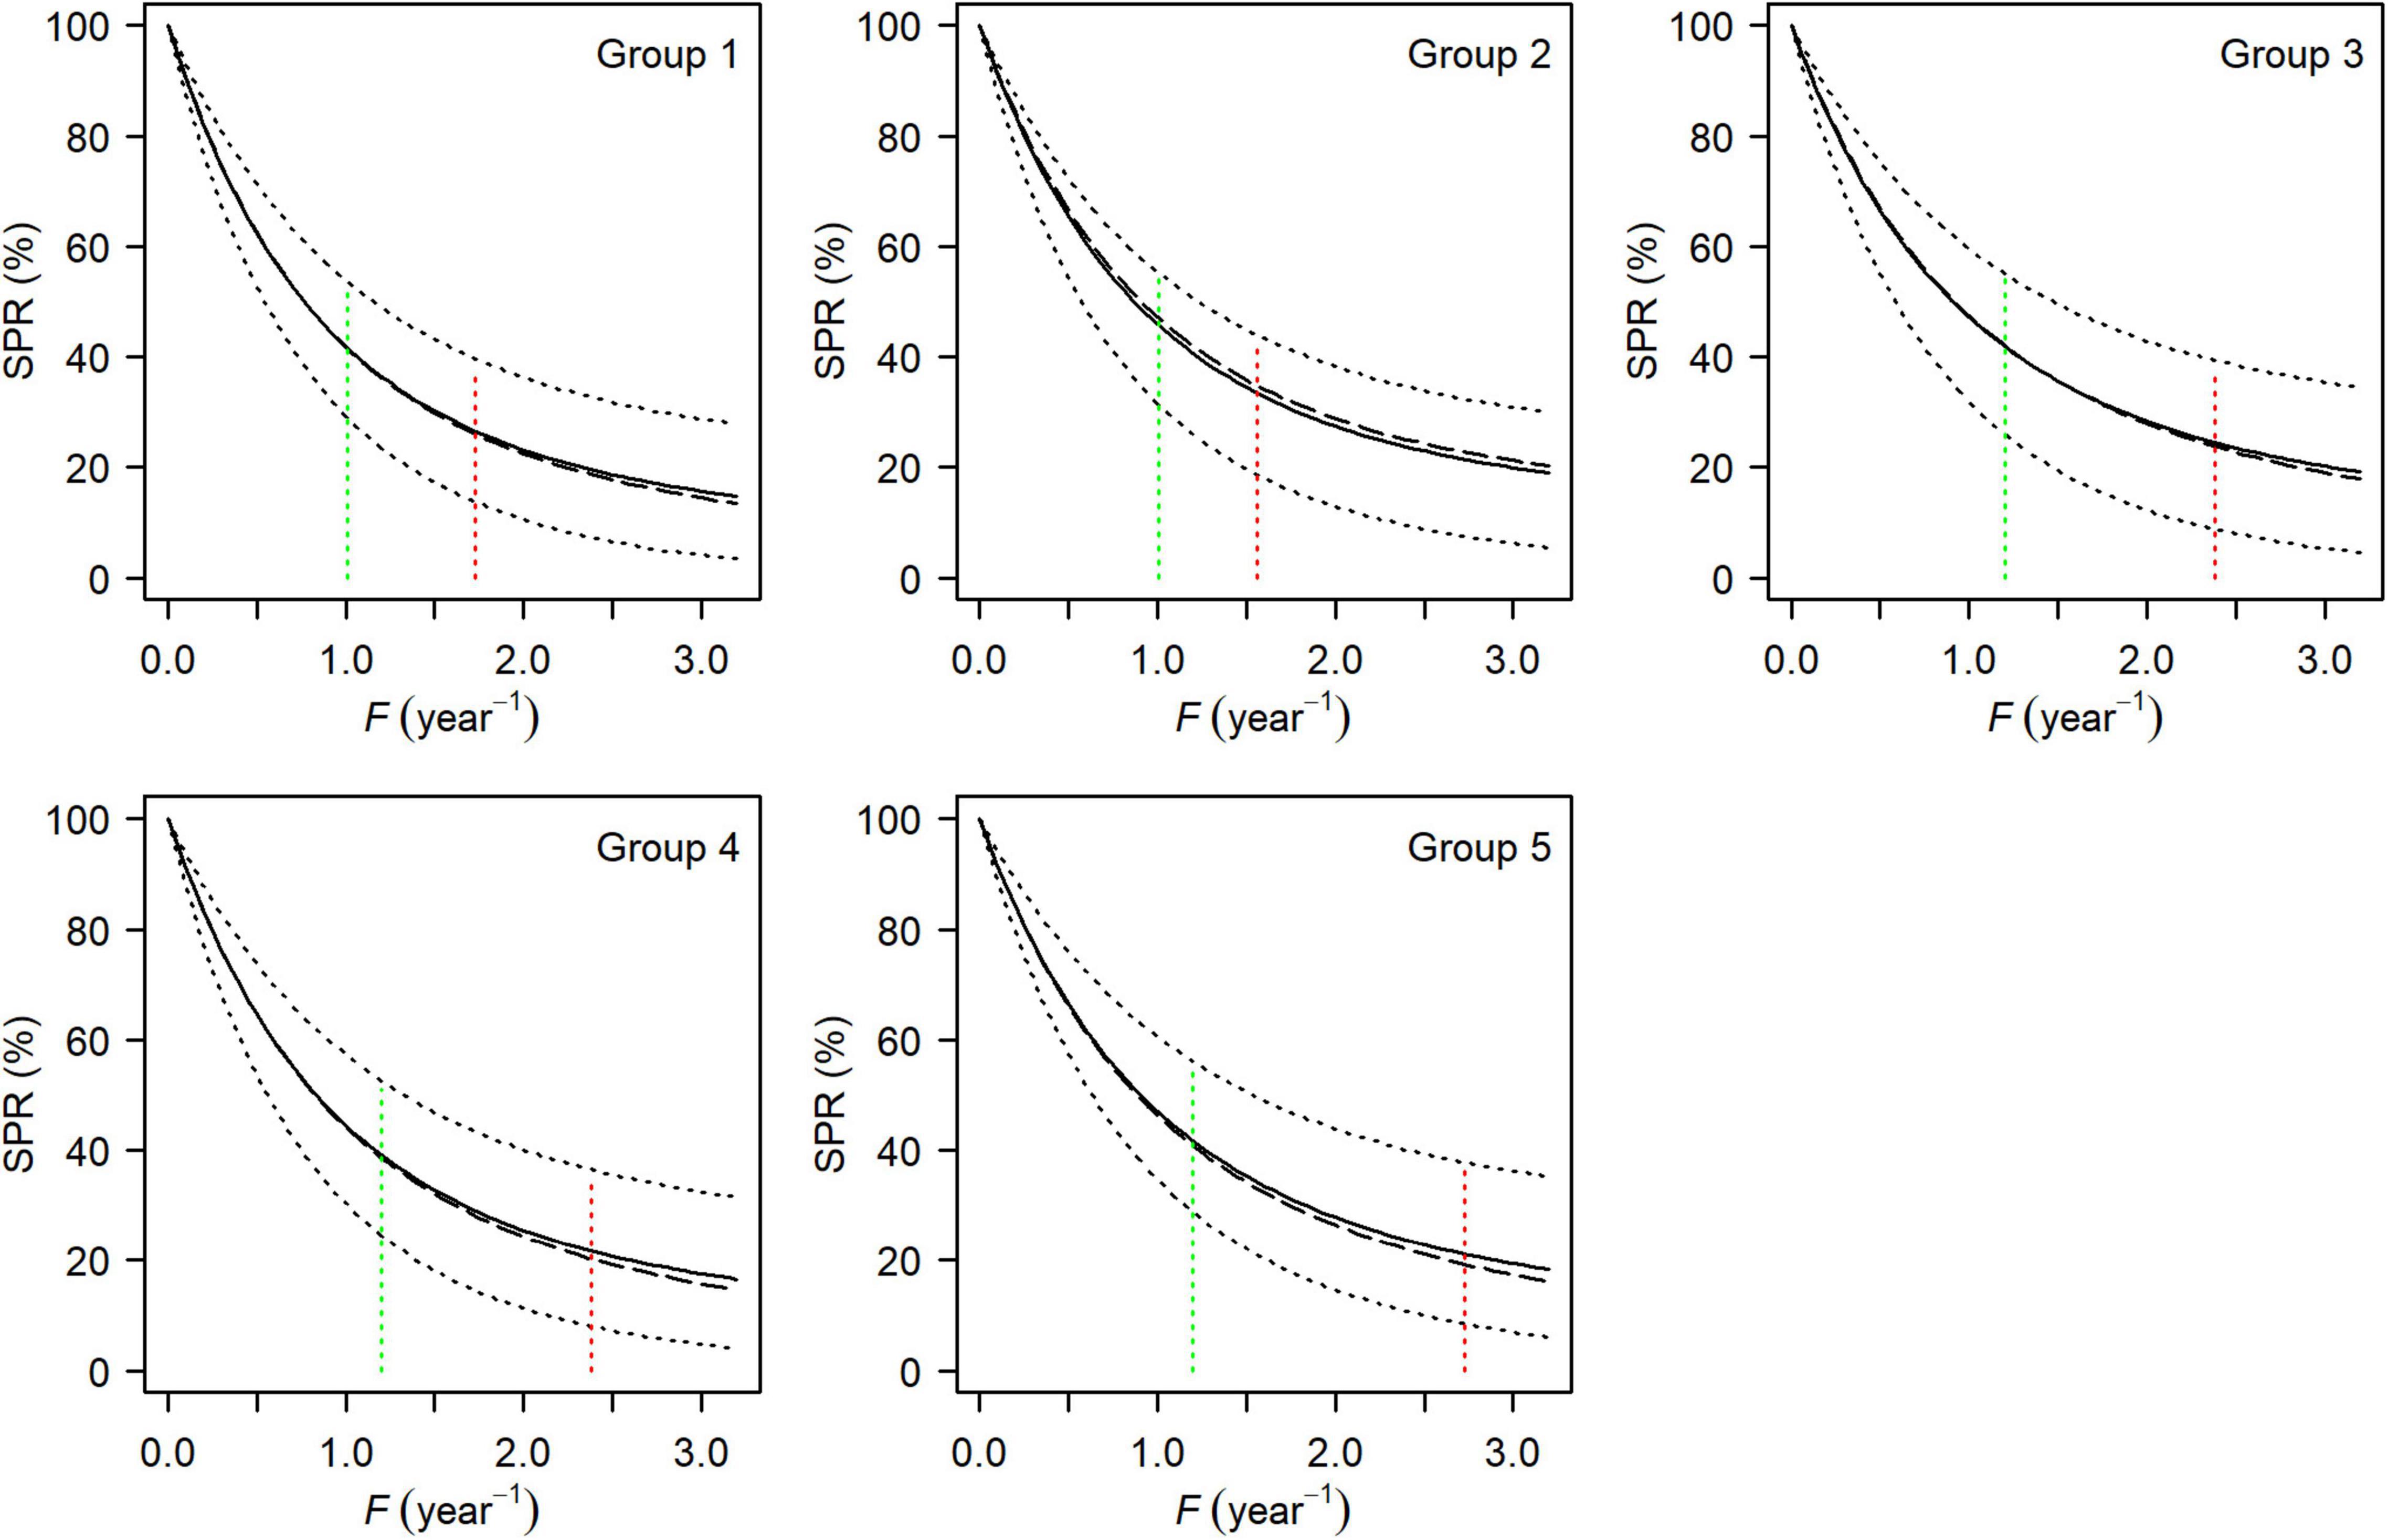
Figure 6. Mean (solid line), median (long-dashed line), and the 95% HDI (dotted line) of spawning potential ratio curves for each group of small yellow croakers when tmax = 3 years. Green and red dotted lines show the position of FMSY and Fcur, respectively.
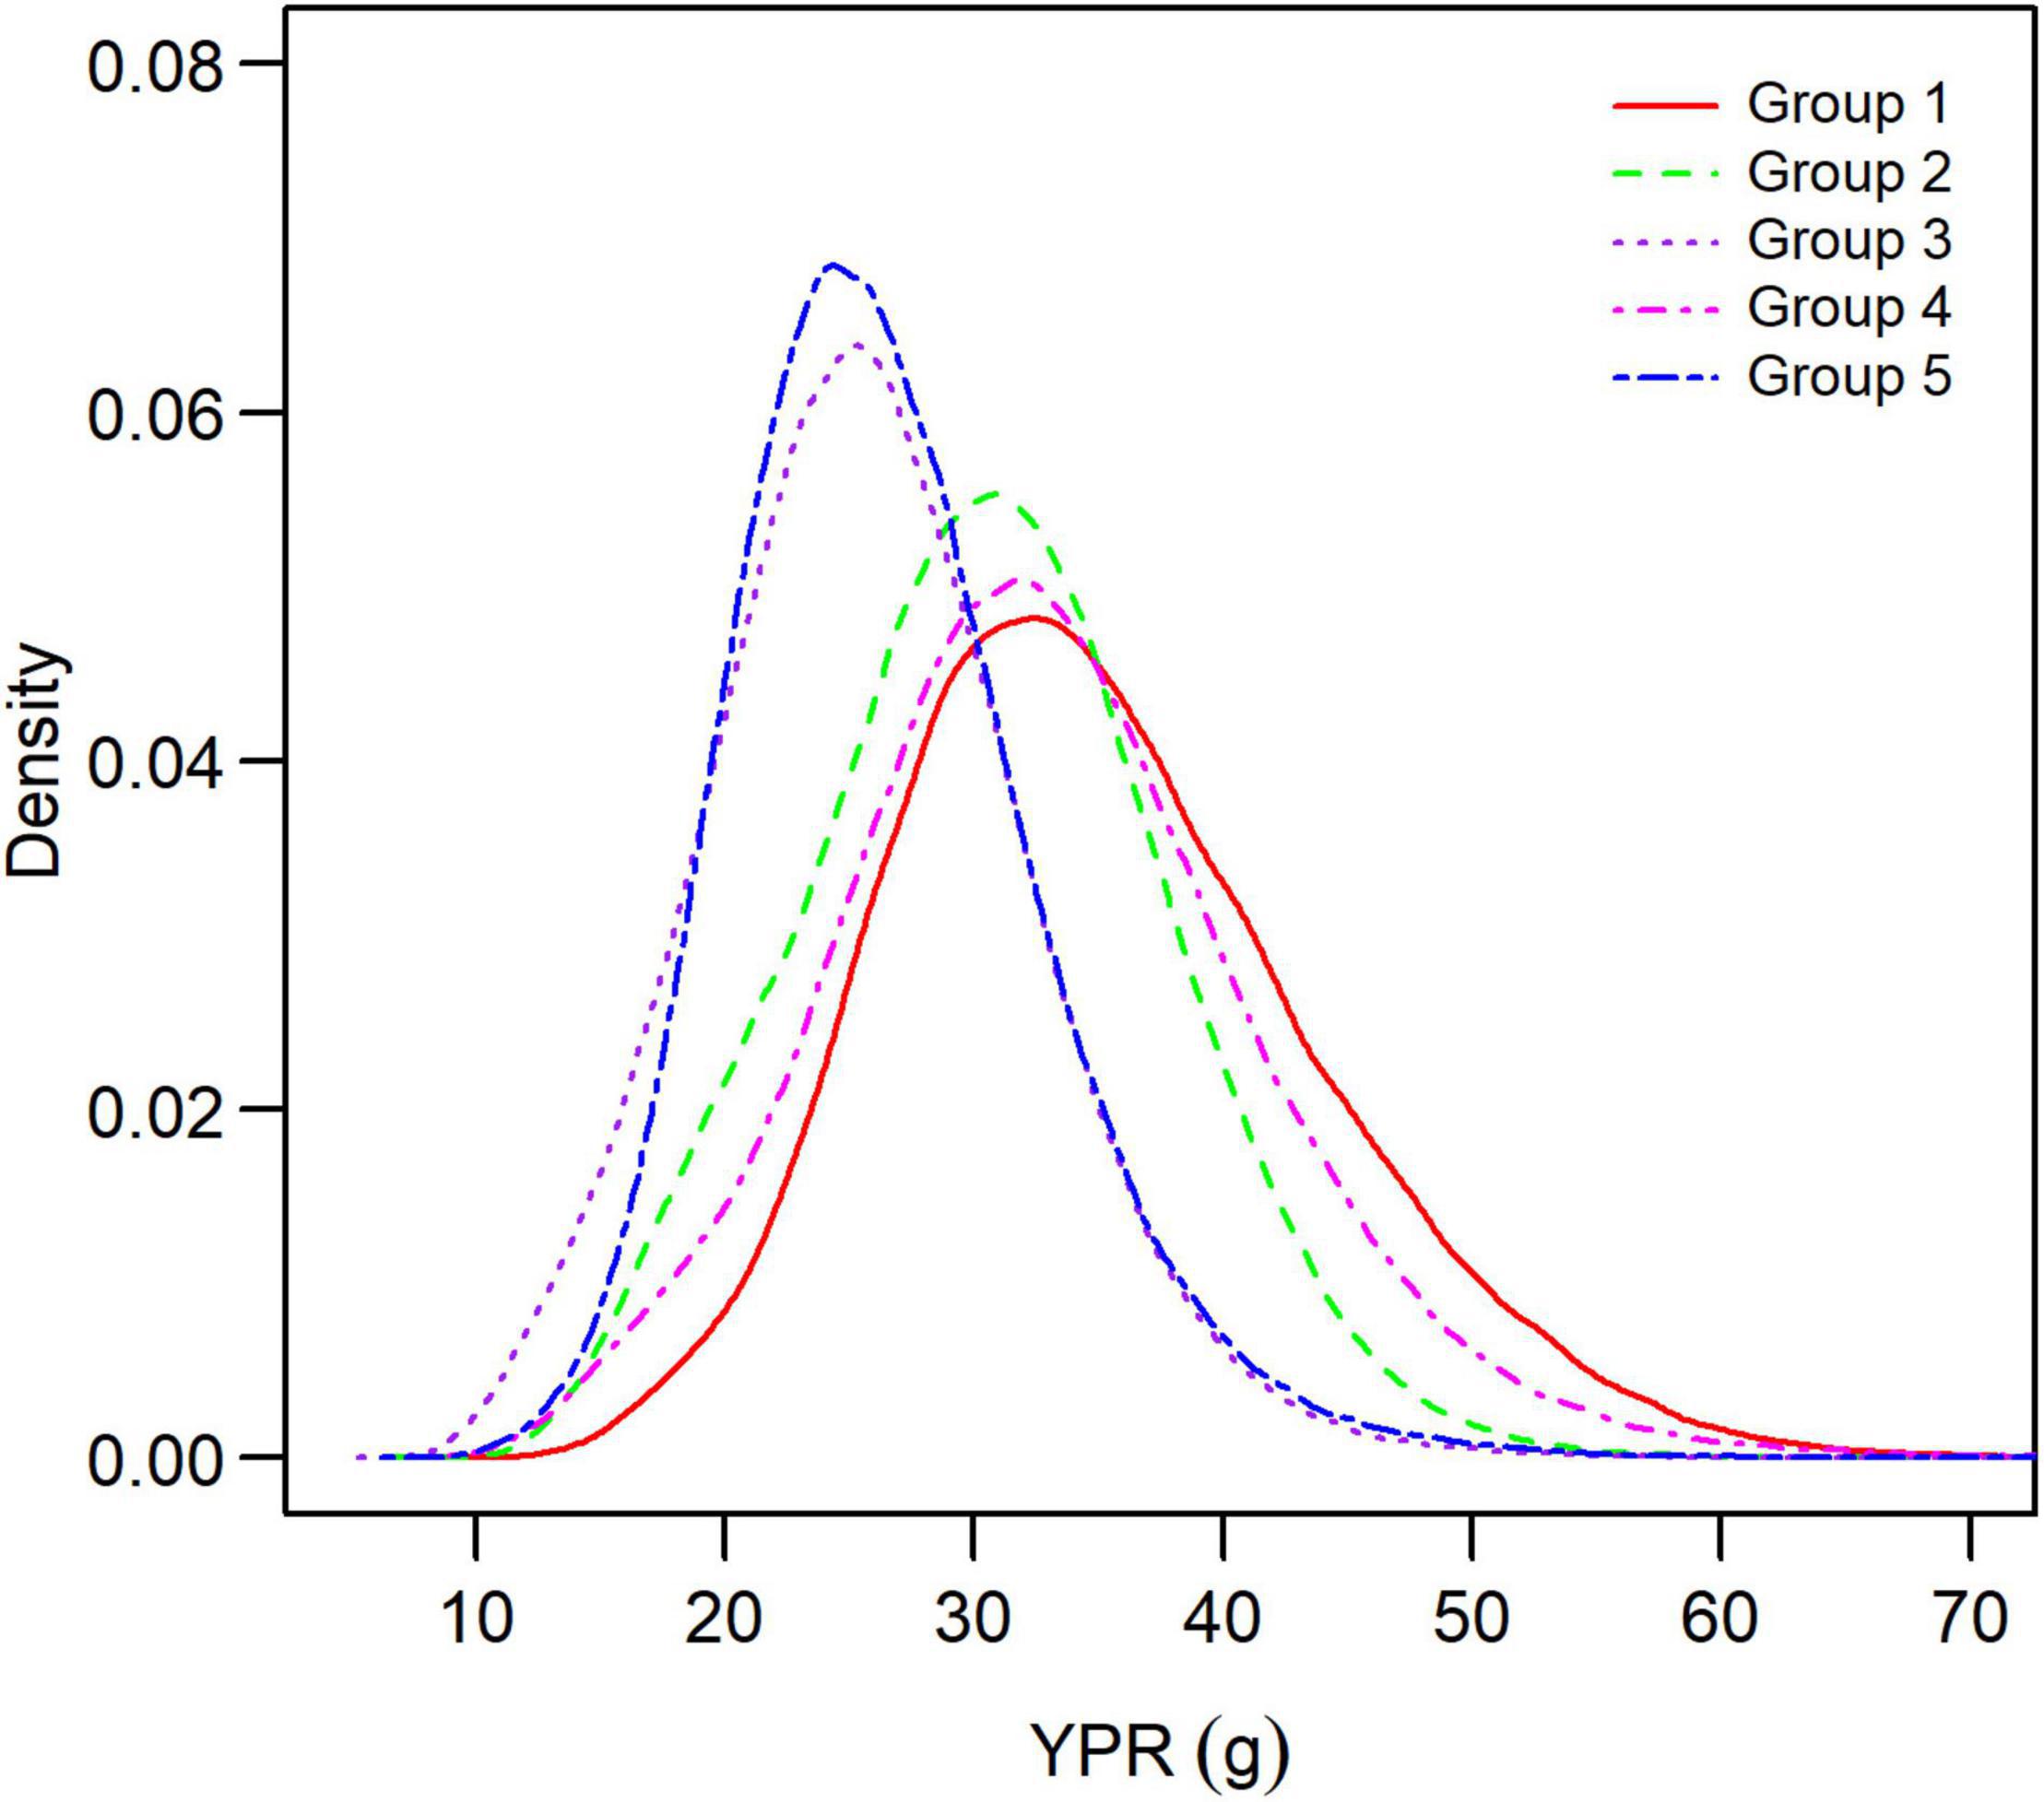
Figure 7. Distribution of maximum yield-per-recruit for each group of small yellow croakers when tmax = 3 years.
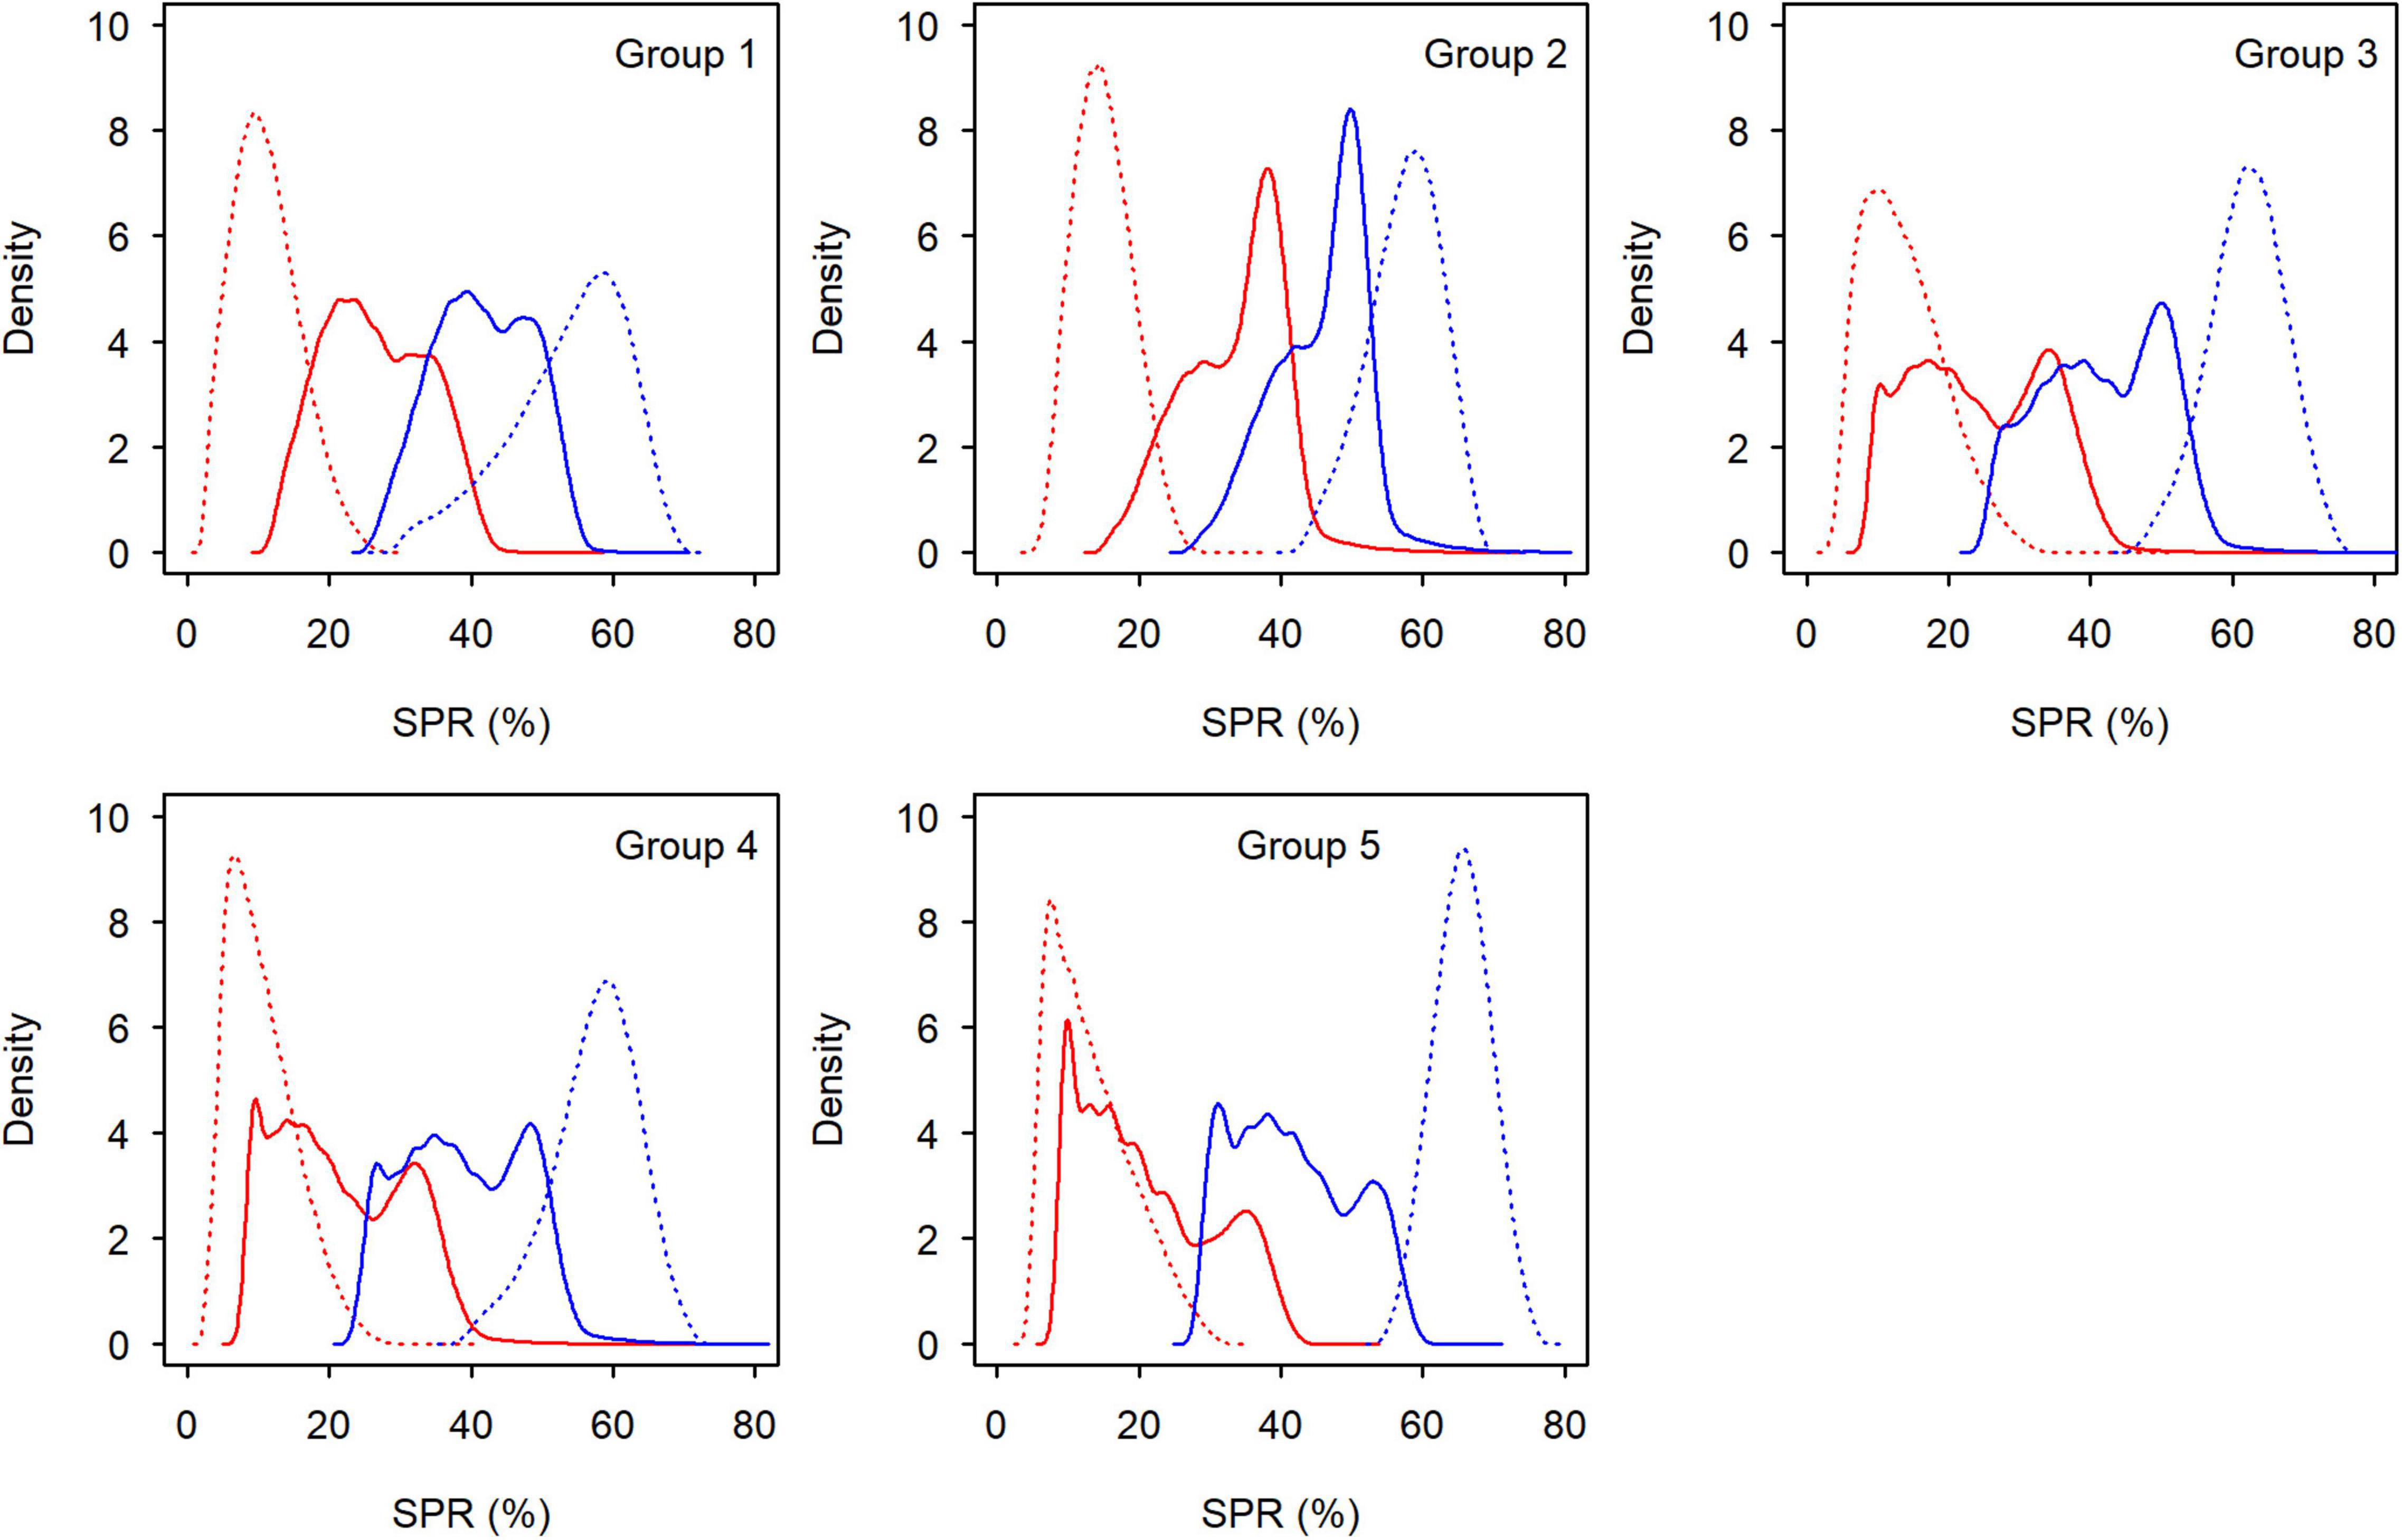
Figure 8. Distribution of spawning potential ratio at Fcur (red lines) and at FMSY (blue lines) for each group of small yellow croakers when Lc = 12.0 cm (tmax = 3 years: solid lines; tmax = toptmax: dotted lines).
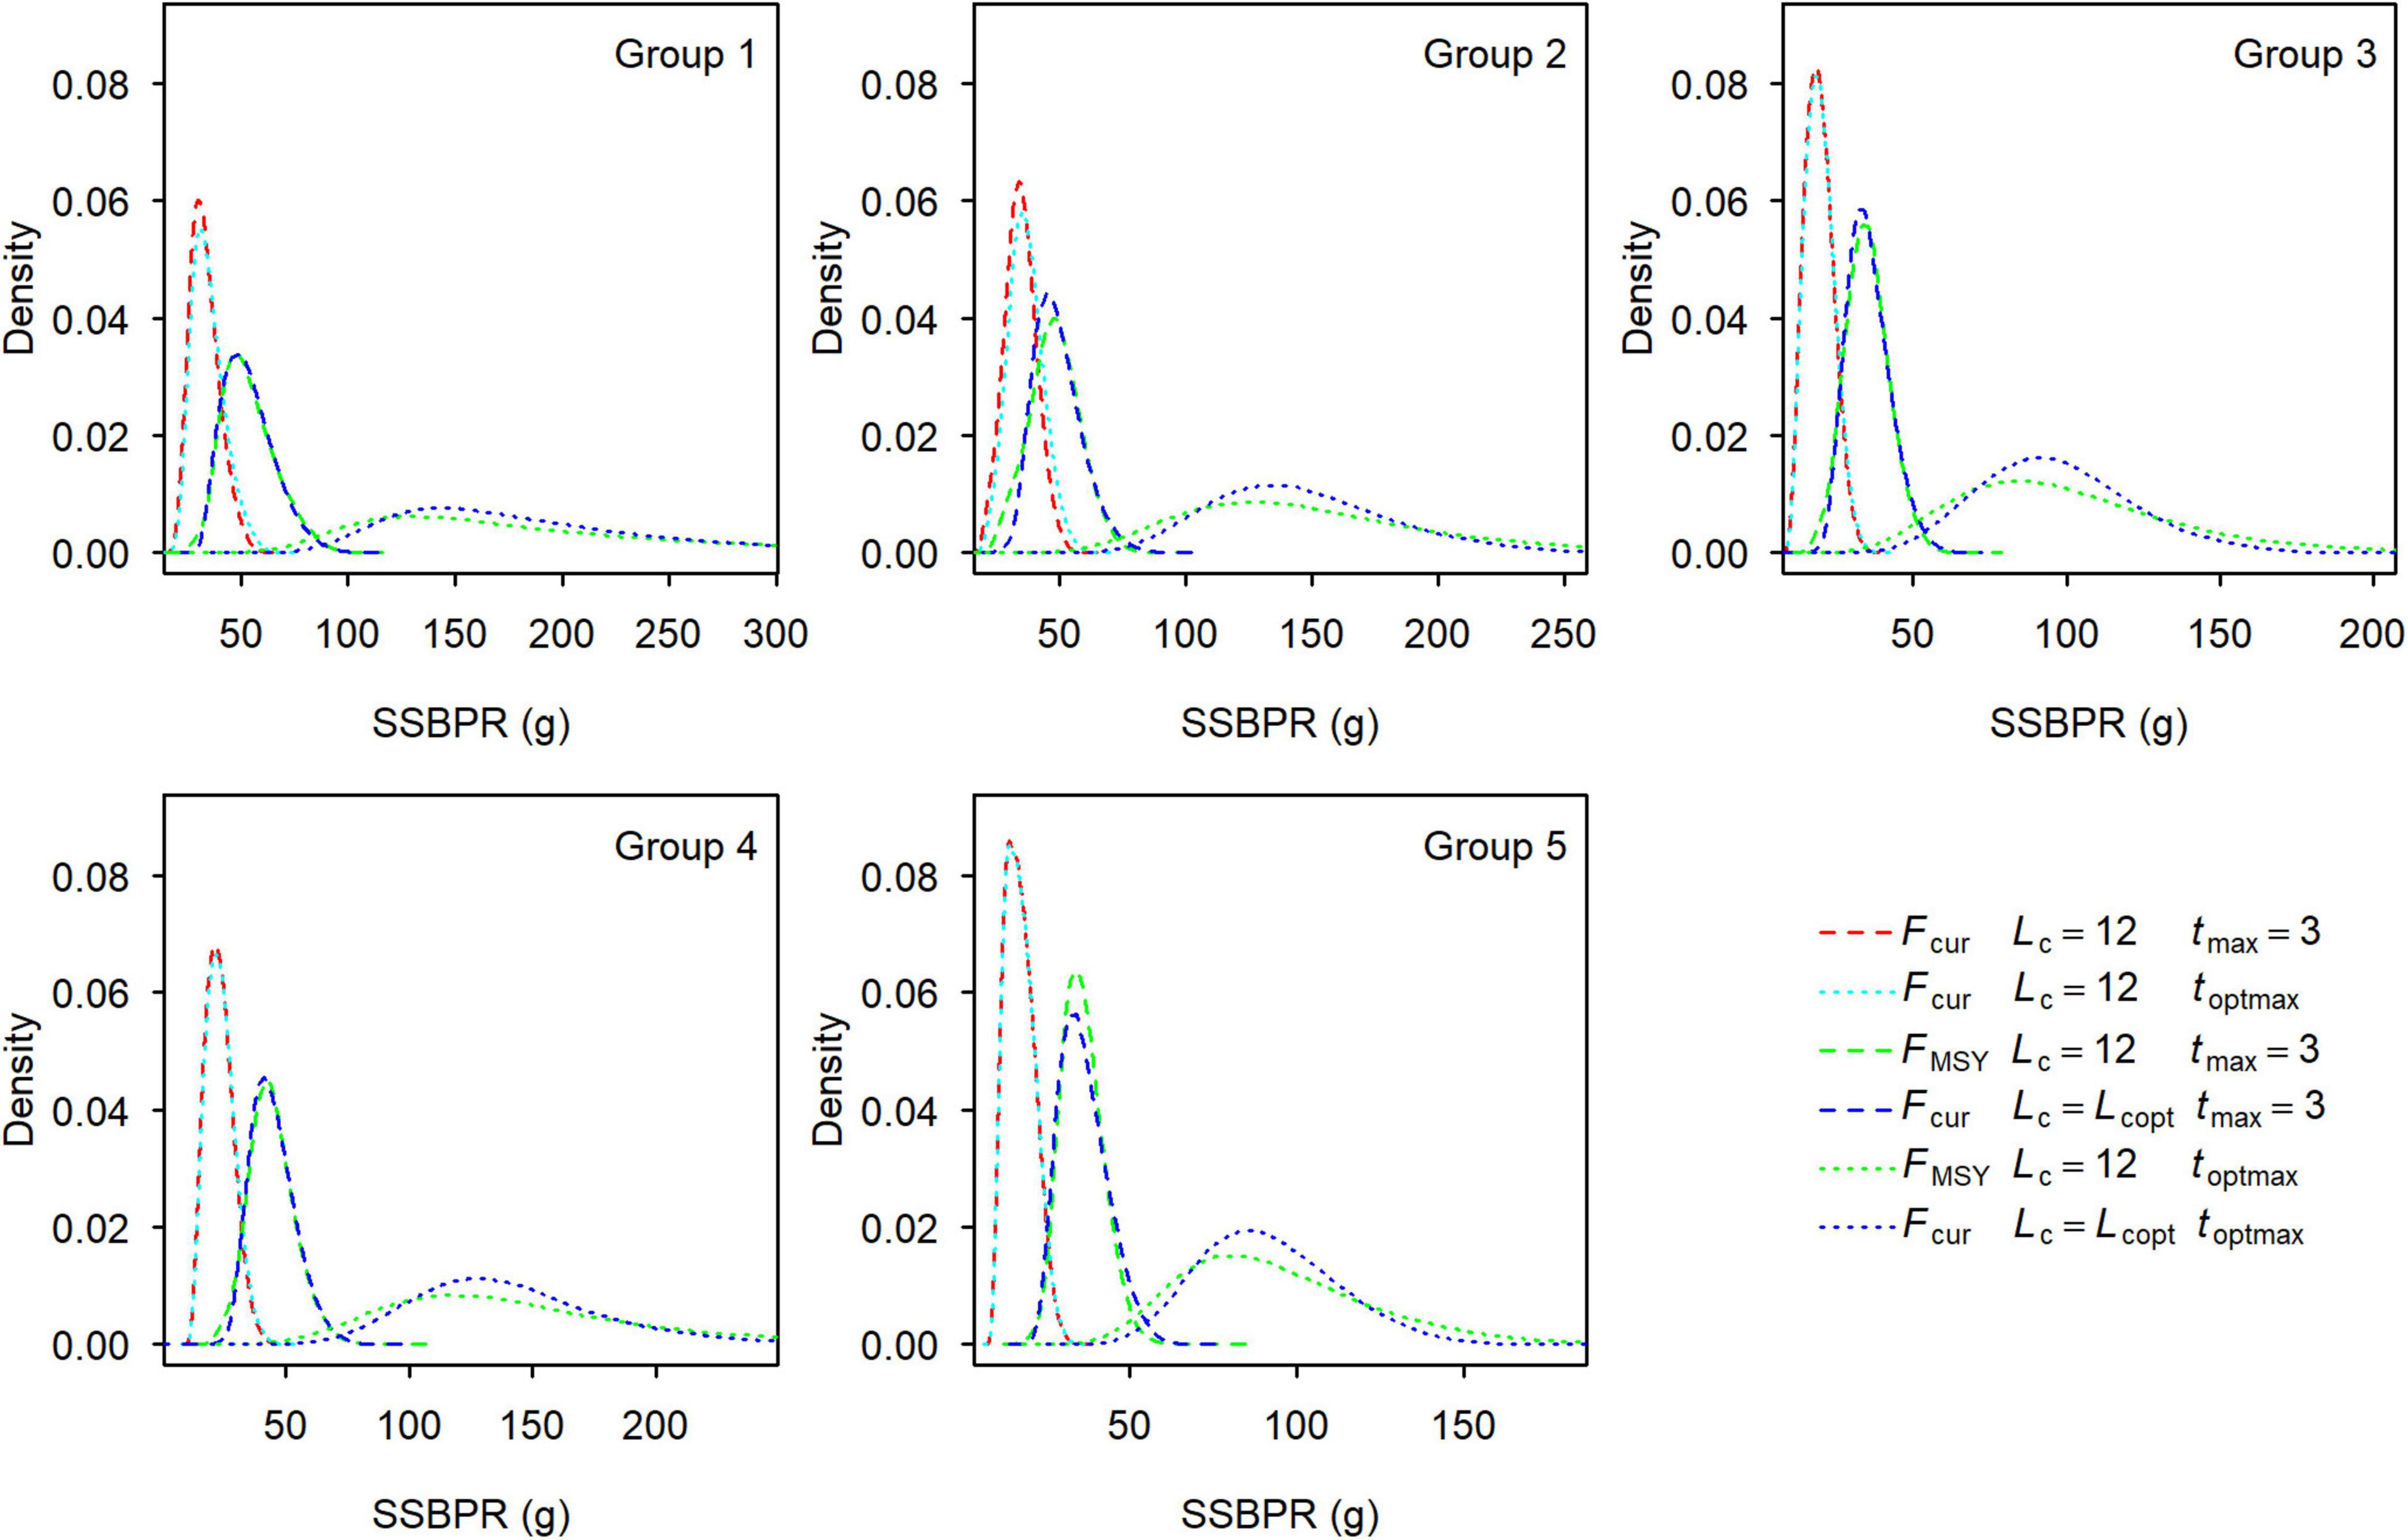
Figure 9. Distribution of spawning stock biomass-per-recruit at Fcur and at FMSY for each group of small yellow croakers when Lc = 12.0 cm and Lc = Lcop. Lcopt was 15.05, 14.80, 15.15, 15.20, and 15.55 cm for Groups 1–5 when tmax = 3, and 23.30, 22.67, 22.19, 22.76, and 22.35 cm when tmax = toptmax.
SPRMSY was not suitable to be used as the benchmark to derive Lcopt when tmax = 3 years because its distribution had two or more modes (Figure 8). We derived Lcopt according to the distribution of SSBPRMSY, which ranged from 14.80 to 15.55 cm when tmax = 3 years and from 22.19 to 23.30 cm when tmax = toptmax (Figure 9). SSBPR at Fcur (SSBPRcur) and SSBPRMSY had a similar distribution when Lcopt was used for each group. But uncertainty in the SSBPR increased when Lc increased to the value of Lcopt as this increased the distribution of the SSBPR for each group. Lcopt could also lead to a higher yield when tmax = 3 years (Table 3). Median YPR would increase 14, 6, 11, 17, and 16% for Groups 1–5, respectively.
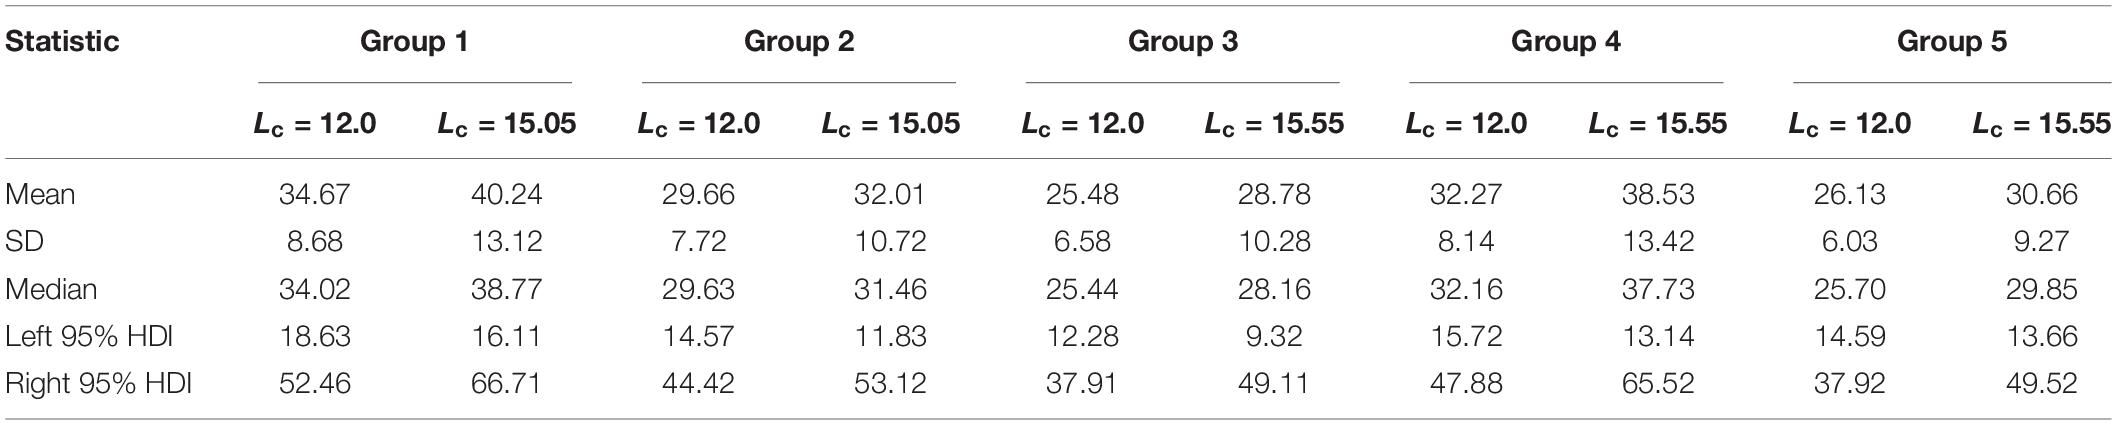
Table 3. Summary of yield-per-recruit at the current fishing mortality rate for each group of small yellow croakers when tmax = 3 years (unit: g).
This study presented a framework for measuring uncertainty in the outputs of per-recruit analysis for small yellow croaker fisheries. In this framework, the Bayesian approach was used to estimate probability distributions for life history parameters. Credible MCMC samples from Bayesian analysis were used to generate the distributions for a quantity of interest from a YPR model and an SSBPR model. Based on previous work, we checked the status of five groups of small yellow croakers and derived optimal lengths at first capture when SSBPRMSY was used as the benchmark. The results showed that uncertainty in a quantity of interest from per-recruit analysis, such as YPR and SSBPR at a fishing mortality rate, could be well quantified using credible MCMC samples and expressed as a probability distribution (Figures 7, 9). The credible range of a quantity could be further expressed as the 95% HDI (Tables 2, 3). Uncertainty in growth parameters, LWR parameters, and natural mortality rate created variation in the reference points (Figure 3), YPR curve (Figure 5), and SPR curve (Figure 6).
In theory, F0.1 always exists, but Fmax is poorly defined in some cases, and even cannot be defined (Rivard and Maguire, 1993). When the natural mortality rate is high relative to growth, the combination of life history paramters will lead to the asymptotic YPR curve, in which Fmax cannot be found (Jensen, 2000). That F20% could not be defined was also due to the low growth and a relatively high natural mortality rate. SPR is positively correlated with natural mortality and negatively correlated with various indices of size (Caddy and Mahon, 1995). The SPR curve will be too high to intersect the horizontal line passing through 20% when growth is low relative to the natural mortality rate. Although some estimates of F20% were extremely high when tmax = 3 years (Figure 3), the 95% HDI could exclude them and provide the range of acceptable values (Table 2).
Overfishing likely occurred for all groups of small yellow croaker because Fcur was significantly higher than FMSY for each group (Table 2). This is consistent with the conclusions made by Ma et al. (2020). A similar conclusion could be drawn if F0.1 was taken as the benchmark because P(Fcur > F0.1) was high for each group when tmax = 3 years (Figure 4), indicating that F0.1 can index the status for small yellow croaker at present. Fmax is not suited for judging the status of small yellow croaker when tmax = 3 years because P(Fcur > Fmax) was not high, especially for groups 1, 2, and 3. Generally, Fmax is not a useful conservation standard because it may be extremely high to maximize yield, which will reduce the spawning potential of the stock to near zero (Goodyear, 1993). Recruitment overfishing may not occur for the current stocks (tmax = 3 years) because P(Fcur > F20%) was also not high (Figure 4). But Fcur was higher than both Fmax and F20% with a high probability for each group when tmax = toptmax, indicating that the current fishing mortality rate was too high for small yellow croakers with the optimal maximum age. Recruitment overfishing might have occurred in the past, but the stocks recovered by changing the life history traits. For instance, small yellow croakers now grow faster and mature earlier.
The level of uncertainty in reference points was jointly determined by uncertainty in three types of life history parameters. However, the contribution of each type of parameter was different, depending on its level of uncertainty. Generally, the LWR parameters have a low level of uncertainty for most fished species because length–weight data are easy to collect and can be measured accurately, whereas uncertainty in growth parameters and natural mortality rate is relatively high. For each group of small yellow croaker, the estimated LWR parameter was almost normally distributed and had the lowest uncertainty among the three types of life history parameters (Zhu et al., 2020). Thus, the LWR parameter had limited influence on all reference points in this study (Figure 3). Natural mortality rate is more difficult to estimate accurately in comparison to growth parameters. Estimates of the natural mortality rate have a high degree of uncertainty (Hamel, 2015). Thus, natural mortality rate has been commonly identified as a key factor influencing the stock assessment for a variety of species (e.g., Grabowski and Chen, 2004; Jiao et al., 2005; Chang et al., 2009). However, uncertainty surrounding growth parameters was the main contributor to the uncertainty in all reference points for small yellow croaker stocks when tmax = 3 years (Figure 3). But the relative importance of uncertainty in growth parameters and natural mortality rate changed with the assumed maximum age. The impact of uncertainty in natural mortality rate on per-recruit analysis became stronger as the maximum age increased. Natural mortality rate became the key source of uncertainty in stock assessments when tmax = 7 years. These results implied that growth parameters may be a key factor influencing the assessment conclusions for a stock with a younger maximum age, unless uncertainty in growth parameters is lower than that of the natural mortality rate.
Maximum age affected the per-recruit analysis. The number of parameter sets that could not generate F20% reduced with an increase in maximum age (Table 1). Larger maximum age values resulted in more SSBPR terms according to Eq. 3. Correspondingly, the SPR curve may have a shape that can define F20%. The estimates of all reference points decreased with an increase in maximum age (Figure 3). That is, fishing mortality rate must be further reduced to let small yellow croakers grow older. A very low fishing mortality rate is needed to maintain the optimal maximum age for small yellow croakers (Table 2). An appropriate choice of the maximum age is particularly important for SSBPR analysis because the maximum age determines the magnitude of maximum SSBPR and further influences SPR. For instance, SSBPRcur was very close for the two maximum ages (Figure 9), but different SPRcur was produced (Figure 8) due to the effect of maximum SSBPR. Normally, a maximum age exists for an unexploited fish stock. A younger maximum age may be observed from a sample after this stock is exploited. If this younger maximum age is employed in the SSBPR model, maximum SSBPR will be underestimated (Mace and Sissenwine, 1993). As a result, a positive bias will be introduced into the estimate of SPR (Goodyear, 1993). In this situation, the maximum age of unexploited stock must be used in the SSBPR analysis. It is worth discussing the choice of maximum age for an overexploited stock that has a much younger maximum age for many years due to long-term heavy fishing. For example, the reported oldest age for small yellow croaker is 21 years in the Bohai Sea (Guo et al., 2006) and 23 years in the southern Yellow Sea (Mao et al., 1987), but the maximum age of small yellow croakers in each region may have not exceeded 3 years for about 15 years. Therefore, it is not realistic to adopt tmax = 21 or 23 years to calculate the YPR and the SSBPR for current stocks. But these optimal maximum ages can be used to calculate management quantities, such as the reference points in Table 2.
There was a significant difference in maximum YPR among groups (Figure 7). YPR at a fishing mortality rate is positively correlated with growth indices and negatively correlated with natural mortality rate according to Eq. 1. Therefore, maximum YPR of Group 1 was greatest mainly because of its highest asymptotic average body size and lowest natural mortality rate among the five groups (Supplementary Tables 2, 4). The lowest SPR curve in Group 1 was also caused by its high growth indices and lowest natural mortality rate, which can be attributed to a negative correlation between SPR and growth, and a positive correlation between SPR and natural mortality.
Median SPRMSY was higher than 40% for all groups of small yellow croaker except Group 4 when tmax = 3 years (Figure 6). Each group required a higher SPRMSY when tmax = toptmax (Figure 8). At present, spawning stock may drop below the level for supporting MSY. Although seas are closed to fishing in summer every year in China, this closed season policy does not prevent overfishing for small yellow croakers; rather, it temporarily enhances the biomass of small yellow croakers (Cheng et al., 2004; Yue et al., 2016). Relative abundance of small yellow croakers increases significantly during the closed months and is the greatest at the end of the closure (Cheng et al., 2004). However, relative abundance is reduced to a low level again in late December due to high fishing pressure (Cheng et al., 2004). Additional management measures are needed to ultimately enhance stocks.
Spawning stock biomass-per-recruit is superior to SPR when deriving Lcopt. It was easy to derive Lcopt using SSBPRMSY because it had a unimodal distribution (Figure 9). However, a younger maximum age could cause the complex distribution for SPRMSY (Figure 8), which limited the application of SPR. The derived Lcopt could improve both SPR and YPR for each group when tmax = 3 years (Table 3 and Figure 8). But Lcopt was different among groups. Groups 1 and 2 are commonly managed by one agency, whereas Groups 3–5 are co-managed by another agency. Vessels can operate anywhere within the jurisdiction of an agency. One policy that could be implemented for Groups 1 and 2 is to use a value of 15.05 cm for Lcopt. This policy could be easily implemented in practice. Similarly, a Lcopt of 15.55 cm can be used for Groups 3–5. These policies would be more conservative for Groups 2–4. It is not realistic to increase Lc to 22.19–23.30 cm (Figure 9). Fishing mortality rate also needs to be reduced to let small yellow croakers reach the optimal maximum age.
The proposed Lc from YPR analysis is usually lower than the recommended value in this study. According to the YPR isopleth, Lin et al. (2006) proposed Lc = 17.0 cm (Lcopt range = 15.48–17.43 cm) for Groups 3–5. Zhang et al. (2010a) suggested Lc = 14.83 cm (Lcopt range = 11.89–15.42 cm) for Group 3. Gao et al. (2019) recommended Lc = 15.0 cm (Lcopt range = 15.15–15.91 cm) for Group 5. Although the upper limit of the Lcopt range estimated by Gao et al. (2019) was higher than 15.55 cm, a relatively small value was chosen. Only the recommended Lc (17.0 cm) by Lin et al. (2006) was high enough to conserve Groups 3–5. But the YPR produced by an Lc of 17.0 cm at Fcur was lower than that produced by an Lc of 15.55 cm for these three groups. Zhai and Pauly (2019) derived an Lcopt of 13.5 cm from YPR analysis and 14.0 cm from utility-per-recruit analysis for Group 1 based on the parameter estimates of Liu et al. (2018). These two values were lower than our result (15.05 cm). Lcopt might have been underestimated by Zhai and Pauly (2019) due to limited data.
The estimated parameters are often imprecise and different between independent studies because the oberved data are a subsample from the population of interest (Doll et al., 2017). Uncertainty in per-recruit analysis will be dominated by the observed data when parameter estimates and their SDs derived from these data are used to generate random parameters. Uncertainty of the parameters estimated from a subsample may be narrower than when data from other years are considered (Froese et al., 2014). Thus, the resulting uncertainty in a quantity from per-recruit analysis may be underestimated. When random parameters are obtained by specifying SDs or CVs for a particular set of parameter estimates, the resulting uncertainty in the outcome of a per-recruit model will be influenced by both the specified estimates and SDs or CVs. In contrast, existing information regarding a parameter can be introduced to Bayesian analysis and the resulting uncertainty of this parameter may be more realistic. Therefore, parameter estimates from Bayesian inference may lead to more realistic uncertainty for a quantity of interest from per-recruit analysis. In addition, the correlated parameters from different types of life history can also be easily incorporated into a Bayesian model to estimate the parameter of interest using their correlation (Pulkkinen et al., 2011; Zhu et al., 2020). Moreover, uncertainty in a parameter with less information can be reduced through their correlation. Thus, estimating parameters using Bayesian inference is suited for quantifying uncertainty in per-recruit analysis.
Generating extremely low or high values from Bayesian inference is unavoidable when sampling in the posterior distribution of a parameter using the MCMC technique. The extreme values may have no biological meaning or exceed the reasonable range. We used MCMC samples inside 95% HDI to avoid the impact of extreme values. The total probability of MCMC samples in the 95% HDI is 95% and these samples are the 95% most credible values (Kruschke, 2014). These MCMC samples can generate uncertainty for a quantity for per-recruit analysis. The median of a quantity was similar when all MCMC samples were used. The mean had an increase of 2–5% for Fmax, 1–4% for F0.1, and 1–3% for F20% when t = 3 years. The 95% HDI became wider due to the increase in the range of MCMC samples; 95% HDI of Fmax had a largest change among these three reference points. Its lower limit decreased by 3–11% and upper limit increased by 5–10%. The variation in the mean and the median of Lcopt was no more than 1% and was less than 2% in the limits of 95% HDI.
Markov chain Monte Carlo samples used in per-recruit analysis were derived from the existing estimates of life history parameters. Growth parameters and natural mortality rate were slightly skewed for most groups of small yellow croakers due to variation in parameter estimates and the relatively small size of the dataset (Zhu et al., 2020). As a result, the distribution of a quantity from per-recruit analysis was also not exactly normal (Figures 7, 9). New data are needed to reduce uncertainty in the output of per-recruit analysis by improving parameter estimates. According to the framework shown in Figure 2, when new data are collected for a group of small yellow croakers in the future, the distributions of parameters estimated by Zhu et al. (2020) will serve as the prior values to derive the newest distributions for life history parameters. Then the resulting credible MCMC samples are used to conduct per-recruit analysis to update our knowledge on a quantity of interest from per-recruit analysis. This procedure for measuring uncertainty in per-recruit analysis is general and suitable for other species. In this framework, other Bayesian approaches can also be adapted to obtain MCMC samples of life history parameters for quantifying uncertainty in the outcomes of per-recruit analysis. The conclusion regarding the status assessment and the recommended Lc in this study were also influenced by the estimates of Fcur and FMSY. When new knowledge on Fcur and FMSY is available, per-recruit analysis needs to be carried out again to update our understanding of the status of each group. In addition, the derived Lcopt for small yellow croakers with the optimal maximum age was influenced by parameter values and FMSY. Current parameter values may be different from those when small yellow croakers attained the optimal maximum age. Similarly, FMSY in 1968 may also be biased. The groups of small yellow croakers were divided in terms of conventional investigation region. It is still unclear whether or not Groups 3 and 4 belong to the same subpopulation. Although Group 3 is the main part of Group 4 in this study, their maximum YPRs were significantly different (Figure 7). Group 3 had larger median values of Fmax, F0.1, and F20% than Group 4 (Table 2), whereas Group 4 had higher YPR and SSBPR (Table 3 and Figure 9). There is a need to discuss the division of groups for small yellow croakers to conduct better resource surveys and stock assessment for this species.
Overfishing likely occurred for all groups of small yellow croakers in China, but recruitment overfishing may not occur if the maximum age is maintained at 3 years. High fishing mortality and small length at first capture might cause SPRcur to be lower than SPRMSY. The current closed season policy coupled with the recommended lengths at first capture could recover the biomass to support MSY when tmax = 3 years. The required fishing mortality rate was very low for small yellow croakers with the optimal maximum age. Besides increasing length at first capture, the fishing mortality rate needs to be reduced to attain the optimal maximum age for each group.
The combination of the SSBPR model and FMSY from the surplus production model can lead to a more conservative length at first capture than the YPR model. SSBPRMSY is more suitable to derive the optimal length at first capture than SPRMSY.
The credible parameter values from Bayesian inference could quantify uncertainty well in the output of per-recruit analysis. The presented framework for measuring uncertainty in the outcome of per-recruit models is suited for other fish species, and the Bayesian approach to parameter estimation in this framework is not limited to that utilized in our previous work: other Bayesian methods can also be used to derive input parameters for per-recruit models.
The data analyzed in this study are subject to the following licenses/restrictions: The MCMC samples from Bayesian inference will be shared on reasonable request to the corresponding author. All other datasets generated for this study are included in the article/Supplementary Material. Requests to access these datasets should be directed to ZL, bGlhbmd6aGVubGluQHNkdS5lZHUuY24=.
Ethical review and approval was not required for the animal study because our manuscript was based on data from literatures and no live vertebrates or higher invertebrates were involved.
LZ performed the computing work and wrote the manuscript. CG analyzed the data. ZJ and CL drafted the figures. GH collected the data. ZL designed this study and provided financial support. All authors contributed to the article and approved the submitted version.
This work was funded by the Natural Science Foundation of Shandong Province, China (No. ZR2010DQ019) and China Postdoctoral Science Foundation (No. 2017M622180).
The authors declare that the research was conducted in the absence of any commercial or financial relationships that could be construed as a potential conflict of interest.
All claims expressed in this article are solely those of the authors and do not necessarily represent those of their affiliated organizations, or those of the publisher, the editors and the reviewers. Any product that may be evaluated in this article, or claim that may be made by its manufacturer, is not guaranteed or endorsed by the publisher.
The authors thank Qiuyun Ma from Shanghai Ocean University for providing values of FMSY in small yellow croaker fisheries. We are grateful to the two reviewers for providing valuable comments, which improved the manuscript. We would like to particularly thank the Associate Editor, ND, for providing constructive comments and making corrections.
The Supplementary Material for this article can be found online at: https://www.frontiersin.org/articles/10.3389/fmars.2021.652293/full#supplementary-material
Caddy, J. F. (1984). Indirect approaches to regulation of fishing effort. FAO Fish. Rep. 289, 63–75.
Caddy, J. F., and Mahon, R. (1995). “Reference points for fisheries management” FAO Fisheries Technical Paper (Rome: Food and Agriculture Organization of the United Nations), 347:83.
Chang, Y. J., Sun, C. L., Chen, Y., Yeh, S. Z., and Chiang, W. C. (2009). Incorporating uncertainty into the estimation of biological reference points for a spiny lobster (Panulirus penicillatus) fishery. New Zeal. J. Mar. Fresh 43, 429–442. doi: 10.1080/00288330909510012
Chen, M., Lu, Z., Du, J., and Yang, S. (2010). Changes in Ecological Parameters of Small Yellow Croaker, Pseudosciaena polyactis, in Eastern Fujian Fishing Ground. J. Xiamen. Univ. 49, 260–265.
Chen, R., Li, X., Fan, G., Zhao, X., and Zhang, G. (2018). Minimal cod-end mesh of a pair trawl in the Yellow Sea. J. Dalian. Ocean Univ. 33, 258–264.
Chen, Y., and Wilson, C. (2002). A simulation study to evaluate impacts of uncertainty on the assessment of American lobster fishery in the Gulf of Maine. Can. J. Fish. Aquat. Sci. 59, 1394–1403. doi: 10.1139/f02-102
Cheng, J., Lin, L., Ling, J., Li, J., and Ding, F. (2004). Effects of summer close season and rational utilization on redlip croaker (Larimichthys polyactis Bleeker) resource in the East China Sea Region. J. Fish. Sci. China 11, 554–560.
Doll, J. C., Lauer, T. E., and Clark-Kolaks, S. (2017). Yield-per-recruit modeling of two piscivores in a Midwestern reservoir: a Bayesian approach. Fish. Res. 191, 200–210. doi: 10.1016/j.fishres.2017.03.012
Froese, R., Thorson, J. T., and Reyes, R. Jr. (2014). A Bayesian approach for estimating length−weight relationships in fishes. J. Appl. Ichthyol. 30, 78–85. doi: 10.1111/jai.12299
Gabriel, W. L., and Mace, P. M. (1999). “A review of biological reference points in the context of the precautionary approach” in Proceedings of the Fifth National NMFS Stock Assessment Workshop: Providing Scientific Advice to Implement the Precautionary Approach Under the Magnuson-Stevens Fishery Conservation and Management Act, ed. V. R. Restrepo (Key Largo: U.S. Department of Commerce), 34–45.
Gao, C., Ma, Q., Tian, S., Dai, X., Kindong, R., Gou, X., et al. (2019). Growth, mortality and yield per recruitment of small yellow croaker in offshore waters of southern Zhejiang. J. Fish. Sci. China 26, 925–937. doi: 10.3724/SP.J.1118.2019.19004
Gavaris, S. (1993). “Analytical estimates of reliability for the projected yield from commercial fisheries” in Risk Evaluation and Biological Reference Points for Fisheries Management. eds S. J. Smith, J. J. Hunt, and D. Rivard (Ottawa: National Research Council of Canada). 185–191.
Goodyear, C. P. (1993). “Spawning stock biomass per recruit in fisheries management: foundation and current use” in Risk Evaluation and Biological Reference Points for Fisheries Management, eds S. J. Smith, J. J. Hunt, and D. Rivard (Ottawa: National Research Council of Canada). 67–81.
Govender, A., Al-Oufi, H., Mcilwain, J., and Claereboudt, M. (2006). A per-recruit assessment of the kingfish (Scomberomorus commerson) resource of Oman with an evaluation of the effectiveness of some management regulations. Fish. Res. 77, 239–247. doi: 10.1016/j.fishres.2005.08.010
Grabowski, R., and Chen, Y. (2004). Incorporating uncertainty into the estimation of the biological reference points F0.1 and Fmax for the Maine green sea urchin (Strongylocentrotus droebachiensis) fishery. Fish. Res. 68, 367–371. doi: 10.1016/j.fishres.2003.12.005
Guo, X., Jin, X., and Dai, F. (2006). Growth variations of small yellow croaker (Pseudosciaena polyactis Bleeker) in the Bohai Sea. J. Fish. Sci. China 13, 243–249.
Hamel, O. S. (2015). A method for calculating a meta-analytical prior for the natural mortality rate using multiple life history correlates. ICES J. Mar. Sci. 72, 62–69. doi: 10.1093/icesjms/fsu131
Hart, D. R. (2013). Quantifying the tradeoff between precaution and yield in fishery reference points. ICES J. Mar. Sci. 70, 591–603. doi: 10.1093/icesjms/fss204
Helser, T. E., Sharov, T., and Kahn, D. M. (2001). “A stochastic decision-based spproach to assessing the Delaware Bay blue crab (Callinectes sapidus) stock” in Incorporating Uncertainty into Fishery Models, eds J. M. Berkson, L. L. Kline, and D. J. Orth (Bethesday: American Fisheries Society Publication). 63–82.
Hu, H., Ye, Z., Li, Z., Wang, M., Wen, Q., and Yu, H. (2015). A preliminary study on the biology of the spawning stock of small yellow croaker (Pseudosciaena ployactis) inhabiting the near shore of southern Yellow Sea. Period. Ocean Univ. China 45, 43–45. doi: 10.16441/j.cnki.hdxb.20140325
Jensen, A. (2000). Harvest reference points for the Beverton and Holt dynamic pool model. Fish. Res. 47, 93–96. doi: 10.1016/s0165-7836(99)00126-5
Jiao, Y., Chen, Y., and Wroblewski, J. (2005). An application of the composite risk assessment method in assessing fisheries stock status. Fish. Res. 72, 173–183. doi: 10.1016/j.fishres.2004.11.003
Jin, X. (1996). Ecology and population dynamics of small yellow croaker (Pseudosciaena ployactis Bleeker) in the Yellow Sea. J. Fish. Sci. China 3, 32–46.
Jin, X., and Deng, J. (2000). Variations in community structure of fishery resources and biodiversity in the Laizhou Bay. Shandong. Chin. Biodivers. 8, 65–72.
Kruschke, J. N. (2014). Doing Bayesian Data Analysis: a Tutorial With R, JAGS, and Stan. Boston: Academic Press.
Li, Z., Shan, X., Jin, X., and Dai, F. (2011). Long-term variations in body length and age at maturity of the small yellow croaker (Larimichthys polyactis Bleeker, 1877) in the Bohai Sea and the Yellow Sea, China. Fish. Res. 110, 67–74. doi: 10.1016/j.fishres.2011.03.013
Lin, L., Cheng, J., Ling, J., and Zhang, H. (2006). First capture sizes of major commercial fishes in the East China Sea Region. J. Fish. Sci. China 13, 250–256.
Lin, L., Cheng, J., Ren, Y., and Ling, J. (2004). Analysis of population biology of small yellow croaker Pseudosciaena polyactis in the East China Sea region. J. Fish. Sci. China 11, 333–338.
Lin, L., Liu, Z., Jiang, Y., Huang, W., and Gao, T. (2011). Current status of small yellow croaker resources in the southern Yellow Sea and the East China Sea. Chin. J. Oceanol. Limn. 29, 547–555. doi: 10.1007/s00343-011-0182-8
Lin, X., Deng, S., Huang, Z., and Wang, Q. (1965). “Study of population on biometrics of small yellow croaker (Pseudosciaena polyactis Bleeker)” in Collections of Marine Fishery Resource, eds Y. Zhu and S. Zhu (Beijing: China Agriculture Press). 84–108.
Lin, Y. J., Chang, Y. J., Sun, C. L., and Tzeng, W. N. (2010). Evaluation of the Japanese eel fishery in the lower reaches of the Kao-Ping River, southwestern Taiwan using a per-recruit analysis. Fish. Res. 106, 329–336. doi: 10.1016/j.fishres.2010.08.015
Lin, Y. J., Sun, C. L., Chang, Y. J., and Tzeng, W. N. (2015). Sensitivity of yield-per-recruit and spawning-biomass-per-recruit models to bias and imprecision in life history parameters: an example based on life history parameters of Japanese eel (Anguilla japonica). Fish. Bull. 113, 302–312. doi: 10.7755/FB.113.3.6
Liu, W., Guo, Z., and Zhan, B. (1999). Analysis on the current exploitation of Pseudosciaena ployactis in the East China Sea. J. Shanghai Fish. Univ. 8, 105–111.
Liu, X. (1990). Small Yellow Croaker (Pseudosciaena Ployactis) (China: Fishery Bureau of Ministry of Agriculture), 191–200.
Liu, X., Guo, D., Wang, A., Dong, J., Wang, X., Duan, Y., et al. (2018). Growth characteristics of small yellow croaker Larimichthys polyactis in the Liaodong Bay. Mar. Fish. 40, 139–146. doi: 10.13233/j.cnki.mar.fish.2018.02.002
Liu, Z., Xie, H., Yan, L., Yuan, X., Yang, L., Li, Y., et al. (2013). Comparative population dynamics of small yellow croaker Larimichthys polyactis in Southern Yellow Sea and East China Sea. J. Dalian. Ocean Univ. 28, 627–632. doi: 10.16535/j.cnki.dlhyxb.2013.06.019
Ma, Q., Jiao, Y., and Ren, Y. (2017). Linear mixed-effects models to describe length-weight relationships for yellow croaker (Larimichthys Polyactis) along the north coast of China. PLoS One 12:e0171811. doi: 10.1371/journal.pone.0171811
Ma, Q., Jiao, Y., Ren, Y., and Xue, Y. (2020). Population dynamics modelling with spatial heterogeneity for yellow croaker (Larimichthys polyactis) along the coast of China. Acta Oceanol. Sin. 39, 107–119. doi: 10.1007/s13131-020-1602-4
Mace, P. M., and Sissenwine, M. P. (1993). “How much spawning per recruit is enough?” in Risk Evaluation and Biological Reference Points for Fisheries Management, eds S. J. Smith, J. J. Hunt, and D. Rivard (Ottawa: National Research Council of Canada). 101–118.
Mao, X., Yu, J., and Qin, Y. (1987). Small Yellow Croaker. Shanghai: East China Normal University Press). 339–356.
Pulkkinen, H., Mäntyniemi, S., Kuikka, S., and Levontin, P. (2011). More knowledge with the same amount of data: advantage of accounting for parameter correlations in hierarchical meta-analyses. Mar. Ecol. Prog. Ser. 443, 29–37. doi: 10.3354/meps09368
Restrepo, V. R., and Fox, W. W. Jr. (1988). Parameter Uncertainty and Simple Yield−per−Recruit Analysis. Trans. Am. Fish. Soc. 117, 282–289. doi: 10.1577/1548-8659(1988)117<0282:puasya>2.3.co;2
Rivard, D., and Maguire, J. J. (1993). “Reference points for fisheries management: the eastern Canadian experience” in Risk Evaluation and Biological Reference Points for Fisheries Management, eds S. J. Smith, J. J. Hunt, and D. Rivard (Ottawa: National Research Council of Canada). 31–57.
Romakkaniemi, A. (2015). Best Practices for the Provision of Prior Information for Bayesian Stock Assessment. Copenhagen: International Council for the Exploration of the Sea.
Shan, X., Li, X., Yang, T., Sharifuzzaman, S., Zhang, G., Jin, X., et al. (2017). Biological responses of small yellow croaker (Larimichthys polyactis) to multiple stressors: a case study in the Yellow Sea, China. Acta Oceanol. Sin. 36, 39–47. doi: 10.1007/s13131-017-1091-2
Shan, X., Sun, P., Jin, X., Li, X., and Dai, F. (2013). Long-term changes in fish assemblage structure in the Yellow River Estuary ecosystem. China. Mar. Coast. Fish. 5, 65–78. doi: 10.1080/19425120.2013.768571
Shen, G., and Heino, M. (2014). An overview of marine fisheries management in China. Mar. Policy 44, 265–272. doi: 10.1016/j.marpol.2013.09.012
Shui, B. (2003). Study on the age and growth of Pseudosciaena polyactis in the south of the Yellow Sea and the north of the East China Sea. J. Zhejiang Ocean Univ. 22, 16–20.
von Bertalanffy, L. (1938). A quantitative theory of organic growth (inquiries on growth laws. II). Hum. Biol. 10, 181–213.
Wang, Y., Huang, J., Tang, X., Jin, X., and Sun, Y. (2016). Stable isotopic composition of otoliths in identification of stock structure of small yellow croaker (Larimichthys polyactis) in China. Acta Oceanol. Sin. 35, 29–33. doi: 10.1007/s13131-016-0868-z
Xu, Q., Li, X., Sun, S., Fan, G., Pang, Z., and You, Z. (2019). On catch composition and selectivity of pair-trawling in the Yellow Sea. Mar. Fish. 41, 676–683. doi: 10.13233/j.cnki.mar.fish.2019.06.003
Xu, Z., and Chen, J. (2010). Population division of Larimichthys polyactis in China Sea. Chin. J. Appl. Ecol. 21, 2856–2864.
Yan, L., Hu, F., Ling, J., and Li, S. (2006). Study on age and growth of Larimichthys polyactis in the East China Sea. Period. Ocean Univ. China 36, 95–100.
Yan, L., Liu, Z., Zhang, H., Ling, J., Yuan, X., and Li, S. (2014). On the evolution of biological characteristics and resources of small yellow croaker. Mar. Fish. 36, 481–488. doi: 10.13233/j.cnki.mar.fish.2014.06.001
Ye, C. (1991). “Small yellow croaker (Pseudosciaena ployactis)” in Marine Fisheries Biology, eds J. Deng and C. Zhao (Beijing: China Agriculture Press), 164–200.
Ying, Y., Chen, Y., Lin, L., and Gao, T. (2011). Risks of ignoring fish population spatial structure in fisheries management. Can. J. Fish. Aquat. Sci. 68, 2101–2120. doi: 10.1139/F2011-116
You, Z., Zhao, X., Li, X., Sun, S., Zhu, J., Pang, Z., et al. (2017). Selectivity of cod-end mesh of pair-trawlers in the Yellow Sea. Fish. Sci. 36, 436–442. doi: 10.16378/j.cnki.1003-1111.2017.04.006
Yue, D., Wang, L., Xiong, S., Xiao, L., and Zhang, H. (2016). Improving the marine summer closed fishing season system: a case study of the practise of Zhejiang province and the East China Sea. Res. Agric. Mod. 37, 337–344. doi: 10.13872/j.1000-0275.2015.0190
Zhai, L., and Pauly, D. (2019). Yield-per-recruit, utility-per-recruit, and relative biomass of 21 exploited fish species in China’s coastal seas. Front. Mar. Sci. 6:724. doi: 10.3389/fmars.2019.00724
Zhang, C., Ye, Z., Wan, R., Ma, Q., and Li, Z. (2014). Investigating the population structure of small yellow croaker (Larimichthys polyactis) using internal and external features of otoliths. Fish. Res. 153, 41–47. doi: 10.1016/j.fishres.2013.12.012
Zhang, G., Li, X., Jin, X., Zhu, J., and Dai, F. (2010a). Growth, mortality and optimum catchable size of small yellow croaker (Larimichthys polyactis Bleeker) in the Southern Yellow Sea. J. Fish. Sci. China 17, 839–846.
Zhang, G., Li, X., Zhu, J., Dai, F., and Jin, X. (2010b). The growth characteristics of small yellow croaker Larimichthys polyactis (Bleeker, 1987) underyearling in the central and southern Yellow Sea. Prog. Fish. Sci. 31, 15–22.
Zhou, S., Punt, A. E., Lei, Y., Deng, R. A., and Hoyle, S. D. (2020). Identifying spawner biomass per-recruit reference points from life-history parameters. Fish. Fish. 21, 760–773. doi: 10.1111/faf.12459
Keywords: yield-per-recruit model, spawning stock biomass-per-recruit model, uncertainty, Bayesian inference, small yellow croaker
Citation: Zhu L, Ge C, Jiang Z, Liu C, Hou G and Liang Z (2021) Stock Assessment of Small Yellow Croaker (Larimichthys polyactis) Off the Coast of China Using Per-Recruit Analysis Based on Bayesian Inference. Front. Mar. Sci. 8:652293. doi: 10.3389/fmars.2021.652293
Received: 12 January 2021; Accepted: 08 November 2021;
Published: 30 November 2021.
Edited by:
Natalie Anne Dowling, Oceans and Atmosphere (CSIRO), AustraliaReviewed by:
Binbin Shan, Key Laboratory of South China Sea Fishery Resources Exploitation and Utilization, South China Sea Fisheries Research Institute (CAFS), ChinaCopyright © 2021 Zhu, Ge, Jiang, Liu, Hou and Liang. This is an open-access article distributed under the terms of the Creative Commons Attribution License (CC BY). The use, distribution or reproduction in other forums is permitted, provided the original author(s) and the copyright owner(s) are credited and that the original publication in this journal is cited, in accordance with accepted academic practice. No use, distribution or reproduction is permitted which does not comply with these terms.
*Correspondence: Zhenlin Liang, bGlhbmd6aGVubGluQHNkdS5lZHUuY24=
Disclaimer: All claims expressed in this article are solely those of the authors and do not necessarily represent those of their affiliated organizations, or those of the publisher, the editors and the reviewers. Any product that may be evaluated in this article or claim that may be made by its manufacturer is not guaranteed or endorsed by the publisher.
Research integrity at Frontiers
Learn more about the work of our research integrity team to safeguard the quality of each article we publish.