 Alexandra Coello-Camba
 Susana Agustí
- Red Sea Research Center, King Abdullah University of Science and Technology (KAUST), Thuwal, Saudi Arabia
Pico-sized Synechococcus, Prochlorococcus, and eukaryotes are the dominant photosynthetic organisms in the vast warm and oligotrophic regions of the ocean. In this paper, we aim to characterize the realized niches of the picophytoplanktonic community inhabiting the Red Sea, the warmest oligotrophic sea, which is considered to be a model for the future ocean. We quantify population abundances and environmental variables over several oceanographic surveys, and use stepwise regression, principal-component analysis (PCA), and compositional-data analysis to identify the realized niches of the three picophytoplanktonic groups. Water temperature varied from 21.4 to 32.4°C within the upper 200-m water column, with the warmest waters being found in the South, where nutrients increased. Synechococcus dominated the biomass, contributing 47.6% to the total picophytoplankton biomass, followed by picoeukaryotes (26.4%) and Prochlorococcus (25.9%), whose proportions contrast significantly with those reported in the subtropical ocean, where Prochlorococcus prevails. There were positive and significant relationships between temperature and the three populations, although these were weak for Prochlorococcus (R2 = 0.08) and stronger and steeper for Synechococcus (R2 = 0.57). The three populations centered their maximum abundances (Lorentzian fits) at similar low nutrient values. Synechococcus were centered close to the surface at ≈77% of surface photosynthetically active radiation (PAR) and ≈30.6°C. The picoeukaryotes were centered at lower light (≈6.4% surface PAR) and warm waters (≈30°C). Prochlorococcus was segregated from the surface waters and centered deep at low light (≈3.2% surface PAR). Light and temperature were the most influential factors determining the community composition, with Synechococcus dominating ∼74% of the picophytoplankton biovolume in the warmest (>30°C) waters. In the warm and mesotrophic southern Red Sea, the moderate abundances of picoeukaryotes and Synechococcus suggest increasing competition with nano and microphytoplankton. Our observations agree with predictions of increasing vertical segregation of picophytoplankton communities with future warming and reveal Synechococcus’s significant capacity to adapt to warming.
Introduction
Picophytoplankton comprises the smallest phytoplanktonic group (0.2–2 μm in size) and includes the populations of oceanic Prochlorococcus and Synechococcus picocyanobacteria, as well as a group of picoeukaryotes (Stockner, 1988; Raven, 1998; Partensky et al., 1999). Picophytoplankton contribution to photosynthetic biomass and production increase with decreasing total phytoplankton biomass and production (Agawin et al., 2000), dominating phytoplankton communities in the warm and oligotrophic areas (Chisholm, 1992; Partensky et al., 1999; Agawin et al., 2000) that account for >70% of the ocean’s surface.
The genetic, molecular and physiological differences between organisms determine their fundamental niches, defined as the range of environmental conditions under which they are technically capable of living (Hutchinson, 1957). However, it is the realized niche (which is a subset of the fundamental niche) that describes the range of environmental conditions under which species actually live by considering the effects of different ecological interactions such as interspecific competition or predation. For Synechococcus, Prochlorococcus, and some picoeukaryotes, there is genetic and physiological evidence to outline their fundamental niches, as indicated by strong differences in their nutrient requirements (Moore et al., 2002; Bertilsson et al., 2003; Heldal et al., 2003; Zubkov et al., 2003), tolerance to light and ultraviolet radiation (Moore et al., 1995; Llabrés and Agustí, 2006), and thermal performances (Moore et al., 1995; Agawin et al., 1998; Chen et al., 2014). The realized niches for picophytoplankton vs. other taxonomical or functional types of phytoplankton in the ocean have been examined in several studies (Irwin et al., 2012; Brun et al., 2015). Other studies analyzed the niche partitioning of the three picophytoplankton populations (i.e., Synechococcus, Prochlorococcus, and picoeukaryotes) in both oceans and lakes (Winder, 2009; Bouman et al., 2011; Flombaum et al., 2020). In situ temperature, light, nutrients, and water-column mixing have been identified as significant influences upon picophytoplankton niche partitioning (Ferris and Palenik, 1998; Agustí, 2004; Bouman et al., 2011; Pittera et al., 2014).
At present, one of the major environmental drivers stressing organisms and ecosystems is climate change (e.g., Doney et al., 2002; Bijma et al., 2013; Bindoff et al., 2019). Ocean warming is inducing rapid changes in ecosystems (Burrows et al., 2011), and marine organisms are responding by varying their distributions, biomass, and phenology (Edwards and Richardson, 2004; Gregory et al., 2009; Boyce et al., 2010; Hoegh-Guldberg and Bruno, 2010). Phytoplankton is responding to climate change faster than other primary producers, with shifts described in both their distribution and phenology (Poloczanska et al., 2013). Organisms from polar and tropical areas are the most affected by climate change (Tittensor et al., 2010; Wassmann et al., 2011; Thomas et al., 2012). The increase in seawater temperature in the tropical ocean will represent a new niche for the existing species that will need to accommodate such temperatures at their upper thermal limits, as tropical strains show temperature optima close to or lower than the mean in situ temperature (Thomas et al., 2012). This will force poleward shifts in species’ thermal niches and can imply a decline in phytoplankton biomass and diversity, which strongly depends upon adaptation processes (Thomas et al., 2012; Bestion et al., 2020).
Recent studies have addressed predictions for the abundance or distribution of picophytoplankton in the future ocean (Morán et al., 2010; Flombaum et al., 2013; Agustí et al., 2019). However, such predictions require a global-change framework that explicitly considers the cascade of effects and feedbacks that affect the response of biota to warming (Acevedo-Trejos et al., 2014; Duarte, 2014; Agustí et al., 2019). This framework must include changes in many relevant ocean processes, in addition to the direct thermal effect upon the organisms themselves, and therefore challenges the use of present realized niches for future ocean predictions, especially if adaptation processes occur. The relatively unexplored Red Sea is considered to be a model for the future ocean due to its elevated water temperatures and strong environmental gradients (Berumen et al., 2019), and it can therefore provide key information to fill gaps in our knowledge.
The Red Sea is a semi-enclosed, subtropical sea that shows characteristically high seawater temperatures, reaching record values of >33°C at the surface (Chaidez et al., 2017), higher than the maximum seawater temperatures reported in most of the subtropical and tropical oligotrophic areas inhabited by picophytoplankton (Grob et al., 2007; Bouman et al., 2011; Agustí et al., 2019). It is also highly saline and highly deficient in major nutrients such as SiO4, PO4, and NO3 (Weikert, 1987). The Red Sea is also warming at a mean rate of 0.17 ± 0.07°C decade–1, higher than the global ocean rate, with the northern Red Sea warming at an even faster rate (0.40–0.45°C decade–1, Chaidez et al., 2017). Therefore, the Red Sea offers the opportunity to investigate potential acclimatization and realized adaptation to ocean warming, with a large number of studies addressing its coral reef habitats (Sawall and Al-Sofyani, 2015; Ziegler et al., 2019) and symbionts responses (Hume et al., 2016). It also constitutes a unique opportunity to identify adaptation mechanisms, and physiological and molecular responses to warming (Hume et al., 2016; Giomi et al., 2019; Anton et al., 2020a) including how the elevated temperature may affect biological processes and the interactions between organisms (Hume et al., 2016; Silva et al., 2018; Abdulrahman Ashy and Agustí, 2020; Anton et al., 2020b).
The goal of the present study is to characterize and model the realized niches of the Synechococcus, Prochlorococcus, and picoeukaryote populations inhabiting the Red Sea, the warmest of the oligotrophic seas. Characterizing the realized niches of picophytoplankton in this ecosystem can serve as a gauge for projecting ocean niches in the warming oligotrophic ocean. To do so, we measured picophytoplankton abundances and environmental parameters across their latitudinal and vertical range. To establish the relationships among picophytoplankton and the environment, we analyzed the univariate correlations between cell abundances and environmental parameters, ran a multivariate analysis to define the realized niches of the different picophytoplankton groups, and compared our results with previous studies in oligotrophic waters. We also modeled the realized niches obtained for picophytoplankton in the Red Sea by applying a stepwise statistical method and by compositional-data analysis in three dimensions using barycentric plotting.
Materials and Methods
Sampling and Biogeochemical Measurements
The hydrography of the Red Sea is dominated by a deep-water current which flows continuously southward out of the main basin through the Strait of Bab al-Mandab, while the surface current is wind-driven and varies seasonally (Manasrah et al., 2019). A seasonal cycle of stratification in spring has been observed, with the maintenance of a shallow thermocline in summer, and a subsequent deepening of the thermocline in winter (Manasrah et al., 2019). Chlorophyll a in the Red Sea also follows a distinct seasonality with maximum concentrations during winter and minimum concentrations during summer (Raitsos et al., 2013).
A total of 29 stations were studied during five different cruises on the Red Sea on board the RV Thuwal (Threats, Dust, and CCF-1 cruises) and RV Al-Azizi (CCF-2 and CCF-3) between October 2016 and March 2018 (Table 1 and Figure 1). At each station, we collected seawater samples using an Idronaut or Sea-Bird CTD-rosette system (depending on the vessel) provided with 12–24 10-L Niskin bottles. We performed sampling at several depths (from 4 to 11 depths per station) between the surface (3–5 m) and 200 m, measuring in situ temperature and salinity. The integrated photosynthetically active radiation (PAR) between 400 and 700 nm was recorded with a PAR sensor installed in a BIC Compact radiometer (Biospherical Instruments, San Diego, CA, United States) or a PUV-2500 Profiling UV Radiometer (Biospherical Instruments, San Diego, CA, United States) deployed at each station at solar noon, thereby avoiding shading from the vessel. The diffuse attenuation coefficient (Kd) was estimated as the slope of the linear regression of the natural logarithm of the instantaneous down-welling irradiance (μmol m–2 s–1) vs. depth (m), as described by Overmans and Agustí (2019). The percentage of incident PAR (%PAR) at each specific depth used in this study was estimated from the Kd values measured at each station.
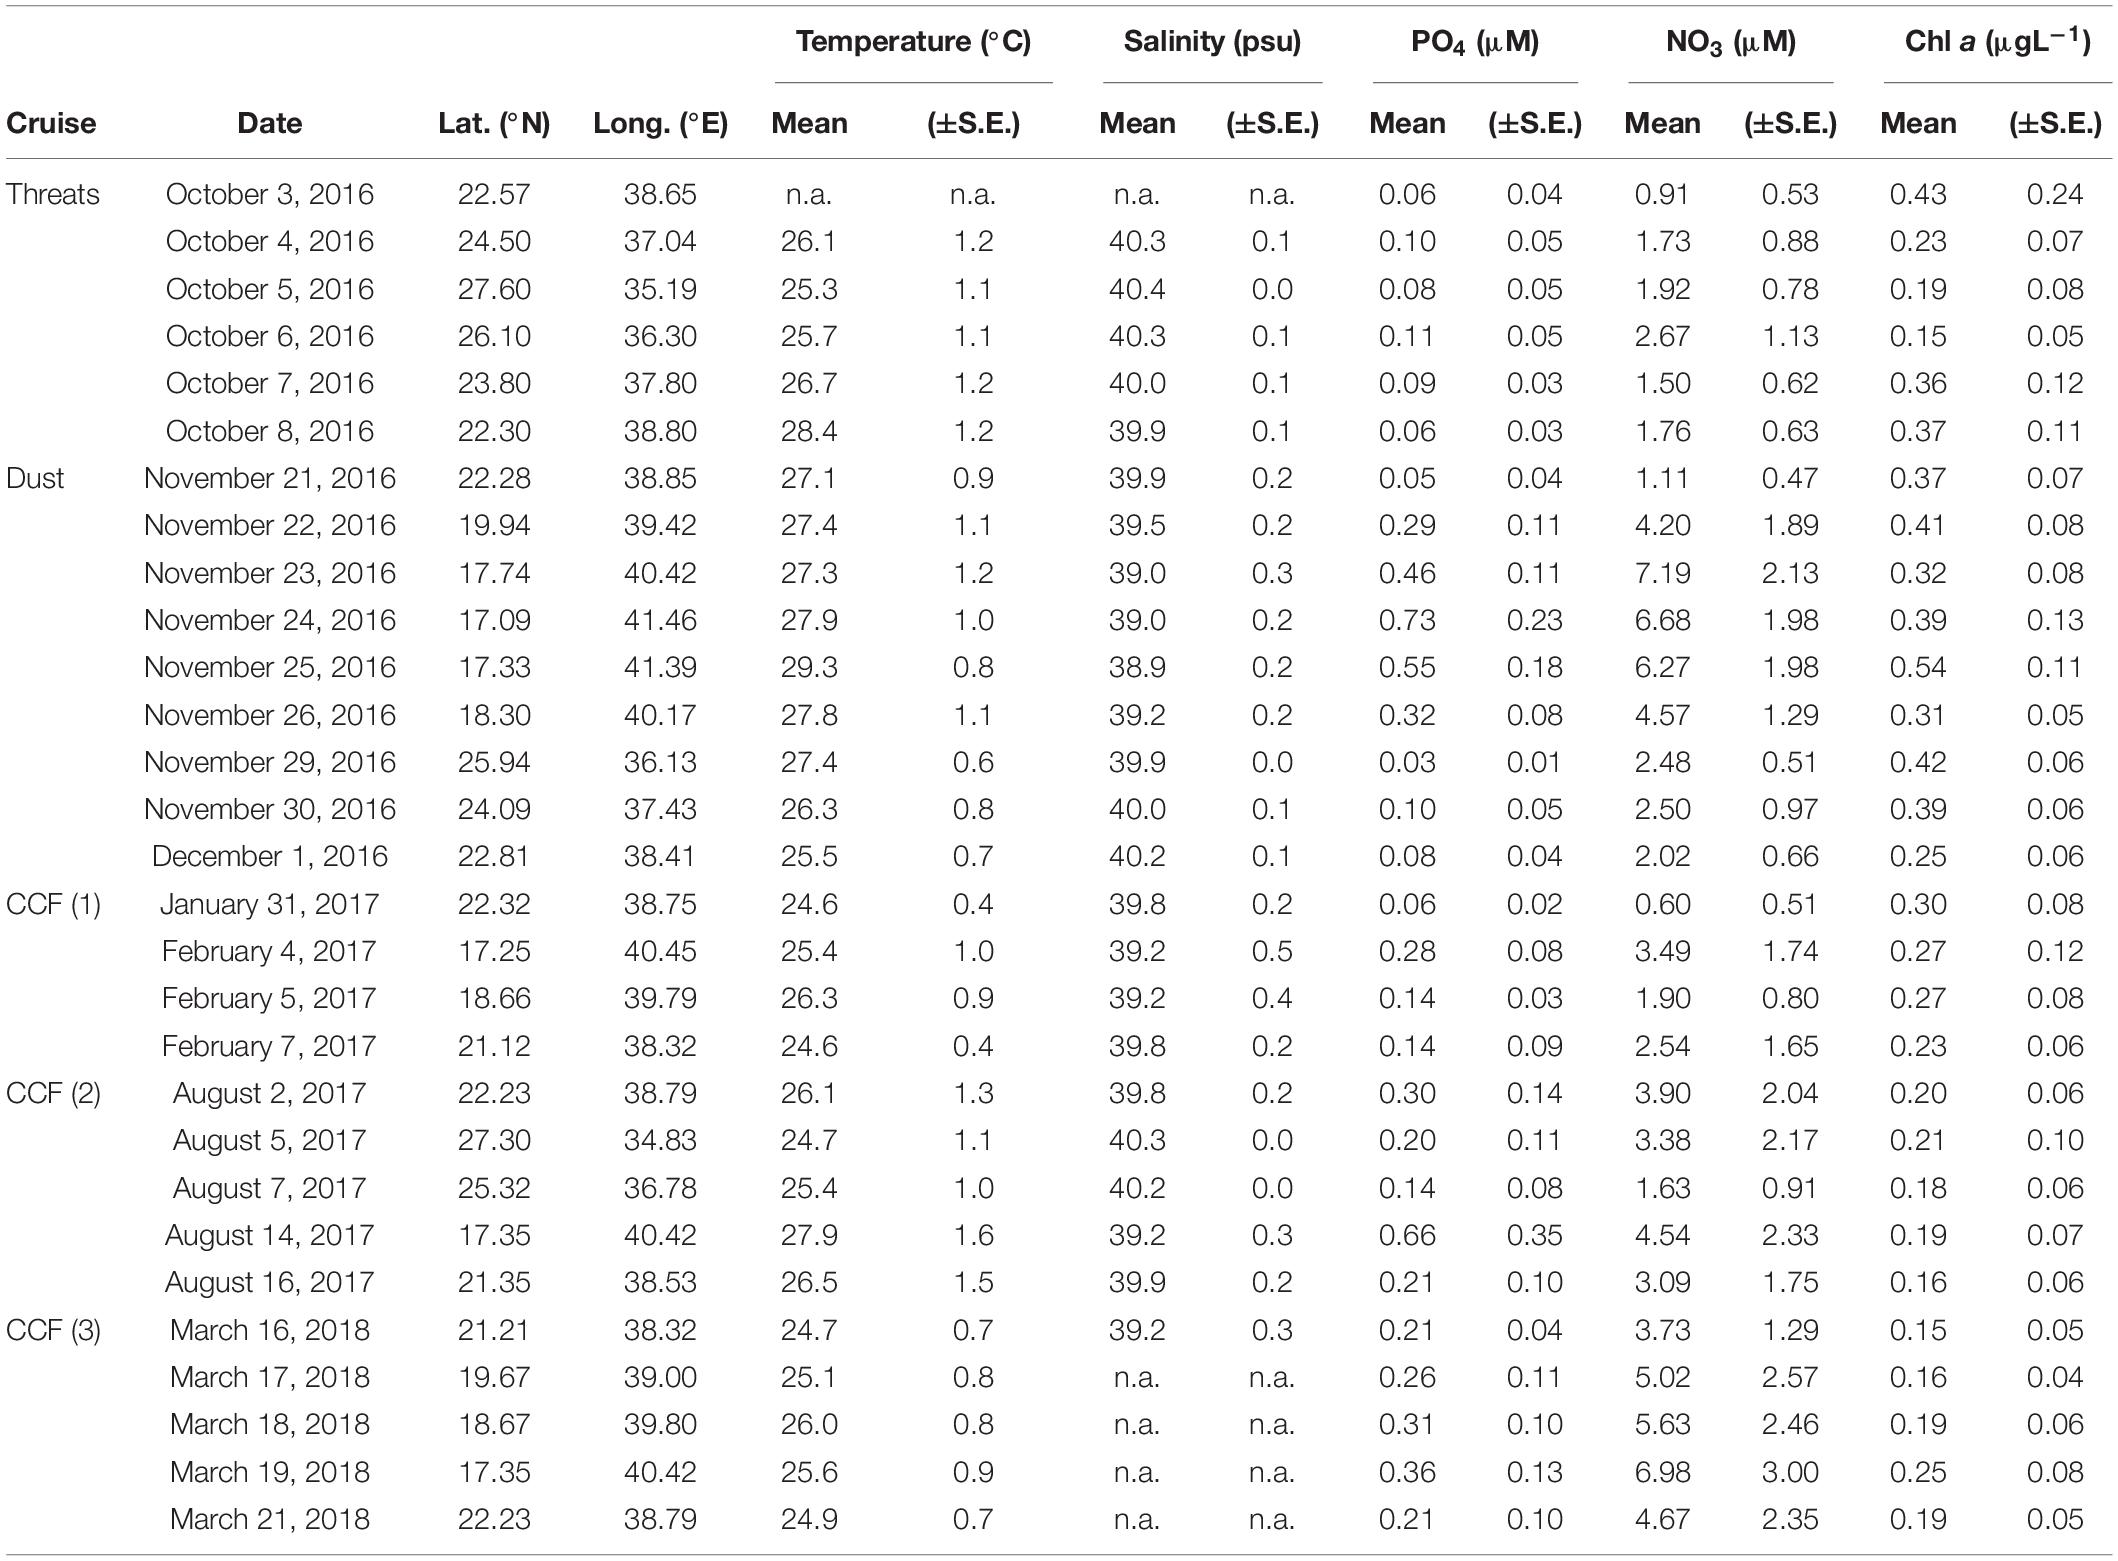
Table 1. Cruise name, sampling dates, and coordinates of the sites analyzed during this study, together with the water-column average values (±standard errors) for temperature, salinity, nutrients, and chlorophyll a concentration measured at each site.
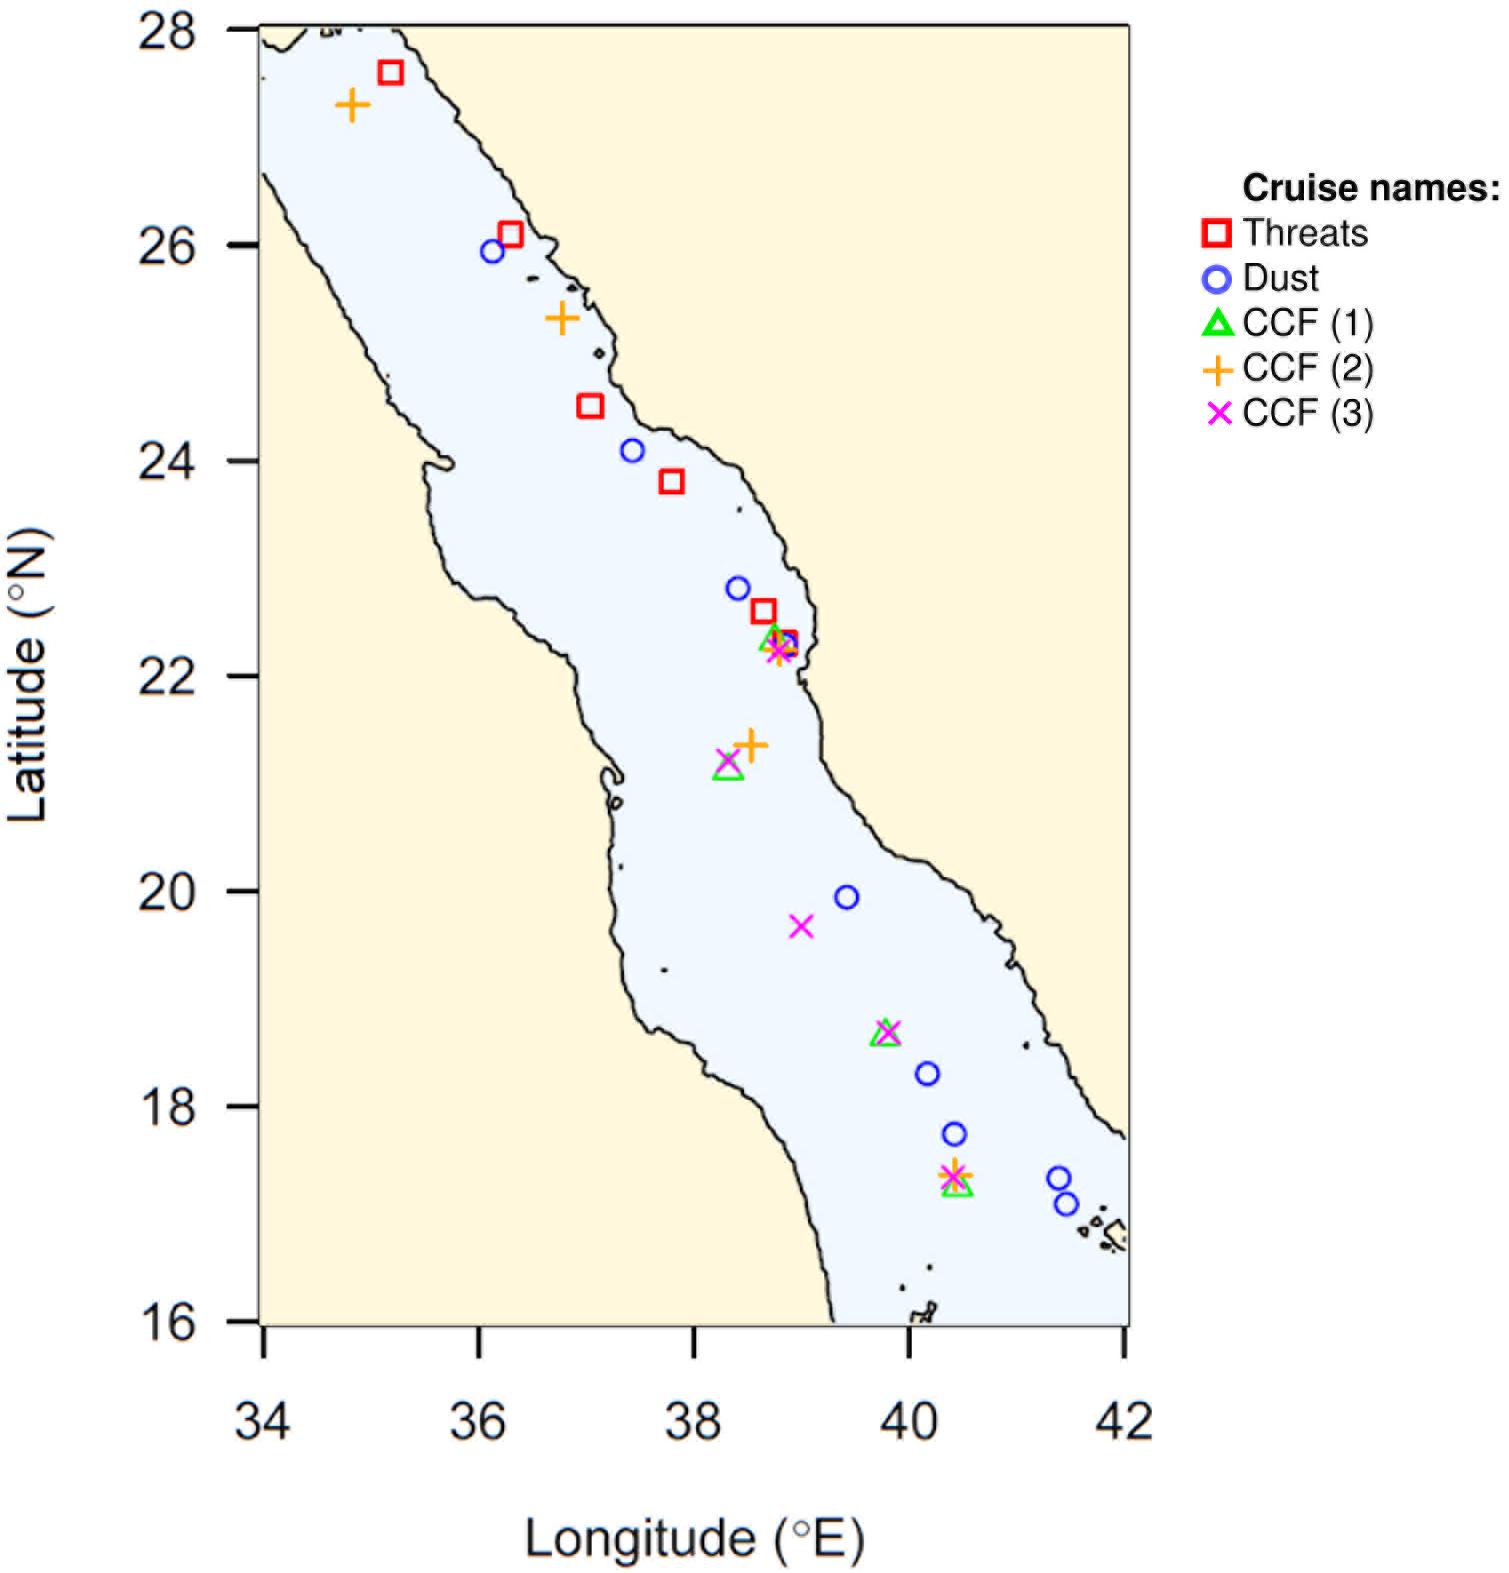
Figure 1. Map showing the distribution of the sampling sites along the Red Sea basin. The different cruises are indicated by their correspondent symbols.
At each sampling location and depth, we filtered 300-mL samples into Whatman GF/F filters to measure chlorophyll a (Chl a) concentrations following the fluorometric method described by Parsons et al. (1984). We added 7 mL of 90% acetone solution to each filter and kept them refrigerated in the dark for 24 h to extract the pigment. After incubation, we performed sensitive chlorophyll a measurements by considering its specific fluorescence excitation and emission wavelengths using a calibrated Trilogy Laboratory Fluorometer (Turner Designs, Inc.).
To count the cells of picoeukaryotes and cyanobacteria, we collected approximately 1 mL of seawater at each depth. The samples were analyzed fresh immediately after sampling. We identified and determined cell abundances running between 100 and 200 μL of sample on a CyFlow® space (Sysmex Co.) flow cytometer. The CyFlow® space is a high-performance multi-laser flow cytometer equipped with a 200 mW blue laser beam (488 nm) and complemented with a CyFlow® autoloading station to facilitate sample loading and processing. The Flow cytometry techniques are particularly helpful in the study of phytoplankton based on the different cell sizes and fluorescent properties that the photosynthetic pigments confer upon these organisms (Veldhuis and Kraay, 1993). The three groups targeted here are photosynthetic and present chlorophyll a, which produces red fluorescence. Within both cyanobacteria groups, only Synechococcus contains accessory pigments besides chlorophyll a, including the phycobiliprotein phycoerythrin, which emits orange fluorescence. Picoeukaryotes produce higher scattering and red fluorescence signals due to their higher size with respect to cyanobacteria. Thus, the different light-harvesting pigments and sizes of Synechococcus, Prochlorococcus, and picoeukaryotes (Supplementary Figure 1) result in distinctive combinations of orange (FL2, 590 ± 50 nm) and red (FL3, 675 ± 20 nm) fluorescence and side-scattering (SSC) signals, allowing their identification and quantification (e.g., Crosbie and Furnas, 2001).
To measure nutrient concentrations (NO3 and PO4), we collected approximately 15 mL of seawater and kept them frozen until analyzed on land using a Segmented Flow Analyzer (SEAL Analytical) following standard autoanalyzer techniques (Hansen and Koroleff, 1999).
Statistical Analysis
We represented the cellular abundances of each group by depth and latitude using contour plots in R (version 3.4.3, reshape2 and stringr packages). To define the individual effect that the specific set of values of each environmental variable measured on site has on the organisms studied we analyzed the univariate relationships between the environmental variables measured (including temperature, salinity, chlorophyll a, %PAR, phosphate and nitrate concentrations, and cellular abundances) for Synechococcus, Prochlorococcus, and picoeukaryote populations. To do so, we performed regression analysis using GraphPad Prism® 7.0a. We applied linear and Lorentzian regressions and selected the best fit based on the lowest AICc index. The Lorentzian fit equation was given as
where y is the cellular abundance in log10, x is an environmental variable in log10 (except for temperature and salinity), amplitude is the height of the center of the distribution in y units, center is the x value at the center of the distribution (where the highest cell abundances are found), and width is a measure of the breadth of the distribution (full width at half maximum) in the same units as x.
In order to assess the relationships between cell abundances and the set of environmental variables that characterize their environment we followed different multivariate methods. We applied a principal-component analysis (PCA) considering cellular abundances, depth, latitude, and environmental parameters (temperature, salinity, %PAR, chlorophyll a, nitrate, and phosphate) using JMP® Pro 12.1.0. This exploratory method allowed us to determine the set of linear combinations that explain most of the variance in cellular abundances and therefore illustrate the realized niches for each group. The cellular abundances and environmental parameters other than temperature and salinity were log-transformed prior to analysis.
We also modeled the realized niches for each of the three picophytoplankton groups based on the relationships among environmental parameters and cellular abundances using general Stepwise Regression on JMP®. Of the candidate models produced, we selected the best multivariate model by AICc with forward selection.
The abundances of the three groups in each of the different samples were converted to biovolume by assuming spherical cell shapes with diameters 0.6 μm for Prochlorococcus, 0.9 μm for Synechococcus, and 1.4 μm for picoeukaryotes (as defined in Raven, 1998). These were expressed as proportions of the total picophytoplankton community biovolume, and represented by compositional-data analysis on a ternary plot created in R (Ternary package) to illustrate three-dimensional cohabitation between the three groups.
Results
Environmental Variability and Picophytoplankton Community
We covered a latitudinal transect from 17.09°N (North Farasan Islands) to 27.60°N (Duba) (Figure 1 and Table 1), sampling a total of 29 open-ocean stations. Seawater temperatures varied between 21.4 and 32.4°C, reaching maximum values at the superficial waters in the southernmost latitudes toward the end of summer-fall (Figure 2A). Salinity was high overall, ranging from 37.6 to 40.6 psu, with the lowest values found at depths of less than 100 m in southern stations at all the seasons sampled (including end of summer, fall and winter) (Figure 2B). The Chl a concentration, representing the total phytoplankton biomass, was low, averaging 0.28 (S.E. = ±0.02) μg L–1, and remaining below 1 μg L–1 except in two samples collected at deep chlorophyll maximum (DCM) depths in October, where the Chl a concentration reached 1.16 μg L–1 (Figure 2C).
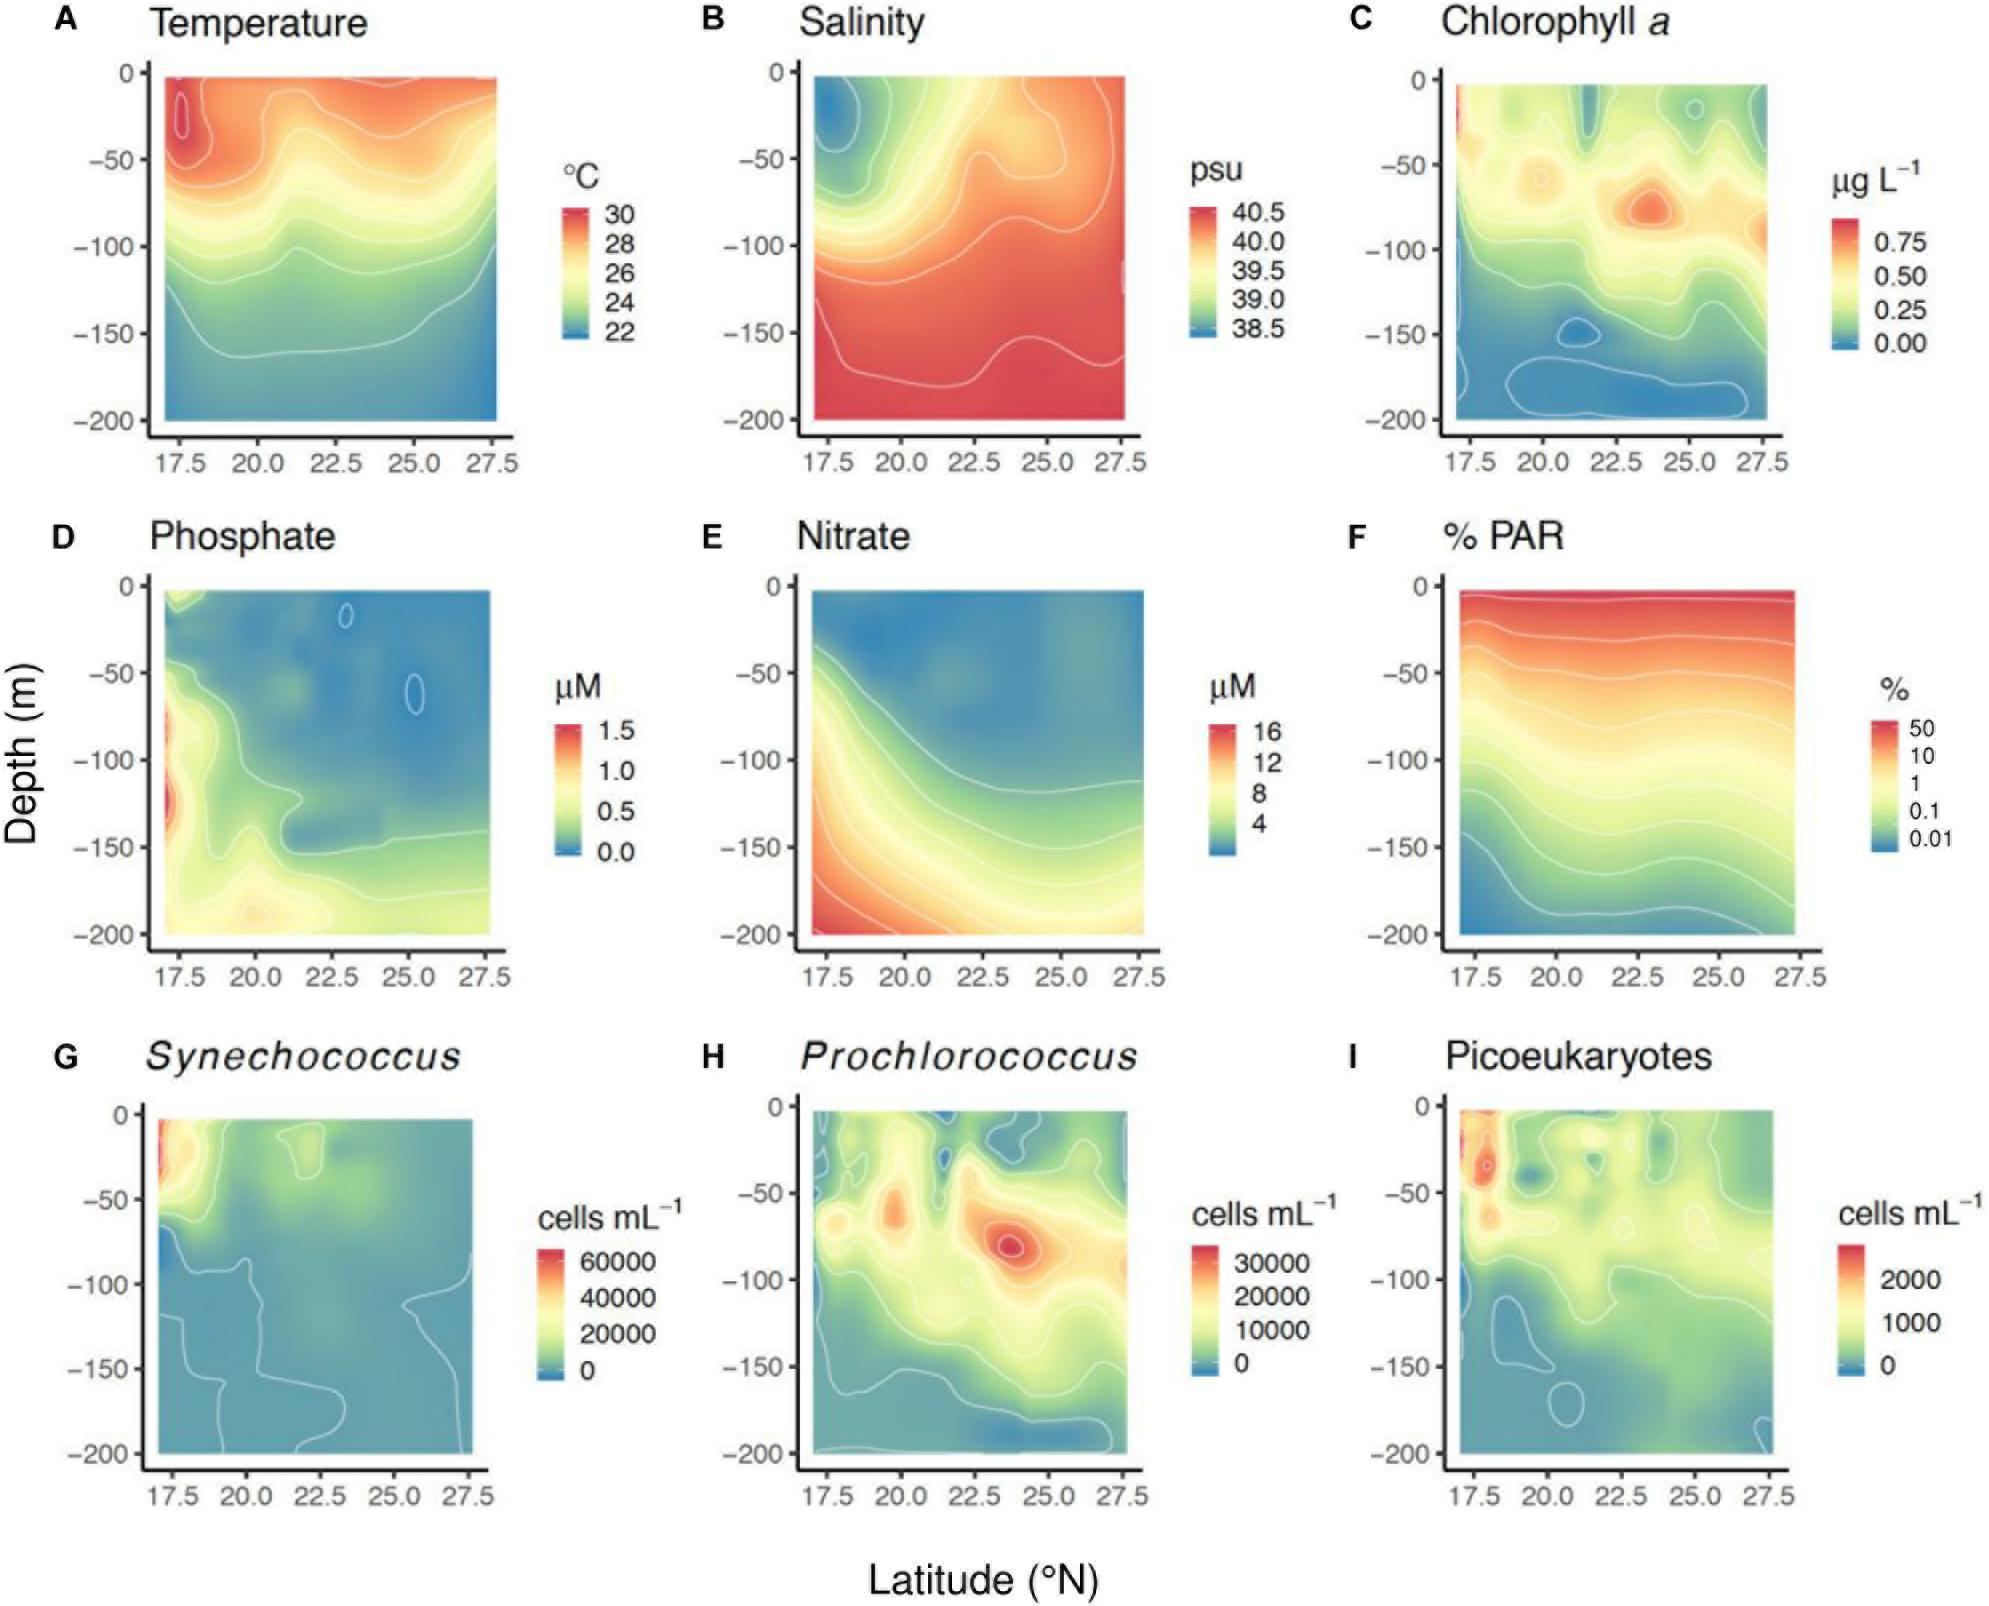
Figure 2. Contour plots showing the distribution with depth and latitude of (A) seawater temperature (°C), (B) salinity (psu), (C) chlorophyll a (μg L–1), (D) phosphate concentration (μM), (E) nitrate concentration (μM), (F) %PAR, (G) cellular abundance of Synechococcus (cells mL–1), (H) cellular abundance of Prochlorococcus (cells mL–1), and (I) cellular abundance of picoeukaryotes (cells mL–1), as measured during the study. These plots were created fitting a two-dimensional loess model to the actual values measured at each station and depth.
The mean phosphate concentration was 0.24 ± 0.02 μM, with a median of 0.09 μM and an inter-quartile range from 0.04 to 0.25 μM (Figure 2D). Nitrate concentrations were low; the mean concentration measured was 3.52 ± 0.32 μM, with median 1.08 μM and an inter-quartile range from 0.47 to 4.73 μM (Figure 2E). The highest nutrient concentrations were measured toward the south, reaching maximal values of 21.7 μM for NO3 and 3 μM for PO4 at approximately 80-m depth (Figures 2D,E).
At the northernmost stations (>25°N), 50% of incident PAR reached an average depth (±S.E.) of 12.9 ± 0.6 m, 10% PAR reached 42.9 ± 1.9 m, 1% PAR reached 85.8 ± 3.8 m, and 0.1% PAR reached 128.6 ± 5.8 m (Figure 2F). Water transparency decreased toward the south, where 50% of the incident PAR reached 9.7 ± 1 m, 10% PAR reached 32.2 ± 3.3 m, 1% PAR reached 64.5 ± 6.5 m, and 0.1% PAR reached 96.8 ± 9.8 m (<19°N) (Figure 2F).
Picophytoplankton-cell abundances (±S.E.) averaged 8.2 ± 1.1 × 10³ cells mL–1 for Synechococcus, 6.7 ± 0.7 × 10³ cells mL–1 for Prochlorococcus, and 0.64 ± 0.05 × 10³ cells mL–1 for picoeukaryotes. The distributions of the three picophytoplankton groups showed different trends with latitude and depth (Figures 2G–I). Synechococcus was more abundant in the southernmost stations, while Prochlorococcus reached its highest concentrations at intermediate latitudes (Figures 2G,H). Moreover, Synechococcus predominated closer to the surface, while Prochlorococcus was more abundant below 40 m (Figures 2G,H). The vertical profiles of averaged cell abundances showed the mean Synechococcus abundances remaining high up to a depth of 50 m, at which point they sharply declined (Supplementary Figure 2). The maximum averaged Prochlorococcus concentrations were located at around 70 m depth (Supplementary Figure 2). The mean picoeukaryotes distribution showed two peaks, one at the surface (∼20 m) and other and at a depth of ∼70 m, similar to that found for Prochlorococcus (Supplementary Figure 2), reflecting the contrasting distributions of picoeukaryotes in the southern and northern stations where they were placed upward or downward, respectively, in the water column (Figure 2I).
There were significant negative relationships between seawater temperature and nutrient concentrations (p < 0.0001, Figure 3). The linear equations of these relationships were: log10 PO4 (μM) = 1.34–0.09. Temperature (°C) (R2 = 0.19, F ratio = 50.4) (Figure 3A) and log10 NO3 (μM) = 3.37–0.12. Temperature (°C) (R2 = 0.3, F ratio = 93.1) (Figure 3B). For phosphate, concentrations showed a smoother decline with temperature at the southernmost stations when compared to stations at higher latitudes (two-tailed p value = 0.005): at southern stations (17.09–18.67°N), the linear equation was log10 PO4 (μM) = 1.7–0.08. Temperature (°C) (R2 = 0.38, F ratio = 43.35), whereas at higher latitudes (19.67–27.6°N) log10 PO4 (μM) = 2.4–0.14. Temperature (°C) (R2 = 0.44, F ratio = 109.3) (Figure 3A). The decline of nitrate with temperature did not differ significantly between the southern and central-northern stations (Figure 3B).
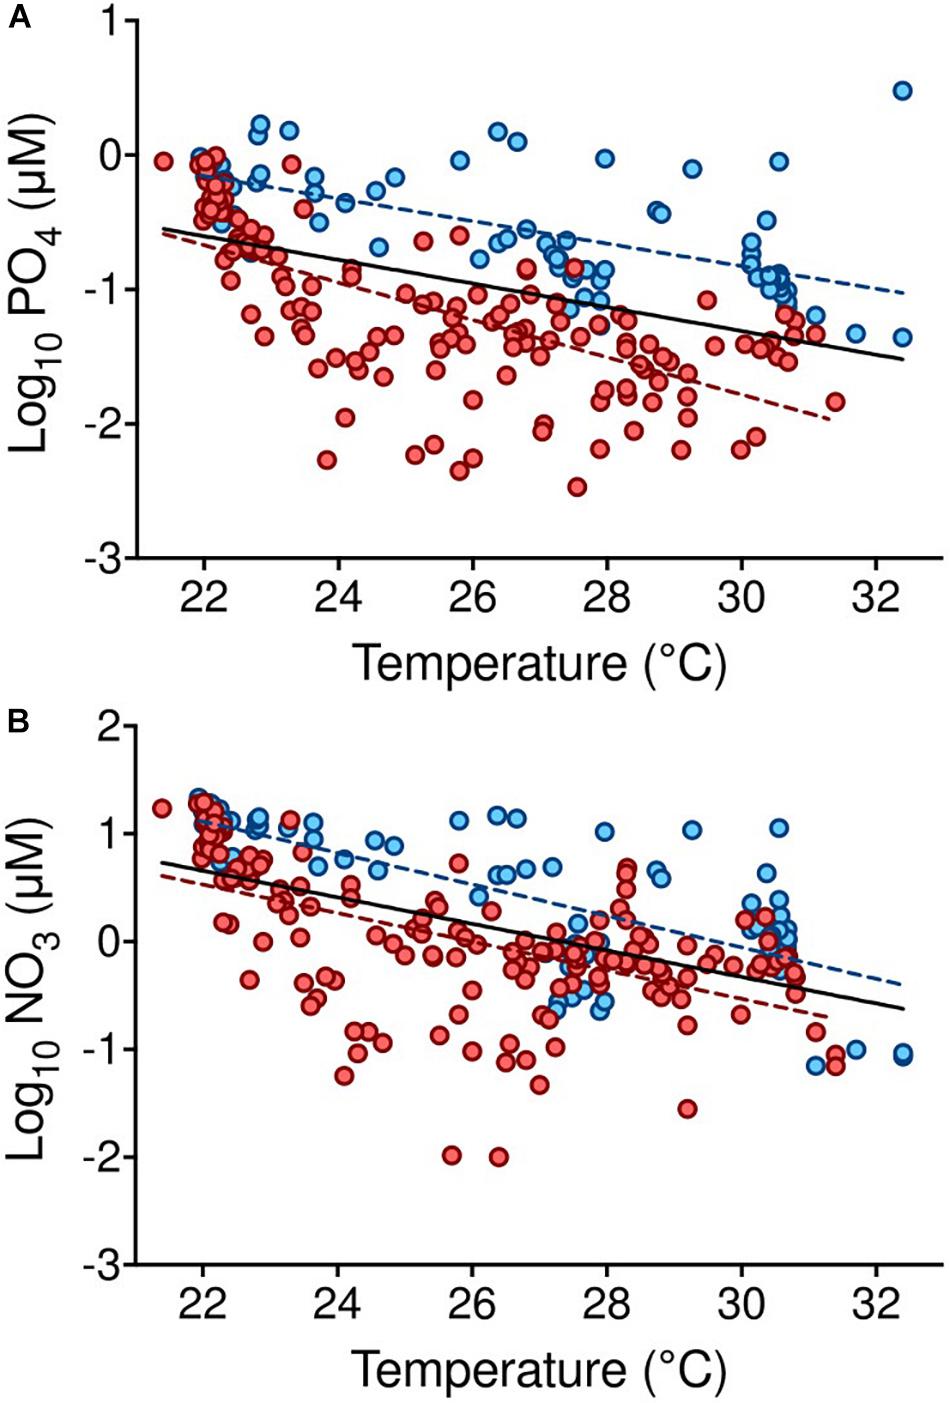
Figure 3. Relationship between nutrient concentrations and seawater temperature in the Red Sea. (A) Relationships between temperature (°C) and PO4 (μM) including all stations (black line, log10 PO4 (μM) = 1.34–0.09. Temperature (°C); R2 = 0.19, F ratio = 50.4, p < 0.0001), and considering the southern (<19°N, as defined in Kheireddine et al., 2017) (blue symbols and discontinuous line, log10 PO4 = 1.7–0.08. Temperature, R2 = 0.38, p < 0.0001) and northern (>19.1°N) (red symbols and discontinuous line, log10 PO4 = 2.4–0.14. Temperature, R2 = 0.44, p < 0.0001) areas separately; (B) relationship between temperature (°C) and NO3 (μM), including all stations (log10 NO3 (μM) = 3.37–0.12. Temperature, R2 = 0.3, F ratio = 93.1; p < 0.0001), with no significant relationship when considering the northern and southern areas separately. Colors and symbols as described for panel (A).
By applying regression techniques, we observed a decrease in Synechococcus abundances with increasing latitude (linear fit, Figure 4A and Table 2), a higher abundance of Prochlorococcus at intermediate latitudes, close to 23 ± 0.5°N (Lorentzian fit, Figure 4B and Table 2), and no significant trend for picoeukaryote abundance (Figure 4C and Table 2). The Lorentzian fits defined the maximum cellular abundances for Synechococcus at 6.7 ± 9.3 m depth, for Prochlorococcus at 59 ± 8.1 m, and for picoeukaryotes at 33.9 ± 10.4 m (Lorentzian fit, Figures 4D–F). This fit also suggested that the distributions of Synechococcus, Prochlorococcus, and picoeukaryotes have vertical widths ranging from the surface to depths of 64.5 ± 11.8 m, 150 ± 25 m, and 116 ± 23.8 m, respectively (Lorentzian fit, Figures 4D–F).
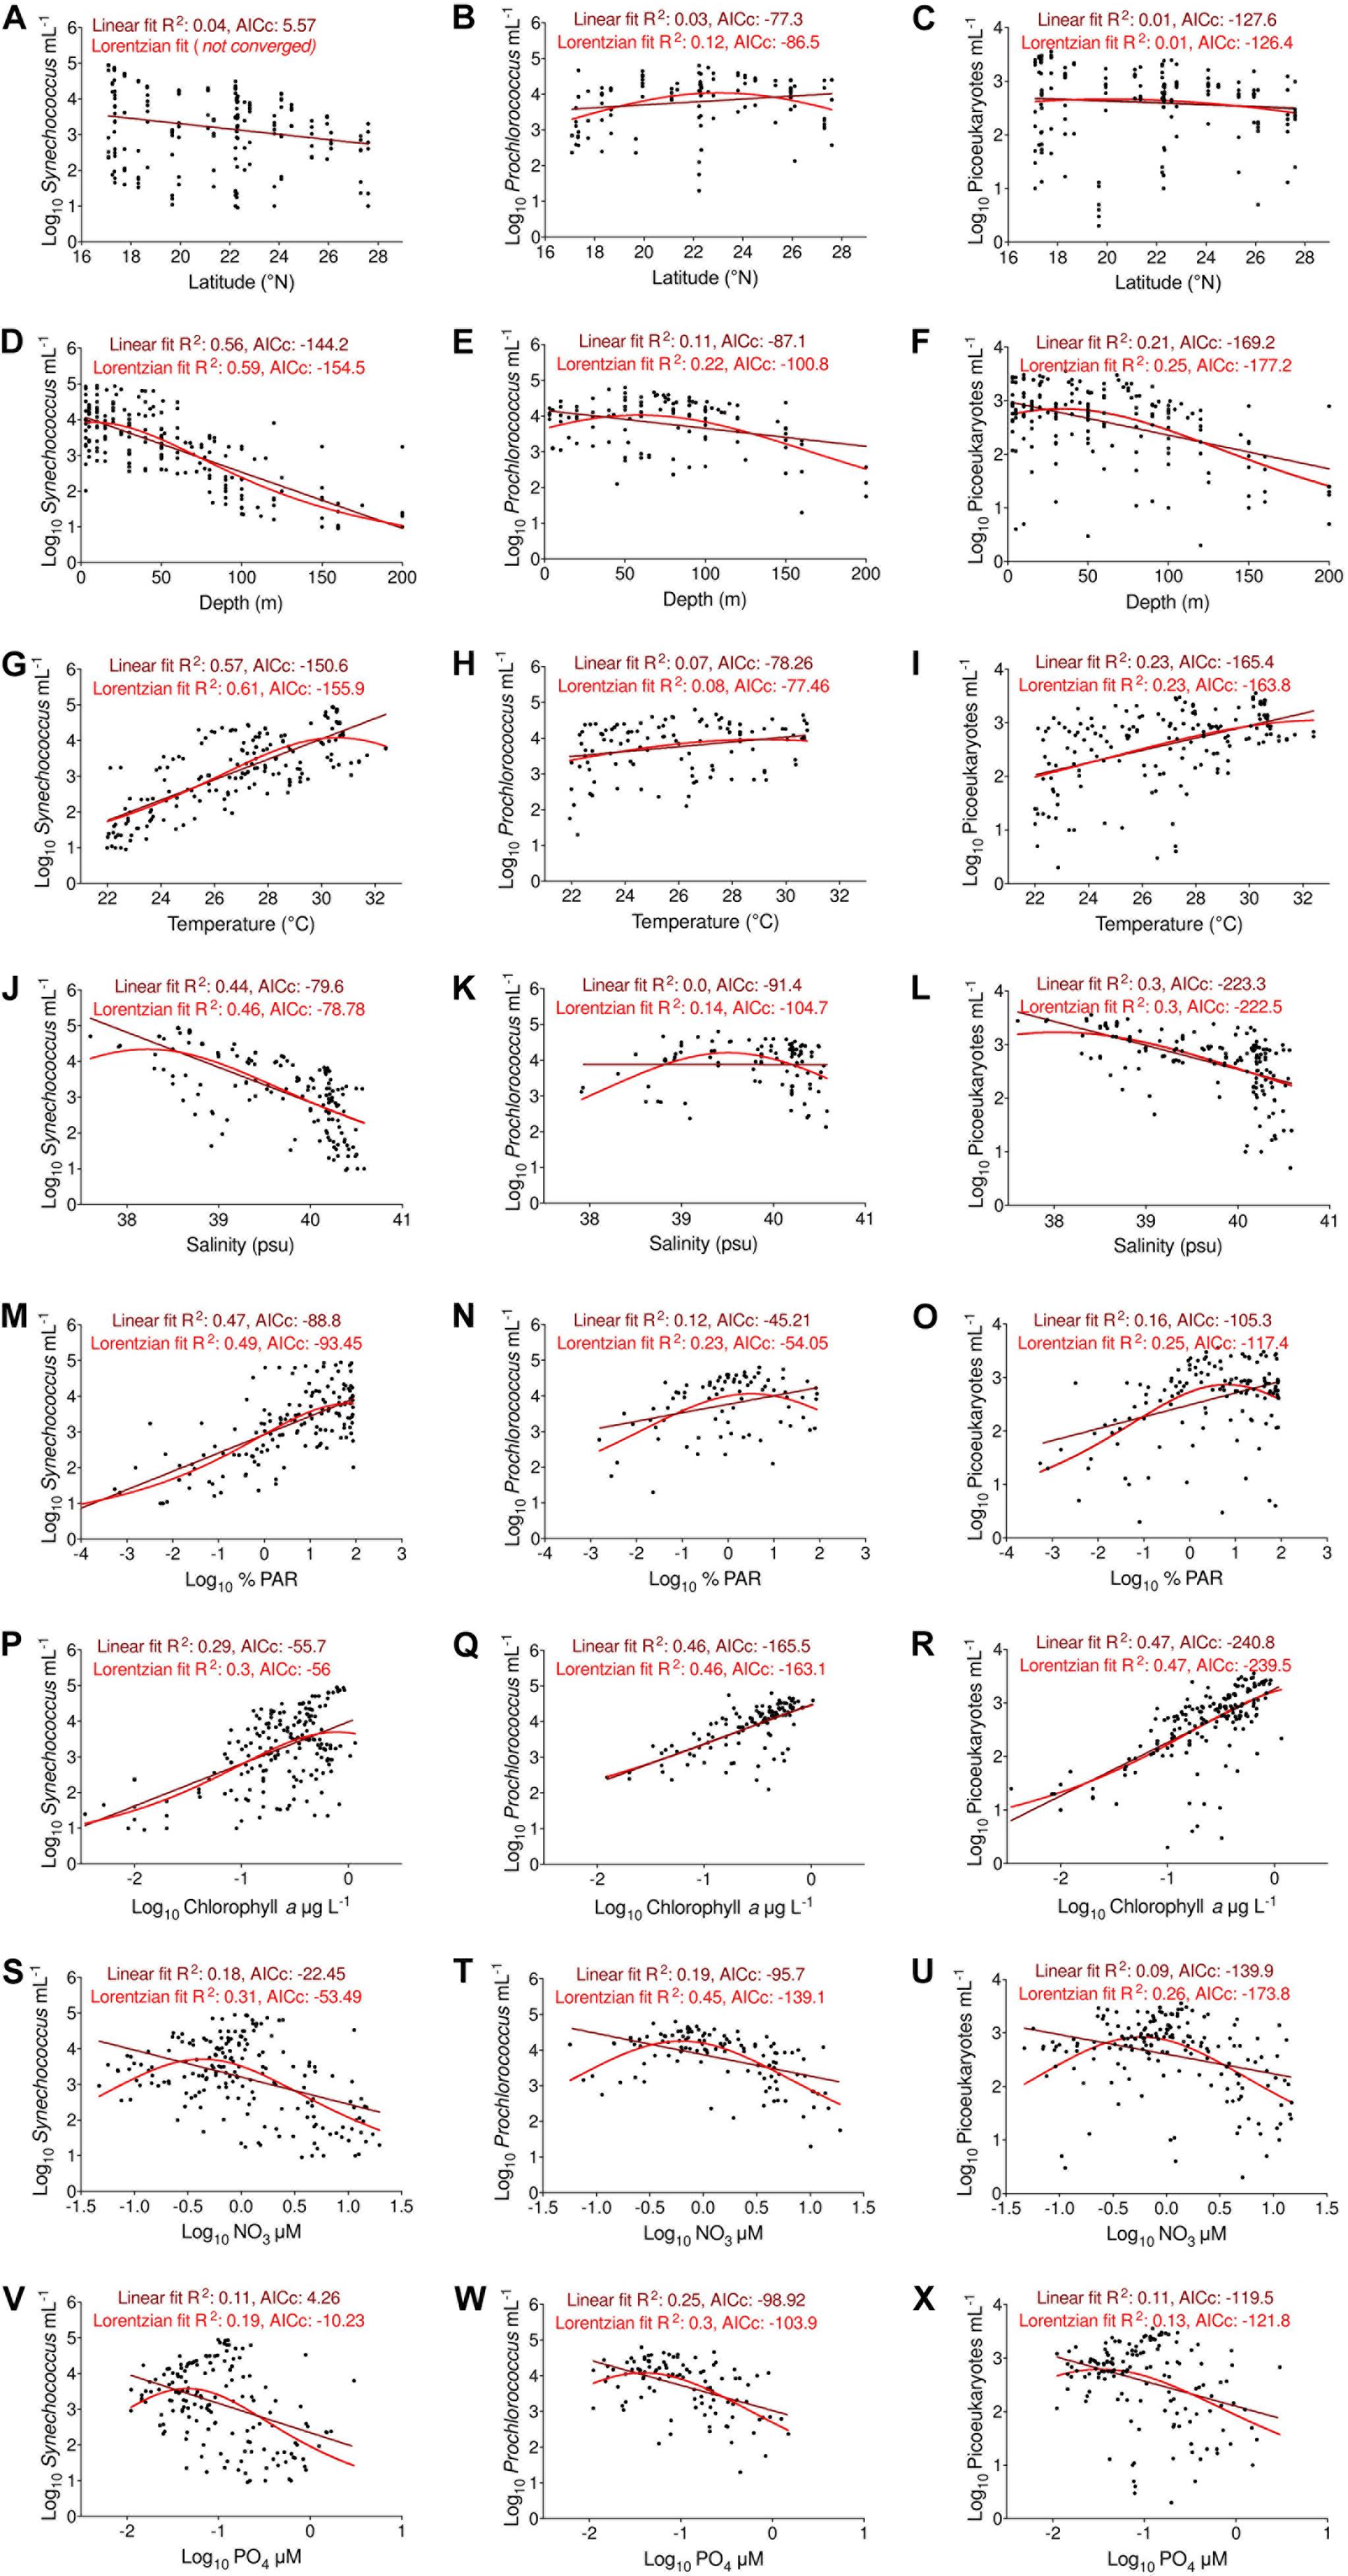
Figure 4. Relationships between the abundances of the three picophytoplankton groups under changes in (A–C) latitude, (D–F) depth, (G–I) temperature, (J–L) salinity, (M–O) %PAR, (P–R) chlorophyll a, (S–U) nitrate, and (V–X) phosphate concentrations in the Red Sea. Straight lines represent linear regression fits (brown) and Lorentzian curves (red). The R2 and AICc index for both fits are indicated at the top of each plot.
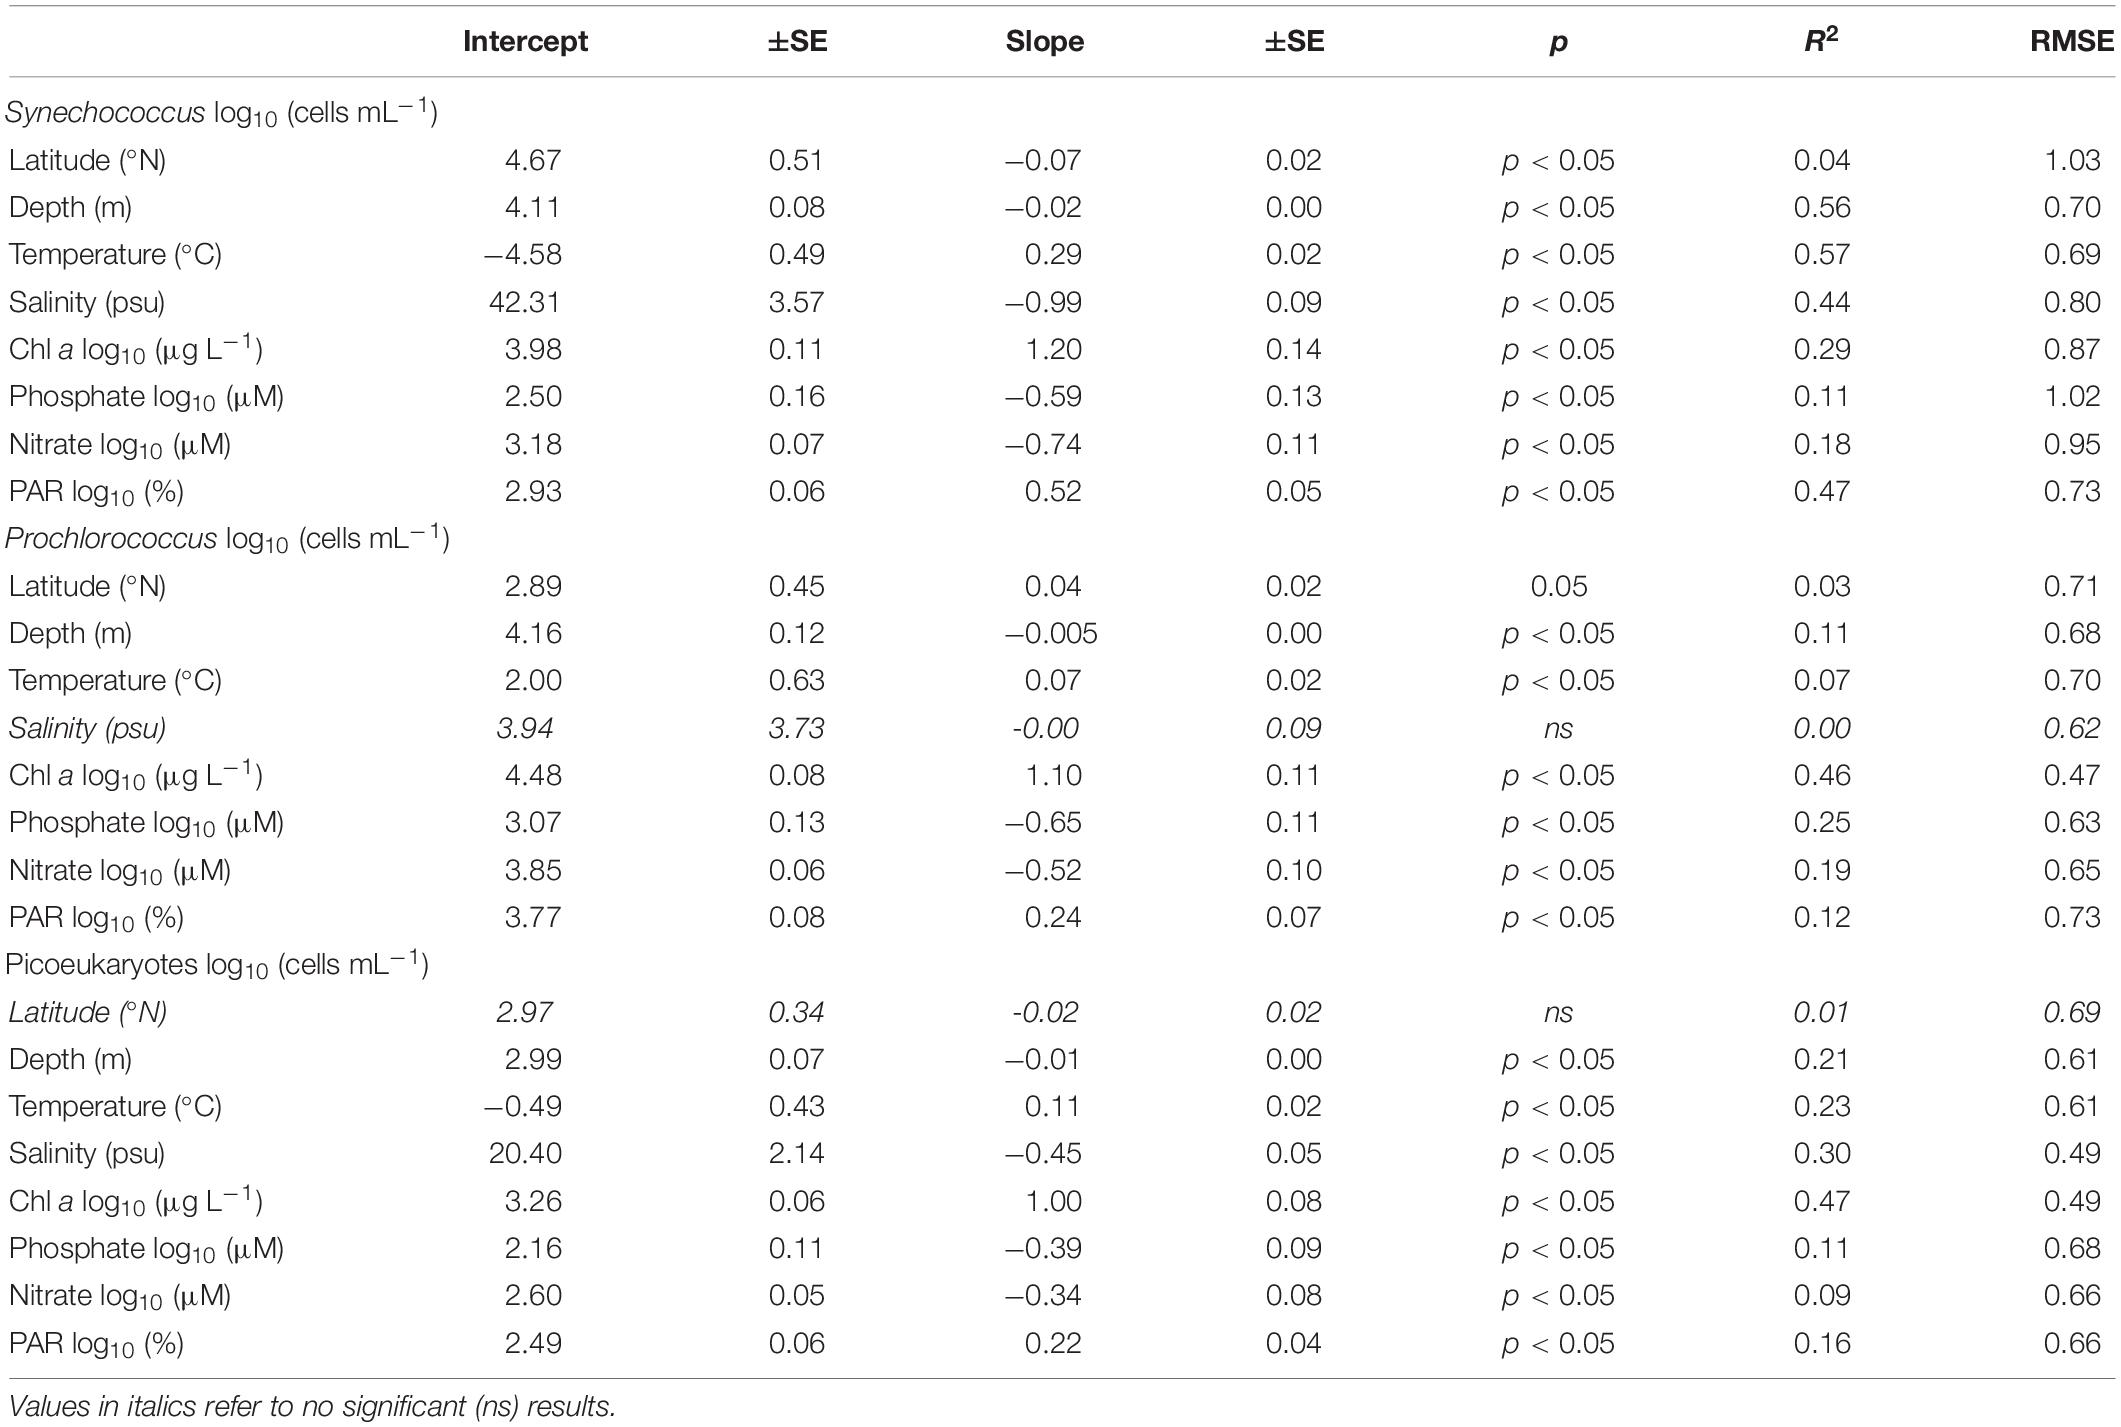
Table 2. Summary of the linear relationships between Synechococcus, Prochlorococcus, and picoeukaryote abundances (log10 cells mL–1) with latitude, depth, and the different environmental parameters measured in the Red Sea.
The cellular abundances of all groups showed an increasing trend with increasing temperature (Figures 4G–I and Table 2). Synechococcus showed the strongest relationship with temperature when the Lorentzian fit marked an optimal value of 30.6 ± 0.5°C, and the width of the response curve indicated a minimum of 26.9 ± 0.6°C (Figure 4G). For this group, the linear regression had a slope of 0.29 ± 0.02 (linear fit, R2 = 0.57, Figure 4G). The relationship between temperature and Prochlorococcus cellular abundances was significant but weak and led to a lower slope of 0.07 ± 0.02 (linear fit, R2 = 0.07, Figure 4H and Table 2). For this group, the Lorentzian curve marked a less clear maximum abundance centered at 29 ± 2.3°C (Lorentzian fit, Figure 4H). Picoeukaryotes showed maximum cellular abundances at around 30°C, increasing with temperature with a slope of 0.11 ± 0.02 (linear fit, R2 = 0.23, Figure 4I and Table 2). Synechococcus and picoeukaryotes decreased linearly with increasing salinity, with slopes of −0.99 ± 0.09 and −0.45 ± 0.05, respectively (linear fit, Figure 4J,L and Table 2). For Synechococcus, the maximum abundance was centered at a salinity value of 38.2 ± 0.29 psu and reached an upper value at 39.5 ± 0.3 psu; for picoeukaryotes, the center was defined at 38 ± 0.63 psu and the upper value at 39.9 ± 0.8 (Lorentzian fit, Figures 4J,L). For Prochlorococcus, the cellular abundances showed their highest values at approximately 39.5 ± 0.1 psu, with a fitted distribution width from 38.3 to 40.7 ± 0.3 psu (Lorentzian fit, Figure 4K). The three groups showed a positive correlation with the percentage of incident PAR, which was more intense for Synechococcus (Figures 4M–O and Table 2). For Synechococcus, higher cellular abundances were found at 77 ± 16% PAR (Lorentzian fit, Figure 4M). Picoeukaryotes and Prochlorococcus distributions were centered at 6.4 ± 5.5% PAR and 3.2 ± 5.2% PAR, respectively (Lorentzian fit, Figures 4N,O). The width of the Lorentzian curve indicated that three groups could be found at the highest %PAR measured here, but the lowest %PAR values at which each group occurred differed, being 0.11 ± 0.06 %PAR for picoeukaryotes, 0.03 ± 0.02 %PAR for Prochlorococcus, and 1.4 ± 0.87 %PAR for Synechococcus (Lorentzian fit, Figures 4M–O). We also observed a positive correlation with chlorophyll a concentration for the three groups, producing slopes of 1.2 ± 0.13 for Synechococcus, 1.1 ± 0.11 for Prochlorococcus, and 1.0 ± 0.08 for picoeukaryotes (linear fit, Figures 4P–R and Table 2). The cellular abundances of the three groups showed a decreasing trend under increased nutrient concentrations (Figure 4 and Table 2). Following the Lorentzian fits, the highest cellular abundances corresponded to the average NO3 concentrations (±S.E.) of 0.42 ± 0.08, 0.6 ± 0.09, and 0.56 ± 0.09 μM for Synechococcus, Prochlorococcus, and picoeukaryotes, respectively; however, these were not significantly different (F test, p > 0.05) (Lorentzian fit, Figures 4S–U). The curve widths for NO3 included concentrations from 0.07 ± 0.01 to 2.54 ± 0.41 μM for Synechococcus, 0.08 ± 0.01 to 4.75 ± 0.79 μM for Prochlorococcus, and 0.08 ± 0.02 to 3.96 ± 0.62 μM for picoeukaryotes (Lorentzian fit, Figures 4S–U). For PO4, the optimal concentrations for the three groups were similar (F test, p > 0.05), varying between 0.02 and 0.03 ± 0.01 μM (Lorentzian fit, Figures 4V–X). The curve widths for PO4 for the three groups ranged from concentrations below detection limits, up to 0.24 ± 0.03 μM for Synechococcus, 0.34 ± 0.02 μM for Prochlorococcus, and 0.39 ± 0.00 μM for picoeukaryotes (Lorentzian fit, Figures 4V–X).
Niche Partitioning
Our PCA analysis helped to identify environmental links among the three groups (Figure 5). The first two components explained 73.1% of the overall variability (Figure 5). The principal component 1 (53.5% of the variability) showed a positive correlation of the three picophytoplankton populations, together with temperature, %PAR, and chlorophyll a concentration, as well as a negative correlation with depth, nutrients, and salinity (Figure 5 and Table 3). The principal component 2 (19.6% of the variability) was positively correlated with latitude and salinity, negatively correlated with phosphate, and slightly correlated with nitrate, separating Prochlorococcus (positive) from Synechococcus (negative). The principal component 1 also indicated that nutrients and temperature had opposite effects upon the picophytoplankton populations. We explored the joint effects of nitrate and temperature upon the picophytoplankton-cell distribution using contour plots (Supplementary Figure 3). Under low temperatures (<26°C) and high nutrient concentrations, the abundance of Synechococcus cells was lowest, although Prochlorococcus followed by picoeukaryotes showed high values. The distribution was inverted at the highest temperatures >30°C, where Synechococcus and picoeukaryotes abundances increased at a wider range of nutrient concentrations, including the maximum abundances observed at the highest nutrient values (Supplementary Figures 3A,C), where Prochlorococcus was almost absent, reaching higher abundances at intermediate nitrate concentrations (Supplementary Figure 3B).
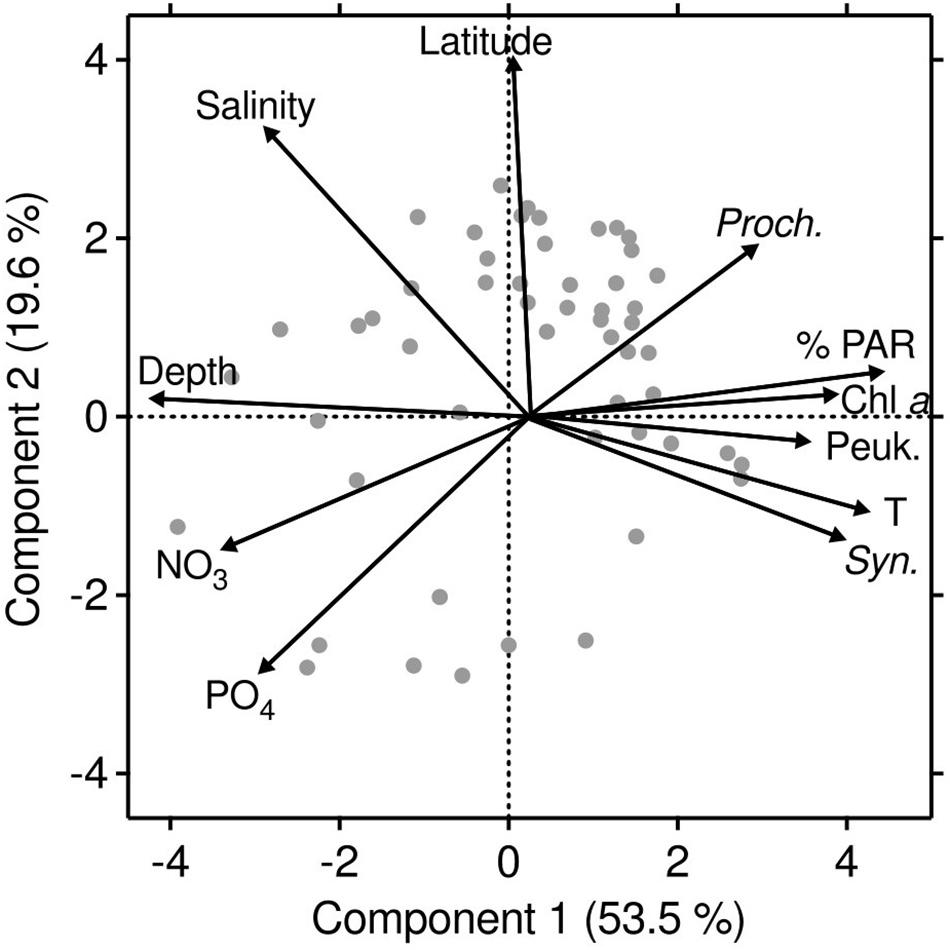
Figure 5. Principal-component analysis (PCA) of the first two components, summarizing the distribution of Synechococcus, Prochlorococcus, and picoeukaryotes with respect to geographical and environmental parameters (latitude, depth, temperature, salinity, chlorophyll a, %PAR, NO3, and PO4) in the Red Sea. Principal component 1 explained 53.5% of the variability and showed a positive correlation with picophytoplankton abundances, temperature, %PAR, and chlorophyll a concentration, as well as a negative correlation with depth, nutrient concentration, and salinity. Principal component 2 (19.6% of variability) was positively correlated with latitude, salinity, and Prochlorococcus abundance and negatively with nutrients and Synechococcus abundance.
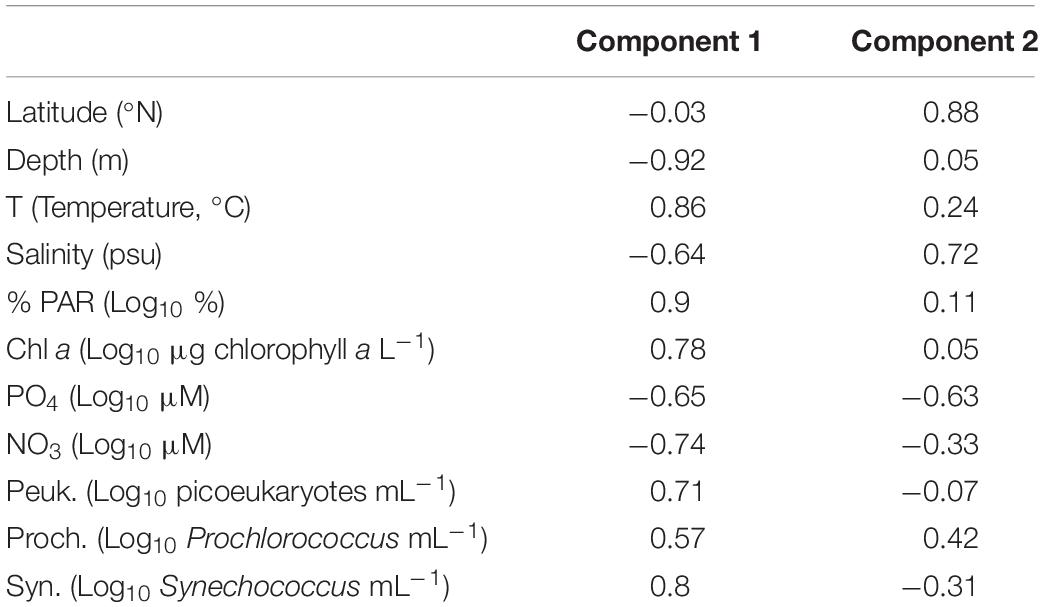
Table 3. Loading values for each factor (latitude, depth, environmental parameters, and cellular abundances) and the first two components of the PCA depicted in Figure 5.
We also explored the realized niches by considering cellular abundances and environmental parameters via multiple regression. Using a general stepwise-regression technique, we produced a set of candidate models describing picophytoplankton abundances and selected the best models based on the RMSE values calculated per number of terms and the estimated AICc values for each candidate (Supplementary Table 1). The best model for Synechococcus showed an R2 value of 0.83 and was composed of five terms: the independent effects of temperature and %PAR and the combined effects of temperature with nitrate and %PAR with salinity and with phosphate (Table 4 and Supplementary Figure 4). For Prochlorococcus, the R2 value was lower (0.44) and was also defined by five terms: the independent effects of %PAR and nitrate, and the combined effects of temperature with salinity and %PAR with nitrate and with phosphate. The model for picoeukaryotes had an R2 value of 0.58 and was defined by four terms: the independent effects of salinity and phosphate and the combined effects of temperature with phosphate and %PAR with nitrate. The different terms in these models showed a good fit when considered separately (p < 0.05, Table 4).
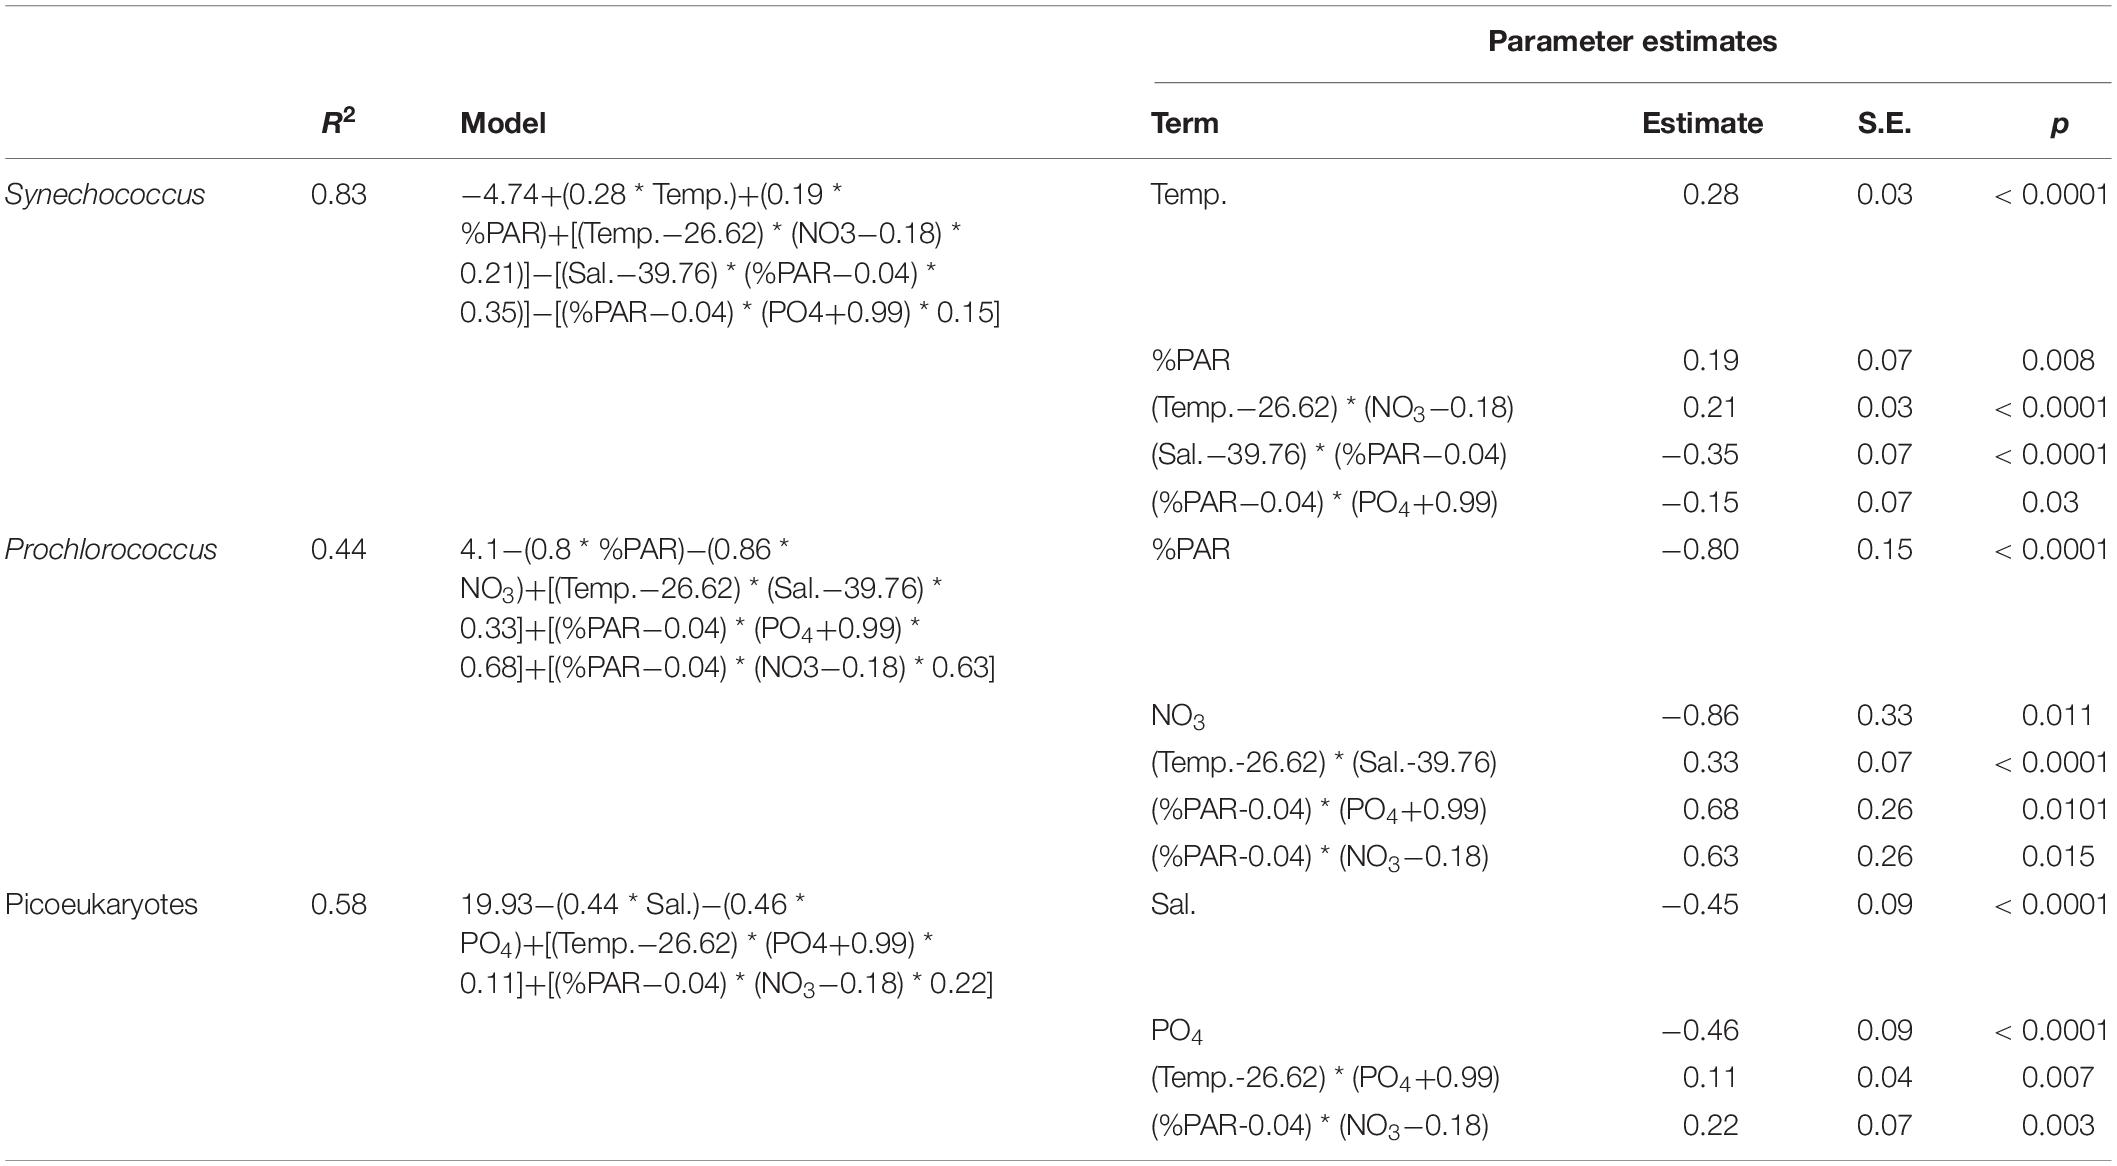
Table 4. Best model for each picophytoplankton group (as determined by general stepwise regression), with forward selection by AICc and the corresponding parameter estimates for each term in the models.
The relative biovolumes of the three groups with respect to the total picophytoplankton biovolume were used to describe partitioning of niches and to identify dominance between the three groups. The average biovolume proportions for the three groups were 47.6 ± 2.5%, 25.9 ± 2.1%, and 26.4 ± 1.3% for Synechococcus, Prochlorococcus, and picoeukaryotes, respectively. In the southern Red Sea, the average biovolume proportion of Synechococcus increased to 60.6 ± 4.2% for Synechococcus, decreased to 15.5 ± 3% for Prochlorococcus, and decreased to 23.9 ± 2.3% for picoeukaryotes. For the rest of the basin (>19°N), the average proportions still indicated the predominance of Synechococcus, representing 41.1 ± 2.9% of the picophytoplankton biomass, although this increased to 31.2 ± 2.7% for Prochlorococcus and 27.7 ± 1.5% for picoeukaryotes. The proportion of Synechococcus biovolume decreased with salinity at a rate of -25.1 ± 3% per psu and increased with temperature at a rate of 7.6 ± 0.8% per °C, at the expense of the proportions of both Prochlorococcus and picoeukaryotes (Supplementary Figure 5). Light had similarly contrasting effects upon the contributions of the three groups to the total picophytoplankton biovolume. At the most superficial layers (3–5 m), where %PAR > 70, the average proportions of picoeukaryotes, Prochlorococcus, and Synechococcus were 20 ± 3.4%, 6.5 ± 3.5%, and 73.4 ± 5.3%, respectively; deeper down the water column, with %PAR < 1, picoeukaryote and Prochlorococcus proportions increased to 29.8 ± 2.6% and 50.4 ± 4.6%, respectively, while the proportion of Synechococcus decreased to 19.7 ± 4.4% (Supplementary Figure 5).
Using k-means clustering, we examined the changes in the biovolume proportions and defined three separate population groups (Cubic Clustering Criterion = 4.74) with statistically different characteristics (p < 0.05). Among the three clusters, cluster A showed the highest average biovolume proportions for Synechococcus (80.2 ± 1.6%, p < 0.05) and the lowest for picoeukaryotes (14.2 ± 1.2%, p < 0.05) (Figure 6). This cluster predominated in surface (average depth 27.5 ± 3.4 m), well-illuminated (35.61 ± 3.36 %PAR), and warm waters (28.6 ± 0.2°C), with moderate nitrate concentrations (0.37 ± 0.02 μg L–1) (Supplementary Figure 6). 83% of the samples with temperature >30°C belonged to this cluster. Cluster B corresponded to the highest average Prochlorococcus-biovolume proportion (60.3 ± 1.4%, p < 0.05) and the lowest for Synechococcus (p < 0.05, 11.7 ± 1.7%) (Figure 6). It comprised deeper (86.8 ± 3.7 m), colder (25.24 ± 0.3°C), more poorly illuminated (6.12 ± 3.54 %PAR), and more saline waters (40.05 ± 0.07 psu) than the other two clusters (p < 0.05), with a high average nitrate concentration of 2.68 ± 0.37 μM and a similar Chl a average to that of cluster A (0.39 ± 0.03 μg L–1, p > 0.05), reflecting its deep water-column conditions (Supplementary Figure 6). Cluster C characterized the highest proportion of picoeukaryotes (50.5 ± 1.8%, p < 0.05) (Figure 6), corresponding to waters located at a layer between those characterizing clusters A and B (38.9 ± 5 m), with intermediate salinity (p < 0.05, average 39.75 ± 0.09 psu), receiving moderate %PAR values (27.67 ± 4.63 %PAR) and warm temperature (28.0 ± 0.4°C, p > 0.05). The high nitrate concentration (2.5 ± 0.51 μM, p > 0.05) indicated deep and/or southern waters (Supplementary Figure 6).
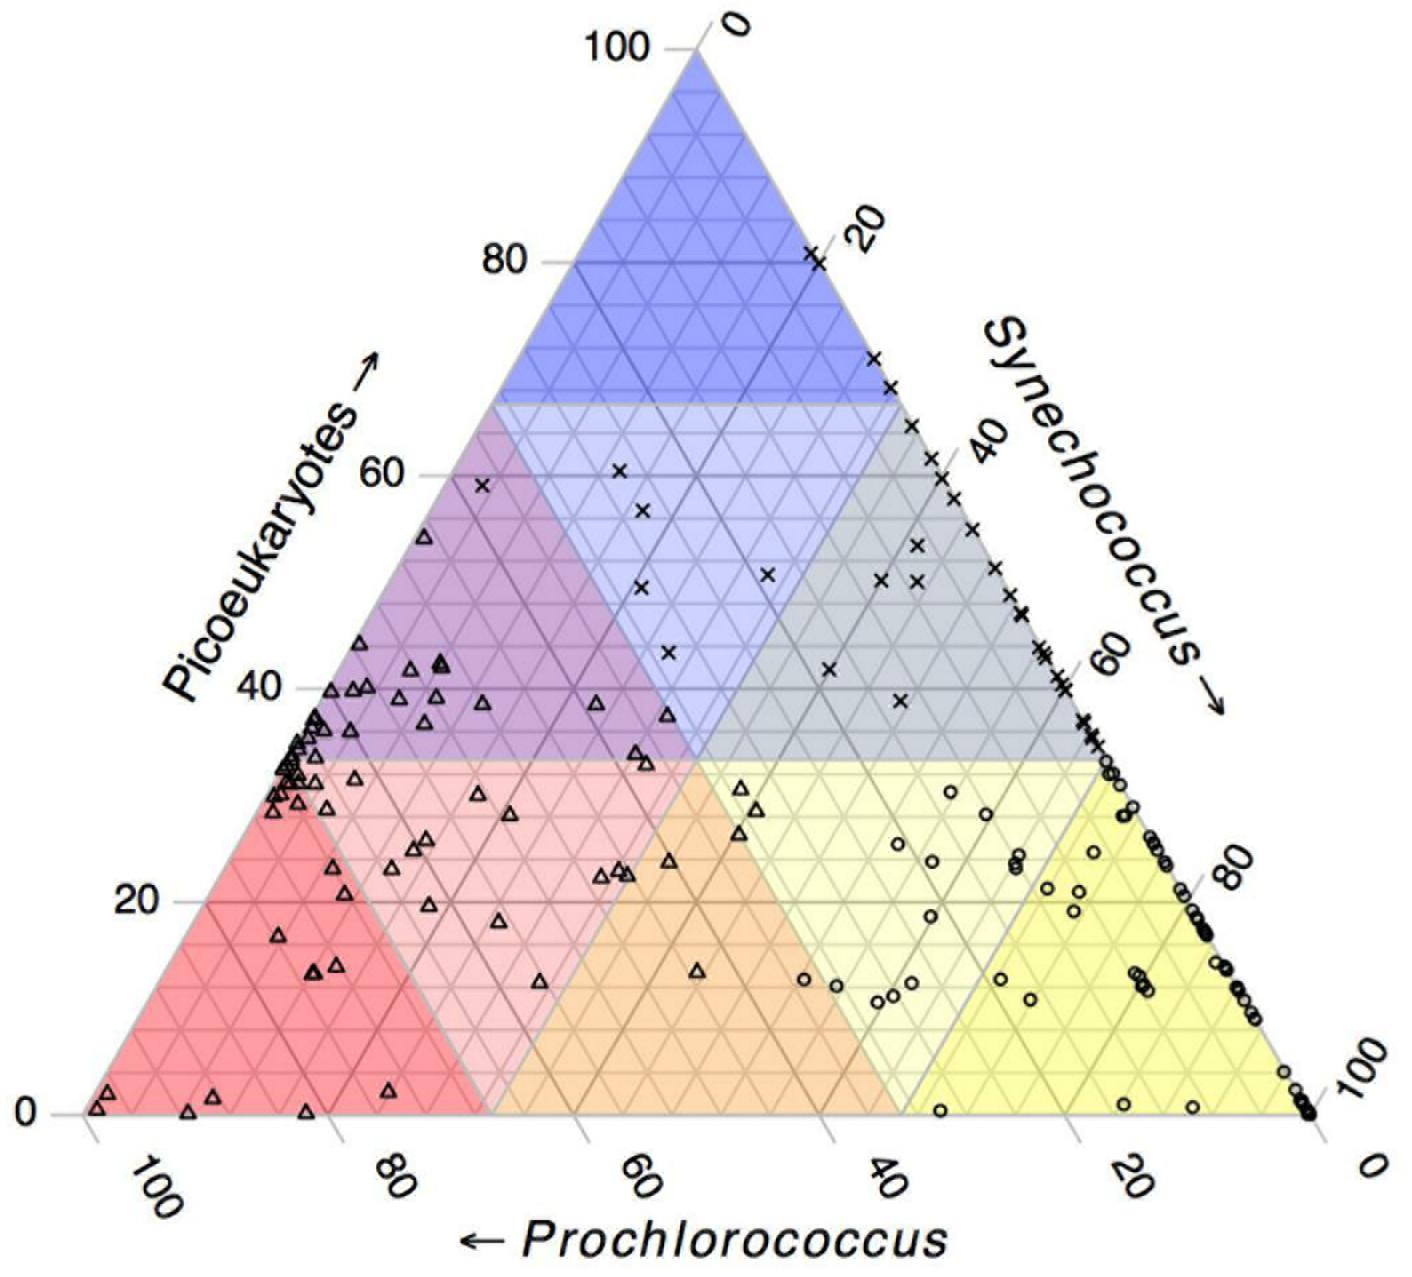
Figure 6. Ternary plot showing the biovolume proportions of the three picophytoplankton groups. The triangular regions at the corners represents the biovolume proportions >66% for picoeukaryotes (darkest blue), Synechococcus (darkest yellow), and Prochlorococcus (darkest red). The intermediate-colored areas correspond to biovolume proportions between 33 and 66% (intermediate light colors), and the regions opposite each corner represent 0–33% for the corresponding group. Different symbols represent the three k-means clusters, where circles correspond to cluster A, for the highest average biovolume proportions for Synechococcus (p < 0.05, 80.2 ± 1.6%) and the lowest for picoeukaryotes (p < 0.05, 14.2 ± 1.2%); triangles correspond to cluster B, for the highest average Prochlorococcus-biovolume proportion (p < 0.05, 60.3 ± 1.4%) and the lowest for Synechococcus (p < 0.05, 11.7 ± 1.7%); and crosses correspond to cluster C, for the highest picoeukaryote proportions of the three clusters (p < 0.05, 50.5 ± 1.8%).
Discussion
Our study characterized the realized niches of Synechococcus, Prochlorococcus, and picoeukaryote populations inhabiting the Red Sea (i.e., the warmest of the oligotrophic seas), where seawater temperatures often exceed 30°C, matching future projected temperatures for the subtropical ocean. The results indicated that, in the warmest waters (>30°C), Synechococcus populations dominated the picophytoplankton community with an average biovolume proportion of 73.6%, while the average proportion of Prochlorococcus and picoeukaryotes decreased to 7.5 and 18.8%, respectively. Seawater temperature and light, followed by nutrient concentrations and salinity, defined the niche partitioning of the picophytoplankton community in the Red Sea, resulting in a strong vertical segregation of the populations.
The picoeukaryotes in the Red Sea belong to several taxa, including members of the classes Mamiellophyceae and Prasinophyceae (Pearman et al., 2017). During their work, Pearman et al. (2017) observed different distribution preferences between picoeukaryotic groups, with the genus Ostreococcus thriving in the north basin, the prasinophyte clade VII in the central basin, and an increased abundance of genera Bathycoccus and Micromonas in the south. This taxonomic diversity may allow niche plasticity for the picoeukaryotic group (Kirkham et al., 2013; Choi et al., 2016). The Synechococcus population is largely dominated by clade II in the Red Sea (Fuller et al., 2003, 2005), which is also very abundant in the Indian Ocean (Zwirglmaier et al., 2008). For Prochlorococcus, previous studies identified the dominant HL at the surface and LL in deeper water (Shibl et al., 2014, 2016), as observed elsewhere (e.g., Moore et al., 1998); however, few studies have yet been conducted on the taxonomic diversity of picocyanobacteria along the Red Sea (Veldhuis and Kraay, 1993; Acosta et al., 2013).
The picophytoplankton abundances found in the Red Sea during this study were similar to those reported in previous studies in the Gulf of Aqaba and the northern Red Sea (Lindell and Post, 1995; Fuller et al., 2005; Stambler, 2005), and along the coast of the Central Red Sea (Al-Otaibi et al., 2020). However, the abundances of the three populations differed strongly from the proportions reported for the oligotrophic ocean: Prochlorococcus is the prevalent picophytoplankton population in the oligotrophic subtropical gyres (Li, 1995; Grob et al., 2007; Bouman et al., 2011; Casey et al., 2013; Agustí et al., 2019), and it was also reported to predominate at more northerly Red Sea latitudes than those studied here, only during summertime (Lindell and Post, 1995). However, we observed that in the Red Sea basin Synechococcus was the most abundant picophytoplankton population, with a moderate average abundance of 8.2 × 10³ cells mL–1. Also, the cellular abundances of Prochlorococcus and picoeukaryotes in the Red Sea basin were an average of 19 and 2.6 times lower, respectively, than the mean cellular abundance reported for the global tropical and subtropical oceans (Agustí et al., 2019), indicating a strong change in picophytoplankton community composition, as well as a reduction in the total picophytoplankton abundance. The prevalence of Synechococcus in the Red Sea basin found in this study is in agreement with qPCR data by Pearman et al. (2017) describing that, with the exception of the northern region in the spring, Synechococcus reads dominated the cyanobacteria in the Red Sea. Therefore, Synechococcus was the prevalent picophytoplankton within the Red Sea area studied, with the highest proportions found at the southern Red Sea.
In terms of biovolume, Synechococcus dominated the picoplankton community in the Red Sea (47.6%), in contrast with a lower proportion of picoeukaryotes (26.4%) and Prochlorococcus (25.9%). For the Pacific Ocean, the contribution of Prochlorococcus varied from 69.3% in the warm oligotrophic area to 58.7% in the equatorial upwelling (Blanchot et al., 2001), with picoeukaryotes accounting for 35% on average and Synechococcus for 7% (Blanchot et al., 2001). In the Central North Atlantic Ocean, Li (1995) found a dominant contribution of picoeukaryotes to total picophytoplankton biomass. The proportions found in the Red Sea are also far from the averages reported for the subtropical Indian Ocean, where Prochlorococcus biomass predominated (Baer et al., 2018), and the contributions of each group to biomass were 69, 19, and 12% for Prochlorococcus, Synechococcus, and picoeukaryotes, respectively (Agustí et al., 2019). In the warm Red Sea between the surface and a depth of 50 m, Synechococcus represented a higher portion of total picophytoplankton biovolume (65.8%), by contrast with the predominance of Prochlorococcus found at similar depth intervals in other oligotrophic sites in the Atlantic and Pacific Oceans (Campbell and Vaulot, 1993; Partensky et al., 1996; Simmons et al., 2016). Therefore, both in terms of cell abundance and biovolume Synechococcus was the prevalent picophytoplankton within the Red Sea area studied, with the highest proportions found at the southern Red Sea surface.
Univariate Relationships of Picophytoplankton to Environmental Parameters in the Red Sea
The three Red Sea picophytoplankton communities were positively correlated with %PAR. However, Synechococcus showed the strongest relationship and dominated the surface waters under high light intensities. The slope of the relationship (0.52) doubled that observed for the global oligotrophic subtropical ocean (slope = 0.28, Agustí et al., 2019), as well as that reported for the oligotrophic Atlantic Ocean (slope = 0.24, Partensky et al., 1996), indicating that high light levels in the Red Sea had a stronger positive effect upon Synechococcus populations. For Prochlorococcus, the correlation was also positive (0.24), but smoother than that for Synechococcus, as observed in the Atlantic Ocean (Partensky et al., 1996, slope = 0.16) and in the global tropical and subtropical ocean (Agustí et al., 2019, slope = 0.2). Our observations agree with previous studies indicating that Synechococcus is limited by low irradiance and is less sensitive to high light levels than Prochlorococcus (Moore et al., 1995; Mella-Flores et al., 2012). Moreover, the high transparency of the Red Sea allows deep penetration of potentially harmful ultraviolet radiation (Overmans and Agustí, 2019), to which Prochlorococcus shows a high sensitivity (Llabrés and Agustí, 2006; Mella-Flores et al., 2012). Previous studies with natural populations from the Atlantic Ocean (Llabrés and Agustí, 2006; Agustí and Llabrés, 2007) and the Mediterranean Sea (Llabrés et al., 2010) confirmed that Synechococcus could be highly resistant to ultraviolet-B radiation.
The Red Sea waters studied here exceeded the temperatures of other oligotrophic open waters by including values above 30°C. Red Sea picophytoplankton abundances showed positive correlations with increasing temperature, although with different slopes of 0.29, 0.07, and 0.11 for Synechococcus, Prochlorococcus, and picoeukaryotes, respectively. For Synechococcus and picoeukaryotes in our study, the effect of temperature upon cellular abundance was steeper than that found in tropical and subtropical gyres (slopes = 0.03 and 0.01, respectively; Agustí et al., 2019). For Prochlorococcus, the slope observed here is similar to that reported in other studies from the Atlantic Ocean (slope = 0.03, Jameson et al., 2010) and for the global tropical and subtropical ocean (slope = 0.04, Agustí et al., 2019). Our observations from the Red Sea suggest that Synechococcus would thrive at high temperatures above 30°C, and that Prochlorococcus would be segregated to colder waters following its thermal niche.
Prochlorococcus covered a wide salinity range of 38.3–40.7 psu, and was present in areas of the northern Red Sea with salinities ≥40 psu, where the Synechococcus and picoeukaryote concentrations were reduced. This association of Prochlorococcus with higher salinity agrees with results from the Mediterranean Sea, where and increasing viability of Prochlorococcus with increasing salinity was reported across the basin (Lasternas et al., 2010). It also agrees with other studies from continental margins in the Atlantic Ocean, where Prochlorococcus was identified as a tracer of saline currents and water masses (Calvo-Díaz et al., 2004; Ribeiro et al., 2016).
The univariate responses of Red Sea picophytoplankton to increased nutrient concentrations obtained here were negative, in contrast with the global oligotrophic ocean, where increased nutrients led to negative correlations with Prochlorococcus, but positive for Synechococcus and picoeukaryotes (Agustí et al., 2019). For picoeukaryotes, however, the effect of increased nutrients observed here was less negative than that for cyanobacteria. Overall, the relationships obtained here between temperature and nutrient concentrations are similar to those reported by Shibl et al. (2016) for a similar latitudinal sampling along the Red Sea basin. Nutrient concentrations in natural ecosystems are usually negatively correlated with seawater temperature, making it difficult to discriminate the effects of each factor upon the picophytoplankton distribution and its responses to temperature (e.g., Li, 1998; Agawin et al., 2000; Agustí et al., 2019). Despite Red Sea waters being considered highly deficient in major nutrients (Weikert, 1987), the intrusion of warm and nutrient-rich water from the Gulf of Aden at the Southern Red Sea leads to latitudinal gradients in nutrient concentrations along the basin (Churchill et al., 2014). However, we did not find differences in the slopes of NO3 vs. temperature when comparing waters from the southern and northern Red Sea; rather, the concentration remained relatively high, even at northerly latitudes. However, increased PO4 concentrations in the south led to a smoother decline with temperature when compared to stations at higher latitudes. In fact, the negative slopes found here between both nitrate and phosphate and temperature were two times larger than those reported for the global tropical and subtropical ocean (Agustí et al., 2019). This may be due to the smaller temperature range observed in the water column in the Red Sea.
Applying a bell-shaped fit to univariate regressions between cell abundances and an environmental factor can allow us to estimate an optimal value and approximate limits. Amongst other non-linear fits, the Lorentzian model has been proven to be a good fit in previous studies, e.g., to assess the relationship between plankton biomass and diversity and several hydrographic features (Baranyi et al., 2002; Breton et al., 2006; Török et al., 2016; Várbíró et al., 2017). With respect to %PAR, the maximum abundance of Synechococcus was centered at 77% PAR in the Red Sea, while those of Prochlorococcus and picoeukaryotes were centered at lower %PAR values of 3.2 and 6.4%, respectively. Similar results were observed for the Atlantic Ocean (Partensky et al., 1996) and the oligotrophic subtropical ocean (Agustí et al., 2019) for Prochlorococcus and picoeukaryotes. However, the maximum abundance of Synechococcus was located at approximately 32% PAR in the subtropical oceans (Agustí et al., 2019), highlighting a possible higher tolerance of Synechococcus Red Sea populations to high light conditions. In agreement with our observations, Veldhuis and Kraay (1993) observed a predominance of Synechococcus in surface waters of the southern region of the Red Sea, with Prochlorococcus peaking closer to the DCM. According to our results, at 1% PAR (≈70 m deep), Synechococcus abundance was strongly reduced, and only Prochlorococcus and picoeukaryotes were able to thrive under such low light conditions. This agrees with previous results from the oligotrophic ocean (Partensky et al., 1996; Agustí et al., 2019).
As expected for picophytoplankton, the three groups showed maxima at low nutrient concentrations, without any significant differences between them. Prochlorococcus and the picoeukaryotes displayed wider niches, reaching waters with higher upper nutrient limits, as they were found deeper in the water column. This was also observed in other studies (Xiao et al., 2018). Overall, the optimal nitrate concentrations for the cyanobacteria studied here (0.42–0.6 μM) were higher than those observed in other areas with similar or lower nitrate concentrations, such as the transition area in NE Pacific Ocean (Simmons et al., 2016), or the Brazilian Bight (Ribeiro et al., 2016). The Red Sea picophytoplankton optima for nitrate were slightly below the threshold of 1 μM, which determines the decline in the dominance of picophytoplankton (Agawin et al., 2000). Synechococcus and picoeukaryote cellular abundances increased at southerly latitudes in the Red Sea, as has been previously observed (Kürten et al., 2014), suggesting that Synechococcus and picoeukaryotes responded to the increased nutrient inputs as described elsewhere (e.g., Mackey et al., 2009). Synechococcus populations increased in warm nutrient-enriched coastal waters (Partensky et al., 1999; Phlips et al., 1999) and areas influenced by upwelling, as reported for the North Eastern African upwelling (Alonso-Laita and Agustí, 2006) and other areas (Zubkov et al., 1998; Blanchot et al., 2001; Ribeiro et al., 2016). This response to increased nutrient availability has also been reported for picoeukaryote groups (Zubkov et al., 1998; Blanchot et al., 2001; Mouriño-Carballido et al., 2016; Ribeiro et al., 2016; Pearman et al., 2017). However, the responses of picoeukaryotes in the Red Sea to nutrient inputs was not as strong as observed elsewhere, probably due to the notable responses of nano- and microphytoplankton in the Southern Red Sea, which accounted for 43 and 27% of the primary production rate in this area, respectively (Kheireddine et al., 2017). In open-ocean, oligotrophic waters, the size distribution of biomass is heavily skewed toward picophytoplankton (Marañón, 2015). But under increased nutrient concentrations, the contribution of small cells to autotrophic biomass is reduced due to increased loss rates (Agawin et al., 2000) and the pressure of more competitive, fast-growing big cells that can take advantage of nutrient inputs (Marañón et al., 2013). In the main Red Sea basin, picophytoplankton accounted for 30–75% of the phytoplankton biomass (Kheireddine et al., 2017); this proportion decreased to 20–40% in the southern Red Sea (Kheireddine et al., 2017), where the intrusion of nutrient-rich waters from the Gulf of Aden favored the growth of mesotrophic groups such as diatoms (Kheireddine et al., 2017; Pearman et al., 2017), confirming the competition and segregation against smaller phytoplankton cells.
Realized Picophytoplankton Niches in the Warmest Sea
Multiple-regression models and PCA analysis showed strong agreement in indicating that temperature and %PAR were the main factors conditioning the distribution of picophytoplankton, followed by (and negatively correlated with) nutrient concentrations and salinity. The strong influence of PAR availability on niche segregation of picophytoplankton in the Red Sea has been observed elsewhere (Agustí, 2004, Agustí et al., 2019; Flombaum et al., 2020). Temperature was also a key parameter affecting the distribution of the three groups on the Red Sea basin. Synechococcus and picoeukaryotes were advantaged at the highest temperatures measured here (>30°C), unlike Prochlorococcus. We also observed a strong salinity effect that would mark a succession in niche partitioning, with a negative correlation between Synechococcus and picoeukaryote abundances and salinity (also observed in Kürten et al., 2014), while Prochlorococcus was more abundant where salinity increased.
To summarize, our results suggest that the realized niche for Synechococcus in the Red Sea is centered at high PAR (77%), high temperature (center ≈30.6°C, lower value ≈26.9°C) and moderate salinity (center ≈38.2 psu). The Prochlorococcus niche, besides being defined by lower %PAR (center ≈3.2 %PAR), was associated with lower temperature and a larger salinity range of 38.3–40.7. The picoeukaryotic group shared the niche with both cyanobacteria, showing a preference for high temperatures (above 30°C) with Synechococcus, but favored by low %PAR levels close to those observed for Prochlorococcus (center ≈6.4%), although they were more successful in moderate-salinity waters (center ≈38.2 psu).
The Red Sea as a Warm Ocean Scenario
The present features of the Red Sea have been used as a gauge of future ocean scenarios in the specialized literature (Sawall and Al-Sofyani, 2015; Hume et al., 2016; Berumen et al., 2019; Ziegler et al., 2019; Anton et al., 2020a). Understanding the factors affecting the realized niches of picophytoplankton communities in the warm and oligotrophic Red Sea can provide key information for estimating picoplankton distributions in a future ocean in which small phytoplankton will be of increased importance (Morán et al., 2010). Different representative-concentration-pathway (RCP) scenarios project increased surface temperatures in the global ocean over the late 21st Century, with expected increases from 0.7 to 3°C (Collins et al., 2013). Considering that, in some areas of the tropical Pacific and Indian Oceans, the long-term mean surface temperatures already surpass 29°C (Deser et al., 2010; Signorini et al., 2015), the expected warming would mean more ecosystems subjected to temperatures beyond 30°C, covering the temperature range considered here, which has not been included in previous oligotrophic analyses. Moreover, climate projections estimate that increased temperatures will lead to stronger stratification, expanding oligotrophic areas in both hemispheres (Polovina et al., 2008; Signorini et al., 2015). The Red Sea is also experiencing a high warming rate of 0.17 ± 0.07°C decade–1, while the northern Red Sea is warming between 0.40 and 0.45°C decade–1 (Chaidez et al., 2017).
As observed here, the Synechococcus distribution was strongly linked to warmer, fresher, and well-illuminated surface waters, reaching higher concentrations toward the nutrient-enriched Southern area of the Red Sea, growing under low to moderate nutrient concentrations and temperatures above 30°C. In the southernmost area, both Synechococcus and picoeukaryotes could grow in warm-water layers closer to the surface, where they could benefit from the increased nutrient concentrations.
Following our results, Synechococcus predominated at temperatures >30°C, while the niches of Prochlorococcus and less-abundant picoeukaryotes were centered deeper in the water column under lower-%PAR and -temperature conditions. The segregation of Synechococcus at the warmest surface layer in the Red Sea revealed this genus’s large capacity for adapting to ocean warming. Toward deeper waters, the percentages of the Prochlorococcus and picoeukaryote biovolumes increased in detriment to Synechococcus. In the southern region of the Red Sea, Veldhuis and Kraay (1993) observed a predominance of Synechococcus in surface waters, with Prochlorococcus peaking closer to the DCM. The descent of Prochlorococcus and picoeukaryotes to deeper layers agrees with predictions pointing to vertical segregation of the picophytoplankton communities with future warming. Models considering changes in several environmental properties associated with warming predict a decrease of populations at the surface and an increase in subsurface blooms for Prochlorococcus and picoeukaryotes in the tropical and subtropical ocean (Agustí et al., 2019). Vertical migration of phytoplankton to deeper layers is predicted to occur with increased warming as a consequence of the deepening of thermal isolines, forcing organisms to follow their thermal niche to deeper layers, with populations becoming increasingly compressed at the base of the photic layer (Jorda et al., 2020). Adaptation to warming, however, will allow phytoplankton species to continue growing in the warmer conditions, as our results suggest for Red Sea Synechococcus, leading to a marked vertical segregation between this group and Prochlorococcus and picoeukaryotes, that would remain relegated to deeper layers.
In addition to the temperature conditions, the picophytoplankton communities in the Red Sea are influenced by the strong nutrient and salinity gradients that characterize this basin. The warmest waters of the Red Sea are found in the south, which are enriched in nutrients due to interchange and upwelled waters from the Indian Ocean. The influence of mesotrophic waters in the Southern Red Sea resulted in the displacement of picophytoplankton toward the surface, the exclusion of Prochlorococcus, and the increasing dominance of tropical nano- and microphytoplankton species (Kheireddine et al., 2017), whose diatoms are also adapted to the high seawater temperatures (Jin and Agustí, 2018). The larger capacity of Red Sea nano- and microphytoplankton to respond to nutrients was evidenced by nutrient enrichment mesocosms experiments with oligotrophic waters (Pearman et al., 2016), which showed the fast response of Synechococcus during the first days, soon declining due to a viral infection (Coello-Camba et al., 2020), followed by a large bloom dominated by diatoms.
Our observations help to identify the realized niches of picophytoplankton in the unique Red Sea environment, characterized by their overall high temperatures and latitudinal nutrient and salinity gradients. However, a profound comprehension of these niches and their definition in space would require a more thorough spatial and seasonal coverage, and even complementary transplant experiments to identify the range limits of these picophytoplankton populations (Hargreaves et al., 2014). Besides this, in scenarios like the Red Sea, defined by gradients in ecologically important variables, the quality of the habitat and a species’ abundance typically decline toward the edges of its distribution range (Holt, 2003; Hargreaves et al., 2014), without sharp boundaries, and therefore the definition of distribution limits is not straightforward. Also, the distribution of a species is a dynamic feature that can be modified by biotic interactions such as predation or competition (Case et al., 2005), dispersal processes and habitat adaptation (Holt, 2003). This way, future scenarios may be conditioned by the species’ ability to adapt to the new conditions, with our results highlighting a good adaptation of Red Sea Synechococcus to surface warming conditions, while less adapted Prochlorococcus and picoeukaryotes thrive deeper.
Data Availability Statement
The raw data supporting the conclusions of this article will be made available by the authors, without undue reservation.
Author Contributions
SA designed the study. AC-C analyzed the data. Both authors obtained the data and wrote the manuscript.
Funding
This research was supported by King Abdullah University of Science and Technology through base line funding BAS/1/1072-01-01 to SA and FCC/1/1973-21-01.
Conflict of Interest
The authors declare that the research was conducted in the absence of any commercial or financial relationships that could be construed as a potential conflict of interest.
Acknowledgments
We thank the technical personnel of the Coastal and Marine Resources Core Laboratory (CMOR) and the RV Thuwal and RV Al-Azizi crews for their help during sampling.
Supplementary Material
The Supplementary Material for this article can be found online at: https://www.frontiersin.org/articles/10.3389/fmars.2021.651877/full#supplementary-material
Supplementary Figure 1 | Flow cytometer plots of red fluorescence (FL3), side scattering (SSC), and orange fluorescence (FL2) signals used to identify the populations of Synechococcus, Prochlorococcus, and eukaryotes from the Red Sea. Data from the water column at 27.3°N 34.8°E. Plots were made using FCS Express 7 software.
Supplementary Figure 2 | Vertical profiles representing the average cellular abundances (±standard error) per sampling depth of (A) Synechococcus, (B) Prochlorococcus, and (C) picoeukaryotes in the Red Sea (black dots). Dotted lines represent the average nitrate concentrations (μM) and dashed lines represent the average temperatures (°C).
Supplementary Figure 3 | Contour plots representing the changes in the abundance of the three picophytoplankton groups with nitrate concentration (log10 μM) and temperature (°C). In the color scale, blue represents cellular concentrations <100 cells mL–1. Black contour lines mark Log10 cells mL–1 = 3, and gray contour lines mark Log10 cells mL–1 = 2.
Supplementary Figure 4 | (A) Contour plots representing the observed distributions of cellular abundances (cell mL–1) for Synechococcus, Prochlorococcus, and picoeukaryotes with depth and latitude. (B) Cellular-abundance distributions estimated by applying the best multiple-regression model for each group with depth and latitude.
Supplementary Figure 5 | Changes in the proportion of picophytoplankton biovolume represented by the three groups with depth, temperature, salinity, and Log10 % PAR. The equations for each regression line are presented at the bottom of each plot, following the same color code of the picoplankton groups shown in the figure legend.
Supplementary Figure 6 | Latitudinal and vertical distribution of the biovolume clusters defined in Figure 6. Circles represent Cluster A, triangles Cluster B, and crosses Cluster C.
Supplementary Table 1 | (A) Candidate models for each picoplankton group, ordered by number of terms, together with their corresponding quality estimators. Gray shading indicates the models selected in our work. (B) Decrease in RMSE with increasing number of terms in the candidate models for each phytoplankton group.
References
Abdulrahman Ashy, R., and Agustí, S. (2020). Low host abundance and high temperature determine switching from lytic to lysogenic cycles in planktonic microbial communities in a tropical sea (Red Sea). Viruses 12:761. doi: 10.3390/v12070761
Acevedo-Trejos, E., Brandt, G., Steinacher, M., and Merico, A. (2014). A glimpse into the future composition of marine phytoplankton communities. Front. Mar. Sci. 1:15. doi: 10.3389/fmars.2014.00015
Acosta, F., Ngugi, D. K., and Stingl, U. (2013). Diversity of picoeukaryotes at an oligotrophic site off the Northeastern Red Sea Coast. Aquat. Biosyst. 9:16. doi: 10.1186/2046-9063-9-16
Agawin, N. S., Duarte, C. M., and Agustí, S. (1998). Growth and abundance of Synechococcus sp. in a Mediterranean Bay: seasonality and relationship with temperature. Mar. Ecol. Progr. Ser. 170, 45–53. doi: 10.3354/meps170045
Agawin, N. S., Duarte, C. M., and Agustí, S. (2000). Nutrient and temperature control of the contribution of picoplankton to phytoplankton biomass and production. Limnol. Oceanogr. 45, 591–600. doi: 10.4319/lo.2000.45.3.0591
Agustí, S. (2004). Viability and niche segregation of Prochlorococcus and Synechococcus cells across the Central Atlantic Ocean. Aquat. Microb. Ecol. 36, 53–59. doi: 10.3354/ame036053
Agustí, S., and Llabrés, M. (2007). Solar radiation-induced mortality of marine pico-phytoplankton in the oligotrophic ocean. Photochem. Photobiol. 83, 793–801. doi: 10.1111/j.1751-1097.2007.00144.x
Agustí, S., Lubián, L. M., Moreno-Ostos, E., Estrada, M., and Duarte, C. M. (2019). Projected changes in photosynthetic picoplankton in a warmer Subtropical Ocean. Front. Mar. Sci. 5:506. doi: 10.3389/fmars.2018.00506
Alonso-Laita, P., and Agustí, S. (2006). Contrasting patterns of phytoplankton viability in the subtropical NE Atlantic Ocean. Aquat. Microb. Ecol. 43, 67–78. doi: 10.3354/ame043067
Al-Otaibi, N., Huete-Stauffer, T. M., Calleja, M. L., Irigoien, X., and Morán, X. A. G. (2020). Seasonal variability and vertical distribution of autotrophic and heterotrophic picoplankton in the Central Red Sea. PeerJ 8:e8612.
Anton, A., Baldry, K., Coker, D. J., and Duarte, C. M. (2020a). Drivers of the low metabolic rates of seagrass meadows in the Red Sea. Front. Mar. Sci. 7:69. doi: 10.3389/fmars.2020.00069
Anton, A., Randle, J. L., Garcia, F. C., Rossbach, S., Ellis, J. I., Weinzierl, M., et al. (2020b). Differential thermal tolerance between algae and corals may trigger the proliferation of algae in coral reefs. Glob. Change Biol. 26, 4316–4327. doi: 10.1111/gcb.15141
Baer, S. E., Rauschenberg, S., Garcia, C. A., Garcia, N. S., Martiny, A. C., Twining, B. S., et al. (2018). Carbon and nitrogen productivity during spring in the oligotrophic Indian Ocean along the GO-SHIP IO9N transect. Deep Sea Res. Part II 161, 81–91. doi: 10.1016/j.dsr2.2018.11.008
Baranyi, C., Hein, T., Holarek, C., Keckeis, S., and Schiemer, F. (2002). Zooplankton biomass and community structure in a Danube River floodplain system: effects of hydrology. Freshw. Biol. 47, 473–482. doi: 10.1046/j.1365-2427.2002.00822.x
Bertilsson, S., Berglund, O., Karl, D. M., and Chisholm, S. W. (2003). Elemental composition of marine Prochlorococcus and Synechococcus: implications for the ecological stoichiometry of the sea. Limnol. Oceanogr. 48, 1721–1731. doi: 10.4319/lo.2003.48.5.1721
Berumen, M. L., Voolstra, C. R., Daffonchio, D., Agustí, S., Aranda, M., Irigoien, X., et al. (2019). “The Red Sea: environmental gradients shape a natural laboratory in a Nascent Ocean,” in Coral Reefs of the Red Sea, eds C. R. Voolstra and M. L. Berumen (Cham: Springer), 1–10.
Bestion, E., Barton, S., García, F. C., Warfield, R., and Yvon-Durocher, G. (2020). Abrupt declines in marine phytoplankton production driven by warming and biodiversity loss in a microcosm experiment. Ecol. Lett. 23, 457–466. doi: 10.1111/ele.13444
Bijma, J., Pörtner, H. O., Yesson, C., and Rogers, A. D. (2013). Climate change and the oceans–what does the future hold? Mar. Pollut. Bull. 74, 495–505. doi: 10.1016/j.marpolbul.2013.07.022
Bindoff, N. L., Cheung, W. W. L., Kairo, J. G., Arístegui, J., Guinder, V. A., Hallberg, R., et al. (2019). “Changing ocean, marine ecosystems, and dependent communities,” in IPCC Special Report on the Ocean and Cryosphere in a Changing Climate, eds H.-O. Pörtner, D. C. Roberts, V. Masson-Delmotte, P. Zhai, M. Tignor, and E. Poloczanska, Available online at: https://www.ipcc.ch/srocc/chapter/chapter-5/ (accessed November 15, 2020).
Blanchot, J., André, J. M., Navarette, C., Neveux, J., and Radenac, M. H. (2001). Picophytoplankton in the equatorial Pacific: vertical distributions in the warm pool and in the high nutrient low chlorophyll conditions. Deep Sea Res Part I 48, 297–314. doi: 10.1016/S0967-0637(00)00063-7
Bouman, H. A., Ulloa, O., Barlow, R., Li, W. K., Platt, T., Zwirglmaier, K., et al. (2011). Water-column stratification governs the community structure of subtropical marine picophytoplankton. Environ. Microbiol. Rep. 3, 473–482. doi: 10.1111/j.1758-2229.2011.00241.x
Boyce, D. G., Lewis, M. R., and Worm, B. (2010). Global phytoplankton decline over the past century. Nature 466, 591–596. doi: 10.1038/nature09268
Breton, E., Rousseau, V., Parent, J. Y., Ozer, J., and Lancelot, C. (2006). Hydroclimatic modulation of diatom/Phaeocystis blooms in nutrient-enriched Belgian coastal waters (North Sea). Limnol. Oceanogr. 51, 1401–1409. doi: 10.4319/lo.2006.51.3.1401
Brun, P., Vogt, M., Payne, M. R., Gruber, N., O’brien, C. J., Buitenhuis, E. T., et al. (2015). Ecological niches of open ocean phytoplankton taxa. Limnol. Oceanogr. 60, 1020–1038. doi: 10.1002/lno.10074
Burrows, M. T., Schoeman, D. S., Buckley, L. B., Moore, P., Poloczanska, E. S., Brander, K. M., et al. (2011). The pace of shifting climate in marine and terrestrial ecosystems. Science 334, 652–655. doi: 10.1126/science.1210288
Calvo-Díaz, A., Morán, X. A. G., Nogueira, E., Bode, A., and Varela, M. (2004). Picoplankton community structure along the northern Iberian continental margin in late winter–early spring. J. Plankton Res. 26, 1069–1081. doi: 10.1093/plankt/fbh098
Campbell, L., and Vaulot, D. (1993). Photosynthetic picoplankton community structure in the subtropical North Pacific Ocean near Hawaii (station ALOHA). Deep Sea Res. P I. 40, 2043–2060. doi: 10.1016/0967-0637(93)90044-4
Case, T. J., Holt, R. D., McPeek, M. A., and Keitt, T. H. (2005). The community context of species’ borders: ecological and evolutionary perspectives. Oikos 108, 28–46. doi: 10.1111/j.0030-1299.2005.13148.x
Casey, J. R., Aucan, J. P., Goldberg, S. R., and Lomas, M. W. (2013). Changes in partitioning of carbon amongst photosynthetic pico- and nano-plankton groups in the Sargasso Sea in response to changes in the North Atlantic Oscillation. Deep Sea Res. Part II 93, 58–70. doi: 10.1016/j.dsr2.2013.02.002
Chaidez, V., Dreano, D., Agustí, S., Duarte, C. M., and Hoteit, I. (2017). Decadal trends in Red Sea maximum surface temperature. Sci. Rep. 7, 1–8. doi: 10.1038/s41598-017-08146-z
Chen, B., Liu, H., Huang, B., and Wang, J. (2014). Temperature effects on the growth rate of marine picoplankton. Mar. Ecol. Progr. Ser. 505, 37–47. doi: 10.3354/meps10773
Chisholm, S. W. (1992). “Phytoplankton size,” in Primary Productivity and Biogeochemical Cycles in the Sea, eds P. G. Falkowski and A. D. Woodhead (New York, NY: Plenum Press), 213–237.
Choi, D. H., An, S. M., Chun, S., Yang, E. C., Selph, K. E., Lee, C. M., et al. (2016). Dynamic changes in the composition of photosynthetic picoeukaryotes in the northwestern Pacific Ocean revealed by high-throughput tag sequencing of plastid 16S rRNA genes. FEMS Microb. Ecol. 92, 1–11. doi: 10.1093/femsec/fiv170
Churchill, J. H., Bower, A. S., McCorkle, D. C., and Abualnaja, Y. (2014). The transport of nutrient-rich Indian Ocean water through the Red Sea and into coastal reef systems. J. Mar. Res. 72, 165–181. doi: 10.1357/002224014814901994
Coello-Camba, A., Diaz-Rua, R., Duarte, C. M., Irigoien, X., Pearman, J. K., Alam, I. S., et al. (2020). Picocyanobacteria community and cyanophage infection responses to nutrient enrichment in a mesocosms experiment in oligotrophic waters. Front. Microbiol. 11:1153. doi: 10.3389/fmicb.2020.01153
Collins, M., Knutti, R., Arblaster, J., Dufresne, J.-L., Fichefet, T., Friedlingstein, P., et al. (2013). “Long-term climate change: projections, commitments and irreversibility,” in Climate Change 2013: The Physical Science Basis. Contribution of Working Group I to the Fifth Assessment Report of the Intergovernmental Panel on Climate Change, eds T. F. Stocker, D. Qin, G.-K. Plattner, M. Tignor, S. K. Allen, J. Boschung, et al. (Cambridge: Cambridge University Press), 1029–1136.
Crosbie, N. D., and Furnas, M. J. (2001). Abundance, distribution and flow-cytometric characterization of picophytoprokaryote populations in central (17°S) and southern (20°S) shelf waters of the Great Barrier Reef. J. Plankton Res. 23, 809–828. doi: 10.1093/plankt/23.8.809
Deser, C., Alexander, M. A., Xie, S. P., and Phillips, A. S. (2010). Sea surface temperature variability: patterns and mechanisms. Annu. Rev. Mar. Sci. 2, 115–143. doi: 10.1146/annurev-marine-120408-151453
Doney, S. C., Ruckelshaus, M., Duffy, J. E., Barry, J. P., Chan, F., English, C. A., et al. (2002). Climate change impacts on marine ecosystems. Annu. Rev. Mar. Sci. 4, 11–37. doi: 10.1146/annurev-marine-041911-111611
Duarte, C. M. (2014). Global change and the future ocean: a grand challenge for marine sciences. Front. Mar. Sci. 1:63.
Edwards, M., and Richardson, A. J. (2004). Impact of climate change on marine pelagic phenology and trophic mismatch. Nature 430, 881–884. doi: 10.1038/nature02808
Ferris, M. J., and Palenik, B. (1998). Niche adaptation in ocean cyanobacteria. Nature 396, 226–228. doi: 10.1038/24297
Flombaum, P., Gallegos, J. L., Gordillo, R. A., Rincón, J., Zabala, L. L., Jiao, N., et al. (2013). Present and future global distributions of the marine Cyanobacteria Prochlorococcus and Synechococcus. Proc. Natl. Acad. Sci. U.S.A. 110, 9824–9829. doi: 10.1073/pnas.1307701110
Flombaum, P., Wang, W. L., Primeau, F. W., and Martiny, A. C. (2020). Global picophytoplankton niche partitioning predicts overall positive response to ocean warming. Nat. Geosci. 13, 116–120. doi: 10.1038/s41561-019-0524-2
Fuller, N. J., Marie, D., Partensky, F., Vaulot, D., Post, A. F., and Scanlan, D. J. (2003). Clade-specific 16S ribosomal DNA oligonucleotides reveal the predominance of a single marine Synechococcus clade throughout a stratified water column in the Red Sea. Appl. Environ. Microbiol. 69, 2430–2443. doi: 10.1128/AEM.69.5.2430
Fuller, N. J., West, N. J., Marie, D., Yallop, M., Rivlin, T., Post, A. F., et al. (2005). Dynamics of community structure and phosphate status of picocyanobacterial populations in the Gulf of Aqaba, Red Sea. Limnol. Oceanogr. 50, 363–375. doi: 10.4319/lo.2005.50.1.0363
Giomi, F., Barausse, A., Duarte, C. M., Booth, J., Agusti, S., Saderne, V., et al. (2019). Oxygen supersaturation protects coastal marine fauna from ocean warming. Sci. Adv. 5:eaax1814. doi: 10.1126/sciadv.aax1814
Gregory, B., Christophe, L., and Martin, E. (2009). Rapid biogeographical plankton shifts in the North Atlantic Ocean. Global Change Biol. 15, 1790–1803. doi: 10.1111/j.1365-2486.2009.01848.x
Grob, C., Ulloa, O., Claustre, H., Huot, Y., Alarcon, G., and Marie, D. (2007). Contribution of picoplankton to the total particulate organic carbon concentration in the eastern South Pacific. Biogeosciences 4, 837–852.
Hansen, H. P., and Koroleff, F. (1999). “Determination of nutrients,” in Methods of Seawater Analysis, eds K. Grasshoff, K. Kremling, and M. Ehrhardt (Weinheim: Wiley-VCH Verlag GmbH). doi: 10.1002/9783527613984.ch10
Hargreaves, A. L., Samis, K. E., and Eckert, C. G. (2014). Are species’ range limits simply niche limits writ large? A review of transplant experiments beyond the range. Am. Nat. 183, 157–173. doi: 10.1086/674525
Heldal, M., Scanlan, D. J., Norland, S., Thingstad, F., and Mann, N. H. (2003). Elemental composition of single cells of various strains of marine Prochlorococcus and Synechococcus using X-ray microanalysis. Limnol. Oceanogr. 48, 1732–1743. doi: 10.4319/lo.2003.48.5.1732
Hoegh-Guldberg, O., and Bruno, J. F. (2010). The impact of climate change on the World’s marine ecosystems. Science 328, 1523–1528. doi: 10.1126/science.1189930
Hume, B. C. C., Voolstra, C. R., Arif, C., D’Angelo, C., Burt, J. A., Eyal, G., et al. (2016). Ancestral genetic diversity associated with the rapid spread of stress-tolerant coral symbionts in response to Holocene climate change. Proc. Natl. Acad. Sci. U.S.A. 113, 4416–4421. doi: 10.1073/pnas.1601910113
Hutchinson, G. E. (1957). Concluding remarks. Cold Spring Harb. Symp. Quant. Biol. 22, 415–427. doi: 10.1101/SQB.1957.022.01.039
Irwin, A. J., Nelles, A. M., and Finkel, Z. V. (2012). Phytoplankton niches estimated from field data. Limnol. Oceanogr. 57, 787–797. doi: 10.4319/lo.2012.57.3.0787
Jameson, E., Joint, I., Mann, N. H., and Mühling, M. (2010). Detailed analysis of the microdiversity of Prochlorococcus populations along a North-South Atlantic Ocean transect. Environ. Microbiol. 12, 156–171. doi: 10.1111/j.1462-2920.2009.02057.x
Jin, P., and Agustí, S. (2018). Fast adaptation of tropical diatoms to increased warming with trade-offs. Sci. Rep. 8, 1–10. doi: 10.1038/s41598-018-36091-y
Jorda, G., Marbà, N., Bennett, S., Santana-Garcon, J., Agustí, S., and Duarte, C. M. (2020). Ocean warming compresses the three-dimensional habitat of marine life. Nat. Ecol. Evol. 4, 109–114. doi: 10.1038/s41559-019-1058-0
Kheireddine, M., Ouhssain, M., Claustre, H., Uitz, J., Gentili, B., and Jones, B. H. (2017). Assessing pigment-based phytoplankton community distributions in the Red Sea. Front. Mar. Sci. 4:132. doi: 10.3389/fmars.2017.00132
Kirkham, A. R., Lepère, C., Jardillier, L. E., Not, F., Bouman, H., Mead, A., et al. (2013). A global perspective on marine photosynthetic picoeukaryote community structure. ISME J. 7, 922–936. doi: 10.1038/ismej.2012.166
Kürten, B., Khomayis, H. S., Devassy, R., Audritz, S., Sommer, U., Struck, U., et al. (2014). Ecohydrographic constraints on biodiversity and distribution of phytoplankton and zooplankton in coral reefs of the Red Sea, Saudi Arabia. Mar. Ecol. 36, 1195–1214. doi: 10.1111/maec.12224
Lasternas, S., Agustí, S., and Duarte, C. M. (2010). Phyto-and bacterioplankton abundance and viability and their relationship with phosphorus across the Mediterranean Sea. Aquat. Microb. Ecol. 60, 175–191. doi: 10.3354/ame01421
Li, W. K. W. (1995). Composition of ultraphytoplankton in the central North Atlantic. Mar. Ecol. Progr. Ser. 122, 1–8.
Li, W. K. W. (1998). Annual average abundance of heterotrophic bacteria and Synechococcus in surface ocean waters. Limnol. Oceanogr. 43, 1746–1753.
Lindell, D., and Post, A. F. (1995). Ultraphytoplankton succession is triggered by deep winter mixing in the Gulf of Aqaba (Eilat). Red Sea. Limnol. Oceanogr. 40, 1130–1141. doi: 10.4319/lo.1995.40.6.1130
Llabrés, M., Agustí, S., Alonso-Laita, P., and Herndl, G. J. (2010). Synechococcus and Prochlorococcus cell death induced by UV radiation and the penetration of lethal UVR in the Mediterranean Sea. Mar. Ecol. Prog. Ser. 399, 27–37. doi: 10.3354/meps08332
Llabrés, M., and Agustí, S. (2006). Picophytoplankton cell death induced by UV radiation: evidence for oceanic Atlantic communities. Limnol. Oceanogr. 51, 21–29. doi: 10.4319/lo.2006.51.1.0021
Mackey, K. R., Rivlin, T., Grossman, A. R., Post, A. F., and Paytan, A. (2009). Picophytoplankton responses to changing nutrient and light regimes during a bloom. Mar. Biol. 156, 1531–1546. doi: 10.1007/s00227-009-1185-2
Manasrah, R., Abu-Hilal, A., and Rasheed, M. (2019). “Physical and chemical properties of seawater in the Gulf of Aqaba and Red Sea,” in Oceanographic and Biological Aspects of the Red Sea, eds N. M. A. Rasul and I. C. F. Stewart (Cham: Springer), 41–73.
Marañón, E. (2015). Cell size as a key determinant of phytoplankton metabolism and community structure. Annu. Rev. Mar. Sci. 7, 241–264. doi: 10.1146/annurev-marine-010814-015955
Marañón, E., Cermeño, P., López-Sandoval, D. C., Rodríguez-Ramos, T., Sobrino, C., Huete-Ortega, M., et al. (2013). Unimodal size scaling of phytoplankton growth and the size dependence of nutrient uptake and use. Ecol. Lett. 16, 371–379. doi: 10.1111/ele.12052
Mella-Flores, D., Six, C., Ratin, M., Partensky, F., Boutte, C., Le Corguillé, G., et al. (2012). Prochlorococcus and Synechococcus have evolved different adaptive mechanisms to cope with light and UV stress. Front. Microbiol. 3:285. doi: 10.3389/fmicb.2012.00285
Moore, L. R., Goericke, R., and Chisholm, S. W. (1995). Comparative physiology of Synechococcus and Prochlorococcus: influence of light and temperature on growth, pigments, fluorescence and absorptive properties. Mar. Ecol. Prog. Ser. 116, 259–275. doi: 10.3354/meps116259
Moore, L. R., Post, A. F., Rocap, G., and Chisholm, S. W. (2002). Utilization of different nitrogen sources by the marine cyanobacteria Prochlorococcus and Synechococcus. Limnol. Oceanogr. 47, 989–996. doi: 10.4319/lo.2002.47.4.0989
Moore, L. R., Rocap, G., and Chisholm, S. W. (1998). Physiology and molecular phylogeny of coexisting Prochlorococcus ecotypes. Nature 393, 464–467.
Morán, X. A. G., López-Urrutia, Á, Calvo-Díaz, A., and Li, W. K. W. (2010). Increasing importance of small phytoplankton in a warmer ocean. Global Change Biol. 16, 1137–1144. doi: 10.1111/j.1365-2486.2009.01960.x
Mouriño-Carballido, B., Hojas, E., Cermeño, P., Chouciño, P., Fernaìndez-Castro, B., Latasa, M., et al. (2016). Nutrient supply controls picoplankton community structure during three contrasting seasons in the northwestern Mediterranean Sea. Mar. Ecol. Prog. Ser. 543, 1–19. doi: 10.3354/meps11558
Overmans, S., and Agustí, S. (2019). Latitudinal gradient of UV attenuation along the highly transparent Red Sea basin. Photochem. Photobiol. 95, 1267–1279. doi: 10.1111/php.13112
Parsons, T. R., Maita, Y., and Lalli, C. M. (1984). A Manual of Chemical and Biological Methods for Seawater Analysis. New York, NY: Pergamon Press.
Partensky, F., Blanchot, J., and Vaulot, D. (1999). Differential distribution and ecology of Prochlorococcus and Synechococcus in oceanic waters: a review. Bull. Inst. Oceanogr. (Monaco Numero Special) 19, 457–476.
Partensky, F., Blanchot, J., Lantoine, F., Neveux, J., and Marie, D. (1996). Vertical structure of picophytoplankton at different trophic sites of the tropical northeastern Atlantic Ocean. Deep Sea Res. Part I. 43, 1191–1213. doi: 10.1016/0967-0637(96)00056-8
Pearman, J. K., Casas, L., Merle, T., Michell, C., and Irigoien, X. (2016). Bacterial and protist community changes during a phytoplankton bloom. Limnol. Oceanogr. 61, 198–213. doi: 10.1002/lno.10212
Pearman, J. K., Ellis, J., Irigoien, X., Sarma, Y. V. B., Jones, B. H., and Carvalho, S. (2017). Microbial planktonic communities in the Red Sea: high levels of spatial and temporal variability shaped by nutrient availability and turbulence. Sci. Rep. 7:6611. doi: 10.1038/s41598-017-06928-z
Phlips, E. J., Badylak, S., and Lynch, T. C. (1999). Blooms of the picoplanktonic cyanobacterium Synechococcus in Florida Bay, a subtropical inner-shelf lagoon. Limnol. Oceanogr. 44, 1166–1175. doi: 10.4319/lo.1999.44.4.1166
Pittera, J., Humily, F., Thorel, M., Grulois, D., Garczarek, L., and Six, C. (2014). Connecting thermal physiology and latitudinal niche partitioning in marine Synechococcus. ISME J. 8:1221. doi: 10.1038/ismej.2013.228
Poloczanska, E. S., Brown, C. J., Sydeman, W. J., Kiessling, W., Schoeman, D. S., Moore, P. J., et al. (2013). Global imprint of climate change on marine life. Nat. Clim. Change 3, 919–925. doi: 10.1038/nclimate1958
Polovina, J. J., Howell, E. A., and Abecassis, M. (2008). Ocean’s least productive waters are expanding. Geophys. Res. Lett. 35:3. doi: 10.1029/2007GL031745
Raitsos, D. E., Pradhan, Y., Brewin, R. J. W., Stenchikov, G., and Hoteit, I. (2013). Remote sensing the phytoplankton seasonal succession of the Red Sea. PLoS One 8:e64909. doi: 10.1371/journal.pone.0064909
Raven, J. A. (1998). The twelfth tansley lecture, small is beautiful: the picophytoplankton. Funct. Ecol. 12, 503–513. doi: 10.1046/j.1365-2435.1998.00233.x
Ribeiro, C. G., dos Santos, A. L., Marie, D., Pellizari, V. H., Brandini, F. P., and Vaulot, D. (2016). Pico and nanoplankton abundance and carbon stocks along the Brazilian Bight. PeerJ 4:e2587. doi: 10.7717/peerj.2587
Sawall, Y., and Al-Sofyani, A. (2015). “Biology of Red Sea corals: metabolism, reproduction, acclimatisation, and adaptation,” in The Red Sea: The Formation, Morphology, Oceanography and Environment of a Young Ocean Basin, eds N. M. A. Rasul and I. C. F. Stewart (Berlin: Springer Earth System Sciences), 487–509.
Shibl, A. A., Haroon, M. F., Ngugi, D. K., Thompson, L. R., and Stingl, U. (2016). Distribution of Prochlorococcus ecotypes in the Red Sea basin based on analyses of rpoC1 sequences. Front. Mar. Sci. 3:104. doi: 10.3389/fmars.2016.00104
Shibl, A. A., Thompson, L. R., Ngugi, D. K., and Stingl, U. (2014). Distribution and diversity of Prochlorococcus ecotypes in the Red Sea. FEMS Microb. Lett. 356, 118–126. doi: 10.1111/1574-6968.12490
Signorini, S. R., Franz, B. A., and McClain, C. R. (2015). Chlorophyll variability in the oligotrophic gyres: mechanisms, seasonality and trends. Front. Mar. Sci. 2:1. doi: 10.3389/fmars.2015.00001
Silva, L., Calleja, M. L., Huete-Stauffer, T. M., Ivetic, S., Ansari, M. I., Viegas, M., et al. (2018). Low abundances but high growth rates of coastal heterotrophic bacteria in the Red Sea. Front. Microbiol. 9:3244–3244. doi: 10.3389/fmicb.2018.03244
Simmons, M. P., Sudek, S., Monier, A., Limardo, A. J., Jimenez, V., Perle, C. R., et al. (2016). Abundance and biogeography of picoprasinophyte ecotypes and other phytoplankton in the Eastern North Pacific Ocean. Appl. Environ. Microbiol. 82, 1693–1705. doi: 10.1128/AEM.02730-15
Stambler, N. (2005). Bio-optical properties of the northern Red Sea and the Gulf of Eilat (Aqaba) during winter 1999. J. Sea Res. 54, 186–203. doi: 10.1016/j.seares.2005.04.006
Stockner, J. G. (1988). Phototrophic picoplankton: An overview from marine and freshwater ecosystems. Limnol. Oceanogr. 33, X5–X775. doi: 10.4319/lo.1988.33.4part2.0765
Thomas, M. K., Kremer, C. T., Klausmeier, C. A., and Litchman, E. (2012). A global pattern of thermal adaptation in marine phytoplankton. Science 338, 1085–1088. doi: 10.1126/science.1224836
Tittensor, D. P., Mora, C., Jetz, W., Lotze, H. K., Ricard, D., Berghe, E. V., et al. (2010). Global patterns and predictors of marine biodiversity across taxa. Nature 466, 1098–1101. doi: 10.1038/nature09329
Török, P., Krasznai, E., Bácsiné Béres, V., Bácsi, I., Borics, G., and Tóthmérész, B. (2016). Functional diversity supports the biomass-diversity humped-back relationship in phytoplankton assemblages. Funct. Ecol. 30, 1593–1602. doi: 10.1111/1365-2435.12631
Várbíró, G., Görgényi, J., Tóthmérész, B., Padisák, J., and Hajnal, É, and Borics, G. (2017). Functional redundancy modifies species–area relationship for freshwater phytoplankton. Ecol. Evol. 7, 9905–9913. doi: 10.1002/ece3.3512
Veldhuis, M. J., and Kraay, G. W. (1993). Cell abundance and fluorescence of picoplankton in relation to growth irradiance and nitrogen availability in the Red Sea. Neth. J. Sea Res. 31, 135–145. doi: 10.1016/0077-7579(93)90003-B
Wassmann, P., Duarte, C. M., Agustí, S., and Sejr, M. K. (2011). Footprints of climate change in the Arctic marine ecosystem. Global Change Biol. 17, 1235–1249.
Weikert, H. (1987). “Plankton and the pelagic environment,” in Key Environments: Red Sea, eds A. J. Edwards and S. M. Head (Oxford: Pergamon Press), 90–111.
Winder, M. (2009). Photosynthetic picoplankton dynamics in Lake Tahoe: temporal and spatial niche partitioning among prokaryotic and eukaryotic cells. J. Plankton Res. 31, 1307–1320. doi: 10.1093/plankt/fbp074
Xiao, W., Wang, L., Laws, E., Xie, Y., Chen, J., Liu, X., et al. (2018). Realized niches explain spatial gradients in seasonal abundance of phytoplankton groups in the South China Sea. Progr. Oceanogr. 162, 223–239. doi: 10.1016/j.pocean.2018.03.008
Ziegler, M., Roik, A., Röthig, T., Wild, C., Rädecker, N., Bouwmeester, J., et al. (2019). “Ecophysiology of reef-building corals in the Red Sea,” in Coral Reefs of the Red Sea, eds C. R. Voolstra and M. L. Berumen (Cham: Springer), 33–52.
Zubkov, M. V., Fuchs, B. M., Tarran, G. A., Burkill, P. H., and Amann, R. (2003). High rate of organic nitrogen compounds by Prochlorococcus cyanobacteria as a key to their dominance in oligotrophic oceanic waters. Appl. Environ. Microbiol. 69, 1299–1304. doi: 10.1128/AEM.69.2.1299-1304.2003
Zubkov, M. V., Sleigh, M. A., Tarran, G. A., Burkill, P. H., and Leakey, R. J. (1998). Picoplanktonic community structure on an Atlantic transect from 50°N to 50°S. Deep Sea Res. Part I 45, 1339–1355.
Zwirglmaier, K., Jardillier, L., Ostrowski, M., Mazard, S., Garczarek, L., Vaulot, D., et al. (2008). Global phylogeography of marine Synechococcus and Prochlorococcus reveals a distinct partitioning of lineages among oceanic biomes. Environ. Microb. 10, 147–161. doi: 10.1111/j.1462-2920.2007.01440.x
Keywords: picophytoplankton, realized niches, Red Sea, warming, Synechococcus, Prochlorococcus, picoeukaryotes
Citation: Coello-Camba A and Agustí S (2021) Picophytoplankton Niche Partitioning in the Warmest Oligotrophic Sea. Front. Mar. Sci. 8:651877. doi: 10.3389/fmars.2021.651877
Received: 11 January 2021; Accepted: 31 March 2021;
Published: 29 April 2021.
Edited by:
Jacob Carstensen, Aarhus University, DenmarkReviewed by:
Michael William Lomas, Bigelow Laboratory For Ocean Sciences, United StatesLumi Haraguchi, Finnish Environment Institute (SYKE), Finland
Paul Berube, Massachusetts Institute of Technology, United States
Copyright © 2021 Coello-Camba and Agustí. This is an open-access article distributed under the terms of the Creative Commons Attribution License (CC BY). The use, distribution or reproduction in other forums is permitted, provided the original author(s) and the copyright owner(s) are credited and that the original publication in this journal is cited, in accordance with accepted academic practice. No use, distribution or reproduction is permitted which does not comply with these terms.
*Correspondence: Alexandra Coello-Camba, YWxleGFuZHJhLmNhbWJhQGthdXN0LmVkdS5zYQ==