 Jisu Yeom
 Nayeon Park
 Raehyuk Jeong
 Wonchoel Lee
94% of researchers rate our articles as excellent or good
Learn more about the work of our research integrity team to safeguard the quality of each article we publish.
Find out more
ORIGINAL RESEARCH article
Front. Mar. Sci., 07 May 2021
Sec. Marine Evolutionary Biology, Biogeography and Species Diversity
Volume 8 - 2021 | https://doi.org/10.3389/fmars.2021.648197
This article is part of the Research TopicBiodiversity and Distribution of Benthic Invertebrates - From Taxonomy to Ecological Patterns and Global ProcessesView all 16 articles
MALDI Time-of-Flight Mass Spectrometry (MALDI-TOF MS) provides a fast and reliable alternative method for species-level identification of pathogens and various metazoans. Compared to the commonly used mitochondrial cytochrome c oxidase subunit I (mtCOI) barcoding, advantages of MALDI-TOF MS are rapid species identifications and low costs. In this study, we used MALDI-TOF MS to determine whether spectra patterns of different species can be used for species identification. We obtained a total of 138 spectra from individual specimens of Tigriopus, which were subsequently used for various cluster analyses. Our findings revealed these spectra form three clear clusters with high AU value support. This study validates the viability of MALDI-TOF MS as a methodology for higher-resolution species identification, allowing detection of cryptic species of harpacticoida. In addition, we propose a new species, Tigriopus koreanus sp. nov. by utilizing integrative methods such as morphological comparison, mtCOI barcoding, and MALDI-TOF MS.
Intertidal copepods of the genus Tigriopus Norman, 1869 are widely distributed in high-shore intertidal rockpools across several continents (Tsuboko-Ishii and Burton, 2018). The genus consists of 17 species and is known to be easily bred under laboratory conditions, as it tolerates abrupt changes in environmental factors such as temperature and salinity (Kwok and Leung, 2005). Tigriopus californicus (Baker, 1912), a well-known representative of the genus, shows extensive population divergence and is a model for understanding allopatric speciation (Barreto et al., 2018). Reproductive isolation and molecular information have confirmed cryptic speciation in T. californicus (Peterson et al., 2013), but it remains unresolved.
Similarly, Tigriopus, which can be found also in the coast of Korea, is represented by T. japonicus Mori, 1938 and has been the subject study of several contributions. However, it has long been recognized that the Korean populations of T. japonicus are molecularly different from those of Japan (e.g., Jung et al., 2006; Ki et al., 2009).
In Karanovic et al. (2018), it was shown that the populations of T. japonicus inhabiting Korean coasts are actually two different species: Tigriopus west Karanovic et al., 2018 and Tigriopus east Karanovic et al., 2018. These three species are morphologically similar, making it nearly impossible to separate them through optical microscopy. Their cryptic nature was unraveled by Karanovic et al. (2018) through molecular and morphological comparisons. For morphological comparison, they selected landmarks on somitic sensilla and segments of different appendages, which were used for two-dimensional geometric morphometrics. In addition, average Kimura 2-parameter (K2P) pairwise distance of mtCOI partial sequences between the two Korean species were revealed to be 0.226, confirming that Tigriopus in the west-south coasts and east coasts of Korea are two different species.
MALDI-TOF MS (Matrix-Assisted Laser Desorption/Ionization Time of Flight Mass Spectrometry) initially hits the sample with a pulsed laser to ionize it. This procedure is known as laser desorption ionization. Using a matrix—which is a small material that can absorb laser wavelengths—the sample collapses when the temperature of the sample-matrix rises rapidly by absorption of the laser. Fundamentally, MALDI is an ionization technique that uses a laser energy absorbing matrix to emit ions from large molecules with minimal fragmentation (Hillenkamp et al., 1991). The protein mass is analyzed with a TOF analyzer that measures the flight time of the ion emitted.
The representative protein spectra obtained by MALDI-TOF MS are used as a kind of barcode that can distinguish different species. This identification method was initially used for the identification of species of bacteria, fungi, and viruses (e.g., Claydon et al., 1996; Fenselau and Demirev, 2001), and is still widely used (e.g., Seng et al., 2010; Chalupová et al., 2014; Singhal et al., 2015). In addition, MALDI-TOF MS has been used for species identification of microalgae (Baumeister et al., 2020), microorganisms (Maier et al., 2006) and various metazoan taxa including insects (Feltens et al., 2010), fish (Volta et al., 2012; Shao and Bi, 2020), and calanoid copepods (Riccardi et al., 2012; Laakmann et al., 2013; Bode et al., 2017). Previous studies with several taxa as study subjects confirmed that MALDI-TOF MS is a reliable and fast alternative method for species identification.
Recently, Rossel and Martínez Arbizu (2019) suggested that the identification of species through protein mass measurement is a faster and cheaper method compared to mtCOI barcoding. In general, barcoding takes at least a day or more to obtain the sequencing result following DNA extraction of the target organism, and additional hours to complete PCR, electrophoresis, and purification. Most importantly, barcoding method varies highly in success rates depending on the primer sets used and requires prior knowledge on the target organism to find a suitable primer set. On the other hand, the protein spectrum used for MALDI-TOF MS can be obtained immediately by incubating the individual in a matrix for several minutes after drying the sample and measuring it with a MALDI-TOF MS machine. Rossel and Martínez Arbizu (2019) argued that the results could be obtained relatively quickly, at a lower cost. They (Rossel and Martínez Arbizu, 2019) used MALDI-TOF for the assessment of 75 species and confirmed that cryptic species Leptastacus can be separated using this approach (Rossel et al., 2019). In this study, we used MALDI-TOF MS to obtain spectra of Tigriopus from Korea and determine whether their varying peaks can be used to detect and differentiate cryptic species. In addition, a new species of Tigriopus is proposed based on approaches such as mtCOI barcoding, clustering of protein spectra, and morphological comparative analysis.
Specimens of Tigriopus inhabiting intertidal rock pools were collected with a spuit at seven different coastal areas of Korea (Figure 1 and Table 1) and brought to the laboratory in plastic container with seawater. In the absence of other animals, specimens of Tigriopus were kept alive in a 20°C incubator under a photoperiod of 12 h light: 12 h dark, for 2–3 months after being brought to the laboratory. As food source for copepods, a small amount of Tetra Bits was provided.
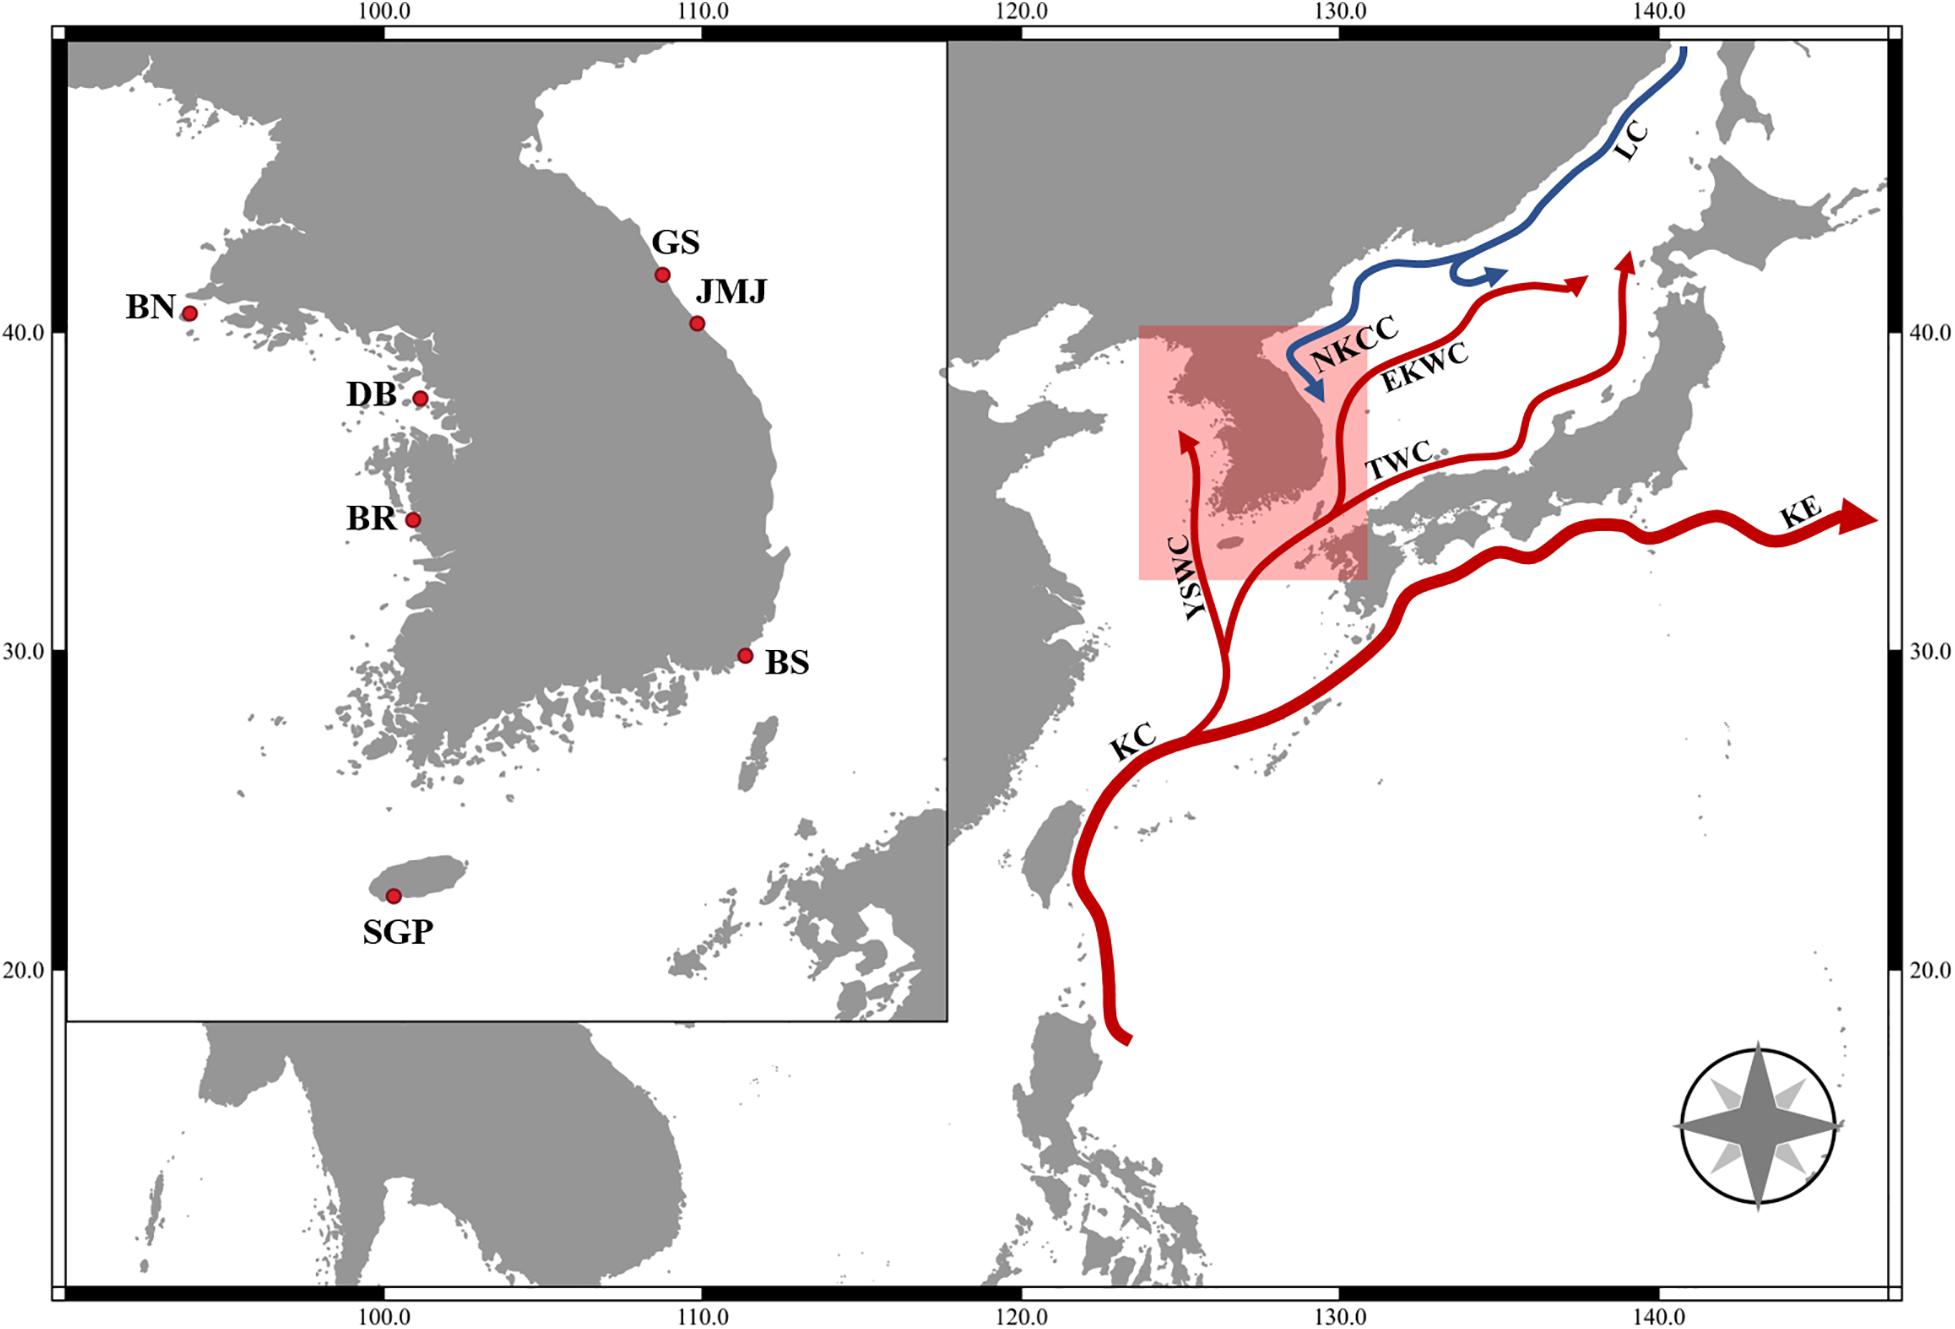
Figure 1. Map of collecting locations. BN, Gobong port, Baengnyeong island, Incheon; BR, Daecheon beach, Boryeong; SGP, Daepyeong port, Seogwipo, Jeju island; JMJ, Jumunjin, Gangneung, Gangwon; BS, Gijang, Busan; GS, Munam, Goseong, Gangwon; DB, Bangameori beach, Daebu island, Ansan; KC, Kuroshio Current; KE, Kuroshio Extension; LC, Liman Current; NKCC, North Korea Cold Current; EKWC, East Korea Warm Current; TWC, Tsushima Warm Current; YSWC, Yellow Sea Warm Current.
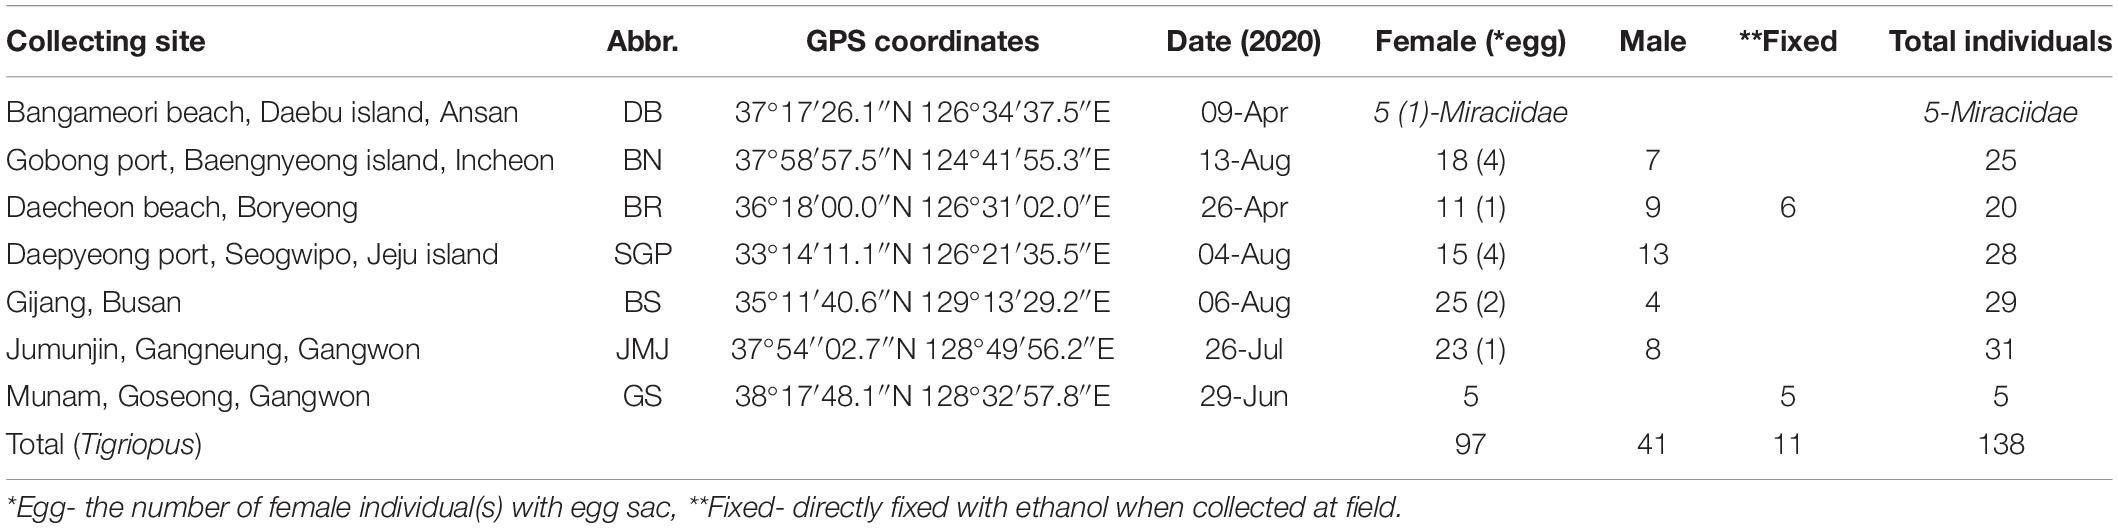
Table 1. Collecting information and the number of harpacticoids by region used in the MALDI-TOF MS experiment.
Several individuals of Tigriopus were sorted under a dissecting microscope and stored in 99% ethyl alcohol. The descriptive terminology of Huys et al. (1996) was adopted. Abbreviations used in the text are as follows: Mxp, maxilliped; exp, exopod; enp, endopod; P1–P5, first to fifth thoracopod; exp (enp)-1 (2, 3) to denote the proximal (middle, distal) segment of a three-segmented ramus. BN, Baengnyeong island; DB, Daebu island; BR, Boryeong; SGP, Seogwipo; BS, Busan; JMJ, Jumunjin; GS, Goseong.
For morphological observation, slides were prepared using the sandwich method of 20 adult females of each species (total 60 individuals). Figure works for morphological comparison of each appendage (Mxp, P1 enp-1, P1 enp-2, P4 exp-3, P5 exp) were completed through observation at 400x magnification with an Olympus BX51 differential interference contrast microscope equipped with a drawing tube. First, length of each segment was measured to calculate the length/width ratio. Based on the ratio, analyses were conducted to compare the differences between the mean of the three species in SPSS. Normal distribution was tested, and while some Mxp’s data were below significance, because the number of samples was sufficient, the data were kept for analysis. In addition, Bonferroni correction was performed, and ANOVA test determined which features showed significant morphological differences between species (p < 0.05).
In total, 18 specimens from BS were prepared for Scanning electron microscopy (SEM). For SEM preparation, specimens were transferred into hexamethyldisilazane (HMDS) for drying (Shively and Miller, 2009), mounted on stubs, and finally coated with gold in an ion coater, SPT-20 (COXEM, Korea). Coated stub was observed under SEM on the in-lens detector at an accelerating voltage of 15.0 Kv. The specimens were photographed using a COXEM EM-30 SEM at the Biodiversity laboratory in Hanyang University. Digital photographs were processed and combined into plates using Adobe Photoshop CS6.
Total of 143 individual harpacticoids (138 Tigriopus and 5 Schizopera) were transferred to a 6-well plate a day before and fasted. On the day of the experiment, copepods were fixed in 99% ethyl alcohol for approximately 30 min, and then transferred to a 1.5 ml tube containing small amount of ethyl alcohol (0.5 μl). Once all ethyl alcohol in the tube evaporated, leaving the copepod in completely dried state, 4 μl of α-Cyano-4-hydroxy-cinnamic acid (HCCA) matrix [Acetonitrile 50%; U.P. Water 47.5%; Trifluoroacetic acid 2.5%; supersaturated HCCA (30 mg for total 1 ml matrix)] was added to each tube and incubated at room temperature for at least 20 min.
Two microliter of this solution was placed on the target plate of the MALDI-TOF MS equipment (AXIMA Confidence MALDI TOF—Mass Spectrometer; Shimadzu) and once the solution dried completely to crystalize, the plate was placed in the instrument to be analyzed.
Protein mass spectra were measured between 2k to 20k Dalton on a MALDI-MS Application Launchpad 2.9.2 (Shimadzu Biotech) software using linear mode with laser power 80. To create a sum spectrum, 150 profiles were summed up. Each profile was measured 10 times, and the obtained individual protein spectra were exported to ASCII format files after range editing in Data Explorer (TM) software version 4.3.
The ASCII files were imported to RStudio using the R package MALDIquantForeign (ver. 0.12) (Gibb, 2015) and the subsequent data processing and analysis of the data was achieved using MALDIquant (ver. 1.19.3) (Gibb and Strimmer, 2012) and MALDIrppa (ver. 1.0.5) (Palarea-Albaladejo et al., 2018). For general methods to obtain the featureMatrix mentioned below, we referred to Species Identification using MALDIquant manual1.
The range of all protein mass spectra were trimmed to 2,000–15,000 m/z. We conducted a basic quality control with raw data and tested whether all spectra contain the same number of data points and are not empty before overall analysis. Spectra were square root transformed and smoothed with the Savitzky-Golay method. The baseline was removed based on SNIP baseline estimation method and spectra were normalized using the Total-Ion-Current-calibration (TIC) method implemented in MALDIquant. Peak detection was applied with a signal-to-noise ratio (SNR) of 8 and a half window size of 18. Peaks were repeatedly binned with the “binpeaks” command from MALDIquant with a tolerance of 0.002. Through this process a feature matrix was created, which was then Hellinger transformed for further analysis. Results of the Hellinger transformed matrix were visualized through clustering analysis, diagonal discriminant analysis (DDA), and non-metric multi-dimensional scaling analysis.
Cluster analysis was performed using 138 spectra of data obtained from adult individuals of Tigriopus. Dendrogram was produced with pvclust (ver. 2.2) R package (Suzuki and Shimodaira, 2006) using Ward’s 2D clustering algorithm with Euclidean distances and 10,000 bootstrapping replications. Approximately unbiased (AU) p-value and bootstrap probability (BP) values were provided alongside the dendrogram, of which AU values of ≥ 85% were considered strong evidence of a cluster for the analysis.
Non-Metric Multidimensional Scaling Plot (NMDS) was generated with the vegan (ver. 2.5.6) R package (Oksanen et al., 2018) based on Bray-Curtis Dissimilarity distance with k = 2. To test multivariate homogeneity of group dispersion, ANOVA test was performed utilizing betadisper function provided with the vegan (ver. 2.5.6) package. PERMANOVA test was also performed using Adonis tool to test the fit of the data with 999 permutations.
Diagonal discriminant analysis (DDA) was performed using Hellinger transformed featurematrix with sda (Ahdesmäki and Strimmer, 2010) function to find peaks with the highest variation among three different species. Total of 196 variables, 138 observations and 3 classes (species) were used to compute t-score for feature ranking. Figure 6 was generated by peakPatterns function in MALDIrppa (ver. 1.0.5). Peaks were filtered with minimum frequency of 0.7.
For DNA extraction and amplification, specimens were transferred to a well of ultrapure water for 2 h to remove ethanol or seawater. Non-destructive DNA extraction was then carried out by utilizing worm lysis buffer (Williams et al., 1992). Specimens were transferred to microcentrifuge tubes containing 25 μl lysis buffer and placed in a Takara thermocycler (Takara, Otsu, Shiga, Japan) with the following settings: 65°C for 15 min, 95°C for 20 min and 15°C for 2 min. After this, specimens were kept for morphological identification. Unpurified total DNA was kept at −20°C for long-term storage.
MtCOI genes were amplified using PCR premix (LaboPass, COSMOgenetech, Korea) and 3 μl of DNA template with Cop-COI-2189 and jgLCO or LCO1490 primers (Bucklin et al., 2010). The amplification protocol consisted of an initial denaturation at 94°C for 5 min followed by 40 cycles of denaturation at 94°C for 1 min, annealing at 45°C for 2 min, and extension at 72°C for 3 min; this was followed by a final extension step at 72°C for 10 min (Bucklin et al., 2010). Successful amplification was confirmed by electrophoresis on a 1% agarose gel. PCR products were sent to Bionics (Seoul, Korea) for purification and DNA sequencing. For sequencing, an ABI automatic capillary sequencer was used with the same set of primers used for amplification. All obtained sequences were visualized using Finch TV (ver. 1.4.0)2 (Geospiza Inc., United States). The quality of each sequence was evaluated, and low-resolution peaks were checked by comparing forward and reverse strands. BLAST search confirmed the obtained sequences as copepods without contaminants. Sequence information from this study was deposited in the NCBI database (MW429840–MW429844).
Thirty two additional sequences were downloaded from GenBank and included in our analyses (Supplementary Table 1). Sequences were aligned with the ClustalW algorithm (Thompson et al., 1994) in MEGA version 7.0 (Kumar et al., 2016). Average pairwise distances were also computed in MEGA version 7.0 using the K2P model. Phylogenetic analyses were performed using Neighbor-Joining (NJ), Maximum parsimony (MP), Maximum Likelihood (ML), and Bayesian Inference (BI) approaches.
NJ analysis used the Kimura two-parameter model (K2P) (Kimura, 1980; Nei and Kumar, 2000) with uniform rates. ML analysis used the TrN + I + G model based on the model test result in jModelTest 2.1.10 (Darriba et al., 2012). 1,000 bootstrap replicates were performed to obtain a relative measure of node support for the resulting trees. A BI tree was constructed with MrBayes (ver. 3.2.6) (Ronquist et al., 2012) based on the following model parameters obtained using jModelTest 2.1.10: nst = 6, rates = gamma, ncat = 4, Lset base = (0.2320, 0.1835, 0.2216, 0.3629), rmat = (1, 6.9644, 1, 1, 12.3900, 1), gamma shape = 0.7700 and pinvar = 0.4730. Markov Chain Monte Carlo (MCMC) was run with the following parameters: nchains = 4, ngen = 1,000,000, samplefreq = 100, savebrlens = yes, and printfreq = 1,000. The BI trees were constructed using the “sump” command with burnin = 250 to summarize parameters and the “sumt” command with burnin = 250 to summarize the tree. ML and BI trees were visualized using FigTree (ver. 1.4.2). Average pairwise distances were also computed in MEGA version 7.0 using the K2P model. All trees were rooted with Calanus glacialis sequence.
Spectra data obtained from a total of 138 Tigriopus and 5 Miraciidae specimens were used for the analysis (Table 1). In the protein spectra obtained from raw data (Figure 2), the x-axis represents protein mass, and the y-axis is intensity, showing how much protein is present for each mass value corresponding to the x-axis. Similar spectra peak patterns were observed among species collected from the same region. Prominent peak values were also confirmed to be similar by region. Protein spectra pattern did not seem to differ by body parts (prosome/urosome), or by sex (Figure 2). Presence of eggs did not seem to effect ability to obtain spectra. Even specimens fixed in 99% ethyl alcohol stored at 4°C for several months yielded spectra without a problem (Table 1, marked with “-fix”), but when only female egg sacs were used for the analysis, accurate protein spectra data could not be obtained.
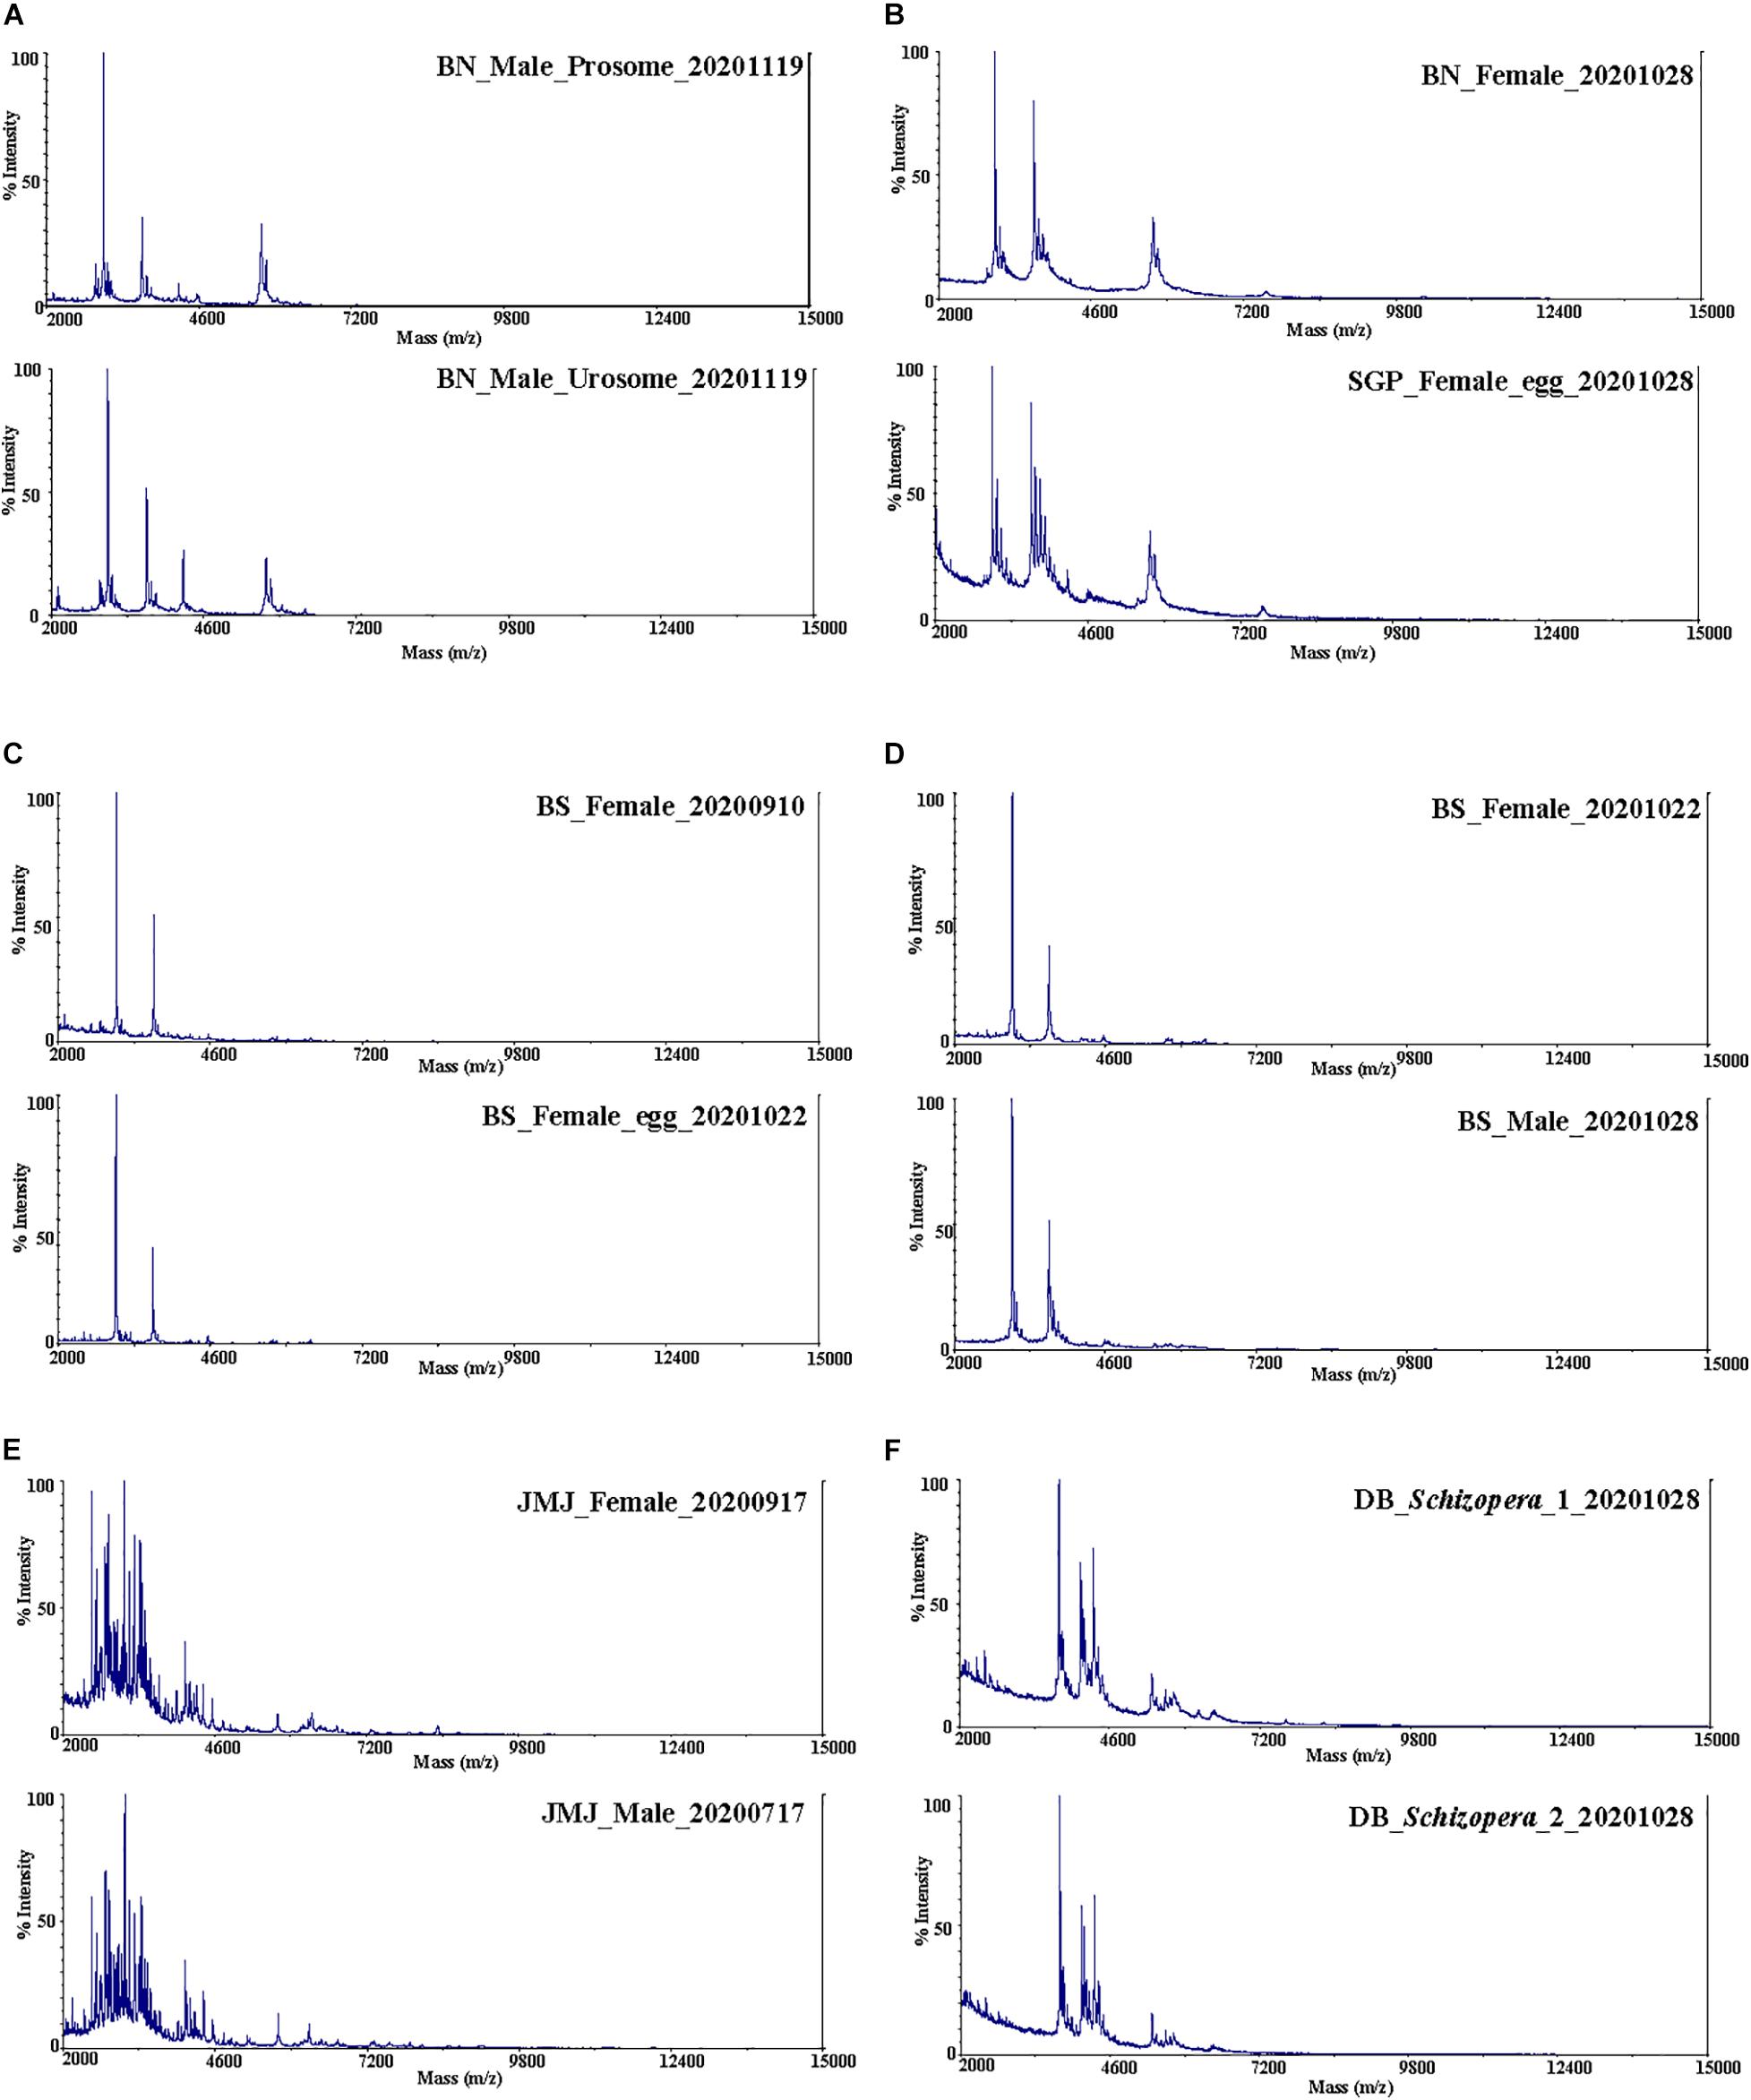
Figure 2. Protein mass spectra. T. west (A,B); (A) prosome and urosome, (B) BN and SGP. T. koreanus sp. nov. (C,D); (C) female and female with egg sac, (D) female and male. (E) T. east female and male, (F) Schizopera sp.
Cluster analysis of 138 adult individuals of Tigriopus collected from six different regions in Korea are shown in Figure 3. Analysis using Hellinger transformed matrix confirm that species are divided into three clusters (Busan, T. east and T. west) with fairly strong support (AU p-values = 91, 84, and 92%, respectively). Of the two p-values, AU is considered to be superior to BP in terms of bias by using multiscale bootstrap resampling as opposed to ordinary bootstrap resampling (Suzuki and Shimodaira, 2006).
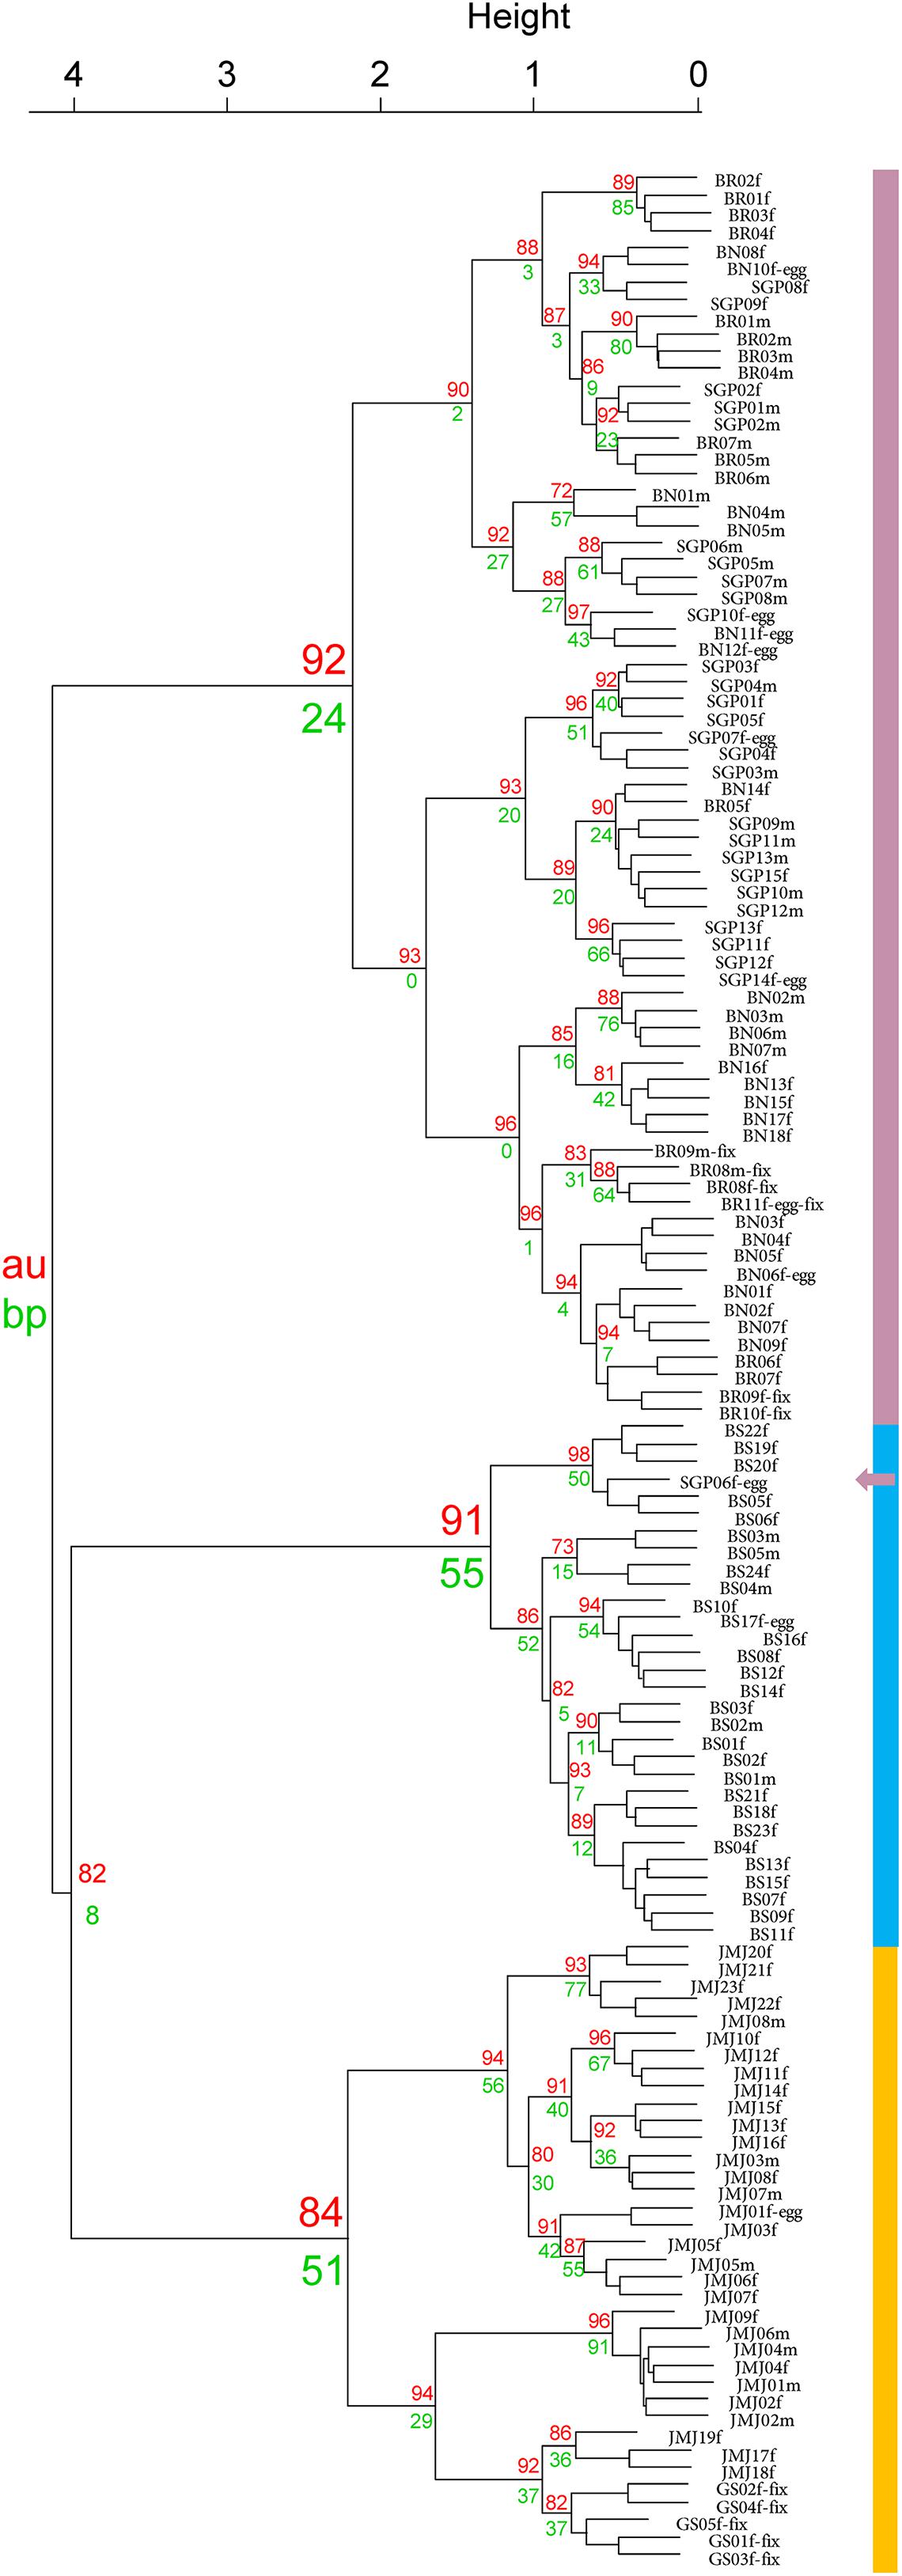
Figure 3. Cluster dendrogram with p-values (%). Purple—T. west/Blue—T. koreanus/Orange—T. east.
It is worth mentioning that clustering analysis was attempted with both raw spectra feature matrix as well as Hellinger transformed matrix. Results from the Hellinger transformed matrix yielded a dendrogram with higher AU and BP values. While optimal combination of data transformation has been documented by Rossel and Martínez Arbizu (2018), they recommended Hellinger transformed data in most cases. Other MALDI-TOF MS studies conducted on copepods also utilized Hellinger transformed datasets (Rossel and Martínez Arbizu, 2018; Rossel et al., 2019).
The indication of a third new species of the cryptic species Tigriopus spp. is further supported below via NMDS analysis.
Non-Metric Multi-Dimensional Scaling (NMDS) analysis of all 138 spectra of Tigriopus used in the experiment are shown in Figure 4. This is the result of visualizing a two-dimensional space by measuring similarities between spectra.
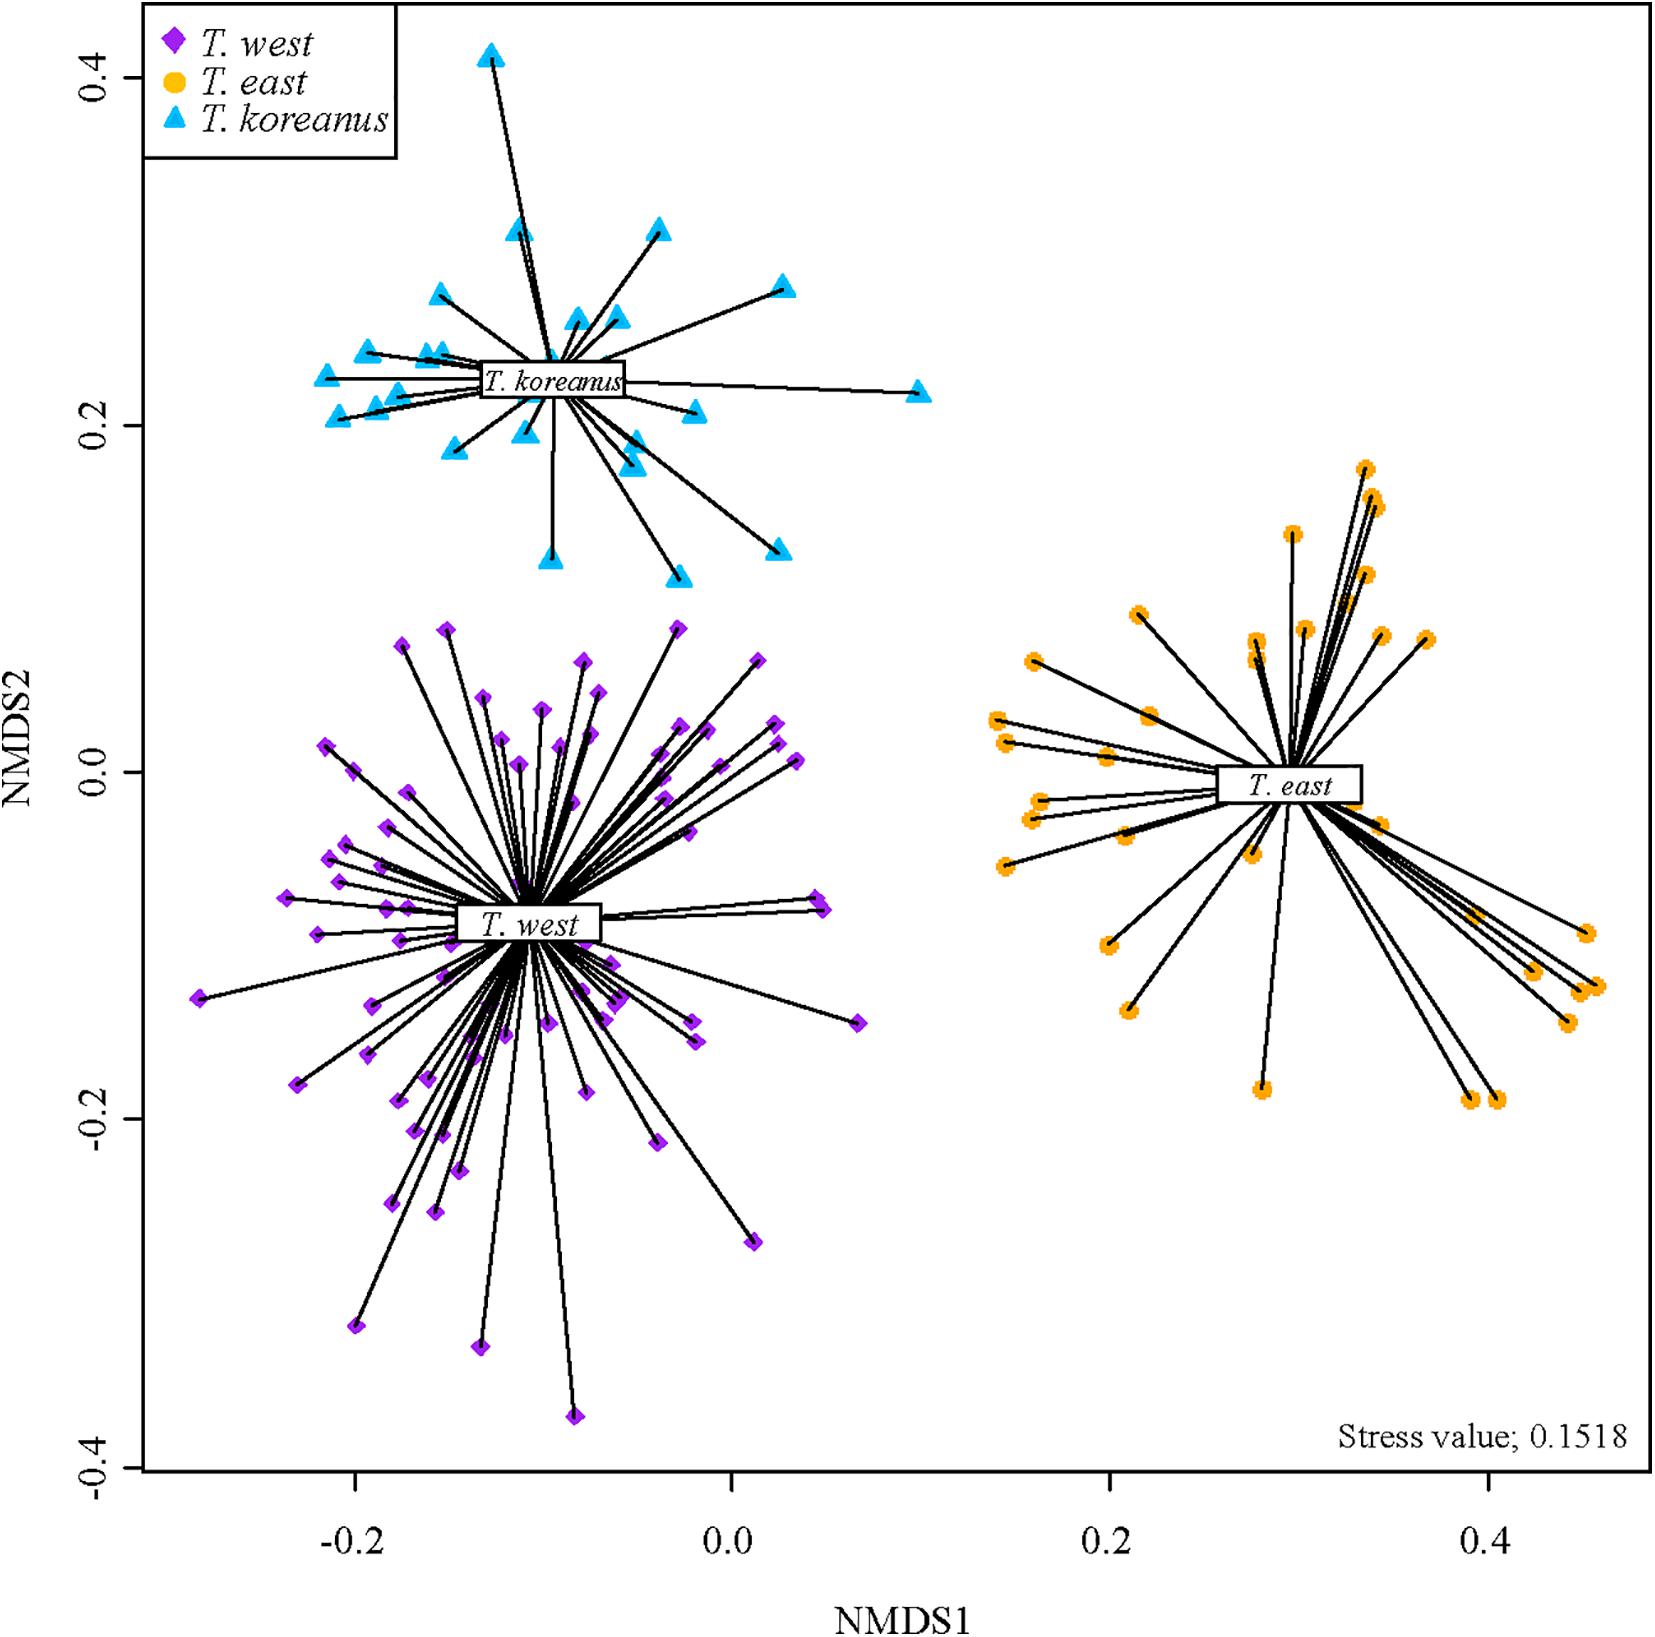
Figure 4. NMDS plot of 138 Tigriopus spectra from Hellinger transformed matrix.
In the West Sea cluster, spectra from Jeju, Boryeong, and Baengnyeong island are mixed. Based on this, all of them are T. west, although there is a considerable geographical difference between Baengnyeong island and Jeju. In addition, it was confirmed that only the Busan cluster was gathered separately above. Therefore, it was determined that Tigriopus in six regions in Korea were divided into three groups.
It is quite clear from the NMDS plot that three groups are visibly distinguishable from one another (homogeneity test, P < 0.05, PERMANOVA test, P = 0.001). Stress value of this plot was 0.1518 which is in usable range according to Clarke (1993), who suggested stress value < 0.20 to be usable. Considering that our dataset contains 138 samples of different variables, and since stress value increases with the number of samples and variables, the stress value of 0.15 is quite acceptable.
In Figure 5, the numbers on the left show top 40 protein masses that differed greatly among species. Simply put, in the case of T. koreanus sp. nov., they have a relatively large amount of 2,986−2,988 m/z compared to the other species, followed by T. west with a relatively large amount of 2,958 m/z. Such inferring peaks with high variation among different species can thus be considered when delimitating Korean species of Tigriopus. Figure 6 illustrates variation in important peaks shown in Figure 5. It is evident individuals exhibit similar peak patterns for each species. The parts not marked in blue mean that they are the peaks below the SNR criteria and have lower intensity compared to other species.
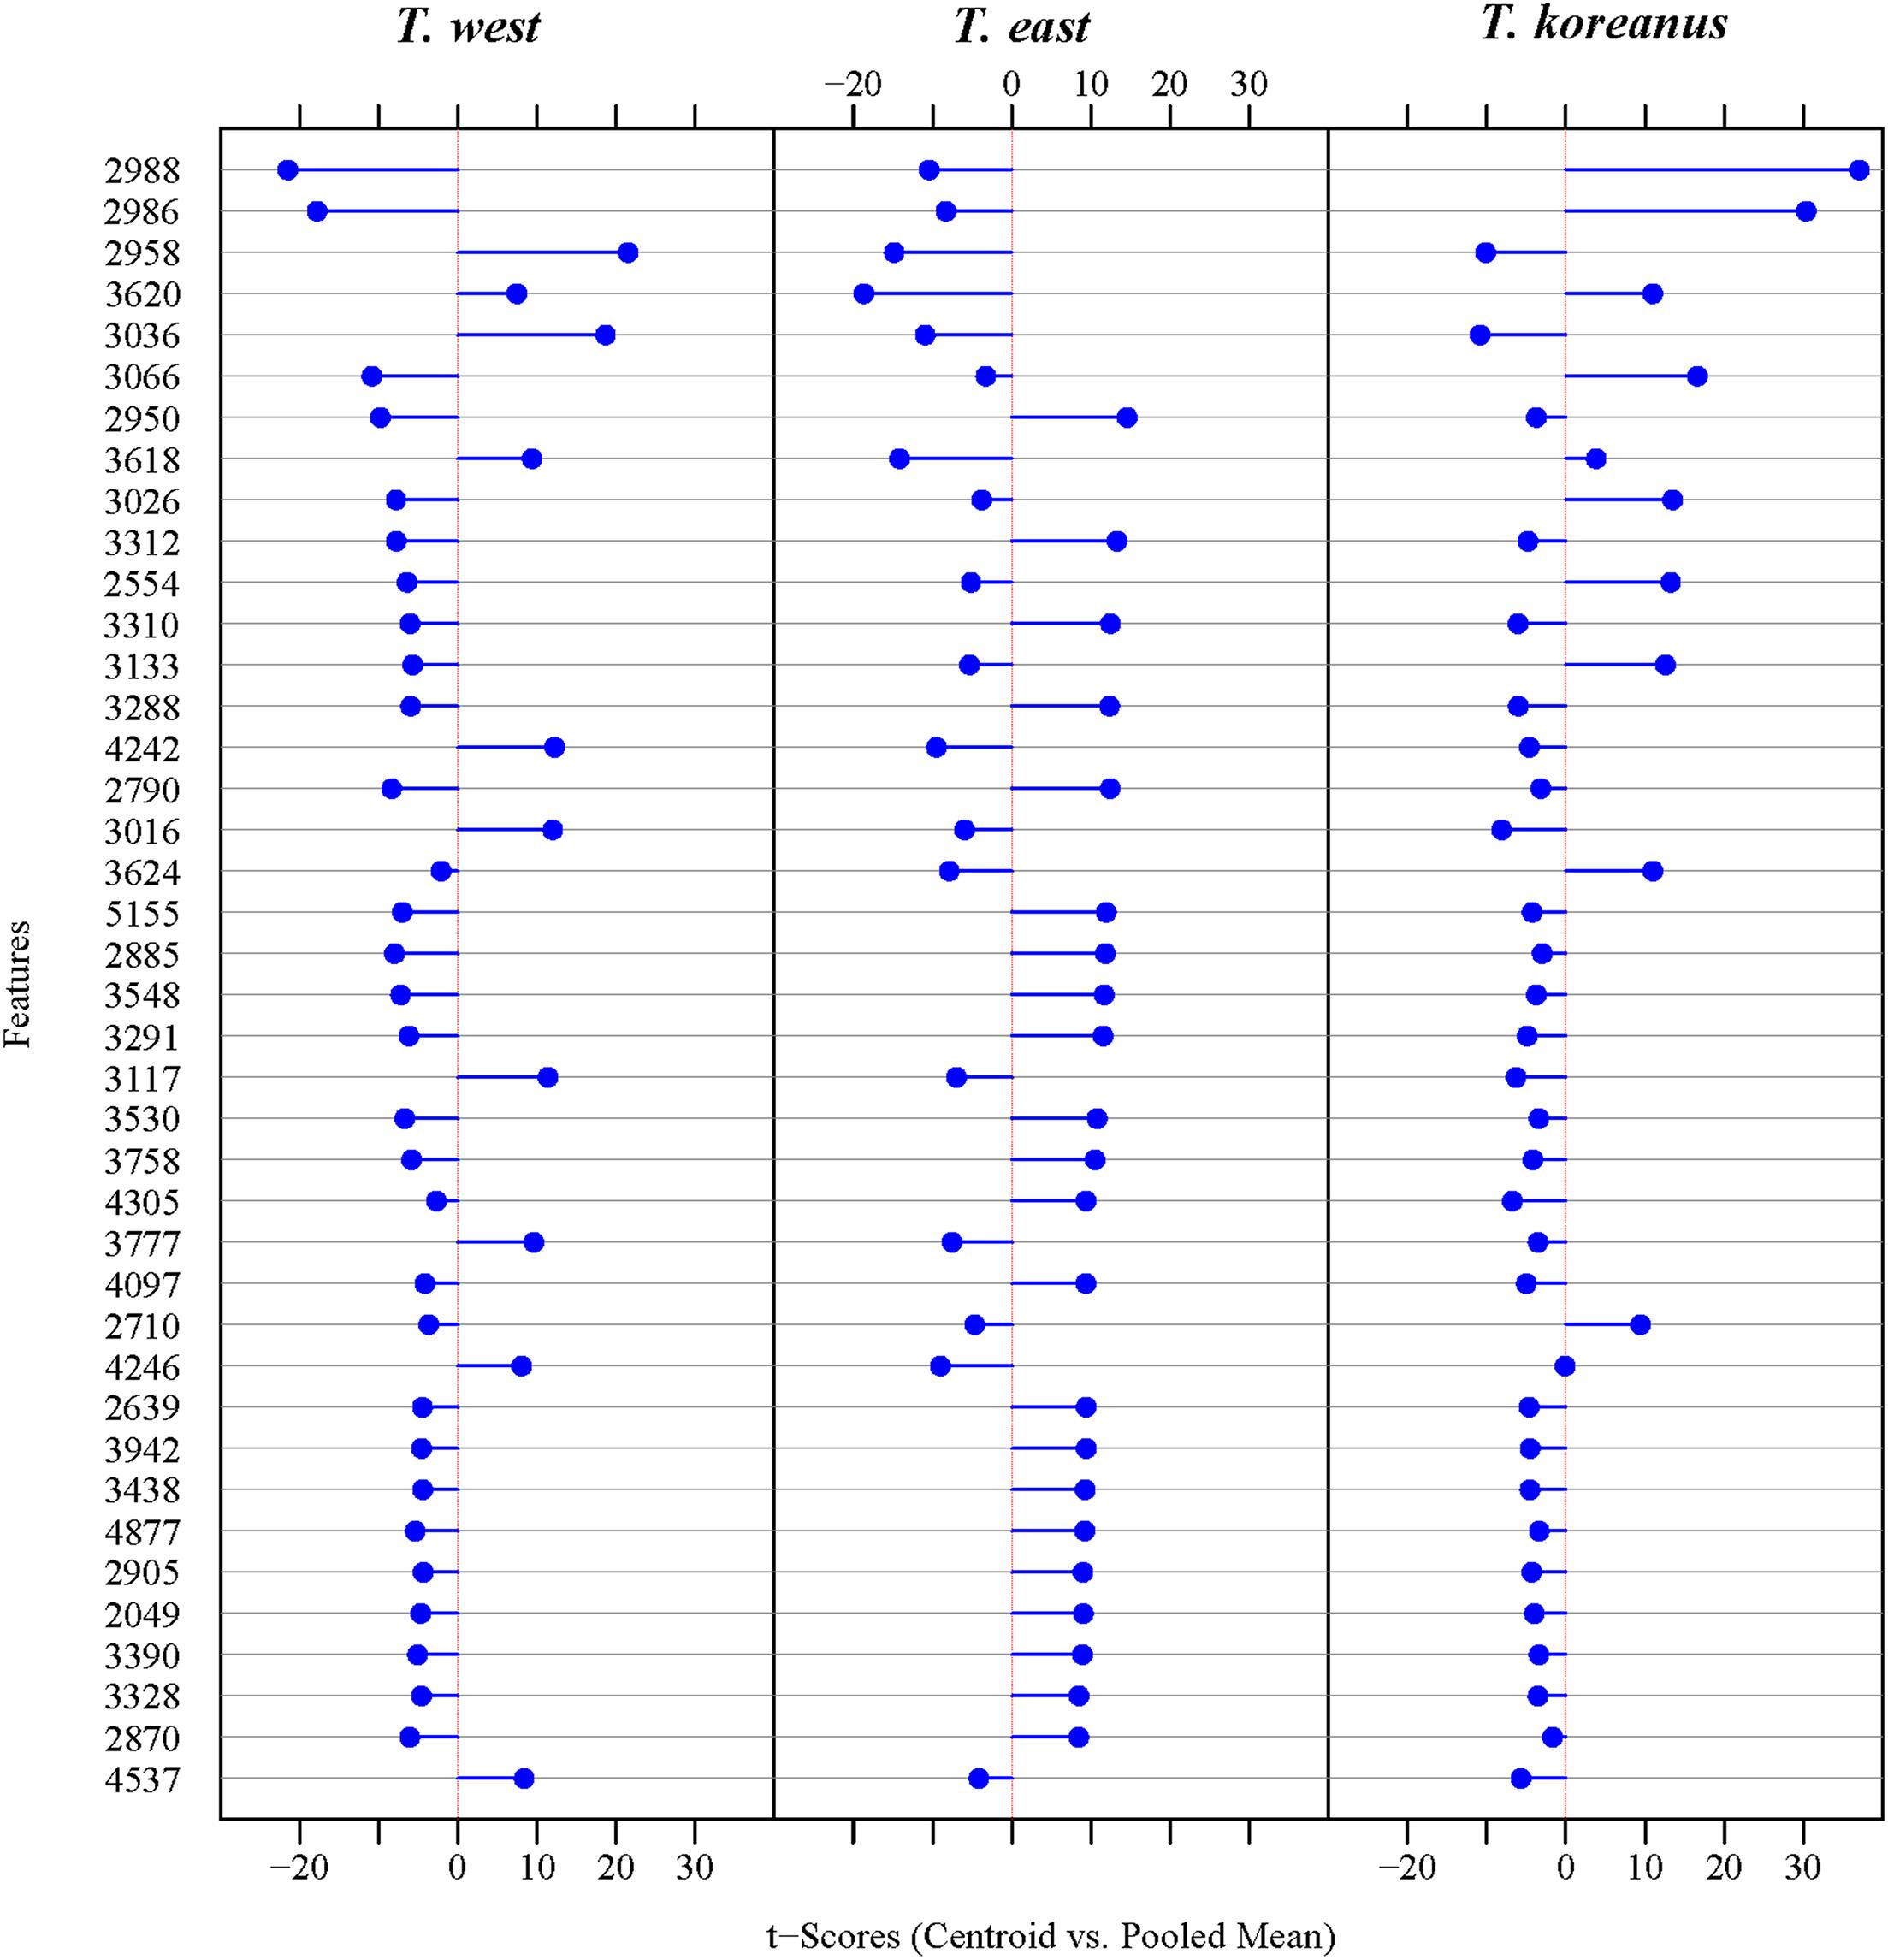
Figure 5. Diagonal discriminant analysis for protein mass. (The 40 Ranking Features).
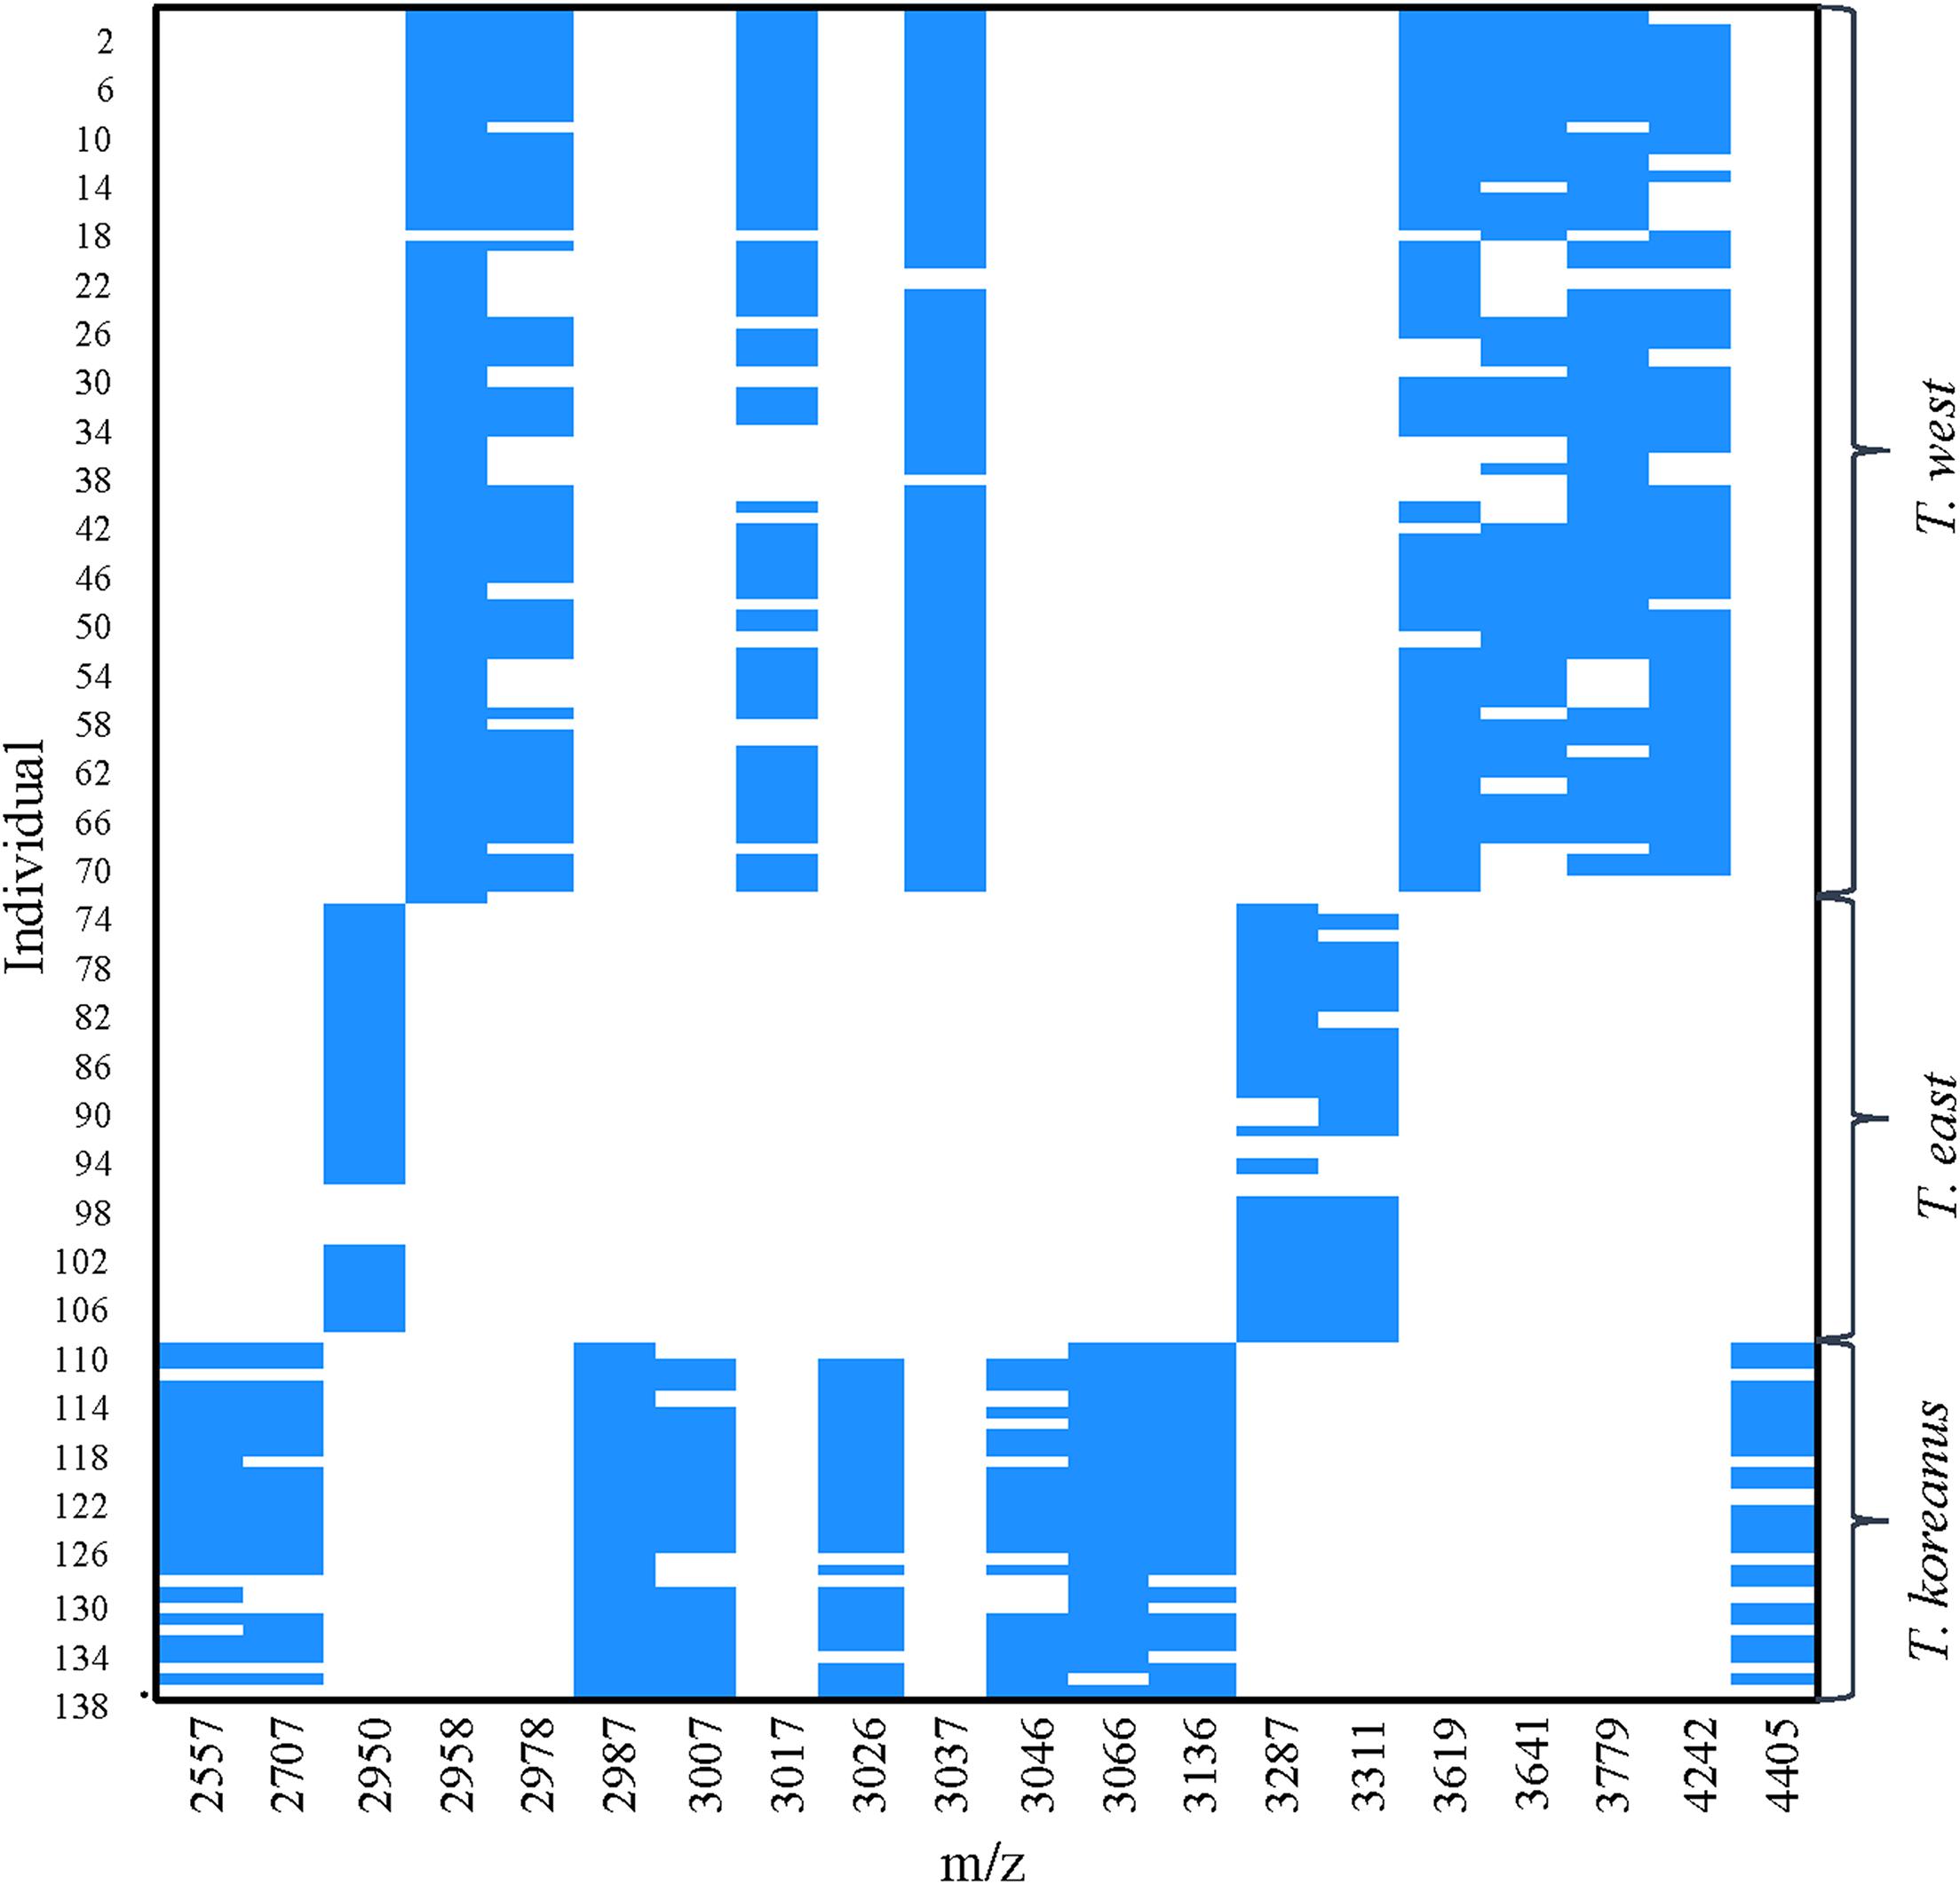
Figure 6. PeakPatterns plot of 138 Tigriopus spectra. X-axis; peaks with the highest variation among three Tigriopus species, Y-axis; individual numbers were displayed in 4 intervals.
Partial mtCOI sequences were successfully obtained from five specimens of the three putative different species (JMJ; BN, BR, SGP; BS). As a result of calculating the average pairwise distance with the mtCOI sequences obtained from each cluster, the mtCOI distances within each species are shown in Table 2. In the case of T. californicus, the average intra-species distance was 0.222, which is considered to reflect the fact that it is a cryptic species complex.
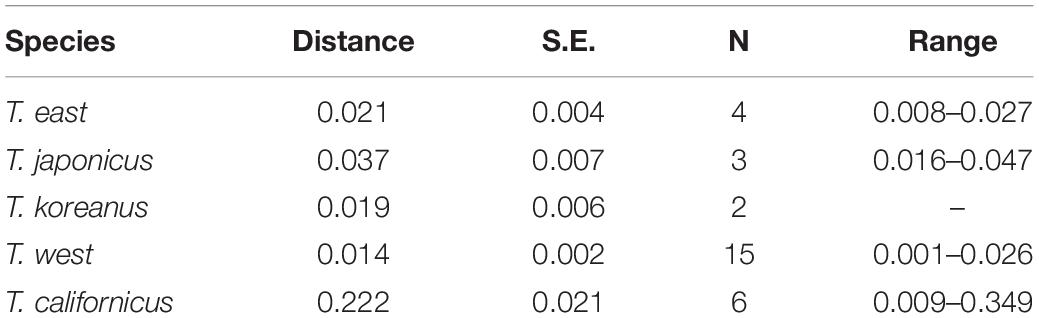
Table 2. Estimates of average evolutionary divergence over sequence pairs within Tigriopus species based on mitochondrial cytochrome oxidase I (mtCOI) data.
Busan population differs from the West coast and Jeju population by about 5–8% (mean = 0.063, S.E. = 0.011) and differs from the East population by about 31–38% (mean = 0.341, S.E. = 0.037) (Supplementary Tables 2, 3). These divergence values exceed the range of mean distances within T. east, T. japonicus, and T. west (0.014–0.037) (Table 2).
Mean distance within Tigriopus was 0.298 (S.E. = 0.022) (Supplementary Table 2). The topologies of the Bayesian inference tree and maximum likelihood tree (Figure 7), maximum parsimony tree (Supplementary Figure 1), and neighbor joining tree (Supplementary Figure 2) were different.
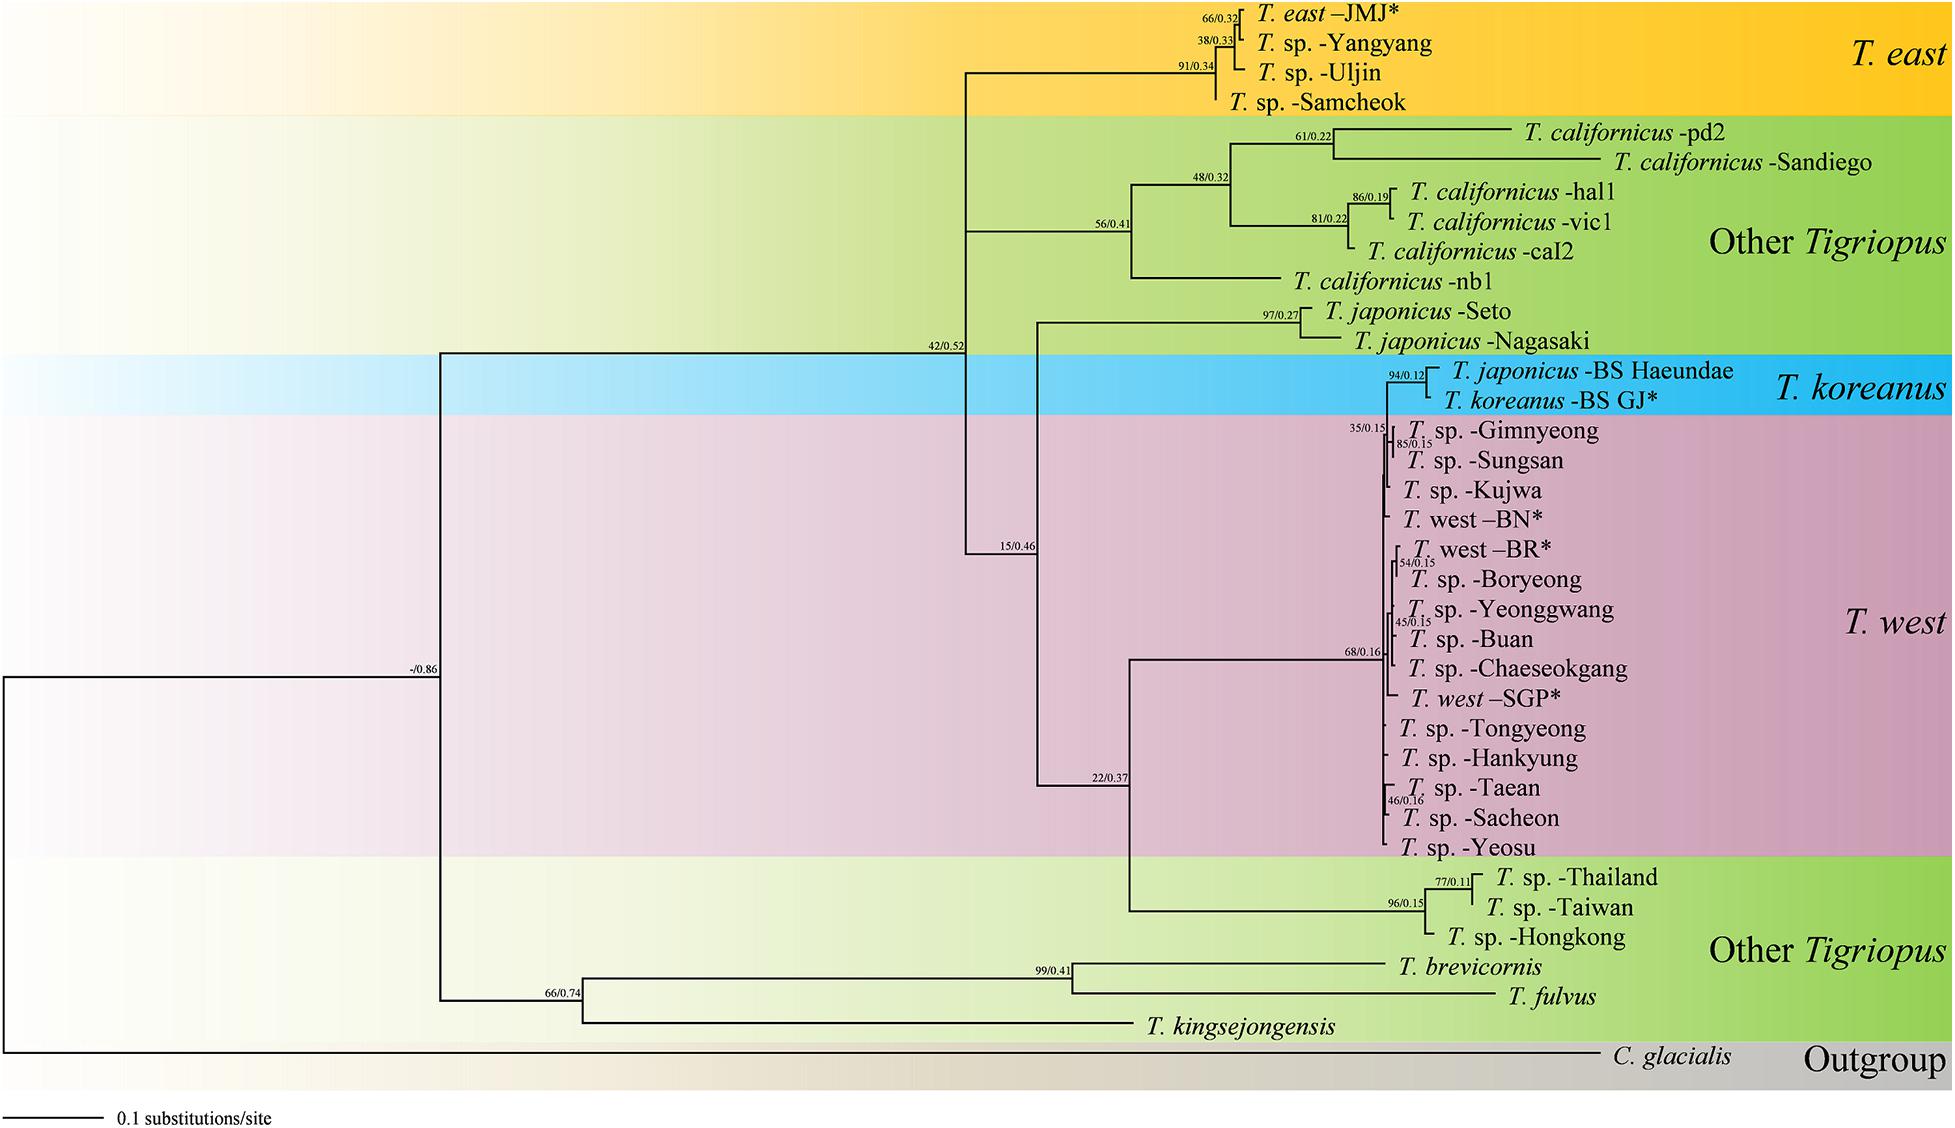
Figure 7. Molecular phylogenetic Maximum Likelihood (ML) and Bayesian Inference (BI) tree of Tigriopus species based on 36 mtCOI sequences. All positions containing gaps and missing data were eliminated. The first number along the branches represents ML, the second number represents BI bootstrap values, and ∗ indicates sequence obtained from this study.
Family Harpacticidae Dana, 1846
Genus Tigriopus Norman, 1869
Tigriopus koreanus sp. nov.
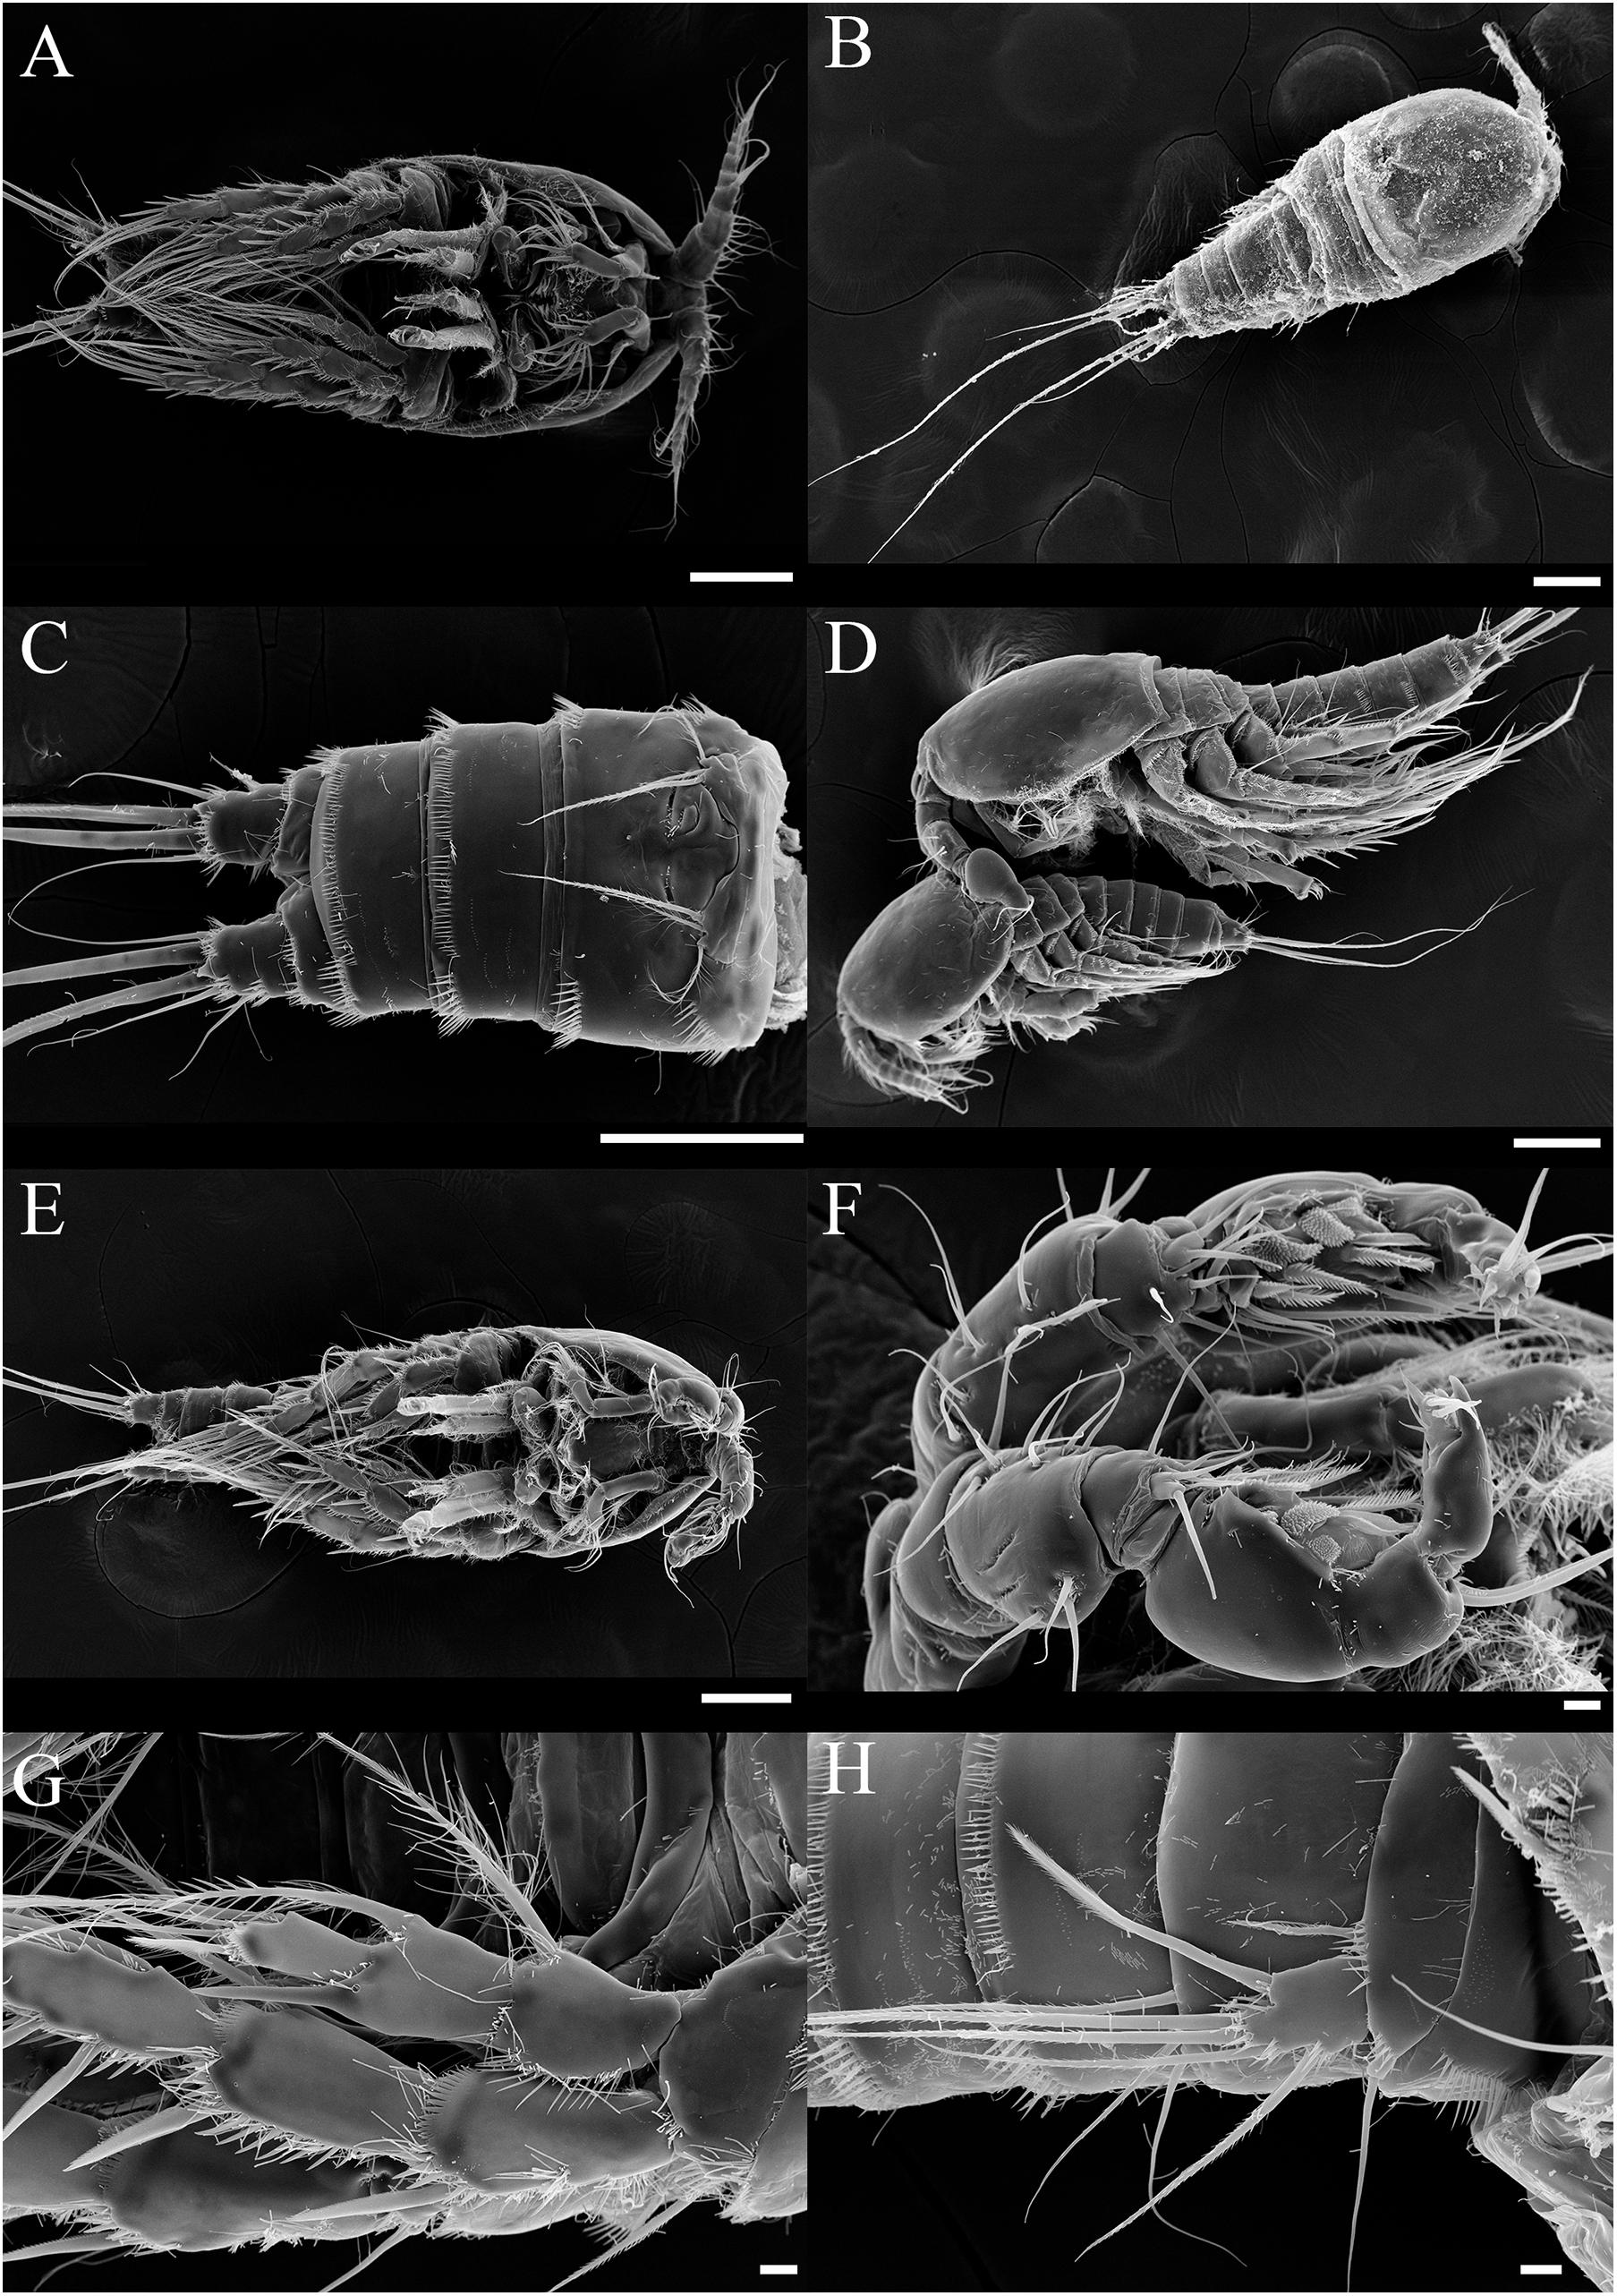
Figure 8. SEM photos of Tigriopus koreanus sp. nov. Female (A–C); (A) Habitus, ventral. (B) Habitus, dorsal. (C) Urosome and P6, ventral. (D) Precopulatory mate-guarding behavior. Male (E–H); (E) Habitus, ventral. (F) A1, (G) P2, (H) P5. (A–E); Scale bars = 100 μm, (F–H); Scale bars = 10 μm.
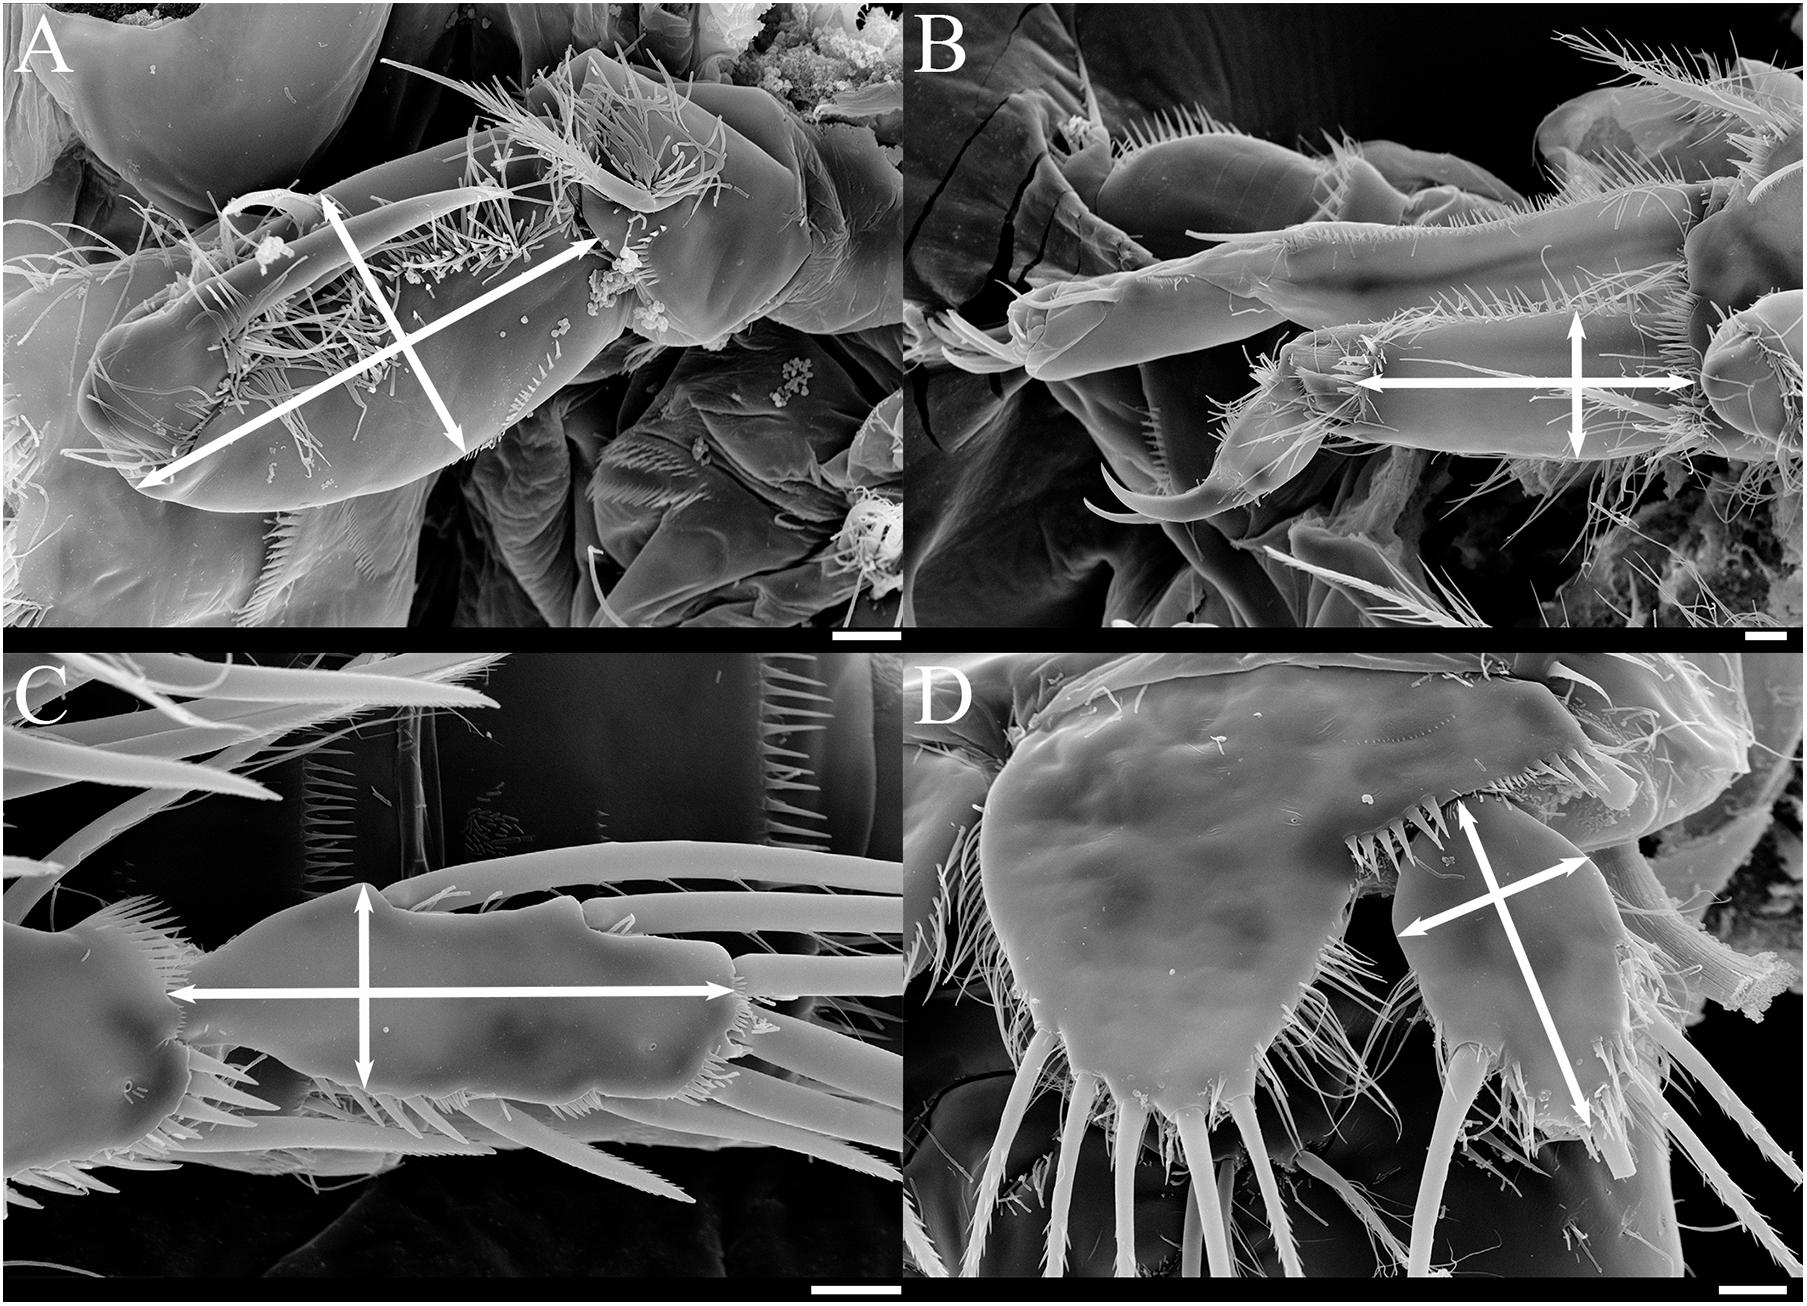
Figure 9. SEM photos of female Tigriopus koreanus sp. nov.; Appendages that length/width measured (white arrow lines) for morphological comparison. (A) Maxilliped, (B) P1, (C) P4 exp-3, (D) P5 exp. Scale bars = 10 μm.
urn:lsid:zoobank.org:act:9F568FAE-D7A0-4439-8BED-0B72056C494C
Type locality – Rock pool, Gijang, Busan, South Korea, 35°11′40.6″N 129°13′29.2″E
Type material – Holotype; 1 female on slide (NIBRIV0000880626). Allotype; 1 male on slide (NIBRIV0000880627). Paratypes; 3 females and 3 males on a SEM stub (NIBRIV0000880628), 2 females and 2 males in a vial (NIBRIV0000880629).
Other material examined − 17 females on slides (for morphological observation). 12 individuals on a SEM stub
Description – Total body length of female 1000.06 μm (n = 10) (Figures 8A,B), male 720.12 μm (n = 9) (Figures 8D,E); Habitus, segmentation, armature, and general ornamentation of somites and appendages as given by Ito (1969) for the redescription of T. japonicus.
Based on female, Mxp basis (Figure 9A) has a maximum length of 63.9–80.6 μm (mean = 73.5; SD = 4.2), a maximum width of 34.7–45.8 μm (mean = 40.6; SD = 2.9), and the ratio average between length and width is 1.8. P1 enp-1 (Figure 9B) has a maximum length of 66.7−91.7 μm (mean = 80.2; SD = 7.6), a maximum width of 25.0−38.9 μm (mean = 33.1; SD = 3.5), and the ratio average between length and width is 2.4. The maximum length of P1 exp-1 is 94.4−121.0 μm (mean = 106.5; SD = 7.5), and the maximum length of P1 exp-2 is 65.3−88.9 μm (mean = 78.5; SD = 6.3). P4 exp-3 (Figure 9C) has a maximum length of 55.6−68.1 μm (mean = 61.5; SD = 3.7), a maximum width of 18.1−26.4 μm (mean = 22.4; SD = 1.7), and the ratio average between length and width is 2.7. Female P5 exp (Figure 9D) has a maximum length of 45.8−58.3 μm (mean = 51.7; SD = 3.1), a maximum width of 27.8−34.7 μm (mean = 31.1; SD = 2.0), and the ratio average between length and width is 1.7 (Supplementary Table 4).
Sexual dimorphism of male expressed in A1 (Figure 8F), P2 enp (Figure 8G), P5, and P6 (Figure 8H).
Remarks – From measuring and comparing the morphological features of 20 females of each species, subtle morphological differences in the length:width ratio (l/w) of the Mxp basis, l/w ratio of the P1 enp-1, P4 exp-3, and P5 exp (Table 3 and Figures 9, 10) among the Korean species of Tigriopus were revealed.
Table 3. The result of multiple comparison (Bonferroni) for morphological comparisons between Korean Tigriopus species.
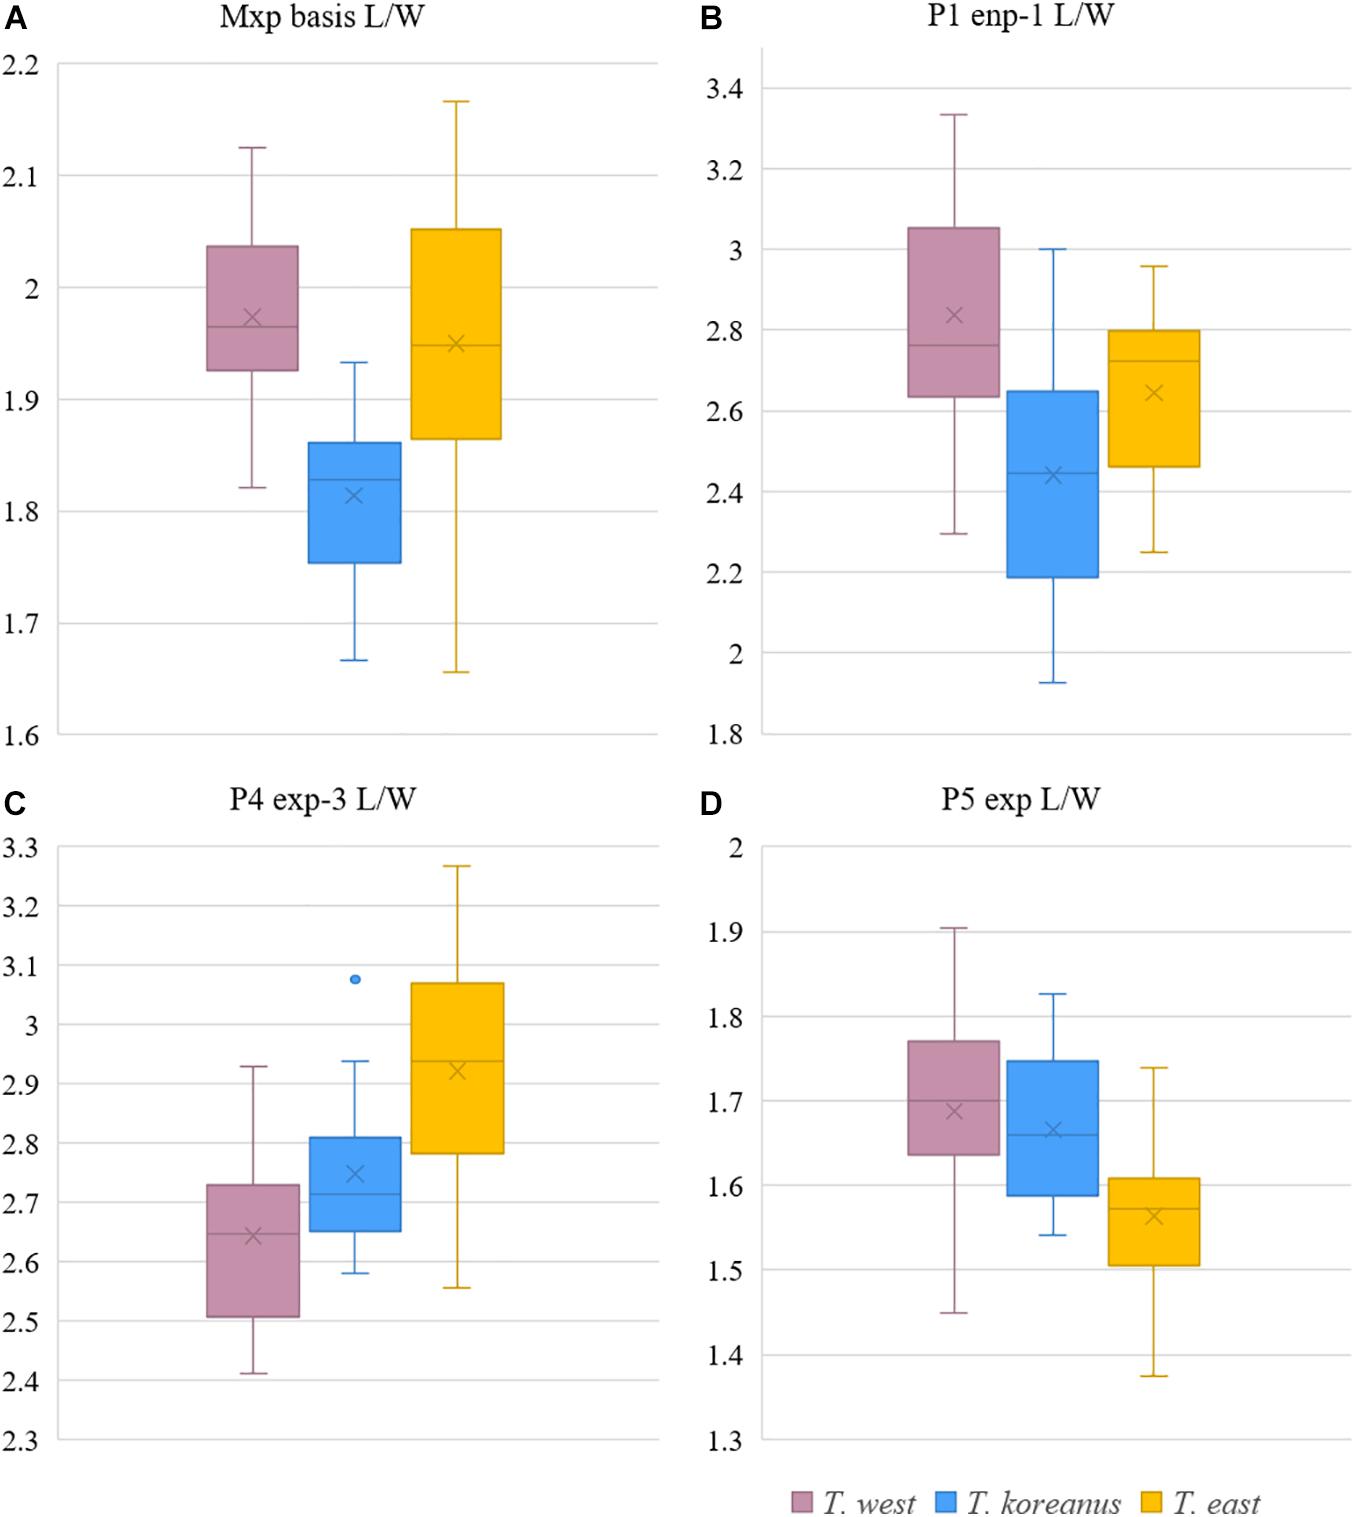
Figure 10. Boxplot of morphological comparisons data between Korean Tigriopus species (n = 20). (A) Mxp basis L/W, (B) P1 enp-1 L/W, (C) P4 exp-3 L/W, (D) P5 exp L/W.
T. koreanus sp. nov. and T. west showed significant differences in Mxp basis l/w (P < 0.001), P1 enp-1 l/w (P < 0.001). The difference between T. koreanus sp. nov. and T. east showed significant differences in all four morphological features (P < 0.001). The Mxp basis l/w of T. koreanus sp. nov. was about 1.8, which was stouter than the other two species (l/w = 2). For P1 enp-1 l/w, T. west is about 2.8, the longest, T. east is 2.6, and T. koreanus sp. nov. is 2.4, which is different in all three species. On the contrary, P4 exp-3 l/w showed the narrowest trend at T. east at about 2.9, followed by T. koreanus sp. nov. with 2.7 and T. west with 2.6. P5 exp l/w was similar in T. west and T. koreanus sp. nov., but both species showed significant differences from T. east.
According to DDA, compared to the other two species, T. koreanus sp. nov. showed strong intensity at 2,986−2,988, 3,066−3,067, and 3,026 m/z, and these peaks can be regarded as representative peaks of this species (Figure 5). In the case of T. west, ten representative peaks were identified, including 2,958, 3,036−3,037, 3,617−3,618, and 4,242. Tigriopus east showed distinct differences from the other two species in 22 mass, including 2,950, 3,310−3,312, and 3,287−3,288.
Computing the distance by comparing the mtCO1 partial sequences of three species, the mtCO1 distance between each species is as follows: T. west—T. koreanus sp. nov.; 0.063 (0.045–0.081), T. west—T. east; 0.301 (0.261−0.346), T. east—T. koreanus sp. nov.; 0.341 (0.308−0.379) (Supplementary Tables 2, 3).
Etymology – Species name refers to the type locality (i.e., Republic of Korea).
There was no difference in raw spectra (Figure 2A) when an individual specimen was cut in half by prosome and urosome, processed in separate tubes by body parts. The protein spectra of Schizopera sp. (Miraciidae) were also obtained in order to observe spectra variation from species not belonging to Tigriopus (Figure 2F). The protein spectra of Schizopera sp. were significantly different from Tigriopus spp. (Figures 2A–E).
Figure 5 shows relative difference between peaks when the three species are compared together, and it is sufficient to find the difference between the three Korean species of Tigriopus. Until now, various factors which could affect difference in spectra such as fixative solution and storage period after fixation have been investigated (Rossel and Martínez Arbizu, 2018). Usefulness of MALDI-TOF MS in cryptic species identification such as bacteria, mosquitoes, fish and sandflies have also been documented (Müller et al., 2013; Dieme et al., 2014; Paauw et al., 2015; Chavy et al., 2019; Maasz et al., 2020). This study further expands on the usefulness of MALDI-TOF MS, confirming that higher-resolution species identification (identification of cryptic species) is possible for copepods as well.
Despite its ability to identify cryptic species, there are several limitations. First, closely related species have similar protein composition, so the aspects of mass spectra patterns may appear similar. In such case, using only the overall pattern of mass spectra may lead to insignificant results. We expect that increasing the SNR to focus specifically on peaks with strong signal difference help detect cryptic species better. Just as DNA barcoding varies in resolution by different gene markers, and markers are chosen depending on the specific study purpose, parameters such as SNR, halfwindow, minfrequency for MALDI-TOF methodology must be adjusted accordingly.
Secondly, MADLI-TOF MS does not provide insight on the phylogenetic relationships between species. Because this method simply compares the overall protein pattern for species identification, protein molecules, composition, or function is not considered. Granted, if there is a difference in genetic distance, it is reflected on protein composition, resulting in mass spectra difference. However, this does not reflect proportional difference in the genetic distance. As such, to gain insight on phylogenetic relationship whilst discerning species complex, MALDI-TOF MS should be used complementally with DNA barcoding method.
Thirdly, it can be misleading to delimit species solely using MALDI-TOF without any prior knowledge about the species being investigated. In such case, cluster result obtained from the dendrogram may be difficult to interpret, since the number of clusters (or in this case, species) differ depending on the criterion setting of the y-axis. However, since this study presented three pieces of evidence (morphology, molecule, and protein) together, other evidences allowed us to present species classification criterion in MALDI-TOF. What this study can suggest is that Korean species of Tigriopus can be classified based on the height value of 3 in the dendrogram through protein mass comparison. Since criteria vary depending on the taxa, in order to use MALDI-TOF for species identification, a library must be established through further studies dealing with many taxa. To achieve this, role of taxonomists to confirm morphology while building on curated spectra, or molecular data would be essential.
Finally, MALDI-TOF MS can be affected by other factors, such as environmental factors (Karger et al., 2019; Chac et al., 2020). Karger et al. (2019) suggest that subtle differences within mass spectra can occur depending on habitat type, season, and region. This means environmental factors can directly influence differences in clusters, resulting differentiation of species. To improve the aforementioned limitations, sufficient accumulation of data from various species and habitats is required.
As is the case with other methods, it is still difficult to accurately identify a species with MALDI-TOF MS alone, so it is necessary to accumulate data library by morphological taxonomists, and in the beginning, it will be necessary to verify the species identification through other methods.
Based solely on this result (Supplementary Table 3), it could be confirmed that the Busan community differs from the West coast and Jeju communities by about 6%. According to a study on copepod DNA barcoding (Baek et al., 2016), the mean interspecific distance of harpacticoida was 1.6%, which is similar to the results of the three Korean Tigriopus species obtained in this study (Table 2). Also, in other copepod orders, there were cases where the mtCOI sequences between congeners differed only by 0.26−1.1%. Therefore, the difference of 6% is considered to be one of the supporting evidences for the species classification. As such, it is evident from existing studies, that range of intraspecific and interspecific distance varies for each copepoda order. The fact that the range of distance always vary among taxa is an indication that classification of species using only fragment sequence of one molecular marker is with limitations.
With DNA templates, researchers can obtain sequences of different lengths and locations depending on the primers used. Therefore, distinguishing cryptic species with just mtCOI barcode may prove to be an ambiguous task, and there is a possibility that they will result in the same species, although they are in fact different species. In accordance with this, in several studies (e.g., Huys et al., 2007; Thum and Harrison, 2009; Wyngaard et al., 2010; Blanco-Bercial et al., 2011; Marrone et al., 2013; Vakati et al., 2019) suggest that multigene analyses are required for more accurate results when identifying species through molecular information. Therefore, rather than using only one marker such as mtCOI for species identification, providing protein analysis alongside can strengthen the support for the overall results.
In a previous study, Rossel and Martínez Arbizu (2019) showed that Leptastacus cf. laticaudatus can be separated through MALDI TOF-MS experiments in three putative cryptic species. The mtCOI distances of the three cryptic species included in this L. cf. laticaudatus complex ranged from 15.32 to 31.15%. Although mtCOI distance between T. koreanus sp. nov. and T. west was less (6%) compared to distances reported by Rossel and Martínez Arbizu (2019), results from protein analysis showed that they were indeed different clusters.
Clusters observed from the protein data are different from clusters from phylogenetic trees based on mtCOI data. Therefore, it is difficult to extract evolutionary and systematic relationships based solely from these results. It is also challenging to interpret whether T. east and T. west clusters are closer to the T. koreanus sp. nov. clusters.
It is predicted that the reason that a Jeju individual had a high similarity to Busan community is because Busan and Jeju are relatively closer than other West Sea regions. In the same vein, when comparing the mtCOI data uploaded to the NCBI, there was only 4.5−6.3% difference from the data known as T. west on the South Sea coast (Yeosu, Sacheon, Tongyeong) or on the northeast coast of Jeju (Gimnyeong, Seongsan), which are adjacent to Busan.
Although the East sea community is relatively close to Busan in geographic distance, the molecular distance differs as much as the distance from the Japanese species. A probable explanation for this is that T. east in the East Sea region have been influenced by the North Korea Cold Current coming from the north, rather than the Kuroshio Current coming from the south. If samples of Tigriopus from South Sea coast and North Korea are obtained in the future, it would be possible to verify this hypothesis through protein spectra measurements. In the BI and ML tree (Figure 7), the topology supports this hypothesis. Because the origin of T. east is different, it appears as a clade different from the species in the region related to the Kuroshio Current.
On the other hand, according to the MP tree (Supplementary Figure 1) and NJ tree (Supplementary Figure 2), the Korean species form one clade (bootstrap; 23, 67%, respectively). This supports the possibility that individuals originating from the same species by the Kuroshio Current were geographically divided, resulting in speciation. Considering the geological aspect, according to a previous study (Knowlton and Weigt, 1998), it was estimated that millions of years would have passed per 1.5−2.6% of mtCOI mutation rates in crustaceans. According to this result, the estimated timing of speciation of T. east and T. west from their most recent common ancestor would be between 20 and 11.6 mya (Miocene).
The two trees obtained in this study were similar to the topologies of the trees suggested in previous studies. The topologies of MP tree and NJ tree in this study were similar to that of Karanovic et al. (2018), which also used mtCOI gene marker. In these cases, T. east and T. west formed the same clade. On the other hand, the topologies of the BI tree and ML tree in this study (Figure 7) were similar to those of the BI tree in Ki et al. (2009) and Karanovic et al. (2018). Although the markers used were different in Ki et al. (2009), based on ITS-5.8S rDNA, the topology was corresponding.
As can be seen from different topologies depending on the marker, method, and model, in fact, no one knows what evolutionary histories remain veiled. Naturally, there are only a few hypotheses that we can infer from these results.
However, the second hypothesis is difficult to support since Tigriopus is a fast-evolving genus, and Miocene may be too old as time for speciation. Therefore, in this study, topological results of the BI tree and ML tree were deemed more reliable, and we suggest that T. east had different origin from T. koreanus and T. west.
Nevertheless, it is evident that Tigriopus species from Busan is different from the previously known T. west and T. east. The mtCOI barcodes further support that the population of Tigriopus inhabiting Korea consists of at least three different species.
When comparing the morphological differences, the microscopic morphological features that distinguish the new species and other two species of Tigriopus were found in the length-width ratio of the P1 enp-1 and Mxp. Karanovic et al. (2018) found the differences between T. west and T. east by geometric morphometrics in P4 exp-3, female P5 exp, and male P2 enp. In this study, differences in P4 exp-3 l/w and P5 exp l/w of the two species were also confirmed, but when comparing the P5 exp l/w of the three species together, it was confirmed that it was difficult to clearly distinguish the three species by these morphological features as T. koreanus shows overlap, the mid-level characteristics of the other two species. Geometric morphometrics is a good tool to find significant differences in morphological characteristics, but it requires a lot of time and effort. Therefore, based on the results of this study, we recommend MALDI-TOF MS as a simple and efficient method for species identification rather than these time-consuming methods.
Furthermore, studies that are likely to be conducted in the future should include experiments to confirm the difference between nauplii and copepodites of the species of Tigriopus. It would also be meaningful to apply this method to other sibling species complexes such as T. californicus (Table 2; mtCO1 distance within genus; 0.22, S.E.; 0.02) to clear its convoluted taxonomic status.
Various identification tools such as mtCOl barcoding and geometric morphometry were utilized alongside morphological analysis to test the usefulness of MALDI-TOF for the identification of species of Tigriopus. Based on our findings, we conclude that identification of cryptic species can be made simpler, faster, and more cost-effective with MALDI-TOF MS than with mtCOI barcoding.
Through MALDI-TOF MS experiments on harpacticoid copepods of Tigriopus, we showed that the separation of specimens, fixation, presence of egg sac, and gender did not have a fatal effect on the clustering results. In addition, it was confirmed that the populations of Tigriopus from Baengnyeong island, Boryeong, and Jeju are in fact Tigriopus west, although there is a considerable geographical difference between Baengnyeong island and Jeju.
Although it has been known as one species for a long time due to the difficulty of morphological distinction even with optical microscopes, results from protein analysis in this study supported that Tigriopus, which inhabits rock pools in Korea’s coastal intertidal zone, actually consists of three species, and that the Busan population is a third distinct species different from the previously reported two species.
The datasets presented in this study can be found in online repositories. The names of the repository/repositories and accession number(s) can be found below: NCBI (accession: MW429840−MW429844) and Supplementary Materials.
JY, NP, and WL designed the study and collected samples. JY and NP carried out measurements, DNA barcoding and analyses of the data. RJ analyzed of the protein data. All authors contributed to the writing of the manuscript.
This research was supported by Basic Science Research Program through the National Research Foundation of Korea (NRF) funded by the Ministry of Education (2018R1D1A1B07050117), the National Institute of Biological Resources (NIBR) funded by the Ministry of Environment of the Republic of Korea (MOE, NIBR202102108), and the National Marine Biodiversity Institute of Korea (2021M01100).
The authors declare that the research was conducted in the absence of any commercial or financial relationships that could be construed as a potential conflict of interest.
We would like to express our sincere gratitude to Prof. Jinwon Lee and Ms. Yourae Kim for providing technical support to obtain the protein mass spectra. Also, we would like to express our deep appreciation to Dr. Seunghan Lee for his helpful information regarding Tigriopus culture and molecular experiments.
The Supplementary Material for this article can be found online at: https://www.frontiersin.org/articles/10.3389/fmars.2021.648197/full#supplementary-material
Supplementary Figure 1 | Molecular phylogenetic Maximum parsimony (MP) tree of Tigriopus species based on 36 mtCOI sequences. All positions containing gaps and missing data were eliminated. The number along the branches represents bootstrap values, and “∗” indicates sequence obtained from this study.
Supplementary Figure 2 | Molecular phylogenetic Neighbor-Joining (NJ) tree of Tigriopus species based on 36 mtCOI sequences. All positions containing gaps and missing data were eliminated. The number along the branches represents bootstrap values, and “∗” indicates sequence obtained from this study.
Supplementary Table 1 | GenBank numbers of mtCOI sequences used in phylogenetic analyses in this study.
Supplementary Table 2 | Estimates of evolutionary divergence between mtCOI sequences of Tigriopus species.
Supplementary Table 3 | Between Tigriopus species distance and S.E. (blue text).
Supplementary Table 4 | Length and width measurement data of appendages of Tigriopus species (μm).
Ahdesmäki, M., and Strimmer, K. (2010). Feature selection in omics prediction problems using cat scores and false nondiscovery rate control. Ann. Appl. Statist. 4, 503–519.
Baek, S., Jang, K., Choi, E., Ryu, S., Kim, S., Lee, J., et al. (2016). DNA Barcoding of Metazoan Zooplankton Copepods from South Korea. PLoS One 11:e0157307. doi: 10.1371/journal.pone.0157307
Barreto, F. S., Watson, E. T., Lima, T. G., Willett, C. S., Edmands, S., Li, W., et al. (2018). Genomic signatures of mitonuclear coevolution across populations of Tigriopus californicus. Nat. Ecol. Evolut. 2, 1250–1257. doi: 10.1038/s41559-018-0588-1
Baumeister, T. U. H., Vallet, M., Kaftan, F., Guillou, L., Svatoš, A., and Pohnert, G. (2020). Identification to species level of live single microalgal cells from plankton samples with matrix-free laser/desorption ionization mass spectrometry. Metabolomics 16, 1–10.
Blanco-Bercial, L., Bradford-Grieve, J., and Bucklin, A. (2011). Molecular phylogeny of the Calanoida (Crustacea: Copepoda). Mol. Phylogenet. Evolut. 59, 103–113. doi: 10.1016/j.ympev.2011.01.008
Bode, M., Laakmann, S., Kaiser, P., Hagen, W., Auel, H., and Cornils, A. (2017). Unravelling diversity of deep-sea copepods using integrated morphological and molecular techniques. J. Plankton Res. 39, 600–617. doi: 10.1093/plankt/fbx031
Bucklin, A., Ortman, B. D., Jennings, R. M., Nigro, L. M., Sweetman, C. J., Copley, N. J., et al. (2010). A “Rosetta Stone” for metazoan zooplankton: DNA barcode analysis of species diversity of the Sargasso Sea (Northwest Atlantic Ocean). Deep Sea Res. Part II Topic. Stud. Oceanogr. 57, 2234–2247. doi: 10.1016/j.dsr2.2010.09.025
Chac, D., Kordahi, M., Brettner, L., Verma, A., McCleary, P., Crebs, K., et al. (2020). Proteomic changes in bacteria caused by exposure to environmental conditions can be detected by Matrix-Assisted Laser Desorption/Ionization–Time of Flight (MALDI-ToF) Mass Spectrometry. bioRxiv 918938. [preprint].
Chalupová, J., Raus, M., Sedlářová, M., and Šebela, M. (2014). Identification of fungal microorganisms by MALDI-TOF mass spectrometry. Biotechnol. Adv. 32, 230–241. doi: 10.1016/j.biotechadv.2013.11.002
Chavy, A., Nabet, C., Normand, A. C., Kocher, A., Ginouves, M., Prévot, G., et al. (2019). Identification of French Guiana sand flies using MALDI-TOF mass spectrometry with a new mass spectra library. PLoS Neglec. Trop. Dis. 13:e0007031. doi: 10.1371/journal.pntd.0007031
Clarke, K. R. (1993). Non-parametric multivariate analyses of changes in community structure. Austral. J. Ecol. 18, 117–143. doi: 10.1111/j.1442-9993.1993.tb00438.x
Claydon, M. A., Davey, S. N., Edwards-Jones, V., and Gordon, D. B. (1996). The rapid identification of intact microorganisms using mass spectrometry. Nat. Biotechnol. 14, 1584–1586. doi: 10.1038/nbt1196-1584
Darriba, D., Taboada, G. L., Doallo, R., and Posada, D. (2012). jModelTest 2: more models, new heuristics and parallel computing. Nat. Methods 9, 772–772. doi: 10.1038/nmeth.2109
Dieme, C., Yssouf, A., Vega-Rúa, A., Berenger, J.-M., Failloux, A.-B., Raoult, D., et al. (2014). Accurate identification of Culicidae at aquatic developmental stages by MALDI-TOF MS profiling. Parasites Vectors 7, 1–14.
Feltens, R., Görner, R., Kalkhof, S., Gröger-Arndt, H., and von Bergen, M. (2010). Discrimination of different species from the genus Drosophila by intact protein profiling using matrix-assisted laser desorption ionization mass spectrometry. BMC Evolution. Biol. 10:95. doi: 10.1186/1471-2148-10-95
Fenselau, C., and Demirev, P. A. (2001). Characterization of intact microorganisms by MALDI mass spectrometry. Mass Spectrometry Rev. 20, 157–171. doi: 10.1002/mas.10004
Gibb, S., and Strimmer, K. (2012). MALDIquant: a versatile R package for the analysis of mass spectrometry data. Bioinformatics 28, 2270–2271. doi: 10.1093/bioinformatics/bts447
Hillenkamp, F., Karas, M., Beavis, R. C., and Chait, B. T. (1991). Matrix-assisted laser desorption/ionization mass spectrometry of biopolymers. Analyt. Chem. 63, 1193–1203.
Huys, R., Gee, J. M., Moore, C. G., and Hamond, R. (1996). Marine and brackish water harpacticoid copepods. London: Published for the Linnean Society of London and the Estuarine and Coastal Sciences Association.
Huys, R., Llewellyn-Hughes, J., Conroy-Dalton, S., Olson, P. D., Spinks, J. N., and Johnston, D. A. (2007). Extraordinary host switching in siphonostomatoid copepods and the demise of the Monstrilloida: integrating molecular data, ontogeny and antennulary morphology. Mol. Phylogenet. Evolut. 43, 368–378. doi: 10.1016/j.ympev.2007.02.004
Jung, S., Lee, Y., Park, T., Park, H., Hagiwara, A., Leung, K. M. Y., et al. (2006). The complete mitochondrial genome of the intertidal copepod Tigriopus sp. (Copepoda, Harpactidae) from Korea and phylogenetic considerations. J. Exp. Mar. Biol. Ecol. 333, 251–262. doi: 10.1016/j.jembe.2005.12.047
Karanovic, T., Lee, S., and Lee, W. (2018). Instant taxonomy: choosing adequate characters for species delimitation and description through congruence between molecular data and quantitative shape analysis. Invertebrate Systemat. 32, 551–580. doi: 10.1071/is17002
Karger, A., Bettin, B., Gethmann, J. M., and Klaus, C. (2019). Whole animal matrix-assisted laser desorption/ionization time-of-flight (MALDI-TOF) mass spectrometry of ticks–Are spectra of Ixodes ricinus nymphs influenced by environmental, spatial, and temporal factors? PLoS One 14:e0210590. doi: 10.1371/journal.pone.0210590
Ki, J., Lee, K., Park, H., Chullasorn, S., Dahms, H.-U., and Lee, J. (2009). Phylogeography of the copepod Tigriopus japonicus along the Northwest Pacific rim. J. Plankton Res. 31, 209–221. doi: 10.1093/plankt/fbn100
Kimura, M. (1980). A simple method for estimating evolutionary rates of base substitutions through comparative studies of nucleotide sequences. J. Mol. Evolut. 16, 111–120. doi: 10.1007/bf01731581
Knowlton, N., and Weigt, L. A. (1998). New dates and new rates for divergence across the Isthmus of Panama. Proc. R. Soc. London Ser. B Biol. Sci. 265, 2257–2263. doi: 10.1098/rspb.1998.0568
Kumar, S., Stecher, G., and Tamura, K. (2016). MEGA7: molecular evolutionary genetics analysis version 7.0 for bigger datasets. Mol. Biol. Evolut. 33, 1870–1874. doi: 10.1093/molbev/msw054
Kwok, K. W. H., and Leung, K. M. Y. (2005). Toxicity of antifouling biocides to the intertidal harpacticoid copepod Tigriopus japonicus (Crustacea, Copepoda): effects of temperature and salinity. Mar. Pollut. Bull. 51, 830–837. doi: 10.1016/j.marpolbul.2005.02.036
Laakmann, S., Gerdts, G., Erler, R., Knebelsberger, T., Martínez Arbizu, P., and Raupach, M. J. (2013). Comparison of molecular species identification for North Sea calanoid copepods (Crustacea) using proteome fingerprints and DNA sequences. Mol. Ecol. Resour. 13, 862–876. doi: 10.1111/1755-0998.12139
Maasz, G., Zrínyi, Z., Fodor, I., Boross, N., Vitál, Z., Kánainé Sipos, D. I., et al. (2020). Testing the Applicability of MALDI-TOF MS as an Alternative Stock Identification Method in a Cryptic Species Complex. Molecules 25:3214. doi: 10.3390/molecules25143214
Maier, T., Klepel, S., Renner, U., and Kostrzewa, M. (2006). Fast and reliable maldi-tof ms–based microorganism identification. Nat. Methods 3, i–ii.
Marrone, F., Brutto, S. L., Hundsdoerfer, A. K., and Arculeo, M. (2013). Overlooked cryptic endemism in copepods: systematics and natural history of the calanoid subgenus Occidodiaptomus Borutzky 1991 (Copepoda, Calanoida, Diaptomidae). Mol. Phylogenet. Evolut. 66, 190–202. doi: 10.1016/j.ympev.2012.09.016
Müller, P., Pflüger, V., Wittwer, M., Ziegler, D., Chandre, F., Simard, F., et al. (2013). Identification of cryptic Anopheles mosquito species by molecular protein profiling. PLoS One 8:e57486. doi: 10.1371/journal.pone.0057486
Nei, M., and Kumar, S. (2000). Molecular evolution and phylogenetics. Oxford: Oxford university press.
Oksanen, J., Blanchet, F. G., Friendly, M., Kindt, R., Legendre, P., McGlinn, D., et al. (2018). vegan: Community Ecology Package. R package version 2.5-2. 2018. Vienna: R Core Team.
Paauw, A., Jonker, D., Roeselers, G., Heng, J. M., Mars-Groenendijk, R. H., Trip, H., et al. (2015). Rapid and reliable discrimination between Shigella species and Escherichia coli using MALDI-TOF mass spectrometry. Int. J. Medical Microbiol. 305, 446–452. doi: 10.1016/j.ijmm.2015.04.001
Palarea-Albaladejo, J., McLean, K., Wright, F., and Smith, D. G. E. (2018). MALDIrppa: quality control and robust analysis for mass spectrometry data. Bioinformatics 34, 522–523. doi: 10.1093/bioinformatics/btx628
Peterson, D. L., Kubow, K. B., Connolly, M. J., Kaplan, L. R., Wetkowski, M. M., Leong, W., et al. (2013). Reproductive and phylogenetic divergence of tidepool copepod populations across a narrow geographical boundary in Baja California. J. Biogeogr. 40, 1664–1675. doi: 10.1111/jbi.12107
Riccardi, N., Lucini, L., Benagli, C., Welker, M., Wicht, B., and Tonolla, M. (2012). Potential of matrix-assisted laser desorption/ionization time-of-flight mass spectrometry (MALDI-TOF MS) for the identification of freshwater zooplankton: a pilot study with three Eudiaptomus (Copepoda: Diaptomidae) species. J. Plankton Res. 34, 484–492. doi: 10.1093/plankt/fbs022
Ronquist, F., Teslenko, M., Van Der Mark, P., Ayres, D. L., Darling, A., Höhna, S., et al. (2012). MrBayes 3.2: efficient Bayesian phylogenetic inference and model choice across a large model space. Systemat. Biol. 61, 539–542. doi: 10.1093/sysbio/sys029
Rossel, S., and Martínez Arbizu, P. (2018). Effects of sample fixation on specimen identification in biodiversity assemblies based on proteomic data (MALDI-TOF). Front. Mar. Sci. 5:149. doi: 10.3389/fmars.2018.00149
Rossel, S., and Martínez Arbizu, P. (2019). Revealing higher than expected diversity of Harpacticoida (Crustacea: Copepoda) in the North Sea using MALDI-TOF MS and molecular barcoding. Sci. Rep. 9, 1–14.
Rossel, S., Khodami, S., and Martinez Arbizu, P. (2019). Comparison of rapid biodiversity assessment of meiobenthos using MALDI-TOF MS and Metabarcoding. Front. Mar. Sci. 6:659. doi: 10.3389/fmars.2019.00659
Seng, P., Rolain, J.-M., Fournier, P. E., La Scola, B., Drancourt, M., and Raoult, D. (2010). MALDI-TOF-mass spectrometry applications in clinical microbiology. Future Microbiol. 5, 1733–1754.
Shao, M., and Bi, H. (2020). Direct identification of fish species by surface molecular transferring. Analyst 145, 4055–4374.
Shively, S., and Miller, W. R. (2009). The use of HMDS (hexamethyldisilazane) to replace critical point drying (CPD) in the preparation of tardigrades for SEM (scanning electron microscope) imaging. Transact. Kansas Acad. Sci. 112, 198–200. doi: 10.1660/062.112.0407
Singhal, N., Kumar, M., Kanaujia, P. K., and Virdi, J. S. (2015). MALDI-TOF mass spectrometry: an emerging technology for microbial identification and diagnosis. Front. Microbiol. 6:791. doi: 10.3389/fmicb.2015.00791
Suzuki, R., and Shimodaira, H. (2006). Pvclust: an R package for assessing the uncertainty in hierarchical clustering. Bioinformatics 22, 1540–1542. doi: 10.1093/bioinformatics/btl117
Thompson, J. D., Higgins, D. G., and Gibson, T. J. (1994). CLUSTAL W: improving the sensitivity of progressive multiple sequence alignment through sequence weighting, position-specific gap penalties and weight matrix choice. Nucleic Acids Res. 22, 4673–4680. doi: 10.1093/nar/22.22.4673
Thum, R. A., and Harrison, R. G. (2009). Deep genetic divergences among morphologically similar and parapatric Skistodiaptomus (Copepoda: Calanoida: Diaptomidae) challenge the hypothesis of Pleistocene speciation. Biol. J. Linnean Soc. 96, 150–165. doi: 10.1111/j.1095-8312.2008.01105.x
Tsuboko-Ishii, S., and Burton, R. S. (2018). Individual culturing of Tigriopus copepods and quantitative analysis of their mate-guarding behavior. J. Visualiz. Exp. 139:e58378.
Vakati, V., Eyun, S., and Lee, W. (2019). Unraveling the intricate biodiversity of the benthic harpacticoid genus Nannopus (Copepoda, Harpacticoida, Nannopodidae) in Korean waters. Mol. Phylogenet. Evolut. 130, 366–379. doi: 10.1016/j.ympev.2018.10.004
Volta, P., Riccardi, N., Lauceri, R., and Tonolla, M. (2012). Discrimination of freshwater fish species by matrix-assisted laser desorption/ionization-time of flight mass spectrometry (MALDI-TOF MS): a pilot study. J. Limnol. 71:e17.
Williams, B. D., Schrank, B., Huynh, C., Shownkeen, R., and Waterston, R. H. (1992). A genetic mapping system in Caenorhabditis elegans based on polymorphic sequence-tagged sites. Genetics 131, 609–624. doi: 10.1093/genetics/131.3.609
Keywords: copepoda, MALDI-TOF MS, cryptic species, protein, identification
Citation: Yeom J, Park N, Jeong R and Lee W (2021) Integrative Description of Cryptic Tigriopus Species From Korea Using MALDI-TOF MS and DNA Barcoding. Front. Mar. Sci. 8:648197. doi: 10.3389/fmars.2021.648197
Received: 31 December 2020; Accepted: 12 April 2021;
Published: 07 May 2021.
Edited by:
Carlos Navarro Barranco, Autonomous University of Madrid, SpainReviewed by:
Samuel Gómez, National Autonomous University of Mexico, MexicoCopyright © 2021 Yeom, Park, Jeong and Lee. This is an open-access article distributed under the terms of the Creative Commons Attribution License (CC BY). The use, distribution or reproduction in other forums is permitted, provided the original author(s) and the copyright owner(s) are credited and that the original publication in this journal is cited, in accordance with accepted academic practice. No use, distribution or reproduction is permitted which does not comply with these terms.
*Correspondence: Wonchoel Lee, d2xlZUBoYW55YW5nLmFjLmty
†These authors have contributed equally to this work and share first authorship
Disclaimer: All claims expressed in this article are solely those of the authors and do not necessarily represent those of their affiliated organizations, or those of the publisher, the editors and the reviewers. Any product that may be evaluated in this article or claim that may be made by its manufacturer is not guaranteed or endorsed by the publisher.
Research integrity at Frontiers
Learn more about the work of our research integrity team to safeguard the quality of each article we publish.