
94% of researchers rate our articles as excellent or good
Learn more about the work of our research integrity team to safeguard the quality of each article we publish.
Find out more
ORIGINAL RESEARCH article
Front. Mar. Sci., 28 May 2021
Sec. Coral Reef Research
Volume 8 - 2021 | https://doi.org/10.3389/fmars.2021.647943
This article is part of the Research TopicAdvances in 3D Habitat Mapping of Marine Ecosystem Ecology and ConservationView all 15 articles
 Courtney S. Couch1,2*
 Thomas A. Oliver2
 Rhonda Suka1,2
 Mia Lamirand1,2
 Mollie Asbury2
 Corinne Amir1,2
 Bernardo Vargas-Ángel1,2
 Morgan Winston1,2
 Brittany Huntington1,2Frances Lichowski1,2
 Ariel Halperin1,2Andrew Gray1,2Joao Garriques1,2
 Jennifer Samson2
As the threats to coral reefs mount, scientists and managers are looking for innovative ways to increase the scope, scale, and efficiency of coral reef monitoring. Monitoring changes in coral communities and demographic features provides key information about ecosystem function and resilience of reefs. While most monitoring programs continue to rely on in-water visual survey methods, scientists are exploring 3D imaging technologies such as photogrammetry, also known as Structure-from-Motion (SfM), to enhance precision of monitoring, increase logistical efficiency in the field, and generate a permanent record of the reef. Here, we quantitatively compare data generated from in-water surveys to SfM-derived metrics for assessing coral demography, bleaching, and diversity in the main Hawaiian Islands as part of NOAA’s National Coral Reef Monitoring Program. Our objectives were to compare between-method error to within-method error, test for bias between methods, and identify strengths and weaknesses of both methods. Colony density, average colony diameter, average partial mortality, prevalence of bleaching, species richness, and species diversity were recorded using both methods within the same survey areas. For all metrics, the magnitude of between-method error was comparable to the within-method error for the in-water method and between method error was significantly higher than within-method error for SfM for one of the seven metrics. Our results also reveal that a majority of the metrics do not vary significantly between methods, nor did we observe a significant interaction between method and habitat type or method and depth. Exceptions include estimates of partial mortality, bleaching prevalence, and Porites juvenile density–though differences between methods are generally small. Our study also highlights that SfM offers a unique opportunity to more rigorously quantify and mitigate inter-observer error by providing observers unlimited “bottom time” and the opportunity to work together to resolve difficult annotations. However, the necessary investment in equipment and expertise does present substantial up-front costs, and the time associated with curating imagery, photogrammetric modeling, and manual image annotation can reduce the timeliness of data reporting. SfM provides a powerful tool to reimagine how we study and manage coral reefs, and this study provides the first quantified methodological comparison to validate the transition from standard in-water methods to SfM survey methods for estimates of coral colony-level surveys.
Coral reefs are suffering under multiple global threats associated with climate change (Hoegh-Guldberg et al., 2007; Pandolfi et al., 2011; Heron et al., 2016; Hughes et al., 2018) as well as local threats including overfishing, pollution, disease, severe storms, and overuse (Sandin et al., 2008; Ruiz-Moreno et al., 2012; Lamb et al., 2014; Pollock et al., 2014; Vega Thurber et al., 2014). These compounding disturbances are resulting in shifts in coral reef communities (Loya et al., 2001; Munday, 2004; Hughes et al., 2018) and progressive decline in coral reefs (Bruno and Selig, 2007; Miller et al., 2009; De’ath et al., 2012). Percent coral cover is the most widely used metric most widely used metric for detecting these shifts (Bruno and Selig, 2007; Edmunds and Elahi, 2007; Hughes et al., 2018), but this coarse metric often operates on decadal timescales that impede timely management action and does not elucidate the underlying demographic processes contributing to change (Edmunds and Riegl, 2020). Metrics such as colony density, size frequency distribution, partial mortality, colony health, and diversity can provide key information about a population’s recovery potential, response to acute and chronic disturbance events, shifts in communities, and ultimately shed light on the underlying mechanisms that cannot be gleaned from cover alone (Edmunds and Elahi, 2007; Riegl et al., 2013, 2017; Baskett et al., 2014; Riegl and Purkis, 2015; Edmunds and Riegl, 2020; García-Urueña and Garzón-Machado, 2020; Kodera et al., 2020).
Over the last five decades, coral reef ecologists have used a broad range of in-water visual and imaging survey methods to quantify various features of benthic communities. Historically, visual methods such as line intercept transects (Loya, 1972), point intercept transects (English et al., 1994), quadrats (Conand et al., 1999), timed swims (Donnelly et al., 2003), and belt transects (Connell et al., 1997) have been widely used. While these methods allow divers to leave the water with data in hand, they can be time consuming to conduct, require specialized training, and visual observations made by a single diver cannot be verified or re-evaluated. Video transects (Carleton and Done, 1995; Houk and Van Woesik, 2006) and photoquadrats (English et al., 1994; Preskitt et al., 2004) have become more widely adopted during the last two decades with the increased accessibility of digital cameras. These methods are more efficient underwater, require less specialized skills in the field, and create a permanent record of the reef. However, they necessitate significant post-processing, are typically only used to quantify benthic cover, only capture a small area of reef which does not allow for accurate colony-level measurements, and usually only captures the reef in two dimensions (Beijbom et al., 2015; Jokiel et al., 2015; Page et al., 2016).
An emerging photogrammetry technology called structure-from-motion (SfM) is gaining popularity in coral reef science (Burns et al., 2015a; Bryson et al., 2017; Casella et al., 2017; Ferrari et al., 2017; Fox et al., 2019; Obura et al., 2019) and offers a potential opportunity to continue collecting population and community metrics beyond coral cover while reducing field costs. SfM uses two dimensional (2D) overlapping images to incorporate every pixel into a 3D point cloud surface. With this 3D point cloud, an orthorectified 2D mosaic of all the 2D images as well as a geometrically accurate 2D projection of the dense point cloud can be generated. This technique provides researchers versatility to study the reef from the coral polyp to reef-scale. To date, a majority of studies on coral reefs utilizing SfM methodology have focused on quantifying structural complexity (Burns et al., 2015a; Figueira et al., 2015; Storlazzi et al., 2016; Bryson et al., 2017; Fukunaga et al., 2020; Torres-Pulliza et al., 2020). Others have used SfM in small-scale studies to quantify disease and bleaching (Fox et al., 2019; Voss et al., 2019; Burns et al., 2020), spatial clustering of corals (Edwards et al., 2017; Pedersen et al., 2019), coral growth (Kodera et al., 2020; Lange and Perry, 2020), and size frequency distributions (Hernández-Landa et al., 2020). SfM can generate high resolution mosaics that facilitate colony-level assessments, but SfM may limit our ability to capture every surface and colony-angle that can be achieved with in-water assessments and significant post processing may impede timely data generation. Thus a comprehensive methodological comparison is needed to assess data comparability and methodological trade-offs. While Burns et al. (2020) conducted a small scale study comparing in-water assessments of coral health to data generated from SfM, no study has tested whether the standard suite of coral metrics (e.g., density, colony size, diversity, partial mortality, prevalence of altered health states, and diversity) extracted from SfM imagery are consistent with in-water observations across gradients of community structure, depth and reef complexity.
In this study, we evaluated the use of SfM as a tool for quantifying seven coral metrics (adult density, juvenile density, colony size, old partial mortality, bleaching prevalence, species richness, and species diversity) in comparison to traditional visual in-water assessments. We conducted this study across eight main Hawaiian Islands where reefs vary considerably in coral abundance, community structure, depth, and structural complexity. To contextualize methodological differences we quantified inter-observer error and compared it to methodological error. To assess the utility of SfM for benthic monitoring, the three objectives of this study are to: (1) compare between-method error to within method observer error, (2) test for methodological bias between SfM and in-water visual surveys across habitats and depths, and (3) review logistical and technical strengths and weaknesses of both methods.
We conducted 104 benthic surveys across eight main Hawaiian Islands between April and July 2019 (Figure 1). Sites were randomly selected within hard bottom habitat from 0 to 30 m and distributed across 17 sub-island sectors. These sites represent a broad range of depths (1–25 m), habitat types (aggregate reef, patch reef, pavement, rock and boulder, and rubble), coral cover, and diving conditions. At each site, an 18 m transect line was deployed along the depth contour. Visual observations were recorded within four 1 × 2.5 m segments along the transect (at 0–2.5, 5–7.5, 10–12.5, and 15–17.5 m). When dive time was limited (i.e., depths > 18 m), only three segments were surveyed. For each adult coral colony (≥5 cm in diameter), maximum diameter, ID (to lowest taxonomic level), and estimated percent old partial mortality (denuded skeleton colonized by turf or other organisms and hereafter referred to as “old dead”) were recorded. Bleaching extent (% of living tissue with reduced or loss of pigmentation) and severity (1 = slight paling, 2 = significant pigmentation loss, and 3 = stark white) were also recorded. Juvenile coral colonies (<5 cm maximum diameter) were recorded within the first 1 m2 of the first three segments. For juvenile colonies, only ID and maximum diameter were recorded. At a subset of these 104 sites, 43 haphazardly chosen segments across 28 sites were re-surveyed by a different diver to create replicate in-water observations for assessing within method observer error (Figure 1). Data were quality controlled in R with specific queries to identify and correct data entry errors.
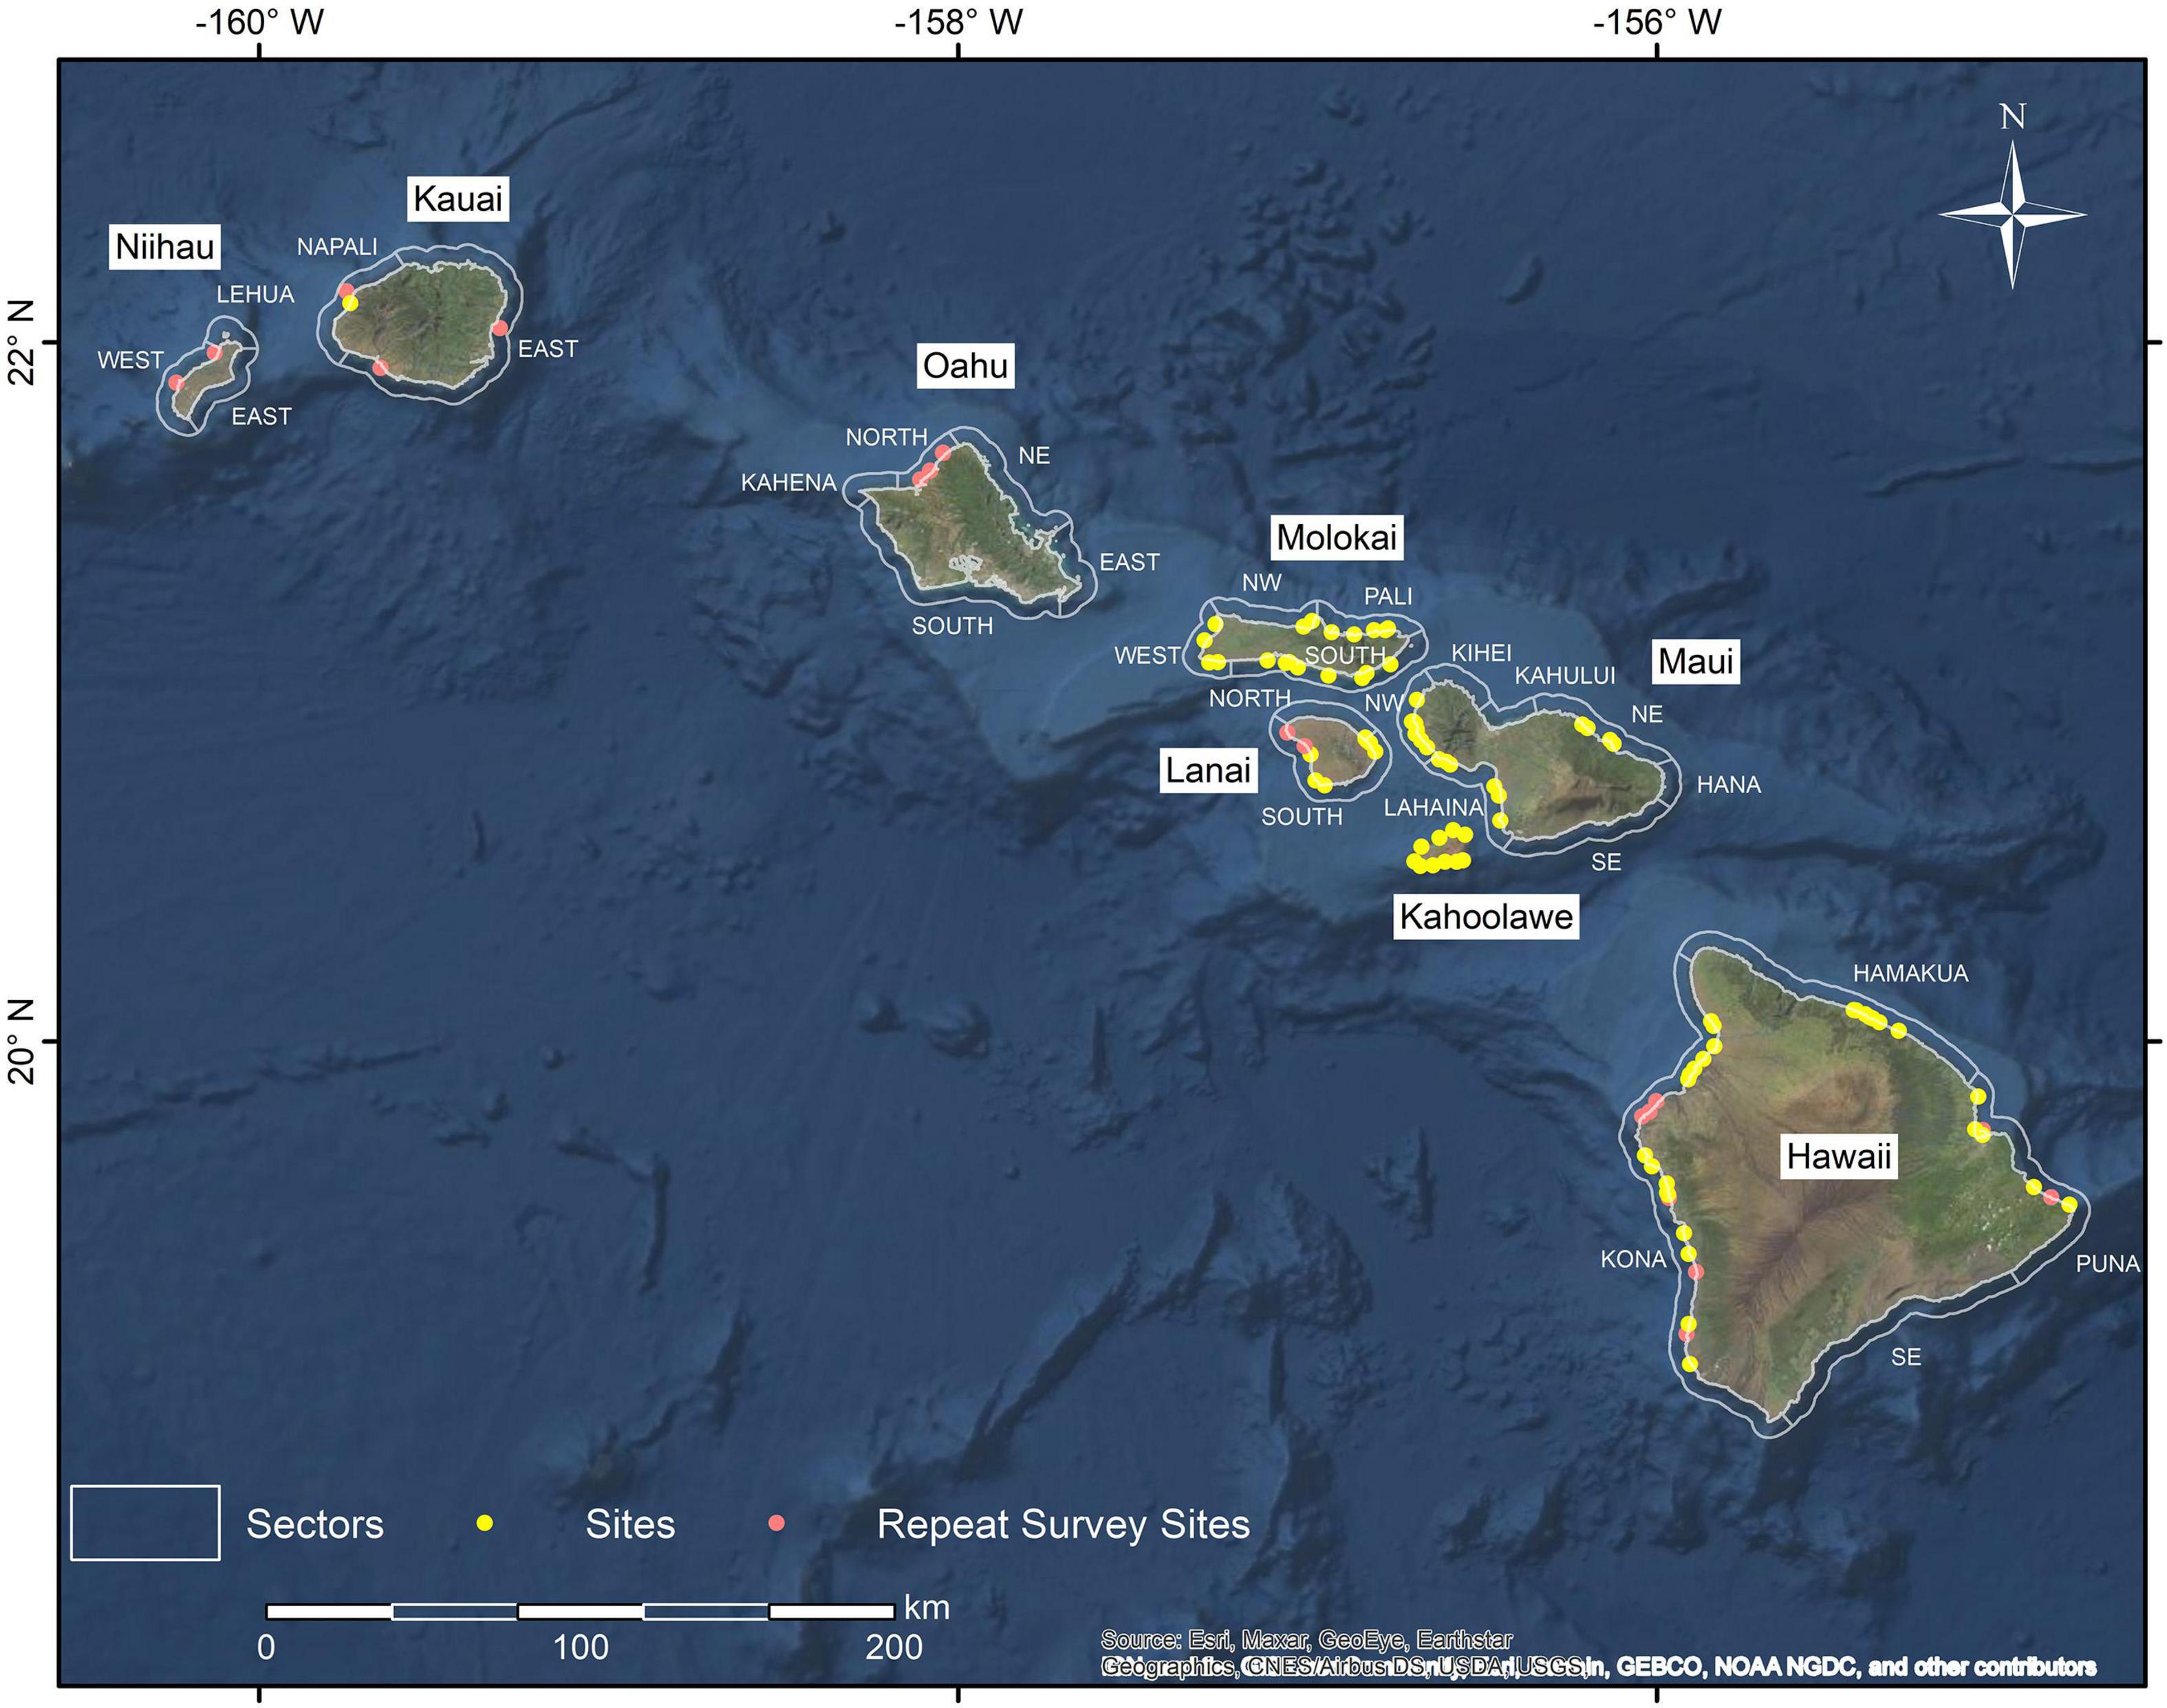
Figure 1. Location of 104 survey sites (pink and yellow), sites with 28 repeated surveys indicated in pink. White outlines and labels indicate sub-island sectors.
Structure-From-Motion image collection was conducted at each site during the in-water visual surveys described above. Scale bar markers, also known as ground control points (GCPs), were placed at the beginning of each segment at least 0.5 m away from the transect line. The depth and relative position of each GCP were recorded. JPEG imagery was collected continuously by the diver depressing the shutter of an entry level digital SLR camera (Canon EOS Rebel SL2, with Ikelite underwater housing with 6” dome port) with an 18–55 mm lens fixed at 18 mm. Prior to conducting the survey the camera was white balanced at depth with an 18% gray card. At depths of 1–20 m (Figure 2), SfM imagery was collected over a 3 × 20 m area and at depths > 18 m, a 3 × 13 m area was surveyed, both with the transect line running down the middle of the survey area. This imaged area allowed divers to capture the 3–4 segments discussed above as well and an adequate buffer around the segments to ensure that colonies that extended outside the segments were fully captured in the imagery. Images were taken continuously along the transect by a diver swimming back and forth with 0.5 m spacing between passes, while maintaining a 1 m distance from the seafloor. The photographer swam three passes on each side of the transect line, for a total of six passes, to produce the total image area (Figure 2). This swim pattern allowed for >60% side overlap and >80% forward overlap of images. Imagery was manually evaluated to ensure only quality imagery (i.e., no overexposed or blue imagery) were included in the models.
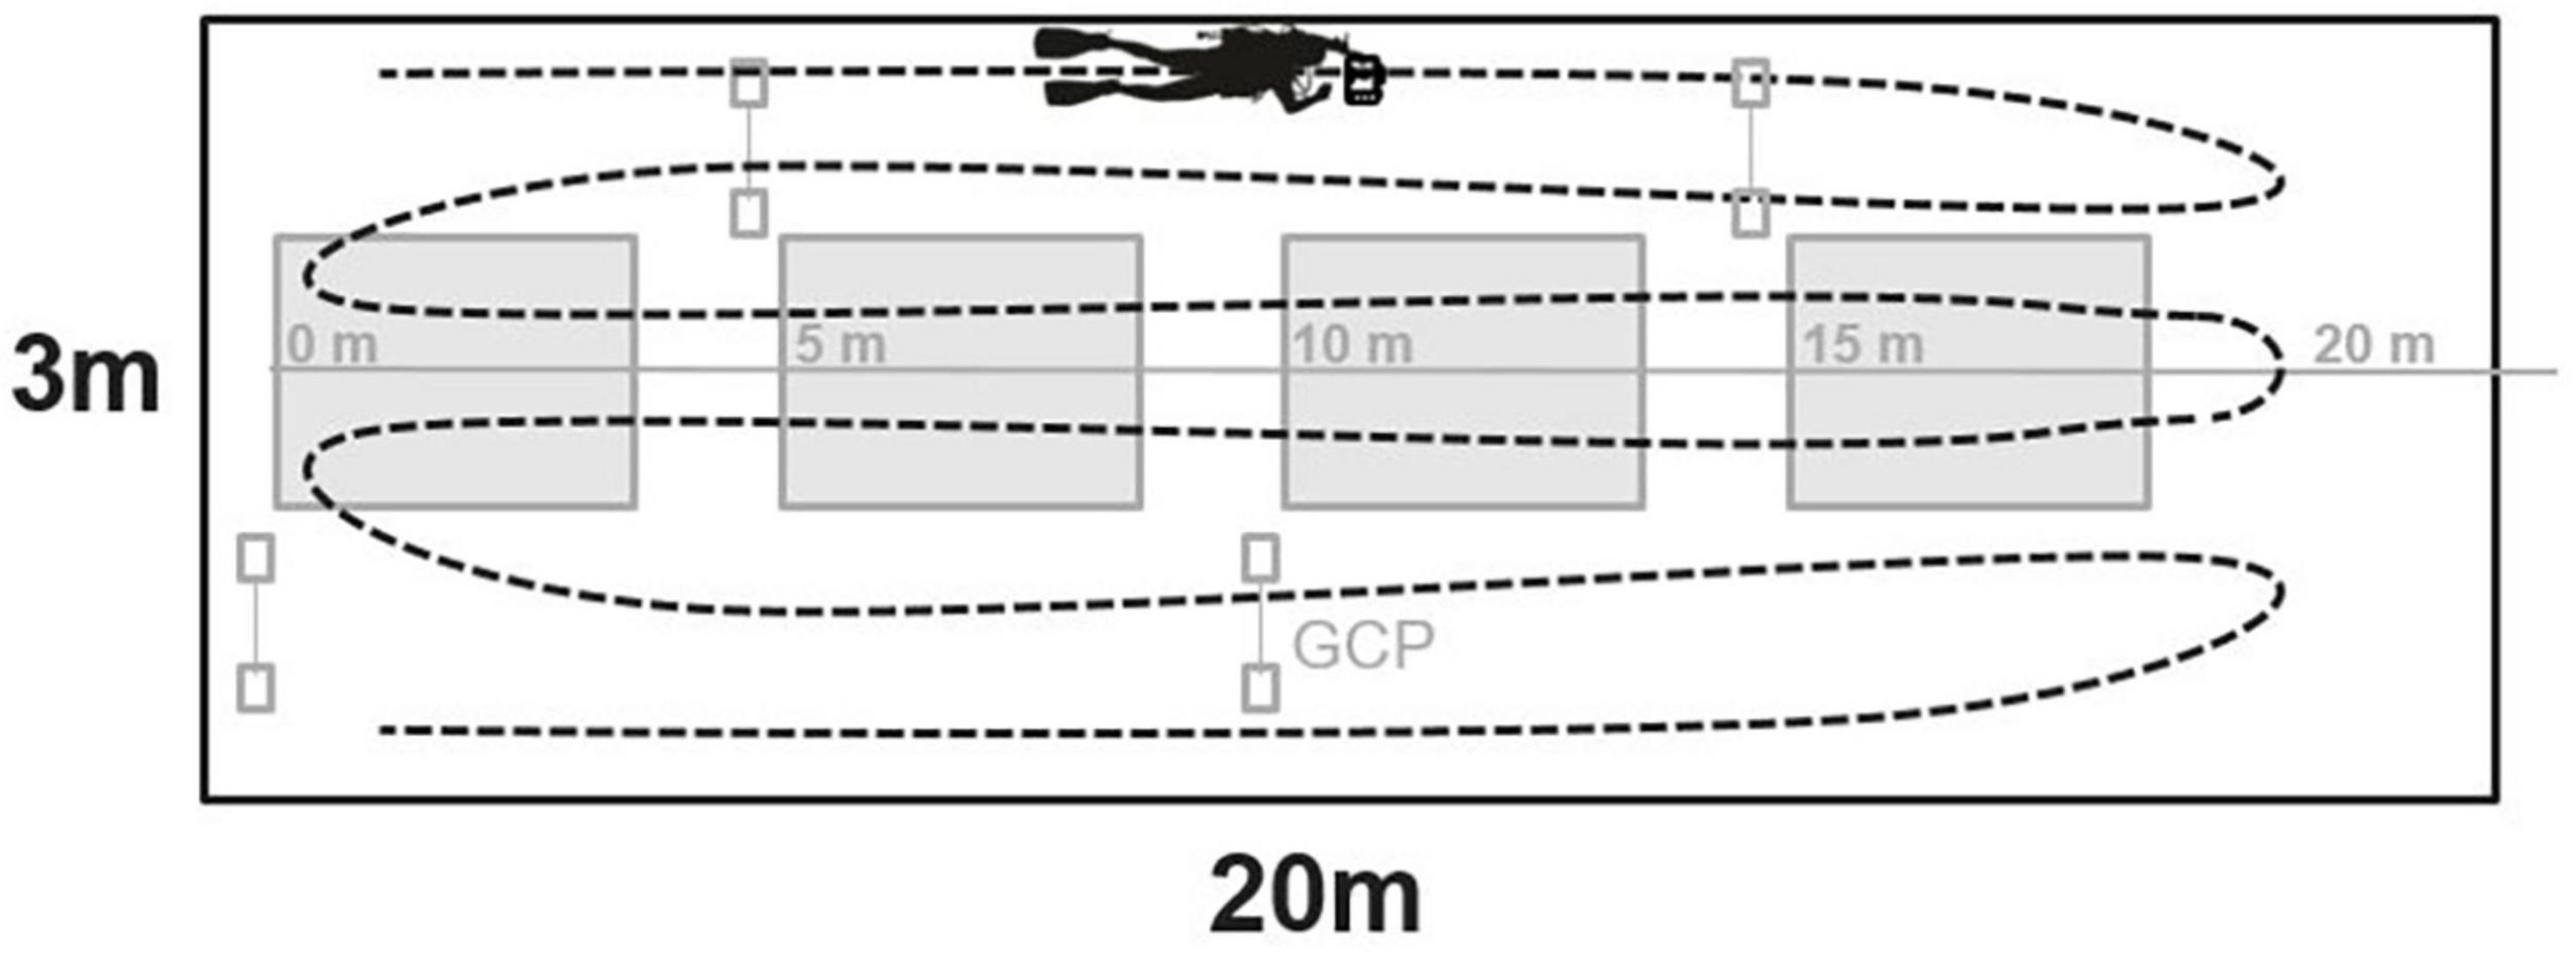
Figure 2. Graphic of benthic survey plot with in-water visual survey segments (in gray). The SfM swim path is indicated by the black dashed line, covering an image area of 3 m × 20 m area. Note, at depths > 18 m, divers reduced the image survey area to 3 × 13 m. GCP, ground control point.
A 3D model from each site was generated using Agisoft Metashape software (AgiSoft Metashape Professional Version 1.6.1). The workflow sequence included aligning images, and then building and exporting the 3D dense point cloud (DPC) following parameters described by Suka et al. (2019). All DPCs were created using a Supermicro SuperServer with a Dual Xeon E5-2600 64 GB processor with 128 GB memory and eight Quardro P4000 graphics processing units. The DPC was then brought into Viscore, a visualization software (Petrovic et al., 2014), and scaled and oriented using the GCP information. The average ground sample distance (resolution/pixel) of all scaled DPC models was 0.000234 m/pix and ranged 0.000145–0.00031 m/pix. The average error was 1.227 pix and ranged 0.618–2.496 pix. These values are comparable to those reported in other coral reef SfM studies (Burns et al., 2015a, b; Suka et al., 2020). A geometrically accurate 2D/top down projection of the DPC, hereafter referred to as an orthoprojection, and a scale grid were exported from Viscore (Figure 3). The orthoprojection and grid were then imported into ArcMap 10.6.1 for manual colony annotation (see Suka et al., 2019 for detailed methods).
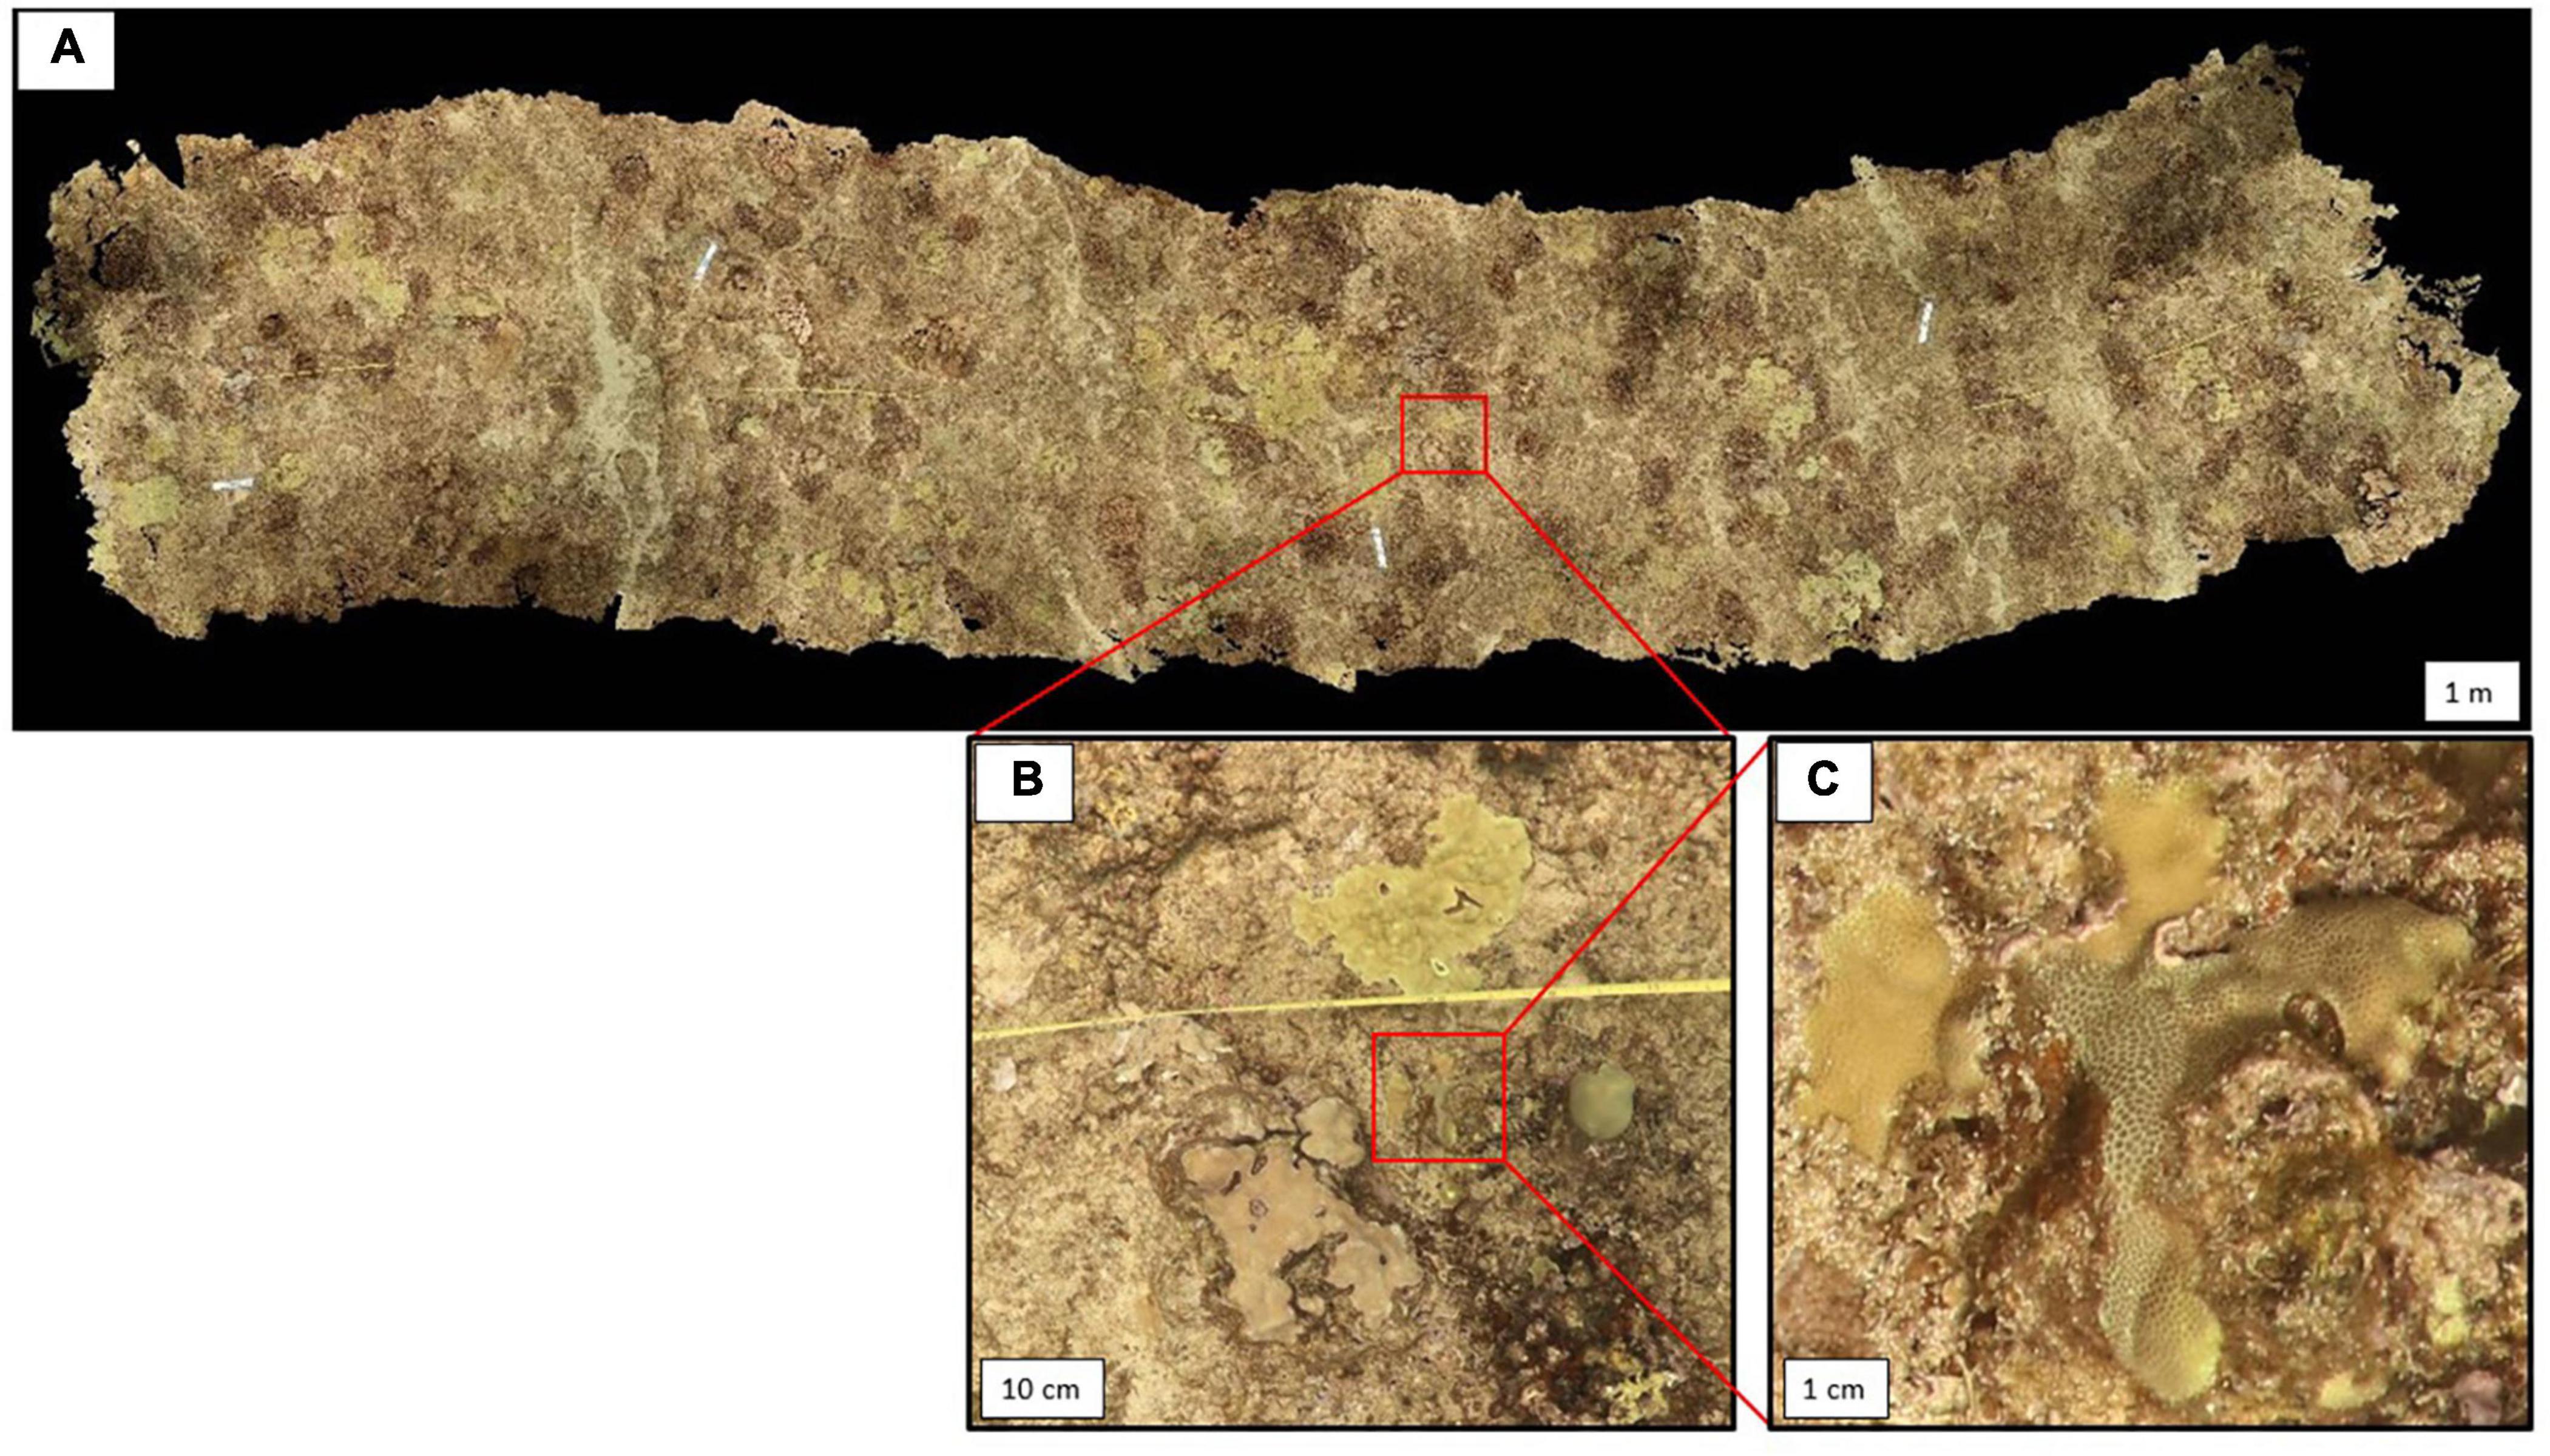
Figure 3. (A) 60 m2 orthoprojection and associated high resolution imagery (B,C) used to both create the orthoprojection and assist with coral colony annotation in ArcMap.
In ArcMap, each site was set up for annotation by defining the ratio of the scale of the orthoprojection using the scale grid, manually digitizing the transect and segments as a shapefile using the same sampling design as the in-water surveys, and setting up the attribute table in a geodatabase to mirror the in-water visual survey database. To record and extract data from the orthoprojection, each coral colony was annotated following the in-water visual survey methods. A total of six annotators extracted data from 104 sites. Each colony was measured by digitizing a line across the maximum diameter of the colony. Coral ID (to lowest taxonomic level), estimated percent old mortality, and bleaching extent and severity were recorded. During annotation, the original JPEG imagery was viewed alongside the orthoprojection with the Viscore Image View feature to see fine scale colony details, observe colonies from multiple angles, and locate colonies not visible in the orthoprojection (i.e., under ledges). Annotators were encouraged to speak with each other during the annotation process. In addition to this standard annotation, the subset of 43 segments across 28 sites that were replicated in-water by divers were also annotated twice by different SfM annotators to create replicate data sets for both methods. SfM data were quality controlled using a multi-stage process. Data were first quality controlled in R with specific queries to identify and correct data entry errors. Then data were summarized to the segment-level by annotator to identify potential issues (i.e., anomalously high or low mean values for specific metrics relative to other annotators). This QC step revealed that all six annotators had issues with at least one metric, the most common being low juvenile density, high adult colony density and low bleaching prevalence. If issues were identified for a given annotator, that annotator reviewed and corrected each site if they did find errors. The third stage involved annotators reviewing a subset (10% of the annotated segments) of randomly selected segments (stratified by annotator) that they did not originally annotate and recording errors to establish individual annotator error rates for each metric. This QC step revealed that one of the annotators had an error rate of >10% for adult density due to missing colonies and four annotators had an error rate of >10% for juvenile density due to missing colonies. All of the sites for the annotators that had error rates >10% were reviewed and corrected for the metric in question by a different annotator.
All data were analyzed in R v3.6.1 (R Core Team, 2019). Seven metrics were summarized as follows: adult colony density (number of colonies ≥ 5 cm per m2), juvenile colony density (number of colonies 0.7–4.9 cm per m2), average maximum adult diameter, average percent old dead, bleaching prevalence (percent of colonies with a bleaching severity ≥ 2), adult species richness (number of species), and adult Shannon-Wiener diversity (), where pi is the proportion of individuals belonging to the ith species at a site and R is the total number of species at a site. Colonies with bleaching severity 1 (slight paling) were not included in this analysis due to challenges associated with identifying low levels of bleaching severity consistently across observers regardless of method type. Richness and diversity of juveniles were not calculated due to the challenges of identifying juvenile corals to the species level using either methods.
To compare error between methods to within method observer error for the seven metrics, data were summarized at the segment-level for all scleractinians combined. The identities of observers within each method were randomly assigned to observer “1” or “2” (i.e., Diver 1 vs. Diver 2, SfM 1 vs. SfM 2). Therefore, comparisons between observers within a method highlight general variation among multiple observers, but do not reflect the tendencies of a single, human observer. Error was calculated as the absolute difference in values (between methods or observers) divided by overall mean and then scaled from 0 to 1 so that we could compare the relative level of error across metrics (termed “midpoint scaled mean absolute error”). Error was calculated for three different types of comparisons for the 43 paired segments repeatedly sampled by both SfM and in-water methods. “Diver observer error” represents the difference between divers for a given demographic metric (Supplementary Figure 1A). “SfM observer error” represents the difference in error for a given metric between SfM annotators (Supplementary Figure 1B). “Method Error” is the difference between methods for all possible combinations of method x observer divided by the mean difference across all method x observer comparisons for a given metric (Supplementary Figure 1C). We summarize each of these error distributions using the mean and standard error of the mean. We used nonparametric Kruskal–Wallis tests and Dunn’s post hoc tests with Benjamini and Hochberg multiple test corrections to test for differences between the three errors because metrics did not meet assumptions of normality and equal variance.
To test for differences between methods in the coral metrics, data were summarized at the site-level at 104 sites that were surveyed by one diver and one SfM annotator. Data were pooled to the site-level because this is the lowest spatial resolution typically summarized using NCRMP data. Within a site, only segments that were surveyed in both methods were included and then pooled to the site-level. Results are presented for the seven metrics for total scleractinian corals combined and for adult and juvenile density of the three dominant coral genera (Porites, Montipora, and Pocillopora). Each metric was tested for normality and equal variance. Measures of adult density, juvenile density, and average old partial mortality were square root transformed. Average colony diameter and Porites adult and juvenile density were log transformed. Richness and diversity met assumptions of normality and equal variance. 1:1 plots with a linear regressions were used to compare and visualize in-water and SfM-generated estimates for each metric. Root mean squared error (RMSE) was used to evaluate the level of error between methods and was calculated as follows:; where yi is the in-water metric value for a given site, xi is the SfM-generated metric value for a given site and n is the total number of sites. For each of these metrics, we established a series of linear mixed effects models (LMMs) to test effect of: method, method × habitat, and method × maximum depth. These variables were treated as fixed effects and sub-island sector was treated as a random effect. To assess the significance of fixed effects, we refit each model using maximum likelihood estimation (ML) and applied likelihood ratio tests (LRTs) (Zuur et al., 2009). Fixed effects that were not significant were sequentially dropped from models. The resulting best-fit models were refit using REML in order to estimate the fixed-effects parameters and associated effect sizes. Bleaching prevalence, Montipora density, and Pocillopora density could not be transformed because standard transformations failed to result in distributions that met assumptions of normality and equal variance and therefore were only tested for overall difference between methods using nonparametric Wilcoxon Rank Tests for each metric.
To determine whether we had adequate sampling to detect significant methodological bias, we ran power analyses for each of the metrics assuming a two-tailed t-test, the standard deviation of the untransformed or transformed metric (see transformation type above), power of 0.8, α = 0.05, and an N from 3 to 350 samples. On each of the resulting curves, we selected the observed sample size (102–104) and compared it to the calculated mean absolute error (MAE), which is the mean absolute difference between methods.
To determine whether the absolute difference between methods is greater or smaller than the difference between observers, we compared the level of method error to both kinds of observer error across the subset of 43 segments surveyed by two in-water divers and two SfM annotators (Figure 4). For adult density, diver observer error was significantly higher than SfM error, but was not different from method error (Figure 4 and Supplementary Table 1). Similarly, for average colony diameter, there was no difference between diver error and method error, but SfM observer error was significantly lower than the other error comparisons (Figure 4 and Supplementary Table 1). These results suggest that the difference between methods for adult density and colony diameter were just as variable as what we normally see between divers underwater, but SfM annotators were more consistent in scoring than divers. For the other metrics there was no significant difference between the three error types.
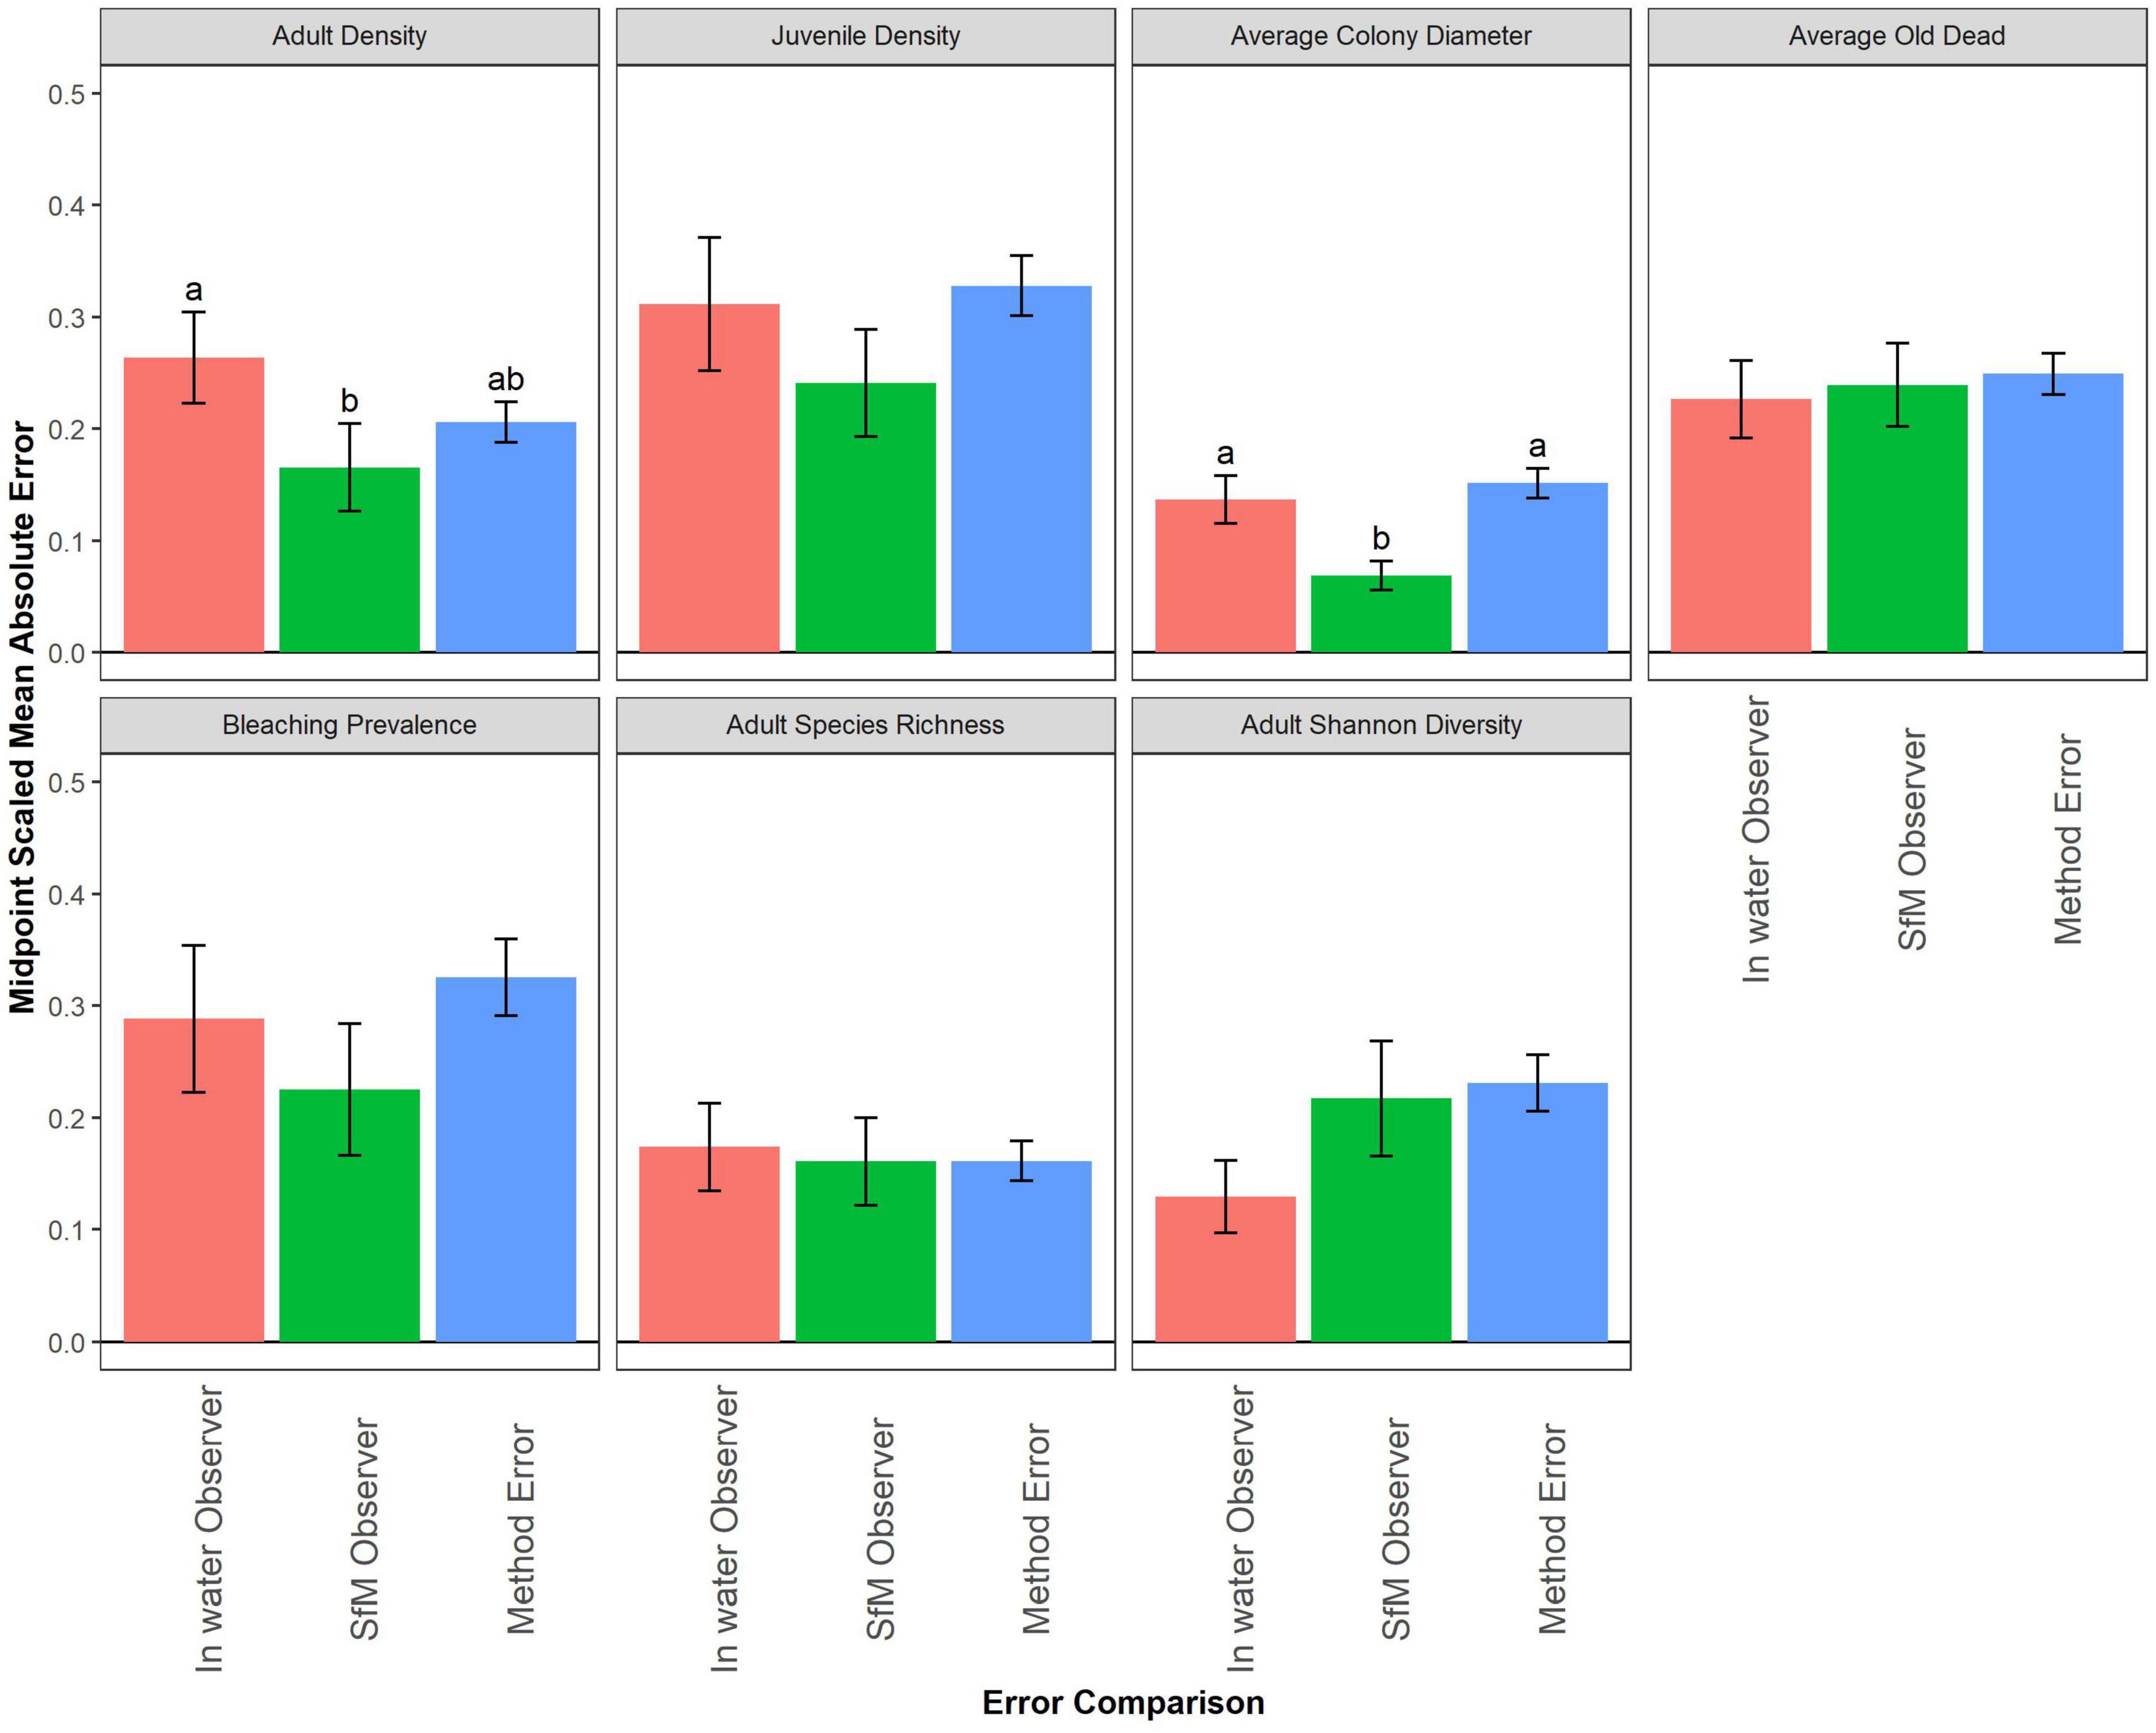
Figure 4. A Comparison of the in-water observer error (difference between divers; red) and structure-from-motion (SfM) observer error (difference between SfM annotators; green) to method error (difference between methods; blue) for each coral demographic metric. Letters, when present, denote significant differences among error types based on post hoc tests for each metric using Dunn’s tests with Benjamini and Hochberg multiple test corrections (adjusted α = 0.05).
Overall, this suggests that while there may be variability between methods, it is consistent with the level of variability we have between divers. The probability distributions of the metrics show only minor variation (especially for old dead, maximum colony diameter and bleaching prevalence) in the general shape of the distribution among observers/methods across all metrics (Supplementary Figure 2). The density metrics and average colony length each show substantial right skew, while average old dead, adult species richness, and adult species diversity all show the least skewed distributions. Bleaching prevalence showed dominance by zero values (i.e., zero-inflation) with a scattering of positive values.
At the site-level, adult colony density was strongly correlated between methods with a low root mean square error (RMSE) and more variability above 15 colonies/m2 (Figure 5A). We did not detect a significant methodological difference (Figure 5B and Supplementary Table 2), nor was there a significant interaction between method and habitat (Supplementary Figure 3A and Supplementary Table 2), or method and depth (Supplementary Figure 3B and Supplementary Table 2).
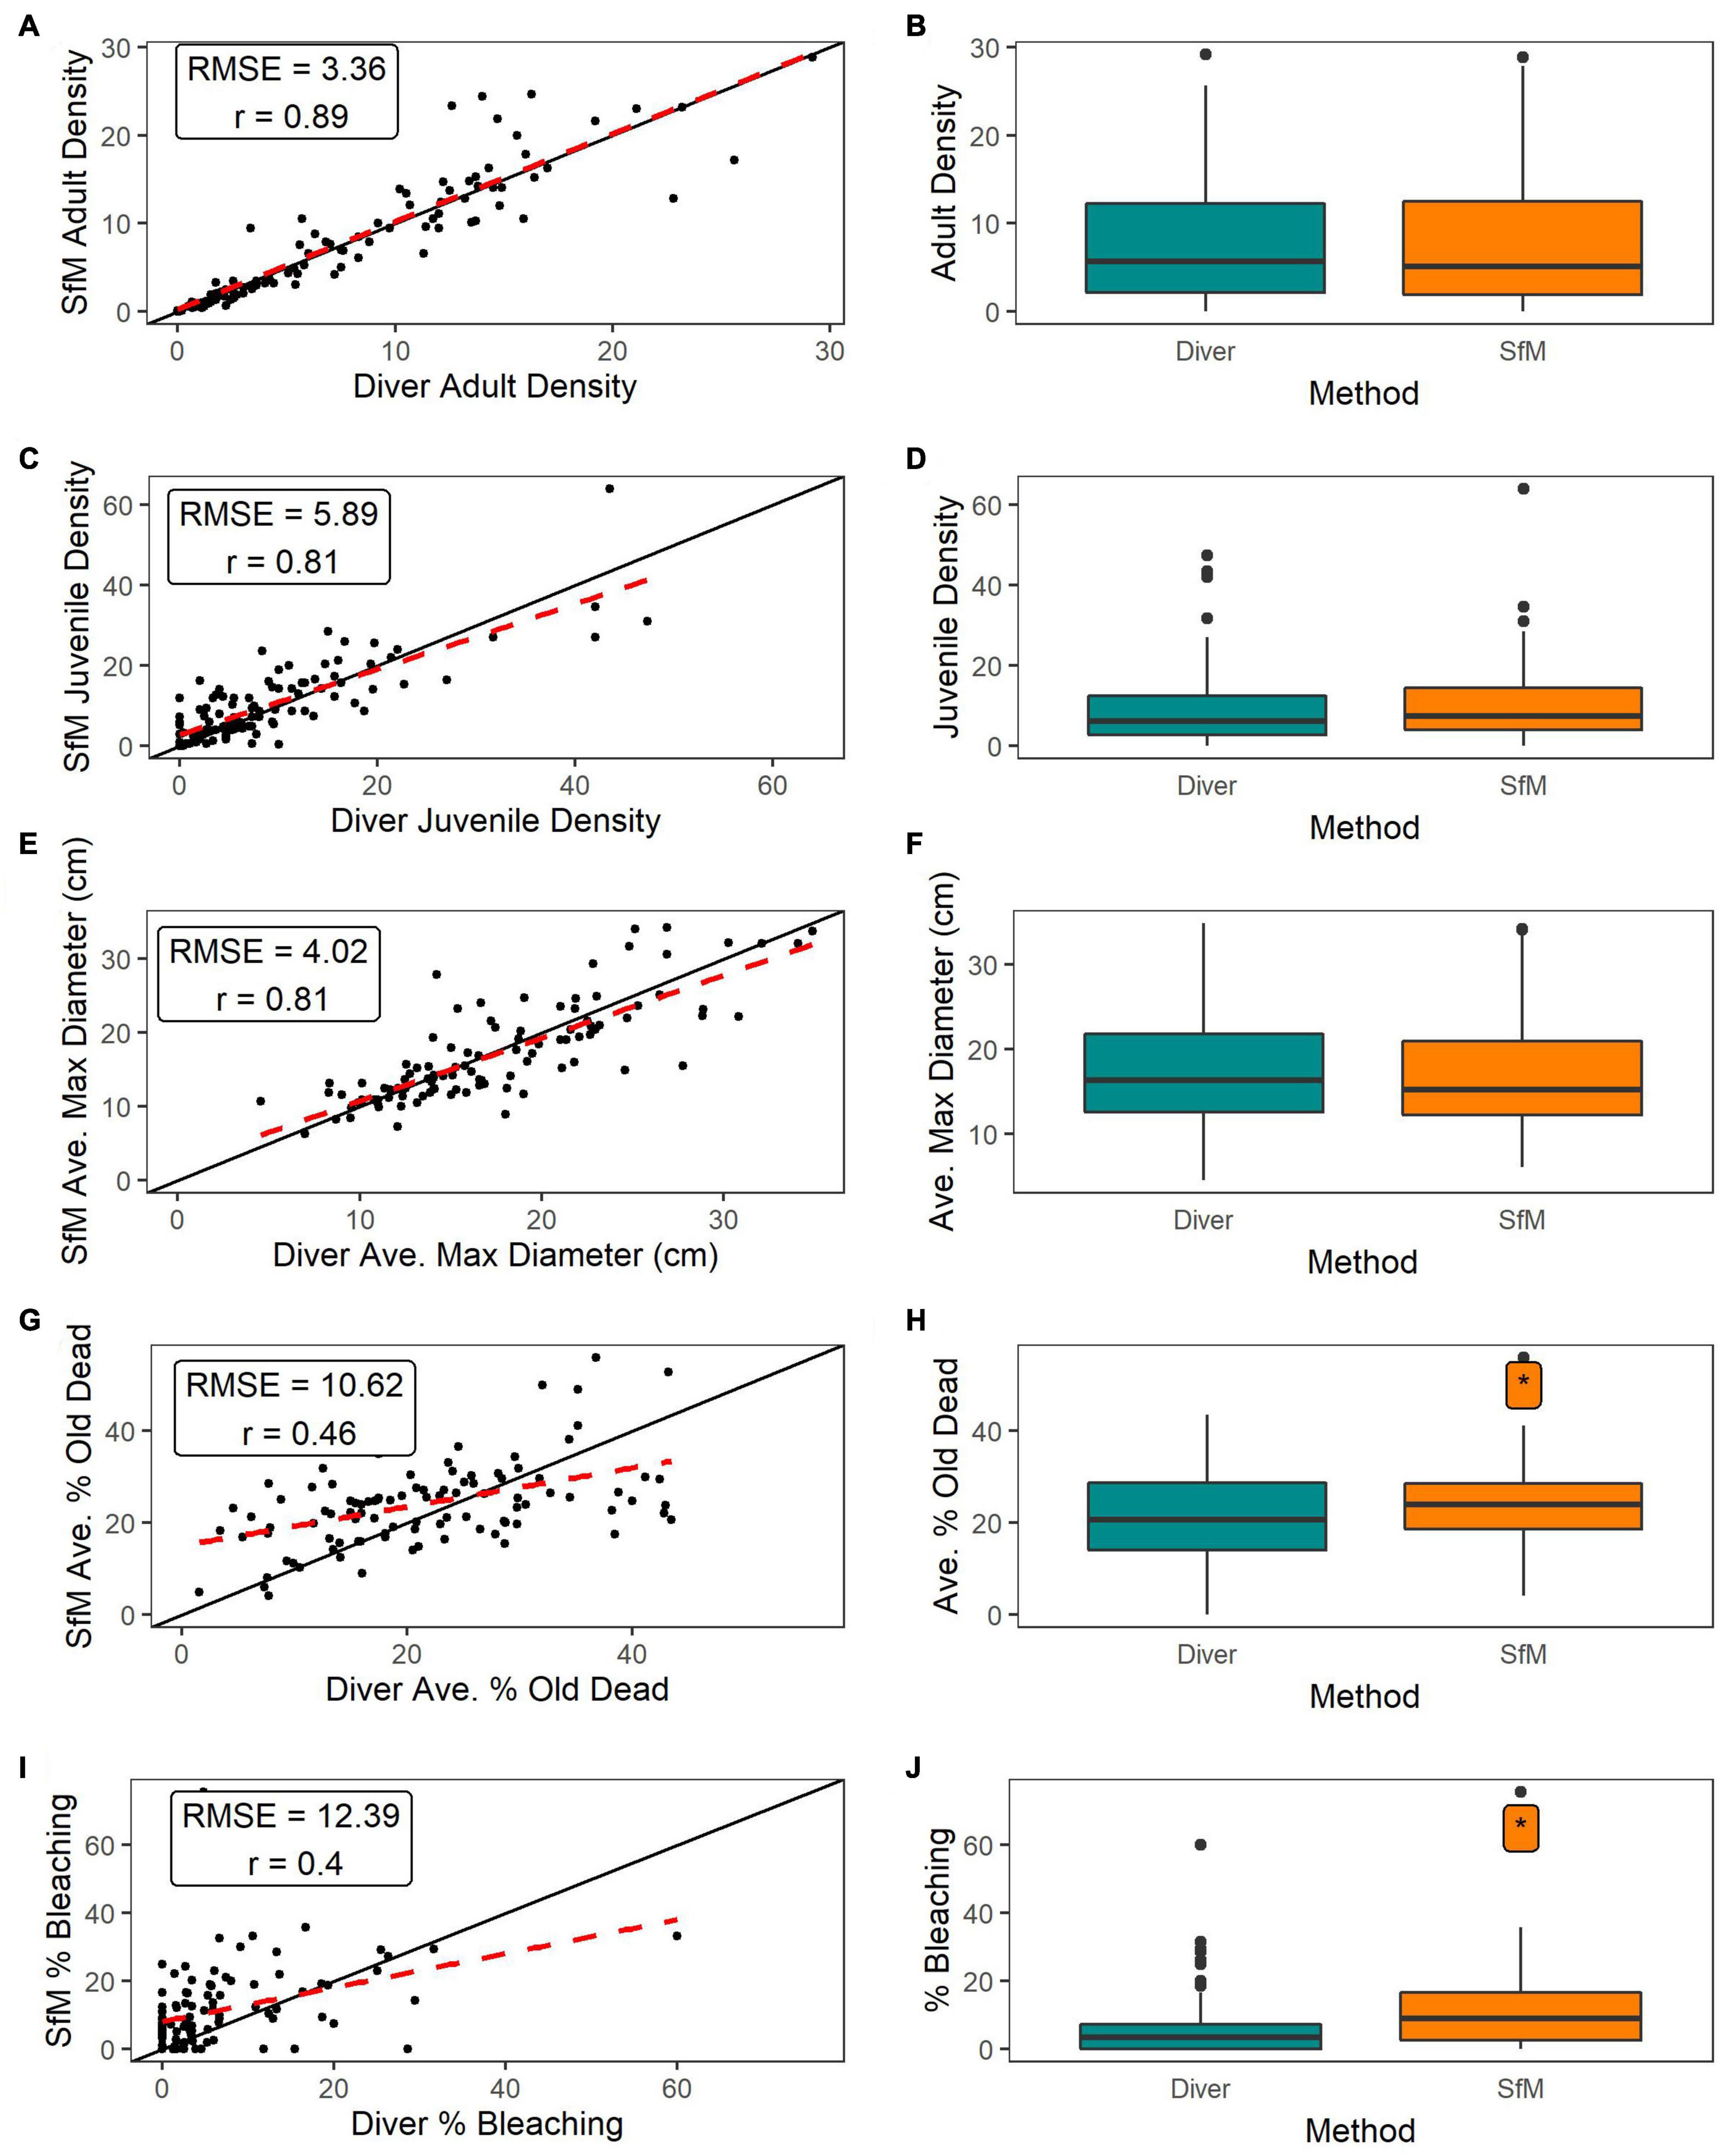
Figure 5. (A,C,E,G,I) 1:1 Plots of the paired site-level SfM versus diver data for adult colony density, juvenile colony density, average adult maximum diameter, average adult colony percent old partial mortality, and bleaching prevalence, respectively (points). Black line is 1:1 line, red dashed line is linear regression line for all 1:1 plots. (B,D,F,H,J) Boxplots of site-level data by method type for adult colony density, juvenile colony density, average adult maximum diameter, average adult colony percent old partial mortality, and bleaching prevalence, respectively. Asterisk, when present, indicates significant difference between methods based on LMMs and LRTs (B,D,F,H) and nonparametric Wilcoxon Test (J) (α = 0.05).
Juvenile colony density was strongly correlated between methods with a low RMSE (Figure 5C). It does appear that SfM may be slightly underestimating juveniles relative to in-water surveys at higher densities, although we did not detect a significant methodological difference (Figure 5D and Supplementary Table 2). More observations are needed at higher densities to resolve this. Juvenile density did not vary significantly as a function of method and habitat (Supplementary Figure 3C and Supplementary Table 2). While there was no significant interaction of method and depth, SfM annotators recorded slightly higher juvenile density with increasing depth, with predicted SfM juvenile density approximately 6 colonies/m2 higher than in-water surveys at deep sites (Supplementary Figure 3D and Supplementary Table 2).
Adult average maximum diameter was strongly correlated with a low RMSE between methods (Figure 5E) and we did not detect a significant methodological difference (Figure 5F and Supplementary Table 2). There was no significant interaction of method and habitat (Supplementary Figure 3E and Supplementary Table 2), nor was the interaction of method and depth significant (Supplementary Figure 3F and Supplementary Table 2).
Average percent old dead was only moderately correlated with a high RMSE between methods (Figure 5G). SfM percent old partial mortality was significantly higher than in-water (Figure 5H and Supplementary Table 2). Although SfM percent old dead was higher than diver old dead in patch reef habitats, the interaction of method and habitat was not significant (Supplementary Figure 3G and Supplementary Table 2). There was no significant interaction between method and depth (Supplementary Figure 3H and Supplementary Table 2).
Bleaching prevalence was moderately correlated between methods with a higher RMSE (Figure 5I). SfM annotators recorded significantly higher bleaching compared to divers (Figure 5J and Supplementary Table 2). When considering each habitat separately, SfM bleaching prevalence was significantly higher than diver prevalence on aggregate reefs and prevalence did not vary between methods for the other habitats (Supplementary Figure 3I and Supplementary Table 2). Prevalence was similarly correlated with depth for both SfM (Spearman rho = 0.07) and in-water methods (Spearman rho = 0.08), suggesting that there is no interaction of method and depth (Supplementary Figure 3J).
For all three of the dominant coral genera in the main Hawaiian Islands, adult colony density was strongly correlated between methods, with the greatest correlation observed in Pocillopora (Supplementary Figures 4A–C). Adult density did not vary significantly between methods for any of the dominant genera (Supplementary Figures 4D–F and Supplementary Table 2). However, it does appear that divers may be underestimating adult Porites relative to SfM annotators at densities > 10 colonies/m2 and there was more variability between methods for Montipora densities > 10 colonies/m2 (Supplementary Figures 4A,B).
Juvenile colony density of the three dominant genera were moderately to strongly correlated between methods, with the weakest correlation observed in Montipora (Supplementary Figures 5A–C). SfM annotators observed significantly more juvenile Porites than divers, particularly at sites with low juvenile density (Supplementary Figure 5D and Supplementary Table 2). While Montipora and Pocillopora juvenile density was slightly lower for SfM compared to divers, we did not detect a significant difference between methods (Supplementary Figures 5E,F and Supplementary Table 2).
Adult species richness and Shannon-Wiener species diversity were strongly correlated between methods with a low RMSE (Figures 6A,C). It does appear that SfM may be slightly underestimating richness and diversity relative to in-water methods, although we did not detect a significant methodological difference (Figures 6B,D). Richness and diversity did not vary significantly by method x habitat (Supplementary Figures 6A,C and Supplementary Table 2), nor method × depth (Supplementary Figures 6B,D and Supplementary Table 2).
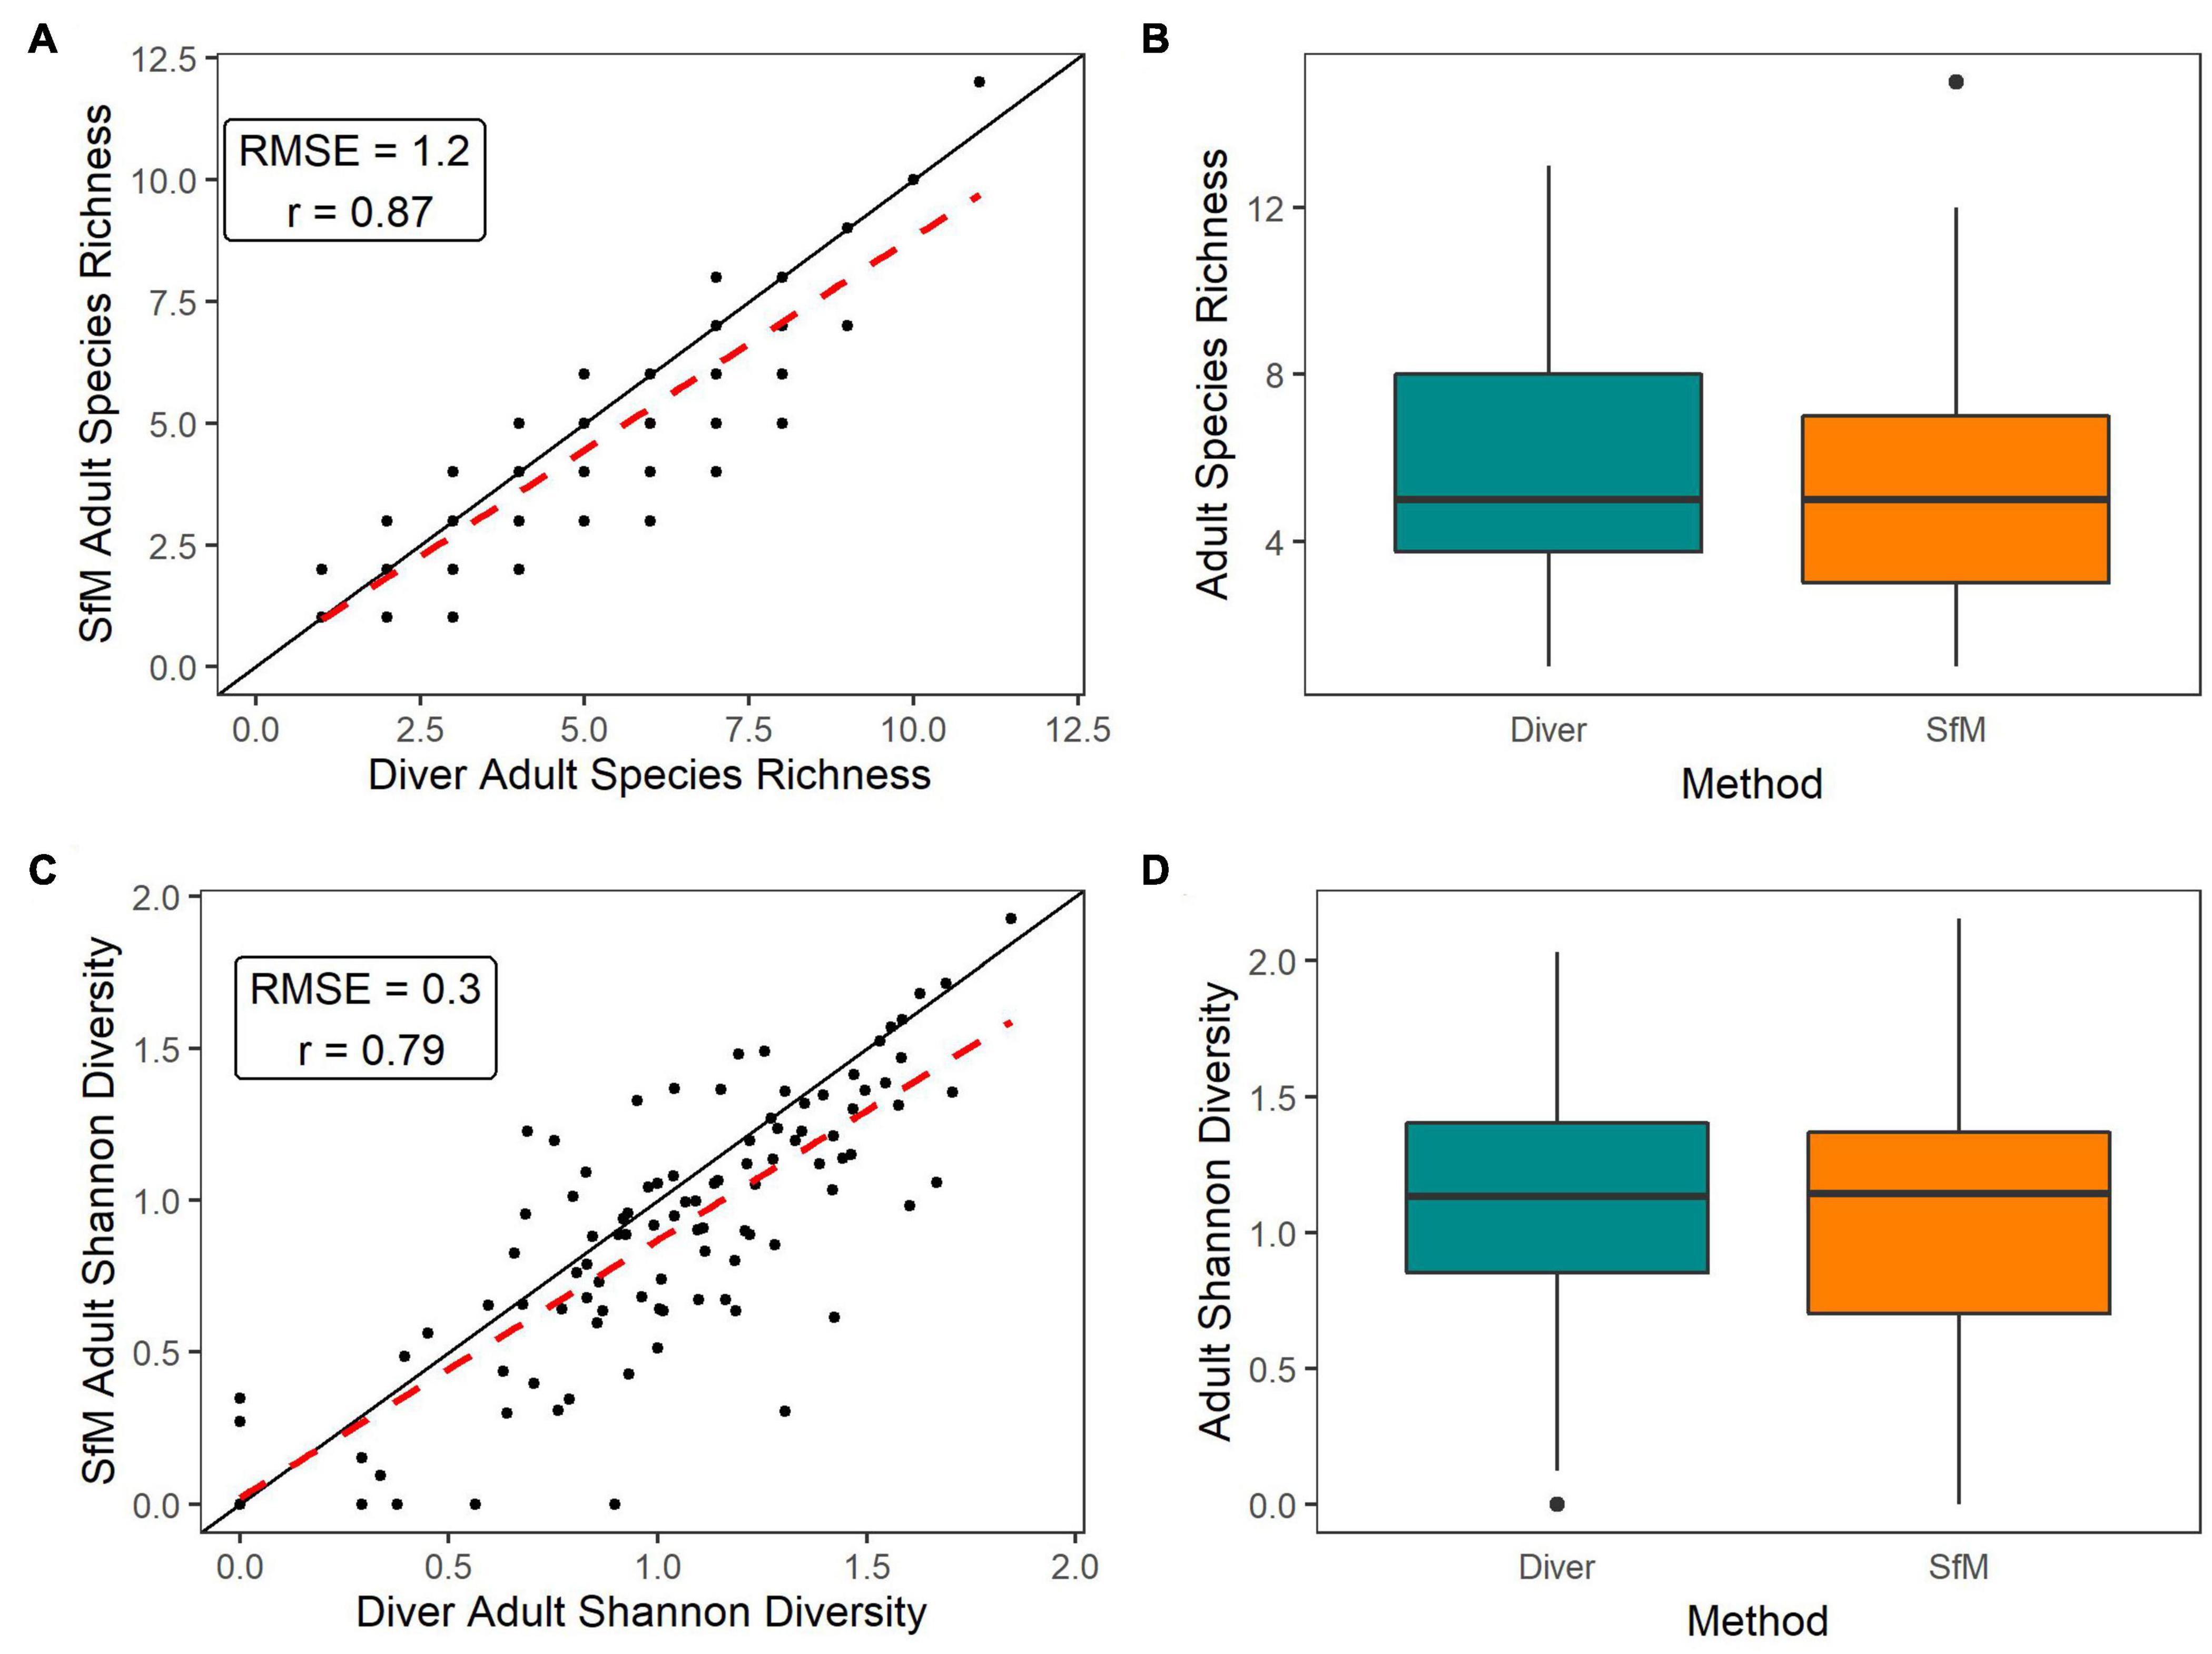
Figure 6. (A,C) 1:1 Plots of the paired site-level (points) SfM versus Diver data for adult species richness and adult Shannon-Wiener diversity, respectively. Black line is the 1:1 line, red dashed line is the linear regression line between methods. (B,D) Boxplots of site-level data by method type for adult species richness and adult Shannon-Wiener diversity, respectively. No significant between methods was detected using LMMs and LRTs (α = 0.05) (B,D).
Differences across methods for five of the seven total scleractinian metrics and five of the six dominant genera metrics showed no significant difference from zero (Figures 5,6 and Supplementary Figures 4, 5) and overall, the between-method error (MAE) was very low for all metrics (Supplementary Figures 7, 8). The power analysis (Supplementary Figures 7, 8) suggests that we have an adequate sample size to detect a significant difference between methods, especially as six of the seven observed MAEs for total scleractinians and three of the six dominant taxa metrics show non-significant estimates at or above our power analysis effect size. This suggests that the consistent pattern of small and non-significant differences between methods is not due to a lack of statistical power, but instead due to well-supported similarities in the results across methodologies.
Understanding the scale of threats to coral reefs and implementing timely management strategies to slow degradation has motivated the scientific community to explore SfM as a tool for expanding the scale of reef monitoring and improving the efficiency of field data collection by replacing visual surveys. Our results suggest that there is little evidence of consistent methodological bias between in-water collection and SfM imagery in the metrics included in this study.
Overall, our results suggest that adult colony density, average colony diameter, species richness and species diversity were strongly correlated between methods and did not vary significantly between methods across habitats or depths (Figures 5, 6 and Supplementary Figures 3, 6). While this is the first study comparing in-water to SfM generated data for these metrics, several studies have conducted similar comparative analysis of density and richness using visual surveys and other imagery based methods. Contrary to our results, Page et al. (2016) found that colony density was inflated in 2D photoquadrat images compared to in-water surveys because colony bases of branching colonies were often obscured in the 2D images and continuity of tissues between branches could not be confirmed, leading annotators to assume that each branch was a physiologically discrete colony. However, similarly to our study, Jokiel et al. (2015) found that coral species richness was similar between in-water visual methods (i.e., point intercept transect and quadrats) and imaging methods such as video and photoquadrats. These studies highlight that while photoquadrat imagery may be appropriate for quantifying diversity in low diversity systems, SfM’s ability to capture the reef from a variety of angles provides a significant improvement over standard photoquadrat methods.
Quantifying juveniles can be challenging given their small size and cryptic nature, sometimes preferring crevices and vertical surfaces to exposed substrates (Babcock and Mundy, 1996; Edmunds et al., 2004). For these reasons, we hypothesized that SfM may underestimate juvenile density. However, our results indicate that density was strongly correlated between methods and there was no significant difference for all taxa combined between methods, nor between methods across habitats and depths. These results are not consistent with previous studies that found that photoquadrat methods significantly underestimate juvenile density compared to in-water observations (Edmunds et al., 1998; Burgess et al., 2010), which the authors attribute to juvenile colonies growing in cryptic microhabitats. These conflicting results may be partly due to the fact that Burgess et al. (2010) only quantified juveniles < 0.5 cm diameter where our study quantified juveniles between 0.7 and 4.9 cm. While juveniles < 0.7 cm could often be detected using SfM in our study, we did not include them due to the challenges of consistently identifying these smaller size classes regardless of method. Our results indicate that it is important to consider the size range of juveniles when comparing across studies and methods, but also indicate that SfM is able to capture many of the cryptic habitats that are not visible using two dimensional photoquadrat images commonly used by many monitoring programs. In addition, significant improvements in digital camera technology and image resolution since these earlier studies were conducted may have also contributed to differing results. Juvenile colony density for Porites among SfM observers was significantly higher than recorded by divers. Porites juveniles tend to be more inconspicuous than other juvenile taxa, often blending in with the substrate due to their muted color and low profile. In fact, when we evaluated the quality of SfM annotations, the most common issue across all annotators was missing juveniles. While we were able to review and correct this in the SfM dataset, we were not able to correct missing juveniles in the in-water dataset.
Metrics that rely on direct counts or measurements (such as colony density and size) were more strongly correlated between methods than metrics that rely on visual estimates of extent (such as percent partial mortality). Specifically, old dead was significantly higher using SfM compared to in-water methods, but did not vary significantly between methods across habitats and depths. However, the absolute difference in old mortality estimates between methods (MAE) was low, i.e., only 1.27% (Supplementary Figure 7) relative to the overall mean of 23% averaged across both methods. One possible explanation for the higher levels of partial mortality in SfM is that with unlimited “bottom time”, annotators have more time to review colonies and record lower levels of partial mortality (especially below 20%) than divers who may be more likely to miss low levels. SfM annotators may also be underestimating mortality on branching colonies where it is difficult to see the bases of colonies.
Estimating old partial mortality can be challenging due to the coarse nature of this metric (recorded in 5% increments) and the challenges identifying colony boundaries consistently across observers. Identifying the boundaries of colonies is a fundamental challenge of these types of demographic surveys regardless of whether surveys are conducted underwater or behind a computer. As colonial organisms, corals can fragment into tissue patches. Our methods dictate that observers identify colonies by lumping together tissue fragments of a similar color and morphology on the same skeletal structure into one colony (Winston et al., 2020). Enumerating and sizing colonies can also be challenging when partial mortality is not recent and colonies are densely aggregated, likely explaining why we observed higher variability between methods at higher colony densities and larger mean colony diameter (Figure 4). Fragmentation is also especially common for taxa such as Porites and Montipora, resulting in difficulty distinguishing between tissue fragments and sexual recruits. Despite significant diver and annotator training, this variability is likely partially explained by variability between observers. The role of observer error in these patterns is supported by the fact that we reported that variability between divers in adult density and adult maximum diameter is comparable to differences between methods (Figure 4). The challenges of identifying colonies and recording demographic information are most certainly not unique to our program. Monitoring programs can continue to improve the quality of their datasets by more rigorous training and quantitative calibration of field staff. In addition, with lower error between observers (Figure 4) and the ability to virtually revisit plots, SfM may provide an opportunity to reduce observer error more effectively than visual surveys.
With increasing severity and frequency of mass coral bleaching events, many monitoring programs are looking to quantify coral bleaching over large areas using digital imagery (Lafratta et al., 2017; Levy et al., 2018; Fox et al., 2019; Ritson-Williams and Gates, 2020). In our study, bleaching prevalence was significantly higher in SfM compared to in-water assessments with an MAE of 8.07%. However, care should be taken when interpreting bleaching MAE as data were highly zero-inflated. As this phenomenon was particularly noticeable on aggregate reefs, one possible explanation for this pattern is that aggregate reefs generally have higher colony density, which means that divers, with limited bottom time to conduct surveys, are more task loaded and may be prone to overlooking low to moderate levels of bleaching. It is also possible that imagery from some sites may have appeared slightly overexposed, leading to overestimation of bleaching in SfM. However, we expect the effects of overexposure to be minimal because cameras were white balanced at depth, imagery was rigorous quality controlled, and all SfM annotators used the same monitors and settings. Our results differ slightly from previous studies that found bleaching estimates did not differ between in-water and photoquad (Page et al., 2016) or SfM surveys (Burns et al., 2020). Previous studies were conducted on a very limited number of shallow homogenous sites; therefore, it is unsurprising that our results differ given that we surveyed 104 sites distributed across a large range of depths, turbidity, lighting, and habitats. Our study was also conducted during the early stages of the 2019 Hawaii bleaching event, and although severe bleaching is easy to identify, low to moderate levels that were more common during the time of these surveys were more challenging to quantify consistently. While SfM annotators could discuss bleaching levels and revise annotations, divers were unable to do this underwater and may have been more conservative.
Both in-water and SfM survey methods have a variety of strengths and weaknesses for coral demographic and community surveys (Table 1), and which method to choose depends on the research question, the timeline for data dissemination, and logistical constraints of the survey. Similar to Burns et al. (2020), our study highlights that there may not be a “gold standard” for colony-level surveys, and observed methodological differences can highlight deficiencies in either method. In-water surveys allow divers to look at corals at the polyp-level from all possible angles, which is important for observing taxa located in crevices, under overhangs, or covered by sand or algae. It also allows scientists to exit the water with data that require minimal post-processing, resulting in summarized data on the order of weeks to months. However, in-water monitoring also has several weaknesses. Surveys generally require more field effort. For example, our program’s in-water assessments require 45–60 min with a three-person team to complete one site. Given the longer dive time and the number of metrics collected underwater, it can be more strenuous to survey in poor conditions and diver fatigue can impact data quality. With limited bottom time, measurements of size and habitat complexity are generally measured or estimated at coarse levels, and the reef area that can be surveyed by divers is often reduced or requires two dives when surveying deeper reefs. Lastly, visual survey data does not allow divers to verify or re-evaluate the benthos, which can lead to unmitigated observer error.
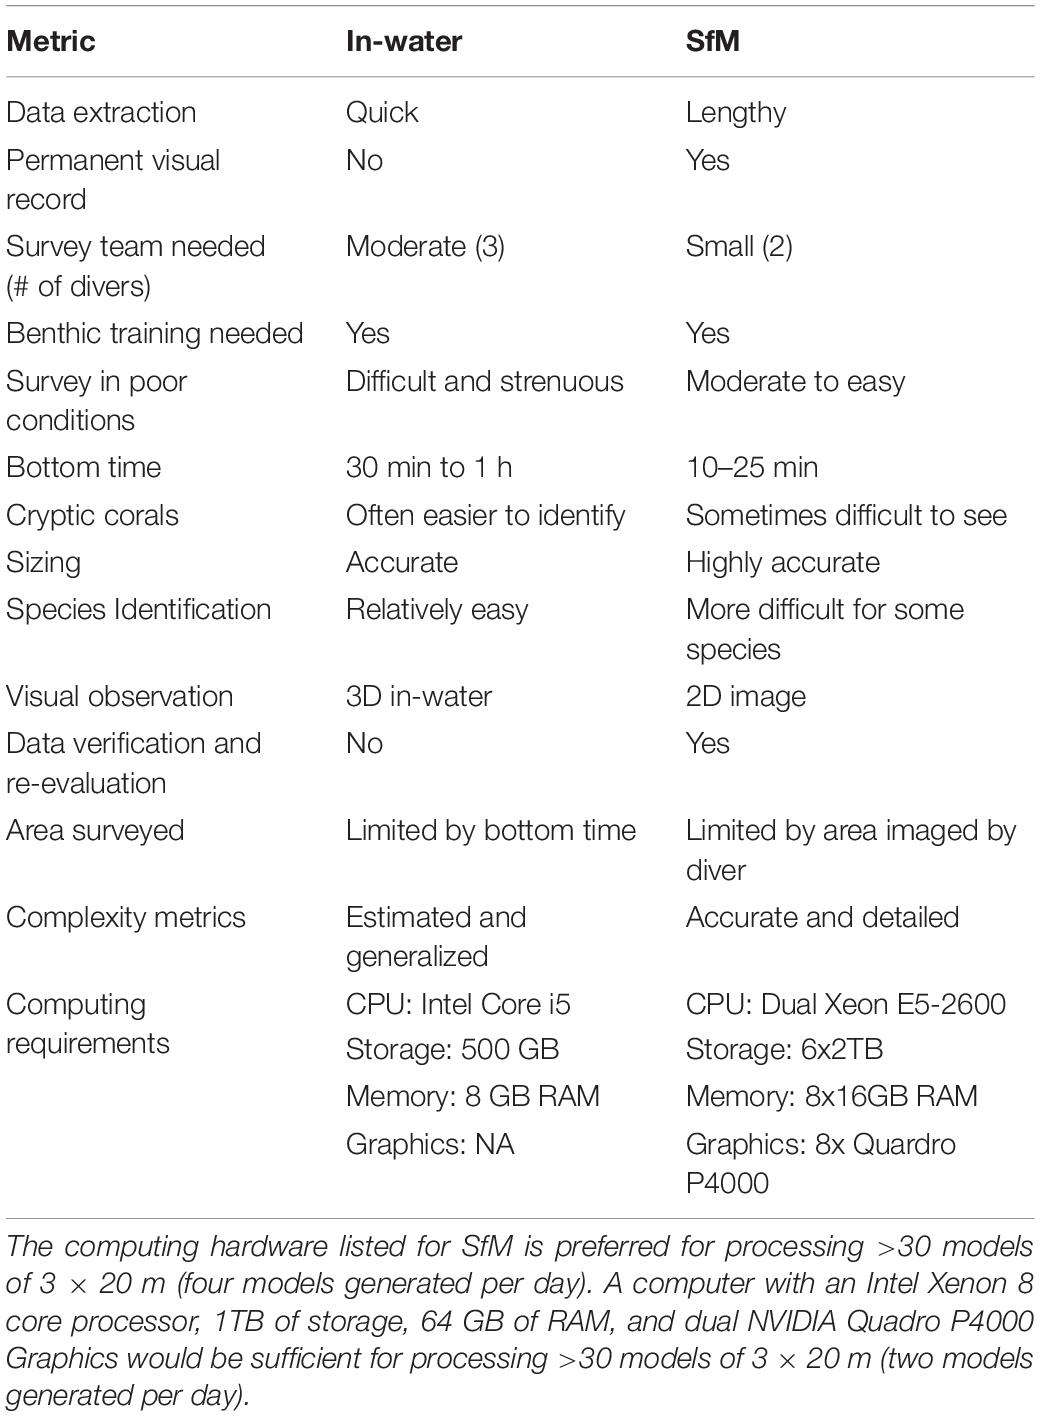
Table 1. Comparison of in-water and SfM strengths and weaknesses.
Conducting SfM surveys in the field is generally more time efficient depending on the size and shape of the plot, which reduces field costs. For example, our program requires 15–20 min with two divers to complete a 3 × 20 m SfM belt survey, compared to a 45–60 min with three divers for an in-water survey. Overall when comparing the total time needed to collect data during a NCRMP survey mission, SfM reduced field time by 55%. While we did not measure habitat complexity in this study, other studies have found that SfM allows scientists to more accurately quantify reef complexity compared to common in-water methods such as “chain and tape” or visual estimates (Storlazzi et al., 2016; Bayley et al., 2019). Contrary to in-water methods, SfM annotators are not limited by time, can take breaks when fatigued, and the area sampled is only limited by the extent of the reef that is imaged. Annotators also have the opportunity to converse during data recording to improve consistency, thus reducing observer error. The SfM method allows, for the first time, the ability to use a more comprehensive quality control process, produce statistically robust error rates and correct observer error by revisiting the imagery. Finally, with SfM the survey provides a permanent visual record, allowing for additional metrics to be extracted in future projects.
One of the primary weaknesses of SfM for colony-level surveys is the time it takes to extract data from the imagery, which is on the order of months to a year depending on the number of sites, annotators, and access to computational resources, leading to delays in data dissemination. For example, in this study, an average of 9 h of hands-on time was needed to generate 3D and 2D products, manually annotate, and QC data per site (most was manual annotation). In addition to the significant manual annotation time, SfM also requires a substantial investment in hardware such as digital cameras, software, and GPU-accelerated computers to process models efficiently. Another weakness is that annotators are limited by the quality and coverage of the imagery. If the imagery is poor quality or has poor overlap then it may be difficult to achieve polyp-level detail or fully capture all of the colonies. This can make species and coral health identification challenging. Even with good image coverage, SfM cannot capture all of the surfaces that divers can assess in in-water surveys. Therefore, it may also be appropriate to consider a hybrid of in-water and SfM to capture more polyp-level detail and balance in-field and annotation costs. While the time needed to implement each stage of these methods will vary in accordance with the experience of the individual and complexity of the reef, a comparison of the average time to execute each stage of the in situ versus SfM surveys can be found in Couch et al. (2021; see Table 2).
Our study provides compelling evidence that with careful consideration to how imagery is collected, SfM may increase efficiency in the field and access to a wealth of other types of data such as habitat complexity, urchin density, and coral growth rates. Our study also highlights that SfM provides an opportunity to more rigorously quantify and mitigate inter-observer error, thus improving our ability to detect smaller changes in the benthos. While SfM provides a powerful tool to reimagine how we study and manage coral reefs, it may not be the best fit for every program and practitioners should carefully weigh the strengths and weaknesses of standard in-water and SfM survey methods. Addressing SfM’s weaknesses outlined above and making this approach more broadly accessible will require a series of steps.
To maximize data quality and utility of SfM, it is paramount that divers prioritize the collection of quality imagery using guidelines such as those described by Suka et al. (2019). Collecting properly color balanced and sharp images is the foundation for quality annotations and derived data products. In addition, shooting from more than one angle allows divers to capture colonies on vertical or concave surfaces and reduce gaps in the model. This may be especially important in habitats with high complexity.
One of the largest hurdles to overcome with SfM is the significant annotation and post-processing time/resources necessary to extract data. The rapidly expanding field of artificial intelligence (AI) has the potential to significantly reduce the amount of human interaction time required to extract data from SfM imagery. While AI tools are potentially revolutionary for scaling up coral reef monitoring, they cannot fully replace humans and tools should continue to leverage human expertise by employing “human-in-the-loop” approaches. This challenge is currently being tackled for coral reef monitoring using a variety of approaches such as CoralNet, a widely used machine-learning image analysis tool for point classification (Beijbom et al., 2015); an encoder-decoder convolutional neural network (CNN) for semantic segmentation leveraging human annotated sparse points (Alonso et al., 2017); TagLab, an interactive semantic segmentation tool that integrates CNN results and previous human labeling (Pavoni et al., 2019); the use of bounding boxes to more efficiently identify benthic features for humans to annotate (Mandel et al., 2019; Modasshir and Rekleitis, 2020); NemoNet, a CNN approach with a citizen-scientist videogame to generate training data and segment benthic features (Chirayath and Li, 2019); and AI challenges that invite computer scientists to develop completely novel automated solutions to delineation (Ionescu et al., 2019). While 2D orthoprojections are still the “industry-standard” for SfM work, annotating natively in 3D will provide more accurate assessments of structure, vital rates, and diversity, especially in dense, structurally complex reefs. These advances will help move annotation from a mostly hands-on, time-intensive approach to a semi-automated workflow, and shifts annotation from 2D to 3D space. The hardware and software investment needed to generate the DPCs, 2D products and derived benthic metrics efficiently may exceed the means of most small monitoring programs. To address this challenge, current SfM practitioners should identify opportunities to develop infrastructure for cloud processing, data sharing and data storage.
The datasets presented in this study can be found in online repositories. The names of the repository/repositories and accession number(s) can be found at: https://www.fisheries.noaa.gov/inport/item/36164 and https://www.fisheries.noaa.gov/inport/item/63097.
CC was the project manager and was responsible for all aspects of this study from project inception, data collection, data analysis, data management, and writing. TO and RS contributed to project inception, data collection, data analysis, data management, and writing. ML, MA, CA, FL, and AH were responsible for image post processing/annotation and the manuscript review. BV-Á, MW, BH, and AG assisted with data collection in the field and the manuscript review. JG assisted with data collection in the field. JS assisted with the manuscript review and overall project management. All authors contributed to the article and approved the submitted version.
This work was funded by the NOAA Coral Reef Conservation Program, as part of the Pacific-National Coral Reef Monitoring Program.
The authors declare that the research was conducted in the absence of any commercial or financial relationships that could be construed as a potential conflict of interest.
We would like to thank Raymond Boland, Noah Pomeroy, and the crew of the NOAA vessel Oscar Elton Sette for providing field support during the main Hawaiian Islands Rapid Assessment and Monitoring Cruise. We would also like to thank Michael Akridge, Brooke Olenski, Kevin Trick, and Annette DesRochers for assistance with development and maintenance of the data management pipeline. We also thank Stuart Sandin, John Burns, Nicole Pederson, Vid Petrovic, and Clinton Edwards for support with field testing, methods development and implementation of SfM.
The Supplementary Material for this article can be found online at: https://www.frontiersin.org/articles/10.3389/fmars.2021.647943/full#supplementary-material
Alonso, I., Cambra, A., Muñoz, A., Treibitz, T., and Murillo, A. C. (2017). “Coral-segmentation: training dense labeling models with sparse ground truth,” in Proceedings - 2017 IEEE International Conference on Computer Vision Workshops, ICCVW 2017, (Venice), doi: 10.1109/ICCVW.2017.339
Babcock, R., and Mundy, C. (1996). Coral recruitment: consequences of settlement choice for early growth and survivorship in two scleractinians. J. Exp. Mar. Bio. Ecol. 206, 179–201. doi: 10.1016/S0022-0981(96)02622-6
Baskett, M. L., Fabina, N. S., and Gross, K. (2014). Response diversity can increase ecological resilience to disturbance in coral reefs. Am. Nat. 184, E16–E31. doi: 10.1086/676643
Bayley, D. T. I., Mogg, A. O. M., Koldewey, H., and Purvis, A. (2019). Capturing complexity: field-testing the use of “structure from motion” derived virtual models to replicate standard measures of reef physical structure. PeerJ 7:e6540. doi: 10.7717/peerj.6540
Beijbom, O., Edmunds, P. J., Roelfsema, C., Smith, J., Kline, D. I., Neal, B. P., et al. (2015). Towards automated annotation of benthic survey images: variability of human experts and operational modes of automation. PLoS One 10:1–22. doi: 10.1371/journal.pone.0130312
Bruno, J. F., and Selig, E. R. (2007). Regional decline of coral cover in the indo-pacific: timing, extent, and subregional comparisons. PLoS One 2:e711. doi: 10.1371/journal.pone.0000711
Bryson, M., Ferrari, R., Figueira, W., Pizarro, O., Madin, J., Williams, S., et al. (2017). Characterization of measurement errors using structure-from-motion and photogrammetry to measure marine habitat structural complexity. Ecol. Evol. 7, 5669–5681. doi: 10.1002/ece3.3127
Burgess, S. C., Osborne, K., Sfiligoj, B., and Sweatman, H. (2010). Can juvenile corals be surveyed effectively using digital photography: implications for rapid assessment techniques. Environ. Monit. Assess. 171, 345–351. doi: 10.1007/s10661-009-1282-1
Burns, J., Delparte, D., Gates, R., and Takabayashi, M. (2015a). Integrating structure-from-motion photogrammetry with geospatial software as a novel technique for quantifying 3D ecological characteristics of coral reefs. PeerJ 3:e1077. doi: 10.7717/peerj.1077
Burns, J. H. R., Delparte, D., Gates, R. D., and Takabayashi, M. (2015b). “Utilizing underwater three-dimensional modeling to enhance ecological and biological studies of coral reefs,” in Proceedings of the International Archives of the Photogrammetry, Remote Sensing and Spatial Information Sciences - ISPRS Archives, (Piano di Sorrento), doi: 10.5194/isprsarchives-XL-5-W5-61-2015
Burns, J. H. R., Weyenberg, G., Mandel, T., Ferreira, S. B., Gotshalk, D., Kinoshita, C. K., et al. (2020). A comparison of the diagnostic accuracy of in-situ and digital image-based assessments of coral health and disease. Front. Mar. Sci. 7:304. doi: 10.3389/fmars.2020.00304
Carleton, J. H., and Done, T. J. (1995). Quantitative video sampling of coral reef benthos: large-scale application. Coral Reefs 14, 35–46. doi: 10.1007/BF00304070
Casella, E., Collin, A., Harris, D., Ferse, S., Bejarano, S., Parravicini, V., et al. (2017). Mapping coral reefs using consumer-grade drones and structure from motion photogrammetry techniques. Coral Reefs 36, 269–275. doi: 10.1007/s00338-016-1522-0
Chirayath, V., and Li, A. (2019). Next-Generation Optical Sensing Technologies for Exploring Ocean Worlds—NASA FluidCam, MiDAR, and NeMO-Net. Front. Mar. Sci. 6:521. doi: 10.3389/fmars.2019.00521
Conand, C., Chabanet, P., Quod, J.-P., and Bigot, L. (1999). Guidelines for Coral Reef Monitoring in the South-West Region of the Indian Ocean. Mauritius: commission de l’océan indien.
Connell, J. H., Hughes, T. P., and Wallace, C. C. (1997). A 30-year study of coral abundance, recruitment, and disturbance at several scales in space and time. Ecol. Monogr. 67, 461–488.
Couch, C., Suka, R., Oliver, T., Lamirand, M., Asbury, M., Amir, C., et al. (2021). Comparing Coral Demographic Surveys From in Situ Observations and Structure-From-Motion Imagery Shows Low Methodological Bias. PIFSC Administrative Report, H-21-01. Honolulu, HI: PIFSC Administrative, doi: 10.25923/307k-fk90
De’ath, G., Fabricius, K. E., Sweatman, H., and Puotinen, M. (2012). The 27–year decline of coral cover on the Great Barrier Reef and its causes. Proc. Natl. Acad. Sci.U.S.A. 109, 17995–17999.
Donnelly, R., Neville, D., and Mous, P. (2003). Report on a rapid ecological assessment of the Raja Ampat islands, Papua, Eastern Indonesia, held October 30 - november 22, 2002. Bali: The Nature Conservancy Bali Indonesia,Google Scholar
Edmunds, P. J., Aronson, R. B., Swanson, D. W., Levitan, D. R., and Precht, W. F. (1998). Photographic versus visual census techniques for the quantification of juvenile corals. Bull. Mar. Sci. 62, 937–946.
Edmunds, P. J., Bruno, J., and Carlon, D. (2004). Effects of depth and microhabitat on growth and survivorship of juvenile corals in the Florida Keys. Mar. Ecol. Ser. 278, 115–124. doi: 10.3354/meps278115
Edmunds, P. J., and Elahi, R. (2007). The demographics of a 15-year decline in cover of the Caribbean reef coral Montastraea annularis. Ecol. Monogr. 77, 3–18.
Edmunds, P. J., and Riegl, B. (2020). Urgent need for coral demography in a world where corals are disappearing. Mar. Ecol. Prog. Ser. 635, 233–242. doi: 10.3354/MEPS13205
Edwards, C. B., Eynaud, Y., Williams, G. J., Pedersen, N. E., Zgliczynski, B. J., Gleason, A. C. R., et al. (2017). Large-area imaging reveals biologically driven non-random spatial patterns of corals at a remote reef. Coral Reefs 36, 1291–1305. doi: 10.1007/s00338-017-1624-3
English, S., Wilkinson, C., and Baker, V. (1994). Survey Manual for Tropical Marine Resources. Townsville AUS: Australian Institute of Marine Science.
Ferrari, R., Figueira, W. F., Pratchett, M. S., Boube, T., Adam, A., Kobelkowsky-Vidrio, T., et al. (2017). 3D photogrammetry quantifies growth and external erosion of individual coral colonies and skeletons. Sci. Rep. 7:16737. doi: 10.1038/s41598-017-16408-z
Figueira, W., Ferrari, R., Weatherby, E., Porter, A., Hawes, S., and Byrne, M. (2015). Accuracy and precision of habitat structural complexity metrics derived from underwater photogrammetry. Remote Sens. 7, 16883–16900. doi: 10.3390/rs71215859
Fox, M. D., Carter, A. L., Edwards, C. B., Takeshita, Y., Johnson, M. D., Petrovic, V., et al. (2019). Limited coral mortality following acute thermal stress and widespread bleaching on Palmyra Atoll, central Pacific. Coral Reefs 38, 701–712. doi: 10.1007/s00338-019-01796-7
Fukunaga, A., Burns, J. H. R., Pascoe, K. H., and Kosaki, R. K. (2020). Associations between benthic cover and habitat complexity metrics obtained from 3d reconstruction of coral reefs at different resolutions. Remote Sens. 12:1011. doi: 10.3390/rs12061011
García-Urueña, R., and Garzón-Machado, M. A. (2020). Current status of Acropora palmata and Acropora cervicornis in the Colombian Caribbean: demography, coral cover and condition assessment. Hydrobiologia 847, 2141–2153. doi: 10.1007/s10750-020-04238-6
Hernández-Landa, R. C., Barrera-Falcon, E., and Rioja-Nieto, R. (2020). Size-frequency distribution of coral assemblages in insular shallow reefs of the Mexican Caribbean using underwater photogrammetry. PeerJ 8:e8957. doi: 10.7717/peerj.8957
Heron, S. F., Johnston, L., Liu, G., Geiger, E. F., Maynard, J. A., De La Cour, J. L., et al. (2016). Validation of reef-scale thermal stress satellite products for coral bleaching monitoring. Remote Sens. 8:59.
Hoegh-Guldberg, O., Mumby, P. J., Hooten, A. J., Steneck, R. S., Greenfield, P., Gomez, E., et al. (2007). Coral reefs under rapid climate change and ocean acidification. Science 318, 1737–1742. doi: 10.1126/science.1152509
Houk, P., and Van Woesik, R. (2006). Coral reef benthic video surveys facilitate long-term monitoring in the commonwealth of the northern mariana islands: toward an optimal sampling strategy. Pacific Sci. 60, 177–189. doi: 10.1353/psc.2006.0005
Hughes, T. P., Kerry, J. T., Baird, A. H., Connolly, S. R., Dietzel, A., Eakin, C. M., et al. (2018). Global warming transforms coral reef assemblages. Nature 556, 492–496. doi: 10.1038/s41586-018-0041-2
Ionescu, B., Müller, H., Péteri, R., Cid, Y. D., Liauchuk, V., and Kovalev, V., et al. (eds) (2019). “ImageCLEF 2019: multimedia retrieval in medicine, lifelogging, security and nature,” in Lecture Notes in Computer Science (including subseries Lecture Notes in Artificial Intelligence and Lecture Notes in Bioinformatics), eds F. Crestani et al. (Cham: Springer), doi: 10.1007/978-3-030-28577-7_28
Jokiel, P. L., Rodgers, K. S., Brown, E. K., Kenyon, J. C., Aeby, G., Smith, W. R., et al. (2015). Comparison of methods used to estimate coral cover in the Hawaiian Islands. PeerJ 2015:e954. doi: 10.7717/peerj.954
Kodera, S. M., Edwards, C. B., Petrovic, V., Pedersen, N. E., Eynaud, Y., and Sandin, S. A. (2020). Quantifying life history demographics of the scleractinian coral genus Pocillopora at Palmyra Atoll. Coral Reefs 39, 1091–1105. doi: 10.1007/s00338-020-01940-8
Lafratta, A., Fromont, J., Speare, P., and Schönberg, C. H. L. (2017). Coral bleaching in turbid waters of north-Western Australia. Mar. Freshw. Res. 68, 65–75. doi: 10.1071/MF15314
Lamb, J. B., True, J. D., Piromvaragorn, S., and Willis, B. L. (2014). Scuba diving damage and intensity of tourist activities increases coral disease prevalence. Biol. Conserv. 178, 88–96. doi: 10.1016/j.biocon.2014.06.027
Lange, I. D., and Perry, C. T. (2020). A quick, easy and non-invasive method to quantify coral growth rates using photogrammetry and 3D model comparisons. Methods Ecol. Evol. 11, 714–726. doi: 10.1111/2041-210X.13388
Levy, J., Hunter, C., Lukacazyk, T., and Franklin, E. C. (2018). Assessing the spatial distribution of coral bleaching using small unmanned aerial systems. Coral Reefs 37, 373–387. doi: 10.1007/s00338-018-1662-5
Loya, Y. (1972). Community structure and species diversity of hermatypic corals at Eilat, Red Sea. Mar. Biol. 13, 100–123. doi: 10.1007/BF00366561
Loya, Y., Sakai, K., Yamazato, K., Nakano, Y., Sambali, H., and van Woesik, R. (2001). Coral bleaching: the winners and the losers. Ecol. Lett. 4, 122–131.
Mandel, T., Gotshalk, D., Del Moral, N., Wilde, D., Marshall, M., Spengler, A., et al. (2019). “Balancing human and machine performance when analyzing image cover,” in Proceedings of the 6th Annual Conference on Computational Science and Computational Intelligence, CSCI 2019, (Las Vegas, NV), doi: 10.1109/CSCI49370.2019.00125
Miller, J., Muller, E., Rogers, C., Waara, R., Atkinson, A., Whelan, K. R. T., et al. (2009). Coral disease following massive bleaching in 2005 causes 60% decline in coral cover on reefs in the US Virgin Islands. Coral Reefs 28, 925–937. doi: 10.1007/s00338-009-0531-7
Modasshir, M., and Rekleitis, I. (2020). “Enhancing coral reef monitoring utilizing a deep semi-supervised learning approach,” in Proceedings of the 2020 IEEE International Conference on Robotics and Automation (ICRA), (Paris), doi: 10.1109/icra40945.2020.9196528
Munday, P. L. (2004). Habitat loss, resource specialization, and extinction on coral reefs. Glob. Chang. Biol. 10, 1642–1647. doi: 10.1111/j.1365-2486.2004.00839.x
Obura, D., Aeby, G., Amornthammarong, N., Appeltans, W., Bax, N., Joe, B., et al. (2019). Coral reef monitoring, reef assessment technologies, and ecosystem-based management. Front. Mar. Sci. 6:580. doi: 10.3389/fmars.2019.00580
Page, C. A., Field, S. N., Pollock, F. J., Lamb, J. B., Shedrawi, G., and Wilson, S. K. (2016). Assessing coral health and disease from digital photographs and in situ surveys. Environ. Monit. Assess. 189:18. doi: 10.1007/s10661-016-5743-z
Pandolfi, J. M., Connolly, S. R., Marshall, D. J., and Cohen, A. L. (2011). Projecting coral reef futures under global warming and ocean acidification. Science 333, 418–422. doi: 10.1126/science.1204794
Pavoni, G., Corsini, M., Palma, M., and Scopigno, R. (2019). “A validation tool for improving semantic segmentation of complex natural structures,” in Eurographics, eds C. Paolo and M. Eder (Ginevra: Eurographics Association), doi: 10.2312/egs.20191014
Pedersen, N. E., Edwards, C. B., Eynaud, Y., Gleason, A. C. R., Smith, J. E., and Sandin, S. A. (2019). The influence of habitat and adults on the spatial distribution of juvenile corals. Ecography (Cop.) 42, 1703–1713. doi: 10.1111/ecog.04520
Petrovic, V., Vanoni, D., Richter, A., Levy, T., and Kuester, F. (2014). Visualizing high resolution three-dimensional and two-dimensional data of cultural heritage sites. Mediterr. Archaeol. Archaeom. 14, 93–100.
Pollock, F. J., Lamb, J. B., Field, S. N., Heron, S. F., Schaffelke, B., Shedrawi, G., et al. (2014). Sediment and turbidity associated with offshore dredging increase coral disease prevalence on nearby reefs. PLoS One 9:e102498. doi: 10.1371/journal.pone.0102498
Preskitt, L. B., Vroom, P., and Smith, C. (2004). A rapid ecological assessment (rea) quantitative survey method for benthic algae using photoquadrats with scuba. Pacific Sci. 58, 201–209. doi: 10.1353/psc.2004.0021
R Core Team. (2019). R: A language and environment for statistical computing. Vienna: R Foundation for Statistical Computing.
Riegl, B., Berumen, M., and Bruckner, A. (2013). Coral population trajectories, increased disturbance and management intervention: a sensitivity analysis. Ecol. Evol. 3, 1050–1064. doi: 10.1002/ece3.519
Riegl, B., Cavalcante, G., Bauman, A. G., Feary, D. A., Steiner, S., and Purkis, S. (2017). Demographic mechanisms of reef coral species winnowing from communities under increased environmental stress. Front. Mar. Sci. 4:344. doi: 10.3389/fmars.2017.00344
Riegl, B., and Purkis, S. (2015). Coral population dynamics across consecutive mass mortality events. Glob. Chang. Biol. 21, 3995–4005. doi: 10.1111/gcb.13014
Ritson-Williams, R., and Gates, R. D. (2020). Coral community resilience to successive years of bleaching in Kâne‘ohe Bay, Hawai‘i. Coral Reefs 39, 757–769. doi: 10.1007/s00338-020-01944-4
Ruiz-Moreno, D., Willis, B. L., Page, A. C., Weil, E., Croquer, A., Vargas-Angel, B., et al. (2012). Global coral disease prevalence associated with sea temperature anomalies and local factors. Dis Aquat Organ 100, 249–261.
Sandin, S. A., Smith, J. E., DeMartini, E. E., Dinsdale, E. A., Donner, S. D., Friedlander, A. M., et al. (2008). Baselines and degradation of coral reefs in the Northern Line Islands. PLoS One 3:e1548. doi: 10.1371/journal.pone.0001548
Storlazzi, C. D., Dartnell, P., Hatcher, G. A., and Gibbs, A. E. (2016). End of the chain? Rugosity and fine-scale bathymetry from existing underwater digital imagery using structure-from-motion (SfM) technology. Coral Reefs 35, 889–894. doi: 10.1007/s00338-016-1462-8
Suka, R., Asbury, M., Gray, A. E., Winston, M., Oliver, T., and Couch, C. S. (2019). Processing Photomosaic Imagery of Coral Reefs Using Structure-from-Motion Standard Operating Procedures. Honolulu: U.S. Department of Commerce, National Oceanic and Atmospheric Administration.
Suka, R., Huntington, B., Morioka, J., O’Brien, K., and Acoba, T. (2020). Successful application of a novel technique to quantify negative impacts of derelict fishing nets on Northwestern Hawaiian Island reefs. Mar. Pollut. Bull. 157:11O1312. doi: 10.1016/j.marpolbul.2020.111312
Torres-Pulliza, D., Dornelas, M. A., Pizarro, O., Bewley, M., Blowes, S. A., Boutros, N., et al. (2020). A geometric basis for surface habitat complexity and biodiversity. bioRxiv[Preprint] doi: 10.1101/2020.02.03.929521
Vega Thurber, R. L., Burkepile, D. E., Fuchs, C., Shantz, A. A., McMinds, R., and Zaneveld, J. R. (2014). Chronic nutrient enrichment increases prevalence and severity of coral disease and bleaching. Glob. Chang. Biol. 20, 544–554.
Voss, J., Shilling, E., and Combs, I. (2019). Intervention and Fate Tracking for Corals Florida, Affected by Stony Coral Tissue Loss Disease in the Northern Florida Reef Tract. Miami, FL: Florida DEP.
Winston, M., Couch, C., Huntington, B., and Vargas-Ángel, B. (2020). Ecosystem Sciences Division Standard Operating Procedures: Data Collection for Rapid Ecological Assessment Benthic Surveys, 2019 Update. Washington, DC: NOAA, doi: 10.25923/ws5s-km69
Keywords: coral reef, photogrammetry, structure-from-motion, coral demography, coral diversity, Hawaii, benthic monitoring
Citation: Couch CS, Oliver TA, Suka R, Lamirand M, Asbury M, Amir C, Vargas-Ángel B, Winston M, Huntington B, Lichowski F, Halperin A, Gray A, Garriques J and Samson J (2021) Comparing Coral Colony Surveys From In-Water Observations and Structure-From-Motion Imagery Shows Low Methodological Bias. Front. Mar. Sci. 8:647943. doi: 10.3389/fmars.2021.647943
Received: 30 December 2020; Accepted: 04 May 2021;
Published: 28 May 2021.
Edited by:
Will F. Figueira, The University of Sydney, AustraliaReviewed by:
Randi D. Rotjan, Boston University, United StatesCopyright © 2021 Couch, Oliver, Suka, Lamirand, Asbury, Amir, Vargas-Ángel, Winston, Huntington, Lichowski, Halperin, Gray, Garriques and Samson. This is an open-access article distributed under the terms of the Creative Commons Attribution License (CC BY). The use, distribution or reproduction in other forums is permitted, provided the original author(s) and the copyright owner(s) are credited and that the original publication in this journal is cited, in accordance with accepted academic practice. No use, distribution or reproduction is permitted which does not comply with these terms.
*Correspondence: Courtney Couch, Q291cnRuZXkucy5jb3VjaEBub2FhLmdvdg==
Disclaimer: All claims expressed in this article are solely those of the authors and do not necessarily represent those of their affiliated organizations, or those of the publisher, the editors and the reviewers. Any product that may be evaluated in this article or claim that may be made by its manufacturer is not guaranteed or endorsed by the publisher.
Research integrity at Frontiers
Learn more about the work of our research integrity team to safeguard the quality of each article we publish.