
95% of researchers rate our articles as excellent or good
Learn more about the work of our research integrity team to safeguard the quality of each article we publish.
Find out more
ORIGINAL RESEARCH article
Front. Mar. Sci. , 25 May 2021
Sec. Marine Conservation and Sustainability
Volume 8 - 2021 | https://doi.org/10.3389/fmars.2021.647685
This article is part of the Research Topic Working Towards a Blue Future: Promoting Sustainability, Environmental Protection and Marine Management: Examples from the UK Government Blue Belt Programme and Current International Initiatives View all 23 articles
The Pitcairn Islands, located in the central South Pacific, contain near-pristine marine ecosystems which support unique fish assemblages, together with both endemic and threatened species. Pitcairn itself is the only inhabited island in the group and, before this study, the environmental impact of local fisheries was unclear, with little data to inform conservation and management. In 2014–2015 coastal fish populations were assessed using a mixed methods approach: a newly introduced system of fishers’ catch monitoring and Baited Remote Underwater Video Systems (BRUVS). Thirty-nine BRUVS deployments recorded 88 species in total, with small-bodied herbivores (e.g., Kyphosus pacificus) and mesopredators (e.g., Xanthichthys mento) dominating a “bottom heavy” assemblage. Several large pelagic predators were recorded, but reef-associated predators were rare with only one shark observed. Pitcairn’s top predator assemblage was relatively impoverished compared to global “pristine” sites, including other islands within the Pitcairn group. Top predator scarcity may be explained by local artisanal fisheries, which have historically targeted sharks and other large reef carnivores, and these taxa may not have recovered despite subsequent declines in fishing pressure. The dominant small-bodied species may have proliferated as a result of diminished top predator populations. Subsequent to BRUVS sampling, a local fisheries officer post was created to collate catch data from coastal fishers. Regular returns were obtained from over half of the active fishers (representing approximately 80% of catches), with K. pacificus also dominating catches and the small grouper Epinephelus fasciatus frequently targeted. Thirty fish species were represented in the recorded catch over a 12 month period. Results were shared with the local community, providing a basis for the cooperative design of a Fisheries Management Plan. This plan ensured traditional fisheries could continue in a sustainable manner within Coastal Conservation Zones around each of the four Pitcairn Islands, established within the large, no-take Marine Protected Area designated in 2016, covering the entire Pitcairn Exclusive Economic Zone. Monitoring of Pitcairn’s artisanal fisheries should be continued beyond this one-off study in order to inform adjustment of the Fisheries Management Plan, as the ongoing island fishery may still have consequences for long-term sustainability, particularly for pelagic species caught in coastal waters which remain a significant data gap.
The Pitcairn Islands are a UK Overseas Territory (UKOT) consisting of four small, extremely remote islands in the central South Pacific. Pitcairn Island itself is the only inhabited island in the group, with a population of around 50 in 2015. The islands’ isolation has helped to ensure that their marine ecosystems have remained in near-“pristine” condition, largely unaffected by human activities (Sala et al., 2012), although this isolation has also contributed to a dearth of available data on the Pitcairn Islands marine environment compared to other UKOTs. Whilst marine species diversity in the Pitcairn Islands is low compared to the Coral Triangle, some 6,000 km to the west, the presence of corals is noteworthy given the islands’ southern location just south of the Tropic of Capricorn, at the south-eastern extreme of the Indo-Pacific province (Irving and Dawson, 2012). Moreover, surveys by the National Geographic Society’s (NGS) Pristine Seas team in 2012 found that regional endemics comprised 45% of fish assemblages, creating unique species communities (Sala et al., 2012). In addition, a number of globally threatened and endemic marine species are known from the islands (Irving and Dawson, 2012). Surveys of uninhabited Ducie and Henderson atolls found that top predators accounted for more than half of fish biomass, reflecting very low fishing pressure (Sala et al., 2012). In summary, the marine ecosystems of the Pitcairn Islands are considered to have “outstanding” value owing to their relatively untouched condition and biological uniqueness (Friedlander et al., 2014).
As part of efforts to protect these valuable ecosystems, the Pitcairn Islands Marine Protected Area (an IUCN Category 1 MPA encompassing all four islands) was established on 14th September 2016 by the Government of the Pitcairn Islands, supported by the UK Government (Gov.UK, 2016). The MPA extends for 839,479 km2 to the outer limit of the islands’ Economic Exclusion Zone (EEZ) (1 accessed February 2021). As such, it stands as one of the largest fully protected Marine Protected Areas on the planet (O’Leary et al., 2018). As a result of the MPA consultation, sustainable traditional fishing activities were allowed to continue around the islands and the occasionally visited 40 Mile Reef, which sits atop Adams seamount, approximately 40 miles from Pitcairn Island itself. These traditional fishing activities were implemented through the creation of sustainable fishing zones located within the territorial waters of each island, amounting to < 0.3% of the MPA’s total area (Figure 1).
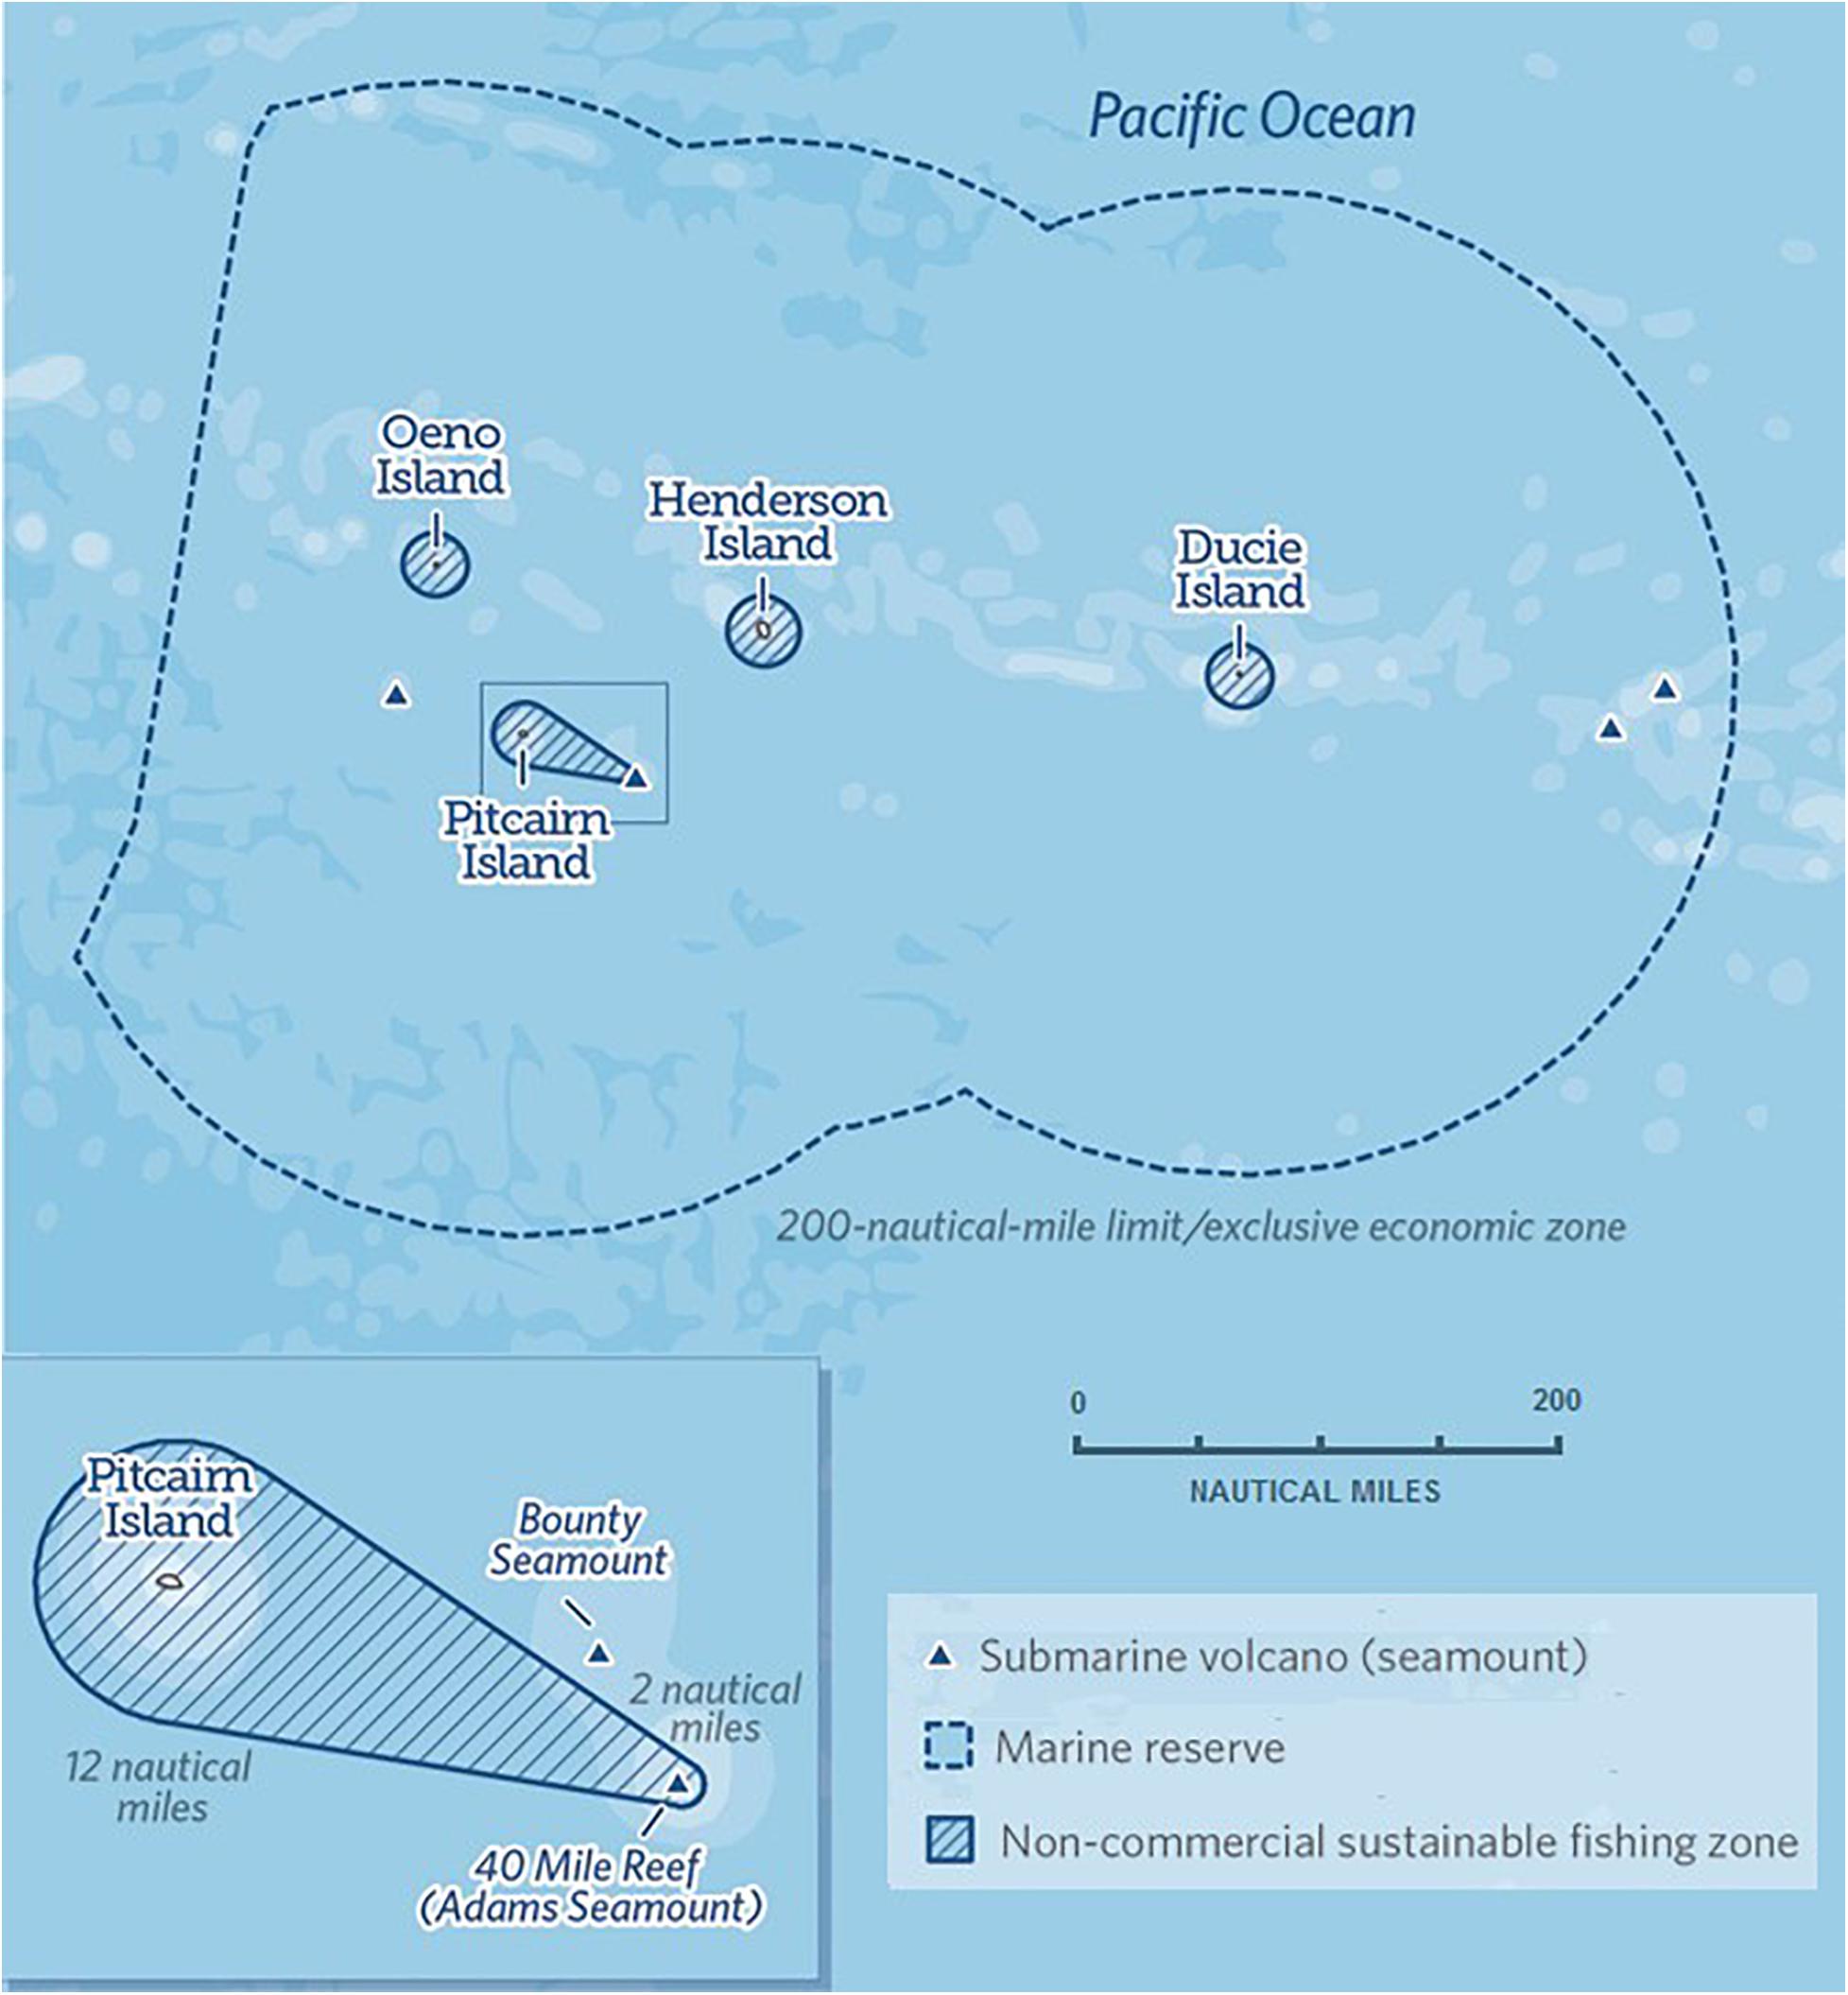
Figure 1. The Pitcairn Islands Marine Protected Area (originally termed a ‘marine reserve’). Map© 2016 The Pew Charitable Trusts. Adapted from Pew (2020).
It should be noted that the MPA was established after this study was completed. Surveillance of possible commercial fishing activity within the vast “highly protected” Marine Protected Area is being undertaken under the auspices of the UK’s Blue Belt Surveillance and Intelligence Hub (Stockill, pers. comm.), which follows the novel Eyes on the Sea program run by the Pew Charitable Trusts (Pew, 2015). The Hub conducts remote monitoring of the Pitcairn Islands MPA following an intelligence-led, risk-based approach to detect illegal, unreported and unregulated (IUU) fishing activities. Such remote monitoring, however, is not suitable to overseeing Pitcairn’s artisanal fisheries, which utilize small boats without Automatic Identification Systems (AIS) installed. As a result, locally-based monitoring is required as part of management measures for the artisanal fishery (Dawson and Irving, 2020).
Fishing has been an important socio-economic component of the Pitcairn community since its establishment over two centuries ago (Götesson, 2012; Irving and Dawson, 2012). Fishing activities are typically undertaken from coastal rock promontories by individuals using baited hand lines; from a drifting small boat (known locally as a canoe) close to shore (typically < 2 km) using baited or feathered hooks; or using lures trolled behind a moving boat (usually 2–5 km from the coast). Trolled lures are used to catch pelagic species such as wahoo Acanthocybium solandri or yellowfin tuna Thunnus albacares, and this method is generally conducted from one of the island’s 13 m longboats, which can take up to eight fishers in a “fishing party.” All fishes caught by such a party are traditionally divided up by household and shared irrespective of individual catch size (Dawson and Irving, 2020). At the time of our study (2014–2015), occasional fishing for juvenile sharks (typically grey reef shark Carcharhinus amblyrhynchos or white tip reef Triaenodon obesus, though occasionally tiger Galeocerdo cuvier) was practiced with overnight baited lines, for the sole purpose of incorporating the shark’s teeth in wooden carvings, leaving the flesh unconsumed (Coghlan et al., 2017). Aesop slipper lobsters Scyllarides haanii are caught using baited traps left overnight in deep water (70–145 m depth) (Götesson, 2012); and spiny lobsters, both the Easter Island lobster Panulirus pascuensis and the pronghorn lobster P. penicillatus, are typically caught using SCUBA gear together with a hook or a Hawaiian sling spear. Catches of these crustaceans are either consumed on island or, as in recent years, sold to visiting cruise ships. Although some reconstruction of historical fish catches has been attempted (Coghlan et al., 2017), the sustainability of this long term artisanal fishery had never been assessed, nor had any form of fisheries management plan been formalized.
In order to assess the impact of the fishery and inform any subsequent management measures, we took a mixed methods approach consisting of: (1) an assessment of the nearshore fish assemblage using Baited Remote Underwater Video Systems (BRUVS); and (2) an assessment of fishing effort and catch composition by the local community. The study builds on a previous household survey of the island population (c. 50 individuals) undertaken in 2011 (Shuttenberg and Dawson, 2012) which showed families to be consuming an average of 2–3 fish meals per week.
All fieldwork was undertaken around the coast of Pitcairn (25° 04’ S, 130° 06’ W) in 2014 and 2015. The island, just 3.2 km long by 1.6 km wide, has a 9.5 km coastline characterized by steep cliffs and occasional rock platforms (Irving and Dawson, 2012). The nearshore seabed, composed of rocky outcrops and patches of coral interspersed with sandy areas, extends seawards for 300–500 m to a depth of around 30 m before dropping away into deeper waters (Irving and Dawson, 2012).
BRUVS have been increasingly employed as a sampling tool in coastal marine environments (Cappo et al., 2006). This approach is recognized as a valuable non-extractive tool for assessing protected areas, threatened species and scientifically important habitats (Letessier et al., 2013). Furthermore, baited cameras record more species and require less replicates to detect change compared to cameras deployed without bait, or certain SCUBA approaches (Watson et al., 2005, 2010; Harvey et al., 2007; Langlois et al., 2010; Dwyer et al., 2020). Single camera BRUVS can record abundance and diversity (Ellis and DeMartini, 1995), although they do not enable body size measurements (Cappo et al., 2003). In order to measure fish accurately, BRUVS studies have increasingly employed stereo video cameras, which generate more accurate measurements compared to single cameras (Cappo et al., 2006; Langlois et al., 2020). Studies have increasingly employed GoPro cameras2 as a light, low-cost setup (Letessier et al., 2013, 2015.). GoPros provide a cost-effective and scientifically robust option for BRUVS studies, lowering the financial barrier of fieldwork and potentially facilitating wider implementation of the technique. Based on the research goals and available resources the technique was considered the optimum approach for this study.
Five stereo BRUVS frames were assembled on Pitcairn (Figure 2A), using a design which has been widely employed for seabed based stereo-video studies (Langlois et al., 2010; Letessier et al., 2015). Two GoPro Hero 3+ cameras (with additional batteries) were placed inside pre-calibrated waterproof housings. The use of two cameras calibrated in fixed positions allowed stereo footage to be filmed, a requirement for accurate measurements (Cappo et al., 2006). Pilchard (Sardinops sagax), was selected as bait and sourced (in a frozen state) from New Zealand. Pilchards have been commonly used in previous BRUVS studies, and bait standardization is essential for comparability (Langlois et al., 2010; Dorman et al., 2012; Hardinge et al., 2013; Letessier et al., 2013). Prior to deployment an attached mesh bag was filled with 600 g of defrosted pilchards, with each fish crushed. This ensured dispersal of oil and blood into the water and guarded against premature depletion. Sampling aimed to deploy BRUVS frames at sites around the coastline of Pitcairn Island across a depth range of 10–40 m, separated by at least 300 m to ensure sample independence. At times it was necessary for deployments to be opportunistic in order to ensure both sample independence and target depth, with depth measured using a handheld sounding device.
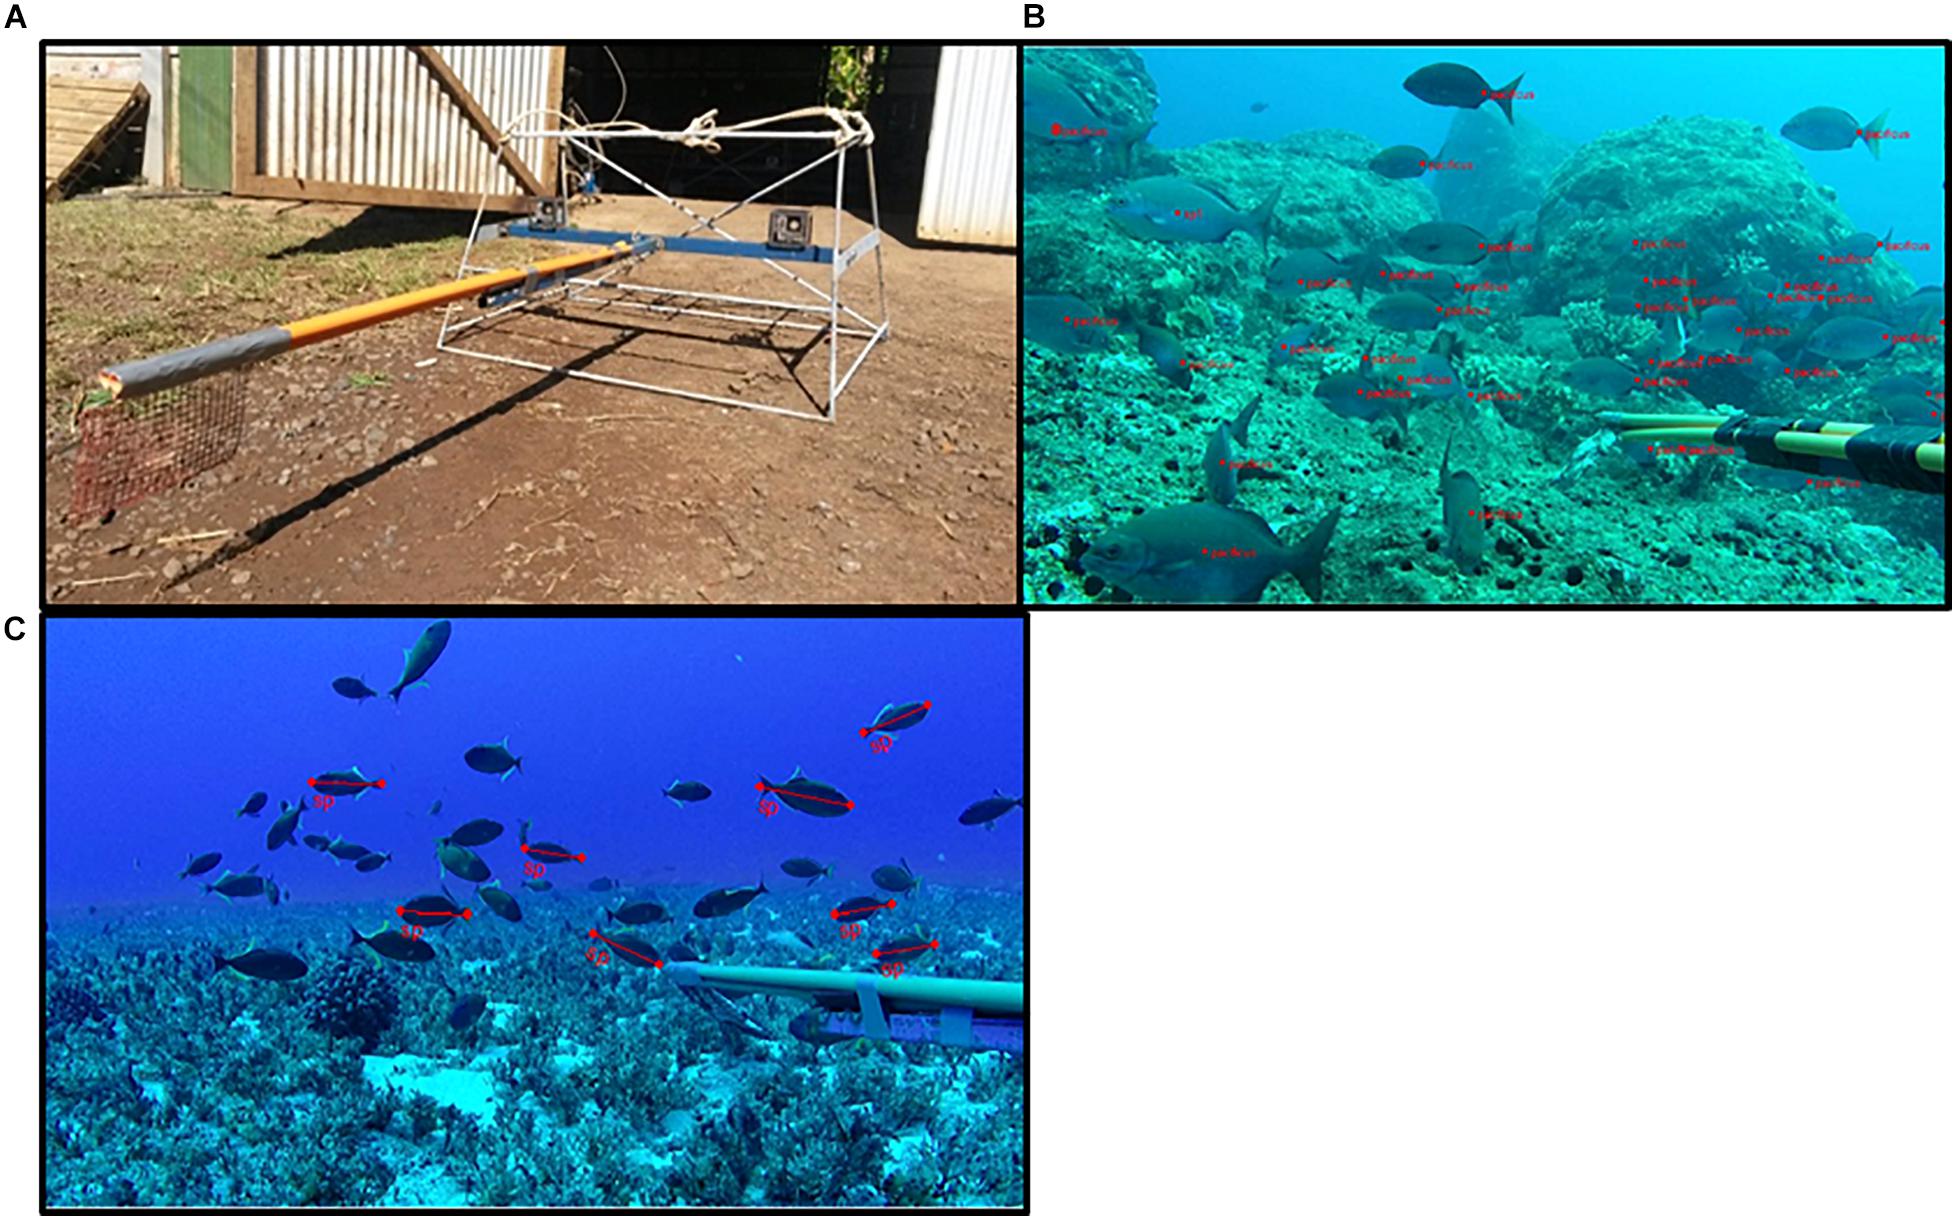
Figure 2. (A) An example of the BRUVS frames deployed on Pitcairn, (B) a screenshot from EventMeasure video analysis showing the individual marking of Pacific chub in order to establish MaxN, and (C) screenshot from EventMeasure showing the measurement of individual crosshatch triggerfish. (A) top left, (B) top right, (C) bottom left.
Species abundance values (MaxN) were obtained by counting the highest number of each species visible at any point during the 1 h video sample, and MaxN was used as an index of fish abundance. This approach provides a conservative relative abundance estimate by preventing double-counts of returning individuals (Letessier et al., 2013) and allows diverse, abundant assemblages to be sampled efficiently and accurately when the counting of all individuals is unfeasible (Cappo et al., 2006).
Stereo cameras were used in order to allow digital three dimensional (3D) measurements of fish. SEAGIS EventMeasure, which estimates the position and size of an individual on 3 axes, was used as the analysis software (Cappo et al., 2006; Hardinge et al., 2013; Letessier et al., 2015). This software allows fish to be measured non-invasively, and allows species diversity, MaxN and length data to be recorded, collated and exported, streamlining archiving and facilitating analysis.
During video review, each species was marked with a red point (see Figure 2B) upon first entering the frame. In order to count large schools which approached the bait, MaxN was computed by marking each visible fish. All identifications and MaxN values were obtained using footage from the frame’s left camera. The sampling period began as soon as the frame landed on the seabed (after adjustments), and 1 h of video was analyzed. Once the frame settled, a still image was taken and used to classify the habitat using rock, algae, sand, and coral categories which allowed the heterogeneity of Pitcairn’s coastal habitats to be taken into account (Sala et al., 2012; Irving and Dawson, 2012). Classifications were based on the category which was observed to cover the highest percentage of the visible substrate.
Length measurements (fork lengths) of individuals were conducted at the time of MaxN (Figure 2C). Individual CAM files for each BRUVS frame were loaded to calibrate the software and maximize measurement accuracy. Fish were only measured if their bodies were straight, side-on and fully visible on both cameras. A measurement was accepted if the precision value generated by EventMeasure was <10% of the individual’s computed fork length. In addition, a measurement was only deemed accurate if EventMeasure estimated the individual to be 5 m or less from the camera, in light of observed inaccuracies in measurements at greater distances (Langlois et al., 2010; Letessier et al., 2015). Length data were also checked against known fork length ranges of species, and any measurements substantially outside known size range were discarded (Lieske and Myers, 1994; Allen et al., 2007; Fishbase, 2014). In order to avoid the repeat measurement of a returning individual, measurements were only taken from the point of species MaxN. If no valid measurements could be obtained from the point of MaxN, an alternative frame was used when possible.
Mean fork length values were produced for each measured species. Individual fish weight estimates were obtained by applying stereo BRUVS-derived measurements to length-weight relationships. Species-specific a and b values were obtained from published length-weight studies or models where available (Fishbase, 2014). The mean calculated weight for each fish species was then multiplied by the total MaxN to estimate biomass values specific to this fish assemblage. Individuals identified to family or genus level, or species without published length-weight data, were included in biomass calculations through using values from morphologically and phylogenetically similar species. Published common lengths were used to calculate biomass for species which could not be measured by stereo BRUVS (Allen et al., 2007; Fishbase, 2014).
All EventMeasure data were collated in Microsoft Excel and all statistical analysis was carried out in R Studio software (version 0.98.507). The “vegan” R package (version 2.4-2) was used to plot species accumulation (“specaccum” function) and to extrapolate total species richness values (“specpool” function) using “jack1,” “boot,” and “chao” richness estimation indexes (Oksanen, 2013).
The fisheries catch monitoring was undertaken as part of a comprehensive programme of community engagement around MPA designation, resource management and conservation. Fishers were consulted on how best to monitor local catches robustly whilst taking individual practices and preferences into account, and without imposing excessive reporting burdens on fishers. In order to assess the diversity of fish species in catches, individual fishers were asked to keep a weekly log of the number of individuals (= abundance) of all species caught (= diversity). Additional information was recorded on the time expended to obtain the catch (= effort), the fishing method employed, the location, and sea conditions. Participating fishers were asked to complete a written logsheet of all catches following any fishing excursion from the shore or from boats, and for both individual and group fishing activities. For ease of logsheet completion, local fish names were used when recording data. Log records were collated by the island’s Fishery Officer, a newly created post funded through the Darwin Initiative project. Initially, there were some concerns expressed by fishers regarding the ultimate purpose of recording catches. By way of addressing such concerns, it was agreed that returns be submitted anonymously.
Forty-two BRUVS deployments were completed in the shallow coastal waters of Pitcairn Island (Figure 3), of which 39 produced valid samples.
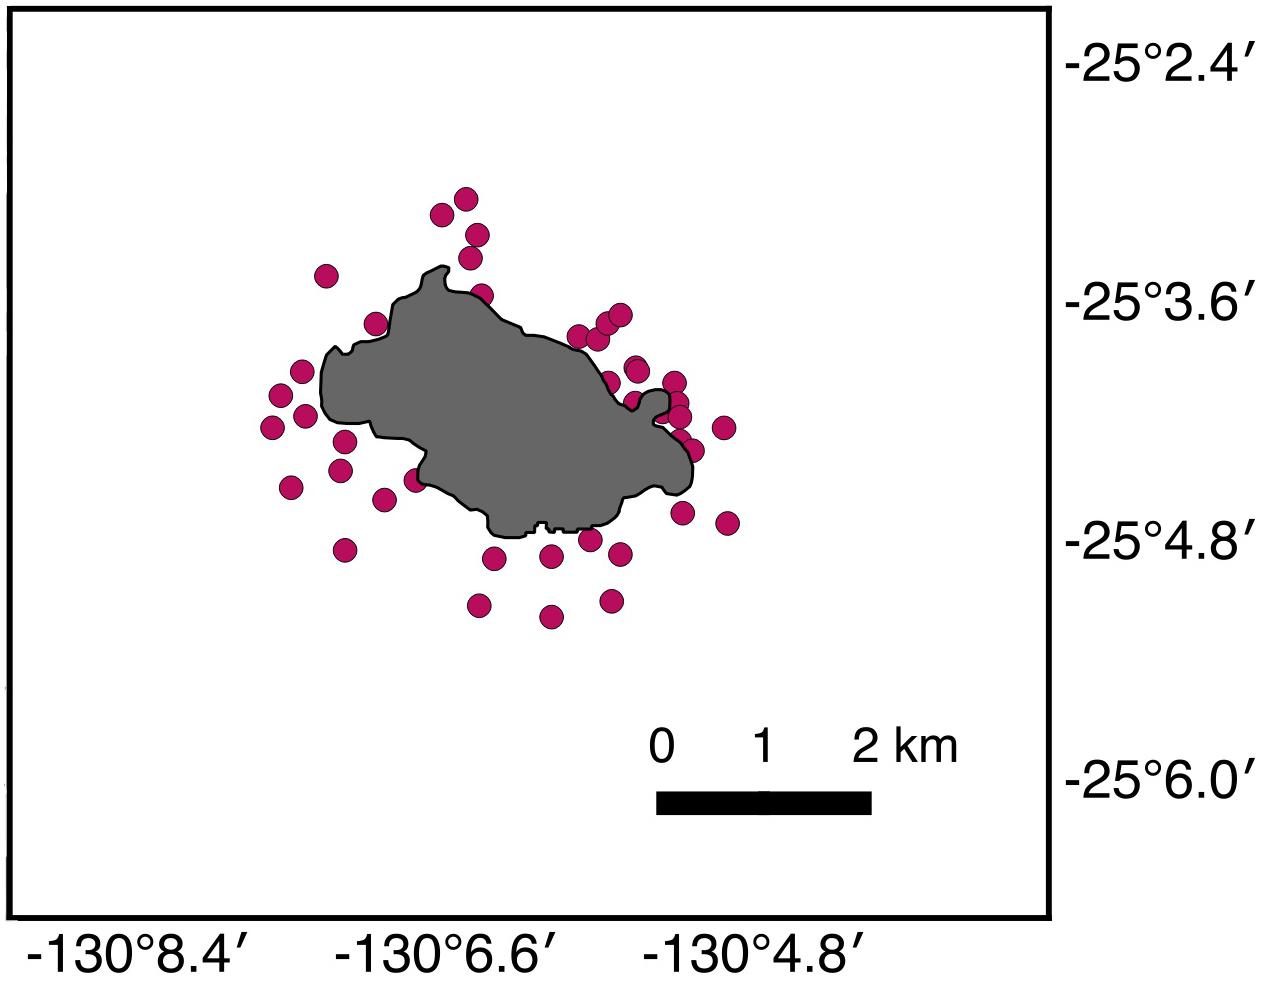
Figure 3. Map of the Pitcairn Island field site, with each dot denoting the site of a single BRUVS deployment.
Deployment depths ranged from 7 to 33 m and the mean depth sampled was 19 m (± 7.39 sd.) Algae and rock-dominated substrates accounted for 38% and 33% of habitat classifications, respectively, whilst coral and sand accounted for 15% and 13% of classifications. 2,769 individual fishes from 26 families were sampled, 88 species were identified and 95% of individuals were identified to species level, with 3% identified to family level and 2% to genus level, respectively. The most diverse sample recorded 33 species, the least diverse recorded 3 species, and mean species richness was 17 (± 7.25 sd.). Abundance values ranged from 198 to 11, and mean abundance was 71 (± 43.84 sd.). Fork length measurements were obtained from 37 deployments, and 484 measurement values for 57 species were computed.
The fish assemblage was dominated by Pacific chub (Kyphosus pacificus) and crosshatch triggerfish (Xanthichthys mento) which accounted for 24% and 28% of total MaxN, respectively. The next highest MaxN value for a single species was recorded by red and green coris (Coris roseoviridis), a regional endemic which accounted for 5% of total MaxN. Scythe triggerfish (Sufflamen bursa) was the most widespread species, recorded on 85% of samples (Table 1).

Table 1. Summary of key data indices for the most common species (in terms of relative abundance) in each of the main fish families recorded on Pitcairn.
The sampled biomass was estimated at 1,381 kg, with mean biomass per sample of 35 kg.h–1. Herbivores (trophic level 2.0–2.9) accounted for 49% of biomass, whilst planktivores and small predators (trophic level 3–3.9) and top predators (trophic level ≥ 4) accounted for 23% and 28%, respectively (Figure 4).
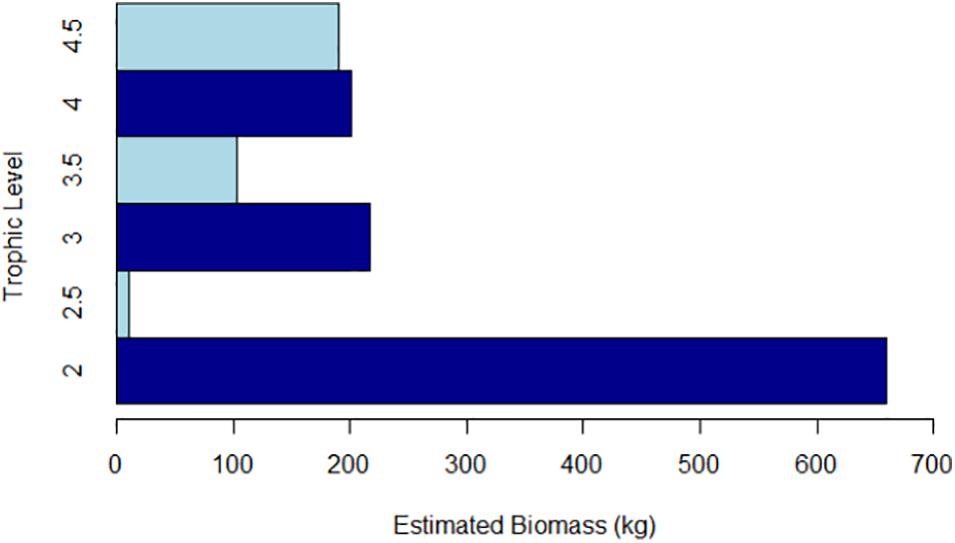
Figure 4. Biomass of BRUVS sampled fish assemblage by trophic level (trophic values taken from Fishbase (2014)].
The 88 species identified during sampling were plotted on a species accumulation curve, and the total species richness of the assemblage was extrapolated using three estimation indices (Oksanen, 2013). These indices produced estimated species richness values ranging from 100 (± 22.92 sd.) to 132 (± 8.89 sd.) (Figure 5).
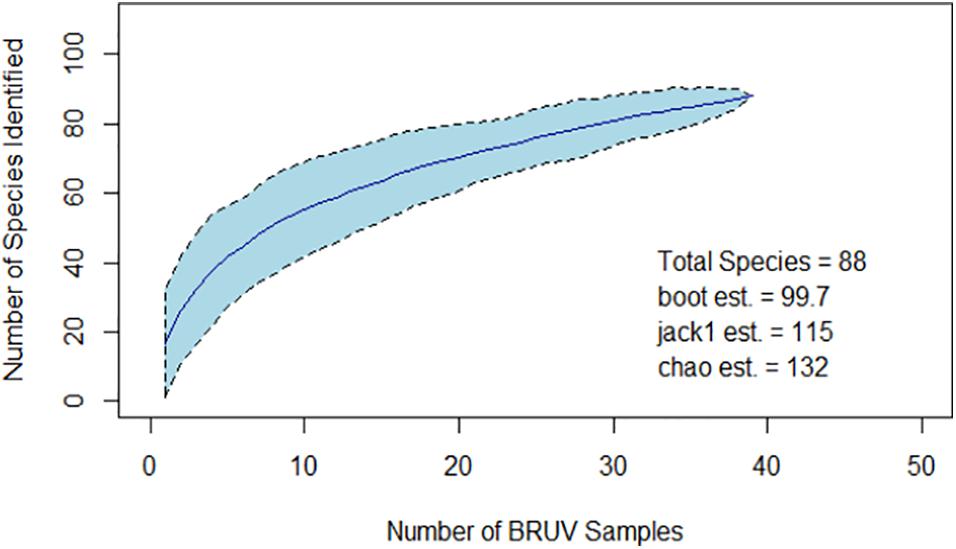
Figure 5. Curve showing the accumulation of identified species during sampling (dark blue line). Confidence intervals are indicated by the light blue polygon and dotted lines. Values for estimated total species richness according to three indices are inset.
Spearman’s Correlation Coefficient was initially used to assess the effect of sampling depth (uncategorized) on abundance and species richness. A weak correlation was found between depth and abundance (Spearman’s rho = 0.22, p = 0.18), and no correlation was observed between depth and species richness (Spearman’s rho = –0.047, p = 0.77). The variance of species richness between the depth categories was tested using ANOVA, and no significant variance was observed (p > 0.07).
Coral habitats supported the highest species richness and abundance, with mean richness of 27 (± 4.83 sd.) and median abundance of 102 (IQR = 91–112). Sand habitats supported the lowest species richness and abundance, with mean richness of 7 (± 4.36 sd.) and median abundance of 46 (IQR = 14–93) (Figures 6, 7).
ANOVA results indicated a strongly significant variance in mean species richness between habitat types (p < 0.0001), with significantly higher richness was observed in coral habitats compared to other substrate types (t = 4.27, p < 0.0002). The ANOVA also observed significantly lower richness in sand habitats (t = -2.74, p < 0.01). Kruskal-Wallis tests indicated significant variance in median abundance between habitat types for all trophic levels (K-W χ2 = 15.42, p < 0.01) including significant variance specifically for top predators (K-W χ2 = 18.07, p < 0.001) which were most abundant in coral-dominated habitats.
The results presented here cover the period September 2014–August 2015 with fishing being undertaken year round, although there was some monthly fluctuations in effort (Figure 8). It should be noted that only half of the fishers within the island’s small community participated in the scheme, although this proportion encompassed an estimated 80% of the total number of fishes caught. A total of 1,190 individual fishes were reported as being caught during the 12 months from September 2014 to August 2015, representing 30 different species (Figure 9 and Table 2).
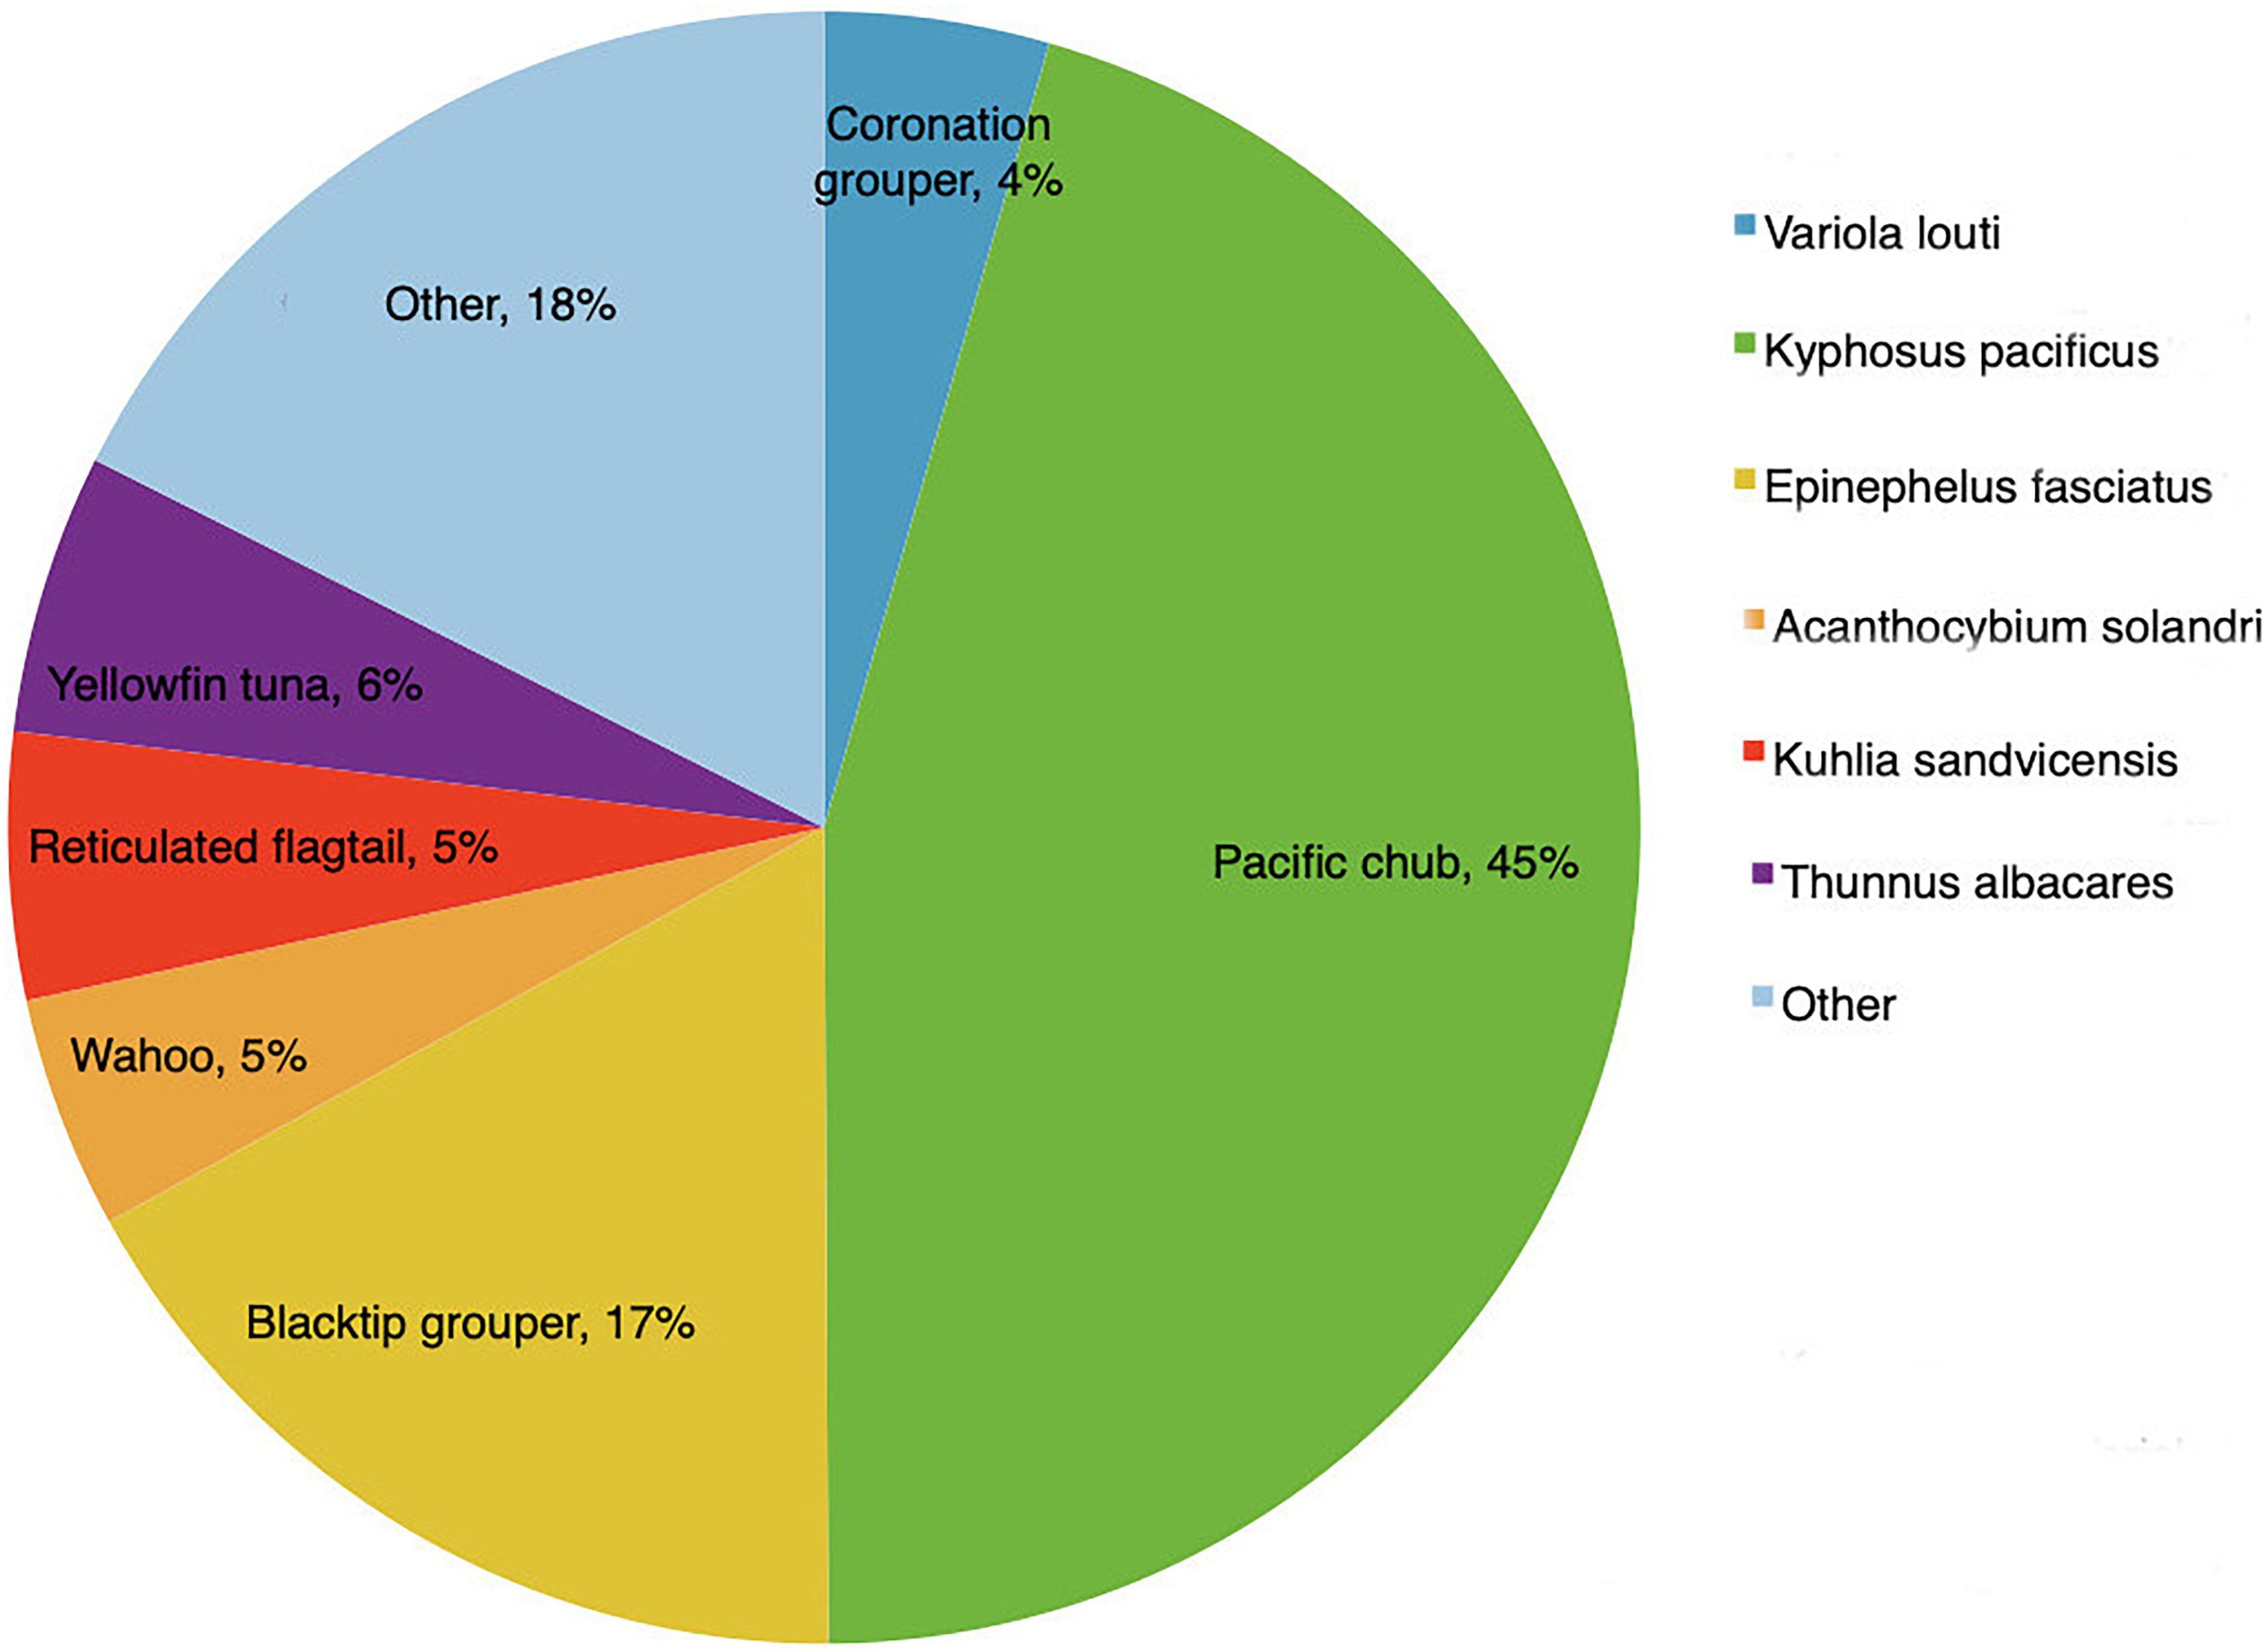
Figure 9. Fish abundance by species, as a proportion of the total catch (after Dawson and Irving, 2020).
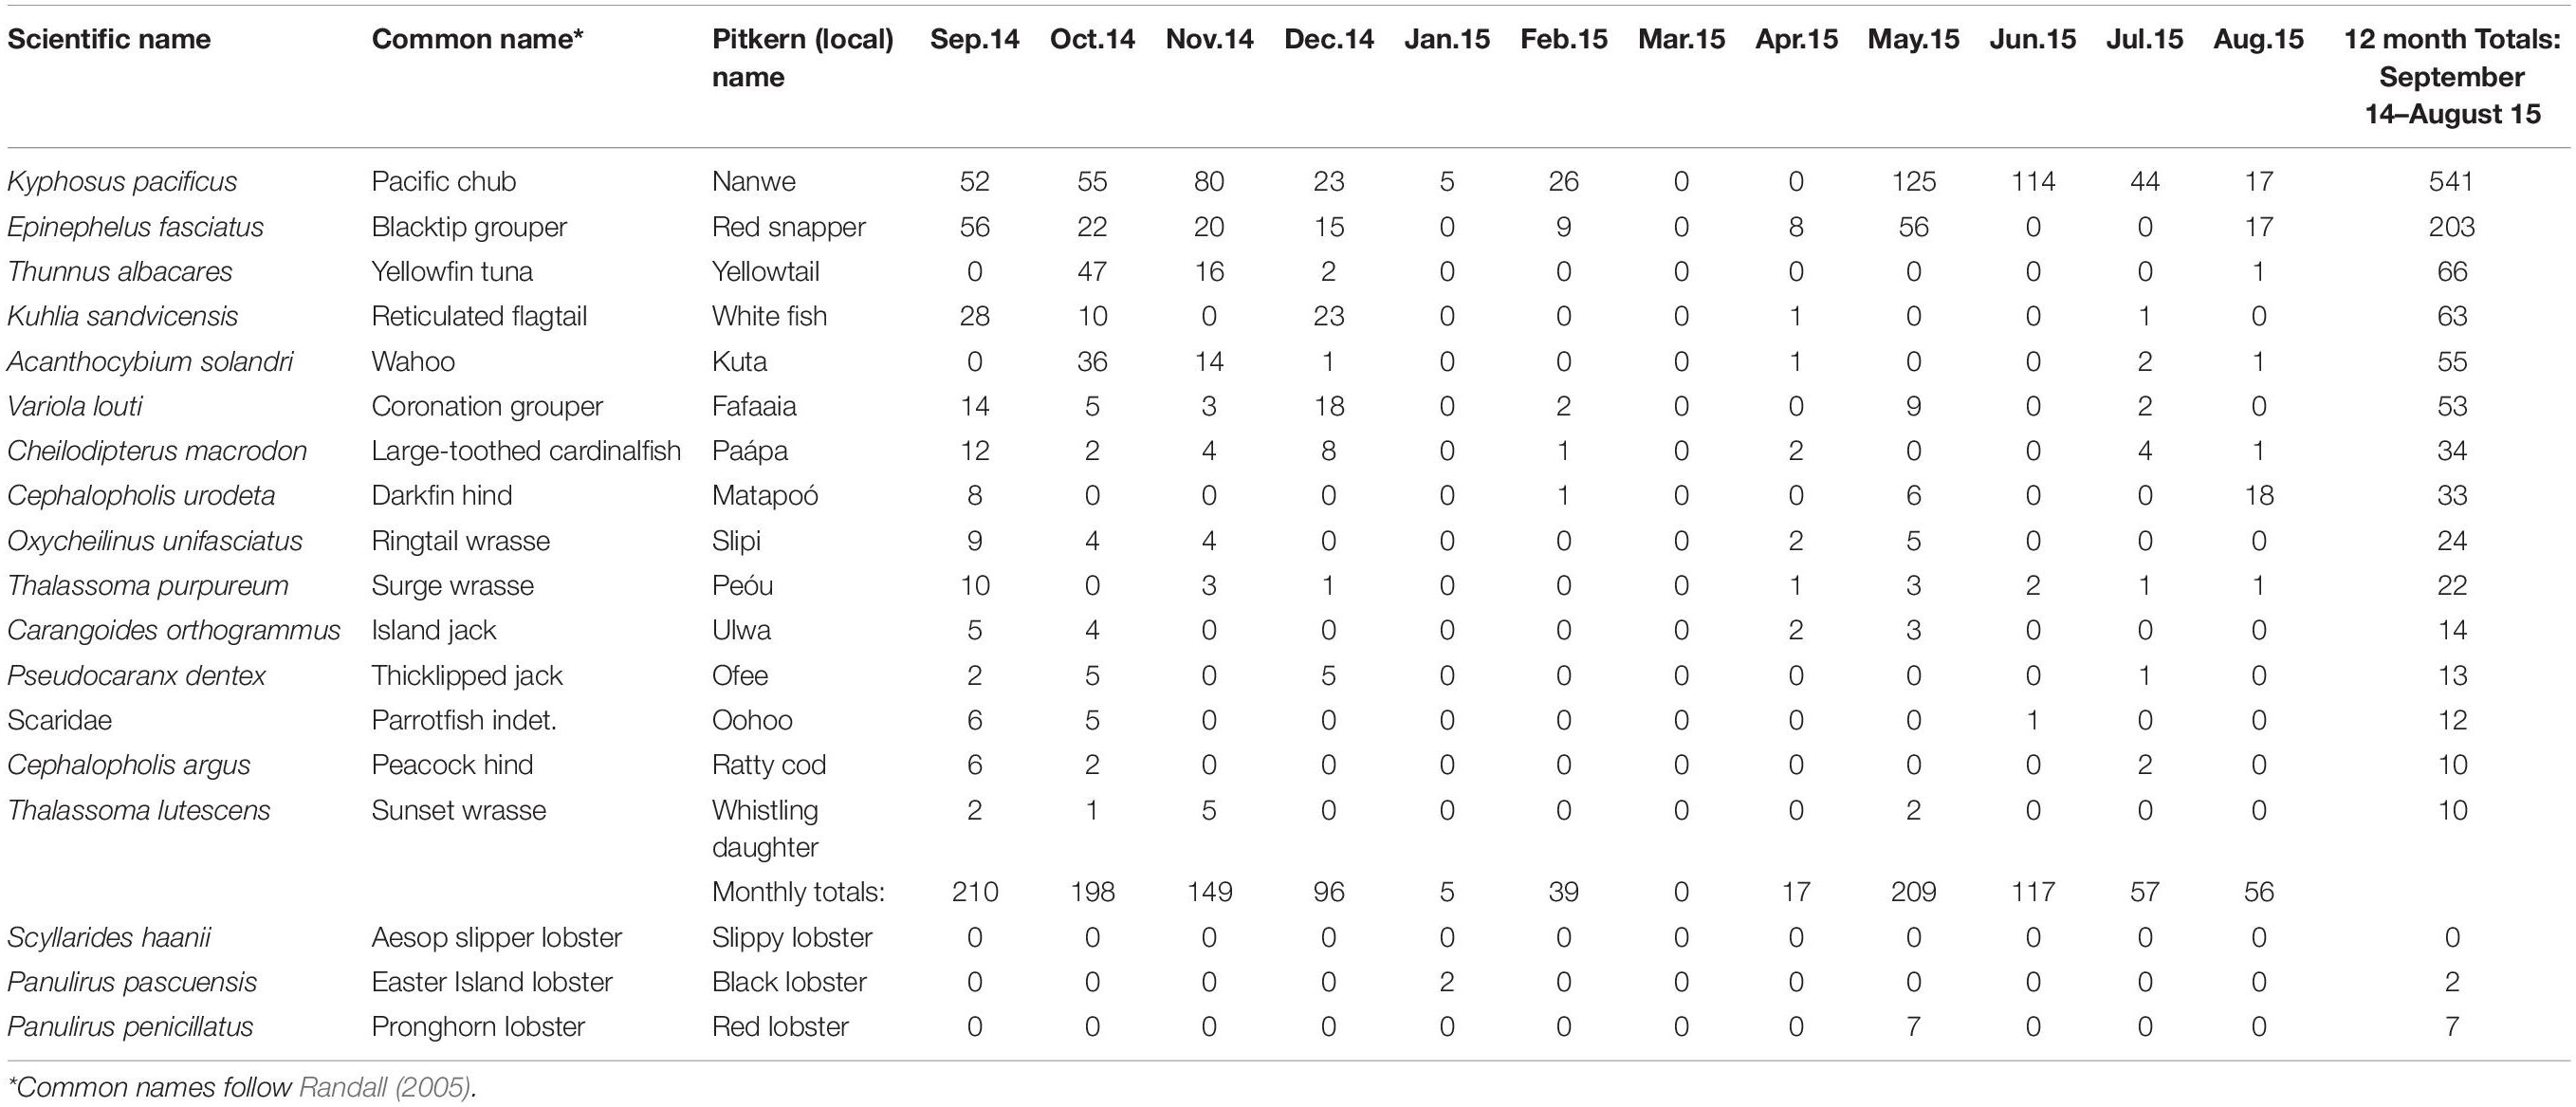
Table 2. Pitcairn fish catch records (September 2014–August 2015) showing the 15 most frequently caught species (≥10 individuals) during the year, by month.
By far the most frequently caught species was the Pacific chub Kyphosus pacificus (45% of the total yearly catch), followed by the blacktip grouper Epinephelus fasciatus (17%). In all, six species (Kyphosus pacificus, Epinephelus fasciatus, Thunnus albacares, Kuhlia sandvicensis, Acanthocybium solandri, and Variola louti) made up 82% of total catch in terms of individuals caught (Figure 9). Two of these species, yellowfin tuna T. albacares and wahoo A. solandri, were only caught from boats using trolling methods. These two species are migratory open water fishes which primarily occur off Pitcairn during the springtime (August to November) (Figure 10).
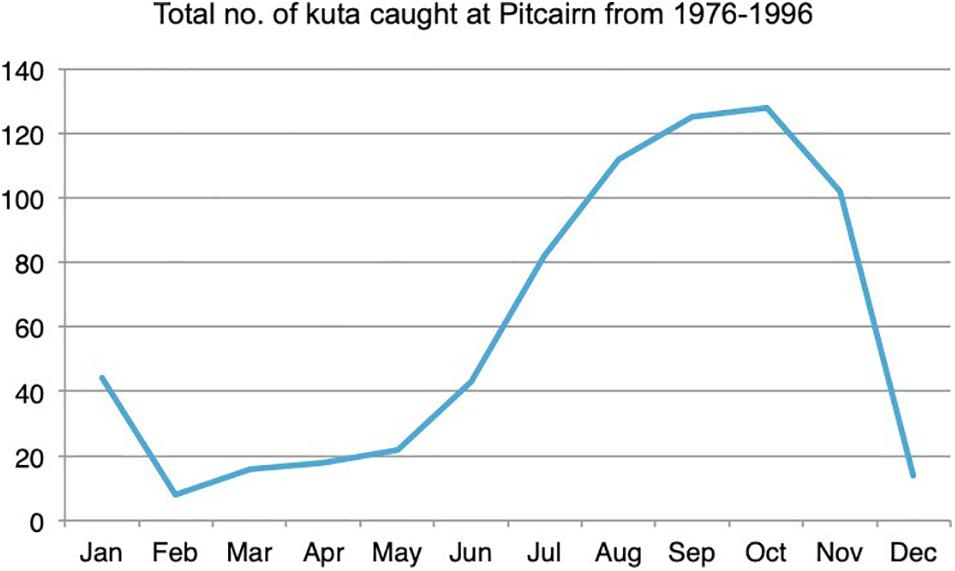
Figure 10. Catch distribution by month of the migratory wahoo/kuta, Acanthocybium solandri (Data from Götesson, 2012).
In terms of the different fishing practices, there were 22 shore trips (typically by solitary individuals) and 20 boat excursions (which include both solitary and group fishing, with 1–8 fishers on board) during the 12 month period. SCUBA diving excursions were rare by comparison, only recorded in a single month of the catch monitoring period (Figure 11).
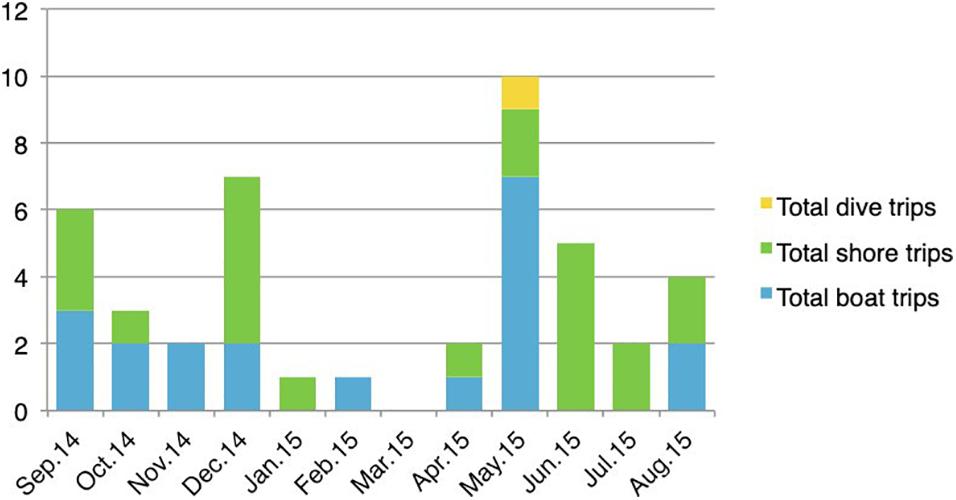
Figure 11. Distribution of fishing practices during the year (September 2014–August 2015) (after Dawson and Irving, 2020).
Put together, BRUVS surveys and fisheries catch monitoring reveal a fish assemblage impoverished in predatory reef fish and sharks, and dominated by small-bodied herbivores and mesopredators. When considered in the context of long-term catch records, fishing practices and demographic changes on Pitcairn, this analysis suggests that the island fishery has reduced populations of high trophic-level predators, with subsequent declines in fishing intensity enabling the proliferation of lower-trophic level species, often less desired as fisheries targets, into vacant ecological niches.
BRUVS sampling achieved broad spatial coverage of the study site, and an extrapolated species richness of 115.57 suggests that sampling captured approximately 80% of diversity. However, it should be noted that a total fish fauna of 270 species has been recorded within the 50 m depth contour on Pitcairn Island (Irving and Dawson, 2012). As a proportion of this total fauna does not occur in the seabed habitats sampled by BRUVS, it is acknowledged this BRUVS study did not fully capture assemblage diversity. Nonetheless, measurements taken from 57 species and the acknowledged precision of EventMeasure for computing fish lengths (Cappo et al., 2006; Letessier et al., 2015), enabled accurate biomass estimations specific to this fish assemblage to be made. Sampling achieved even coverage across depths, although results suggest that depth did not drive species richness or abundance. Sampling was uneven across habitats, although statistically significant results indicate that assemblage variation was still detected. Habitat was a strong driver of species richness, overall abundance and top predator abundance, with significant variation between the highest scoring habitat (coral) and the lowest (sand). Exceptional water clarity at deeper sites provided ideal BRUVS conditions, as shown by identification of 95% of individuals to species level.
Top predators accounted for 28% of sampled biomass in comparison to 12% estimated by previous SCUBA surveys (Sala et al., 2012; Friedlander et al., 2014), a discrepancy likely to indicate a function of attraction to the bait (Meekan et al., 2006; Watson et al., 2010). Two predators, greater amberjack Seriola dumerili and giant trevally Caranx ignobilis, were also observed on Pitcairn for the first time (Duffy et al., 2017). Bait also attracted cryptic predators which might otherwise remain concealed (Watson et al., 2010) with moray eels (Muraenidae) and hawkfishes (Cirrhitidae) recorded on 74% of samples. Of note was the sighting of just a single shark (gray reef Carcharhinus amblyrhyncos). Similarly, National Geographic divers recorded sharks on only three of their 26 transects undertaken at similar depths (Sala et al., 2012). Whilst the diver surveys and BRUVS are not directly comparable, it was expected that the presence of bait would attract more sharks. Combined results from the NGS and Darwin studies, coupled with evidence of regular local shark landings by the island community, indicate that human activities have affected the top predator assemblage.
Analysis of recent and historic catch data adds weight to the theory that the island fishery has impacted shark populations. Whilst no shark species were recorded during the 12 months of catch monitoring in 2015, historic catch data from 2006 to 2008 showed that 28 sharks were caught over a 20 month period (Götesson, 2012). BRUVS results indicated lower shark numbers than might be expected for a comparable non-exploited area, as corroborated by observations from the uninhabited nearby islands by Sala et al. (2012) which contrastingly revealed top-heavy trophic pyramids on Henderson Island and Ducie atoll, including abundant reef sharks. With top predators accounting for 62% and 35% of biomass at Henderson and Ducie, respectively, similar conditions might be expected on Pitcairn in the absence of fishery impacts (Friedlander et al., 2014). Furthermore, the low abundance of sharks at Pitcairn itself, with its history of targeted shark fishing, reflects acknowledged global trends whereby top predator abundance is substantially higher at uninhabited, remote “marine wilderness” sites in comparison to open access fishery sites or no take areas in locations of high anthropogenic impact (Soler et al., 2015; Letessier et al., 2019; MacNeil et al., 2020). Therefore, although Pitcairn’s historical artisanal fishery is small-scale, it appears top predators are over-exploited, and the acknowledged ecological vulnerability of these taxa to overfishing may have hastened their depletion around Pitcairn despite fishing pressure being low by global standards (Worm et al., 2013). In order to address this concern around over-exploitation of sharks, and to eradicate the practice of catching these species solely for their teeth, alternative means of obtaining shark’s teeth were suggested. Sustainable sources of shed teeth may be obtained from accumulation on beaches worldwide, or from aquarium tanks holding sharks (Dawson and Irving, 2020), although checks should be made with authorities and CITES to ensure that provision of sharks’ teeth from overseas follows regulations. The islanders understood the reasoning behind such a change and agreed to incorporate this within the proposed (inshore) Fisheries Management Plan (Dawson and Irving, 2020). The Plan also introduced a measure to prohibit the taking of any shark species using a set shark line. The United Kingdom Government’s Blue Belt Programme has been assisting the Government of the Pitcairn Islands to develop an MPA Management Plan (currently awaiting approval by the Pitcairn Island Council). Within the proposed Plan is an action to undertake regular monitoring of shark populations to assess the effectiveness of the restrictions included within the inshore Fisheries Management Plan (Hardman, MMO, pers. comm.).
The structure of Pitcairn’s assemblage is echoed in global data on reef fish communities on fisheries-impacted islands (Graham et al., 2017), with biomass dominated by low trophic level species. Study of the sampled trophic pyramid revealed a “bottom heavy” fish assemblage with herbivores and small predators dominant. Aside from sharks, other large predators were also rare, and it must be noted that 33% of the trophic level’s total sampled biomass was accounted for by four individuals: a giant trevally (Caranx ignobilis), a greater amberjack (Seriola dumerili|), the single grey reef shark (Carcharhinus amblyrhyncos) and an unidentified tuna (Thunnus sp.). Thus the biomass value reflects presence of large-bodied individuals rather than abundant top predators, as demonstrated by the trophic level only accounting for 6% of MaxN. Furthermore, S. dumerili and Thunnus sp. may have been attracted by the bait but should not be considered a permanent component of the reef-associated predator assemblage due to their pelagic life histories (Allen et al., 2007). Large reef-associated predators were almost entirely absent, with a single grey reef shark, one smalltooth jobfish (Aphareus furca) and nine bluestriped snapper (Lutjanus kasmira) the only records from their respective families on Pitcairn. The majority of sampled reef groupers (Epinephelus and Cephalopholis spp.) on Pitcairn were small, with coronation grouper (Variola louti) the only grouper measured above 400 mm, and only fourteen individuals of this species were sampled. This general rarity across all large reef predator taxa further suggests that the island fishery has altered fish assemblage structure, particularly when considering the prevalence of reef groupers in the fisheries catch data. Indeed the second-most frequently caught fish, the black-tip grouper (local name: red snapper) Epinephelus fasciatus is considered a desirable food fish, as is coronation grouper (local name faafaia) Variola louti, and both species, particularly larger-bodied individuals, were rare in the BRUV data. It is interesting to note that the crosshatch triggerfish (local name: pick-pick) Xanthichthys mento was the second-most abundant species present in BRUVS samples, and showed hyperabundance at specific sites with the highest recorded MaxN value for any species (165). It is likely that the dominance of crosshatch triggerfish is partially a result of the relative absence of large predators, resulting in the “mesopredator release” phenomenon (Ruppert et al., 2013). However, despite the abundance in BRUVS footage, crosshatch triggerfish are not recorded in the fisheries catch data. Fishers report that the species is often caught and discarded due to being a poor food fish, and therefore not recorded on the catch logsheets.
Whilst the large predator community was impoverished, small-bodied herbivores such as Pacific chub were hyper-abundant, at 24% of total MaxN. These species were recorded across all habitats and seen grazing on the algal beds which characterize the island’s shallowest waters, with this abundant food source a possible driver of Pacific chub dominance. Indeed, research in north-west Australia has shown a positive relationship between small herbivore abundance and increased algal cover on coral reefs (Ruppert et al., 2013). Pacific chub also consumed the bait, suggesting dietary opportunism which may further explain their dominance over other herbivores such as surgeonfish (Acanthuridae) and parrotfish (Scaridae), which did not consume bait and accounted for just 8% of total MaxN combined. Parrotfish are recognized as a reef functional group associated with increased hard coral cover and reef resilience (Heenan and Williams, 2013), and thus the rarity of the family has potentially negative implications for the overall health of Pitcairn’s shallow corals (Mumby et al., 2013), particularly given the observed proliferation of algae in shallow waters, which has likely resulted in coral overgrowth and mortality. The relative absence of suppressing large-bodied predators may also be an explanatory factor in the dominance of Pacific chub. Catch monitoring found the Pacific chub (local name: nanwe) to be the most commonly caught species. This is probably due to their abundance in Pitcairn’s nearshore waters, as indicated in the BRUVS results, rather than strong local preference as a food fish. It would appear that fishing off-take is not significantly suppressing Pacific chub populations.
Beyond the analysis of specific species groups as detailed above, catch monitoring has also provided an important characterization of the local fishery. Results indicate that all local fishing methods are practiced throughout the year at Pitcairn. The frequency of boat forays, particularly where these utilize an island longboat for fishing “parties,” are sporadic, depending on the availability of key boat operators, sea conditions, and the participation of a sufficient number of fishers. A weekend with calm sea conditions at a “quiet” time of year (with regard to impending cruise ship visits or island infrastructure projects which demand long working hours) is usually sufficient to entice fishers to venture out. This, and the potential for extra income from selling certain fish and lobsters to visiting cruise ships, appeared to be a key driver of fishing effort. However, data show that effort does not necessarily correspond with catch size, suggesting a variable fishery. Furthermore, it is apparent that fishing effort has declined considerably in recent decades. Historic fishing records published between 1976 and 1996 in the island’s newsletter, Pitcairn Miscellany, again showed a variable annual catch of between 4,000 and 12,000 individual fishes (Götesson, 2012), whilst the 2014/15 catch monitoring recorded just 1,190 fishes landed. Unfortunately, the Pitcairn Miscellany data do not record the number of fishing trips, or any equivalent measure of fishing effort. Nonetheless, several reasons can be suggested to explain the observed reduction in catch volume: (1) a gradual decline in Pitcairn’s resident population, reflected in fewer fishers and consumers; (2) an aging demographic; (3) a reduction in “free time” for residents to fish as a pastime; (4) an increase in foodstuffs imported from New Zealand, thus reducing reliance on local fish as food source; and (5) less demand from cruise ships due to higher food safety standards, with the purchase of seafood during voyages being restricted to certified suppliers (Shuttenberg and Dawson, 2012). It should be noted that the 2014/15 catch data may not be wholly indicative of catches during the preceding decade, firstly due to competing demands on islander time during the sampling period (which may have reduced fishing effort); and secondly due to some fishers choosing not to participate in the catch monitoring (six fishers participated). However, it is considered that a representative sample has been obtained for the species caught, together with their relative abundance, as indicated by the Pacific drummer being the most abundant species in both the fisheries catch and BRUVS datasets.
One component of the island fishery, which cannot be triangulated with BRUVS data, is the harvesting of lobster species. Demand for all three lobster species is reported to have grown in recent years due to ad hoc sales to visiting cruise ships and to supply the local restaurant (Coghlan et al., 2017). By the start of the Darwin project in 2014 on Pitcairn, it was becoming apparent that wild stock of all lobster species (Aesop slipper lobster Scyllarides haanii, Easter Island lobster Panulirus pascuensis and pronghorn lobster P. penicillatus) was rapidly diminishing. This was reflected in the increase in fishing effort required to fulfill purchase orders (Coghlan et al., 2017). In order to address this concern, we made a number of recommendations at project conclusion which included (1) a ban on the landing of berried female lobsters, which should be released back into the sea from a lifted pot; and (2) the introduction of marking female lobsters with a V-notch on a uropod of the tail (thereby identifying the individual for release if subsequently caught).
In summary, the “bottom heavy” assemblage on Pitcairn, as sampled by BRUVS and the fisheries catch data, is markedly different from assemblages at pristine unfished sites, both elsewhere in the island group (Sala et al., 2012) and at comparable reef sites in regional and global published data (Graham and McLanahan, 2013; Graham et al., 2017; Letessier et al., 2019). This is likely to be the product of a long term artisanal fishery targeting large reef predators including popular food fishes, and sharks primarily harvested for their teeth. Targeted fishing of a slow-reproducing group such as sharks is likely to be unsustainable even within this artisanal fishery context, and Pitcairn BRUVS findings echo recent observations on the global decline of reef sharks in fished areas (MacNeil et al., 2020). Fisheries impacts on top predators may have subsequently driven the observed proliferation of small-bodied herbivores and mesopredators, which have also taken advantage of abundant food sources such as widespread benthic algae. Once adoption of the proposed MPA Management Plan takes place, the regular monitoring of reef-associated top predator populations should indicate their current status and whether numbers have started to recover (as is hoped). Early anecdotal indications from islanders (in 2018) would suggest that the numbers of reef sharks at least are increasing (O’Keefe, pers. comm.).
By setting new quantitative information on Pitcairn’s marine resources in biogeographical and anthropogenic contexts through comparison with regional and global data, this study has improved the understanding of Pitcairn’s fish assemblage and highlighted evidence which may explain the observed assemblage structure. The value of BRUVS as a precise, repeatable and environmentally sustainable method has been demonstrated, and the scientific foundation for future conservation and management decision-making on Pitcairn has been substantially expanded. This study also made a major contribution to the identified aims of the Darwin Project (Dawson et al., 2013) through its assessment of key fisheries species by means of a mixed methods approach.
The application of BRUVS and catch monitoring information to setting catch levels and fishing quotas is recommended to inform ongoing fisheries management, in addition to regular surveys with this mixed methods approach in order to triangulate ecological and fisheries data. Establishment of regular sampling will be vital to monitor for any recoveries in high trophic level reef predators on Pitcairn in the 5 years since these data were collected, as fishing effort has likely continued declining and the historically intense shark fishery is now considerably reduced. It will also be important to review the impact of the Coastal Conservation Zones which were included within the Fisheries Management Plan (Dawson et al., 2017) to support the continuation of small-scale fisheries in nearshore waters.
There is potential for wider implementation of BRUVS on Pitcairn, particularly on the globally unique deep coral reefs around the island which extend beyond 40 m (Sala et al., 2012) and were beyond the logistical means of the 2014 BRUVS surveys. The use of mid-water BRUVS (Letessier et al., 2013; Santana-Garcon et al., 2014) in offshore pelagic habitats around Pitcairn would also provide valuable data to inform ongoing implementation and monitoring of both the Fisheries Management Plan and the MPA Management Plan. This is especially needed as catch monitoring demonstrated the targeting by local fisheries of offshore pelagic species such as yellowfin tuna (Thunnus albacares) and wahoo (Acanthocybium solandri) which cannot be effectively assessed by the shallow seabed-based BRUVS sampling deployed in this study. Whilst historical data (Götesson, 2012) and the 2014/15 catch monitoring have highlighted seasonal variations in catches of these fished pelagic migratory species, dedicated ecological sampling of these taxa is required to create robust, fisheries-independent data in support of management.
The raw data supporting the conclusions of this article will be made available by the authors, without undue reservation.
Ethical review and approval was not required for the animal study because the research was conducted in accordance with the ethical research guidelines of the participating institutions.
HD and TL: video data acquisition and analysis. RI: fisheries data acquisition and analysis. TD and HK: supervision and review. All authors contributed to the article and approved the submitted version.
Funding for this work was provided by the United Kingdom’s Darwin Initiative, Project No. 20-006 (a sustainable marine and fisheries management plan for the Pitcairn Islands), which ran from 2013 to 2017.
RI was employed by Sea-Scope Marine Environmental Consultants.
The remaining authors declare that the research was conducted in the absence of any commercial or financial relationships that could be construed as a potential conflict of interest.
We would like to thank the all those on Pitcairn Island who provided homestay accommodation to the Darwin team members during their stays on Pitcairn and who generously provided assistance with various aspects of the project. In particular, we should like to thank Michele Christian, Division Manager, Environmental, Conservation and Natural Resources Division, Government of Pitcairn Islands; Brian Young, Charlene Warren-Peu and Sue O’Keefe, past and present Fisheries Officers, Environmental, Conservation and Natural Resources Division, Government of the Pitcairn Islands; and Randy Christian, Operations Division, for the construction of the five BRUVS frames. We are also thankful for the support from the Center for Marine Future at UWA toward the BRUVS deployments, including field preparation, stereo calibration, and video analysis. Finally we are grateful to JS and Emily Hardman of the United Kingdom’s Marine Management Organisation for a number of factual corrections to the text.
Allen, G., Steene, R., Humann, P., and Deloach, N. (2007). Reef Fish Identification: Tropical Pacific. Jacksonville, FL: New World Publications.
Cappo, M., Harvey, E., and Shortis, M. (2006). “Counting and measuring fish with baited video techniques - an overview,” in Proceedings of the Australian Society for Fish Biology Workshop “Cutting-Edge Technologies in Fish and Fisheries Science, eds J. M. Lyle, D. M. Furlani, and C. D. Buxton (Hobart: Australian Society for Fish Biology), 101–114.
Cappo, M., Harvey, E. S., Speare, P., and Malcom, H. (2003). Potential of Video Techniques to Monitor Diversity, Abundance and Size of Fish in Studies of Marine Protected Areas. Aquatic Protected Areas; What Works Best and How do we Know, 455-464. Available online at: www.ozcoasts.gov.au (accessed August 26, 2013).
Coghlan, A. R., White, R., Dawson, T. P., Irving, R. A., Zeller, D., and Palomares, M. L. D. (2017). Reconstructed marine fisheries catches at a remote island group: Pitcairn Islands (1950-2014). Front. Mar. Sci. 4:320. doi: 10.3389/fmars.2017.00320
Dawson, T. P., Gray, K., Irving, R. A., Crick, K., O’Keefe, S., and Christian, M. (2017). Fisheries Management Plan for the Pitcairn Islands Coastal Conservation Areas. Environmental, Conservation and Natural Resources Division, Government of the Pitcairn Islands.
Dawson, T. P., and Irving, R. A. (2020). “Developing a Fisheries Management Plan for the Pitcairn Islands Marine Reserve,” in Marine Protected Areas: Science, Policy and Management, eds J. Humphreys and R. W. E. Clark (Amsterdam: Elsevier), doi: 10.1016/B978-0-08-102698-4.00014-9
Dawson, T. P., Koldewey, H., and Irving, R. A. (2013). Darwin Initiative Round 19 Grant Application: A Sustainable Marine and Fisheries Management Plan for the Pitcairn Islands. London: Darwin Initiative.
Dorman, S. R., Harvey, E. S., and Newman, S. J. (2012). Bait effects in sampling coral reef fish assemblages with stereo-BRUVs. PLoS One 7:e41538. doi: 10.1371/journal.pone.0041538 (accessed January 23, 2014).
Duffy, H., Letessier, T., and Irving, R. (2017). Significant range extensions for two fish species at Pitcairn Island, South Pacific. J. Fish Biol. 91, 669–672. doi: 10.1111/jfb.13359
Dwyer, R. G., Krueck, N. C., Udyawer, V., Heupel, M. R., Chapman, D., Pratt, H. L., et al. (2020). Individual and population benefits of marine reserves for reef sharks. Curr. Biol. 30, 480–489.e5. doi: 10.1016/j.cub.2019.12.005
Ellis, D. M., and DeMartini, E. E. (1995). Evaluation of a video camera technique for indexing abundances of juvenile pink snapper, Pristipomoides filamentosus, and other Hawaiian insular shelf fishes. Oceanogr. Literat. Rev. 42, Available online at: yadda.icm.edu.pl (accessed August 26, 2014).
Fishbase (2014). Available online at: www.fishbase.org/search.php (accessed August 31, 2014).
Friedlander, A. M., Caselle, J. E., Ballesteros, E., Brown, E. K., Turchik, A., and Sala, E. (2014). The real bounty: marine biodiversity in the Pitcairn Islands. PLoS One 9:e100142. doi: 10.1371/journal.pone.0100142
Götesson, L. -Å (2012). Fishes of the Pitcairn Islands, Including Local Names and Fishing Methods. Visby, SE: Nomen Forlag.
Graham, N. A., and McLanahan, T. R. (2013). The last call for marine wilderness. Bioscience 63, 397–402.
Gov.UK. (2016). Available online at: https://www.gov.uk/government/news/uk-set-to-protect-four-million-square-kilometres-of-ocean (accessed November 17, 2020).
Graham, N. A. J., McClanahan, T. R., MacNeil, M. A., Wilson, S. K., Cinner, J. E., Huchery, C., et al. (2017). Human disruption of coral reef trophic structure. Curr. Biol. 27, 231–236. doi: 10.1016/j.cub.2016.10.062
Hardinge, J., Harvey, E. S., Saunders, B. J., and Newman, S. J. (2013). A little bait goes a long way: the influence of bait quantity on a temperate fish assemblage sampled using stereo-BRUVs. J. Exp. Mar. Biol. Ecol. 44, 250–260. doi: 10.1016/j.jembe.2013.09.018 (accessed May 7, 2014).
Harvey, E. S., Cappo, M., Butler, J. J., Hall, N., and Kendrick, G. (2007). Bait attraction affects the performance of remote underwater video stations in assessment of demersal fish community structure. Mar. Prog. Ser. 350, 245–254. doi: 10.3354/meps07192
Heenan, A., and Williams, I. (2013). Monitoring herbivorous fishes as indicators of coral reef resilience in American Samoa. PloS One 8:e079604. doi: 10.1371/journal.pone.0079604
Irving, R. A., and Dawson, T. P. (2012). The Marine Environment of the Pitcairn Islands. A Report to Global Ocean Legacy, a Project of the Pew Environment Group. Dundee: Dundee University Press, 115.
Langlois, T., Goetze, J., Bond, T., Monk, J., Abesamis, R. A., Asher, J., et al. (2020). A field and video annotation guide for baited remote underwater stereo-video surveys of demersal fish assemblages. Methods Ecol. Evol. 11, 1401–1409. doi: 10.1111/2041-210X.13470
Langlois, T., Harvey, E., Fitzpatrick, B., Meeuwig, J., Shedrawi, G., and Watson, D. (2010). Cost-efficient sampling of fish assemblages: comparison of baited video stations and diver video transects. Aquat. Biol. 9, 155–168. doi: 10.3354/ab00235
Letessier, T. B., Juhel, J.-B., Vigliola, L., and Meeuwig, J. J. (2015). Low-cost small action cameras in stereo generate accurate measurements of fish. Jnl. Exp. Mar. Biol. Ecol. 466, 120–126. doi: 10.1016/j.jembe.2015.02.013
Letessier, T. B., Meeuwig, J. J., Gollock, M., Groves, L., Bouchet, P., Chapuis, L., et al. (2013). Assessing pelagic fish populations: the application of demersal video techniques to the mid-water environment. Methods Oceanogr. 8, 41–55. doi: 10.1016/j.mio.2013.11.003
Letessier, T. B., Mouillot, D., Bouchet, P. J., Vigliola, L., Fernandes, M. C., Thompson, C., et al. (2019). Remote reefs and seamounts are the last refuges for marine predators across the Indo-Pacific. PLoS Biol. 17:e3000366. doi: 10.1371/journal.pbio.3000366
Lieske, E., and Myers, R. (1994). Coral Reef Fishes: Indo-Pacific & Caribbean. London: Harper Collins Publishers.
MacNeil, M. A., Chapman, D. D., Heupel, M., Simpfendorfer, C. A., Heithaus, M., Meekan, M., et al. (2020). Global status and conservation potential of reef sharks. Nature 583, 801–806. doi: 10.1038/s41586-020-2519-y
Meekan, M. G., Cappo, M., Carleton, J., and Marriott, R. (2006). Surveys of Shark and Fin-Fish Abundance on Reefs within the MOU74 Box and Rowley Shoals using Baited Remote Underwater Video Systems. Report Prepared for the Australian Government Department of the Environment and Heritage. Townsville: Australian Institute of Marine Science.
Mumby, P. J., Bejarano, S., Golbuu, Y., Steneck, R. S., Arnold, S. N., van Woesik, R., et al. (2013). Empirical relationships among resilience indicators on Micronesian reefs. Coral Reefs 32, 213–226. doi: 10.1007/s00338-012-0966-0
O’Leary, B. C., Fieldhouse, P., McClean, C. J., Ford, A. E. S., Burns, P., Hawkins, J. P., et al. (2018). Evidence gaps and biodiversity threats facing the marine environment of the United Kingdom’s Overseas Territories. Biodiv. Conserv. 28, 363–383. doi: 10.1007/s10531-018-1660-5
Oksanen, J. (2013). Vegan: Ecological Diversity. Available online at: hokudai.ac.jp (accessed August 15, 2014).
Pew (2015). Project Eyes on the Seas. Available online at: http://pewtrusts.org/en/research-and-analysis/issue-briefs/2015/03/project-eyes-on-the-seas (accessed February 12, 2021).
Pew (2020). Global Ocean Legacy. Available online at: http://pewtrusts.org/en/projects/global-ocean-legacy (accessed November 17, 2020).
Randall, J. (2005). Reef and Shore Fishes of the South Pacific: New Caledonia to Tahiti and the Pitcairn Islands. Honolulu: University of Hawai’i Press.
Ruppert, J. L. W., Travers, M. J., Smith, L. L., Fortin, M. J., and Meekan, M. G. (2013). Caught in the middle: combined impacts of shark removal and coral loss on the fish communities of Coral Reefs. PLoS One 8:e74648. doi: 10.1371/journal.pone.0074648
Sala, E., Friedlander, A., Ballesteros, E., Brown, E., Bradner, H., Caselle, J., et al. (2012). Pitcairn Islands Expedition Report. Washington, DC: National Geographic Society, 99.
Santana-Garcon, J., Braccini, M., Langlois, T. J., Newman, S. J., McAuley, R. B., and Harvey, E. S. (2014). Calibration of pelagic stereo?BRUVs and scientific longline surveys for sampling sharks. Methods Ecol. Evol. 5, 824–833. doi: 10.1111/2041-210X.12216
Shuttenberg, H. Z., and Dawson, T. P. (2012). Artisanal Fishing in the Pitcairn Islands: an Analysis of Household Survey Data. Dundee: University of Dundee, 18.
Soler, G. A., Edgar, G. J., Thomson, R. J., Kininmonth, S., Campbell, S. J., Dawson, T. P., et al. (2015). Reef fishes at all trophic levels respond positively to effective marine protected areas. PLoS One 10:e0140270. doi: 10.1371/journal.pone.0140270
Watson, D. L., Harvey, E. S., Anderson, M. J., and Kendrick, G. (2005). A comparison of temperate reef fish assemblages recorded by three underwater stereo-video techniques. Mar. Biol. 148, 415–425. doi: 10.1007/s00227-005-0090-6
Watson, D. L., Harvey, E. S., Fitzpatrick, B. M., Langlois, T. J., and Shedrawi, G. (2010). Assessing reef fish assemblage structure: how do different stereo-video techniques compare? Mar. Biol. 157, 1237–1250. doi: 10.1007/s00227-010-1404-x
Keywords: Pitcairn Island, BRUVS, coastal waters, marine protected area, coral and rocky reefs, sustainable fisheries, remote island
Citation: Duffy HJ, Letessier TB, Koldewey HJ, Dawson TP and Irving RA (2021) Ensuring the Sustainability of Coastal Small-Scale Fisheries at Pitcairn Island (South Pacific) Within a Large Scale No-Take MPA. Front. Mar. Sci. 8:647685. doi: 10.3389/fmars.2021.647685
Received: 30 December 2020; Accepted: 16 April 2021;
Published: 25 May 2021.
Edited by:
Joanna Stockill, Marine Management Organisation (MMO), United KingdomReviewed by:
Marco Andrello, Instituto per lo Studio degli Impatti Antropici e Sostenibilità in Ambiente Marino (CNR), ItalyCopyright © 2021 Duffy, Letessier, Koldewey, Dawson and Irving. This is an open-access article distributed under the terms of the Creative Commons Attribution License (CC BY). The use, distribution or reproduction in other forums is permitted, provided the original author(s) and the copyright owner(s) are credited and that the original publication in this journal is cited, in accordance with accepted academic practice. No use, distribution or reproduction is permitted which does not comply with these terms.
*Correspondence: Robert A. Irving, cm9iZXJ0QHNlYS1zY29wZS5jby51aw==
†These authors share senior authorship
Disclaimer: All claims expressed in this article are solely those of the authors and do not necessarily represent those of their affiliated organizations, or those of the publisher, the editors and the reviewers. Any product that may be evaluated in this article or claim that may be made by its manufacturer is not guaranteed or endorsed by the publisher.
Research integrity at Frontiers

Learn more about the work of our research integrity team to safeguard the quality of each article we publish.