 Guoqiang Qiu
 Xiaogang Xing
 Fei Chai2,3
 Zhiyu Liu
 Haili Wang
95% of researchers rate our articles as excellent or good
Learn more about the work of our research integrity team to safeguard the quality of each article we publish.
Find out more
ORIGINAL RESEARCH article
Front. Mar. Sci. , 13 April 2021
Sec. Ocean Observation
Volume 8 - 2021 | https://doi.org/10.3389/fmars.2021.643608
Super typhoon Rammasun (2014) traveled across the South China Sea on July 16–18. Its far-field impacts on phytoplankton dynamics in the upper ocean were documented by a Biogeochemical-Argo (BGC-Argo) float located 200 km to the left of its track. Both surface chlorophyll-a concentration (Chla) and particulate backscattering coefficient (bbp) were observed to increase substantially within two distinct stages. The initial increase occurred during the passage of the typhoon, and the subsequent increase happened 5 days after the typhoon. In contrast, depth-integrated Chla and bbp in the upper 150 m underwent negligible changes throughout the entire period. The key lies in the fact that surface phytoplankton increases in the far-field region resulted from the physically driven vertical redistribution of particles, rather than from biological alternations. The first increase was attributed to the typhoon-induced strong turbulence which deepened the surface mixed layer, and thus entrained subsurface particles to the surface; the second was due to the post-typhoon adiabatic quasi-geostrophic adjustment of the upper ocean that gradually raised the isopycnals (and thus subsurface particles). These results challenge the prevailing wisdom on typhoon impacts, and thus shed new lights on the nature of the upper ocean responses to typhoons from both physical and biological perspectives.
Typhoons (or hurricanes) are extreme weather events that have significant impacts on physical and biogeochemical processes in the underlying upper ocean. Typhoons can induce strong mixing, upwelling, near-inertial oscillations, mixed layer deepening, and surface cooling (Price, 1981; Stramma et al., 1986; Dickey et al., 1998; Sanford et al., 2011), and the induced baroclinic oscillations can propagate outward far away from the typhoon track, leading to large scale changes in the thermocline (Geisler, 1970). These physical responses can further impact biogeochemical processes in the upper ocean. There are many studies reporting that surface chlorophyll-a concentration (Chla) substantially increased after the passage of a typhoon (Babin et al., 2004; Lin et al., 2003; Black and Dickey, 2008), and two primary mechanisms have been proposed to explain such a phenomenon. The first one highlights a direct physical process that the typhoon-induced strong mixing and upwelling can bring subsurface phytoplankton into the surface mixed layer (i.e., the so-called particle entrainment mechanism) (Chai et al., 2021). The other one is mainly a biological process that typhoons can pump more nutrients into the upper layers from depth (i.e., the nutrient entrainment mechanism), which in turn promote the growth of surface phytoplankton (Lin et al., 2003). Moreover, a two-stage increase of the surface Chla has been identified by some studies, that is, an initial rapid increase attributed to direct physical process, and a subsequent one mainly due to the biological response to increased nutrient supply (Shang et al., 2008; Pan et al., 2017).
Not surprisingly, the extent of the surface Chla increase depends on the forcing factors including the typhoon intensity, its translation speed, and the pre-typhoon ocean state (Lin, 2012). In general, strong and slow typhoons inject more energy into the ocean, thereby facilitating the surface phytoplankton increase; whereas strong upper ocean stratification diminishes vertical mixing and thus inhibits the surface phytoplankton increase. These responses are usually asymmetric with respect to the typhoon track. A greater Chla increase is often observed under or to the right of the typhoon track, and it is usually attributed to the rightward stronger mixing due to both larger wind speed and the stronger wind-current resonance (Babin et al., 2004). To date, most studies have concentrated on this strong phytoplankton increase immediately under or to the right of the typhoon track; while little attention has been given to upper ocean responses in more distant regions of the direct typhoon influence, especially to the left of the typhoon track. It remains unclear as to what mechanisms are responsible for the observed increase of surface phytoplankton in these regions due to a lack of vertical profiling measurements.
Owing to the rough weather (and sea) conditions, the typhoon-induced changes of phytoplankton in the upper ocean are hardly observable through either shipboard sampling or satellite remote sensing. Thus, most studies have been based on the analysis of satellite remote sensed surface Chla several days after the typhoon’s passage (e.g., Zhao et al., 2013). Recently, a new type of profiling platform, Biogeochemical-Argo (BGC-Argo) float, has been developed, making all-weather physical and biogeochemical observations at both high vertical (<5 m) and temporal (<5 d) resolutions possible (Johnson et al., 2009). To date, two cases of phytoplankton response to a typhoon based on the observations using BGC-Argo floats have been reported. After the weak but slow-moving tropical cyclone Hudhud traveled across the Bay of Bengal, both surface and subsurface Chla was observed to greatly increase under the storm track (Chacko, 2017). This bloom was attributed to the combined effects of the particle entrainment and nutrient entrainment mechanisms, via strong mixing and upwelling favored by sufficient wind-ocean interaction and a pre-existing cyclonic eddy. By contrast, the strong but fast-moving typhoon Trami passed over the western Pacific, causing an increase in surface Chla while a decrease in subsurface Chla to the right of the typhoon track, but no net increase in the depth-integrated Chla (Chai et al., 2021). These observations demonstrate that the phytoplankton responses depend on both the characteristics of the typhoon and the state of the underlying ocean, and illustrate the great value of BGC-Argo float profiling observations as well.
The super typhoon Rammasun (2014) crossed the South China Sea (SCS) on July 16–18, and the vertical physical and biological changes were well observed by a BGC-Argo float located 200 km to the left of the typhoon track with high vertical (2 m) and temporal (1 d) resolutions (Figure 1). The observations showed that surface phytoplankton increased during and shortly after the typhoon’s passage, but the change of the depth-integrated Chla in the upper 150 m was negligible during the entire period. These unique observations provide a rare opportunity to examine the upper ocean phytoplankton dynamics response to typhoon in the far-field region of typhoon influence. This work extends the previous studies limited to surface phytoplankton changes, and seeks to shed light on the physical and biological responses of the entire upper ocean to typhoon.
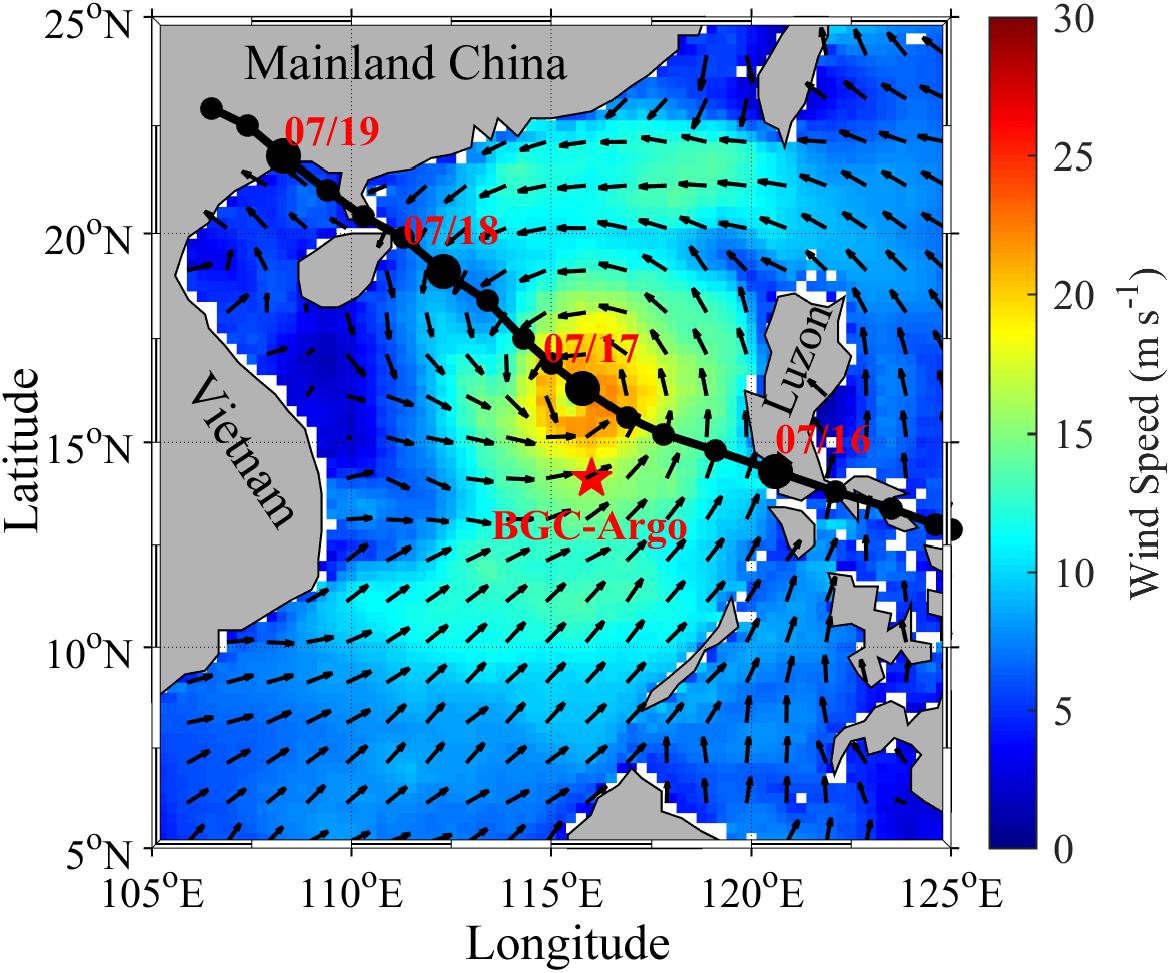
Figure 1. Wind speed at 0 h UTC on July 17 in the SCS and the track of Rammasun (black line). The black dots represent the 6-hourly typhoon centers, and the red pentagram shows the BGC-Argo float.
The BGC-Argo float (Sea-Bird Navis BGC-i, No. 0348) was deployed at 14°N, 116°E in the central SCS basin, more than 400 km away from the nearest coast (Figure 1). The float was equipped with a CTD (SBE 41CP), a dissolved oxygen sensor (SBE 63), and a three-channel optical sensor (MCOMS) to measure Chla, fluorescent dissolved organic matter, and the particulate backscattering coefficient at 700 nm (bbp). It profiled every day with 2 m sampling resolution and surfaced at midnight. The Chla and bbp profiles were smoothed by a five-point running median filter to remove unexpected spikes. In order to identify overall temporal changes, high-frequency variations were removed using a 3-d moving average. The BGC-Argo float data are provided by Xiamen University1.
The typhoon track data was obtained from the Joint Typhoon Warning Center (JTWC2); 6-hourly wind speed and stress data with a spatial resolution of 0.25° × 0.25° were extracted from the Global Blended Mean Wind Fields product provided by Copernicus Marine Environment Monitoring Service (CMEMS3); 3-hourly precipitation data with a spatial resolution of 0.25° × 0.25° were extracted from the 3B42 product provided by the Tropical Rain Measuring Mission (TRMM) project4; daily sea level anomaly (SLA) data with a resolution of 0.25° × 0.25° were extracted from the Global Ocean Gridded L4 Sea Surface Height and Derived Variables Reprocessed product provided by CMEMS (see text footnote 3); daily satellite sea surface temperature (SST) data with a spatial resolution of 0.25° × 0.25° were extracted from the Microwave-only Optimally Interpolated SST product from Remote Sensing Systems (RSS)5; daily and 8-d composited Chla and daily surface photosynthetically available radiation (PAR) data with a spatial resolution of 4 km × 4 km were obtained from the GlobColour project6.
Potential density (σ0) was calculated from the CTD measured pressure, temperature, and conductivity (salinity) based on the thermodynamic equation of Seawater-2010 (TEOS-10; McDougall and Barker, 2011). The surface mixed layer depth (MLD) was calculated using a density threshold of 0.125 kg m–3 from the near-surface value at 10 m (Levitus, 1982). The deep Chla and bbp maximums (DCM and DBM) were defined as their vertical maximum in each profile. The daily anomaly for each variable was defined as the difference between the float-observed value and the pre-typhoon value on July 14.
Ekman pumping velocity (wE) was calculated as:
where τx and τy are the eastward and northward wind stresses, f is the Coriolis parameter, and ρ is the density of seawater.
The displacement of isotherms (Δh) in the pycnocline was calculated from the change in SLA (Δη) using the reduced gravity approximation (Shay et al., 2000):
where , Δρ is the density increase from the surface mixed layer to the pycnocline base, and g is gravity acceleration.
According to the two-layer linear ocean model (Geisler, 1970), the first baroclinic wave speed (C1) was calculated as:
where H1 is the upper layer thickness, which is practically indicated by the thermocline depth (Jaimes and Shay, 2009). In the SCS basin, the depth of the 22°C isotherm can be used as a good proxy for the thermocline (Liu et al., 2001).
The local eddies were identified based on the daily SLA data following the approach of Chaigneau et al. (2009). Firstly, the SLA is plotted with a uniform interval of 1 cm; the geometric center within the innermost enclosed contour is considered as the center of a possible eddy; all the enclosed contours vary monotonously outward from the eddy center belong to this eddy, and the outmost contour is taken as the eddy edge; finally, only the detected eddies with the amplitude difference between the center and edge larger than 2 cm are reserved.
The category 5 (on the Saffir-Simpson Hurricane Wind Scale) typhoon Rammasun (2014) crossed the SCS at a translation speed of ∼6.5 m s–1 on July 16–18. Satellite-observed SST was >28°C over the basin before the typhoon (Figure 2A), but it decreased immediately afterward (Figure 2B). The surface cooling was attributed to the typhoon-induced strong mixing, upwelling and air–sea heat exchange (Price, 1981). The cooling was asymmetric across the typhoon track, with the largest decrease of −5.6°C to the right of the typhoon track and about a factor of 3 less at the same distance to the left. The asymmetric response was due to more intense mixing by both larger winds and stronger wind–current resonance to the right of the typhoon track (Price, 1981). Before the typhoon, satellite-observed Chla was ∼0.1 mg m–3 (Figure 2C), which is typical for an oligotrophic region (Ning et al., 2004). Ocean color sensors were largely ineffective due to the heavy cloud cover during the typhoon. However, the 8-d composited observation showed a basin-scale increase in surface Chla after the passage of the typhoon (Figure 2D). The increase in surface Chla, which coincided with the surface cooling, was more pronounced to the right of the typhoon track.
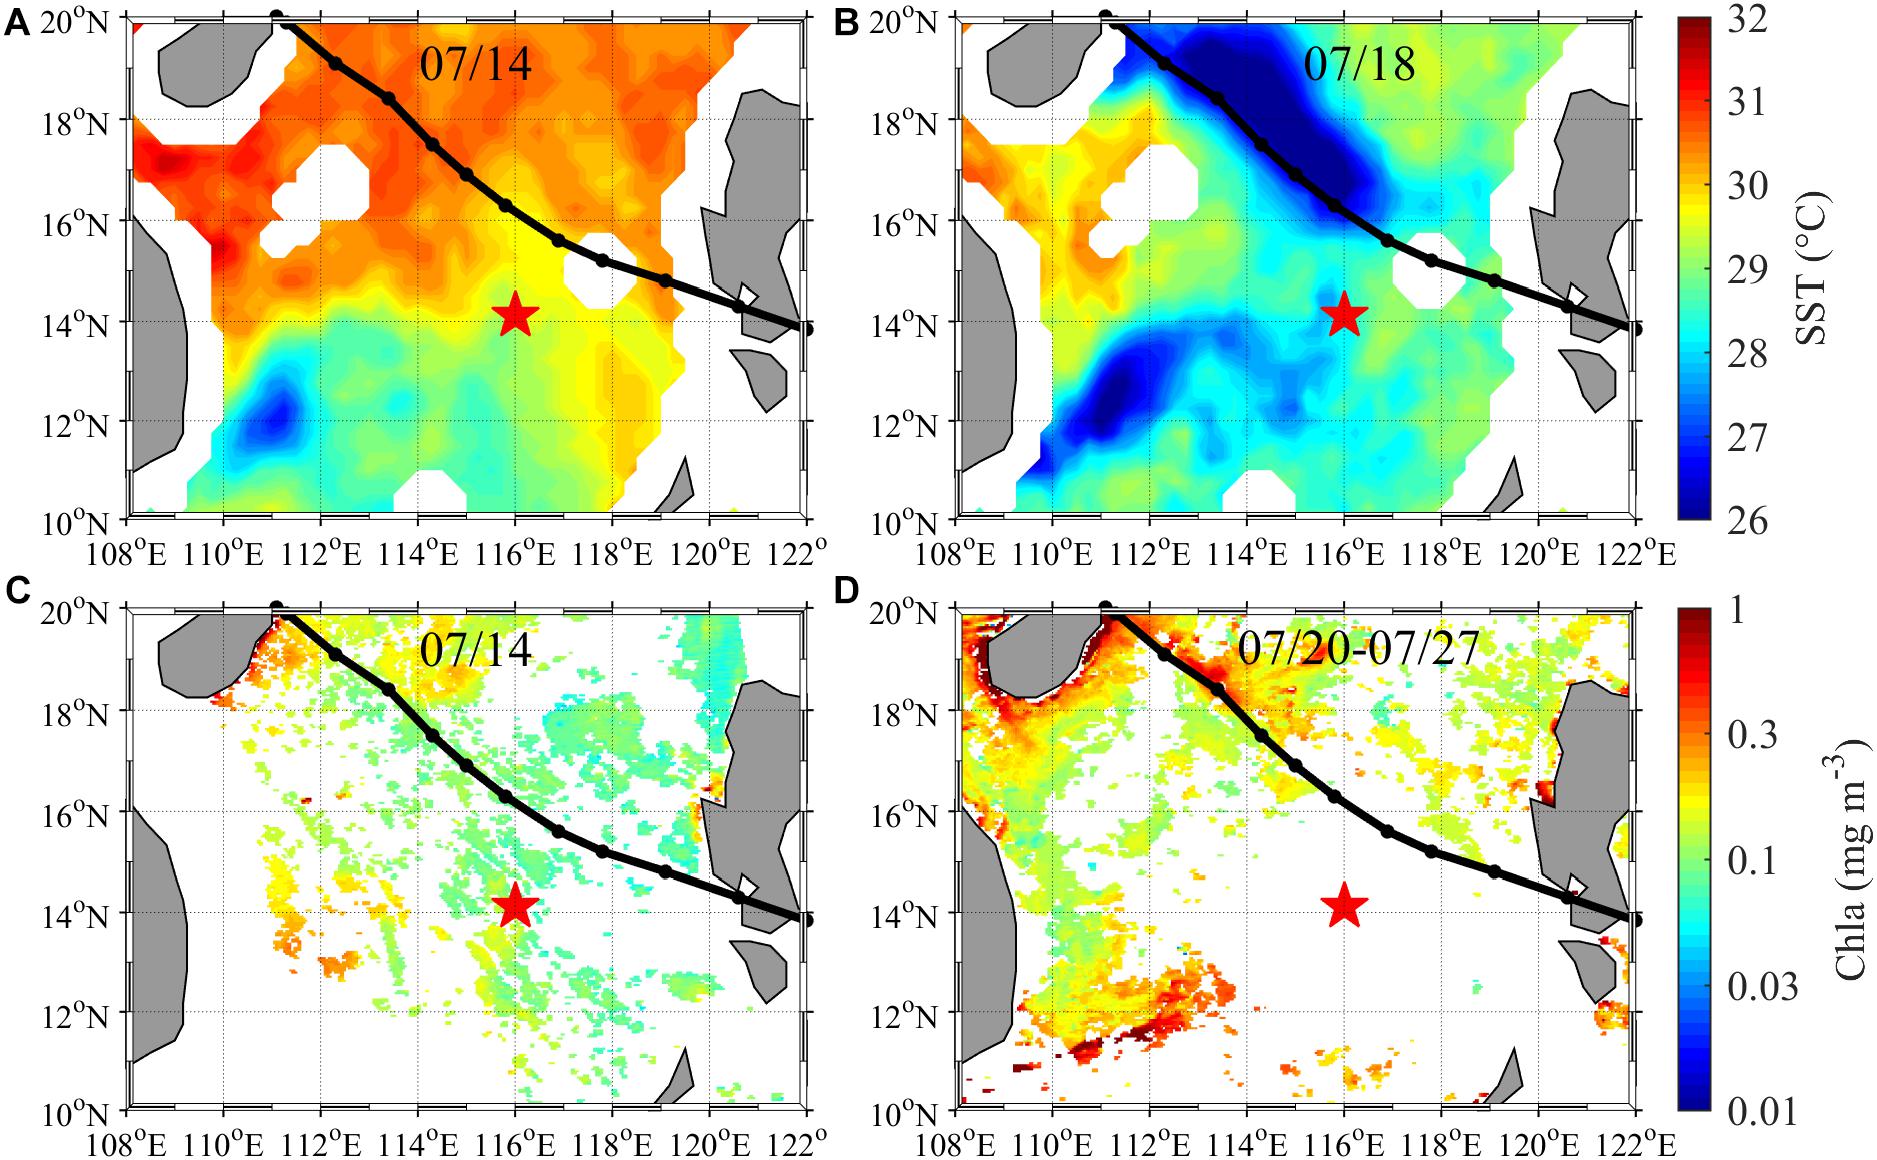
Figure 2. Satellite-observed SST on (A) July 14 and (B) July 18, and surface Chla on (C) July 14 and (D) composited for July 20–27.
The BGC-Argo float was located approximately 200 km to the left of the typhoon track (Figure 1), ∼6 times of the radius of maximum wind, thus its observations represented a far-field responses of the upper ocean to the typhoon. At the float location, the wind speed was very low (<6 m s–1) before the typhoon, and increased rapidly during the typhoon’s passage, with a maximum value of 17 m s–1 on July 17, and then decreased to the pre-typhoon level on July 19 (Figure 3A). Precipitation was heavy (18.2 mm h–1) during the passage, and continuous during July 20–23 after the typhoon with a mean of 1.7 mm h–1. SLA decreased from 7 cm before the typhoon to 2.6 cm on July 25. Surface PAR reached 57 Einstein m–2 d–1 on July 14, which suggests there was intense solar radiation before the typhoon; however, solar radiation was unobservable during the passage of the typhoon due to the heavy cloud cover. The PAR recovered to the pre-typhoon level on July 18–19 just after the typhoon, but it became very low (8.4–21.8 Einstein m–2 d–1) again during July 20–23 due to the continuous precipitation (Figure 3A).
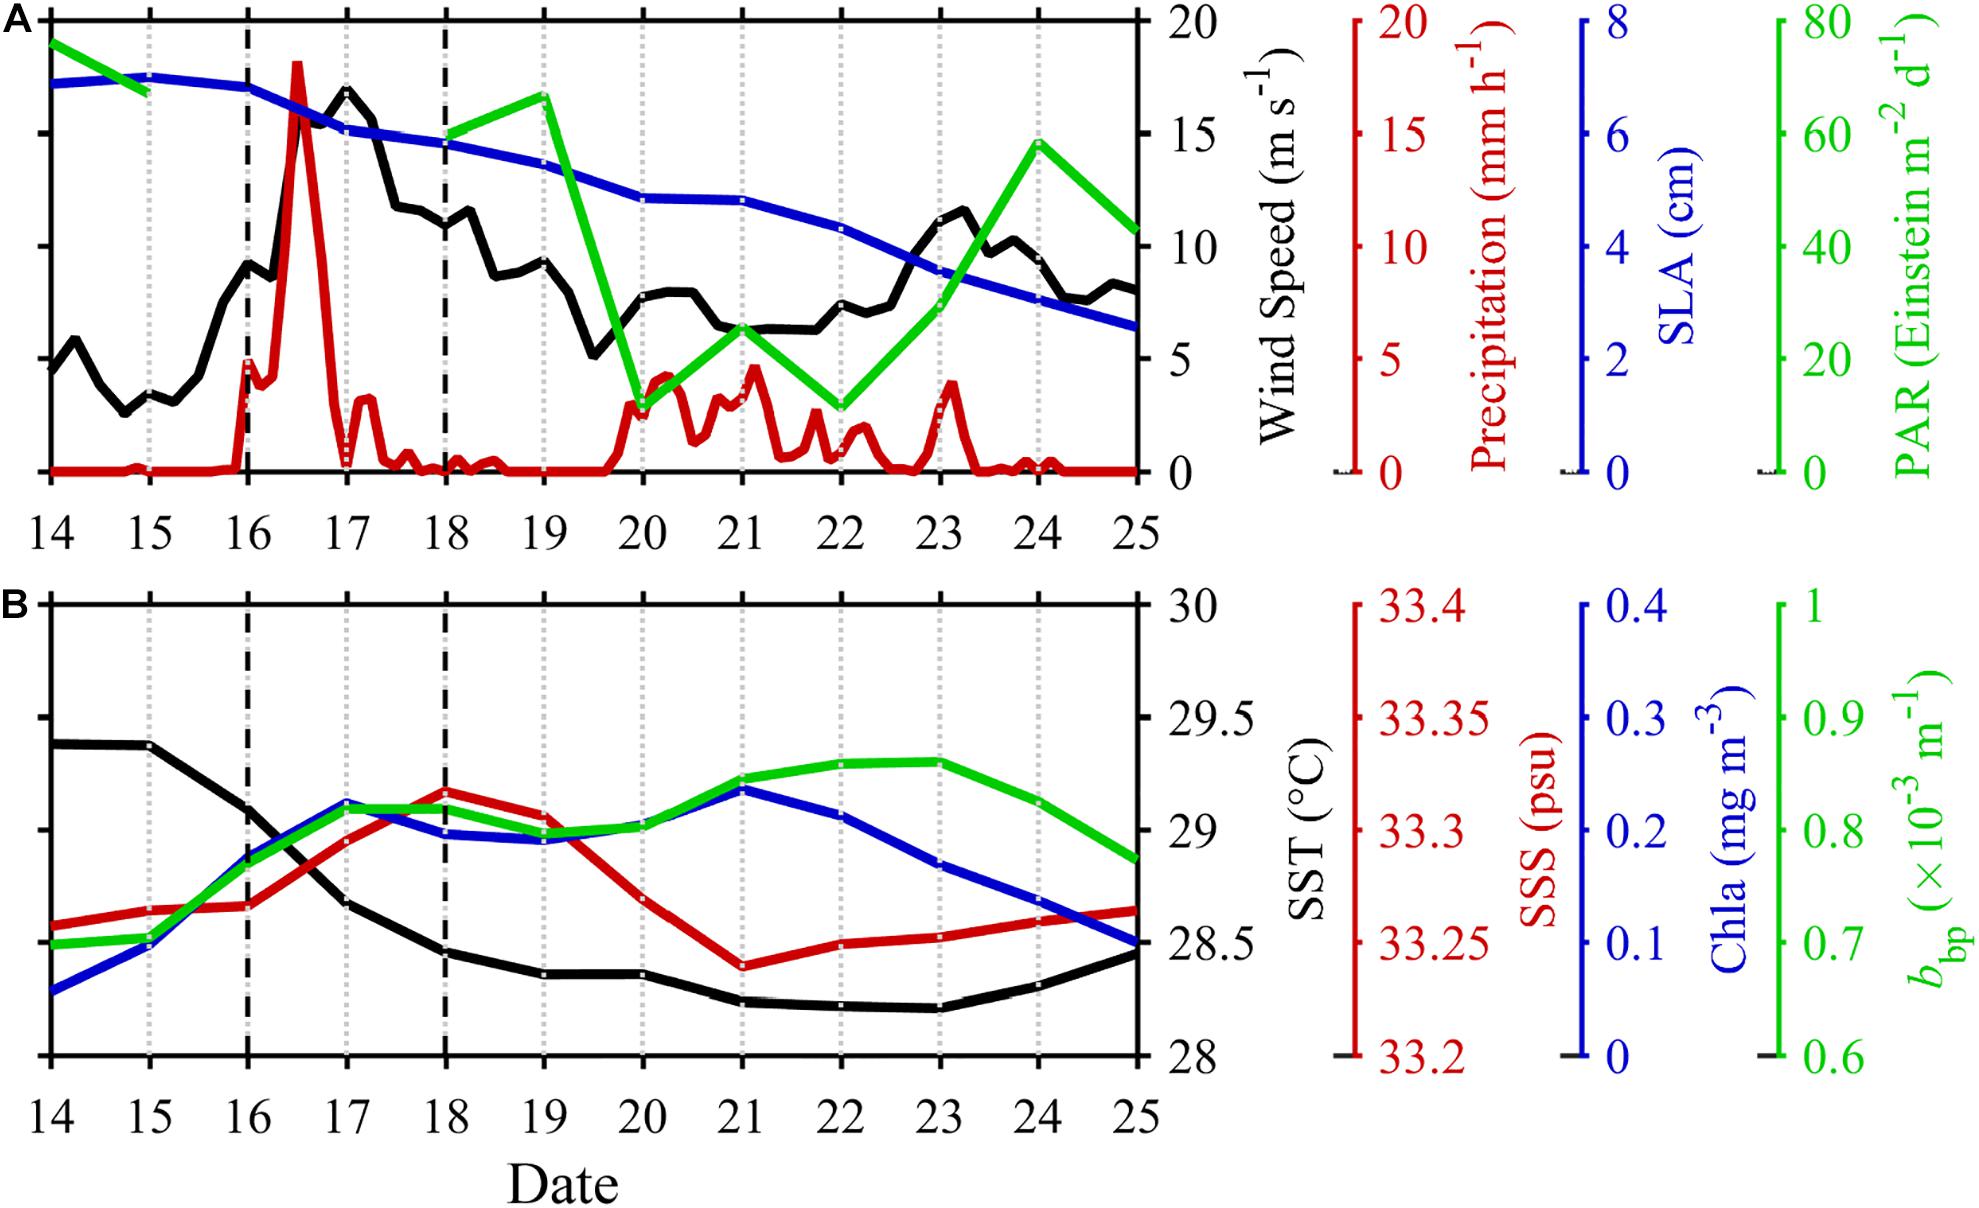
Figure 3. Time series of (A) satellite-observed 6-hourly wind speed, 3-hourly precipitation, daily SLA, and daily PAR at the float location, and of (B) float-observed surface temperature, salinity, Chla and bbp. The period when Rammasun crossed SCS is denoted by the two vertical dashed lines.
Before the super typhoon Rammasun, the surface mixed layer was quite shallow (∼26 m) due to weak wind stirring and strong solar radiation (Figures 3A, 4A). Below the MLD, both the temperature and σ0 profiles had large vertical gradients, approximately 0.1°C m–1 and 0.05 kg m–4 (Figures 4A,E), which implies strong subsurface stratification. The seasonal thermocline depth, indicated by the depth of the 22°C isotherm (Liu et al., 2001), reached 92 m. These vertical structures agreed well with the climatological observations (Qu et al., 2007).
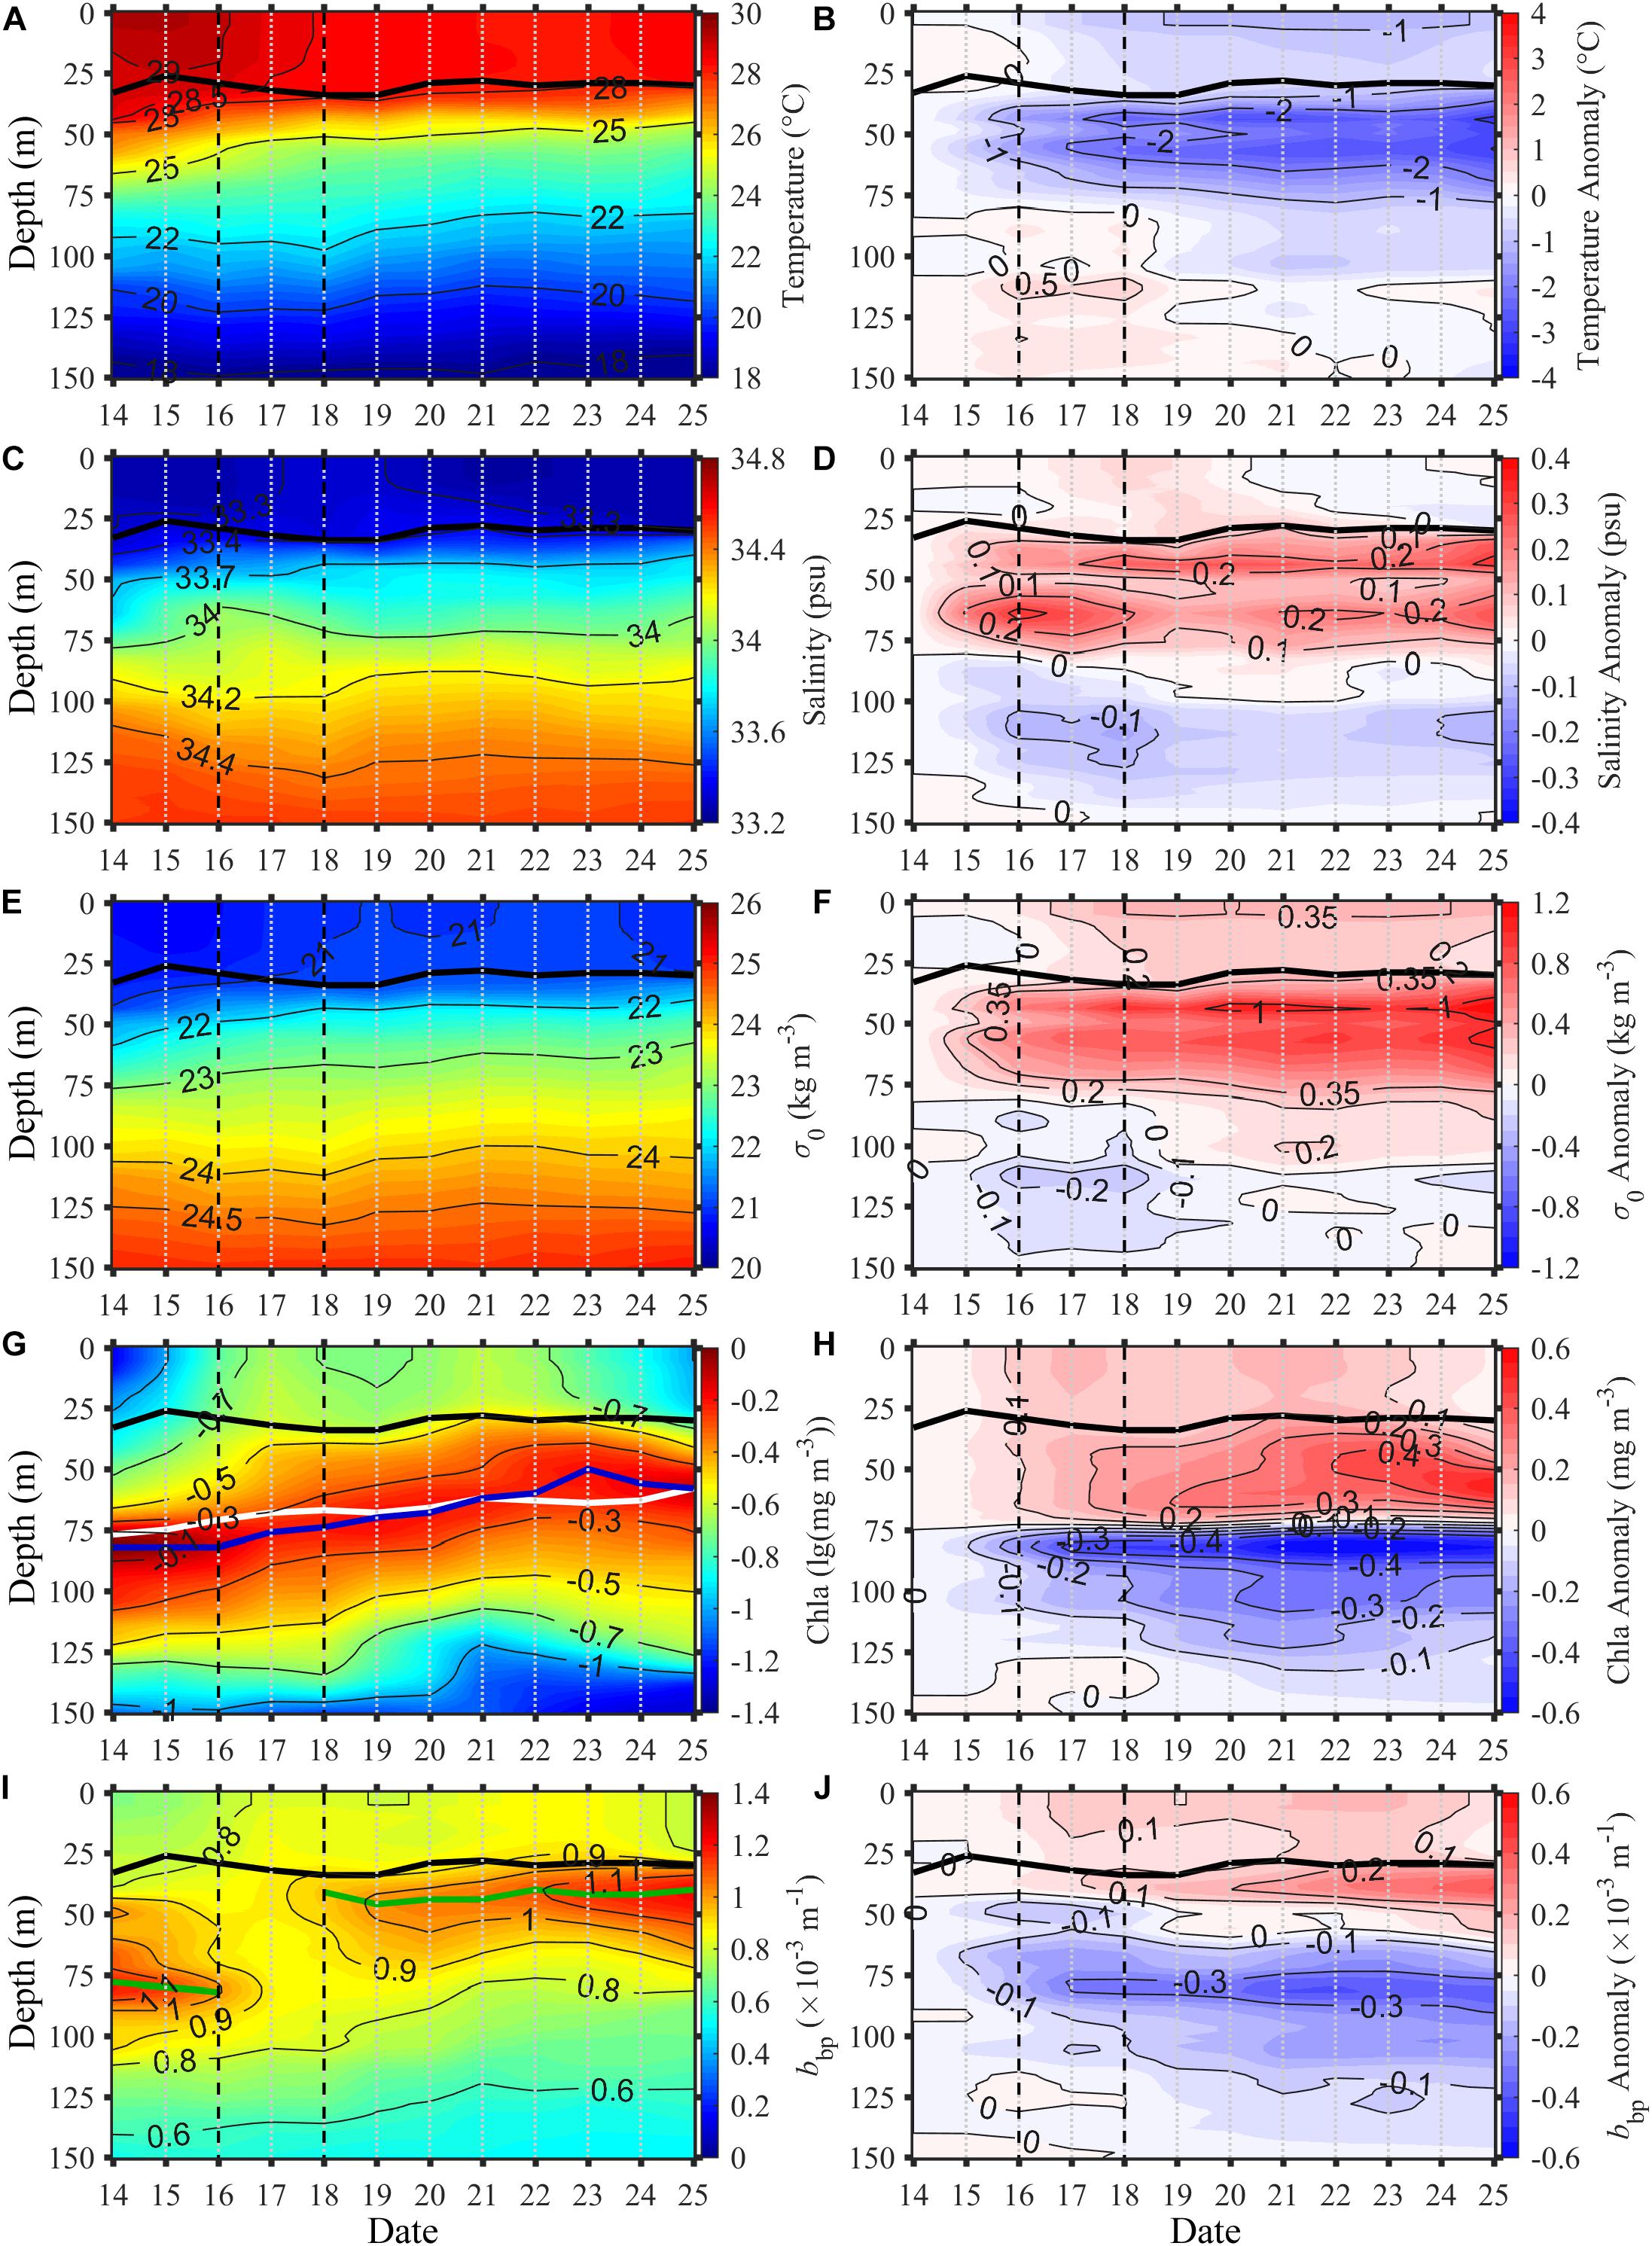
Figure 4. Time series of vertical distributions of float-observed (A) temperature, (C) salinity, (E) σ0, (G) Chla, and (I) bbp, alongside their corresponding anomalies (right panel). The solid black lines in (A-J), white line in (G), blue line in (G), and green line in (I) represent the MLD, depth of isopycnic of σ0 = 23 kg m– 3, depth of DCM, and depth of DBM, respectively.
During the passage of the typhoon, MLD increased abruptly to 34 m due to wind stirring (Figure 4A). Consequently, upper thermocline water was entrained into the surface mixed layer: SST decreased by 0.7°C, and sea surface salinity (SSS) increased by 0.031 psu despite heavy precipitation (Figure 3B). Although MLD showed only a modest increase of 8 m, the temperature, salinity and σ0 all showed remarkable changes below the MLD (Figures 4B,D,F). The temperature anomaly was largely negative above 75 m but positive below that depth, and the salinity anomaly showed an opposite trend. The lower colder but saltier water was brought into the upper layer, while the upper warmer and fresher water was mixed into the lower layer. Mechanical energy injected by the typhoon disperses both vertically and horizontally (Gill, 1984). Vertically, the energy can penetrate to depths well below the surface mixed layer by the near-inertial internal waves, causing strong turbulence at subsurface (Price et al., 1994; Liu et al., 2008). Consequently, during this period the increased subsurface diapycnal mixing altered the vertical distribution of physical variables (Figures 4A–F).
After the passage of the typhoon, the MLD shoaled and reached 28 m on July 21, which was close to the pre-typhoon state (Figure 4A). However, temperature did not begin to recover immediately, but continued to decrease (Figure 4B). SST decreased by 0.46°C on July 23 from the value on July 17. The surface cooling lasted for 8 d; a similar phenomenon has been observed for some other typhoons (e.g., Domingues et al., 2015). The salinity anomaly above the MLD shows two distinct stages (Figure 4D). During July 18–20 salinity increased by 0.01–0.05 psu, which was consistent with the temperature decrease. However, after July 20, salinity decreased with the SSS even lower than the pre-typhoon value by 0.03 psu due to continuous precipitation (Figure 3).
After the typhoon, both isotherm and isopycnal showed continuous upward displacement during July 16–23 (Figures 4A,E). In most previous studies, these uplifts have been attributed to the intense typhoon-driven upwelling (i.e., positive Ekman pumping). However, this was not the case in this situation. On the one hand, the typhoon-induced upwelling mainly occurred in the typhoon forced stage, which time scale was usually <1 d (Jaimes and Shay, 2015) and is known not to persist for a period of 8 d as observed in this case. On the other hand, the intense upwelling was confined within a narrow region along the typhoon track, and correspondingly, a compensatory downwelling occurred over a broader area outside the region of upwelling (Jullien et al., 2012; Jaimes and Shay, 2015). The observed negative Ekman pumping at the BGC-Argo float location suggests that the float measurements were conducted in such a downwelling region (Figure 5A). In this case, we attribute the long-lasting upward displacement to the quasi-geostrophic response of the upper ocean to typhoon forcing. Both barotropic and baroclinic oscillations can be induced in the ocean by the passage of a typhoon (Geisler, 1970). According to the two-layer ocean model, when typhoon translation speed exceeds the first baroclinic wave speed, a geostrophically balanced baroclinic ridge is generated along the track, which can also propagate as Rossby waves. In the present case, the typhoon translation speed was around 6.5 m s–1 and the first baroclinic wave speed was calculated to be 1.5 m s–1; thus, the formation of a baroclinic ridge was to be expected. A primary feature of the first baroclinic mode is that the sea surface height changes in the opposite direction to the vertical displacement of the pycnocline or thermocline. This effect was clearly shown by our observations. After the passage of the typhoon, SLA decreased continuously (Figure 3A), which was coincident with the upward displacement of the isotherms and isopycnals (Figures 4A,E). The estimated isotherm displacement from the pre-typhoon condition (Δh) was basically consistent with the subsurface observations (Figure 5C). The westward propagation speed of first mode Rossby wave can be practically estimated from the time-series of altimeter observations (Chelton and Schlax, 1996). According to their estimation, this speed at the latitude of the float location (14°N) is approximately 0.15 m s–1, and thus the upward displacement forced by the adiabatic quasi-geostrophic adjustment could last for 15 d in theory. However, in a real case, the ocean is always forced by various physical dynamics, and this phenomenon would be obscured by new forcing. Nevertheless, our observation of 8 d uplifting revealed the great impact of a super typhoon on the far-filed region. In principle, sea surface depression is also influenced by the barotropic process and local eddy development. However, the SCS basin is deeper than 4000 m, and the depth-averaged horizontal velocity calculated from the neighboring float locations was <0.01 m s–1, and thus the barotropic sea surface depression was negligible (Ginis and Sutyrin, 1995). Local eddy influence was also excluded as the float was located far away from eddies before and after the typhoon (Figures 5B,D).
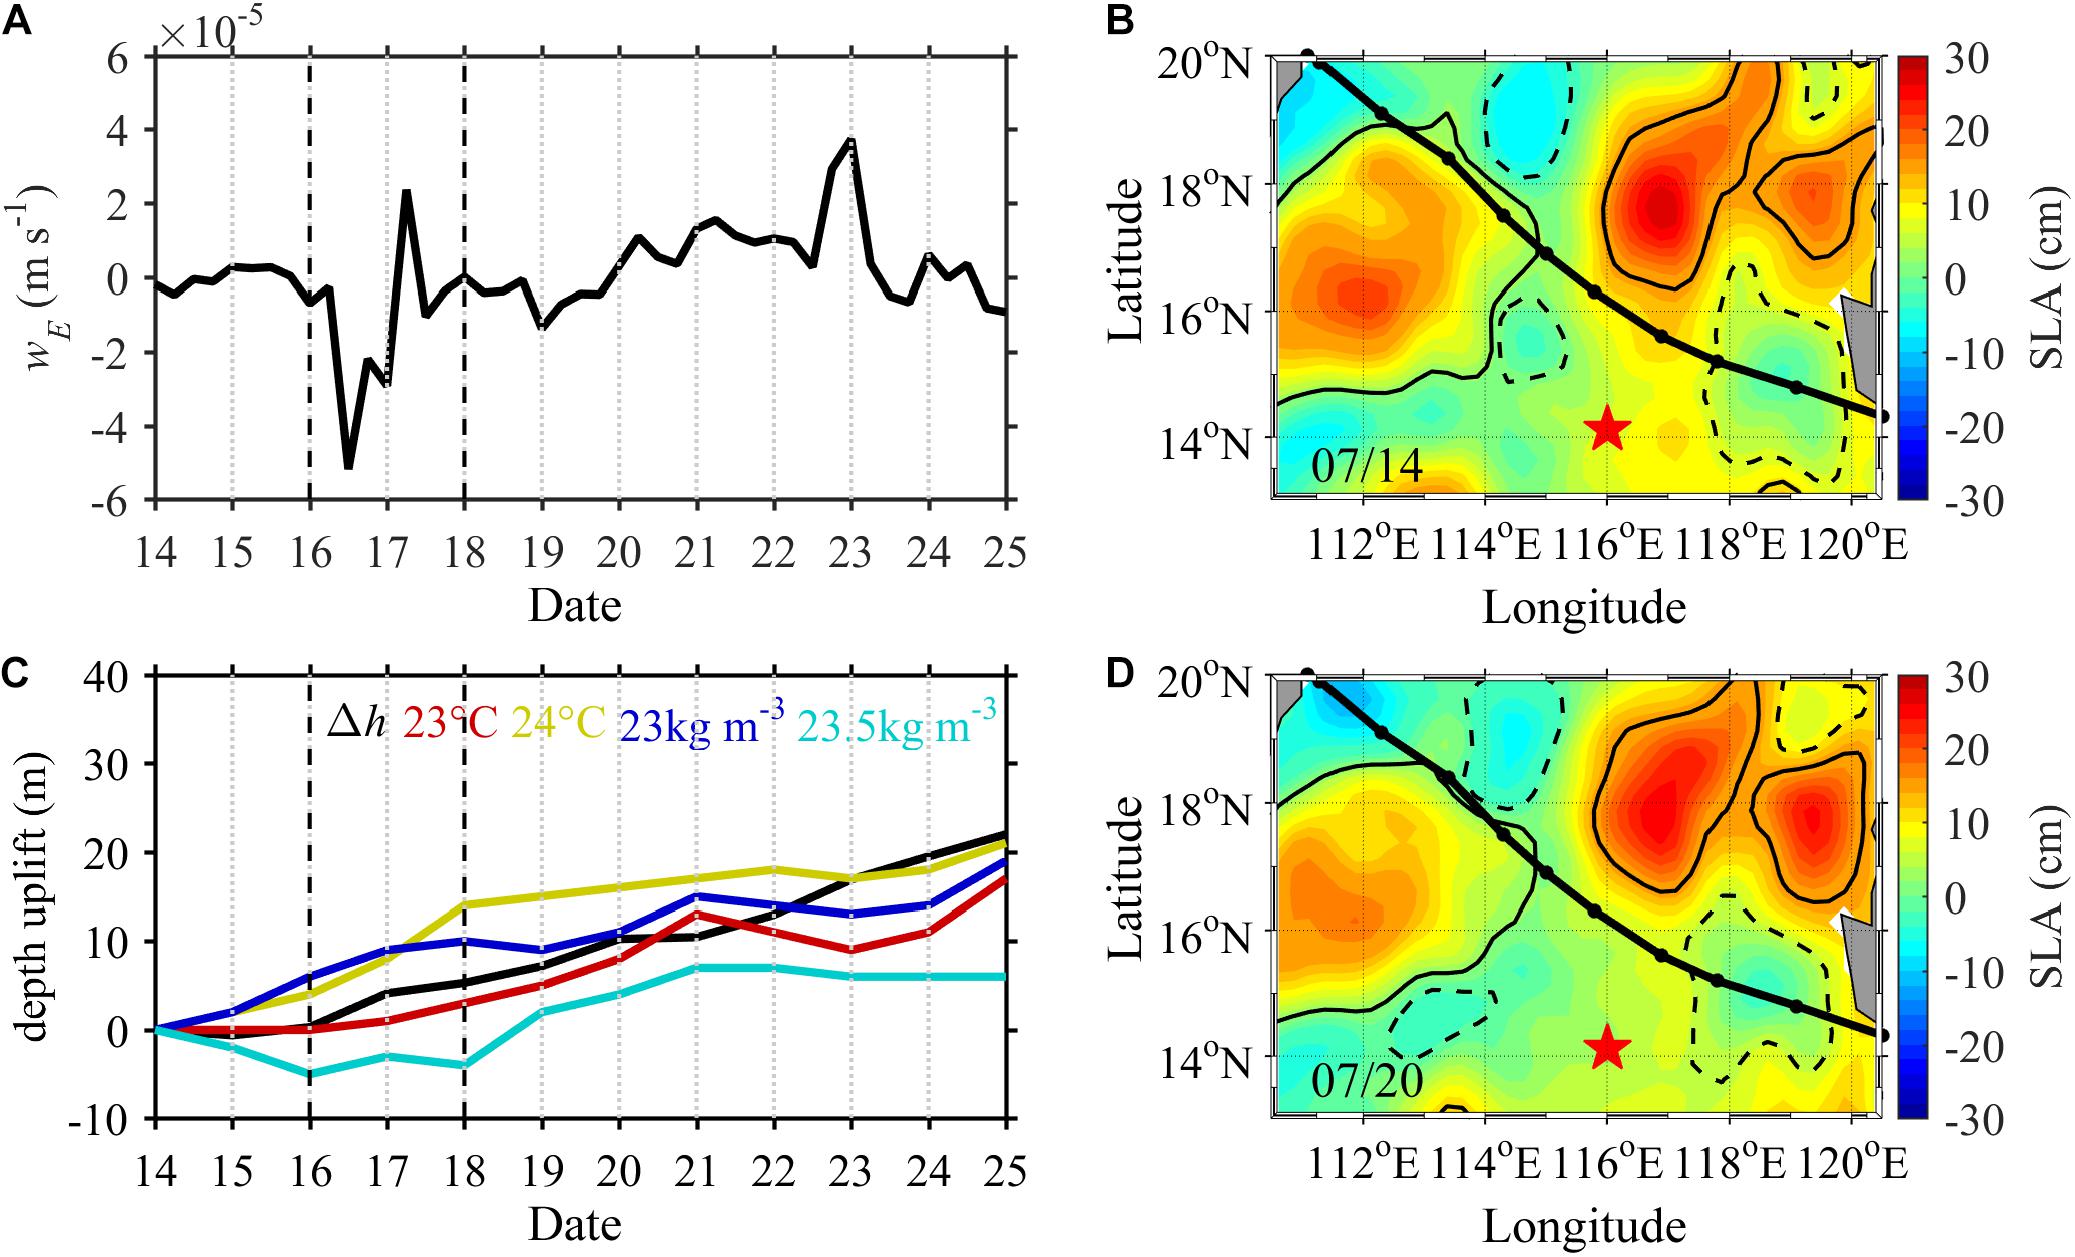
Figure 5. (A) Time series of Ekman pumping at the float location. (B,D) Daily SLA on July 14 and 20, with solid (dashed) contours for the edges of anticyclonic (cyclonic) eddies. (C) Estimated vertical displacement of the thermocline (Δh), the float-observed depth of the 23 (24) °C isotherm, and depth of isopycnic of σ0 = 23 (23.5) kg m– 3.
In stratified waters, Chla usually exhibits a bell-shaped vertical distribution, and DCM appears near the top of the nutricline where phytoplankton growth is optimal (Cullen, 2015). Before the typhoon Rammasun, a pronounced DCM of 1 mg m–3 occurred at 82 m (Figures 4G, 6A). Previous studies have shown that the nutricline in the SCS basin is deep (∼60 m) in summer (Tseng et al., 2005). To clearly show the phytoplankton redistribution, we divided the upper 150 m into three layers: upper (0–50 m), intermediate (50–100 m), and lower (100–150 m). DCM was located in the intermediate layer before the typhoon, and the depth-integrated Chla in this layer was 28 mg m–2, about 5 and 2 times higher than the values in the upper and lower layers, respectively (Figure 6B). A similar vertical distribution (Figures 4I, 6C) can be seen for bbp, the proxy for particulate organic carbon or phytoplankton biomass (Cetinić et al., 2012; Graff et al., 2015).
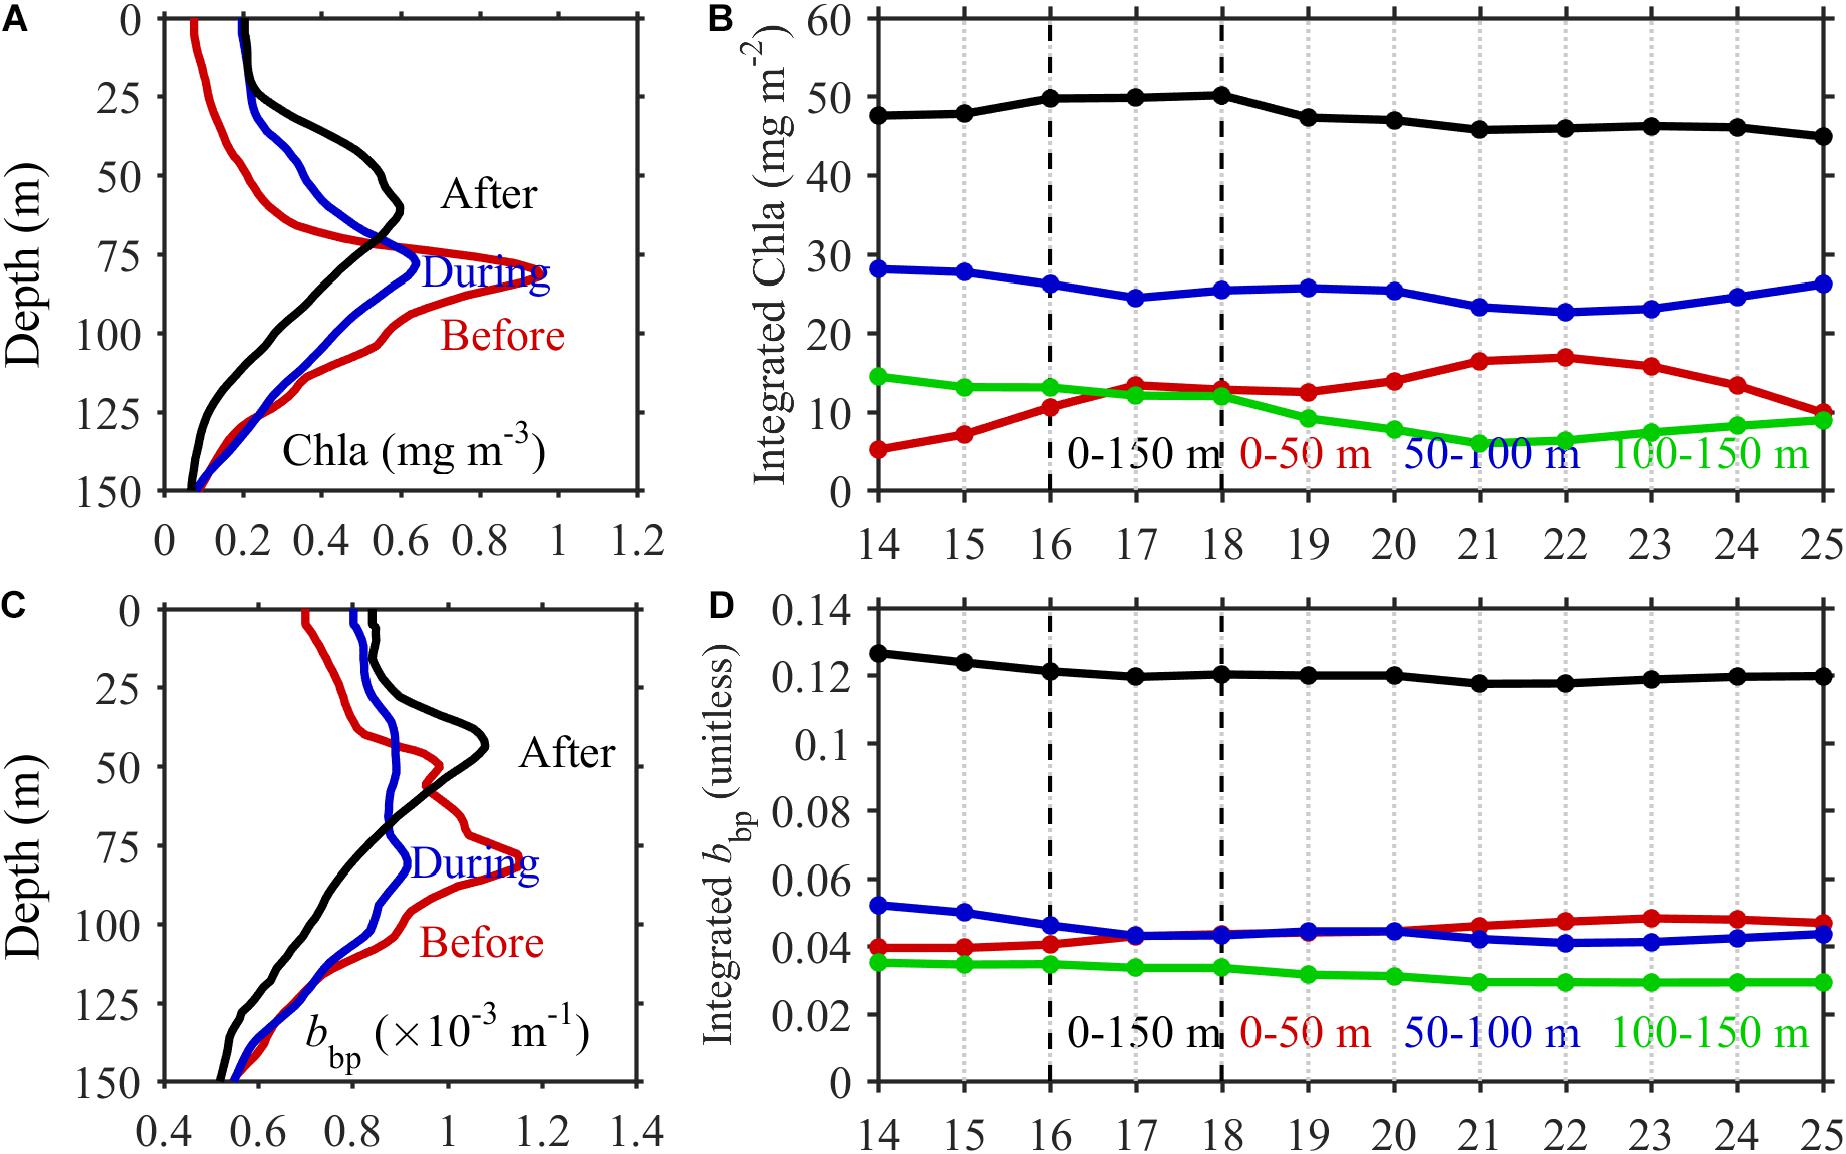
Figure 6. (A,C) Vertical distributions of the time-averaged Chla and bbp before (July 14–15), during (July 16–17), and after (July 19–23) the typhoon’s passage. (B,D) Time series of the depth-integrated Chla and bbp in the upper (0–50 m), intermediate (50–100 m), and lower layers (100–150 m), and the entire column (0–150 m), respectively.
Coinciding with the physical responses during the passage of the typhoon, the increased mixing also altered the vertical distribution of phytoplankton, and brought subsurface phytoplankton into the surface mixed layer. As a result, the surface Chla increased from 0.06 to 0.22 mg m–3 (Figure 3B). Below the MLD, Chla anomaly displayed a two-layer structure: increasing by 0.06–0.2 mg m–3 above 75 m, and decreasing by 0–0.4 mg m–3 below (Figure 4H). Depth-integrated Chla in the upper layer (0–50 m) increased from 5.2 to 13.4 mg m–2, but the depth-integrated values in the intermediate and lower layers decreased by 3.5 and 2.4 mg m–2, respectively (Figure 6B). The depth-integrated Chla in the upper 150 m increased slightly by 2.2 mg m–2, implying that biological alternations (i.e., net phytoplankton growth) was very limited and that the typhoon-induced physical processes were more significant in determining the vertical phytoplankton re-distribution and the consequent increase in surface Chla. The bbp anomaly showed a two-layer structure as well (Figures 4J, 6C). Depth-integrated bbp in the upper layer increased by 0.0034, while the depth-integrated values in the intermediate and lower layers decreased by 0.0091 and 0.0016; the total bbp within 150 m showed a slight decrease of 0.007 (Figure 6D). It should be noted that, phytoplankton can adjust their Chla:Carbon ratio in response to the changes of light, temperature, and nutrients (e.g., Laws and Bannister, 1980; Siegel et al., 2013). When the light decreases, phytoplankton can increase their Chla content to promote the photosynthesis, resulting in a higher Chla:Carbon ratio (Laws and Bannister, 1980). This effect is the so-called phytoplankton photoacclimation. During the passage of the typhoon, the surface PAR was rather low due to the heavy cloud (Figure 3A), and the photoacclimation adjustment can give rise to a higher increase extent of the upper layer Chla than that of bbp (Figures 6B,D). However, the depth-integrated Chla in the total column (0–150 m) increased negligibly, suggesting that photoacclimation process plays a minor role in the total Chla increase. The changes in Chla and bbp suggests that there was almost no net phytoplankton biomass increase in the euphotic layer during the typhoon, and that surface increases were primarily due to the vertical redistribution of particles (and thus phytoplankton) driven by typhoon-induced vertical mixing.
After the passage of the typhoon, both DCM and DBM showed continuous uplifting (Figures 4G,I), accompanied by the upward displacement of the isotherms and isopycnals (Figures 4A,E). DCM depth rose to 49 m on July 23, which was 33 m shallower than the pre-typhoon depth and was similar to the isopycnal displacement of 23 kg m–3 (Figure 4G); DBM depth showed a similar vertical displacement (Figure 4I). These shifts brought more subsurface phytoplankton into the surface mixed layer; 5 d after the typhoon, both surface Chla and bbp increased again (Figure 3B). Both the Chla and bbp vertical anomalies were positive above 75 m and negative below that depth (Figures 4H,J). Depth-integrated Chla and bbp in the upper layer increased, while those integrated values in the intermediate and lower layers decreased; However, both the depth-integrated Chla and bbp above 150 m showed an insignificant decrease of 1.5 mg m–2 and 0.009 (Figures 6B,D). Similarly, phytoplankton photoacclimation effect also contributed to the upper layer Chla increase, but the impact to the total Chla within the whole water column was negligible. These observations suggest that there was no phytoplankton bloom after the typhoon and that the surface increases in phytoplankton were mainly due to the uplift of subsurface particles.
Other studies have also recognized two stages of surface phytoplankton increase (Pan et al., 2017). Their first stage was characterized by a remarkable deepening of MLD, to the extent of exceeding DCM, entraining subsurface phytoplankton into the surface mixed layer. In our case, the float was located far away from the typhoon track, and wind speed at this location was not large enough so that the observed MLD increased weakly; however, the mechanical energy transferred into the ocean was transported into the ocean depth by near-inertial internal waves, which causes intense subsurface turbulence (Price et al., 1994). This wave-induced mixing redistributed the particles, matching an increase in surface phytoplankton along with a decrease in subsurface.
Studies have attributed the delayed increase in surface phytoplankton to biological alternations, arguing that the phytoplankton blooms lagged the nutrient supplement by 3–6 days (Walker et al., 2005; Zheng and Tang, 2007). However, we observed that the upper ocean was highly stratified before the typhoon, and the nutricline was far from MLD. It is therefore unlikely that substantial quantities of nutrients were entrained into the mixed layer from depth. Moreover, in some occasions, plentiful nutrients are horizontally transported to the offshore regions by the reinforced river discharge (Zhao et al., 2013) or jet flow (Davis and Yan, 2004). In summer, a strong coastal upwelling has often been observed off the Vietnam coast, mainly attributed to the strong wind-driven offshore Ekman transport and Ekman pumping (e.g., Tang et al., 2004b; Lu et al., 2018; Xiao et al., 2020). This upwelling water characterized with low SST, high Chla, and high nutrients, can be transported eastward by the jet flow, resulting in a surface phytoplankton bloom in the open region (e.g., Tang et al., 2004a,b; Liu and Tang, 2012; Liu et al., 2020). The bloom induced by the jet flow is usually found in the region within 400 km off the Vietnam coast (e.g., Tang et al., 2004b), and cannot extend to the BGC-Argo float location (116°E, 14°N) even in the larger summer monsoon year (e.g., Liu and Tang, 2012; Xiao et al., 2020). The satellite-observed SST showed that the Vietnam coastal upwelling water was indeed transported to the open area, but the surface cooling induced by typhoon and coastal upwelling can still be distinguished (Figure 2B). Therefore, the likelihood of horizontal advection can be excluded. Furthermore, if nutrients were supplied into the euphotic layer by vertical entrainment or horizontal advection, the total phytoplankton biomass in the water column is expected to increase. Therefore, we conclude that the second stage increase in surface phytoplankton was also due to vertical redistribution of the particles. The typhoon-induced adiabatic quasi-geostrophic adjustment can produce large scale upward displacement of the thermocline. Although the BGC-Argo float was located in a region of negative Ekman pumping, subsurface particles can be uplifted for long periods, in which case some subsurface particles would be brought into the surface mixed layer.
Therefore, the super typhoon Rammasun did not increase the total Chla and bbp in the distant region either during or after its passage, suggesting that the total phytoplankton biomass and the associated primary production were not promoted. In the far-field regions, the typhoon-induced surface Chla increase resulted from particle vertical redistribution, and was not necessarily connected with the nutrient supply. Only the surface (satellite) observations may overestimate the phytoplankton biological responses.
Our observations suggest that: (1) spatially, although the typhoon-induced upwelling (positive Ekman pumping) region was narrow and local, the response of isopycnal uplifting may occur on a much larger scale; (2) temporally, although the typhoon-induced upwelling was usually a transient process, the uplifting of the thermocline in the distant regions can last for a long period (>1 week) due to its quasi-geostrophic nature; (3) the spatial extent and duration of these physical processes support the increase in surface Chla several days after the typhoon without necessitating an increase in net phytoplankton growth; and (4) it is likely that previous studies based only on satellite data overestimated the extent of typhoon-induced phytoplankton increase and the associated carbon fixation, especially in the far-field regions, because they neglected to consider important physical processes that redistribute particles between the surface and subsurface layers.
Physical and biological responses to the super typhoon Rammasun (2014) were investigated using a BGC-Argo float located some 200 km to the left of its track. The float observations showed that there were two stages in the increase of surface phytoplankton, but the negligible change in the depth-integrated values of phytoplankton in the upper 150 m. The initial stage surface increase was attributed to the typhoon-induced diapycnal mixing, which entrained subsurface particles directly into the upper layer; the second stage increase was due to adiabatic quasi-geostrophic adjustment of the upper ocean to the typhoon forcing, which uplifted subsurface particles to the surface. In the far-field region of the typhoon influence, the surface bloom was due primarily to particle redistribution rather than biological alternations. This study provides some new insight into the physical and biological responses of the upper ocean to a typhoon. The impacts of typhoons on ocean are extremely complex, and our observations cannot represent the whole picture of the biological responses to a typhoon. In the future, more vertical profiling observations across a broad region are necessary to comprehensively quantify oceanic biological responses to a typhoon.
The original contributions presented in the study are included in the article, further inquiries can be directed to the corresponding author/s.
HW performed the observations and initiated this work. FC designed the concept. ZL contributed to the physical analysis. X-HY provided suggestions on concept design, data analysis, and manuscript writing. GQ and XX analyzed the data. GQ prepared the figures and wrote the manuscript. All authors revised the manuscript.
This work was supported by the National Key R&D Program of China (2019YFA0606702), the National Natural Science Foundation of China (41876032, 41721005, 41576100, 91858202, 41630963, and 41776003), the Scientific Research Fund of the Second Institute of Oceanography, MNR (14283), and the National Basic Research Program of China (2015CB954002).
The authors declare that the research was conducted in the absence of any commercial or financial relationships that could be construed as a potential conflict of interest.
The authors thank Huijie Xue, Zhumin Lu, Yunwei Yan, and Yi Yu for their insightful suggestions.
Babin, S. M., Carton, J. A., Dickey, T. D., and Wiggert, J. D. (2004). Satellite evidence of hurricane-induced phytoplankton blooms in an oceanic desert. J. Geophys. Res. Oceans 109:C03043. doi: 10.1029/2003jc001938
Black, W. J., and Dickey, T. D. (2008). Observations and analyses of upper ocean responses to tropical storms and hurricanes in the vicinity of Bermuda. J. Geophys. Res. Oceans 113:C08009. doi: 10.1029/2007jc004358
Cetinić, I., Perry, M. J., Briggs, N. T., Kallin, E., D’Asaro, E. A., and Lee, C. M. (2012). Particulate organic carbon and inherent optical properties during 2008 North Atlantic Bloom Experiment. J. Geophys. Res. Oceans 117:C06028. doi: 10.1029/2011jc007771
Chacko, N. (2017). Chlorophyll bloom in response to tropical cyclone Hudhud in the Bay of Bengal: Bio-Argo subsurface observations. Deep Sea Res. I 124, 66–72. doi: 10.1016/j.dsr.2017.04.010
Chai, F., Wang, Y., Xing, X., Yan, Y., Xue, H., Wells, M., et al. (2021). A limited effect of sub-tropical typhoons on phytoplankton dynamics. Biogeosciences 18, 849–859. doi: 10.5194/bg-18-849-2021
Chaigneau, A., Eldin, G., and Dewitte, B. (2009). Eddy activity in the four major upwrelling systems from satellite altimetry (1992-2007). Prog. Oceanogr. 83, 117–123. doi: 10.1016/j.pocean.2009.07.012
Chelton, D. B., and Schlax, M. G. (1996). Global observations of oceanic Rossby waves. Science 272, 234–238. doi: 10.1126/science.272.5259.234
Cullen, J. J. (2015). Subsurface chlorophyll maximum layers: enduring enigma or mystery solved? Annu. Rev. Mar. Sci. 7, 207–239. doi: 10.1146/annurev-marine-010213-135111
Davis, A., and Yan, X. H. (2004). Hurricane forcing on chlorophyll-a concentration off the northeast coast of the US. Geophys. Res. Lett. 31:L17304. doi: 10.1029/2004gl020668
Dickey, T., Frye, D., McNeil, J., Manov, D., Nelson, N., Sigurdson, D., et al. (1998). Upper-ocean temperature response to Hurricane Felix as measured by the Bermuda testbed mooring. Mon. Wea. Rev. 126, 1195–1201. doi: 10.1175/1520-04931998126<1195:uotrth<2.0.co;2
Domingues, R., Goni, G., Bringas, F., Lee, S.-K., Kim, H.-S., Halliwell, G., et al. (2015). Upper ocean response to Hurricane Gonzalo (2014): salinity effects revealed by targeted and sustained underwater glider observations. Geophys. Res. Lett. 42:2015GL065378. doi: 10.1002/2015GL065378
Geisler, J. E. (1970). Linear theory of the response of a two layer ocean to a moving hurricane. Geophys. Fluid Dyn. 1, 249–272. doi: 10.1080/03091927009365774
Gill, A. E. (1984). On the behavior of internal waves in the wakes of storms. J. Phys. Oceanogr. 14, 1129–1151. doi: 10.1175/1520-04851984014<1129:OTBOIW<2.0.CO;2
Ginis, I., and Sutyrin, G. (1995). Hurricane-generated depth-averaged currents and sea surface elevation. J. Phys. Oceanogr. 25, 1218–1242. doi: 10.1175/1520-04851995025<1218:hgdaca<2.0.co;2
Graff, J. R., Westberry, T. K., Milligan, A. J., Brown, M. B., Dall’Olmo, G., van Dongen-Vogels, V., et al. (2015). Analytical phytoplankton carbon measurements spanning diverse ecosystems. Deep Sea Res. I 102, 16–25. doi: 10.1016/j.dsr.2015.04.006
Jaimes, B., and Shay, L. K. (2009). Mixed layer cooling in mesoscale oceanic eddies during hurricanes katrina and rita. Mon. Wea. Rev. 137, 4188–4207. doi: 10.1175/2009mwr2849.1
Jaimes, B., and Shay, L. K. (2015). Enhanced wind-driven downwelling flow in warm oceanic eddy features during the intensification of tropical cyclone isaac (2012): observations and theory. J. Phys. Oceanogr. 45, 1667–1689. doi: 10.1175/jpo-d-14-0176.1
Johnson, K. S., Berelson, W. M., Boss, E., Chase, Z., Claustre, H., Emerson, S. R., et al. (2009). Observing biogeochemical cycles at global scales with profiling floats and gliders: prospects for a global array. Oceanography 22, 216–225.
Jullien, S., Menkes, C. E., Marchesiello, P., Jourdain, N. C., Lengaigne, M., Koch-Larrouy, A., et al. (2012). Impact of tropical cyclones on the heat budget of the south Pacific Ocean. J. Phys. Oceanogr. 42, 1882–1906. doi: 10.1175/jpo-d-11-0133.1
Laws, E. A., and Bannister, T. T. (1980). Nutrient- and light-limited growth of Thalassiosira fluviatilis in continuous culture with implications for phytoplankton growth in the ocean. Limnol. Oceanogr. 25, 457–473.
Levitus, S. (1982). Climatological atlas of the world ocean. Paper Presented at the National Oceanic and Atmospheric Administration, Rockville, MD.
Lin, I. I. (2012). Typhoon-induced phytoplankton blooms and primary productivity increase in the western North Pacific subtropical ocean. J. Geophys. Res. Oceans 117:C03039. doi: 10.1029/2011jc007626
Lin, I. I., Liu, W. T., Wu, C. C., Wong, G. T. F., Hu, C. M., Chen, Z. Q., et al. (2003). New evidence for enhanced ocean primary production triggered by tropical cyclone. Geophys. Res. Lett. 30:1718. doi: 10.1029/2003gl017141
Liu, C., and Tang, D. (2012). Spatial and temporal variations in algal blooms in the coastal waters of the western South China Sea. J. Hydro. Environ. Res. 6, 239–247. doi: 10.1016/j.jher.2012.02.002
Liu, L. L., Wang, W., and Huang, R. X. (2008). The mechanical energy input to the ocean induced by tropical cyclones. J. Phys. Oceanogr. 38, 1253–1266. doi: 10.1175/2007jpo3786.1
Liu, Q., Jia, Y., Liu, P., Wang, Q., and Chu, P. C. (2001). Seasonal and intraseasonal thermocline variability in the central south China Sea. Geophys. Res. Lett. 28, 4467–4470. doi: 10.1029/2001GL013185
Liu, S., Li, J., Sun, L., Wang, G., Tang, D., Huang, P., et al. (2020). Basin-wide responses of the South China Sea environment to super typhoon Mangkhut (2018). Sci. Total Environ. 731:139093. doi: 10.1016/j.scitotenv.2020.139093
Lu, W. F., Oey, L. Y., Liao, E. H., Zhuang, W., Yan, X. H., and Jiang, Y. W. (2018). Physical modulation to the biological productivity in the summer Vietnam upwelling system. Ocean Sci. 14, 1303–1320. doi: 10.5194/os-14-1303-2018
McDougall, T. J., and Barker, P. M. (2011). Getting started with TEOS-10 and the Gibbs Seawater (GSW) oceanographic toolbox. London SCOR IAPSO WG 127, 1–28.
Ning, X., Chai, F., Xue, H., Cai, Y., Liu, C., and Shi, J. (2004). Physical-biological oceanographic coupling influencing phytoplankton and primary production in the South China Sea. J. Geophys. Res. Oceans 109:C10005. doi: 10.1029/2004jc002365
Pan, S. S., Shi, J., Gao, H. W., Guo, X. Y., Yao, X. H., and Gong, X. (2017). Contributions of physical and biogeochemical processes to phytoplankton biomass enhancement in the surface and subsurface layers during the passage of Typhoon Damrey. J. Geophys. Res. Biogeosci. 122, 212–229. doi: 10.1002/2016jg003331
Price, J. F. (1981). Upper Ocean response to a hurricane. J. Phys. Oceanogr. 11, 153–175. doi: 10.1175/1520-04851981011<0153:uortah<2.0.co;2
Price, J. F., Sanford, T. B., and Forristall, G. Z. (1994). Forced stage response to a moving hurricane. J. Phys. Oceanogr. 24, 233–260. doi: 10.1175/1520-04851994024<0233:fsrtam<2.0.co;2
Qu, T., Du, Y., Gan, J., and Wang, D. (2007). Mean seasonal cycle of isothermal depth in the South China Sea. J. Geophys. Res. Oceans 112:C02020. doi: 10.1029/2006JC003583
Sanford, T. B., Price, J. F., and Girton, J. B. (2011). Upper-ocean response to hurricane frances (2004) observed by profiling EM-APEX floats. J. Phys. Oceanogr. 41, 1041–1056. doi: 10.1175/2010jpo4313.1
Shang, S. L., Li, L., Sun, F. Q., Wu, J. Y., Hu, C. M., Chen, D. W., et al. (2008). Changes of temperature and bio-optical properties in the South China Sea in response to Typhoon Lingling, 2001. Geophys. Res. Lett. 35:L10602. doi: 10.1029/2008gl033502
Shay, L. K., Goni, G. J., and Black, P. G. (2000). Effects of a warm oceanic feature on Hurricane Opal. Mon. Wea. Rev. 128, 1366–1383. doi: 10.1175/1520-04932000128<1366:eoawof<2.0.co;2
Siegel, D. A., Behrenfeld, M. J., Maritorena, S., McClain, C. R., Antoine, D., Bailey, S. W., et al. (2013). Regional to global assessments of phytoplankton dynamics from the SeaWiFS mission. Remote Sens. Environ. 135, 77–91. doi: 10.1016/j.rse.2013.03.025
Stramma, L., Cornillon, P., and Price, J. F. (1986). Satellite observations of sea surface cooling by hurricanes. J. Geophys. Res. Oceans 91, 5031–5035. doi: 10.1029/JC091iC04p05031
Tang, D. L., Kawamura, H., Doan-Nhu, H., and Takahashi, W. (2004a). Remote sensing oceanography of a harmful algal bloom off the coast of southeastern Vietnam. J. Geophys. Res. Oceans 109:2045. doi: 10.1029/2003JC002045
Tang, D. L., Kawamura, H., Van Dien, T., and Lee, M. (2004b). Offshore phytoplankton biomass increase and its oceanographic causes in the South China Sea. Mar. Ecol. Prog. Ser. 268, 31–41. doi: 10.3354/meps268031
Tseng, C.-M., Wong, G. T. F., Lin, I. I., Wu, C. R., and Liu, K. K. (2005). A unique seasonal pattern in phytoplankton biomass in low-latitude waters in the South China Sea. Geophys. Res. Lett. 32:L08608. doi: 10.1029/2004gl022111
Walker, N. D., Leben, R. R., and Balasubramanian, S. (2005). Hurricane-forced upwelling and chlorophyll a enhancement within cold-core cyclones in the Gulf of Mexico. Geophys. Res. Lett. 32:L18610. doi: 10.1029/2005gl023716
Xiao, F., Wu, Z. F., Lyu, Y. S., and Zhang, Y. C. (2020). Abnormal strong upwelling off the coast of southeast vietnam in the late summer of 2016: a comparison with the case in 1998. Atmosphere 11:940. doi: 10.3390/atmos11090940
Zhao, H., Han, G., Zhang, S., and Wang, D. (2013). Two phytoplankton blooms near Luzon Strait generated by lingering Typhoon Parma. J. Geophys. Res. Biogeosci. 118, 412–421. doi: 10.1002/jgrg.20041
Keywords: particle redistribution, typhoon, phytoplankton dynamics, far-field impacts, diapycnal mixing, adiabatic quasi-geostrophic adjustment
Citation: Qiu G, Xing X, Chai F, Yan X-H, Liu Z and Wang H (2021) Far-Field Impacts of a Super Typhoon on Upper Ocean Phytoplankton Dynamics. Front. Mar. Sci. 8:643608. doi: 10.3389/fmars.2021.643608
Received: 18 December 2020; Accepted: 22 March 2021;
Published: 13 April 2021.
Edited by:
Laura Lorenzoni, National Aeronautics and Space Administration (NASA), United StatesReviewed by:
Oscar Schofield, Rutgers, The State University of New Jersey, United StatesCopyright © 2021 Qiu, Xing, Chai, Yan, Liu and Wang. This is an open-access article distributed under the terms of the Creative Commons Attribution License (CC BY). The use, distribution or reproduction in other forums is permitted, provided the original author(s) and the copyright owner(s) are credited and that the original publication in this journal is cited, in accordance with accepted academic practice. No use, distribution or reproduction is permitted which does not comply with these terms.
*Correspondence: Haili Wang, aHdhbmdAeG11LmVkdS5jbg==
†These authors have contributed equally to this work
Disclaimer: All claims expressed in this article are solely those of the authors and do not necessarily represent those of their affiliated organizations, or those of the publisher, the editors and the reviewers. Any product that may be evaluated in this article or claim that may be made by its manufacturer is not guaranteed or endorsed by the publisher.
Research integrity at Frontiers
Learn more about the work of our research integrity team to safeguard the quality of each article we publish.