
95% of researchers rate our articles as excellent or good
Learn more about the work of our research integrity team to safeguard the quality of each article we publish.
Find out more
BRIEF RESEARCH REPORT article
Front. Mar. Sci. , 14 May 2021
Sec. Marine Fisheries, Aquaculture and Living Resources
Volume 8 - 2021 | https://doi.org/10.3389/fmars.2021.643318
This article is part of the Research Topic The Approach to Complex Systems in Fisheries View all 9 articles
 Edgar Torres-Irineo1*
 Silvia Salas2Jorge Iván Euán-Ávila2
 Leopoldo E. Palomo3
 Daniel R. Quijano Quiñones4
 Eva Coronado2Rocío Joo5,6
In most small-scale fisheries (SSF), there is limited or null information about the distribution and spatial extent of the fishing grounds where the fleets operate, due to the lack of explicit spatial and temporal data. This information is key when addressing marine spatial planning and fisheries management programs for SSF. In addition to technical or biogeographic restrictions, environmental conditions in the area influence the way fishers operate. Making use of data from a pilot Vessel Monitoring System (VMS) project tested in a small-scale fleet in the Southeastern Gulf of Mexico (SGoM), for the first time in the region, we were able to learn what role environmental factors play in the distribution of potential fishing grounds for this fleet. We got tracking information of 1,608 daily fishing trips from vessels operating in four states using the VMS for 7 months. We used a correlative modeling approach to identify potential fishing grounds where this fleet operates along the SGoM, accounting for environmental variables. We assumed that environmental conditions can shape the spatial distribution of species targeted by this fleet and hence influence fishers’ operations. The results indicated that net primary production and sea surface temperature were the main drivers that shape the spatio-temporal potential distribution of fishing grounds in the study site. The approach employed here seems appropriated and opens an opportunity to learn more about the factors that define the spatial distribution of small-scale fleets and their potential fishing grounds.
The continuous increase of fishing pressure on marine resources is a worldwide concern for fisheries managers because it threatens the sustainability of fisheries and the ecosystems supporting them, potentially impacting the people that depend on this activity (Coulthard et al., 2011; Watson et al., 2013). Coastal planning faces growing challenges from sectors competing for space on land and at sea (Campbell et al., 2014). Marine spatial planning needs to take into account the spatial extent of fishing activity (Stelzenmüller et al., 2008). However, fisheries are not fully integrated into marine spatial plans (Janßen et al., 2018). For fisheries’ spatial management planning, the identification of fishing grounds has been recognized as an important feature, both spatially and temporally, to be incorporated into the design and implementation of regulatory measures (Daw, 2008; McCluskey and Lewison, 2008). Understanding spatial distribution of fishing vessels and the factors that determine this distribution, can facilitate identification of current and potential fishing grounds, so this knowledge can inform coastal planning that accounts for multiple users of spatial regions (fisheries, energy, and conservation; see McCluskey and Lewison, 2008; Campbell et al., 2014; Maina et al., 2016, 2018).
Spatial distribution of fishing activities has been mainly assessed for industrial fisheries at large spatial scales when the data is available (e.g., Torres-Irineo et al., 2014). However, for small-scale fisheries (SSF) which spread along a wide range of landing sites, it has been difficult obtaining this type of information, thus hindering the implementation of spatial management, but also exposing these fisheries of being excluded from new programs or plans (Daw, 2008; James et al., 2018). The acquisition of spatio-temporal data to determine fishing grounds in SSF has been challenging due to (1) a lack of systematic data collection and limitations in sampling programs; (2) the wide range of landing sites from dispersed fishing communities; (3) the unreliability of some official records on catch and fleet size; (4) the lack of remote tracking devices for this fleet (Metcalfe et al., 2017; Chuenpagdee et al., 2019). These factors limit the implementation of management programs, and this condition gets aggravated by the malleability of these fleets, allowing fishers to search for alternative target species or to exploit new fishing grounds when catches decline, making it difficult to track changes in the spatial extent and distribution of the fleet (McCluskey and Lewison, 2008; Gonzalez-Mon et al., 2021).
Vessel Monitoring Systems (VMS) have been introduced to support fishing authorities with enforcement and surveillance (Lee et al., 2010), mainly on industrial and semi-industrial fleets. The introduction of these systems has allowed access to high-resolution data that helps to understand the dynamics of fishing activities and the spatial distribution of the vessels among alternative fishing grounds (Jennings and Lee, 2012; Katara and Silva, 2017). This information can also offer an invaluable opportunity to learn more about the spatial distribution of small-scale fleets. Because VMS data mirror the vessels’ geographical position, as well as speed and course, some methods have been developed to identify the vessels’ activity, i.e., fishing, searching, or transit (e.g., Joo et al., 2013; Behivoke et al., 2021). In some cases, spatial effort distribution has been used to indirectly reflect the spatial dispersion of target species (Bertrand et al., 2008). Furthermore, the use of the Automatic Identification System (AIS) has been implemented to monitor fishing effort allocation (e.g., Natale et al., 2015). However, VMS and AIS monitoring systems have been implemented in industrial fleets, and in limited cases in SSF in developed countries (James et al., 2018). More recently, some interactive platforms that combine tracking data and catch data have been developed to support fishers and managers decisions (e.g., D’Andrea et al., 2020; Tilley et al., 2020). Unfortunately, some regions lack logistic or technical capabilities to monitor small-scale fleets over a wide range of fishing areas to obtain explicit spatial data (catch and effort).
In this line, the use of correlative models in combination with information about fishing operations derived from tracking data and environmental information offer a window to assess potential distribution of species and the vessels targeting them (D’Andrea et al., 2020).
The assumption here is, from an ecological perspective, that fishers generally operate under uncertainty to locate the target species, and as natural predators do (Bertrand et al., 2007), their spatial behavior depends on identifying where the target species are, which in turn can be constrained by environmental conditions (Joo et al., 2014). Therefore, potential fishing grounds can be inferred through the identification of environmental suitable conditions that ensure location of targets. Variables such as sea surface temperature, chlorophyll-a, net primary production, oxycline depth, and bathymetry, have been considered to determine suitable areas for fishing in different areas (e.g., Joo et al., 2014; Lezama-Ochoa et al., 2016; Lan et al., 2017; Damasio et al., 2020).
In the Southeastern Gulf of Mexico (SGoM: Tabasco, Campeche, Yucatan, and Quintana Roo states), small-scale vessels (8 and 12 m long) represent 90% of the fishing fleet (Fernández et al., 2011) where close to 46,000 people benefit directly from jobs and food. Approximately 70% of the total catch comes from the small-scale fleet, which targets a high diversity of valuable species (Coronado et al., 2020). In the region, more than 50 species are caught but the main species targeted, which vary in proportion through the fishing season, include Caribbean lobster (Panulirus argus), Mayan octopus (Octopus maya), red grouper (Epinephelus morio), red snapper (Lutjanus campechanus), sea cucumber (Isostichopus badionotus), Atlantic seabob (Xiphopenaeus kroyeri), pink shrimp (Farfantepenaeus duorarum), blue runner (Caranx crysos), common snook (Centropomus undecimalis), and Atlantic sharpnose shark (Rhizoprionodon terranovae) (DOF, 2018).
Fisheries policies and regulations for SSF are established within fisheries management schemes and are applied homogeneously in the region over the most important resources (Coronado et al., 2020). These regulations include both input controls (e.g., fishing licenses, seasonal closures, fishing concessions, control of fishing gears) and output controls (e.g., quotas, minimum legal size). Up to this point, there has been no spatial management scheme for SSF in SGoM. For instance, in Tabasco and Campeche, where several oil platforms operate, fishing is forbidden. Also, some marine protected areas were established along the coast to protect mangroves and the resources of the coastal lagoons, but no consideration about the impact on fishing operations of SSF that take place nearby or around them was made. Currently, the management schemes in place, disregard the spatio-temporal distribution of the small-scale fleet, mainly because of the limitations to monitoring such many sites where it lands.
In 2010 a pilot VMS for small-scale fleets in SGoM was developed and tested with 191 vessels in four states. This pilot system facilitated learning about the extent of the spatial distribution of small-scale vessels in the region, which was unknown before. However, as stated earlier, even if VMS can be useful to get georeferenced information regarding fishing grounds and their characteristics (Joo et al., 2014), this does not tell the whole story, as these data do not necessarily inform about all vessels’ activities at sea. In this study, we aimed to identify fishing grounds where fishers can potentially operate to target their species. Assuming that fishers will respond to changes in resource availability, and that resources will be available where habitats are suitable given environmental conditions (Bastardie and Brown, 2021; Marco et al., 2021). Hence the data coming from VMS in combination with environmental information could generate knowledge about potential fishing grounds in fishing communities where this system was not tested or implemented.
In the SGoM region, there are more than 25 coastal communities where SSF operate over a mix of resources, and alternating among target species throughout the year, depending on species availability, regulations, and market demand (Coronado et al., 2020). Small-scale vessels usually perform daily fishing trips (∼9 h/trip). It is common to use GPS to register suitable fishing grounds, and later, fishers return to these locations if they get good catches. Furthermore, fishers adapt their fishing operations in accordance with previous knowledge about the seasonal availability of target species and their local conditions. For instance, the small-scale vessels from Campeche and Yucatan operate in shallow waters (up to ∼30 m depth) near to the coastline (∼40 km). In Tabasco, the vessels perform their fishing trips close to their base port or can move offshore, near to the continental slope (∼200 m), but within a similar distance from coastline than those of Yucatan, given the biogeographic characteristics of the area and the constrains defined by the oil operators. In Quintana Roo, vessels operate near to the coast (∼10 km) because the continental shelf is narrow.
In the SGoM, there are two upwellings (uplift of nutrient-rich and cold waters), one in the north and northeast of the Yucatan shelf (Merino, 1997) and the other has been reported along within the Tabasco and Campeche states (Zavala-Hidalgo et al., 2006). Both upwellings are present throughout the year, but the former is stronger from late spring to autumn, and the latter intensifies from May to September. Nutrients and organic matter are exported into Campeche Bank (toward Campeche and Tabasco) by a westward wind-driven circulation (Zavala-Hidalgo et al., 2006; Estrada-Allis et al., 2020). Furthermore, during autumn-winter, sea surface temperature (SST) depicts cold temperatures (around 23.5–26°C) (Varela et al., 2018).
The VMS data were collected from vessels departing from 12 coastal communities located in the states of Tabasco, Campeche, Yucatán, and Quintana Roo in the SGoM (Figure 1). The pilot monitoring system operated between November 2012 and June 2013. A total of 191 vessels participated in the test and 1,608 fishing trips were recorded. Each vessel position was recorded every 30 min from the start to the end of the journey. Fishers’ participation within de pilot VMS derived from informative workshops about this project carried out with fishing cooperatives, then, VMS devices were installed on their vessels with their approval. In addition, onboard observers recorded GPS tracks of 14 fishing trips, and registered information associated with the fishing activity along each fishing trip (i.e., fishing or transit).

Figure 1. Fishing communities in Southeastern Gulf of Mexico where the study was undertaken. Orange dots represent the geographical coordinates acquired from the pilot vessel monitoring system.
Environmental variables measures paired with the records of the VMS were not available; thus we used indirect sources, such as SST from MODIS Aqua satellite images (cell size of 4 km)1, net primary production (NPP) from the Oregon State Ocean Productivity standard products (cell size of 9 km)2. We acquired information on NPP and SST on monthly basis from 2010 to 2014 to cover a period that accounted for the implementation of the pilot VMS (i.e., environmental data before, during, and after implementation). In addition, we used bathymetry (BAT) derived from the General Bathymetric Chart of the Oceans (GEBCO, cell size of 1 km)3. Furthermore, we estimated a distance grid (DIS) from the coastline to each cell based on the bathymetry layer. We assumed that SST and NPP were associated with the species availability in the fishing grounds visited by fishers (Lezama-Ochoa et al., 2016). Furthermore, we used BAT and DIS to consider the observed spatial distribution of small-scale vessels. The average monthly layers of NPP and SST are depicted in Supplementary Figures 1, 2, respectively.
Pilot VMS did not provide information about vessels’ activities at sea, therefore, in order to distinguish fishing activities from those associated to vessel transit, we used onboard observers’ data to compute at each vessel position: speed, heading, changes of speed, and turning angles between the previous and the current position, and between the current and the next position; we also took into account the time of day when fishers performed their fishing activities.
For the behavioral states’ classification (i.e., fishing or transit) within recorded trajectories, we performed random forest models that have been shown to work well to comply with this procedure (Joo et al., 2013; Behivoke et al., 2021). Random forest (RF; Breiman, 2001) is a supervised machine learning model with a flexible structure that learns a classification rule to predict a class (e.g., fishing/transit) from observed variables (e.g., speed, heading, time). A random forest comprises a set of N decision trees, where each tree discriminates patterns recursively in a tree-like structure. Then, m variables (e.g., speed, heading, time of day) are randomly selected among the subset of observed variables at each tree node. In order to minimize the within-group variance and maximize the between-group variance, data are split following thresholds of those m variables. The output of each tree corresponds to its classification in a given activity (i.e., fishing or transit). Therefore, the result of the random forest is the statistical mode of the classification outputs from N trees.
The RF model used 927 transit positions and 4,102 fishing positions from onboard observers’ data to train and test the algorithm. We randomly selected half of the trips to train the model, and the other half was used as an independent dataset to assess its performance. This procedure of random partitioning of the data for training and validation of the model, was repeated 100 times. The performance was assessed with the specificity and sensitivity indicators. The former indicates the proportion of observed fishing activities that were well classified; the latter indicates the proportion of observed transit activities that were well classified. This analysis was performed with the R package randomForest (Liaw and Wiener, 2002). We used the RF fitted to classify geographical coordinates from the VMS into fishing and transit activities.
For the determination of potential fishing grounds, we performed correlative models in the BIOMOD platform (Thuiller et al., 2009) implemented in the R statistical software (R Core Team, 2020). BIOMOD intends to model species distribution by examining species-environment relationships through correlative models. Adapting to the fleet distribution, given the assumptions referred to earlier, we used Generalized Linear/Additive/Boosting Models (GLM, GAM, GBM, respectively), Classification Tree Analysis (CTA), Artificial Neural Network (ANN), Surface Range Envelope (SRE), Flexible Discriminant Analysis (FDA), Multiple Adaptive Regression Splines (MARS), and RF. These single-models, need presence/absence data, thus, we assumed that fishing records can be considered as presences (expected to be suitable for fishing), and transit records as absences (expected to be unsuitable for fishing). Therefore, instead of estimating the potential species distribution, we estimate the potential vessels’ distribution (i.e., fishing grounds) characterized by suitable environmental conditions. A key feature of BIOMOD is that it can generate ensemble models which can ameliorate the prediction of distribution models (Araujo and New, 2007). The nine single-models were run 100 times (i.e., 900 models were built), for each run BIOMOD split the dataset to train (70%) and test (30%) the models. This sort of cross-validation allows having a quite robust test of the models when independent data are not available (Thuiller et al., 2009).
We resized SST and NPP layers to cells of 1 km2 based on BAT layer and we restricted depths to above 250 m. Then, the variables’ values were extracted from the raster layers’ cells corresponding to the geographic coordinates of the VMS. Regarding SST and NPP, we extracted their values on monthly basis according to the VMS records’ dates, e.g., from SST and NPP raster layers for November 2012, we extracted their values only for the VMS geographical coordinates for the same month. This procedure was carried out with the extract function from the raster R package (Hijmans et al., 2020). Consequently, the input data set to build the correlative models consisted of fishing/transit activities (derived from the classification procedure above) and their corresponding environmental variables’ values.
The ensemble models use a combination of the single-models, choosing those with the model performance evaluation of a metric threshold. This metric was the True Skill Statistic (TSS; Allouche et al., 2006); it is defined as sensitivity + specificity −1. Additionally, it is not dependent on prevalence and is not affected by the size of the validation dataset (below 50 sample points), that can affect model accuracy. TSS ranges from −1 to +1, where +1 points to perfect agreement (Allouche et al., 2006). We used TSS to assess the performance of both single-models and ensemble models. In addition to TSS, we assessed the performance of ensemble models with sensitivity and specificity indicators. The sensitivity indicates the probability that the model correctly predicted presences (i.e., suitable fishing grounds), while specificity indicates the probability that the model accurately predicted the absences (i.e., unsuitable fishing grounds).
Finally, we carried out by averaging monthly values of NPP (Supplementary Figure 1), SST (Supplementary Figure 2), and layers of BAT and DIS to predict the spatial distribution of the fishing activities (i.e., fishing grounds). These predictions were mapped to forecast potential fishing grounds given environmental characteristics. Raster layers and predictions were analyzed with the R package raster.
From the RF results, both types of activities (transit and fishing; see Supplementary Figure 3) were well identified by the model. The fishing positions seem to be the easiest activity to identify and showed a specificity indicator of 0.95 (±0.004 SE), while for transit positions, the sensitivity was 0.72 (±0.006 SE).
From the 100 runs for each single-model, high TSS values were observed with RF (average of 0.6 ± 0.0009 SE) (Figure 2). The TSS metric threshold for single-models was 0.6. Thus, we used 47 RF models to build the ensemble models, where the Median ensemble model showed the best performance (TSS = 0.801); this model corresponds to the median probability over the selected single-models. Sensitivity and specificity indicators were 0.931 and 0.9, respectively, which means that the Median ensemble model performed well to correctly classify both: presences (i.e., suitable fishing grounds) and absences (i.e., unsuitable fishing grounds).
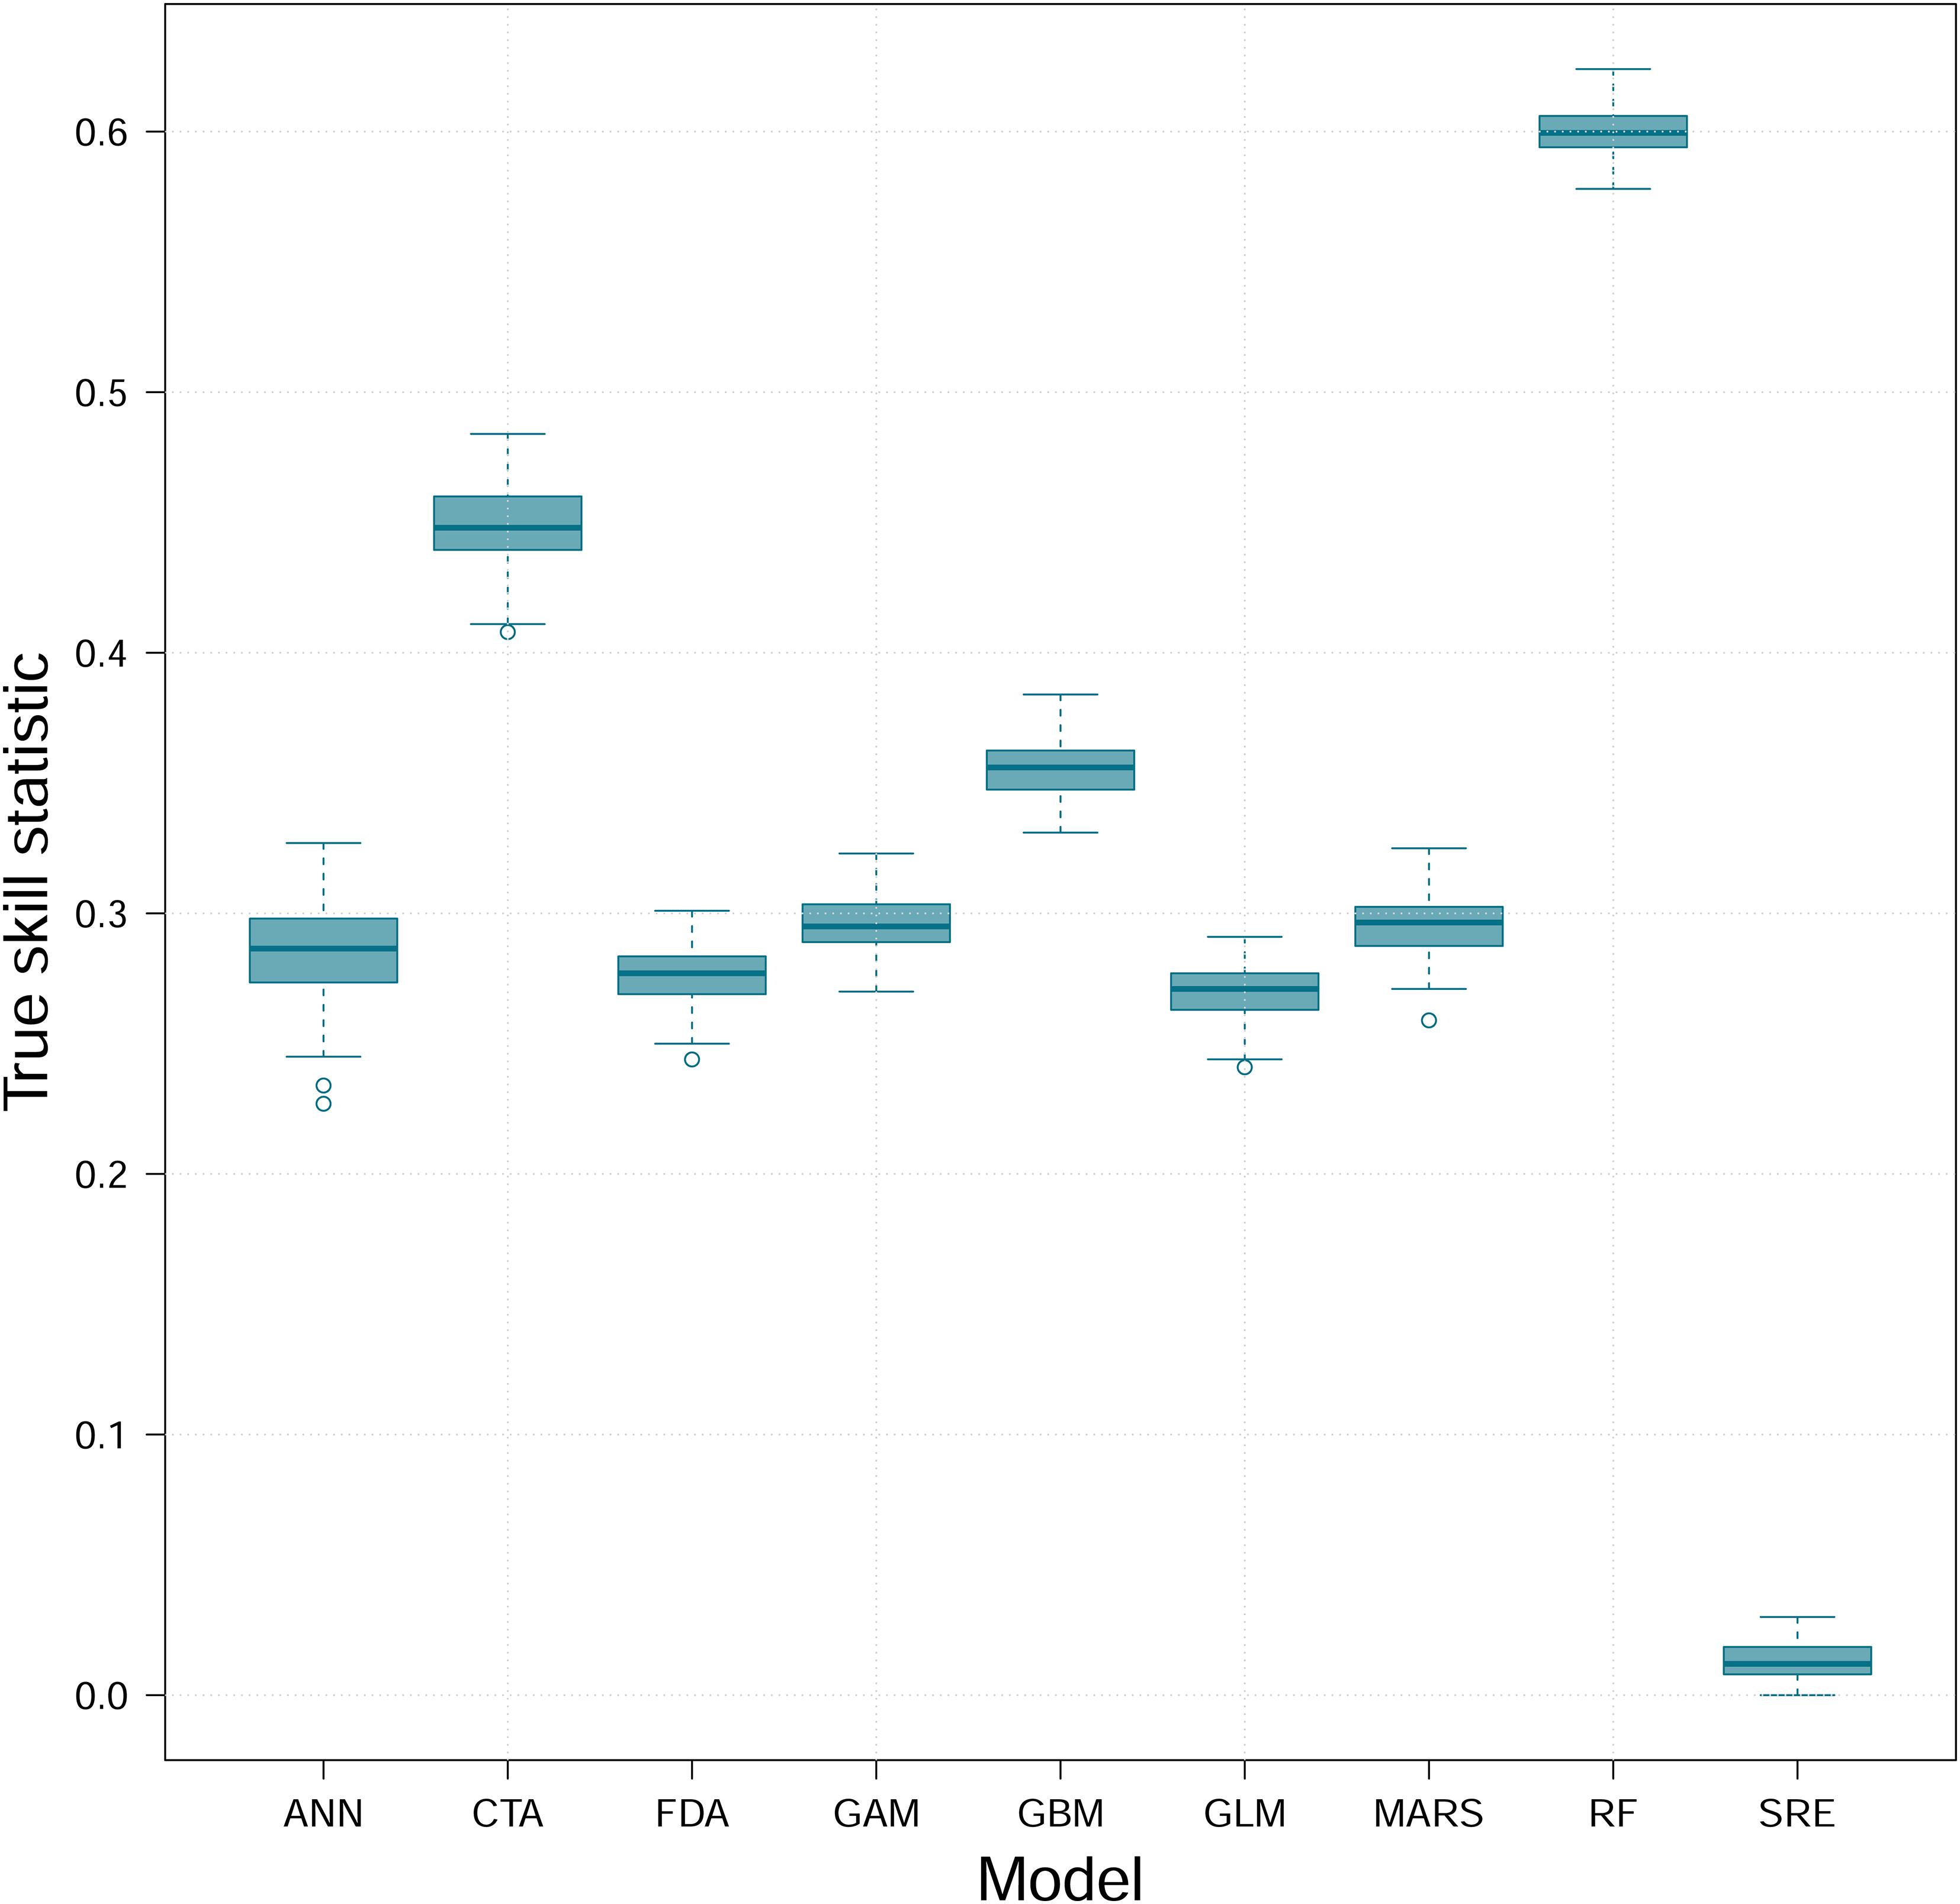
Figure 2. Boxplot of the true skill statistic values from 9 single-models run 100 times each. ANN, Artificial Neural Network; CTA, Classification Tree Analysis; FDA, Flexible Discriminant Analysis; GAM, Generalized Additive Model; GBM, Generalized Boosting Model; GLM, Generalized Linear Model; MARS, Multiple Adaptive Regression Splines; RF, Random forest; SRE, Surface Range Envelope.
The highest variable importance values were with NPP (0.53) and SST (0.518), followed by DIS (0.483), and BAT (0.206). Contribution of NPP to the probability of occurrence of fishing occurs below 1,000 mgC.m–2.day–1 (Figure 3A). The range of SST values that contributes the most to the probability of occurrence of fishing in the ensemble model was between 24.5 and 26°C (Figure 3B). DIS values between 20 and 65 km contribute the most to the probability of occurrence of fishing for small-scale fleet (Figure 3C). BAT values from 20 m up to 100 m increase the probability of occurrence of fishing of this fleet (Figure 3D).
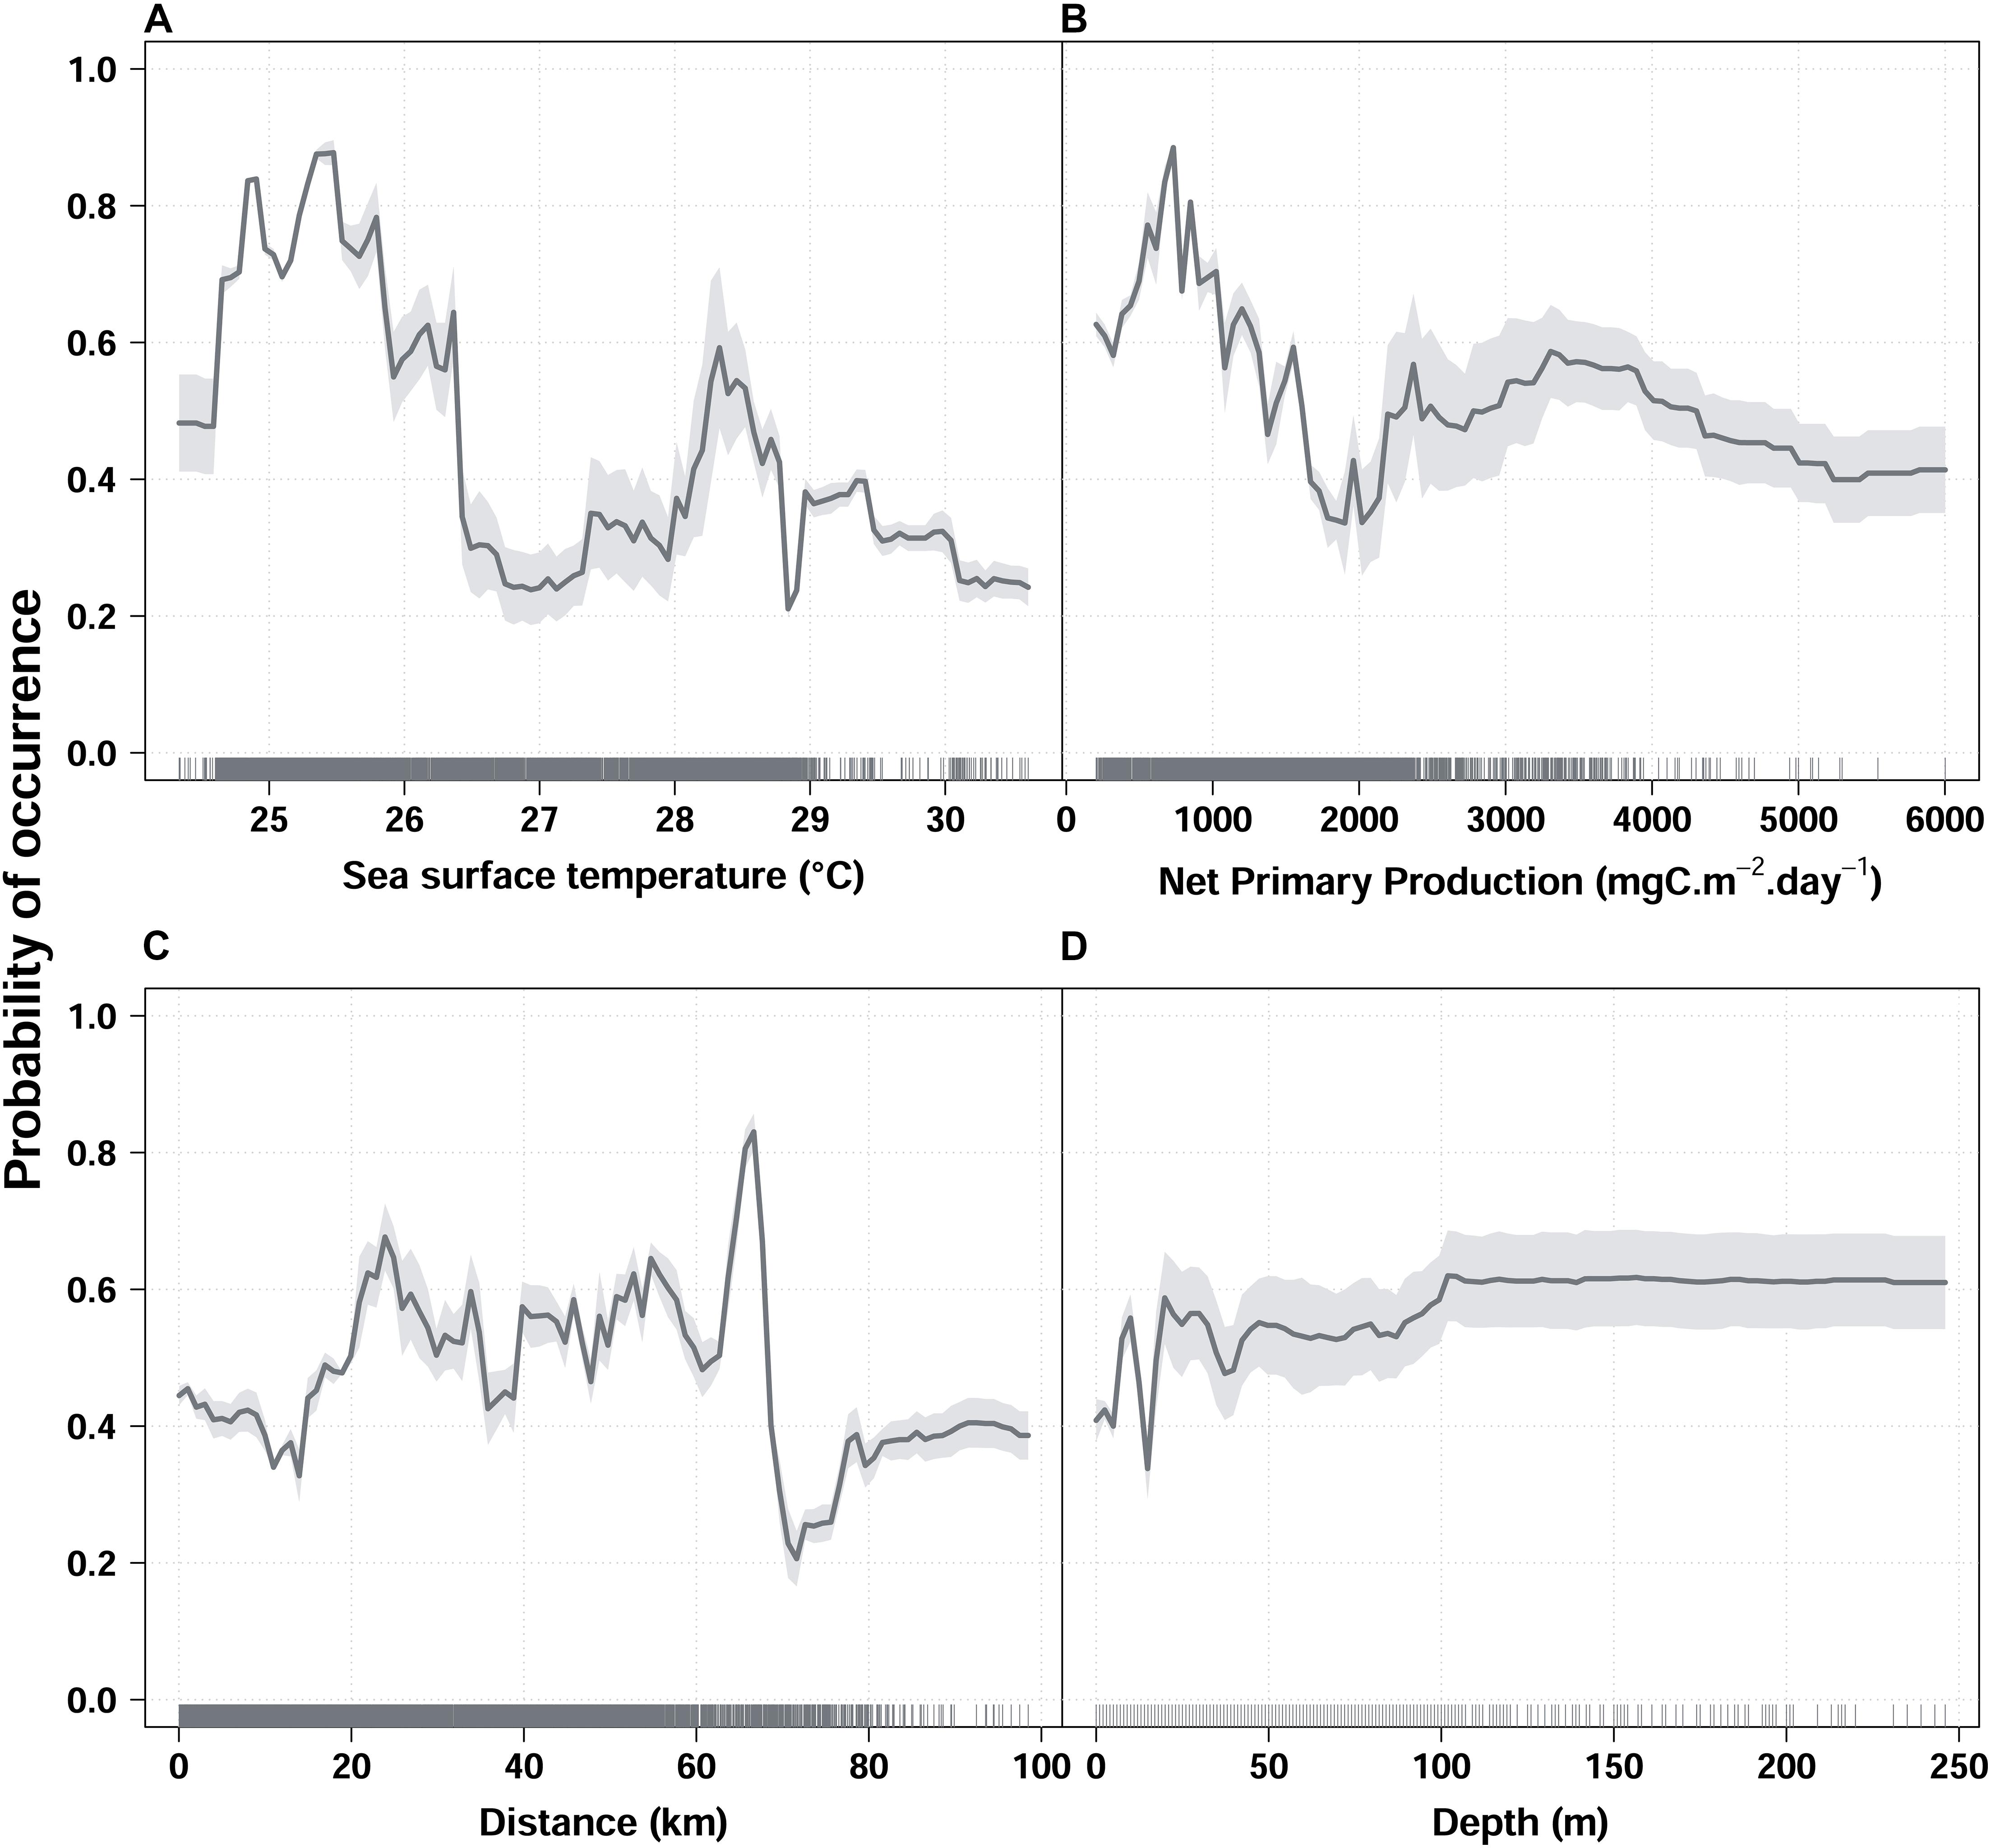
Figure 3. Predicted response curves of SST (A), NPP (B), DIS (C), and BAT (D) covariates. Each figure represents the expected contribution to the probability of occurrence of fishing activities while the other covariates were set constant to their mean value.
We were able to predict the potential fishing grounds monthly, derived from the ensemble median model. Overall, along the coast of the SGoM, we found high probabilities to perform fishing operations, i.e., fishing grounds (from Tabasco to Quintana Roo) (Figure 4). The northeastern region of Yucatán Peninsula showed suitable areas for fishing (high probability values of occurrence) from November to April (Figures 4A–D,K,L). Another region with suitable areas for fishing is offshore Tabasco, mainly from December to May (Figures 4A–E,L). From November to May, the areas of these potential fishing grounds, NPP and SST were below 1,500 mgC.m–2.day–1 and 26°C, respectively (Supplementary Figures 1, 2). From June to October, the probability of occurrence of fishing zones range between 0.6 and 0.8 along the coast in the study region (Figures 4F–J). These areas from June to October showed low values of NPP but SST was warm (Supplementary Figures 1, 2). Beyond 60 km, we did not identify suitable areas for fishing for the small-scale fleet (Figure 4).
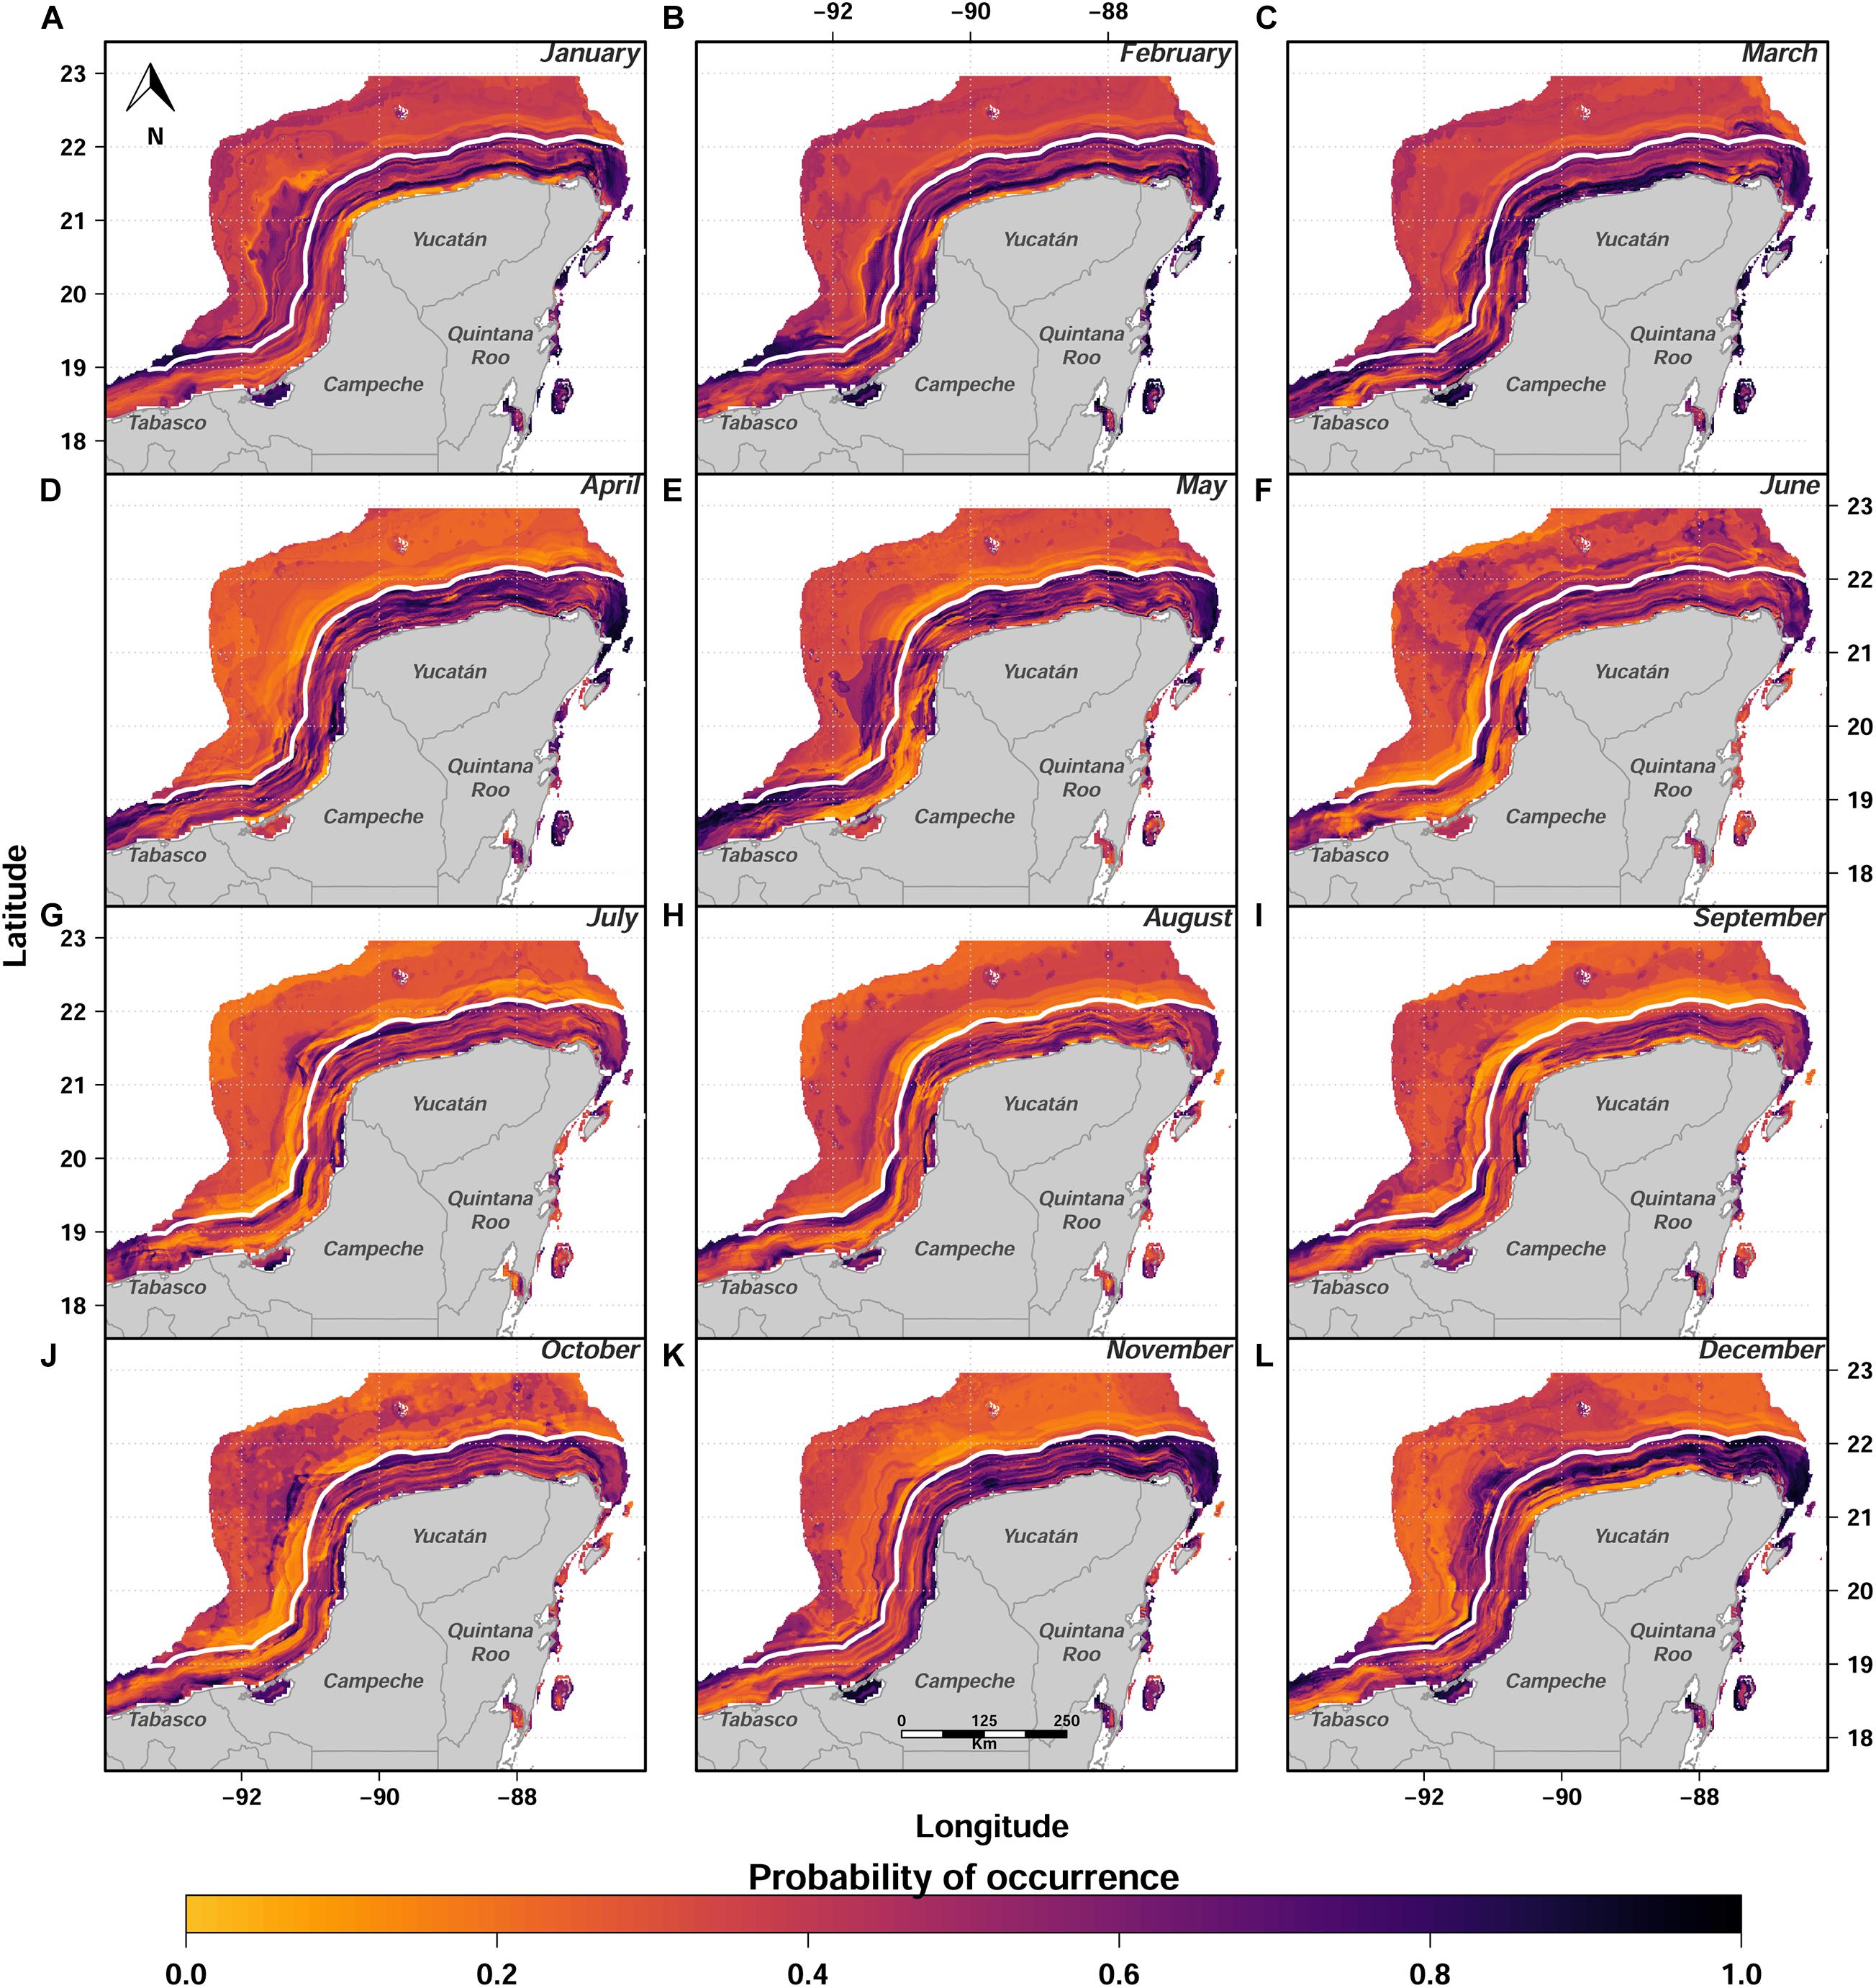
Figure 4. Monthly ensemble model forecasting (median ensemble model; A-L) for potential fishing grounds. Color scale represents the probability of occurrence of fishing activities given certain environmental conditions; the darker the color, the higher the probability.
It has been reported that fishers’ behavior could be a result of their adaptation for success when fishing (Salas and Gaertner, 2004; McCluskey and Lewison, 2008; Gonzalez-Mon et al., 2021). Fishers’ behavior is not usually considered when analyzing relationships between environmental conditions and target species (Torres-Irineo et al., 2014; Naranjo-Madrigal et al., 2015). From an ecological perspective, fishers must operate under uncertainty to locate the target species, as natural predators do (Bertrand et al., 2007). In the case of small-scale fishing vessels, fishers rarely have specialized technology to find their target species, unlike industrial vessels. Therefore, the analysis of monitoring systems and observers’ data could contribute to improving the understanding of small-scale fleet dynamics at a high resolution scale, generating different outputs that can support management decision such as the definition of marine protected areas, rights’ allocation by zone when applicable, introduction of fishing refuges or solving potential conflicts among different productive sectors (e.g., oil-fishing; fishing -tourism).
Maina et al. (2016, 2018) identify the bottom fishing grounds in a trawl fishery in Greece, showing the usefulness of data coming from VMS. This type of analyses is less common in small-scale fisheries (e.g., James et al., 2018). However, in a recent study, promising results were shown by Damasio et al. (2020) who used a Bayesian hierarchical spatial modeling approach to characterize small-scale fleet fishing grounds. In this study, a set of statistical methods allowed us to learn about the potential fishing grounds visited by small-scale fleets in the SGoM by using VMS data. The results showed that NPP and SST were the most important variables associated with the potential fishing grounds selected by the small-scale fishing fleet in the SGoM. Environmental variables have been declared as relevant with the spatio-temporal distribution of species targeted commercially (Lan et al., 2017; Murillo-Posada et al., 2019). The SST has been considered as a key variable regarding species distribution in marine ecosystems, while NPP refers to available carbon for consumption by the heterotrophic community and is estimated from a chlorophyll-based model (e.g., Arrizabalaga et al., 2015; Lezama-Ochoa et al., 2016). Thus, the association with suitable fishing grounds makes sense, especially in the case of benthic and demersal species, as the main species caught in the studied region. Unlike planktivorous species, these species did not depict high abundances with NPP peaks. Lan et al. (2017) reported that high catch rates occur in areas with intermediate productivity, and hence there is a positive association between high target species abundance and high chlorophyll concentrations in a time-lagged correlation. This can explain that low values of NPP contribute to high probabilities of fishing grounds occurrence in the present study. Our results related to SST and NPP seem to be supported by physical and biogeochemical processes reported before in the area. Estrada-Allis et al. (2020), through a coupled physical-biogeochemical model, analyzed the nitrogen budget in the Yucatan shelf, and reported that during autumn and winter, when the upwellings weaken, there is an efficient biogeochemical cycle in which dissolved inorganic nitrogen (key factor to primary productivity) is highly consumed by phytoplankton and then becomes particulate organic nitrogen. Furthermore, during autumn-winter (where the ensemble model depicted suitable fishing grounds), SST depict temperatures around 23.5 and 26°C (see Supplementary Figure 2; Varela et al., 2018).
In the Yucatan shelf (with a wide extension), the distance traveled from the coast to fishing grounds is a limiting factor for the small-scale vessels, due to their technical characteristics, such as low motility or low investment to perform long fishing trips and also due to fuel costs (Salas et al., 2019). However, an increase in the distance fishers venture from the coast has been reported through the years due to a decrease in target species availability in Yucatan (Saldaña et al., 2017), such a pattern is common in SSF (e.g., Damasio et al., 2020). This is consistent with our results, as the most suitable fishing grounds can be located far from the coast. Depth (associated with distance in the continental shelf) has been reported as a limiting factor for the allocation of the fishing effort of small vessels, limiting the range of operation (e.g., Saldaña et al., 2017). Our results showed that depth seemed less important to characterize the suitable fishing grounds. Therefore, fishers from the different states need to adapt to their particular conditions, for instance, vessels in Tabasco usually operate in areas near to the shelf break, while in Yucatan, they do it in shallower waters.
The access to detailed information from the VMS allowed us to disentangle evidence of fishing operations of SSF in the region. If well, we addressed only a part of the complexity associated with the SSF using the RF model to classify fishing and transit positions of vessels, it is still necessary to increase the number of trips with onboard observers to improve the analytical forecasting capacity of the approach used in this study. Lastly, it is important to indicate that from the pilot VMS data, we could not infer which species were caught or the fishing gear used; thus, incorporation of these data could help to analyze such relationships (fishing gears-target species) and add more detail to differentiate the potential fishing grounds according to different target species (e.g., D’Andrea et al., 2020; Tilley et al., 2020). Despite the limitations in our study, our results showed the usefulness of VMS for SSF to help understand the fleet dynamics and provided insights into the potential fishing grounds available in the SGoM region for the first time.
Generally, SSF in Mexico have not been fully integrated within marine spatial planning, partly because of the lack of explicit spatial data, fishing operations are variable in time and space, and spatial distribution patterns of species is dynamic (e.g., Trouillet et al., 2019). In this context, the results presented here, make evident the usefulness of the VMS data, which paired with analytical tools, can help to provide sound information for fisheries decision-makers, for implementation of fisheries programs such as the fishing refugees (CONAPESCA, 2018), or even within the context of countries moving toward the blue economy, with the potential introduction of wind energy in the region and other activities, so the government agencies require relevant information to implement marine spatial planning in a harmonious way in order to enhance communities’ livelihoods and preserve ecosystem services (Janßen et al., 2018; Morzaria-Luna et al., 2020).
Nowadays, the implementation of a VMS in the region is challenging, from gaining the acceptance of fishers to issue of the costs involved in the implementation of the system and its maintenance, especially given the size of the fleet (in the region there are around 20,000 small-scale vessels; Coronado et al., 2020). Thereby, a VMS for SSF demands the development of a cost-effective platform for daily catch recording in an integrative way, including the type of gears and species captured whenever possible (e.g., D’Andrea et al., 2020; Tilley et al., 2020). This type of data could be coupled with that obtained from onboard observers, and a program of monitoring systems in the coast, thus the acquisition of explicit spatial data from the small-scale vessels (Russo et al., 2018). Studies that jointly integrate fishing methods, species, catch, and location can be merged with VMS data and allow the identification of management units (Campbell et al., 2014; Russo et al., 2015; Salas et al., 2019; Méndez-Espinoza et al., 2020). These management units can be used with correlative models to predict potential fishing grounds per unit. With these results as an incentive, it is expected that both fishers and managers can see the potential benefits from implementing monitoring systems throughout the analyzed region and elsewhere.
The raw data supporting the conclusions of this article will be made available by the authors, without undue reservation.
ET-I, SS, and JE-Á conceived the idea. LP, DQ, and EC carried out the data management. ET-I and RJ performed the statistical analyses. ET-I, RJ, SS, and JE-Á wrote the first draft of the manuscript. All authors contributed to manuscript revision, read, and approved the submitted version.
This work was supported by: (1) FORDECYT-CONACYT-143329 research project (carried out by Cinvestav Mérida, Universidad Riviera, and Plenumsoft); (2) UNAM-PAPIIT IA208720 research project from Dirección General de Asuntos del Personal Académico, Universidad Nacional Autónoma de México; and (3) CONACYT-CB252215 research project (carried out by Cinvestav Mérida, EPOMEX, and UNAM).
The authors declare that the research was conducted in the absence of any commercial or financial relationships that could be construed as a potential conflict of interest.
We would like to thank all the fishers who accepted the implementation of the pilot VMS on their vessels. We appreciate the constructive comments provided by reviewers.
The Supplementary Material for this article can be found online at: https://www.frontiersin.org/articles/10.3389/fmars.2021.643318/full#supplementary-material
Allouche, O., Tsoar, A., and Kadmon, R. (2006). Assessing the accuracy of species distribution models: prevalence, kappa and the true skill statistic (TSS): Assessing the accuracy of distribution models. J. Appl. Ecol. 43, 1223–1232. doi: 10.1111/j.1365-2664.2006.01214.x
Araujo, M., and New, M. (2007). Ensemble forecasting of species distributions. Trends Ecol. Evol. 22, 42–47. doi: 10.1016/j.tree.2006.09.010
Arrizabalaga, H., Dufour, F., Kell, L., Merino, G., Ibaibarriaga, L., Chust, G., et al. (2015). Global habitat preferences of commercially valuable tuna. Deep Sea Res. Part II Top. Stud. Oceanogr. 113, 102–112. doi: 10.1016/j.dsr2.2014.07.001
Bastardie, F., and Brown, E. J. (2021). Reverse the declining course: A risk assessment for marine and fisheries policy strategies in Europe from current knowledge synthesis. Mar. Policy 126:104409. doi: 10.1016/j.marpol.2021.104409
Behivoke, F., Etienne, M.-P., Guitton, J., Randriatsara, R. M., Ranaivoson, E., and Léopold, M. (2021). Estimating fishing effort in small-scale fisheries using GPS tracking data and random forests. Ecol. Indic. 123:107321. doi: 10.1016/j.ecolind.2020.107321
Bertrand, S., Bertrand, A., Guevara-Carrasco, R., and Gerlotto, F. (2007). SCALE-INVARIANT MOVEMENTS OF FISHERMEN: THE SAME FORAGING STRATEGY AS NATURAL PREDATORS. Ecol. Appl. 17, 331–337. doi: 10.1890/06-0303
Bertrand, S., Díaz, E., and Lengaigne, M. (2008). Patterns in the spatial distribution of Peruvian anchovy (Engraulis ringens) revealed by spatially explicit fishing data. Prog. Oceanogr. 79, 379–389. doi: 10.1016/j.pocean.2008.10.009
Campbell, M. S., Stehfest, K. M., Votier, S. C., and Hall-Spencer, J. M. (2014). Mapping fisheries for marine spatial planning: Gear-specific vessel monitoring system (VMS), marine conservation and offshore renewable energy. Mar. Policy 45, 293–300. doi: 10.1016/j.marpol.2013.09.015
Chuenpagdee, R., Rocklin, D., Bishop, D., Hynes, M., Greene, R., Lorenzi, M. R., et al. (2019). The global information system on small-scale fisheries (ISSF): A crowdsourced knowledge platform. Mar. Policy 101, 158–166. doi: 10.1016/j.marpol.2017.06.018
CONAPESCA (2018). Refugios pesqueros, herramienta de manejo para lograr la sustentabilidad. Las Varas: CONAPESCA.
Coronado, E., Salas, S., Torres-Irineo, E., and Chuenpagdee, R. (2020). Disentangling the complexity of small-scale fisheries in coastal communities through a typology approach: The case study of the Yucatan Peninsula, Mexico. Reg. Stud. Mar. Sci. 36:101312.
Coulthard, S., Johnson, D., and McGregor, J. A. (2011). Poverty, sustainability and human wellbeing: A social wellbeing approach to the global fisheries crisis. Glob. Environ. Change 21, 453–463. doi: 10.1016/j.gloenvcha.2011.01.003
D’Andrea, L., Campos, A., Erzini, K., Fonseca, P., Franceschini, S., Kavadas, S., et al. (2020). The MINOUWApp: a web-based tool in support of by-catch and discards management. Environ. Monit. Assess. 192:754. doi: 10.1007/s10661-020-08704-5
Damasio, L. M. A., Peninno, M. G., and Lopes, P. F. M. (2020). Small changes, big impacts: Geographic expansion in small-scale fisheries. Fish. Res. 226:105533. doi: 10.1016/j.fishres.2020.105533
Daw, T. M. (2008). Spatial distribution of effort by artisanal fishers: Exploring economic factors affecting the lobster fisheries of the Corn Islands, Nicaragua. Fish. Res. 90, 17–25. doi: 10.1016/j.fishres.2007.09.027
Estrada-Allis, S. N., Sheinbaum Pardo, J., Azevedo Correia de Souza, J. M., Enríquez Ortiz, C. E., Mariño Tapia, I., and Herrera-Silveira, J. A. (2020). Dissolved inorganic nitrogen and particulate organic nitrogen budget in the Yucatán shelf: driving mechanisms through a physical–biogeochemical coupled model. Biogeosciences 17, 1087–1111. doi: 10.5194/bg-17-1087-2020
Fernández, J. I., Álvarez-Torres, P., Arreguín-Sánchez, F., López-Lemus, L., Ponce, G., Díaz-de-León, A., et al. (2011). “Coastal fisheries of México,” in Coastal fisheries of Latin America and the Caribbean, eds S. Salas, R. Chuenpagdee, A. Charles, and J. C. Seijo (Rome: FAO), 231–284.
Gonzalez-Mon, B., Bodin, Ö, Lindkvist, E., Frawley, T. H., Giron-Nava, A., Basurto, X., et al. (2021). Spatial diversification as a mechanism to adapt to environmental changes in small-scale fisheries. Environ. Sci. Policy 116, 246–257. doi: 10.1016/j.envsci.2020.11.006
Hijmans, R. J., Etten, J., van, Sumner, M., Cheng, J., Baston, D., et al. (2020). raster: Geographic Data Analysis and Modeling. Vienna: R Core Team.
James, M., Mendo, T., Jones, E. L., Orr, K., McKnight, A., and Thompson, J. (2018). AIS data to inform small scale fisheries management and marine spatial planning. Mar. Policy 91, 113–121. doi: 10.1016/j.marpol.2018.02.012
Janßen, H., Bastardie, F., Eero, M., Hamon, K. G., Hinrichsen, H.-H., Marchal, P., et al. (2018). Integration of fisheries into marine spatial planning: Quo vadis? Estuar. Coast. Shelf Sci. 201, 105–113. doi: 10.1016/j.ecss.2017.01.003
Jennings, S., and Lee, J. (2012). Defining fishing grounds with vessel monitoring system data. ICES J. Mar. Sci. 69, 51–63. doi: 10.1093/icesjms/fsr173
Joo, R., Bertrand, A., Bouchon, M., Chaigneau, A., Demarcq, H., Tam, J., et al. (2014). Ecosystem scenarios shape fishermen spatial behavior. The case of the Peruvian anchovy fishery in the Northern Humboldt Current System. Prog. Oceanogr. 128, 60–73. doi: 10.1016/j.pocean.2014.08.009
Joo, R., Bertrand, S., Tam, J., and Fablet, R. (2013). Hidden Markov models: the best models for forager movements? PLoS One 8:e71246. doi: 10.1111/eth.13106
Katara, I., and Silva, A. (2017). Mismatch between VMS data temporal resolution and fishing activity time scales. Fish. Res. 188, 1–5. doi: 10.1016/j.fishres.2016.11.023
Lan, K.-W., Shimada, T., Lee, M.-A., Su, N.-J., and Chang, Y. (2017). Using Remote-Sensing Environmental and Fishery Data to Map Potential Yellowfin Tuna Habitats in the Tropical Pacific Ocean. Remote Sens. 9:444. doi: 10.3390/rs9050444
Lee, J., South, A. B., and Jennings, S. (2010). Developing reliable, repeatable, and accessible methods to provide high-resolution estimates of fishing-effort distributions from vessel monitoring system (VMS) data. ICES J. Mar. Sci. J. Cons. 67, 1260–1271. doi: 10.1093/icesjms/fsq010
Lezama-Ochoa, N., Murua, H., Chust, G., Van Loon, E., Ruiz, J., Hall, M., et al. (2016). Present and Future Potential Habitat Distribution of Carcharhinus falciformis and Canthidermis maculata By-Catch Species in the Tropical Tuna Purse-Seine Fishery under Climate Change. Front. Mar. Sci. 3:34. doi: 10.3389/fmars.2016.00034
Maina, I., Kavadas, S., Damalas, D., Pantazi, M., and Katsanevakis, S. (2018). Dynamics of trawling effort in the Aegean Sea: investigating the potential of Vessel Monitoring System (VMS) data. ICES J. Mar. Sci. 75, 2265–2275. doi: 10.1093/icesjms/fsy083
Maina, I., Kavadas, S., Katsanevakis, S., Somarakis, S., Tserpes, G., and Georgakarakos, S. (2016). A methodological approach to identify fishing grounds: A case study on Greek trawlers. Fish. Res. 183, 326–339. doi: 10.1016/j.fishres.2016.06.021
Marco, J., Valderrama, D., and Rueda, M. (2021). Triple bottom line assessment for the historically underperforming Colombian queen conch fishery. Mar. Policy 125:104257. doi: 10.1016/j.marpol.2020.104257
McCluskey, S. M., and Lewison, R. L. (2008). Quantifying fishing effort: a synthesis of current methods and their applications: Quantifying fishing effort: methods review. Fish Fish. 9, 188–200. doi: 10.1111/j.1467-2979.2008.00283.x
Méndez-Espinoza, D., Ojeda-Ruiz, M. Á, Marín-Monroy, E. A., Jiménez-Esquivel, V., and Cota-Nieto, J. J. (2020). Participatory research to understand spatio-temporal dynamics of small-scale fleets: The C. bellicosus fishery in Magdalena Bay, Baja California Sur, Mexico. Ocean Coast. Manag. 198:105369. doi: 10.1016/j.ocecoaman.2020.105369
Merino, M. (1997). Upwelling on the Yucatan Shelf: hydrographic evidence. J. Mar. Syst. 13, 101–121. doi: 10.1016/S0924-7963(96)00123-6
Metcalfe, K., Collins, T., Abernethy, K. E., Boumba, R., Dengui, J.-C., Miyalou, R., et al. (2017). Addressing Uncertainty in Marine Resource Management; Combining Community Engagement and Tracking Technology to Characterize Human Behavior: Small-scale fisheries. Conserv. Lett. 10, 460–469. doi: 10.1111/conl.12293
Morzaria-Luna, H. N., Turk-Boyer, P., Polanco-Mizquez, E. I., Downton-Hoffmann, C., Cruz-Piñón, G., Carrillo-Lammens, T., et al. (2020). Coastal and Marine Spatial Planning in the Northern Gulf of California, Mexico: Consolidating stewardship, property rights, and enforcement for ecosystem-based fisheries management. Ocean Coast. Manag. 197:105316. doi: 10.1016/j.ocecoaman.2020.105316
Murillo-Posada, J. C., Salas, S., and Velázquez-Abunader, I. (2019). Factors affecting relative abundance of low-mobility fishing resources: spiny lobster in the Galapagos Marine Reserve. PeerJ 7:e7278. doi: 10.7717/peerj.7278
Naranjo-Madrigal, H., van Putten, I., and Norman-López, A. (2015). Understanding socio-ecological drivers of spatial allocation choice in a multi-species artisanal fishery: A Bayesian network modeling approach. Mar. Policy 62, 102–115. doi: 10.1016/j.marpol.2015.09.003
Natale, F., Gibin, M., Alessandrini, A., Vespe, M., and Paulrud, A. (2015). Mapping Fishing Effort through AIS Data. PLoS One 10:e0130746. doi: 10.1371/journal.pone.0130746
R Core Team (2020). R: A language and environment for statistical computing. Vienna: R Foundation for Statistical Computing.
Russo, T., Morello, E. B., Parisi, A., Scarcella, G., Angelini, S., Labanchi, L., et al. (2018). A model combining landings and VMS data to estimate landings by fishing ground and harbor. Fish. Res. 199, 218–230. doi: 10.1016/j.fishres.2017.11.002
Russo, T., Pulcinella, J., Parisi, A., Martinelli, M., Belardinelli, A., Santojanni, A., et al. (2015). Modelling the strategy of mid-water trawlers targeting small pelagic fish in the Adriatic Sea and its drivers. Ecol. Model. 300, 102–113. doi: 10.1016/j.ecolmodel.2014.12.001
Salas, S., and Gaertner, D. (2004). The behavioural dynamics of fishers: management implications. Fish Fish. 5, 153–167.
Salas, S., Torres-Irineo, E., and Coronado, E. (2019). Towards a métier-based assessment and management approach for mixed fisheries in Southeastern Mexico. Mar. Policy 103, 148–159. doi: 10.1016/j.marpol.2019.02.040
Saldaña, A., Salas, S., Arce-Ibarra, A. M., and Torres-Irineo, E. (2017). Fishing operations and adaptive strategies of small-scale fishers: insights for fisheries management in data-poor situations. Fish. Manag. Ecol. 24, 19–32. doi: 10.1111/fme.12199
Stelzenmüller, V., Rogers, S. I., and Mills, C. M. (2008). Spatio-temporal patterns of fishing pressure on UK marine landscapes, and their implications for spatial planning and management. ICES J. Mar. Sci. 65, 1081–1091.
Thuiller, W., Lafourcade, B., Engler, R., and Araújo, M. B. (2009). BIOMOD - a platform for ensemble forecasting of species distributions. Ecography 32, 369–373. doi: 10.1111/j.1600-0587.2008.05742.x
Tilley, A., Dos Reis, Lopes, J., and Wilkinson, S. P. (2020). PeskAAS: A near-real-time, open-source monitoring and analytics system for small-scale fisheries. PLoS One 15:e0234760. doi: 10.1371/journal.pone.0234760
Torres-Irineo, E., Gaertner, D., Chassot, E., and Dreyfus-León, M. (2014). Changes in fishing power and fishing strategies driven by new technologies: The case of tropical tuna purse seiners in the eastern Atlantic Ocean. Fish. Res. 155, 10–19. doi: 10.1016/j.fishres.2014.02.017
Trouillet, B., Bellanger-Husi, L., El Ghaziri, A., Lamberts, C., Plissonneau, E., and Rollo, N. (2019). More than maps: Providing an alternative for fisheries and fishers in marine spatial planning. Ocean Coast. Manag. 173, 90–103. doi: 10.1016/j.ocecoaman.2019.02.016
Varela, R., Costoya, X., Enriquez, C., Santos, F., and Gómez-Gesteira, M. (2018). Differences in coastal and oceanic SST trends north of Yucatan Peninsula. J. Mar. Syst. 182, 46–55. doi: 10.1016/j.jmarsys.2018.03.006
Watson, R. A., Cheung, W. W. L., Anticamara, J. A., Sumaila, R. U., Zeller, D., and Pauly, D. (2013). Global marine yield halved as fishing intensity redoubles. Fish Fish. 14, 493–503. doi: 10.1111/j.1467-2979.2012.00483.x
Keywords: fishing grounds, vessel monitoring system, small-scale fisheries, fleet dynamics, correlative modeling
Citation: Torres-Irineo E, Salas S, Euán-Ávila JI, Palomo LE, Quijano Quiñones DR, Coronado E and Joo R (2021) Spatio-Temporal Determination of Small-Scale Vessels’ Fishing Grounds Using a Vessel Monitoring System in the Southeastern Gulf of Mexico. Front. Mar. Sci. 8:643318. doi: 10.3389/fmars.2021.643318
Received: 17 December 2020; Accepted: 20 April 2021;
Published: 14 May 2021.
Edited by:
Andrés M. Cisneros-Montemayor, University of British Columbia, CanadaReviewed by:
Tommaso Russo, University of Rome Tor Vergata, ItalyCopyright © 2021 Torres-Irineo, Salas, Euán-Ávila, Palomo, Quijano Quiñones, Coronado and Joo. This is an open-access article distributed under the terms of the Creative Commons Attribution License (CC BY). The use, distribution or reproduction in other forums is permitted, provided the original author(s) and the copyright owner(s) are credited and that the original publication in this journal is cited, in accordance with accepted academic practice. No use, distribution or reproduction is permitted which does not comply with these terms.
*Correspondence: Edgar Torres-Irineo, ZWRnYXIudG9ycmVzQGVuZXNtZXJpZGEudW5hbS5teA==
Disclaimer: All claims expressed in this article are solely those of the authors and do not necessarily represent those of their affiliated organizations, or those of the publisher, the editors and the reviewers. Any product that may be evaluated in this article or claim that may be made by its manufacturer is not guaranteed or endorsed by the publisher.
Research integrity at Frontiers
Learn more about the work of our research integrity team to safeguard the quality of each article we publish.