 Michiyo Yamamoto-Kawai
 Soichiro Ito
 Haruko Kurihara
 Jota Kanda
- 1Department of Ocean Sciences, Tokyo University of Marine Science and Technology, Tokyo, Japan
- 2Department of Science, University of the Ryukyus, Nishihara, Japan
Seasonal and interannual variabilities in the partial pressure of CO2 (pCO2), pH, and calcium carbonate saturation state (Ω) were investigated in the highly eutrophicated Tokyo Bay, Japan, based on monthly observations that were conducted from 2011 to 2017. There were large variabilities in these parameters for surface and bottom waters due to photosynthesis and respiration, respectively. Warming/cooling and freshwater input also altered the surface Ω. During the observation period, calcium carbonate undersaturation was observed twice in the anoxic bottom waters in summer. The data indicate that anaerobic remineralization under anoxic conditions lowers the Ω, causing undersaturation. These findings suggest that de-eutrophication can decelerate ocean acidification in the bottom waters of Tokyo Bay. However, if atmospheric CO2 exceeds 650 ppm, aragonite undersaturation will be a common feature in the summer bottom water, even if hypoxia/anoxia are alleviated by de-eutrophication.
Introduction
Ocean acidification (OA) is defined as the progressive reduction in the pH of ocean over an extended period of time, typically decades or longer (Field et al., 2011). Changes of seawater carbonate chemistry associated to OA, such as an increase in partial pressure of seawater CO2 (pCO2) concentration and a decrease in calcium carbonate (CaCO3) saturation state (Ω) are also included in the discussion of the effects of OA (Royal Society, 2005; IPCC, 2014). The increased CO2 concentration promotes the photosynthesis by primary producers such as phytoplankton and seagrass (Hinga et al., 2002; Palacios and Zimmerman, 2007; Hendriks et al., 2010), while the decreased Ω adversely affects the calcification, as well as the growth and survival of calcifying organisms (e.g., Kroeker et al., 2010). The increased CO2 concentration also affects the growth of otoliths (CaCO3 structures in ears), metabolic rate and behavior of some fishes (Heuer and Grosell, 2014 for review). The co-occurrence of OA with other environmental changes, such as warming and deoxygenation lead to further biological complications (Kroeker et al., 2013; Gao et al., 2019; Doney et al., 2020). It has been found that an elevated CO2 concentration reduces the tolerance of fish and bivalves to low oxygen conditions (Hancock and Place, 2016; Miller et al., 2016; Gobler and Baumann, 2016). In addition, the synergistic effects of OA and the warming of seawater negatively impact the calcification, reproduction, and survival of marine organisms (Harvey et al., 2013).
The current OA, caused primarily by the uptake of anthropogenic CO2 from the atmosphere, is occurring at a rate higher than that observed at any other time in the last 300 million years (Hönisch et al., 2012). The high OA rate, together with other anthropogenic perturbations, pose a threat to marine organisms, and thus to human society (Bednaršek et al., 2016; Hall-Spencer and Harvey, 2019; Stewart-Sinclair et al., 2020). Coastal regions are of particular importance to human society, providing ∼40% of the global ecosystem goods and services (Costanza et al., 1997). However, due to the complex natural processes and anthropogenic effects, it is difficult to understand and predict the progress of OA in coastal regions. For instance, freshwater discharge from land lowers the salinity and alkalinity and thus lowers the buffer capacity of coastal seawater, making it sensitive to anthropogenic CO2 addition (Salisbury et al., 2008; Hu and Cai, 2013). An excessive loading of man-made nutrients from land, a phenomenon known as eutrophication, causes massive algal production (blooms) and the subsequent decomposition of large amounts of sinking organic matter causes hypoxia (oxygen concentrations ≤ 2 mg L–1 or ≤ 61 μmol kg–1) in coastal waters worldwide (Breitburg et al., 2018). Eutrophication can thwart OA in the surface waters by increasing the biological CO2 uptake; however, it amplifies OA in bottom waters by increasing the amount of CO2 released from the decomposed organic matter (respiration) and also by reducing the buffer capacity (CO2-rich water has lower buffer capacity; Cai et al., 2011; Duarte et al., 2013; Wallace et al., 2014; Zhao et al., 2020). Large seasonal variations in the physical and biogeochemical conditions of shallow coastal regions can also result in large pH and Ω fluctuations, suggesting that the progress of OA causes coastal waters to seasonally exceed the biologically harmful pH and Ω thresholds faster than offshore waters (Pacella et al., 2018; c.f., McNeil and Matear, 2008). Depending on the balance between the OA (caused by anthropogenic CO2) and other processes, the coastal regions can undergo a variety of changes from rapid acidification to basification (Duarte et al., 2013; Ishizu et al., 2019). Furthermore, all of these natural and anthropogenic processes can differ across regions. Therefore, to predict the future environmental conditions, it is essential to quantitatively understand the processes affecting OA in each coastal region (e.g., Cai et al., 2011; Laurent et al., 2017; Feely et al., 2018; Rheuban et al., 2019).
In this study, we investigate the state of OA in Tokyo Bay, a highly eutrophicated bay in Japan. Our previous study was the first report on the Ω of water in Tokyo Bay based on monthly observations at two station, which were conducted from April 2011 to January 2012 (Yamamoto-Kawai et al., 2015). Of these two stations, larger seasonal variabilities in the physical and biogeochemical parameters were observed at F3, the inner bay station, than at F6, the middle bay station. Herein, the seasonal and interannual variations in the various carbonate chemistry parameters, viz., CO2, pH, and Ω are quantitatively examined to understand the processes affecting the of OA in Tokyo Bay, based on the monthly observations made at F3 from April 2011 to December 2017.
Study Area
Tokyo Bay is a semi-enclosed bay with a mean depth of 19 m (Figure 1). The freshwater discharge from rivers (∼400 m3 s–1) and the inflow of offshore waters drives the estuarine circulation in the bay. The residence time of water in the bay is 1–3 months (Okada et al., 2011). The environment of Tokyo Bay has significantly changed over the last century (see Furukawa and Okada, 2006 for review). The nutrient loading from the surrounding metropolitan areas to the bay rapidly increased in the 1950s and the 1960s. The massive algal bloom (commonly referred to as the “red tide”), mainly caused by the dinoflagellates and diatoms, and the resulting bottom water hypoxia/anoxia have been repeatedly observed since the 1960s (Ishii et al., 2008; Kodama and Horiguchi, 2011). Since most river discharge enters from the north-west side, severe eutrophication and prolonged hypoxia/anoxia are observed in the inner part of the bay (e.g., Kodama and Horiguchi, 2011). Hypoxia/anoxia promotes the anaerobic oxidation of organic matter such as denitrification and sulfate reduction (e.g., Krumins et al., 2013). The bottom water with toxic hydrogen sulfide produced by the sulfate-reducing bacteria can rise by wind mixing, killing the fish and shellfish at the northern coast of the bay. This phenomenon is known as “blue tide” because the hydrogen sulfide in upwelled water is oxidized to elemental sulfur, causing the water to appear whitish blue (Takii et al., 2002). In addition, the area of the tidal flats decreased by ∼90% over the past century, thereby decreasing the shellfish habitat and destroying the network for benthic larvae transport. Due to these environmental changes, the total fish caught annually in Tokyo Bay decreased from > 1 × 10⁵ tons in the 1950s (∼90% of shellfish) to 4 × 10⁴ tons in the 1990s (Furukawa and Okada, 2006). Although the implementation of sewage treatment decreased the nutrient concentration in the bay after the 1980s (Kanda et al., 2008; Kubo et al., 2019), red tide and summer bottom hypoxia are still observed every year. The progress of OA can impose additional stress to the ecosystem of Tokyo Bay, which has been suffering from eutrophication and hypoxia.
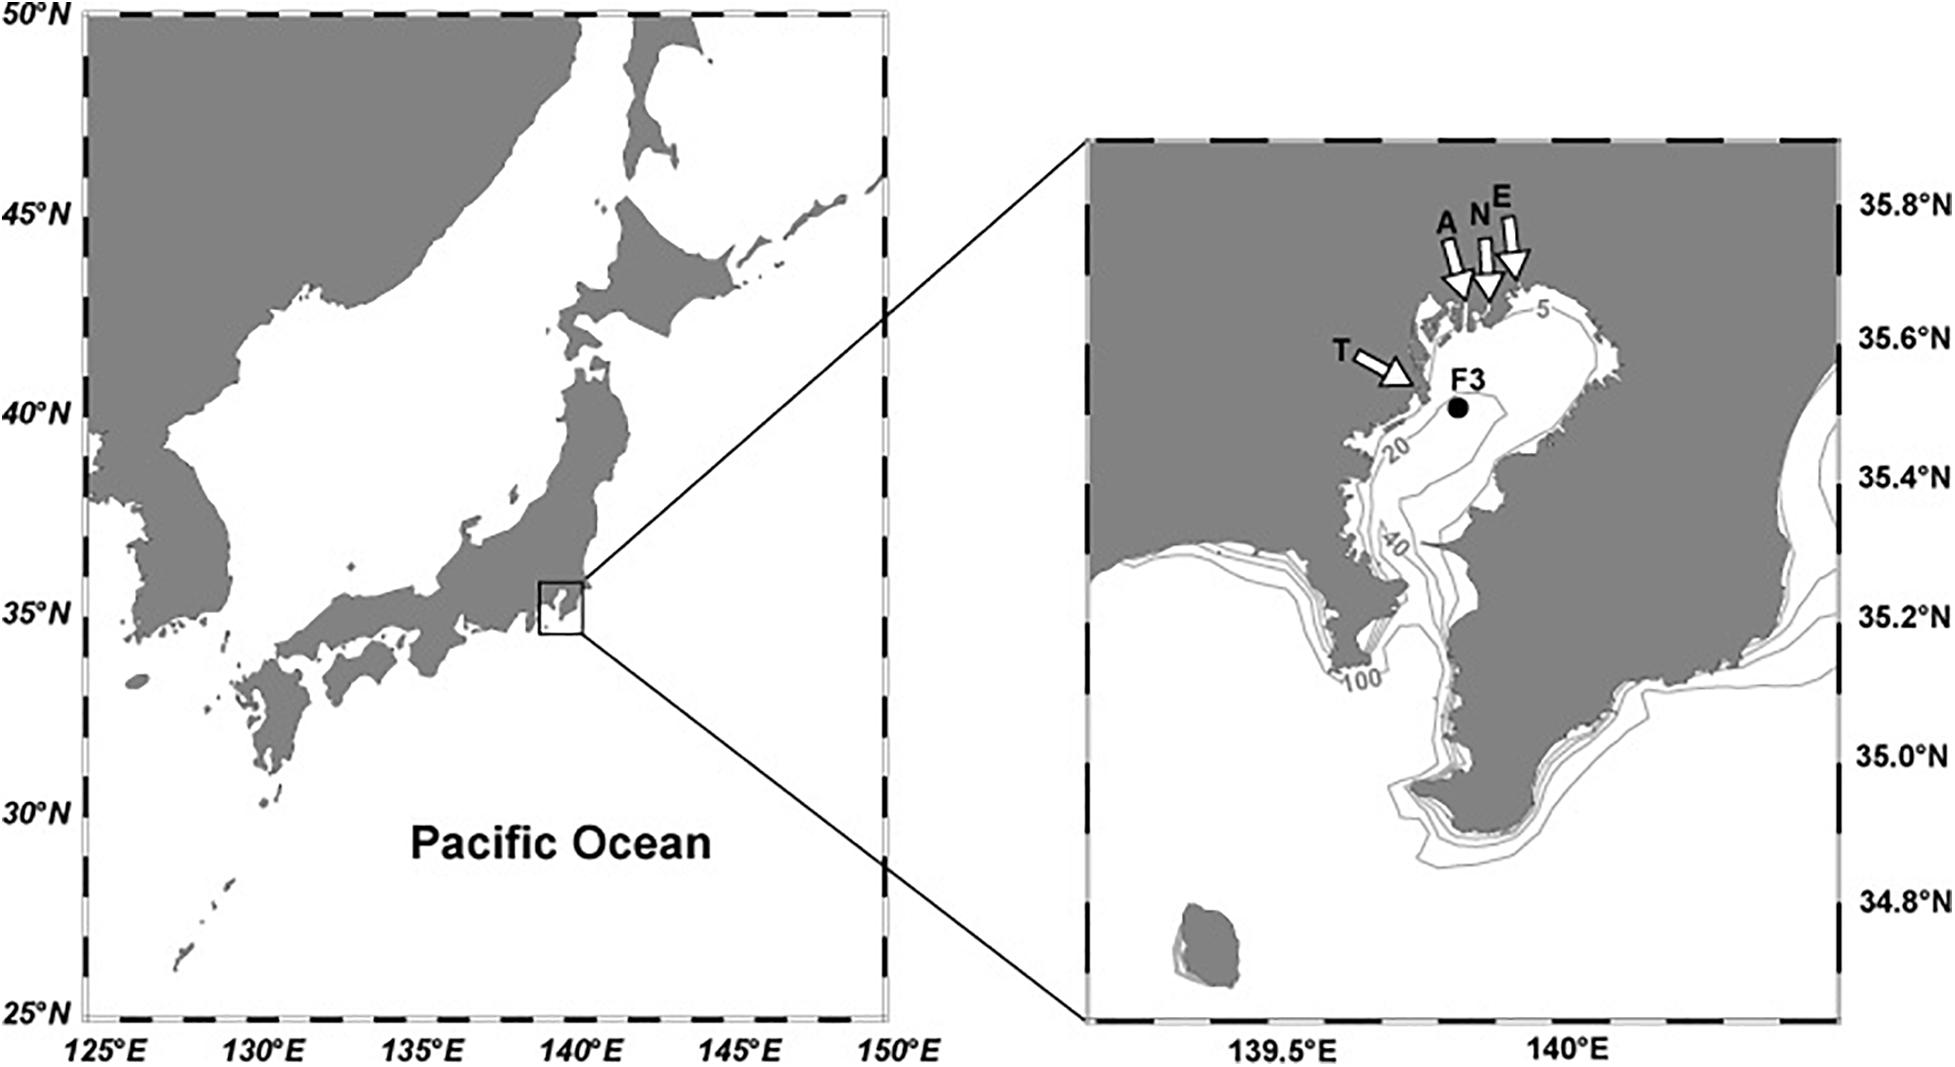
Figure 1. Map of Tokyo Bay and the sampling location. White arrows indicate the major rivers (E, Edogawa; N, Nakagawa; A, Arakawa; T, Tamagawa rivers). Gray lines with numbers indicate the bathymetry in meters.
Materials and Methods
Monthly observations (a total of 77 times) were carried out at F3, a time-series station (35.51°N, 139.83°E, bottom depth = 23 m; Figure 1) from April 2011 to December 2017. Station F3 is located in the inner bay region. Seawater samples were collected using Niskin bottles mounted on a conductivity-temperature-depth (CTD)/rosette on the R/V Seiyo-maru of Tokyo University of Marine Science and Technology at target depths of 0 m, 5 m, 10 m, 15 m, and bottom. Actual depths of sampling were 1–3 m for the target depth of 0 m, 2–8 m for 5 m, 10–14 m for 10 m, 14–18 m for 15 m, and 19–24 m for the bottom.
Samples for dissolved inorganic carbon (DIC) and total alkalinity (TA) were preserved using a saturated mercuric chloride solution (0.1% by volume). The DIC was determined using the CO2 extraction-coulometry method (Dickson et al., 2007). The TA was measured using a spectrophotometric method (Yao and Byrne, 1998) for samples from April 2011 to January 2012, and by an open titration method (Dickson et al., 2007) for all other samples. The DIC and TA were calibrated against certified reference materials provided by Dr. Dickson at Scripps Institution of Oceanography and/or KANSO Technos, Japan. The pooled standard deviations obtained from replicate analysis were 2.5 and 2.8 μmol kg–1 for TA and DIC, respectively. The dissolved oxygen (DO) and chlorophyll a (Chl a) concentrations were measured using a RINKO DO sensor (JEFF Advantec Co., Ltd.) and a Seapoint chlorophyll fluorometer (Seapoint sensors, Inc.), respectively. The percentage of oxygen saturation (DO%) was calculated at standard air pressure with solubility of Weiss (1970). We also used nutrient data till October 2015, reported in Kubo et al. (2019).
The DIC, TA, temperature (T), salinity (S), and phosphate and silicate concentrations were used to calculate the in situ partial pressure of CO2 (pCO2), pH (total scale), and Ω of the collected samples using the CO2SYS program (Lewis and Wallace, 1998), along with the K1 and K2 constants reported by Mehrbach et al. (1973), refit by Dickson and Millero (1987), and KSO4 constant of Dickson (1990). The phosphate and silicate concentrations of Kubo et al. (2019), who reported data till October 2015, were used. After October 2015, we used the mean of the monthly phosphate and silicate concentrations calculated from 2011 to 2015 at each depth. For Ω, only the saturation state of aragonite (Ωar) is reported. The calcite saturation state is approximately 1.5 times higher than that of Ωar.
Results and Discussion
Seasonal Variability
Figure 2 shows mean values of physical and biogeochemical parameters for each month and each target depth (0, 5, 10, 15 m, and bottom). In December and January, all observed parameters show relatively uniform values from the surface to the bottom, because of vertical mixing induced by cooling and winds. From January to August, the T increases from 10.7 to 26.8°C in the surface layer and from 12.5 to 21.2°C in bottom layer (Figure 2A). The S below 10 m remains largely unchanged throughout the year, ranging between 33 and 34 at the bottom (Figure 2B). In contrast, there is a large seasonal variability in S at 0 and 5 m, decreases to 26.1 and 29.7, respectively, in September. This indicate that river discharge significantly lowers S in the top 5 m layer at F3. The average T and S for all observations were 17.5°C and 32.0, respectively.
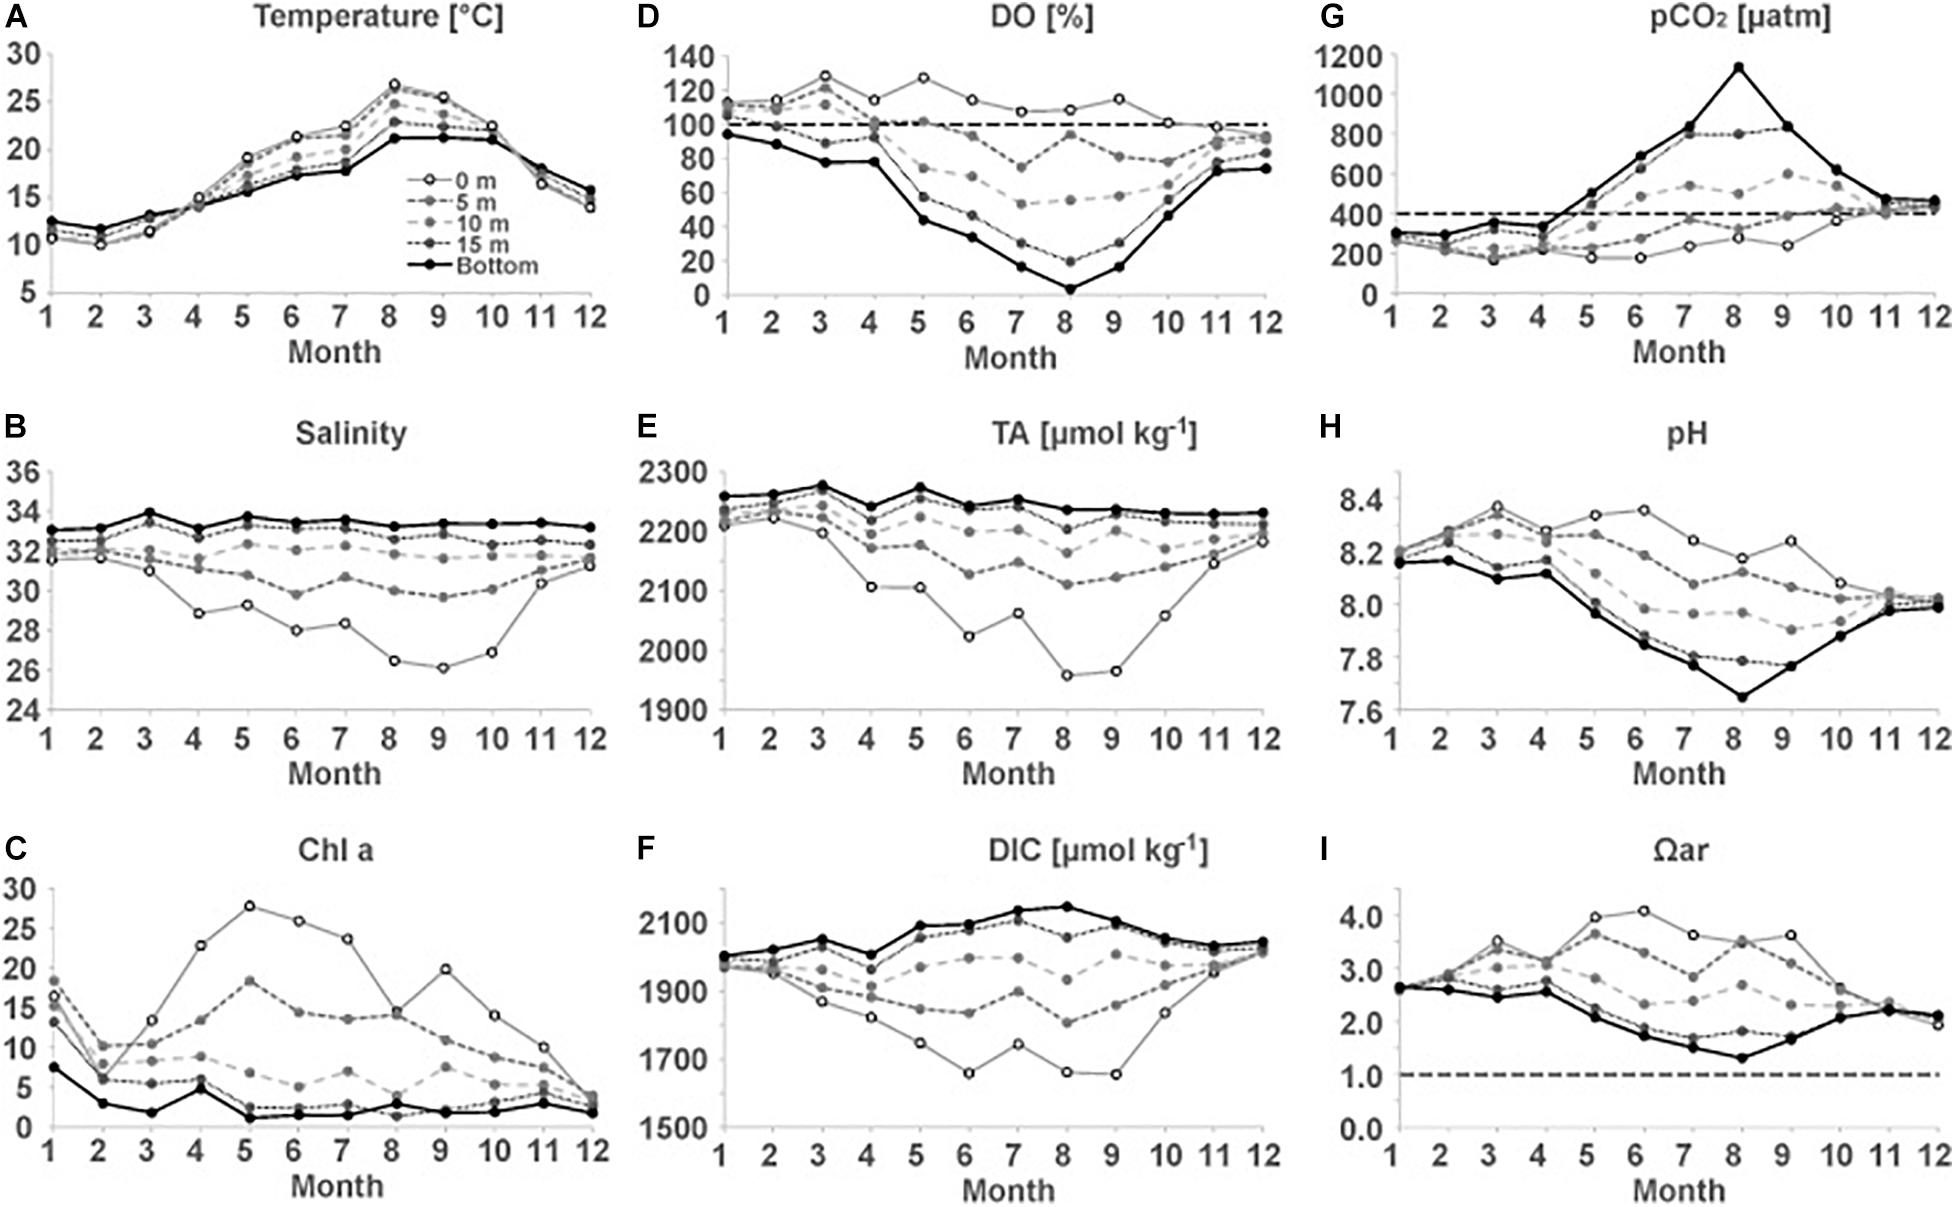
Figure 2. Seasonal variations in (A) T, (B) S, (C) Chl a, (D) DO%, (E) TA, (F) DIC, (G) pCO2, (H) pH, and (I) Ωar at station F3. Black horizontal dashed lines in (D,G,I) indicate the O2 saturation, CO2 saturation (relative to mean atmospheric CO2 for the observation period), and aragonite saturation (Ωar = 1), respectively.
Chl a concentrations in the top 5 m layer also show large seasonal variability (Figure 2C). The highest Chl a concentration of 28 μg L–1 was observed in the surface water in May. Interestingly, the Chl a concentration increased from December to January at all depths (Figure 2C), suggesting the enhancement of primary production during January. In addition, the concurrent decrease in the phosphate and silicate concentrations from December to January (not shown) indicates the occurrence of photosynthesis by diatoms. This finding is consistent with previous studies, which have reported winter photosynthesis by diatoms in Tokyo Bay, stimulated by episodic stratification with favorable light conditions and abundant nutrients (Shibata and Aruga, 1982; Nomura and Yoshida, 1997).
The surface DO was slightly undersaturated in December (94.5 ± 3.9%), but increased to 115.0 ± 15.5% in January due to the production of DO by photosynthesis. Despite continued photosynthesis and warming (lowers gas solubility in seawater), DO% does not largely increase from spring to summer, possibly due to the release of O2 to the atmosphere by an air-sea gas exchange. From spring to summer, the DO in the bottom water at F3 largely decreases because of decomposition of organic matter, reaching as low as 3.3% (7.4 μmol kg–1) in August. Bottom water is in hypoxic condition (≤61 μmol kg–1) from July to September. In August, water at 15 m also reaches hypoxic condition. After September, vertical mixing supplies oxygen from the atmosphere to the bottom waters, increasing the DO levels (Figure 2D).
Carbonate chemistry should be affected by above mentioned seasonal variation in cooling/warming, freshwater mixing, biological activity such as photosynthesis and respiration. Seasonal variations in TA and DIC were similar to those in S, showing low values during summer in the top 5 m layer due to mixing with river water (Figures 2B,E,F). The DIC below 10 m increases from spring to summer due to the accumulation of CO2 from decomposition of organic matter. The seasonal and interannual variations in the carbonate parameters (calculated from TA and DIC) differ from those in TA or DIC (Figures 2G–I). The seasonal variation in pCO2 is much larger in the bottom layer than in the surface layer. Surface water tends to be undersaturated with respect to atmospheric CO2 (∼400 μatm) from January to October, while it is oversaturated with CO2 from November to December (Figure 2G). The bottom water also tends to be undersaturated from January to April and the pCO2 in the bottom water increased as the DO% decreased, reaching 1,134 μatm in August. From September to November, the bottom pCO2 rapidly decreases, indicating the transfer of CO2 to the upper waters and the atmosphere by an enhanced vertical mixing in fall; however, CO2 oversaturation was still observed in December, following which, winter photosynthesis decreases the pCO2 till the water is undersaturated with respect to the atmosphere in January (Figure 2G). The seasonal variations in the pH mirrors that of pCO2 (Figure 2H). Bottom pH is as low as 7.6 in August. Ωar is high in the surface waters during summer (Figure 2I), in spite of freshwater mixing that lowers Ωar (Salisbury et al., 2008; Yamamoto-Kawai et al., 2011). This means that effect of biological activity (i.e., uptake of CO2 by photosynthesis) exceeds the effect of freshening. The bottom Ωar reaches a minimum value of 1.3 in August.
Interannual Variability
Although 7 years of observations are not sufficient to determine the acidification trends in the highly variable Tokyo Bay, the interannual variabilities in the physical and biogeochemical parameters can be investigated. Interannual variability in T is not so large, compared to seasonal variability (Figure 3A). For example, surface T in August ranged only between 25.31°C (in 2015) and 28.86°C (in 2013). In contrast, surface S shows large interannual variability (Figure 3B). Extreme surface freshening was observed in September 2011 (S = 15.87), April 2014 (S = 20.75), June 2014 (S = 22.95), August 2016 (S = 19.49), and October 2016 (S = 16.30), while surface S was greater than 28 throughout 2013 (Figure 2A). In the layer below 10 m depth, S is relatively constant throughout the study period. Accordingly, extreme surface freshening leads to strong stratification at around 5 m.
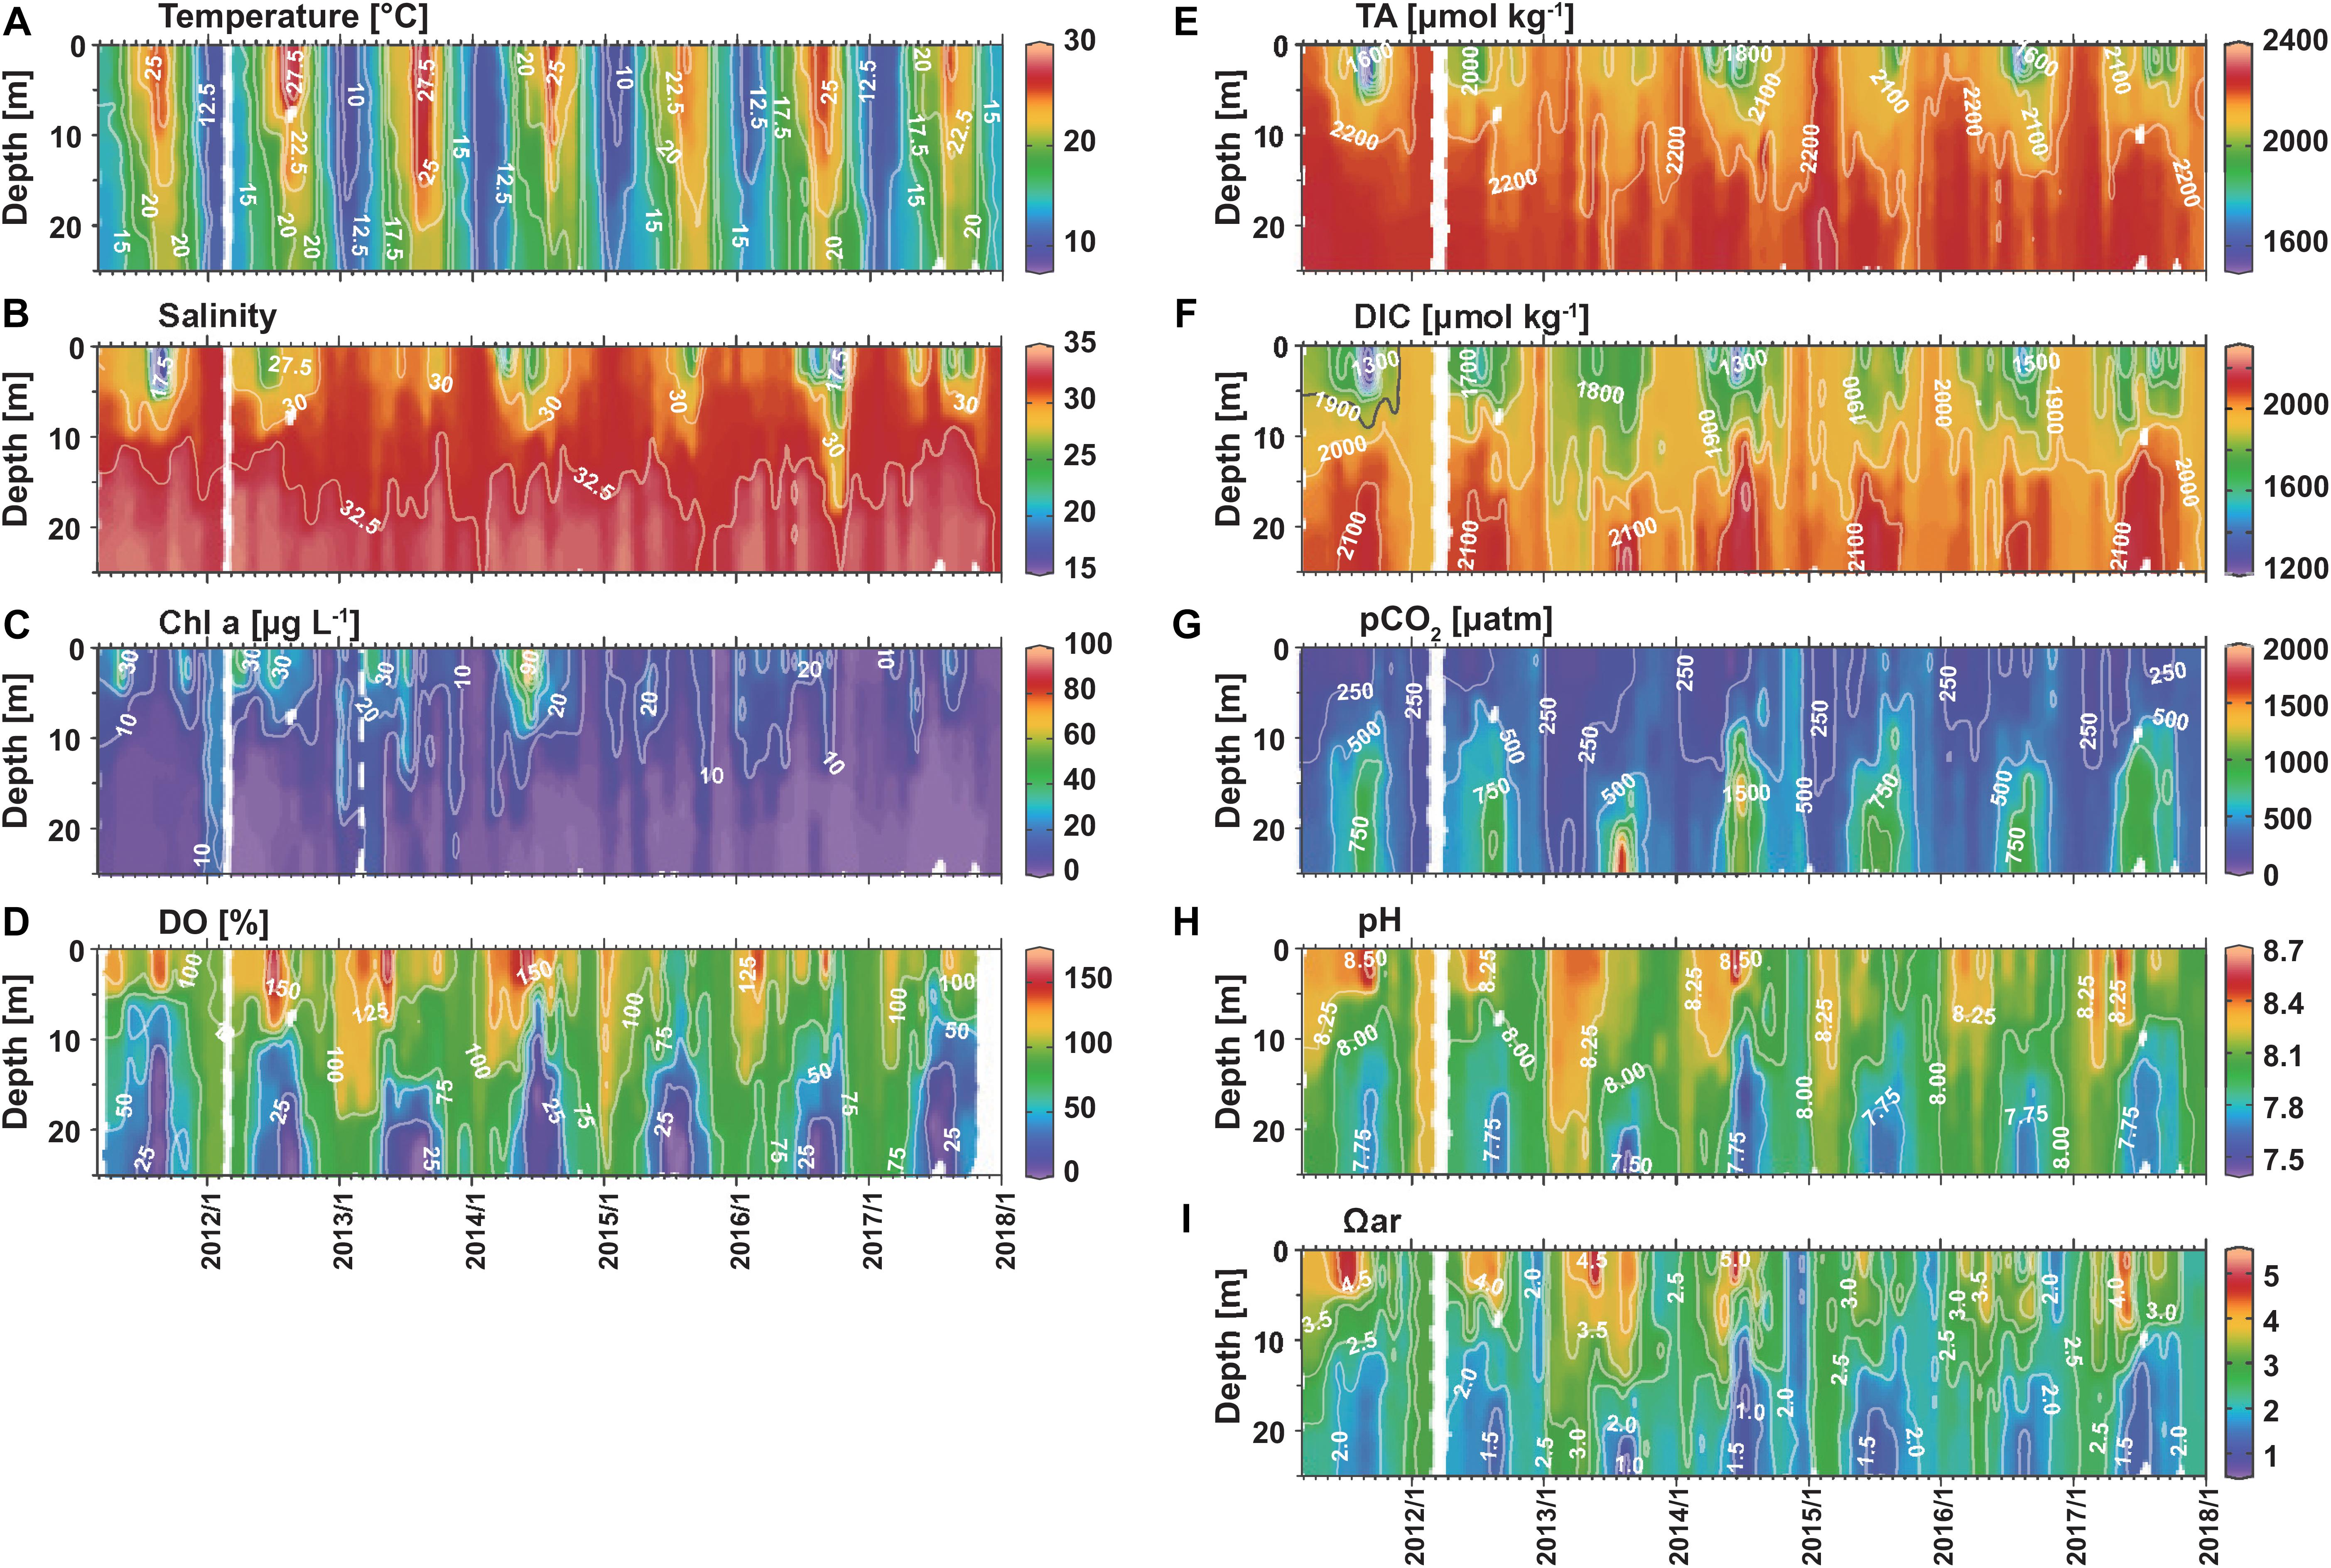
Figure 3. Time series of (A) T, (B) S, (C) Chl a, (D) DO%, (E) TA, (F) DIC, (G) pCO2, (H) pH, and (I) Ωar at station F3.
Though a seasonal maximum Chl a concentration of 28 μg L–1 was found in May in Figure 2C, greater concentrations were observed during other months too (Figure 3C). According to Nomura (1998), a Chl a concentration > 30 μg L–1 indicates the occurrence of red tide in Tokyo Bay, and such high concentrations were observed every year from 2011 to 2014, with the highest Chl a concentration (92 μg L–1) in June 2014. The observed Chl a concentrations were lower than 30 μg L–1 after 2015. The extent of DO oversaturation was extremely high (>150%) in the surface layers in 2012, 2013, and 2014. These observations along with the high Chl a concentrations suggest that the primary productivity was higher in the earlier years of the observation period (Figures 3C,D). On the contrary, a significant undersaturation of DO in surface water (<80%, down to 47%) was observed in July and August 2015, October 2016, and July 2017, indicating the mixing with waters affected by respiration at the bottom of F3 or somewhere in upstream regions. In October 2016, the low DO% in extremely low S water (S = 16.3) suggests that the respiratory processes took place near the river mouth and then advected to F3.
Bottom hypoxia (DO ≤ 61 μmol kg–1, DO% < 25%) was observed every summer. Anoxic conditions (DO = 0 μmol kg–1) were observed in the bottom layer in August 2013, July 2015, and August 2015, and at a depth of 16 m in July 2014 (Figure 3D). Not anoxia, but very low concentration of DO (<5.0 μmol kg–1, DO% < 2%) were observed in the bottom water in all other years. Although hypoxia and anoxia are induced by the stratification and decomposition of organic matter produced by primary production, the occurrence of anoxia at the bottom does not seem to be directly related to the strength of stratification (stronger in 2011 and 2016 by freshening; Figure 3B) or surface productivity (higher in 2011–2014 than 2015–2017; Figure 3C). This is likely because bottom anoxia was not a special event for 2013, 2014, and 2015, but almost occurs every year, and our observations happened to be made during a short anoxic period in 2013, 2014, and 2015. This is supported by the data of public water quality measurement near our study site (at 9 stations in the area of 35.46–35.53°N, 139.74–139.85°E; data can be downloaded from websites of Tokyo Metropolitan Government Bureau of Environment and Kanagawa prefecture Environment and Agriculture Bureau). The minimum DO values at or below detection limit [<0.5 mg L–1 (Tokyo) or 0.1 mg L–1 (Kanagawa)] were reported every summer at 1–4 of 9 stations, suggesting possible occurrence of localized anoxia. However, such low DO condition was not observed for two consecutive months at each station. These results suggest that anoxia in this region is not uncommon, but is a localized, short-term event. This is consistent with previous studies reporting that bottom DO in Tokyo Bay varies in a short period of time due to the wind-driven intrusion of offshore water (Fujiwara and Yamada, 2002; Sato et al., 2012). The intrusion of offshore water supplies oxygen and also moves hypoxic/anoxic water toward the coast and to the subsurface layer (Fujiwara and Yamada, 2002). This explains the observation of anoxic water at a depth of 16 m, not at the bottom in July 2014.
Interannual variations in TA and DIC are similar to that of S in the upper layer (Figures 3E, 4F). Especially low TA and DIC were observed in September 2011, April 2014, June 2014, and August 2016 when extreme freshening was observed. Although extreme freshening was also observed in October 2016, TA and DIC were relatively high. In the deeper layer, T shows relatively small interannual variability. The bottom DIC in summer is high in 2013, 2014, 2015, and 2017.
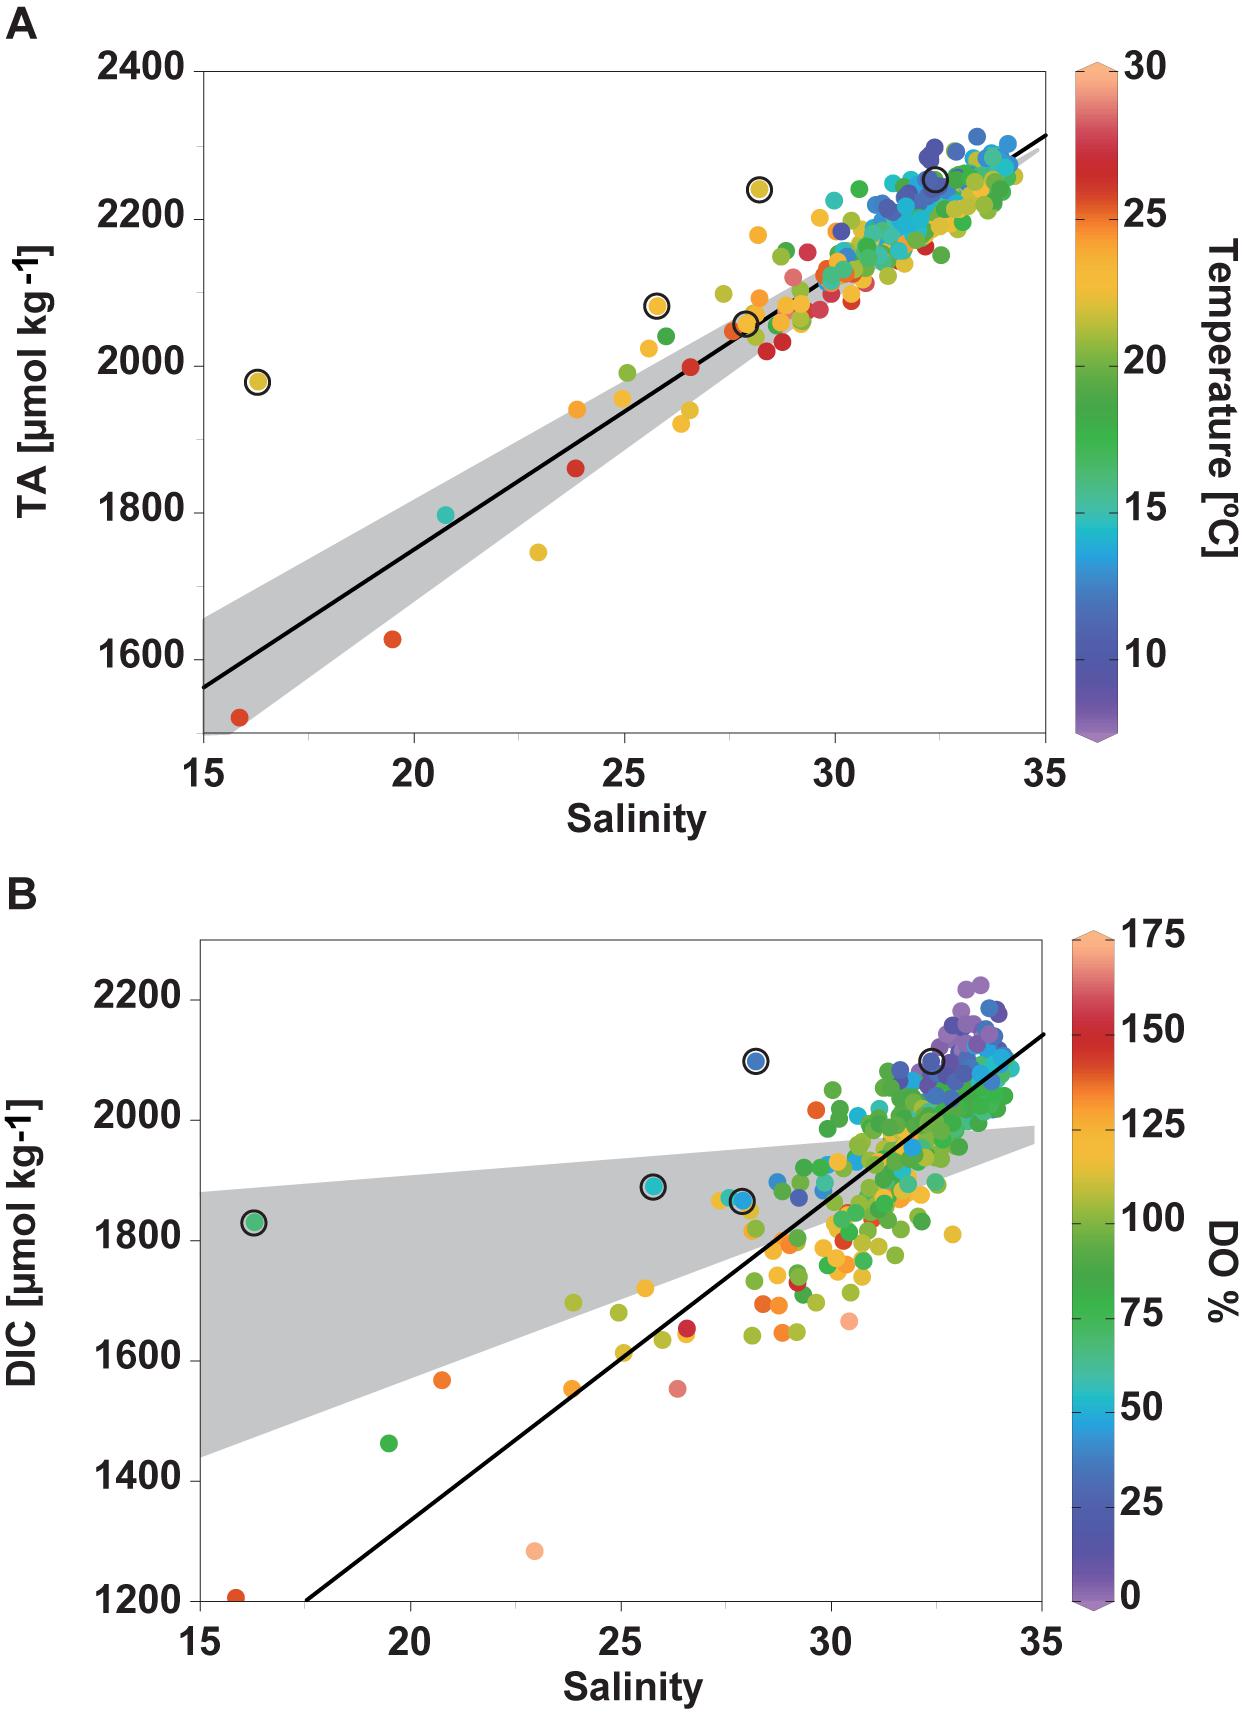
Figure 4. Relationships between (A) TA and S, colored by T, (B) DIC and S, colored by DO%. Black lines represent the least square linear fits of each plot. Gray area shows the mixing of offshore water (S = 34.82, TA = 2,293 μmol kg− 1, DIC = 1,960∼1,990 μmol kg− 1) with river water (S = 0, TA = 1,013 ± 156 μmol kg− 1, DIC = 1,047∼1,800 μmol kg− 1). Circled data points represent the observations of the water samples collected in October 2016.
Lower pCO2, higher pH and Ωar were observed in the summer surface waters during the first half of the observation period (Figures 3G–I). Extremely high pCO2 (>1,500 μatm), low pH (<7.5) and low Ωar (<1) were observed in the bottom layer in August 2013 and at a depth of 16 m in July 2014, when anoxic condition was also observed. This is the first record of aragonite undersaturation in Tokyo Bay. Although bottom anoxia was observed in July and August 2015, the carbonate parameters did not show extreme values and Ωar was higher than 1 (1.2 and 1.4, respectively). In November and December of 2014, high pCO2, low pH, and low Ωar were observed in the whole water column compared to other years. This should reflect the accumulation of large amounts of CO2 during the preceding summer in the layer below 10 m (Figure 3G), indicating that the properties of summer bottom water later affect the properties in winter. Another process causing interannual variation in the winter carbonate properties is winter photosynthesis (Shibata and Aruga, 1982; Nomura and Yoshida, 1997): relatively low pCO2, high pH and high Ωar were observed in the whole water column in January 2012 and February 2013 when Chl a was relatively high.
Processes Affecting Carbonate Chemistry in Tokyo Bay
Physical Processes Occurring With Air-Sea CO2 Equilibrium
In this section, the processes responsible for the seasonal and interannual variations in the carbonate parameters in Tokyo Bay are quantitatively discussed. As shown in Figure 4, both DIC and TA are linearly correlated with S, indicating the significant influence of mixing of offshore water (high in S, DIC, and TA) with freshwater (low in S, DIC, and TA). The TA and DIC values were higher than expected from S in October 2016 (circled data in Figure 4) when freshening was observed from the surface (S = 16.3) to a depth of 16 m (S = 28.2 at 16 m) in the water column. Although the reason is not completely understood, the low DO% (68% at the surface) suggests that this anomaly arises from the input of local freshwater input with especially high TA and DIC and local respiratory processes in the regions near the coast or the river mouth. Except for the data recorded in October 2016, TA correlated well with S and the regression line of TA is 37.61 (± 0.73) × S + 998.4 (± 23.1) (black line in Figure 4A, r = 0.94, n = 368), which is in good agreement with that obtained by Taguchi et al. (2009) for surface waters in 2008 (TA = 36.77 × S + 1,006, r = 0.99, n = 59), following a mixing line between offshore water [North Pacific Sub-Tropical Mode Water (NPSTW), S = 34.82, TA = 2293 μmol kg–1] and river water (S = 0, TA ∼1,000 μmol kg–1). This indicates that the waters in Tokyo Bay can be expressed as a mixture of these two components. Deviations from the regression line in the low-salinity waters may reflect the variations in TA in the river water and the contribution of precipitation (TA = 0). The correlation between DIC and S, except for data from October 2016, is expressed by DIC = 53.7 (± 1.7) × S + 261.5 (± 54.8) (black line in Figure 4B, r = 0.85, n = 367). Compared to the TA-S plot, there were more data scattering and deviations from the mixing line between the DIC values of offshore waters (DIC = 1,960–1,900 μmol kg–1 at S = 34.82 from Ishii et al., 2011) and river waters (1,047 ± 164 μmol kg–1 in the Tamagawa River and 1,499 ± 222 μmol kg–1 in the Arakawa River from May 2011 to April 2012, Kubo, 2015; ∼1,800 μmol kg–1 in the Tamagawa River in April 1993, Ogawa and Ogura, 1997) in the DIC-S plot. Water samples with high S and low DO% showed an elevated DIC, while surface waters with low S and high DO% showed a lower DIC than that expected from the mixing line, indicating the significant influence of photosynthesis and respiration on the DIC concentrations. The DIC should also have been affected by warming/cooling and air-sea gas exchanges.
To separately and quantitatively assess the effects of the physical processes on the carbonate parameters, we have assumed that the TA and DIC values were affected only by the physical processes, i.e., mixing with freshwater and warming/cooling. Under this assumption, the TA (TAphys) can be predicted from the S values assuming two end-member mixing of offshore water with river water (TAphys = 36.76 × S + 1,013). For the offshore waters, the S and TA values of Taguchi et al. (2009) were used (34.82 and 2293 μmol kg–1, respectively). This TA value was in agreement with that of Ishii et al. (2011), who reported a mean salinity-normalized TA of 2,305 μmol kg–1 at S = 35, corresponding to 2,293 μmol kg–1 at S = 34.82 in the Kuroshio region, southwest of Tokyo Bay. For the river water, a TA of 1,013 μmol kg–1, the mean of monthly observations of four major rivers (the Edogawa, Arakawa, Nakagawa, and Tamagawa rivers, ± 156 μmol kg–1, n = 42), was used (reported in the appendix of the 2018 annual report on water quality by the Bureau of Waterworks Tokyo Metropolitan Government)1. The DIC can be also predicted from the S and end-member DIC values. However, the mixing of river water with offshore water causes an oversaturation of pCO2 in the waters compared with the atmospheric pCO2. Accordingly, the DIC should decrease from the river mouth to the observation site by the outgassing of CO2, as observed in Tokyo Bay (Kubo et al., 2017) and other coastal regions (e.g., Zhao et al., 2020). Therefore, we used pCO2 instead of DIC, by assuming that pCO2 in the physics only case (pCO2phys) is at equilibrium with atmospheric pCO2 at TAphys and observed T and S conditions. For this calculation, the monthly mean dry air CO2 concentration (xCO2) observed at Mauna Loa (NOAA/PMEL) was converted to pCO2 at 100% humidity, standard air pressure, and the observed water T. Then, the DIC, pH and Ω of the waters, under the assumption that only physical processes are taking place, are calculated as:
where the function f refers to the CO2SYS thermodynamic equations, Tobs and Sobs are observed T and S. DICphys shows relatively large variability (ranging from 1,481 to 2,071 μmol kg–1) under the equilibration with atmospheric pCO2, reflecting significant effects of T, S, and TA on DIC (Figure 5A). Of these, the effect of T can be estimated by comparing DICphys with that calculated by replacing Tobs by mean T of 17.5°C. It is estimated that summer warming to 27°C decreases DIC by ∼70 μmol kg–1 and winter cooling to 11°C increases DIC by ∼50 μmol kg–1. This indicates that the large variability in DICphys is mostly caused by freshening (Figure 5A). Nevertheless, when compared to the observed seasonal and interannual variabilities in the carbonate parameters, those calculated for the physical processes with an air sea CO2 equilibrium were significantly lower (Figures 2F–I, 3F–I, 5A–D, note that the scales of the y-axis in Figures 5B,C are much smaller than those in Figures 2G,H, 3G,H). Figure 5C shows that the pHphys reflects seasonal variations and long-term trend of pCO2phys. In addition, it is apparent that the pHphys is affected by S. However, even under extreme freshening, the pHphys is lowered by only ∼0.03, suggesting that the effects of mixing of seawater with river water and warming/cooling on the pH are small after sufficient air–sea gas exchange has occurred, even in Tokyo Bay with large seasonal variability in T and S. Seasonal variation in the Ωphys values is relatively large (Figure 5D). In general, Ωphys values are high in the summer (∼2.8) and low in winter (∼1.8), and the data are positively correlated with T (r = 0.86), reflecting the effect of T on solubility of aragonite (Mucci, 1983). In addition, surface freshening lowers the Ωphys by ∼1 (for example, the difference between the Ωphys value at 0 m (S = 15.87) and that at 5 m (S = 29.82) in September 2011 is 1.3). Due to the combined effects of T and freshening, the lowest and second lowest Ωphys values (Ωphys = 1.3 and 1.4) were observed in the surface waters in April 2014 (S = 20.75, T = 15°C) and October 2016 (S = 16.3 and T = 22°C), respectively, not in the freshest but warm water in September 2011 (S = 15.9, T = 26°C, Ωphys = 1.6). In terms of interannual variability, freshwater mixing is the major factor affecting the Ωphys values since T has a small interannual variation (Figure 2A). These findings suggest that warming/cooling induces the seasonal variation in Ωphys, whereas fluctuations in freshwater mixing cause the interannual variations in the surface Ωphys in Tokyo Bay.
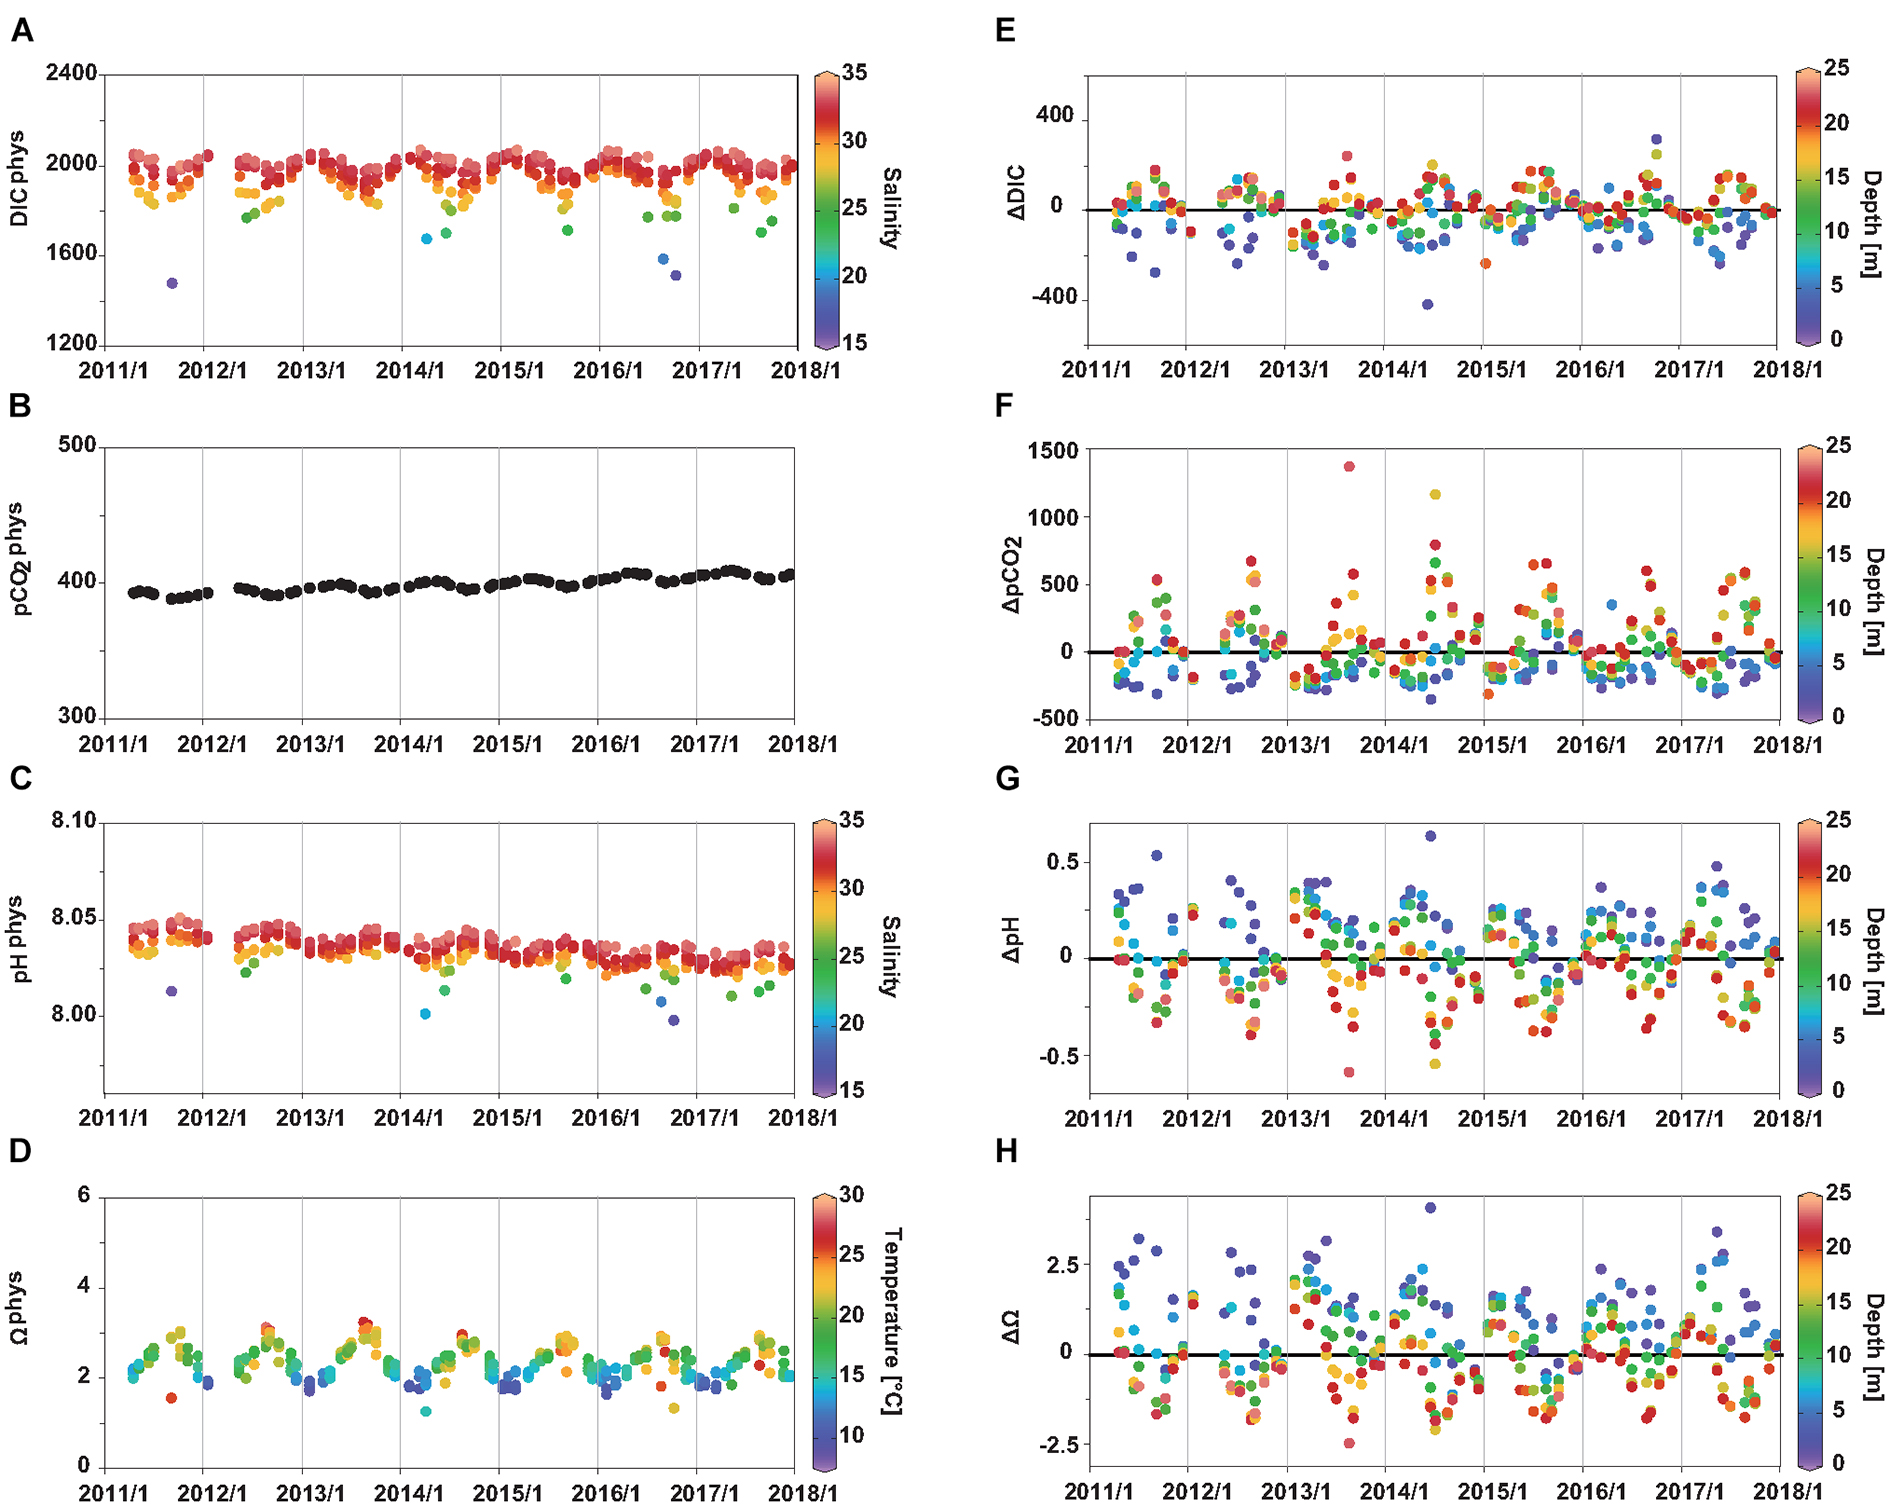
Figure 5. Seasonal and interannual variations in (A) pCO2phys, (B) pHphys, (C) Ωphys, (D) ΔpCO2, (E) ΔpH, and (F) ΔΩ at all observation depths. (B,C) are colored by S and T, respectively. (D–F) are colored by depth.
Other Processes
The net effect of processes other than physical processes on the carbonate parameters can be estimated by the differences between the observed values and those calculated under the physical processes only condition;
The other processes that affect the carbonate parameters include photosynthesis, remineralization, formation and dissolution of CaCO3, and air-sea CO2 disequilibrium. Uncertainties and fluctuations in the end-member TA values used to estimate the carbonate parameters for the physical processes-only case can affect the ΔDIC, ΔpCO2, ΔpH, and ΔΩar values (Δ values). The seasonal and interannual variations in the Δ values are similar to those in the observed carbonate parameters (Figures 2F–I, 3F–I, 5E–H), indicating the importance of non-physical processes in Tokyo Bay. The average net effects of these processes in the surface (bottom) waters are as follows: DIC = −76 ± 102 μmol kg–2 (+ 50 ± 73 μmol kg–2), pCO2 = −130 ± 127 μatm (+ 192 ± 283 μatm), pH = + 0.17 ± 0.17 (−0.12 ± 0.17), and Ωar = + 1.0 ± 0.9 (−0.4 ± 0.7). The relationships between carbonate parameters (ΔpCO2, ΔpH, and ΔΩar) and the DO% (Figure 6) indicate that photosynthesis and aerobic respiration are the major processes controlling the Δ values. In waters with high DO oversaturation, the effect of non-physical processes is high: maximum values (ΔpCO2: −345 μatm; ΔpH: + 0.6; ΔΩar: + 3.3) were observed in the water with the highest DO% (174%). Relatively low ΔpCO2 along with high ΔpH and ΔΩar values were observed in the surface waters during the first half of the observation period (Figure 5). These findings are consistent with the higher photosynthesis rate in the earlier years, as indicated by the higher Chl a concentration and DO% (Figures 3C,D).
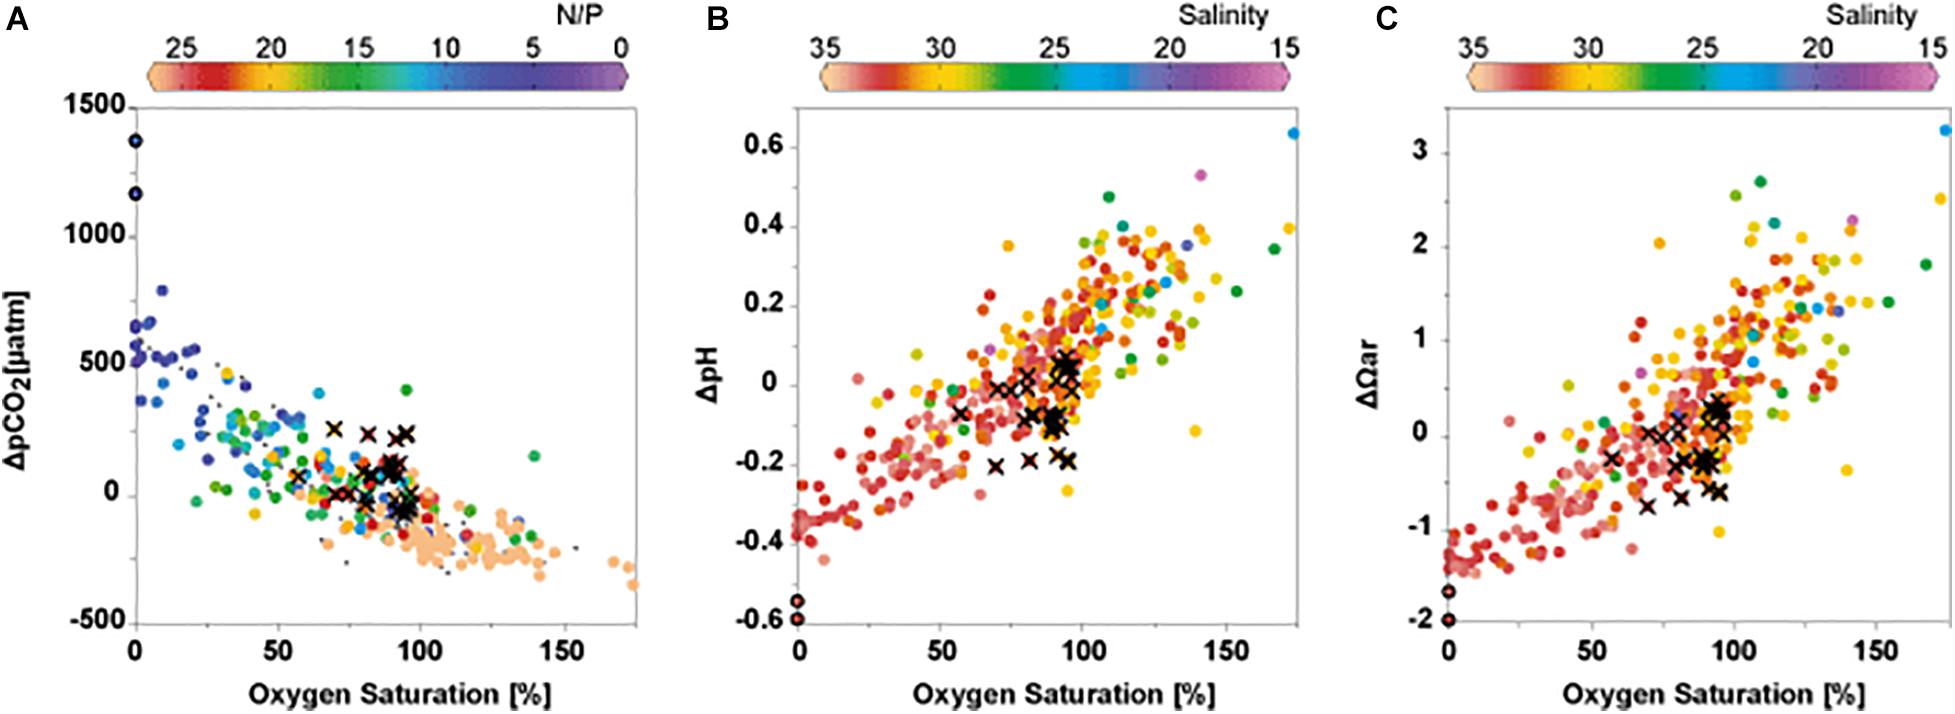
Figure 6. (A) ΔpCO2, (B) ΔpH, and (C) ΔΩ plotted against oxygen saturation %. Color indicates ratio of DIN (nitrate + nitrite + ammonia) over phosphate in (A), and S in (B,C). Gray dots are data after November 2015, when nutrient data are not available. Crosses represent data for samples collected in December. Black circles demonstrate the aragonite undersaturations and anoxic waters observed in August 2013 and July 2014.
During summer, high ΔpCO2 values (>1,000 μatm) were estimated for the anoxic and aragonite undersaturated bottom waters collected on 19 August, 2013 and 04 July, 2014 (Figure 5F). An increase in the pCO2 without a corresponding change in the DO level under anoxic conditions (Figure 6A) suggests the influence of anaerobic processes, such as denitrification and sulfate reduction in the sediment, which are followed by a DIC efflux to the overlying bottom water. Both denitrification and sulfate reduction are known to occur in the sediments of Tokyo Bay (Koike and Hattori, 1978; Nishio et al., 1982; Takii et al., 2002). Significant denitrification in the bottom waters is also expected to occur in summer (Koike, 1993). In our observations, relationship between dissolved inorganic nitrogen (DIN: nitrate + nitrite + ammonia) and dissolved inorganic phosphorous (phosphate) indicates effects of anaerobic processes. As shown in Figure 6, N/P ratio in low oxygen water is much lower than the Redfield ratio of 16 (Redfield et al., 1963), although surface water in the bay has much larger N/P ratio (Kubo et al., 2018). The low N/P ratio can be caused by denitrification (removal of DIN) and/or efflux of phosphate from anoxic sediments (Golterman, 2001). Low N/P values are found in low DO% waters overall, not only in anoxic waters (Figure 6). This indicates that anaerobic remineralization, not only in anoxic bottom waters but also in anoxic bottom sediments, influences bottom water properties in the region. The DIN deficit (DIN – P × 16) in summer hypoxic/anoxic bottom water (DO < 61 μmol kg–1 at 20 m in July, August, and September) was −24.0 μmol kg–1 (−38.4 ∼−9.0 μmol kg–1). If this deficit represent the removal of DIN by denitrification, DIC produced by denitrification is estimated to be 21.2 μmol kg–1 (8.0∼33.9 μmol kg–1; DIN deficit/(104 + 16) × 106; cf. Gruber and Sarmiento, 1997). Without this DIC, carbonate parameters in summer bottom water would change significantly: pCO2 decreases by 136 μatm while pH and Ωar increases by 0.06 and 0.18, respectively. However, given that DIN deficit can be caused by efflux of phosphate from sediments (Golterman, 2001) and that N/P ratios in Tokyo Bay without denitrification should be greater than 16 (Kubot et al., 2018), these estimates could be either underestimates or overestimates. Nevertheless, these results demonstrate the importance of anaerobic remineralization processes on carbonate parameters in Tokyo Bay.
Figures 3, 5 show that aerobic remineralization in the water and sediments increases pCO2 to as high as > 1,500 μatm and ΔpCO2 as high as > 1,000 μatm (Figure 5), leading to sporadic aragonite undersaturation in the bottom waters. Notably, aragonite undersaturation and anoxia were observed at a depth of 16 m, and not in the bottom waters (22 m) in July 2014. The higher Ωar and DO values in the waters above and below 16 m imply that the aragonite undersaturation and anoxia were not developed in situ at station F3, but they initially occurred in the surrounding areas and then advected to station F3. Such advection of low DO water has been reported as a subsurface hypoxic water mass in a previous study focused on Tokyo Bay (Fujiwara and Yamada, 2002). In July and August 2015, when bottom anoxia was also observed, the Ωar values were greater than 1. It seems that ΔDIC in these waters were relatively high (∼175 μmol kg–2) but were not enough to cause aragonite undersaturation. As ΔDIC should reflect total amount of organic matter remineralized through both aerobic and anaerobic oxidation, anoxic water does not necessarily always accompany aragonite undersaturation.
The scatter in Figure 6 reflect the effects of non-physical processes other than photosynthesis and respiration on the carbonate parameters. For example, the waters collected in December tended to have higher ΔpCO2 and lower ΔpH and ΔΩar values than those that were expected from the DO% (Figure 6), possibly due to the occurrence of an air–sea CO2 disequilibrium after vertical mixing. Vertical mixing during fall/winter brings CO2-enriched and DO-depleted bottom water to the surface. An air–sea gas exchange changes the properties to attain a DO% = 100% and Δ = 0. However, as compared to the DO exchange rate, the CO2 exchange rate is considerably lower (e.g., Zeebe and Wolf-Gladrow, 2001), which causes deviations from the expected carbonate parameters, as observed in the data for waters collected in December (Figure 6). The large extent of scattering for the low-salinity waters in the ΔpH-DO% and ΔΩar-DO% plots may also reflect differences in gas exchange rate between the oxygen and CO2. Variability in the TA of freshwater end-members is another possible reason for the scattering. Furthermore, the dissolution of CaCO3 has been suggested by the high TA relative to the S values in low-Ω bottom waters of some coastal regions (e.g., Cross et al., 2013; Wang et al., 2017). In Tokyo Bay, elevated TA values were observed (Figure 4A) in cold waters during winter, and not in the low-Ωar bottom waters during the summer. This elevation from the regression line in Figure 4A was observed every year, by an average of 24 μmol kg–1 (n = 65) and up to 81 μmol kg–1 for waters at T < 13°C. Since the Ωar values of these waters are high (2.8 ± 0.5) and that sedimentary dissolution of CaCO3 is a slow process (time required for complete dissolution of available aragonite solid is 20,000 days at Ω = 0.5, Cross et al., 2013), the elevated TA values are probably not caused by CaCO3 dissolution. An increase in the TA during winter is not evident in offshore subtropical source water (Ishii et al., 2011) and in river water (Bureau of Waterworks Tokyo Metropolitan Government). Since surface water at higher latitudes tends to have higher TA at the same salinity level (Takatani et al., 2014), the observed increase in TA could be explained if water of northern-origin flows into Tokyo Bay every winter. However, to the best of the authors’ knowledge, this has not been reported. Particulate and dissolved organic matter (POM and DOM) are known to affect the TA of coastal water samples (Cai et al., 1998; Kim et al., 2006; Hernández-Ayon et al., 2007; Kim and Lee, 2009). However, the POM and DOM concentrations observed at our study sites are high in summer and low in winter (Kubo et al., 2015, 2017). Therefore, the elevated TA during winter cannot be explained by the organic contributions. Anaerobic remineralization processes such as denitrification and sulfate reduction can also increase the TA (Hu and Cai, 2011; Krumins et al., 2013). Although increase in TA was not evident in the hypoxic/anoxic summer bottom water, sediment denitrification can be stimulated in winter by supplying O2 to promote nitrification or NO3 itself into nitrate-limited sediment (Bonaglia et al., 2014). Quantitative analysis of the TA efflux from the sediment may clarify the reason for the TA elevation in winter waters and its importance in the carbonate system of Tokyo Bay.
Future Progress of Ocean Acidification
In this section, the future changes in the pH and Ωar values of surface and bottom waters at station F3 are estimated. As per the report by Yamamoto-Kawai et al. (2015), the future DIC values are calculated as DIC = DICEQ + ΔDIC, where DICEQ is the DIC of the water that is in equilibrium with atmospheric CO2, and ΔDIC represents an air–sea disequilibrium caused by an insufficient air–sea gas exchange, biological activities, etc. Using the CO2SYS program, the mean DICEQ of the study period with atmospheric xCO2 of 400 ppm is estimated from the monthly mean Tobs, Sobs, and TAphys. Then, ΔDIC is calculated by subtracting DICEQ from the monthly mean of the observed DIC. This is similar to the calculations for the carbonate parameters in the physical processes-only case and the Δ values, with the only difference being that monthly mean values were used instead of each individual observation. Under the assumption that the ΔDIC remains unchanged over time, ΔDIC is added to DICEQ estimated for the water under future xCO2 conditions. Future changes in the pH and Ωar were then estimated using the derived DIC along with Tobs, Sobs, and TAphys values.
Figure 7 shows changes in pH and Ωar with increasing atmospheric xCO2. It is predicted that in future, the decrease in the pH of surface waters will be larger in winter than that in summer (Figure 7C). In contrast, the decrease in the pH of bottom waters will be larger in summer than that in winter, due to the lower buffer capacity of waters with higher pCO2. Aragonite undersaturation in bottom waters will be a common event in August when the atmospheric xCO2 values reach 500 ppm (in the year 2043 and 2057 in RCP 8.5 and RCP6.0 scenario, respectively). When the atmospheric xCO2 is 700 ppm (in the year 2073 in RCP8.5, after the end of this century in RCP6.0), aragonite undersaturation in the bottom waters lasts for ∼3 months from July to September (Figure 7B).
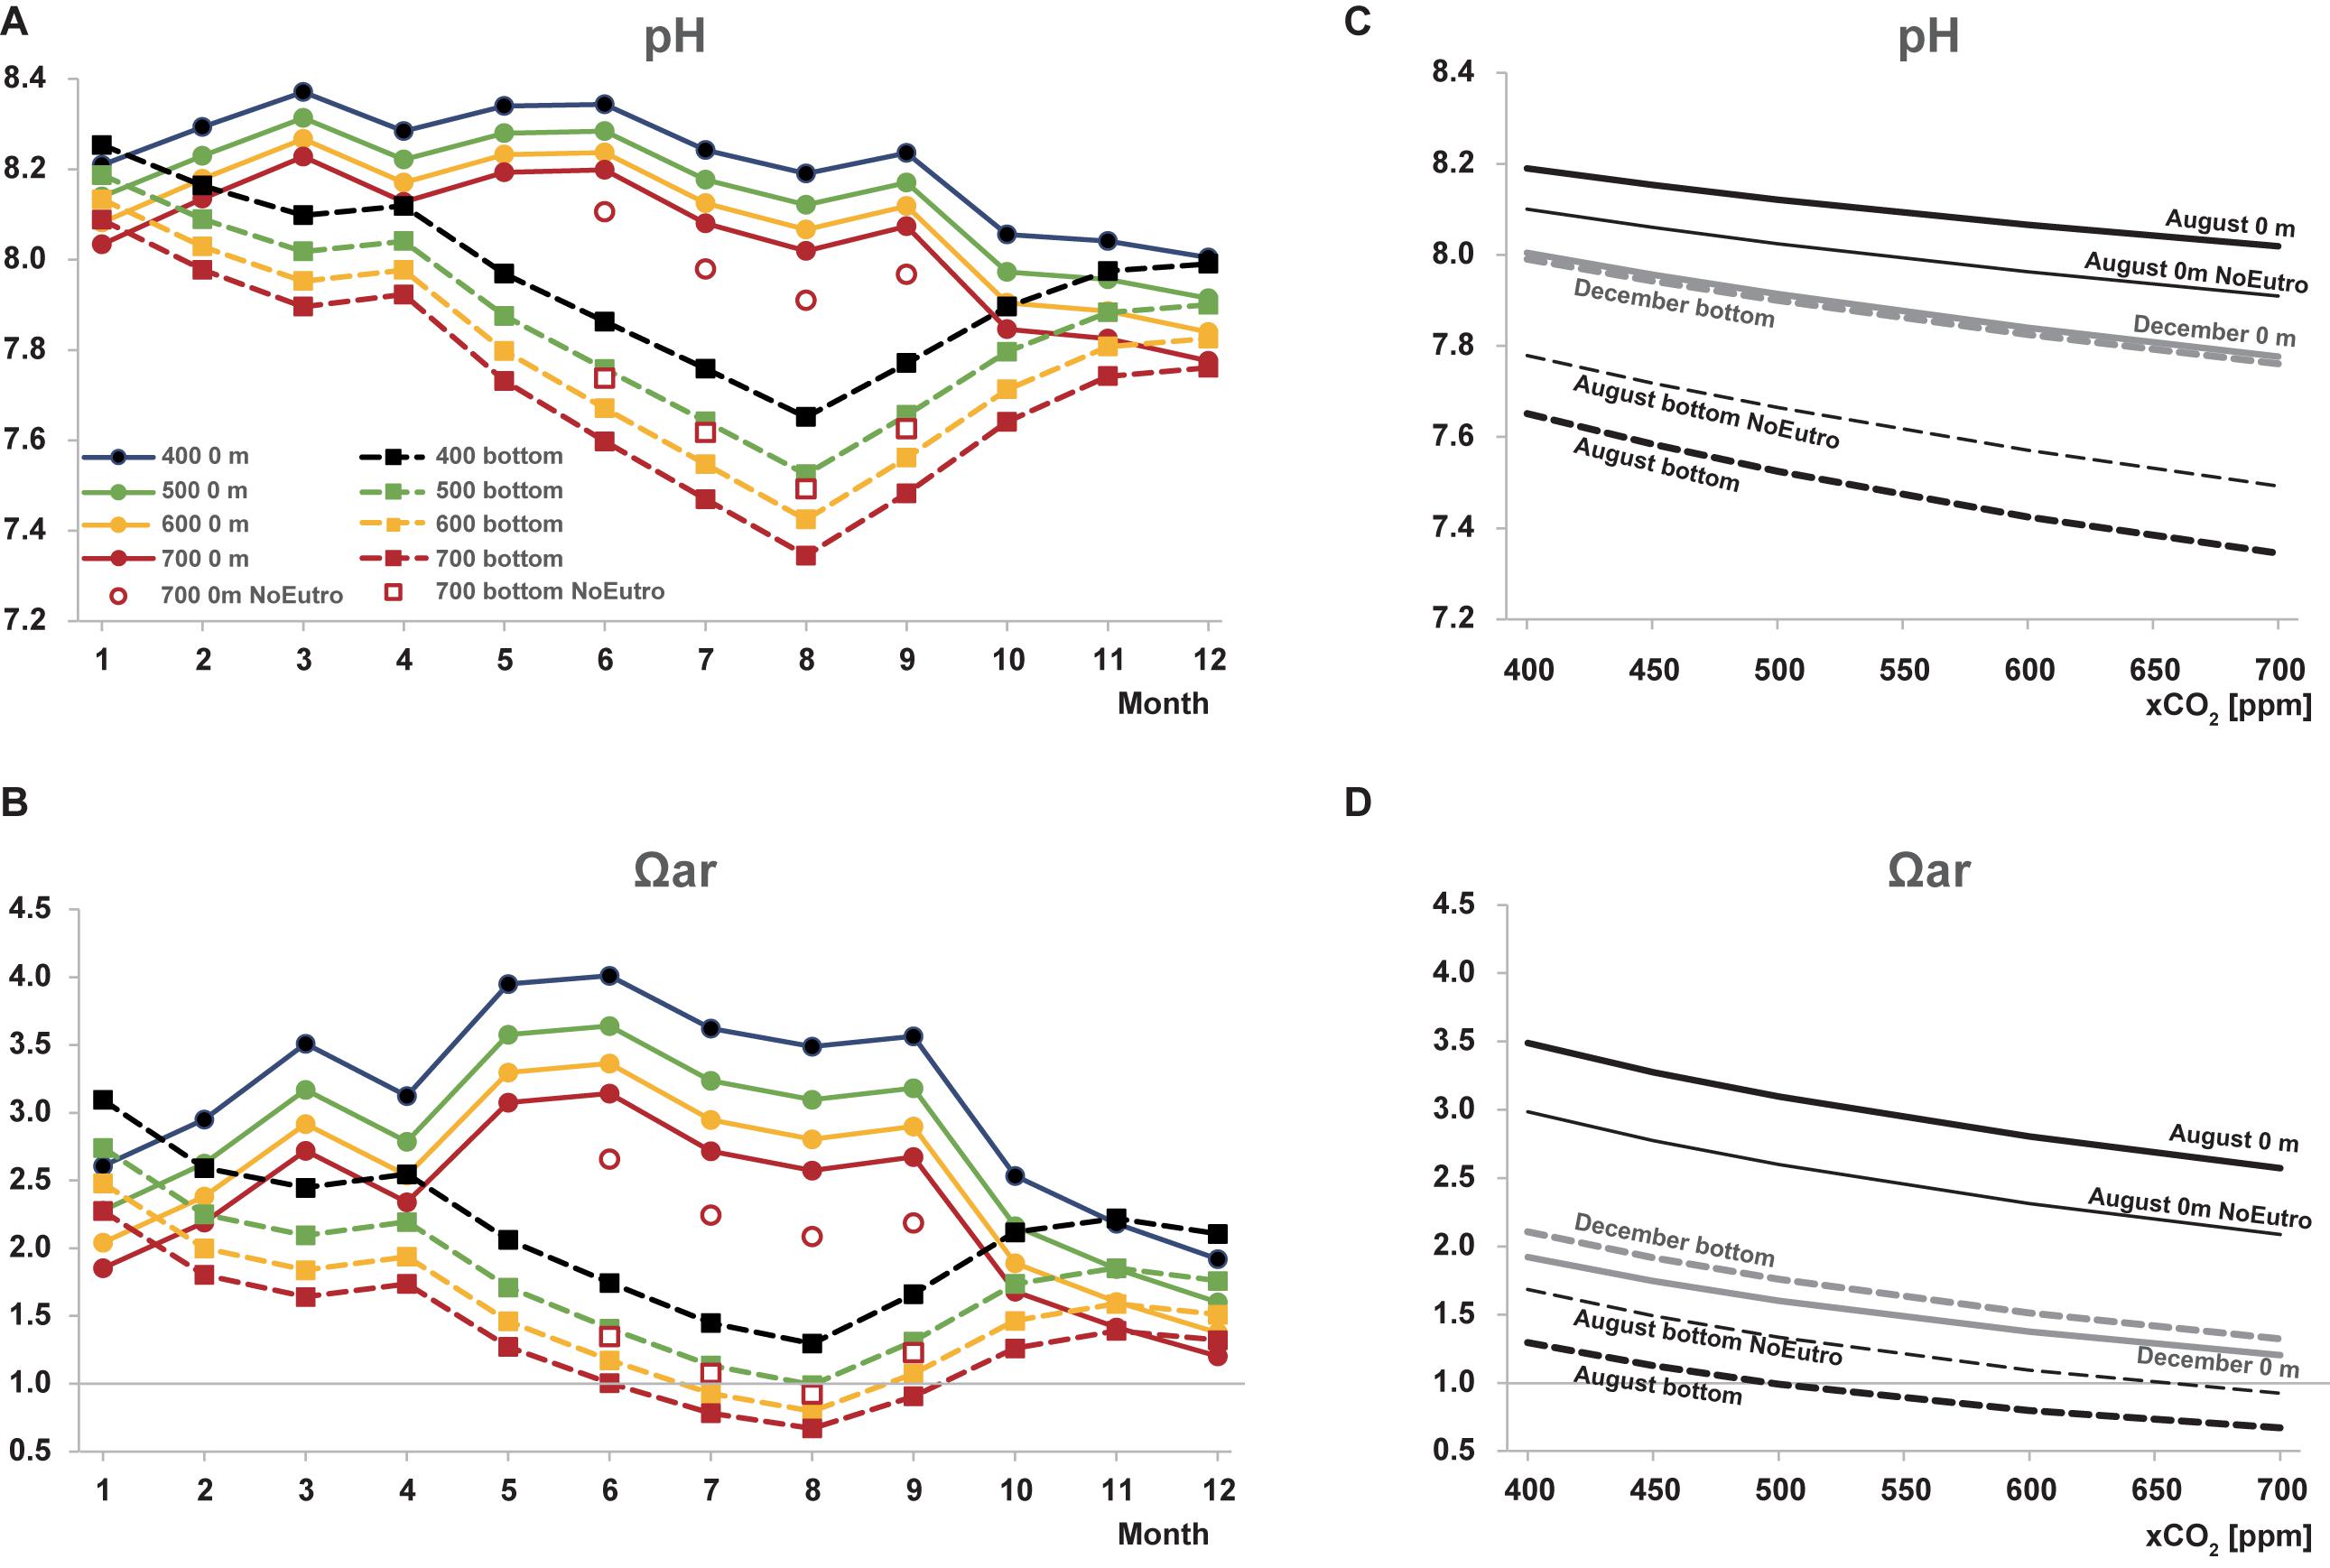
Figure 7. Predicted changes in (A,C) pH and (B,D) Ωar in the surface (solid lines) and the bottom (dashed lines) waters with increasing atmospheric xCO2. (A,B) Show seasonal variations. (C) indicate future progress of ocean acidification in August (black lines) and December (gray lines). aso shoof the surface water, (B) pH of the bottom water, (C) Ωar in the surface water, and (D) Ωar in the bottom water in August (blue lines) and December (orange lines)estimated pH and Ωar values in the absence of eutrophication are indicated as open symbols (A,B) or thin lines (C,D).
Yamamoto-Kawai et al. (2015) have estimated that since 1950/1960s, eutrophication has increased the summer bottom water DIC by 46 μmol kg–1 and decreased summer surface water DIC by 46 μmol kg–1. When we remove these changes in DIC in the calculation of future pH and Ωar for summer months (from June to September), results change significantly (Figure 7). Under the atmospheric xCO2 of 700 ppm, removal of eutrophication effect decreases pH by ∼0.10 and Ωar by ∼0.48 in the surface water (red filled circles and red open squares). In the bottom water, the pH and Ωar values increase by ∼0.14 and 0.30, respectively (red filled squares and red open squares) And aragonite undersaturation occurs only in August. In addition, in the absence of eutrophication, the rate of decrease in pH (for every 100 ppm increase in xCO2) is reduced from 0.076 to 0.067 in December and from 0.102 to 0.096 in August (mean rate for xCO2 range from 400 to 700 ppm; Figure 7). The mean Ωar in August becomes < 1 when the xCO2 value reaches 650 ppm (in the year 2067 and 2095 in the RCP 8.5 and 6.0 scenarios, respectively), indicating that de-eutrophication can postpone the timing of bottom aragonite undersaturation by 24 and 38 years, RCP 8.5 and RCP6.0 scenarios, respectively. Nevertheless, de-eutrophication should be accompanied with an effort to maintain low atmospheric xCO2 values (below 650 ppm) to ensure that the water in Tokyo Bay is oversaturated with respect to aragonite throughout the year.
Summary and Conclusion
Seven years of observations have revealed the seasonal and interannual variations in the carbonate parameters and the processes affecting the carbonate system in Tokyo Bay. In the surface layer, the Ωar increases by ∼1.0 from winter to summer because of warming. The sporadic extreme freshening caused by river water input lowers the Ωar by ∼1.0. These physical processes do not cause large variations in pCO2 and pH when a CO2 equilibrium is achieved by an air-sea gas exchange. In contrast, the active photosynthetic processes in this highly eutrophic bay significantly impact the carbonate parameters. Surface water was undersaturated with respect to atmospheric CO2 for most months, making the bay a strong CO2 sink (Kubo et al., 2017). Quantitative evaluation shows that photosynthesis, together with other non-physical processes, decreases the pCO2 in surface waters by up to 345 μatm, causing both the pH and Ωar of surface waters to increase by up to 0.6 and 3.3, respectively. In the bottom layer, remineralization is the major process controlling the carbonate parameters. Aragonite undersaturation was observed twice during the study period in anoxic waters. The relationship between pCO2 and DO% suggests that anaerobic remineralization under anoxic conditions lowered the Ωar value, causing undersaturation. This suggests that anoxic conditions can enhance ocean acidification at bottom water which can be critical to the benthic marine organisms. In addition, advection of the anoxic and aragonite undersaturated seawater to the upper water column can be detrimental to the planktonic organisms in Tokyo Bay.
If the concentration of atmospheric CO2 continues to increase, aragonite undersaturation of the summer bottom water will be a common event in the Tokyo Bay in the near future. De-eutrophication, resulting from pollution control, can decelerate ocean acidification and postpone the occurrence of prolonged aragonite undersaturation in the bottom waters. De-eutrophication will also improve the oxygen conditions in summer bottom waters, thereby suppressing anoxic remineralization and sporadic aragonite undersaturation. However, if atmospheric CO2 exceeds 650 ppm, aragonite undersaturation will be a common feature in the summer bottom waters, even if hypoxia/anoxia are alleviated by de-eutrophication.
Data Availability Statement
The raw data supporting the conclusions of this article will be made available by the authors, without undue reservation.
Author Contributions
MY-K and HK contributed the concept and design of the study. JK, MY-K, and SI collected the samples during field samplings and analyzed the samples. MY-K drafted the manuscript. All authors contributed to the manuscript revision, read, and approved the submitted version.
Conflict of Interest
The authors declare that the research was conducted in the absence of any commercial or financial relationships that could be construed as a potential conflict of interest.
Acknowledgments
We thank the crews of the R/V Seiyo-maru as well as the many participants in the sampling cruises. We also thank Dr. Atsushi Kubo for providing us with the nutrient data. We are grateful to the Fleet Management Office at the Tokyo University of Marine Science and Technology for their assistance in coordinating the observations.
Footnotes
References
Bednaršek, N., Harvey, C. J., Kaplan, I. C., Feely, R. A., and Možina, J. (2016). Pteropods on the edge: cumulative effects of ocean acidification, warming, and deoxygenation. Prog. Oceanogr. 145, 1–24. doi: 10.1016/j.pocean.2016.04.002
Bonaglia, S., Deutsch, B., Bartoli, M., Marchant, H. K., and Brüchert, V. (2014). Seasonal oxygen, nitrogen and phosphorus benthic cycling along an impacted Baltic Sea estuary: regulation and spatial patterns. Biogeochemistry 119, 139–160. doi: 10.1007/s10533-014-9953-6
Breitburg, D., Levin, L. A., Oschlies, A., Grégoire, M., Chavez, F. P., Conley, D. J., et al. (2018). Declining oxygen in the global ocean and coastal waters. Science 359:eaam7240.
Cai, W. J., Hu, X., Huang, W. J., Murrell, M. C., Lehrter, J. C., Lohrenz, S. E., et al. (2011). Acidification of subsurface coastal waters enhanced by eutrophication. Nat. Geosci. 4, 766–770. doi: 10.1038/ngeo1297
Cai, W.-J., Wang, Y., and Hodson, R. E. (1998). Acid-base properties of dissolved organic matter in the estuarine waters of Georgia, USA. Geochimica et Cosmochimica Acta 62, 473–483. doi: 10.1016/s0016-7037(97)00363-3
Costanza, R., d’Arge, R., De Groot, R., Farber, S., Grasso, M., Hannon, B., et al. (1997). The value of the world’s ecosystem services and natural capital. Nature 387, 253–260.
Cross, J. N., Mathis, J. T., Bates, N. R., and Byrne, R. H. (2013). Conservative and non-conservative variations of total alkalinity on the southeastern Bering Sea shelf. Mar. Chem. 154, 100–112. doi: 10.1016/j.marchem.2013.05.012
Dickson, A. G. (1990). Thermodynamics of the dissociation of boric acid in synthetic seawater from 273.15 to 318.15 K. Deep Sea Res. A. Oceanogr. Res. Papers 37, 755–766. doi: 10.1016/0198-0149(90)90004-f
Dickson, A. G., Sabine, C. L., and Christian, J. R. (2007). Guide to Best Practices for Ocean CO2 Measurements. British Columbia: North Pacific Marine Science Organization.
Dickson, A. G., and Millero, F. J. (1987). A comparison of the equilibrium constants for the dissociation of carbonic acid in seawater media. Deep Sea Res. A. Oceanogr. Res. Papers 34, 1733–1743. doi: 10.1016/0198-0149(87)90021-5
Doney, S. C., Busch, D. S., Cooley, S. R., and Kroeker, K. J. (2020). The impacts of ocean acidification on marine ecosystems and reliant human communities. Annu. Rev. Environ. Resour. 45, 83–112. doi: 10.1146/annurev-environ-012320-083019
Duarte, C. M., Hendriks, I. E., Moore, T. S., Olsen, Y. S., Steckbauer, A., Ramajo, L., et al. (2013). Is ocean acidification an open-ocean syndrome? understanding anthropogenic impacts on seawater pH. Estuaries Coasts 36, 221–236. doi: 10.1007/s12237-013-9594-3
Feely, R. A., Okazaki, R. R., Cai, W. J., Bednaršek, N., Alin, S. R., Byrne, R. H., et al. (2018). The combined effects of acidification and hypoxia on pH and aragonite saturation in the coastal waters of the California current ecosystem and the northern Gulf of Mexico. Continental Shelf Res. 152, 50–60. doi: 10.1016/j.csr.2017.11.002
Field, C. B., Barros, V., Stocker, T. F., Dahe, Q., Mach, K. J., Plattner, G.-K., et al. (2011). IPCC Workshop on Impacts of Ocean Acidification on Marine Biology and Ecosystems. US: Carnegie Institution, Stanford.
Fujiwara, T., and Yamada, Y. (2002). Inflow of oceanic water into Tokyo Bay and generation of a subsurface hypoxic water mass. J. Geophys. Res. Oceans 107, 13–11.
Furukawa, K., and Okada, T. (2006). “Tokyo Bay: its environmental status—past, present, and future,” in The Environment in Asia Pacific Harbours, ed. E. Wolanski (Dordrecht: Springer), 15–34. doi: 10.1007/1-4020-3655-8_2
Gao, K., Beardall, J., Häder, D. P., Hall-Spencer, J. M., Gao, G., and Hutchins, D. A. (2019). Effects of ocean acidification on marine photosynthetic organisms under the concurrent influences of warming, UV radiation and deoxygenation. Front. Mar. Sci. 6:322.
Gobler, C. J., and Baumann, H. (2016). Hypoxia and acidification in ocean ecosystems: coupled dynamics and effects on marine life. Biol. Lett. 12:20150976. doi: 10.1098/rsbl.2015.0976
Gruber, N., and Sarmiento, J. L. (1997). Global patterns of marine nitrogen fixation and denitrification. Global Biogeochem. Cycles 11, 235–266. doi: 10.1029/97gb00077
Hall-Spencer, J. M., and Harvey, B. P. (2019). Ocean acidification impacts on coastal ecosystem services due to habitat degradation. Emerg. Top. Life Sci. 3, 197–206. doi: 10.1042/etls20180117
Hancock, J. R., and Place, S. P. (2016). Impact of ocean acidification on the hypoxia tolerance of the woolly sculpin, Clinocottus analis. Conserv. Physiol. 4:cow040. doi: 10.1093/conphys/cow040
Harvey, B. P., Gwynn-Jones, D., and Moore, P. J. (2013). Meta-analysis reveals complex marine biological responses to the interactive effects of ocean acidification and warming. Ecol. Evol. 3, 1016–1030. doi: 10.1002/ece3.516
Hendriks, I. E., Duarte, C. M., and Álvarez, M. (2010). Vulnerability of marine biodiversity to ocean acidification: a meta-analysis. Estuar. Coast. Shelf Sci. 86, 157–164. doi: 10.1016/j.ecss.2009.11.022
Heuer, R. M., and Grosell, M. (2014). Physiological impacts of elevated carbon dioxide and ocean acidification on fish. Am. J. Physiol. Regul. Integr. Comp. Physiol. 307, R1061–R1084.
Hu, X., and Cai, W. J. (2011). An assessment of ocean margin anaerobic processes on oceanic alkalinity budget. Global Biogeochem. Cycles 25. doi: 10.1007/978-3-662-05127-6_10
Hu, X., and Cai, W. J. (2013). Estuarine acidification and minimum buffer zone—a conceptual study. Geophys. Res. Lett. 40, 5176–5181. doi: 10.1002/grl.51000
Hönisch, B., Ridgwell, A., Schmidt, D. N., Thomas, E., Gibbs, S. J., Sluijs, A., et al. (2012). The geological record of ocean acidification. Science 335, 1058–1063.
IPCC (2014). “Climate change 2014: synthesis report,” in Contribution of Working Groups I, II and III to the Fifth Assessment Report of the Intergovernmental Panel on Climate Change, Core Writing Team, eds R. K. Pachauri and L. A. Meyer (Geneva: IPCC).
Ishii, M., Hasegawa, K., and Kakino, J. (2008). Long-term fluctuations of the water quality in Tokyo Bay judged from a data set of Chiba prefecture. Bull. Jpn. Soc. Fish. Oceanogr. 72, 189–199. doi: 10.1007/bf02489226
Ishii, M., Kosugi, N., Sasano, D., Saito, S., Midorikawa, T., and Inoue, H. Y. (2011). Ocean acidification off the south coast of Japan: a result from time series observations of CO2 parameters from 1994 to 2008. J. Geophys. Res. Oceans 116. doi: 10.1029/2010JC006831
Ishizu, M., Miyazawa, Y., Tsunoda, T., and Ono, T. (2019). Long-term trends in pH in Japanese coastal seawater. Biogeosciences 16, 4747–4763. doi: 10.5194/bg-16-4747-2019
Kanda, J., Chomthaison, P., Horimoto, N., Yamaguchi, Y., and Ishimaru, T. (2008). Time-series variations in nutrient concentrations at two monitoring stations in Tokyo Bay. J. Jpn. Soc. Water Environ. 31, 559–564. doi: 10.2965/jswe.31.559
Kim, H. C., Lee, K., and Choi, W. (2006). Contribution of phytoplankton and bacterial cells to the measured alkalinity of seawater. Limnol. Oceanogr. 51, 331–338. doi: 10.4319/lo.2006.51.1.0331
Kim, H. C., and Lee, K. (2009). Significant contribution of dissolved organic matter to seawater alkalinity. Geophys. Res. Lett. 36:L20603.
Kodama, K., and Horiguchi, T. (2011). Effects of hypoxia on benthic organisms in Tokyo Bay, Japan: a review. Mar. Pollut. Bull. 63, 215–220. doi: 10.1016/j.marpolbul.2011.04.022
Koike, I., and Hattori, A. (1978). Denitrification and ammonia formation in anaerobic coastal sediments. Appl. Environ. Microbiol. 35, 278–282. doi: 10.1128/aem.35.2.278-282.1978
Kroeker, K. J., Kordas, R. L., Crim, R. N., and Singh, G. G. (2010). Meta-analysis reveals negative yet variable effects of ocean acidification on marine organisms. Ecol. Lett. 13, 1419–1434. doi: 10.1111/j.1461-0248.2010.01518.x
Kroeker, K. J., Kordas, R. L., Crim, R., Hendriks, I. E., Ramajo, L., Singh, G. S., et al. (2013). Impacts of ocean acidification on marine organisms: quantifying sensitivities and interaction with warming. Global Change Biol. 19, 1884–1896. doi: 10.1111/gcb.12179
Krumins, V., Gehlen, M., Arndt, S., Van Cappellen, P., and Regnier, P. (2013). Dissolved inorganic carbon and alkalinity fluxes from coastal marine sediments: model estimates for different shelf environments and sensitivity to global change. Biogeosciences 10, 371–398. doi: 10.5194/bg-10-371-2013
Kubo, A. (2015). Carbon Cycling in Tokyo Bay. [dissertation], Tokyo University of Marine Science and Technology, Japan.
Kubo, A., Hashihama, F., Kanda, J., Horimoto-Miyazaki, N., and Ishimaru, T. (2019). Long-term variability of nutrient and dissolved organic matter concentrations in Tokyo Bay between 1989 and 2015. Limnol. Oceanogr. 64, S209–S222.
Kubo, A., Maeda, Y., and Kanda, J. (2017). A significant net sink for CO2 in Tokyo Bay. Sci. Rep. 7:44355.
Kubo, A., Yamamoto-Kawai, M., and Kanda, J. (2015). Seasonal variations in concentration and lability of dissolved organic carbon in Tokyo Bay. Biogeosciences 12:269. doi: 10.5194/bg-12-269-2015
Kubo, A., and Kanda, J. (2017). Seasonal variations and sources of sedimentary organic carbon in Tokyo Bay. Mar. Pollut. Bull. 114, 637–643. doi: 10.1016/j.marpolbul.2016.10.030
Laurent, A., Fennel, K., Cai, W. J., Huang, W. J., Barbero, L., and Wanninkhof, R. (2017). Eutrophication-induced acidification of coastal waters in the northern Gulf of Mexico: insights into origin and processes from a coupled physical-biogeochemical model. Geophys. Res. Lett. 44, 946–956. doi: 10.1002/2016gl071881
Lewis, E. R., and Wallace, D. W. R. (1998). Program Developed for CO2 System Calculations (No. cdiac: CDIAC-105). U.S: Department of Energy Office of Scientific and Technical Information.
Hernández-Ayon, M. J., Zirino, A., Dickson, A. G., Camiro-Vargas, T., and Valenzuela-Espinoza, E. (2007). Estimating the contribution of organic bases from microalgae to the titration alkalinity in coastal seawaters. Limnol. Oceanogr. Methods 5, 225–232. doi: 10.4319/lom.2007.5.225
McNeil, B. I., and Matear, R. J. (2008). Southern Ocean acidification: a tipping point at 450-ppm atmospheric CO2. Proc. Natl. Acad. Sci. U.S.A. 105, 18860–18864. doi: 10.1073/pnas.0806318105
Mehrbach, C., Culberson, C. H., Hawley, J. E., and Pytkowicx, R. M. (1973). Measurement of the apparent dissociation constants of carbonic acid in seawater at atmospheric pressure 1. Limnol. Oceanogr. 18, 897–907. doi: 10.4319/lo.1973.18.6.0897
Miller, S. H., Breitburg, D. L., Burrell, R. B., and Keppel, A. G. (2016). Acidification increases sensitivity to hypoxia in important forage fishes. Mar. Ecol. Prog. Ser. 549, 1–8. doi: 10.3354/meps11695
Mucci (1983). The solubility of calcite and aragonite in seawater at various salinities, temperatures, and one atmosphere total pressure. Am. J. Sci. 283, 780–799. doi: 10.2475/ajs.283.7.780
Nishio, T., Koike, I., and Hattori, A. (1982). Denitrification, nitrate reduction, and oxygen consumption in coastal and estuarine sediments. Appl. Environ. Microbiol. 43, 648–653. doi: 10.1128/aem.43.3.648-653.1982
Nomura, H. (1998). Changes in red tide events and phytoplankton community composition in Tokyo Bay from the histrorical plankton records in a period between 1907 and 1997. Umi no Kenkyu 7, 159–178. doi: 10.5928/kaiyou.7.159
Nomura, H., and Yoshida, M. (1997). Recent occurrence of phytoplankton in the hyper-eutrophicated inlet, Tokyo Bay, central Japan. La Mer 35, 107–121.
Ogawa, N., and Ogura, N. (1997). Dynamics of particulate organic matter in the Tamagawa Estuary and inner Tokyo Bay. Estuar. Coast. Shelf Sci. 44, 263–273. doi: 10.1006/ecss.1996.0118
Okada, T., Nakayama, K., Takao, T., and Furukawa, K. (2011). Influence of freshwater input and bay reclamation on long-term changes in seawater residence times in Tokyo Bay, Japan. Hydrol. Process. 25, 2694–2702. doi: 10.1002/hyp.8010
Pacella, S. R., Brown, C. A., Waldbusser, G. G., Labiosa, R. G., and Hales, B. (2018). Seagrass habitat metabolism increases short-term extremes and long-term offset of CO2 under future ocean acidification. Proc. Natl. Acad. Sci. U.S.A. 115, 3870–3875. doi: 10.1073/pnas.1703445115
Palacios, S. L., and Zimmerman, R. C. (2007). Response of eelgrass Zostera marina to CO2 enrichment: possible impacts of climate change and potential for remediation of coastal habitats. Mar. Ecol. Prog. Ser. 344, 1–13. doi: 10.3354/meps07084
Rheuban, J. E., Doney, S. C., McCorkle, D. C., and Jakuba, R. W. (2019). Quantifying the effects of nutrient enrichment and freshwater mixing on coastal ocean acidification. J. Geophys. Res. Oceans 124, 9085–9100. doi: 10.1029/2019jc015556
Royal Society (2005). Ocean Acidification Due to Increasing Atmospheric Carbon Dioxide. London: The Royal Society.
Salisbury, J., Green, M., Hunt, C., and Campbell, J. (2008). Coastal acidification by rivers: a threat to shellfish? Eos Trans. Am. Geophys. Union 89, 513–513. doi: 10.1029/2008eo500001
Sato, C., Nakayama, K., and Furukawa, K. (2012). Contributions of wind and river effects on DO concentration in Tokyo Bay. Estuar. Coast. Shelf Sci. 209, 91–97. doi: 10.1016/j.ecss.2012.05.023
Shibata, Y., and Aruga, Y. (1982). Variation of chlorophyll a concentration and photosynthetic activity of phytoplankton in Tokyo Bay. La Mer 20, 75–92.
Stewart-Sinclair, P. J., Last, K. S., Payne, B. L., and Wilding, T. A. (2020). A global assessment of the vulnerability of shellfish aquaculture to climate change and ocean acidification. Ecol. Evol. 10, 3518–3534. doi: 10.1002/ece3.6149
Taguchi, F., Fujiwara, T., Yamada, Y., Fujita, K., and Sugiyama, M. (2009). Alkalinity in costal seas around Japan. Bull. Coast. Oceanogr. 47, 71–75.
Takii, S., Tanaka, H., Kohata, K., Nakamura, Y., Ogura, H., and Takeshita, S. (2002). Seasonal changes in sulfate reduction in sediments in the inner part of Tokyo Bay. Microbes Environ. 17, 10–17. doi: 10.1264/jsme2.2002.10
Wallace, R. B., Baumann, H., Grear, J. S., Aller, R. C., and Gobler, C. J. (2014). Coastal ocean acidification: the other eutrophication problem. Estuar. Coast. Shelf Sci. 148, 1–13. doi: 10.1016/j.ecss.2014.05.027
Wang, Z. A., Lawson, G. L., Pilskaln, C. H., and Maas, A. E. (2017). Seasonal controls of aragonite saturation states in the G ulf of M aine. J. Geophys. Res. Oceans 122, 372–389. doi: 10.1002/2016jc012373
Weiss, R. F. (1970). The Solubility of Nitrogen, Oxygen and Argon in Water and Seawater. in Deep Sea Research and Oceanographic Abstracts. Amsterdam: Elsevier, 721–735.
Yamamoto-Kawai, M., Kawamura, N., Ono, T., Kosugi, N., Kubo, A., Ishii, M., et al. (2015). Calcium carbonate saturation and ocean acidification in Tokyo Bay, Japan. J. Oceanogr. 71, 427–439. doi: 10.1007/s10872-015-0302-8
Yamamoto-Kawai, M., McLaughlin, F. A., and Carmack, E. C. (2011). Effects of ocean acidification, warming and melting of sea ice on aragonite saturation of the Canada Basin surface water. Geophys. Res. Lett. 38. doi: 10.1029/2010GL045501
Yao, W., and Byrne, R. H. (1998). Simplified seawater alkalinity analysis: use of linear array spectrometers. Deep Sea Res. I Oceanogr. Res. Papers 45, 1383–1392. doi: 10.1016/s0967-0637(98)00018-1
Zeebe, R. E., and Wolf-Gladrow, D. (2001). CO2 in Seawater: Equilibrium, Kinetics, Isotopes (No. 65). Texas: Gulf Professional Publishing.
Keywords: ocean acidification, hypoxia, eutrophication, coastal region, anoxic remineralization
Citation: Yamamoto-Kawai M, Ito S, Kurihara H and Kanda J (2021) Ocean Acidification State in the Highly Eutrophic Tokyo Bay, Japan: Controls on Seasonal and Interannual Variability. Front. Mar. Sci. 8:642041. doi: 10.3389/fmars.2021.642041
Received: 15 December 2020; Accepted: 05 March 2021;
Published: 25 March 2021.
Edited by:
Xianghui Guo, Xiamen University, ChinaReviewed by:
Naohiro Kosugi, Meteorological Research Institute, JapanLiang Xue, First Institute of Oceanography, Ministry of Natural Resources, China
Copyright © 2021 Yamamoto-Kawai, Ito, Kurihara and Kanda. This is an open-access article distributed under the terms of the Creative Commons Attribution License (CC BY). The use, distribution or reproduction in other forums is permitted, provided the original author(s) and the copyright owner(s) are credited and that the original publication in this journal is cited, in accordance with accepted academic practice. No use, distribution or reproduction is permitted which does not comply with these terms.
*Correspondence: Michiyo Yamamoto-Kawai, bWljaGl5b0BrYWl5b2RhaS5hYy5qcA==