
94% of researchers rate our articles as excellent or good
Learn more about the work of our research integrity team to safeguard the quality of each article we publish.
Find out more
ORIGINAL RESEARCH article
Front. Mar. Sci., 30 August 2021
Sec. Marine Conservation and Sustainability
Volume 8 - 2021 | https://doi.org/10.3389/fmars.2021.639334
This article is part of the Research TopicAdvances in 3D Habitat Mapping of Marine Ecosystem Ecology and ConservationView all 15 articles
 Justine Richaume1
 Adrien Cheminée1*
 Pierre Drap2
 Patrick Bonhomme3Frederic Cadene4Bruno Ferrari5Virginie Hartmann4Noëmie Michez5Olivier Bianchimani1
Imaging the marine environment is more and more useful to understand relationships between species, as well as natural processes. Developing photogrammetry allowed the use of 3D measuring to study populations dynamics of sessile organisms at various scales: from colony to population. This study focuses on red coral (Corallium rubrum), as known as precious coral. Metrics measured at a colony scale (e.g., maximum height, diameter and number of branches) allowed population understanding and a comparison between an old (Cerbère-Banyuls reserve) vs. a new (Calanques National Park) MPA. Our results suggested a 5-year time step allows the appearance of a significant difference between populations inside vs. outside the Calanques National Park no-take zones. Red coral colonies were taller and had more branches inside no-take zones. A significant difference was still observable for the populations inside the Cerbère-Banyuls reserve after 40 years of protection, reflecting the sustainability and effectiveness of precautionary measures set by the reserve. The impacts at the local level (mechanical destruction) and those presumed to occur via global change (climatic variations) underline the need to develop strategies both to follow the evolutions of red coral populations but also to understand their resilience. Photogrammetry induced modeling is a time and cost effective as well as non-invasive method which could be used to understand population dynamics at a seascape scale on coralligenous reefs.
Marine protected areas (MPAs) efficiency is a great question when one species conservation is at stake. Conserving marine biodiversity through a “good environmental status” by 2020 was the initial aim of the Marine Strategy Framework Directive (2008/CE/56, DCSMM). Over the past decade, more and more interest has grown for marine conservation policies and assessing MPAs efficiency for fish (Lester et al., 2009), as well as sessile organisms (Linares et al., 2012).
Some Mediterranean MPAs have shown efficiency to protect sessile species such as endangered red coral (Corallium rubrum). Mediterranean red coral Corallium rubrum (Linnaeus, 1758) is a long-lived suspensivorous colonial octocoralliary belonging to the Corallidae family. Adult individuals are polyps living in clonal colonies that can bring together several hundred individuals (Torrents, 2007). This species is found in low light, strong hydrodynamic and low temperature conditions (Torrents, 2007; Linares et al., 2010) mainly colonizing overhangs, anfractuosities and cave entrances on hard substrates (Gibson et al., 2006).
Ocean acidification (Bramanti et al., 2013) and extreme climatic events endanger red coral (Perez et al., 2000; Garrabou et al., 2001; Crisci et al., 2011) as well as commercial exploitation (Lo Basso and Raveux, 2018) and anthropogenic disturbances (Garrabou et al., 2001; Crisci et al., 2011; Bramanti et al., 2013; Linares et al., 2013; Zapata-Ramírez et al., 2013). Population decrease could result in a general loss of ecological functionality in Mediterranean coastal ecosystems (Santangelo et al., 1993; Bruckner, 2009) as the red coral contributes to the consolidation of coralligenous substrate and structures the habitat of many species including algae, invertebrates, fish and microorganisms (Gibson et al., 2006).
However red coral conservation is a major challenge for policy makers wishing to both preserve natural habitats and maintain a traditional economic activity (Bonhomme et al., 2015). Conservation initiatives already exist and are being reinforced: in France, several Marine Protected Areas (MPAs) wishing to manage and maintain the populations of red coral have prohibited harvest from all [Cerbère-Banyuls Marine Natural Reserve (1974), Scandola Natural Reserve (1975), Côte Bleue Marine Park (1982), Bouches de Bonifacio Natural Reserve (1999)], or part of their perimeter [Calanques National Park (2012)].
Evolution of local conservative measures reflects existing conflicts of interest with successive changes in laws (Cau et al., 2013). These issues concern all the precious corals exploited (Bruckner, 2009; Santangelo et al., 2012). Nowadays after 30 years of protection in French and Spanish MPAs, the size of red coral colonies still does not reach the values of the primary populations suggesting that full recovery will require centuries of protection (Garrabou and Harmelin, 2002; Tsounis et al., 2006; Linares et al., 2010).
Red coral height growth rate is estimated at 1.78 ± 0.7 mm/year (Garrabou and Harmelin, 2002). Basal diameter growth is estimated around 0.62 ± 0.19 mm/year (Bramanti et al., 2005). Growth rates are influenced by environmental condition within the habitat as well as factors specific to the genetics and biology of individuals (Ledoux et al., 2010).
Moreover the study of these fragile sessile organisms is complex and was recently allowed by photogrammetry techniques (Drap et al., 2014). Photogrammetry has been used for more than 50 years in the fields of archeology and more recently in marine biology (Drap et al., 2013b) in order to collect various metrics describing an object of study, at scales ranging from the millimeter to hundred meters. It is an indirect and non-invasive measurement technique (Bythell et al., 2001; Burns and Delparte, 2017) that has been validated in various studies on long-lived benthic species (Linares et al., 2010). It also reduces the time spent underwater, thus reducing the constraints and risks associated with diving. Despite a long post-processing time, this technique provides reusable raw data for additional measurements and a posteriori parameter analysis. Photogrammetry is based on the construction of 3D models of an object from a set of 2D photos using the principle of triangulation (Ludvigsen et al., 2006). Under ideal conditions, these models allow measurements to be made with an accuracy of around 1/10 of a millimeter. Once the models have been reconstructed, it is then possible to carry out measurements with suitable software tools such as Arpenteur, developed for the study of red coral (Royer et al., 2018).
The present paper presents a comparison between two marine protected areas in the Mediterranean and their implication in red coral conservation: the 40 years old Cerbère-Banyuls Reserve (CB reserve) and the 5 years old Calanques National Park (Calanques NP). Using photogrammetry-born biometrics of the red coral populations, collected in various levels of protection of both MPAs, we constructed a Before-After-Control-Impact design (BACI) in order to test the following hypothesis: we hypothesize that there is a significant effect of the interaction between year and protection in the case of the Calanques NP but not in the case of the CB reserve, revealing the apparition of a reserve effect between sites outside (i.e., Control) vs. inside (i.e., Impact) no-take zones of the young Calanques NP between 2013 (i.e., before) and 2019 (i.e., after), while (ii) such reserve effect would be already present and maintain itself in the old CB reserve.
The study sites are located inside and outside the protected no-take zones of two MPAs located along the Western Mediterranean French rocky coast, respectively, between Cap Bear and Cap Cerbère for the Cerbère-Banyuls Reserve populations, and between west of Marseille and La Ciotat for the Calanques National Park populations (Figure 1), located 350 km from each other. Cerbère-Banyuls Reserve (42°28′18″N, 3°9′53″E) covers 650 ha and encompasses 2 zones, a central no-take zone (i.e., “full reserve”), where all activities are prohibited except for scientific surveys and a peripheral “partial reserve” zone where small-scale and recreational fishing and diving are permitted with some restrictions. Red coral harvesting as well as other fishing activities have been banned inside the Cerbère-Banyuls marine reserve since 1974. The substrate is mostly schist stone and detrital sediments (Flemming, 1972). Calanques National Park (43°12′34″ N, 5°26′57″ E) covers 43,500 ha and encompasses 2 zones as well: several no-take zones (i.e., “full reserves”) where any fishing or harvesting activities are prohibited since 2013 and a surrounding “partial reserve” where fishing and recreational diving and fishing are still partly permitted. The substrate in the Calanques National Park is mostly limestone (Flemming, 1972). In both MPAs, these zones displaying full and partial protection are surrounded by unprotected “outside reserve” zones (Figure 1).
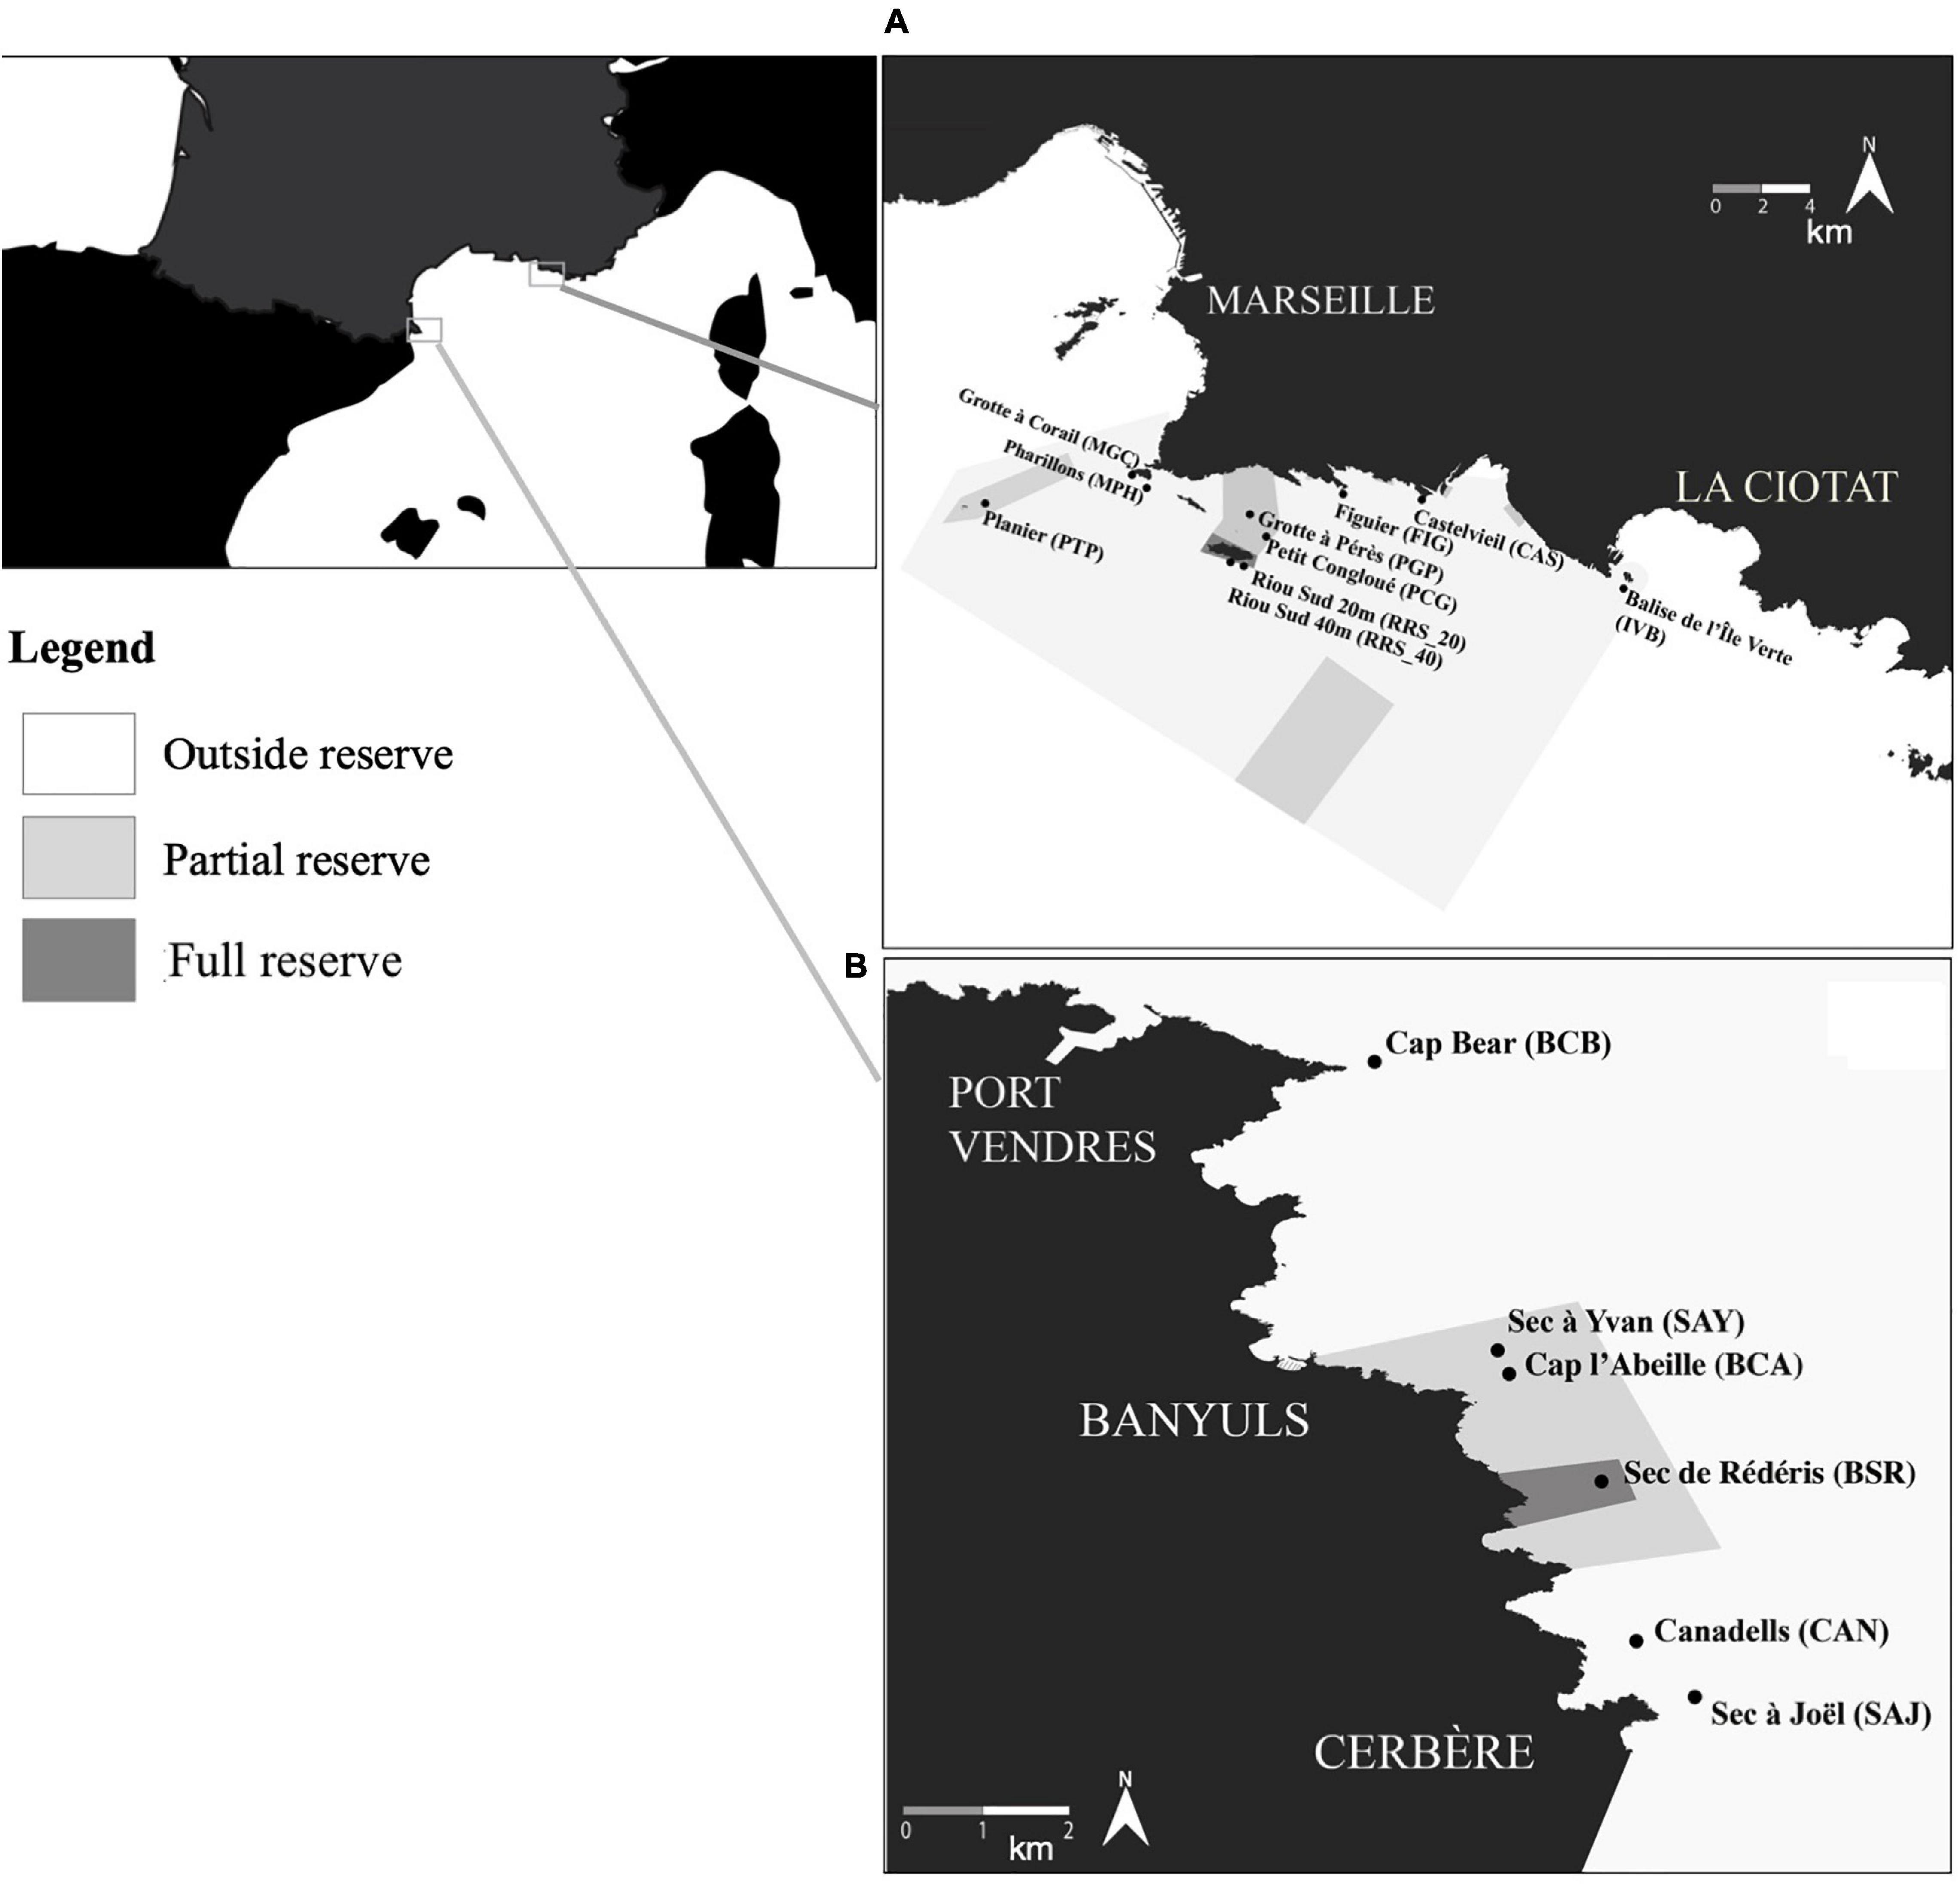
Figure 1. Study areas with Calanques national park (A) and Cerbère-Banyuls reserve (B).
The red coral settlements in these regions are characterized by a frequent occurrence in shallow overhangs and cavities on hard substrate (Torrents, 2007). We studied shallow red coral populations settled at depths ranging from 19 to 25 m.
Corallium rubrum populations of the Calanques National Park and Cerbère-Banyuls reserve were studied using photogrammetry, an indirect and non-invasive method previously validated in a study on long-lived benthic species (Linares et al., 2010).
In the Calanques National Park, photogrammetric surveys were done at the studied sites during sampling campaigns performed in December 2013 (i.e., when the MPA was created) and in December 2019: five sites were located outside no-take zones (Bonhomme et al., 2015) [Castelviel (CAS), Figuier (FIG), Balise de l’Île Verte (IVB), Grotte à Corail (MGC), and Pharillons de l’Île Maïre (MPH)], three sites were located in the partial reserve [Petit Congloué (PCG), Grotte Pérès (PGP), Le Planier (PTP)]; and finally 2 sites were located inside the full reserve zone [South Riou 20 m (RRS_20) and South Riou 40 m (RRS_40)].
In Cerbère-Banyuls, photogrammetric surveys were done in December 2012 and December 2020 during sampling campaigns at three sites located outside the no-take zones [Sec à Joël (SAJ), Canadells (CAN), and Cap Béar (BCB)]; two sites located inside partial reserve [Sec à Yvan (SAY) Cap Abeille (BCA)]; and one site located inside the full reserve [Sec de Rédéris (BSR)].
In each MPAs, at both occasions, in each site, the surveys were done in the same populations i.e., patches of red coral colonies : in each site, red coral populations were haphazardly sampled using 20 cm × 20 cm quadrats (0.04 m2). For each site, between 19 and 41 quadrats were modeled (Table 1). For each quadrat, 3 photographs were taken with a Nikon D700 DSLR (sensor pixel density = 1.41 Mp/cm2) and a 20 mm lens, Nauticam housing with hemispherical window and two pairs of Ikelite DS160 flashes.
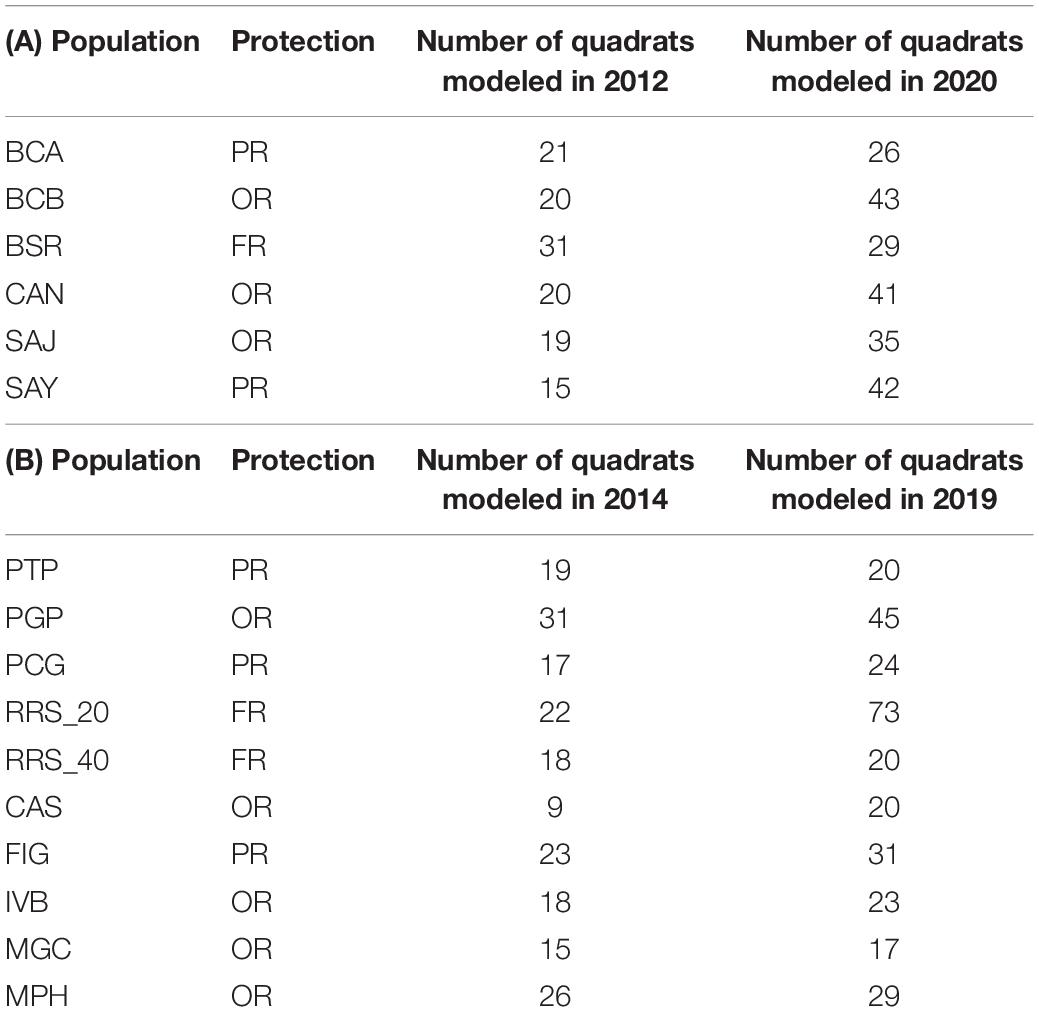
Table 1. Number of quadrats modeled for each site in Cerbère-Banyuls reserve (A) and Calanques National Park (B) in each protection status (FR, Full Reserve; PR, Partial Reserve; OR, Outside Reserve.
The pictures were taken from slightly different angles in order to build the corresponding photogrammetric model with the Arpenteur software (Drap et al., 2013a, 2014). An angle of approximately 20° allows a high overlap of the pixels between the two images (50–70%) for a reliable 3D reconstruction (Royer et al., 2018). More than 20 coded targets, uniformly distributed on the quadrat, are measured automatically by the software. Each quadrat is previously calibrated and the targets are known in the reference system of the quadrat in which the measurements of the colonies were to be made. Orientation of the photos was done by bundle adjustment using the measures on the coded targets. The accuracy obtained on the targets is usually less than 1 mm (Drap et al., 2013a). Once the 3D model was obtained, the acquisition of the metrics describing the populations and colonies was carried out for each quadrat by selection of the homologous points so that the resulting 3D point is calculated by triangulation (Bythell et al., 2001; Drap et al., 2014, p. 2014; Royer et al., 2018). Resolution inside the quadrats was around 0.1 mm/px.
Metrics were measured at the scale of the colony. In each quadrat and for each colony three metrics were measured: number of branches, basal diameter, and maximum height (maximum distance between base and apex of a branch).
Data considered as aberrant given the literature were excluded: this was the case for colonies exceeding 220 mm for their maximum size and 15 mm in basal diameter (Garrabou and Harmelin, 2002; Marschal et al., 2004). The aberrant data came from model distorsions due to underwater constraints in some quadrats which were removed from the analysis. Precision is around one pixel and the calculated mean distance error with Arpenteur tool was less than 0.5 mm (Royer et al., 2018).
We were interested in the descriptors of C. rubrum measured on colonies: (i) maximum height (ii) basal diameter, and (iii) number of branches, in order to test their responses to the following explanatory factors: protection, site and year. For both MPAs separately (Cerbère-Banyuls Reserve and Calanques National Park), we carried out permutational multi- or uni-variate analysis of variance (PERMANOVA) (Anderson et al., 2008) in order to determine the effect of the factors studied (site, year and protection and their interaction) on the descriptors of C. rubrum populations. The resemblance matrices were calculated from the initial data matrix containing, for each sample (i.e., the colony) a row displaying the response variable(s). The response variable was alternatively a multivariate set of data containing the combination of (i) maximum height (ii) basal diameter, and (iii) number of branches or a univariate data (i.e., each descriptor separately). Indeed, independently of potential differences in the multivariate combination of descriptors, understanding the population dynamics requires a further inspection of the individual behavior of each descriptor. In order to study the effect of explaining factors, two designs were used. A first design was set to assess the spatio-temporal variability of these descriptors, testing the effect of both the year and the site. Year was a two-level fixed factor (respectively, 2013 and 2019 for Calanques NP and 2012 and 2020 for Cerbère-Banyuls Reserve). Site was a random factor with 6 modalities for Cerbère-Banyuls reserve and 10 modalities for Calanques national park. A second design was set to test the effect of year and protection on the same response variables. Protection was a three-level fixed factor (Outside reserve, partial reserve and full reserve), while year was set as previously.
This BACI design (design 2) allowed us to test the hypothesis that there is an interaction between year and protection in the case of the Calanques NP but not in the case of the CB marine reserve; indeed it would reveal the apparition of a reserve effect between samples from outside (i.e., Control) vs. inside (i.e., Impact) no-take zones of the young Calanques NP between 2013 (i.e., before) and 2019 (i.e., after), while (ii) such reserve effect would be already present and maintain itself in the old Cerbère-Banyuls reserve. Such approaches are used in particular to detect significant changes indicative of the effect of ecosystem management (Underwood, 1981, 1992). In addition, the first design also allowed us to address the natural spatio-temporal variability of population descriptors.
For this inferential approach, Euclidean distance matrices were calculated from standardized data measured on all colonies (normalization by sum function on PRIMER). P-values were calculated by 999 residual permutations under a reduced model. When the number of permutations was below 200, Monte Carlo p-values were used (Clarke et al., 2014).
Since ecological data give rise to intrinsic inherent variability, significance was considered—for all designs—when p-value < 0.1. Data treatment and graphical representations were carried out using R 3.1.3 programming freeware (R Core Team, 2017) and PRIMER 6 software with PERMANOVA + add-on (Anderson, 2001; Clarke and Gorley, 2006; Anderson et al., 2008).
In 2020, in Cerbère-Banyuls reserve on all 6 sites studied, a total of 1,186 arborescent colonies was found within the 217 quadrats (Table 2). In addition, a small number of individuals (n = 28) had abnormal measurements and were therefore removed from the dataset. The complete set presented a total of 1,158 individuals distributed over the 6 Cerbère-Banyuls studied populations.
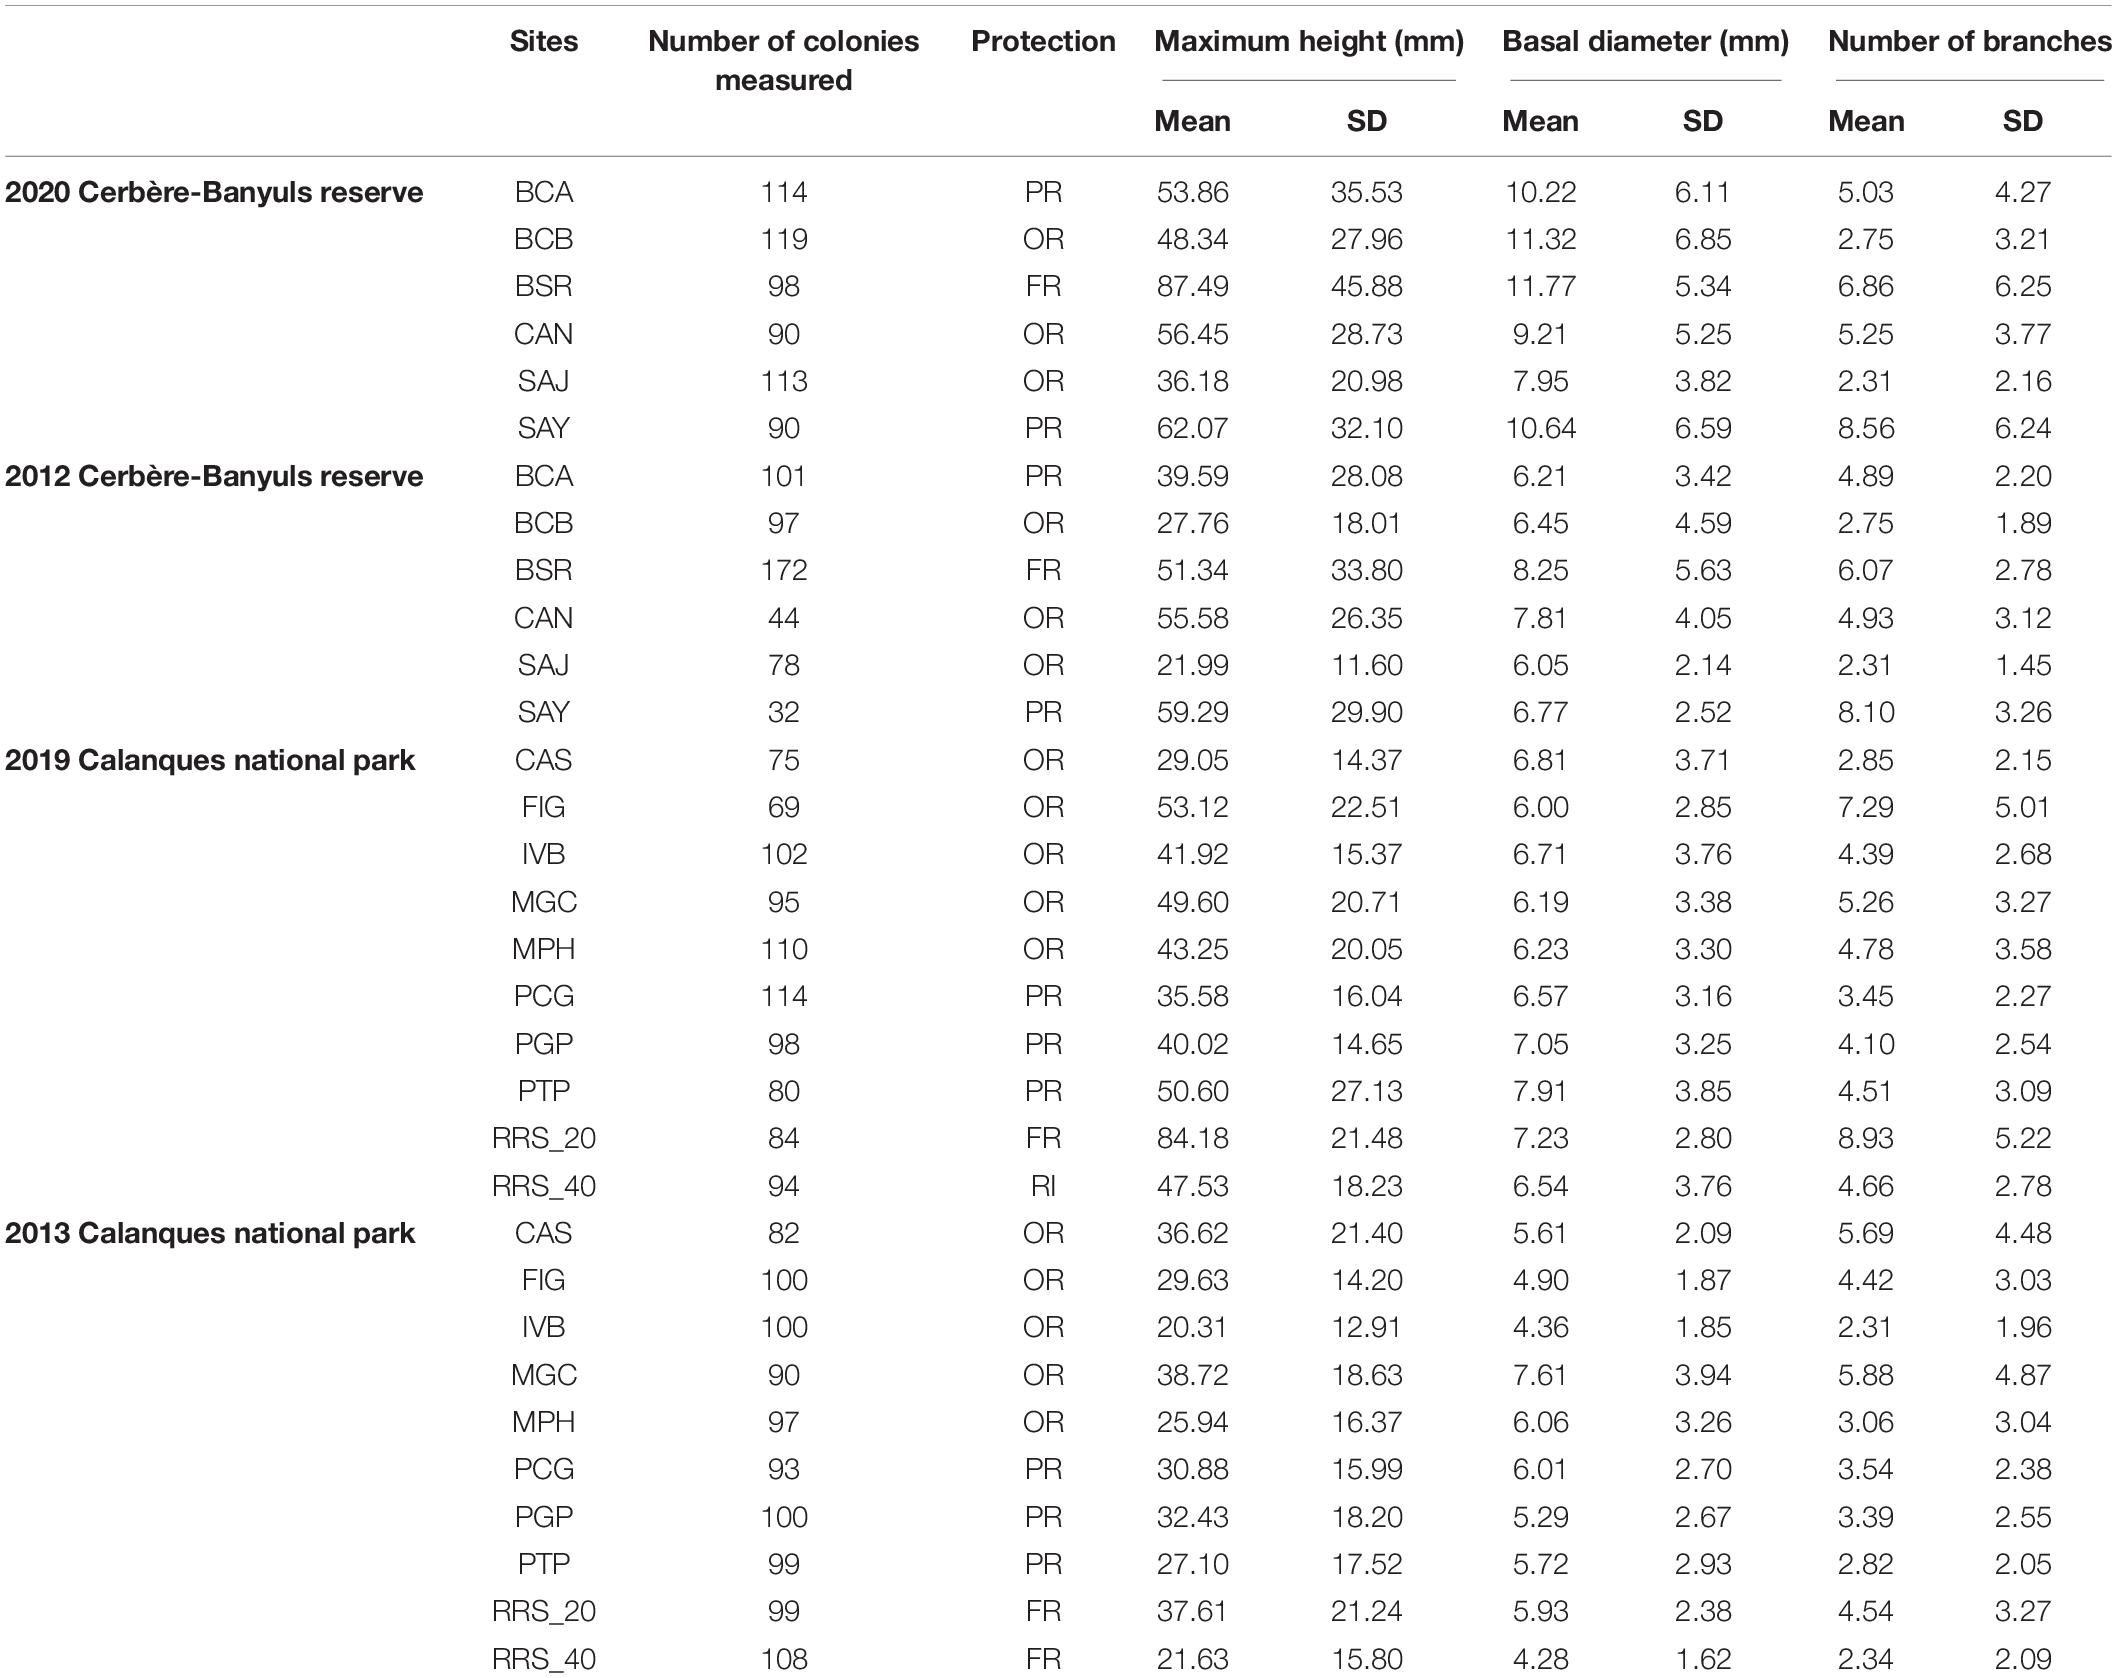
Table 2. Number of colonies measured, mean and standard deviation of each metric for each site of Cerbère-Banyuls reserve and Calanques national park: maximum size, basal diameter, and number of branches for each site of each year in each protection status (FR, Full Reserve; PR, Partial Reserve; OR, Outside Reserve).
Differences in population structure between sites were highlighted by a significant effect of the factor “site” as well as a significant interaction between year and site on the multivariate combination of metrics (PERMANOVA, p-value = 0.004, Table 3). In 2020, large disparities in the distributions of the three descriptors from one site to another were observed (Figures 2–4). The distributions of populations in site BCA and site BCB were similar and centered toward small values, whatever the descriptor. Some populations had an unimodal distribution (BCA, BCB, SAJ) while others had nearly uniform probability densities for maximum height, indicating that individuals were distributed more evenly. The colonies of BSR (in full reserve) were on average larger (μ = 87.49 ± 45.88 mm, Table 2) than in the other populations (Figure 2). For the populations of sites CAN and SAY, a second density peak was observed around 100 mm. The distributions in basal diameter were more homogeneous between populations than the maximum height distributions. Some populations showed a unimodal peak followed by an increase in probability density at higher values of basal diameter: CAN, BCA, SAJ, SAY. The distribution of BSR probability densities is the most homogeneous, with a peak around 7 mm of basal diameter. Finally, the number of branches per colony was distributed relatively differently from one population to another.
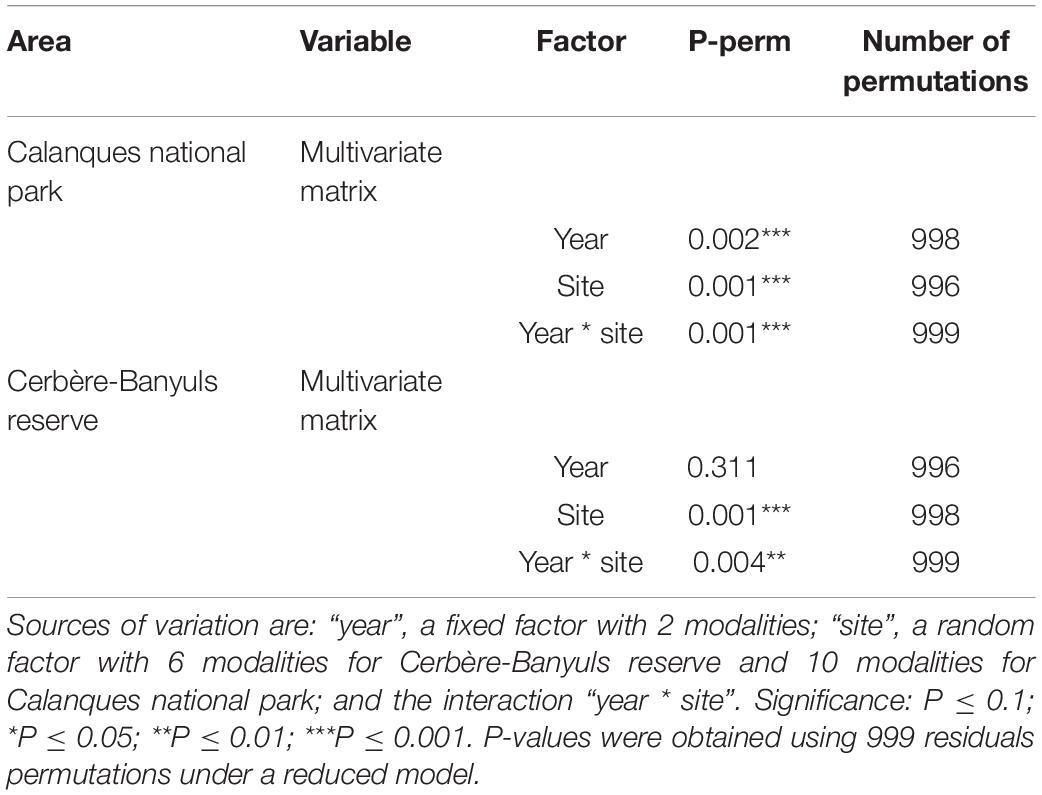
Table 3. Results of permutation analyzes of variance (PERMANOVA) in the Cerbère-Banyuls reserve and the Calanques national park MPAs via a design incorporating the “site” and “year” factors, applied for the multivariate matrix (maximum size; basal diameter; number of branches) and each univariate matrix.
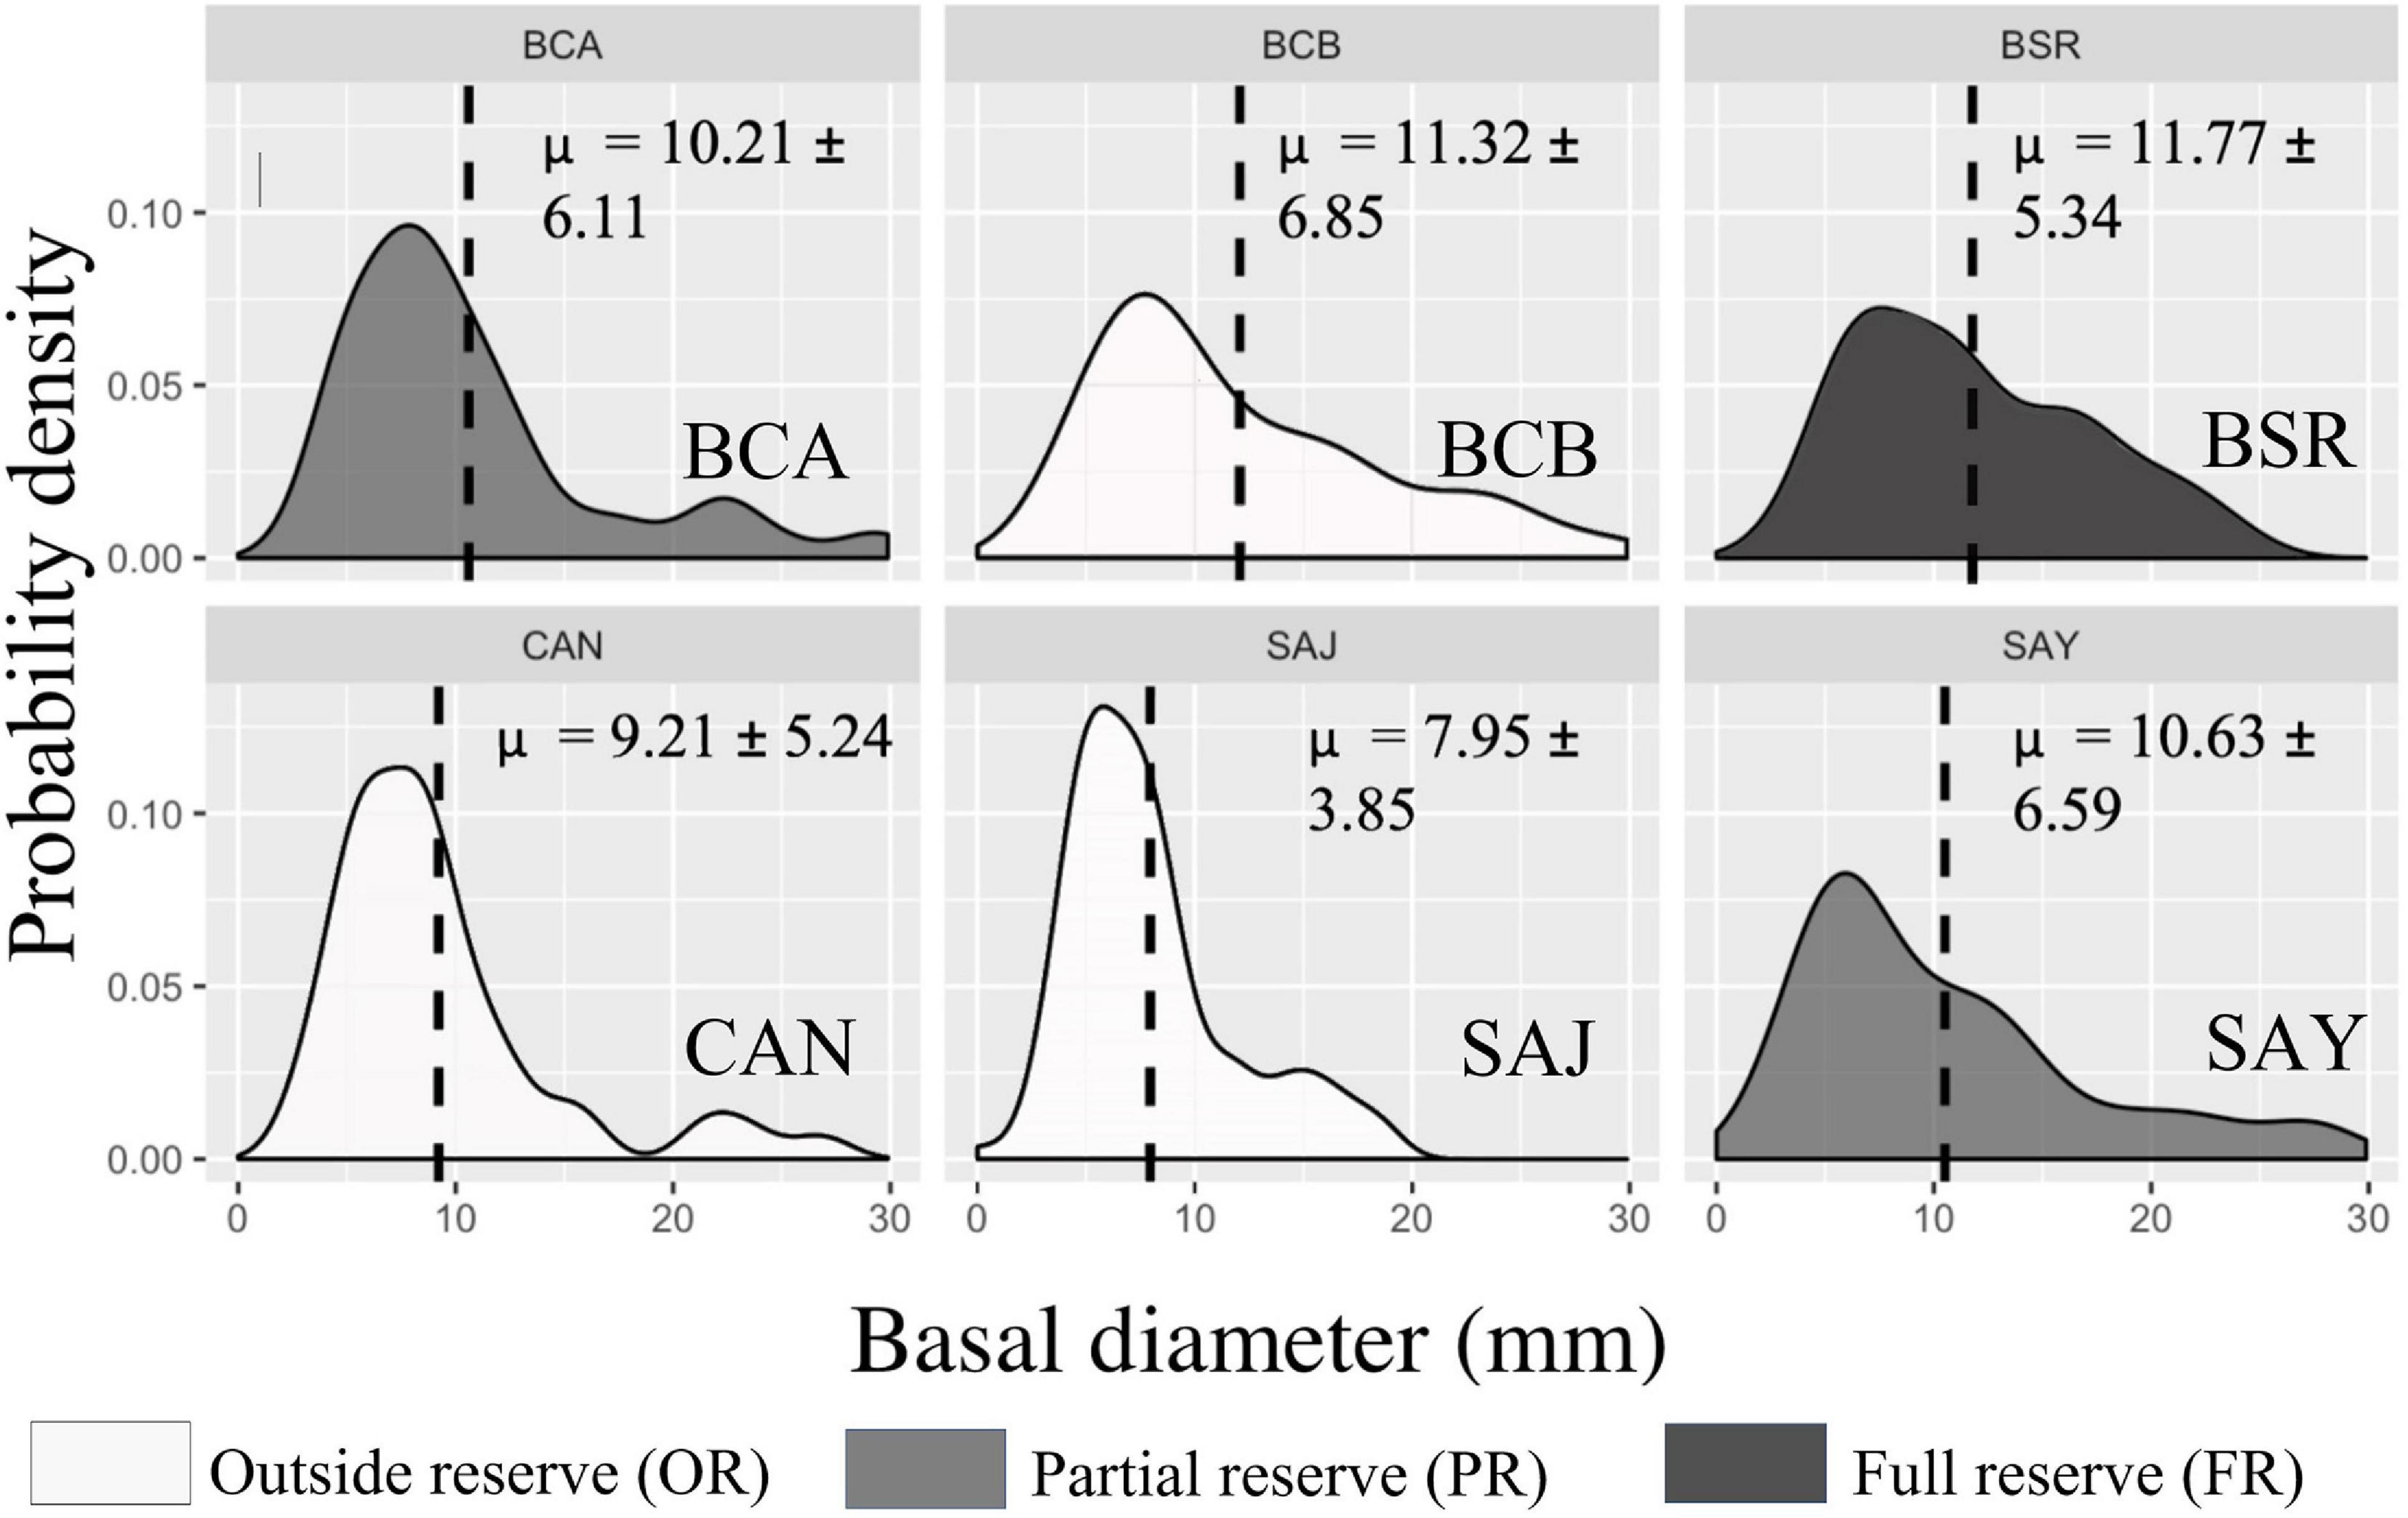
Figure 2. Cerbère-Banyuls reserve: representation of probability density functions by population of each site for the basal diameter variable (mm) in 2020. The values indicated correspond to the means followed by the standard deviations. In dark the population in full reserve (BSR), in medium the populations in partial reserve (BCA, SAY), in clear the populations outside the reserve (BCB, CAN, SAJ).
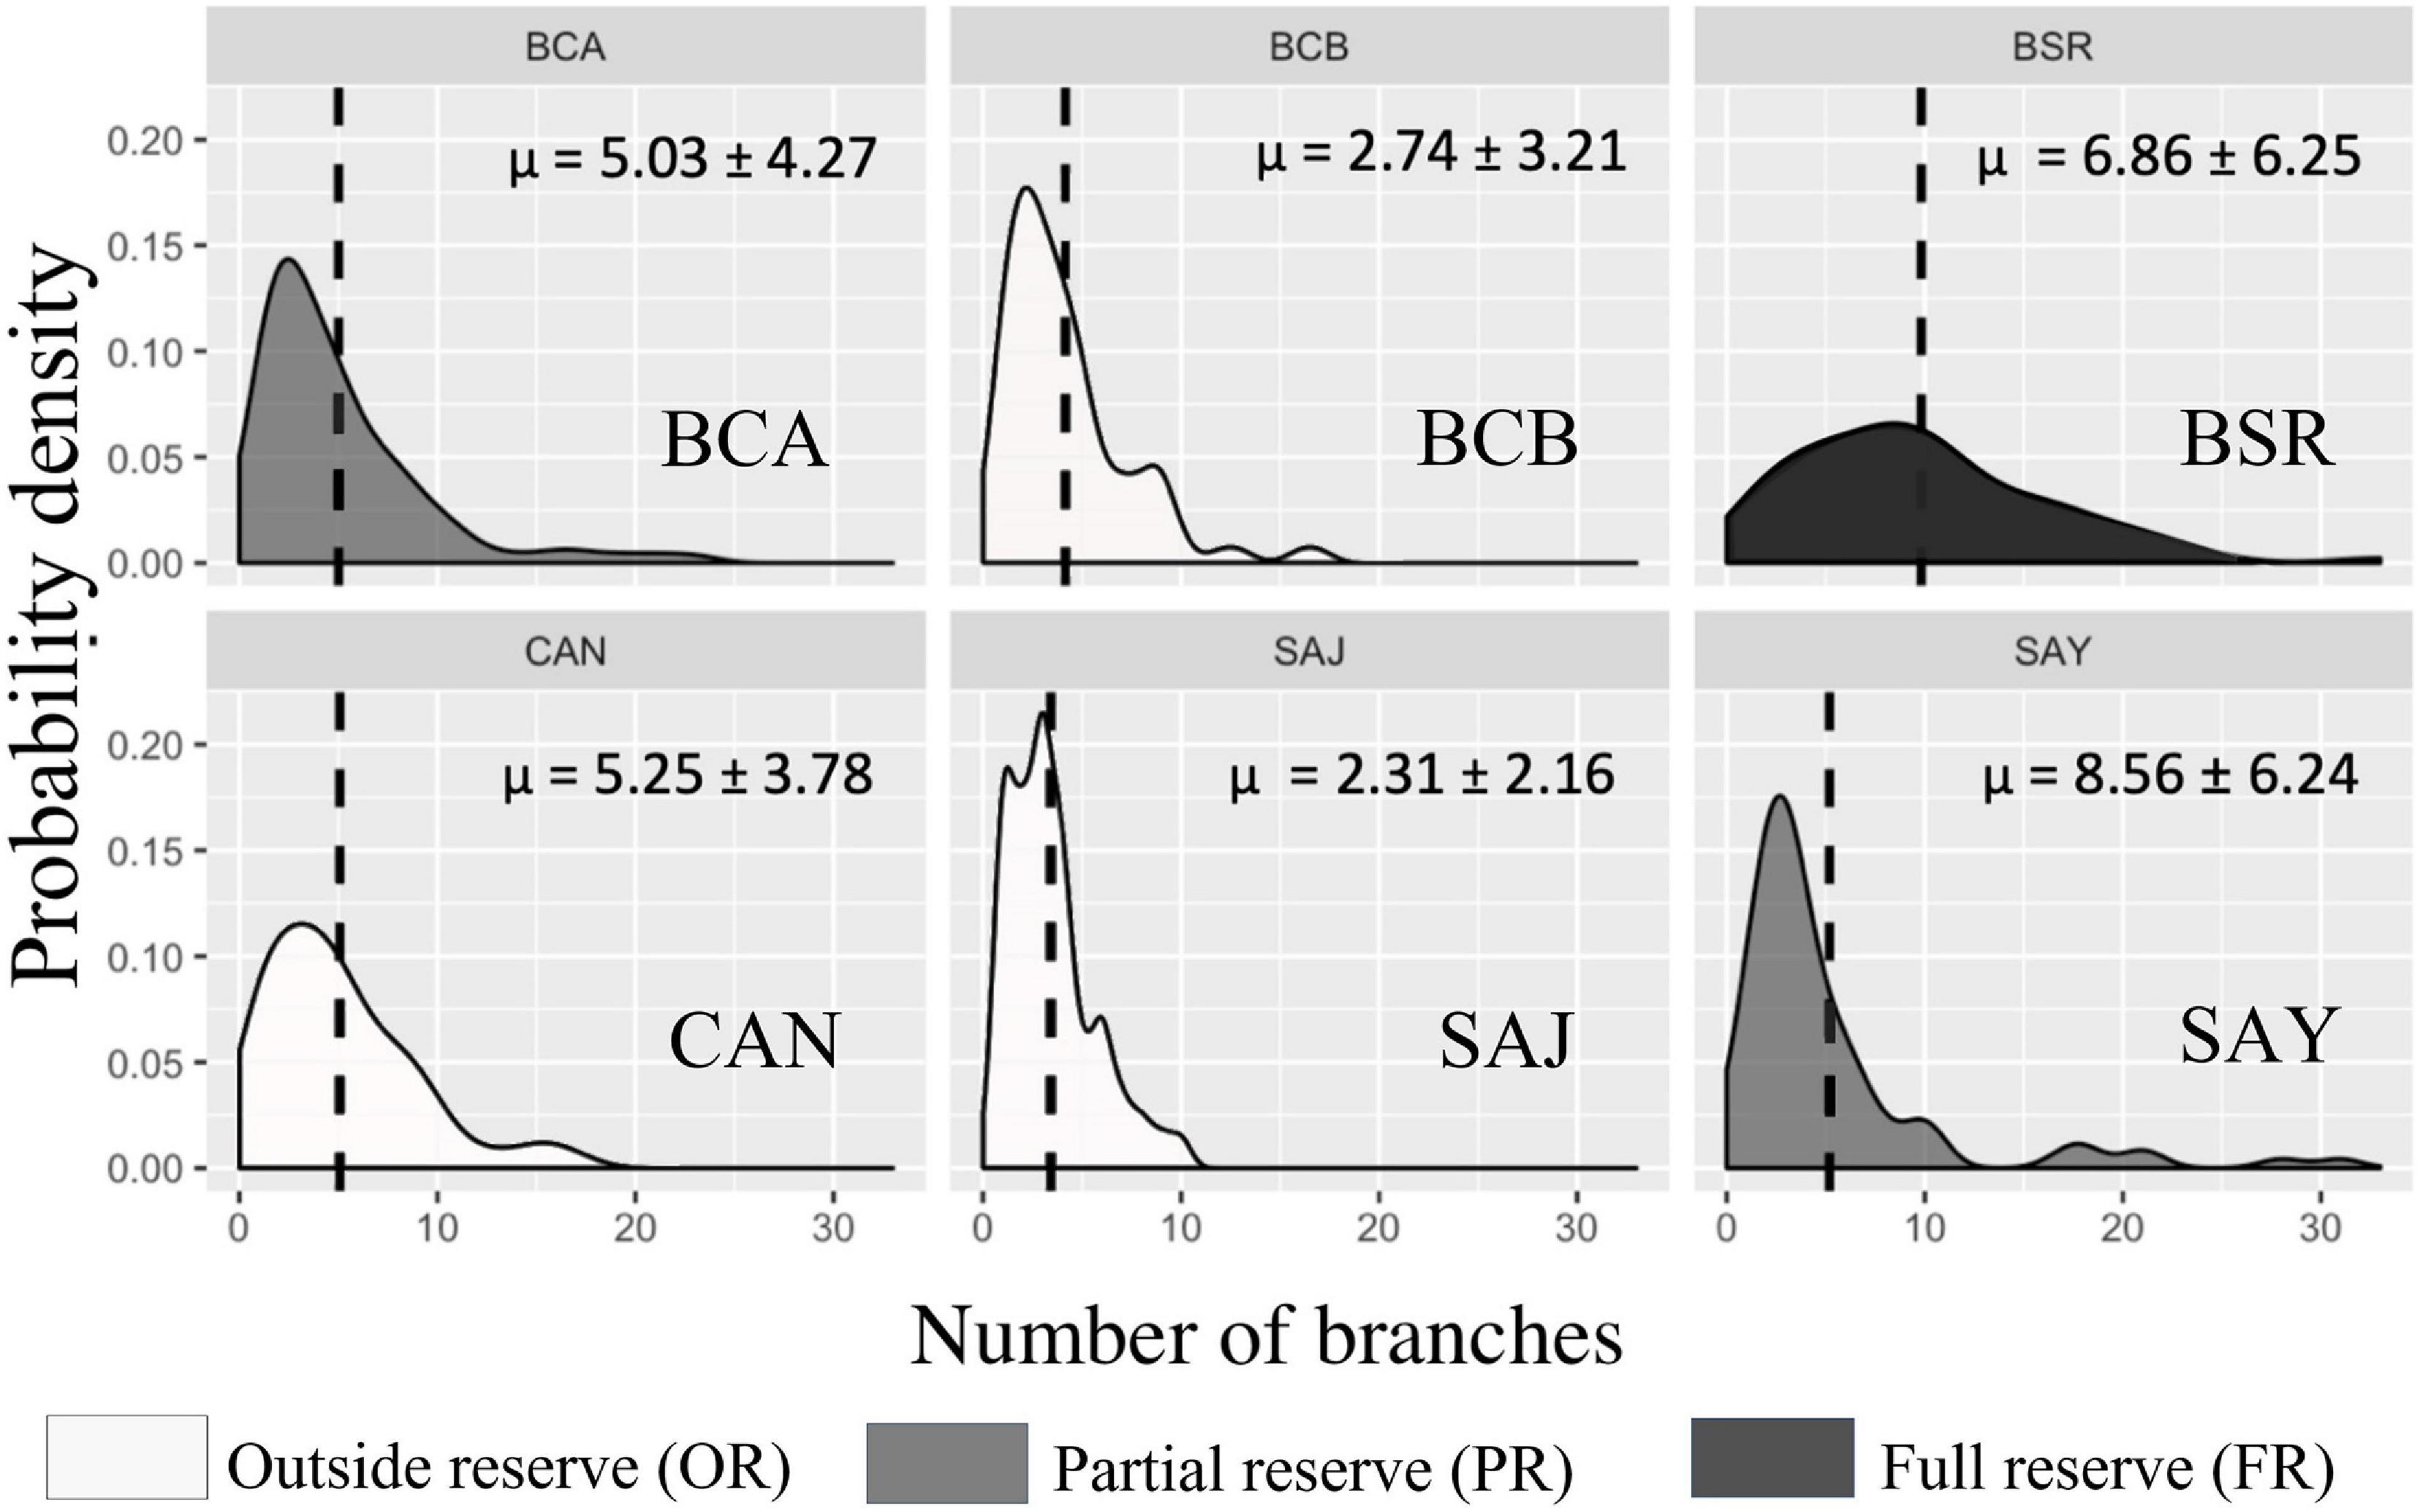
Figure 3. Cerbère-Banyuls reserve: representation of probability density functions by population of each site for the variable number of branches in 2020. The values indicated correspond to the means followed by the standard deviations. In dark the population in full reserve (BSR), in medium the populations in partial reserve (BCA, SAY), in clear the populations outside the reserve (BCB, CAN, SAJ).
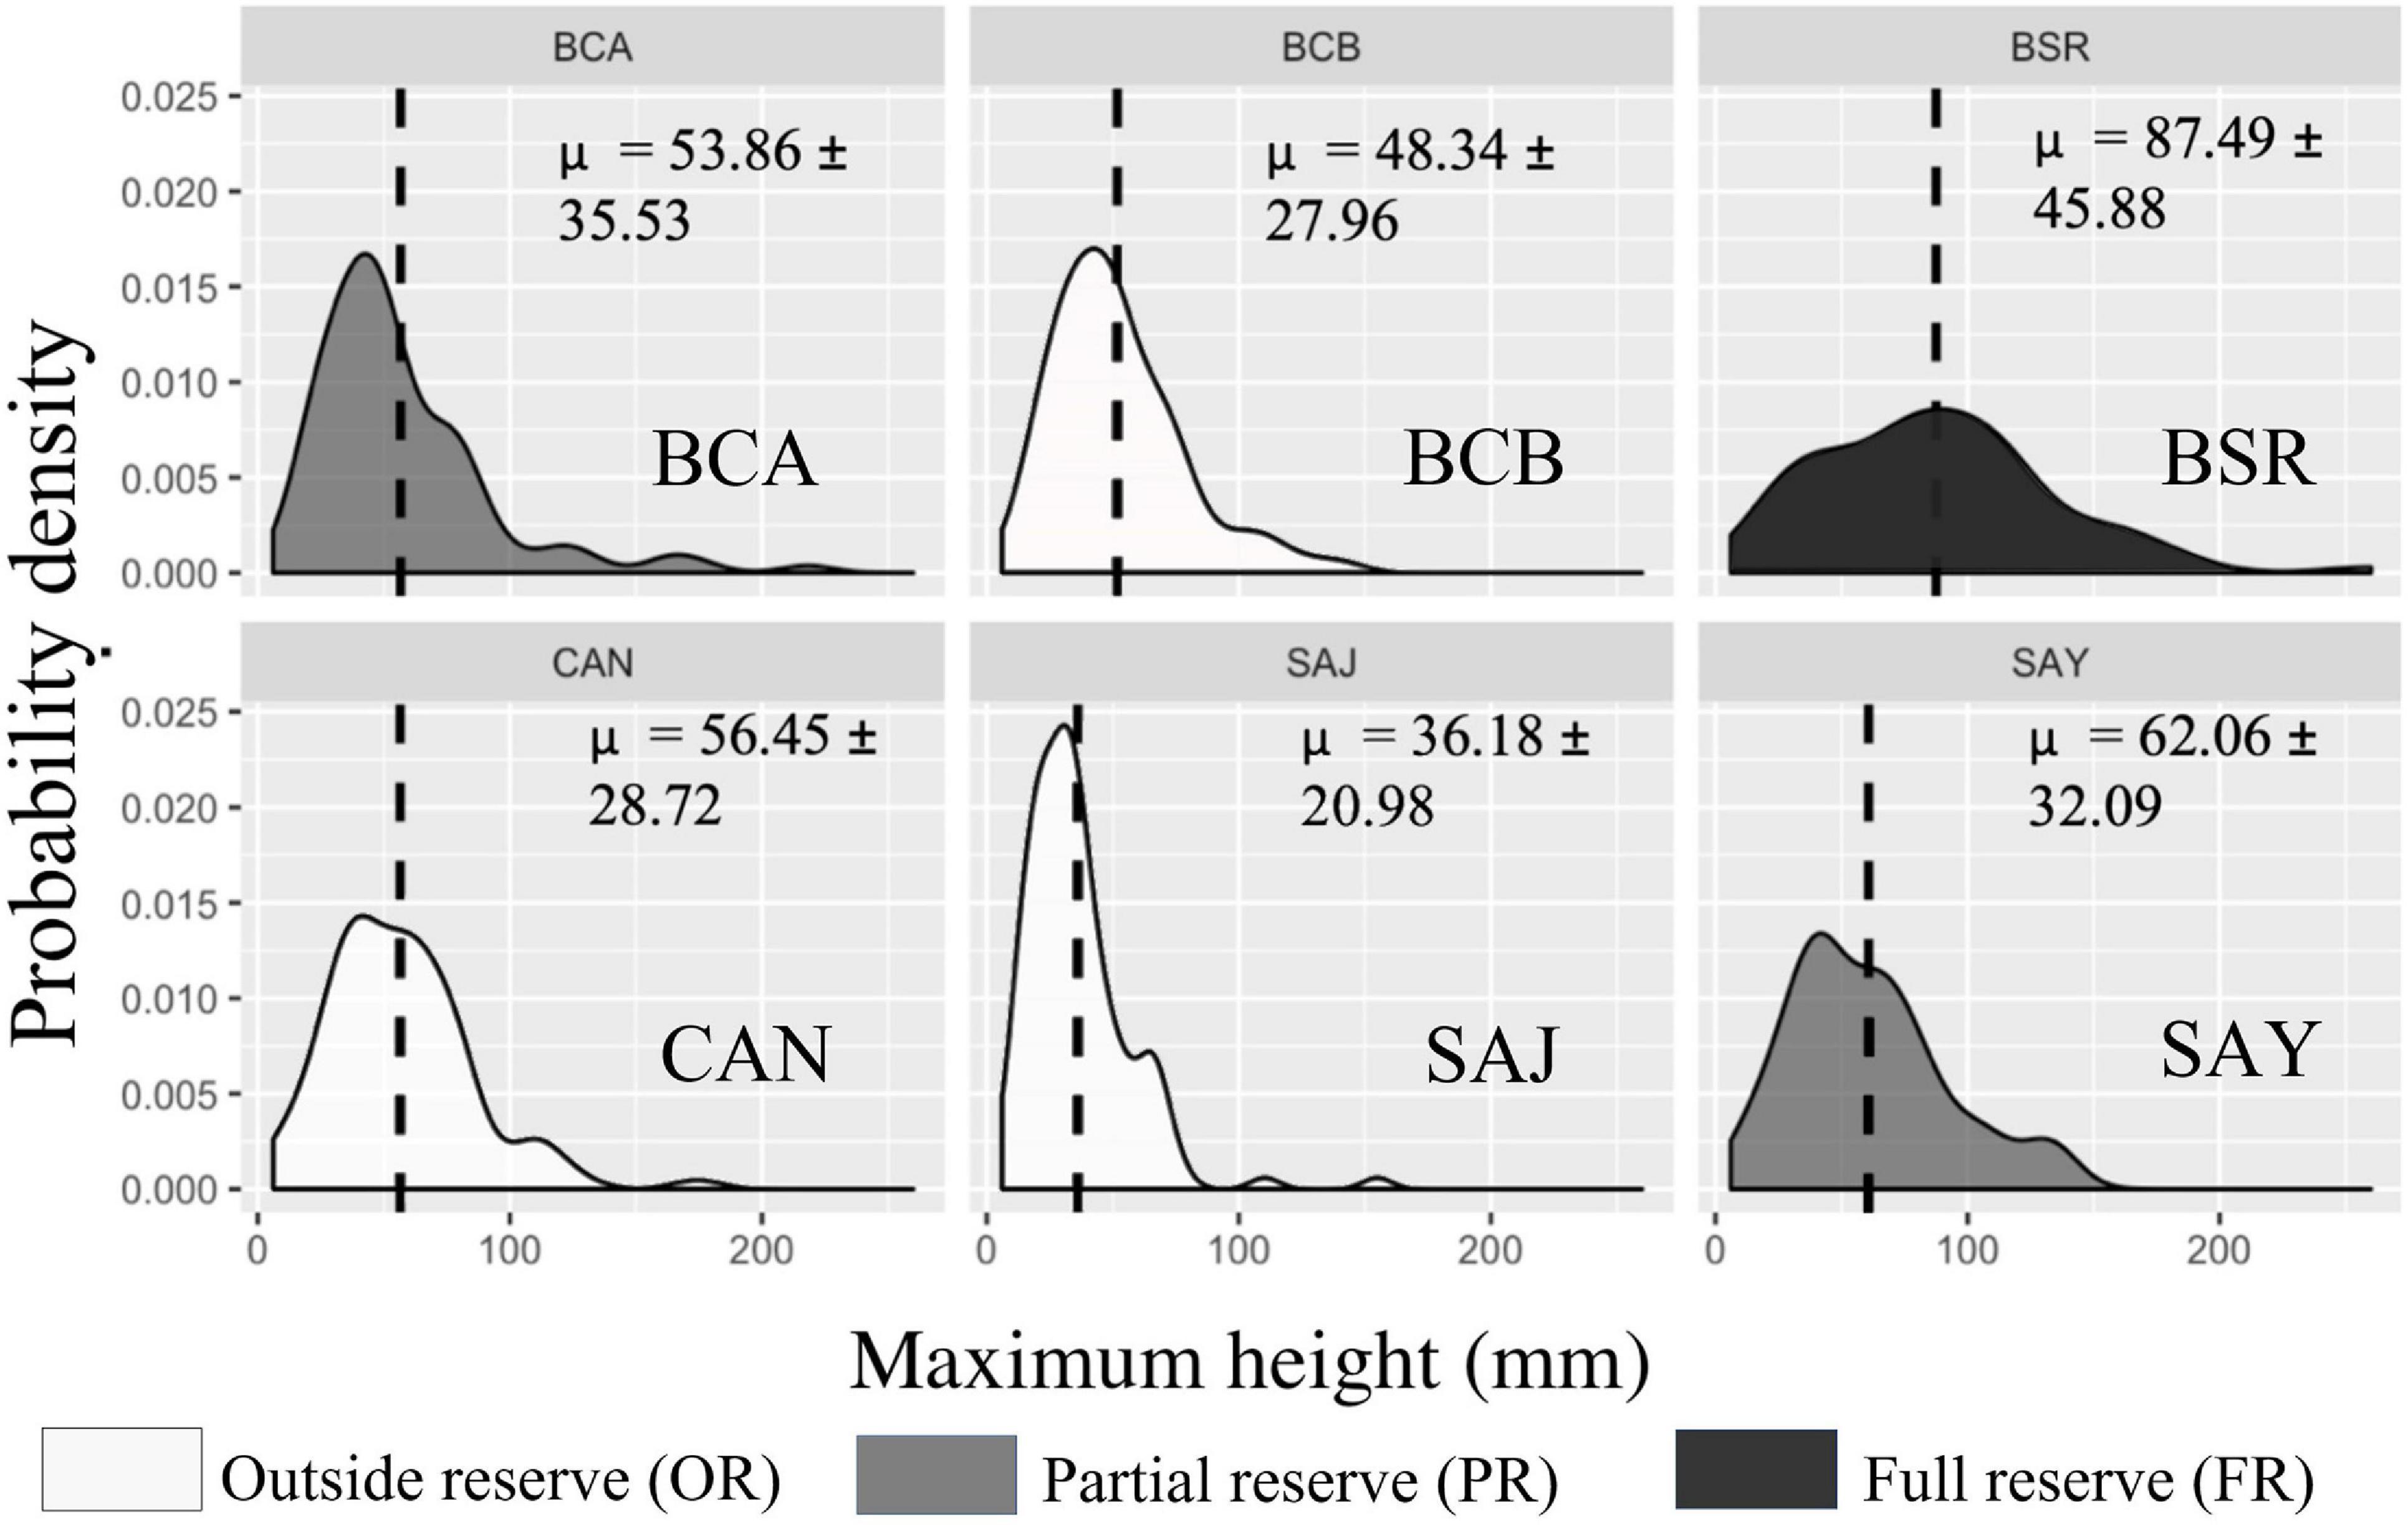
Figure 4. Cerbère-Banyuls reserve: representation of probability density functions by population of each site for the variable maximum height (mm) in 2020. The values indicated correspond to the means followed by the standard deviations. In dark the population in full reserve (BSR), in medium the populations in partial reserve (BCA, SAY), in clear the populations outside the reserve (BCB, CAN, SAJ).
In 2019, in the Calanques National Park, 1,809 colonies of the “arborescent” type were found (Table 2). A small number of individuals (n = 59) had abnormal measurements and were therefore removed from the dataset. The complete set presented a total of 1,750 individuals distributed over the 10 Calanques sites.
In 2019, we observed large disparities in the distribution from one population to another when representing probability density of each site as a function of size classes for maximum height (Figure 5). Populations of sites CAS, PCG, PGP, and MPH showed decreasing distributions concentrated toward small values of height (between 29 ± 14.37 and 43.25 ± 20.05 mm, Table 2). Some populations had a unimodal height distribution (MPH, PCG, PGP) while others displayed bimodal (RRS_20, FIG) or even almost uniform (PTP) height probability densities indicating that individuals are distributed more evenly according to their maximum height. Basal diameter density probabilities were more homogeneous between populations (Figure 6). Some sites showed an unimodal peak followed by a resurgence in probability density of diameter at higher values: IVB, MGC, MPH, PCG, RRS_40. The distribution of PTP diameter probability densities is the most homogeneous, with a slight peak around 7 mm. The number of branches per colony is distributed relatively differently from one population to another (Figure 7). All sites displayed populations with an unimodal distribution of number of branches but with some disparities.
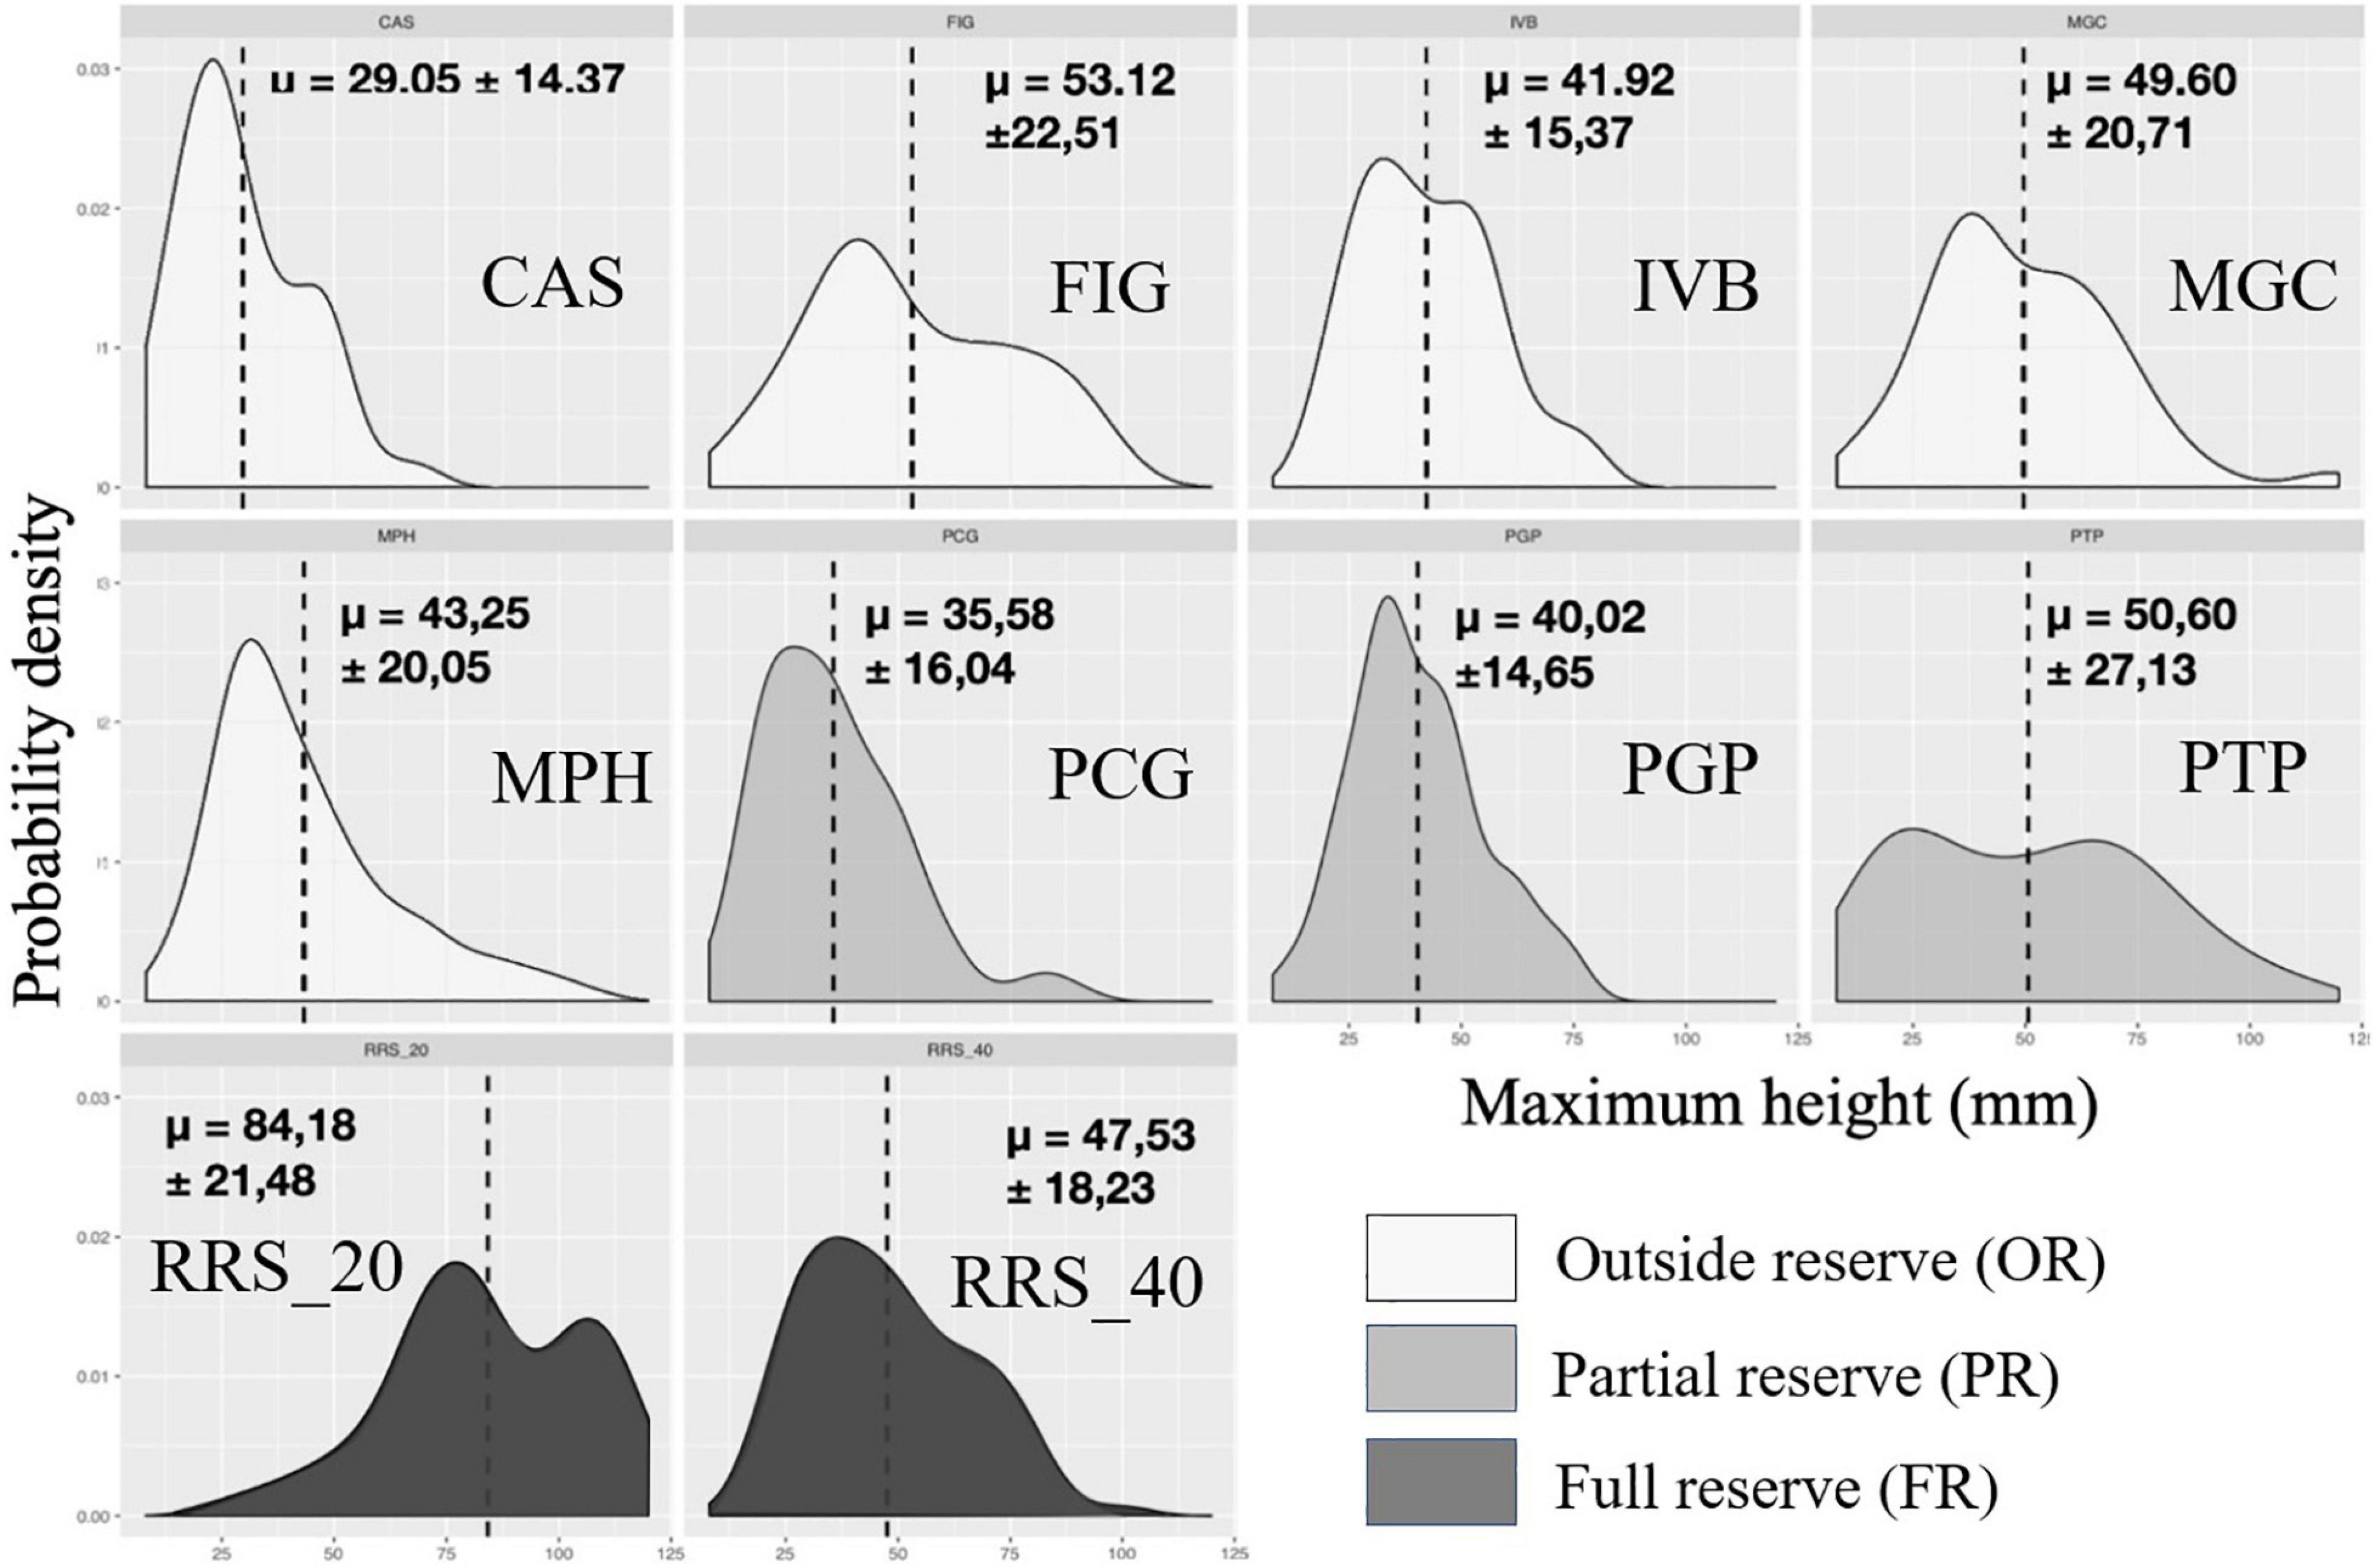
Figure 5. Calanques national park: representation of probability density functions by population of each site for maximum height (mm) in 2020. The values indicated correspond to the means followed by the standard deviations. In dark the populations in full reserve (RRS_20; RRS_40), in medium the populations in partial reserve (PTP, PGP, PTP), in clear the populations outside the reserve (MPH, CAS, FIG, IVB, MGC).
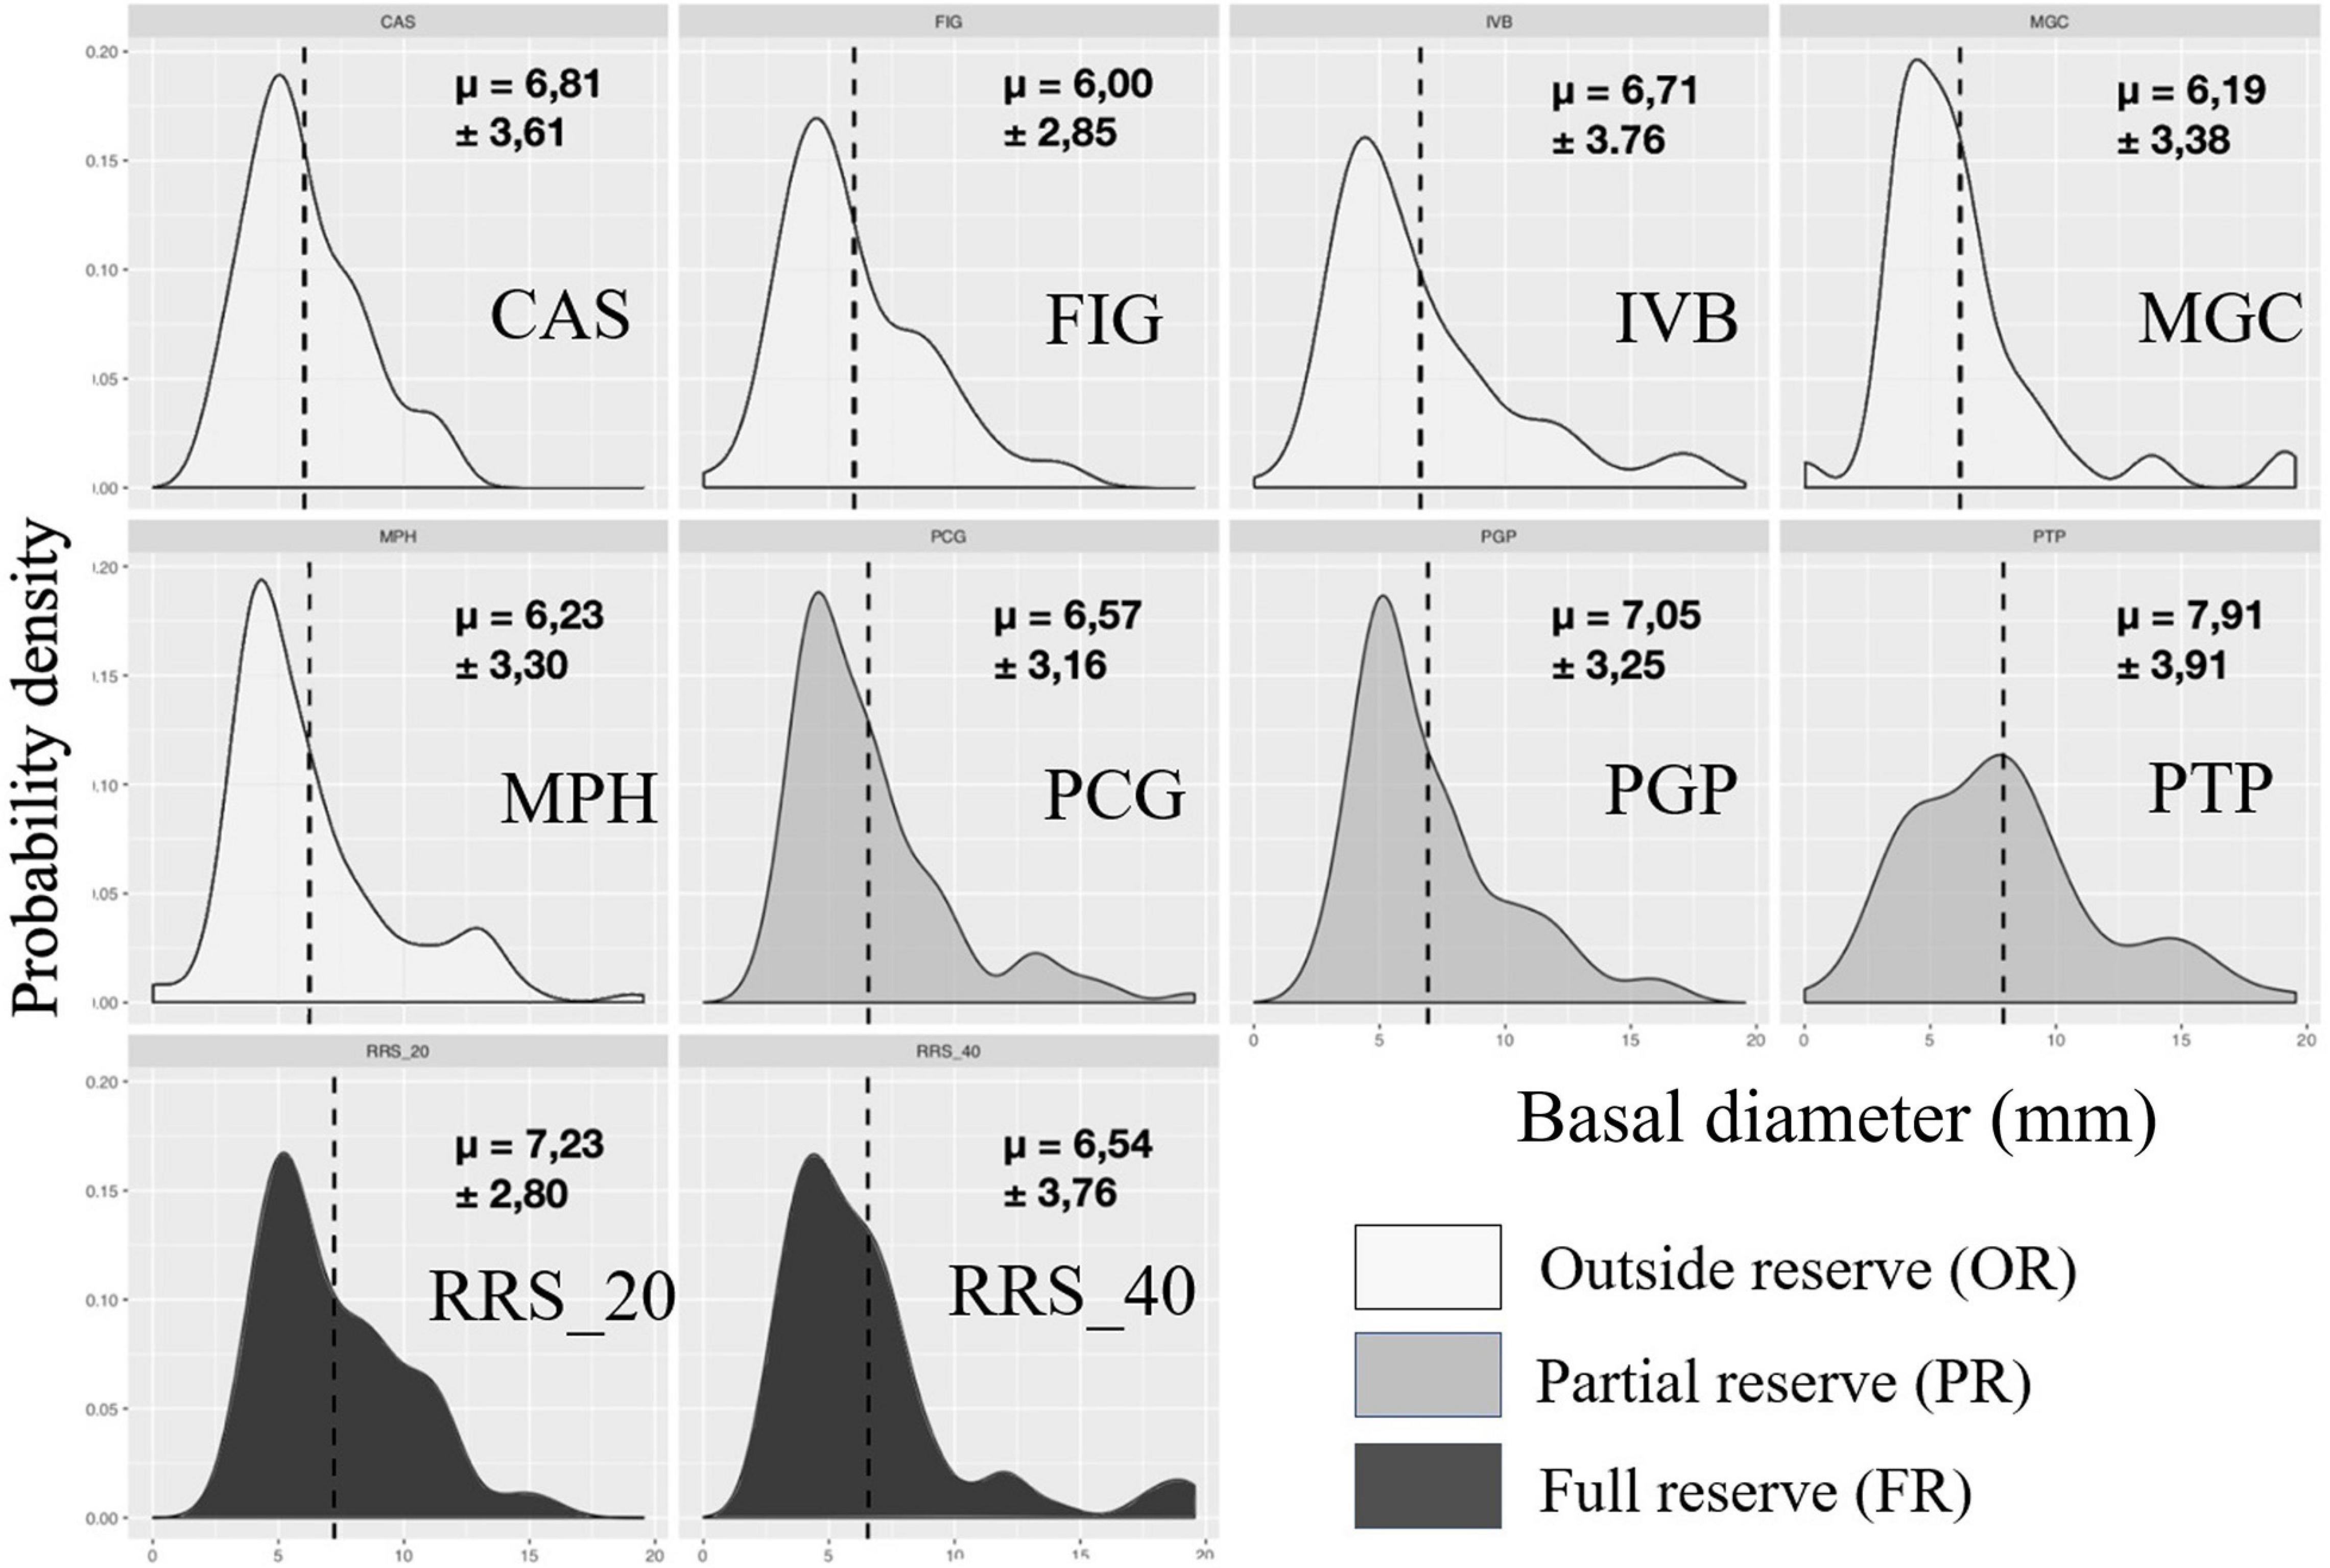
Figure 6. Calanques national park: representation of probability density functions by population of each site for basal diameter (mm) in 2020. The values indicated correspond to the means followed by the standard deviations. In dark the populations in full reserve (RRS_20; RRS_40), in medium the populations in partial reserve (PTP, PGP, PTP), in clear the populations outside the reserve (MPH, CAS, FIG, IVB, MGC).
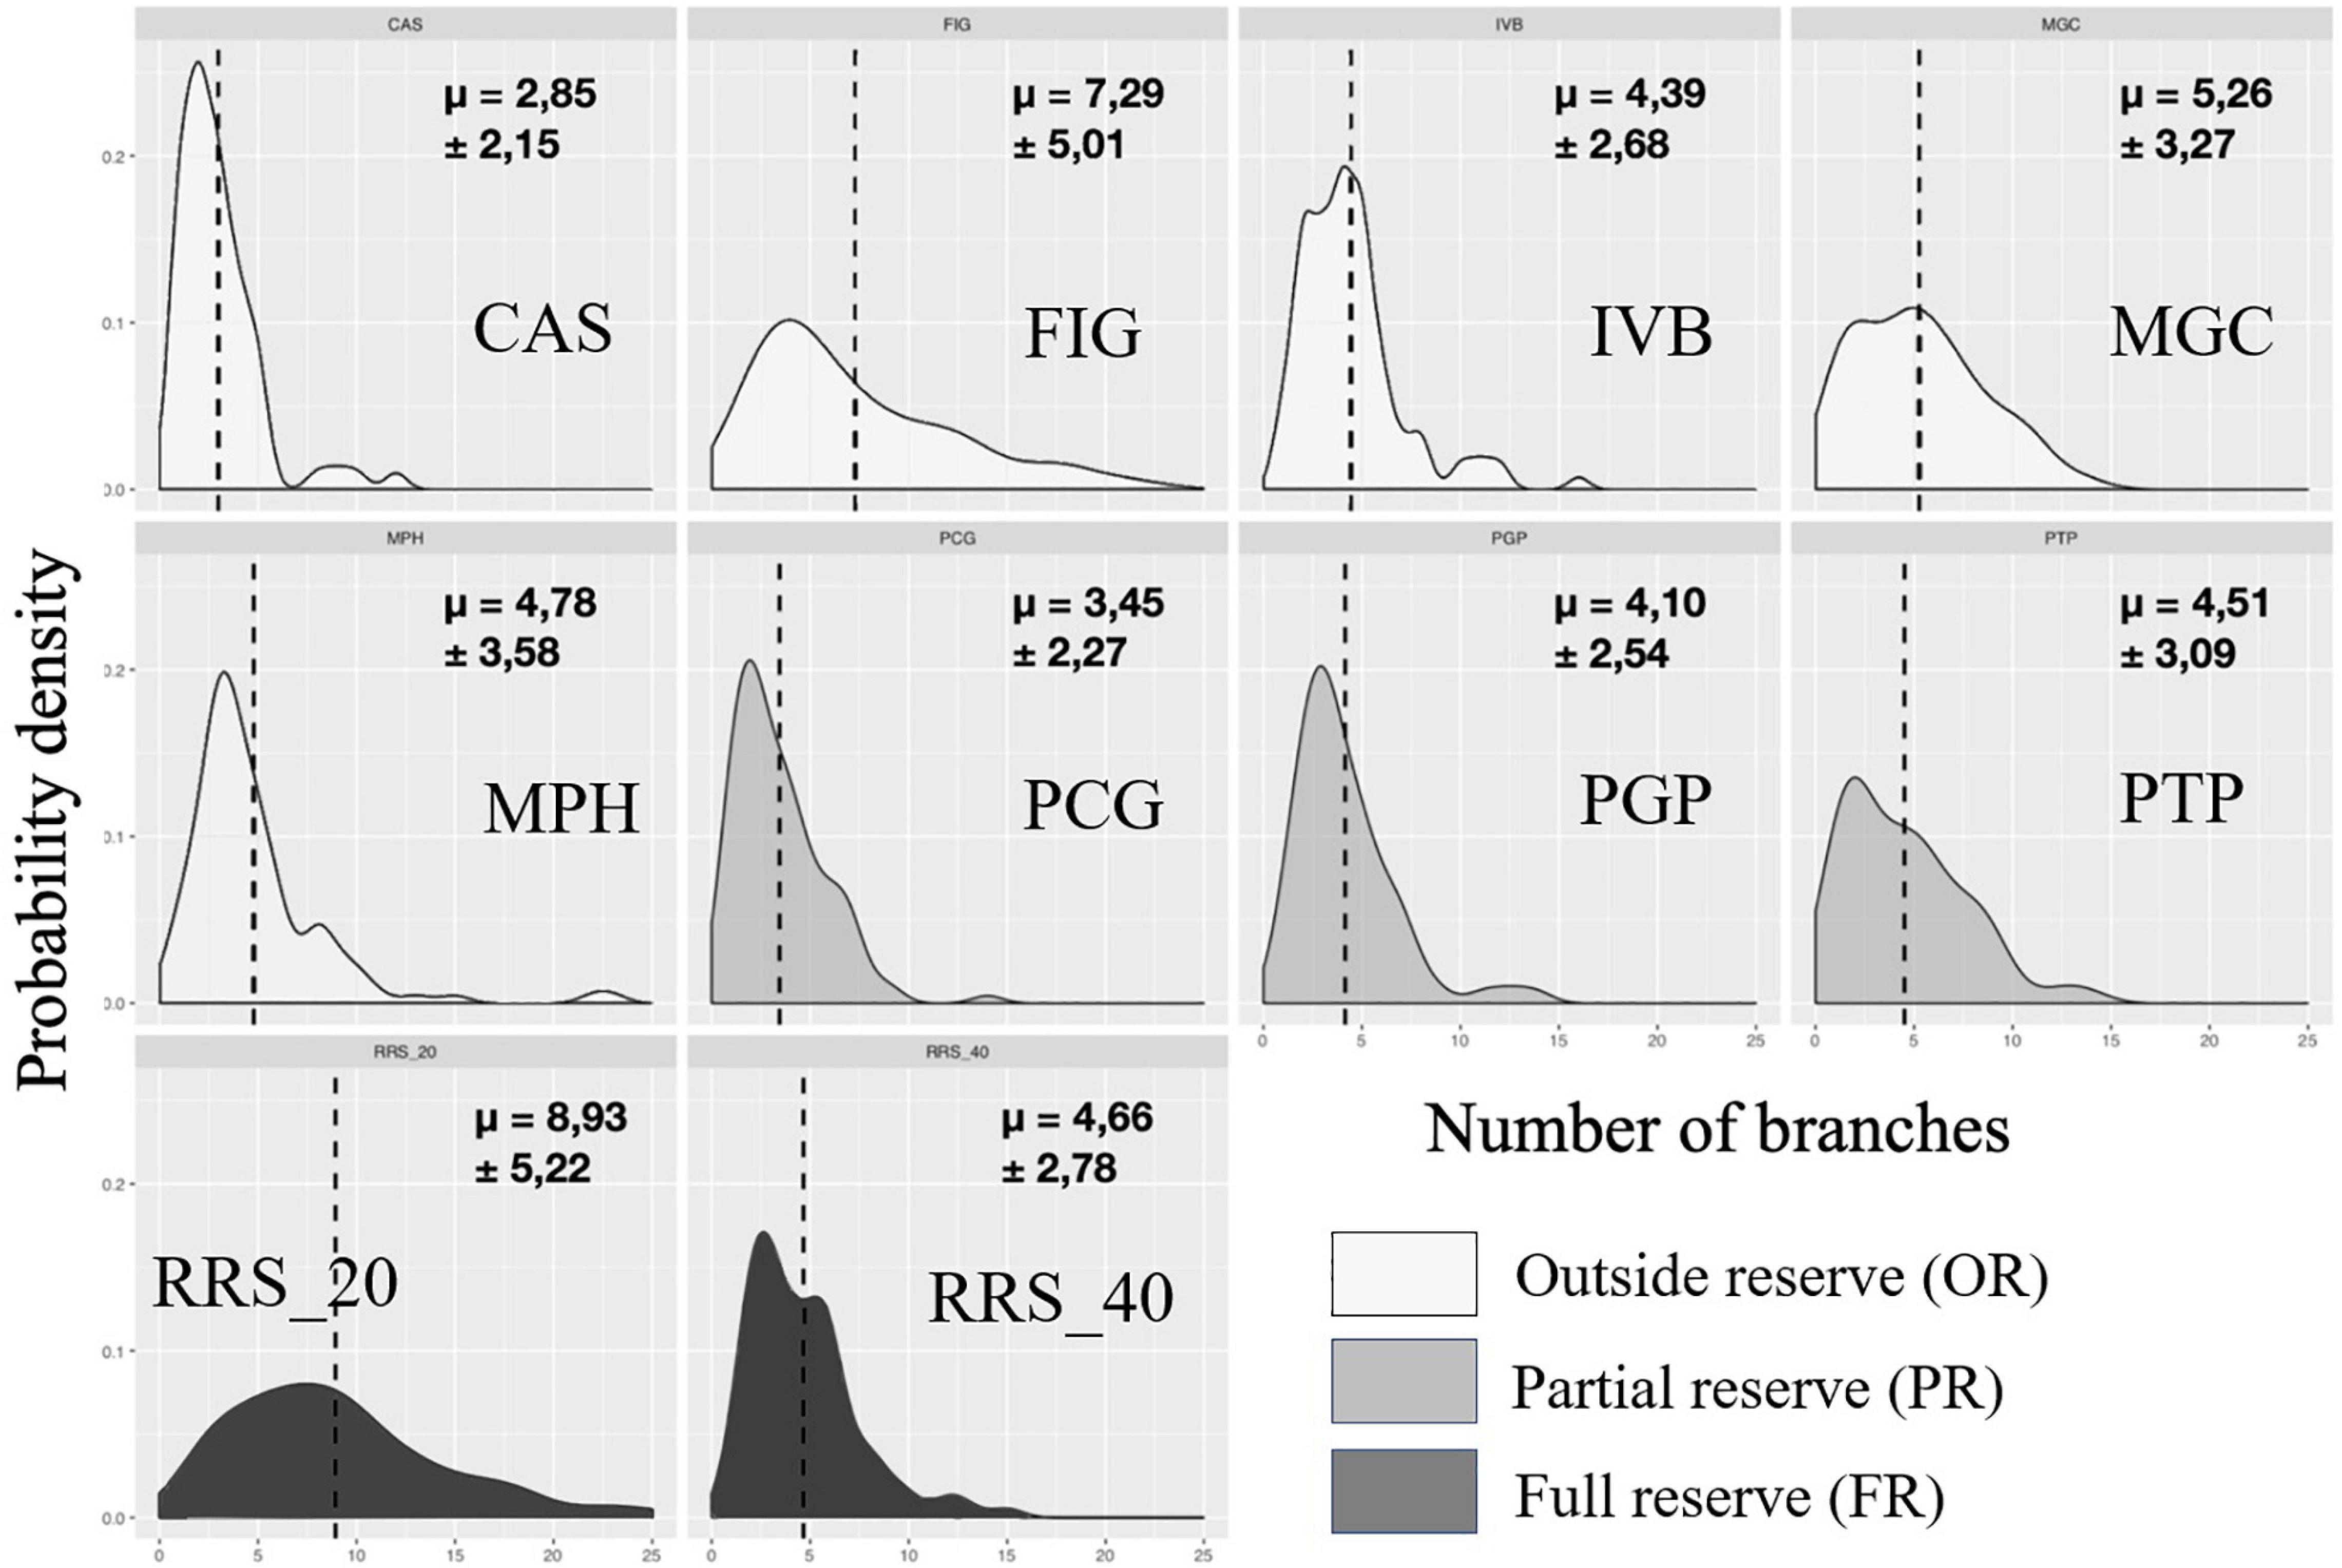
Figure 7. Calanques national park: representation of probability density functions by population of each site for the variable number of branches in 2020. The values indicated correspond to the means followed by the standard deviations. In dark the populations in full reserve (RRS_20; RRS_40), in medium the populations in partial reserve (PTP, PGP, PTP), in clear the populations outside the reserve (MPH, CAS, FIG, IVB, MGC).
When we observe the evolution of each metric between 2013 and 2019 by site, we observed various dynamic between populations, which was reflected in a significant effect of year ∗ site interaction on the multivariate dataset (PERMANOVA, p-value = 0.001, Table 3). The maximum size increased between 2013 and 2019 for all Calanques NP populations regardless of whether or not they are located inside the protection of the Calanques national park except for site Castelvieil (CAS) (Table 2).
In Cerbère-Banyuls reserve we observed a significant interaction between year and protection for the multivariate matrix (PERMANOVA, p-value = 0.022, Table 4), as well as for the univariate maximum height (PERMANOVA, p-value = 0.001, Table 4 and Figure 8) and the number of branches (PERMANOVA, p-value = 0.001, Table 4 and Figure 8). In 2020, the multivariate matrix revealed a significant difference between the populations of the full reserve and those located in the partial reserve (PERMANOVA Pair-wise comparison, p-value = 0.012, Table 5), which did not appear in 2012 (PERMANOVA Pair-wise comparison, p-value = 0.23, Table 5). Moreover the gap widens between population located outside reserve and inside full reserve from 2012 to 2020 (Figure 8). The one-to-one comparison of the three colony-scale metrics between 2012 and 2020 showed a significant effect of the interaction year ∗ protection status for maximum height (PERMANOVA, p-value = 0.001, Table 4) and number of branches (PERMANOVA p_value = 0.001, Table 4). It was confirmed when we observed graphically (Figure 8) a clearer increase from 2012 to 2020 of the difference in the maximum size and number of branches (than for basal diameter) when comparing full reserve vs. others levels. In 2012, the density functions (Figure 8) showed an almost total overlap within the Cerbère-Banyuls reserve (partial reserve and outside reserve) for the basal diameter. In 2020, there was an overlap between partial reserve and full reserve for the basal diameter distribution, considering a slight shift to the right for the full reserve modality. In 2020 for the maximum height there was a clearer shift toward higher values (Figure 8), as already confirmed by the results of the PERMANOVA (PERMANOVA p-value = 0.001, Table 4).
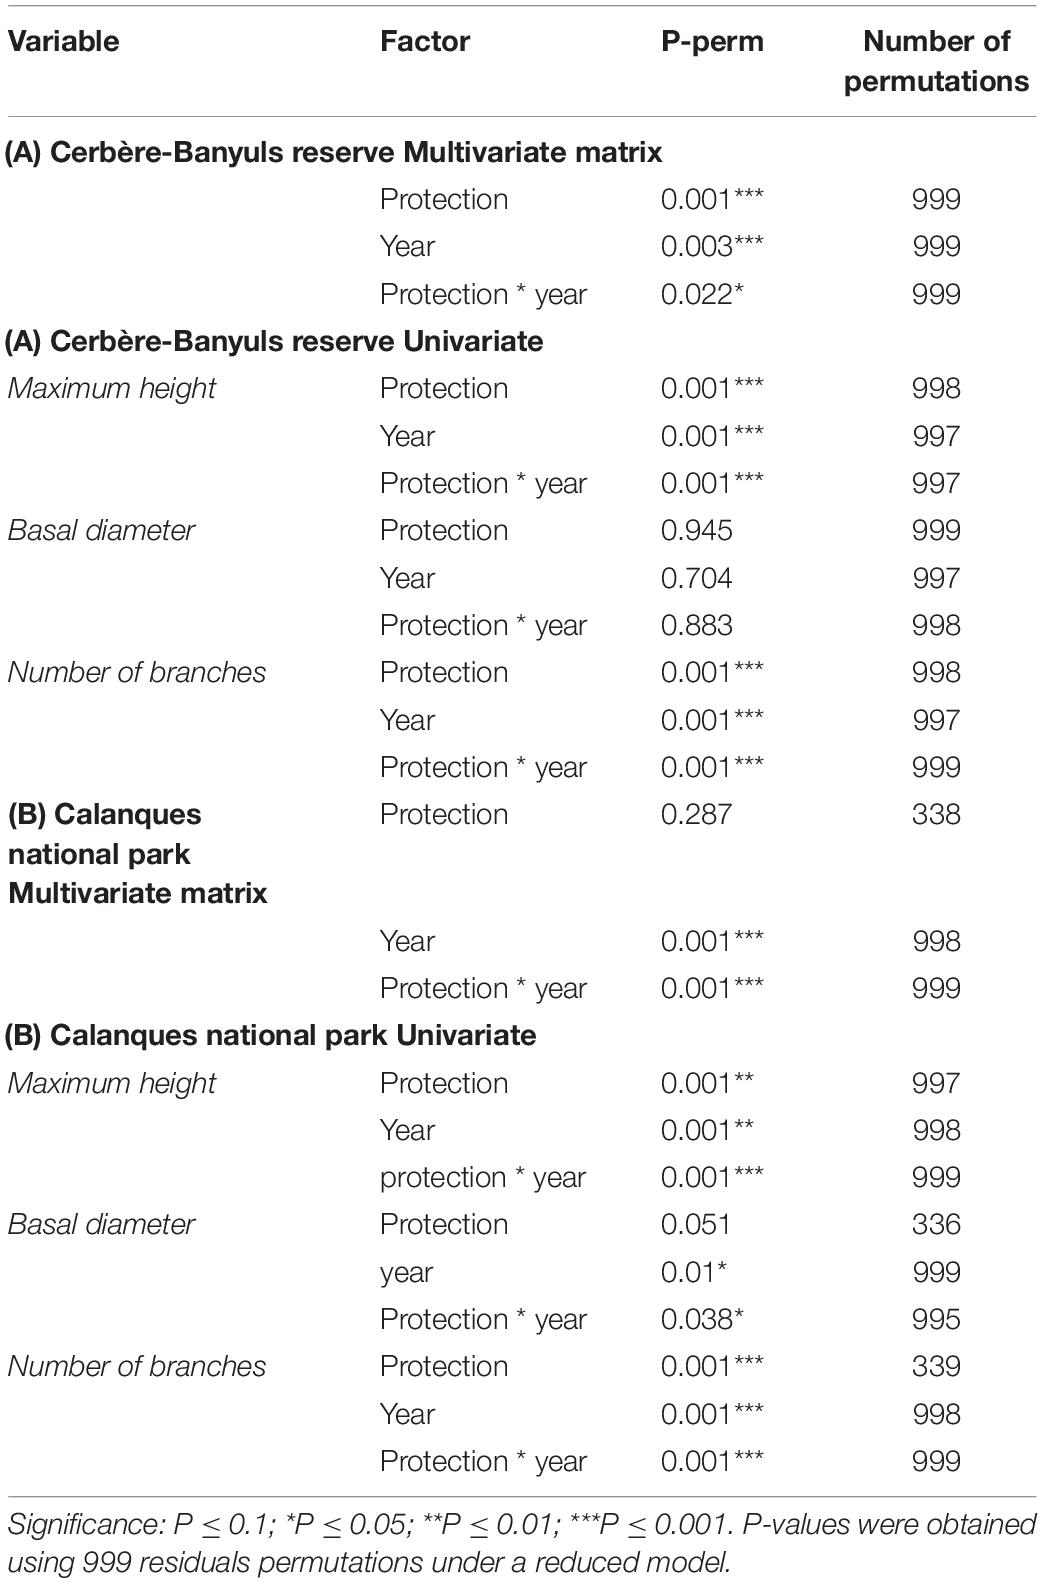
Table 4. Results of permutation analyzes of variance (PERMANOVA) in the Cerbère-Banyuls reserve (A) and the Calanques national park (B) via a design incorporating the year and protection factor (year as a fixed factor with 2 modalities; protection as a fixed factor with three modalities; interaction protection * year) for the multivariate matrix (maximum size; basal diameter; number of branches) and each univariate matrix.
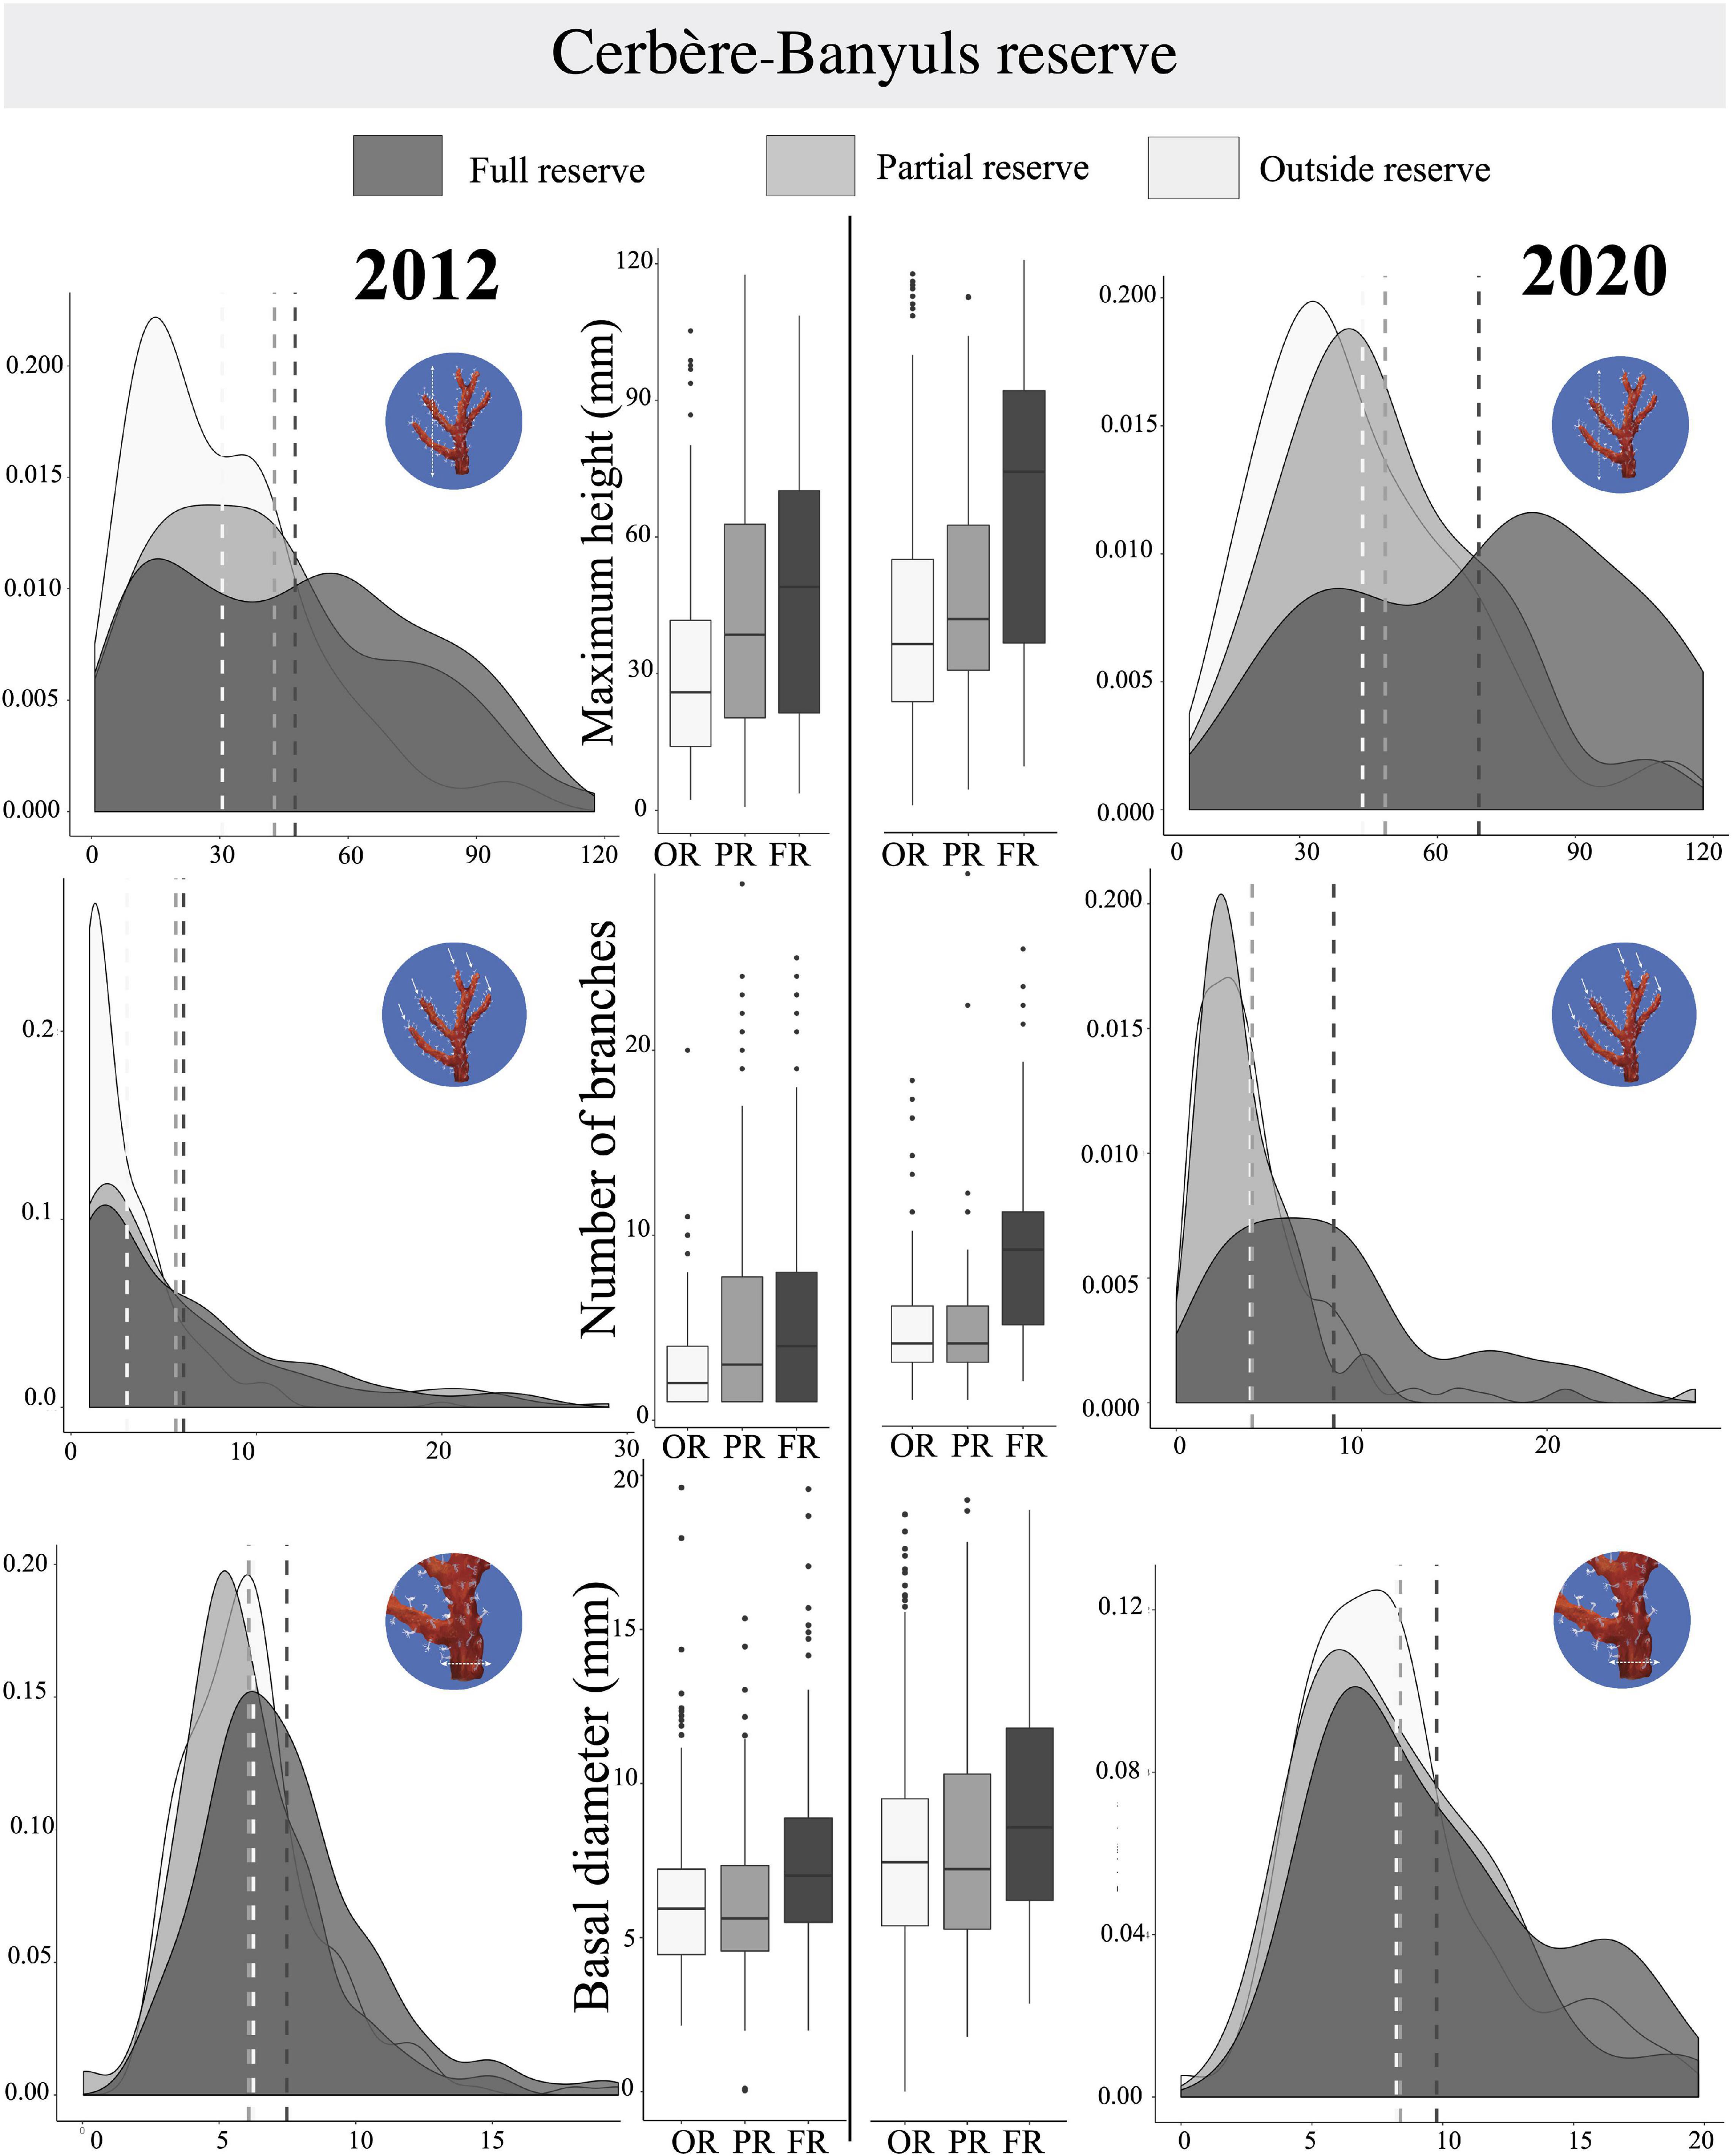
Figure 8. For Cerbère-Banyuls Reserve, representation of probability density functions and Tuckey boxplots by protection levels for each year for the variables (i) Maximum height (mm), (ii) Number of branches, and (iii) Basal diameter (mm). Sites outside reserve (in clear), in partial reserve (in medium gray), in full reserve (in dark). On density functions, mean are shown in a dotted line; Boxplots indicate the median (bold line near the center), the first and third quartile (the box), the extreme values where distance from the box is at most 1.5 times the inter-quartile range (whiskers), and remaining outliers (dark circles).
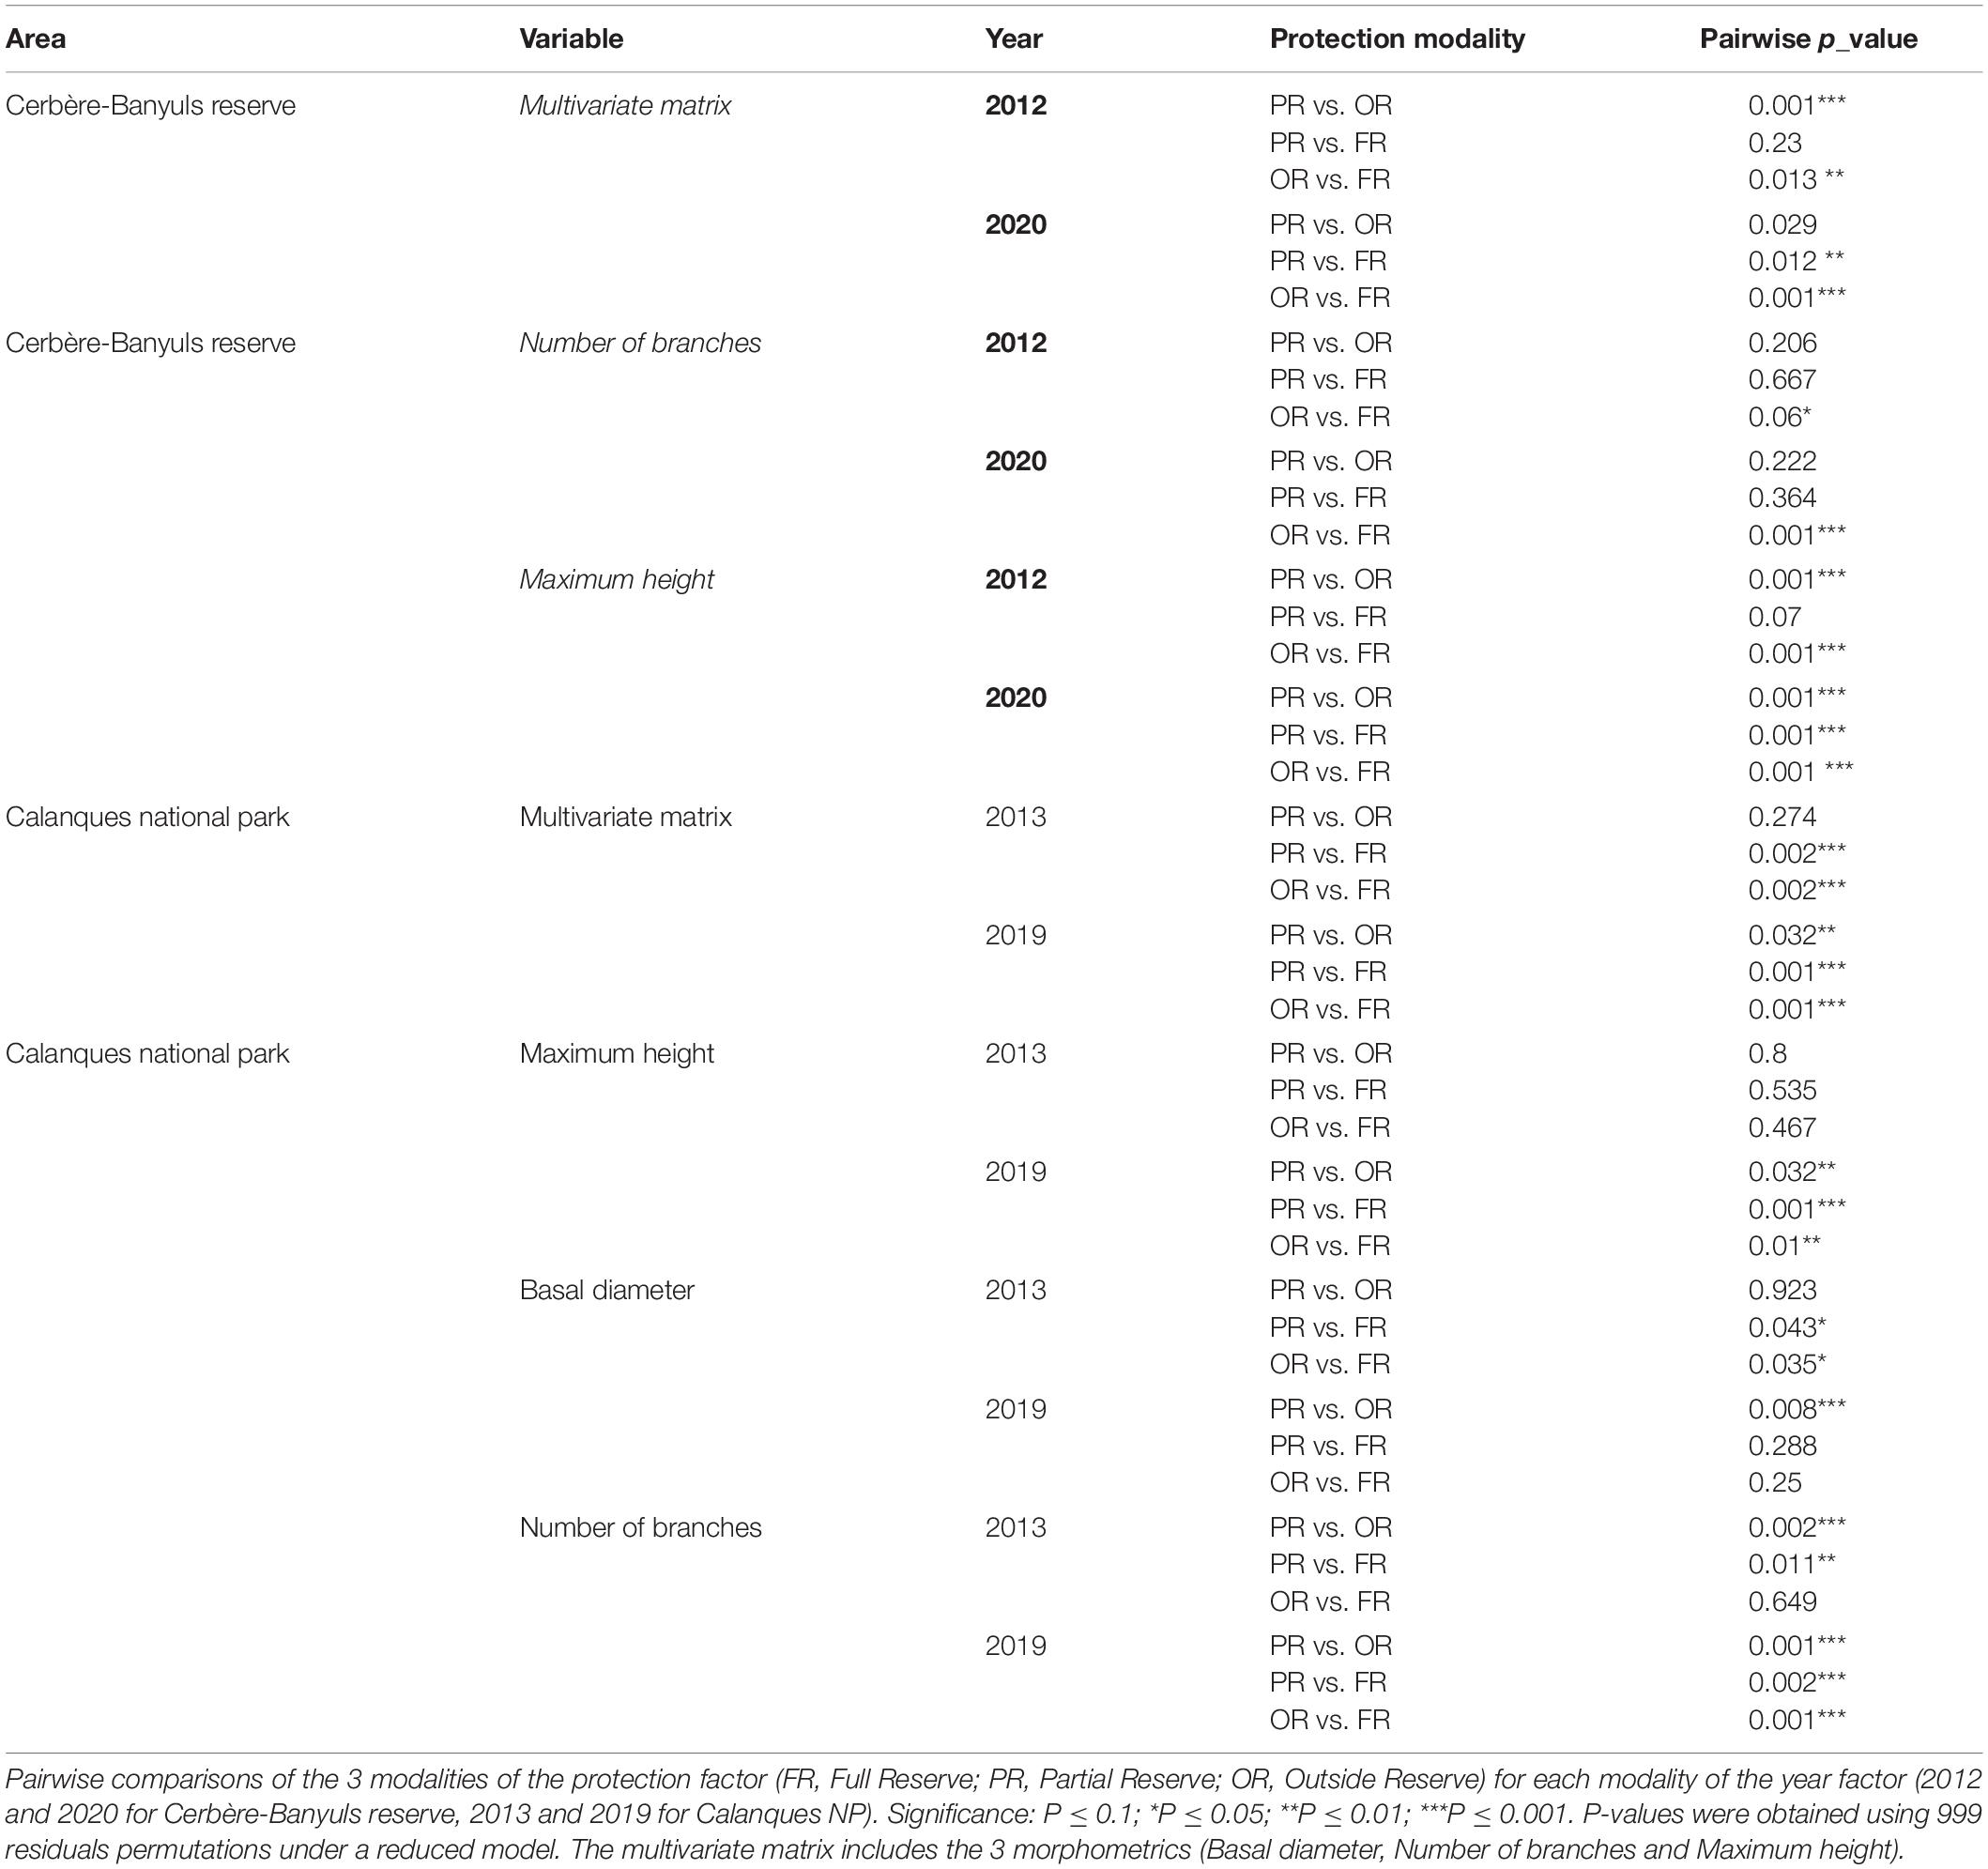
Table 5. Pair-Wise test result corresponding to the interaction between year and protection for the 3 descriptors.
We observed a significant effect of the interaction between year and protection for the multivariate matrix (PERMANOVA, p-value = 0.001, Table 4), and univariate maximum height (PERMANOVA, p-value = 0.001, Table 4), basal diameter (PERMANOVA, p-value = 0.038, Table 4) and number of branches (PERMANOVA, p-value = 0.001, Table 4). The gap widens between outside the reserve and full reserve: in 2013 there was no significant difference in the number of branches between full reserve and outside reserve (PERMANOVA Pair-wise comparison, p-value = 0.649, Table 5), while there was a significant difference in 2019 (PERMANOVA Pair-wise comparison, p-value = 0.001 In the Calanques NP there was also a significant interaction between protection and year for maximum height (PERMANOVA Pairwise comparison, p-value = 0.001). Indeed in 2013 there was no significant difference of maximum height between outside reserve, partial reserve and full reserve (respectively, PERMANOVA Pairwise comparison, p-value = 0.8; p-value = 0.535; and p-value = 0.467, Table 5). Meanwhile in 2019 there was a significant difference between outside reserve and partial reserve (PERMANOVA Pairwise comparison, p-value = 0.032), outside reserve and full reserve (PERMANOVA Pairwise comparison, p-value = 0.001) and between partial reserve and full reserve (PERMANOVA Pairwise comparison, p-value = 0.001). These results highlighted the appearance of a reserve effect between 2013 and 2019 for maximum height and number of branches. Graphically (Figure 9) in 2013, the density functions showed almost total overlap between the sites located outside reserve and inside full reserve for number of branches and maximum height. In 2019, for the number of branches, a slight shift to the right of the density function was observed for the colonies in full reserve vs. the colonies inside partial and outside reserve. For the maximum height there was a clearer shift toward higher values for the colonies inside full reserve in 2019. Finally, concerning basal diameter, although the trend was not so clear, we still observed that in 2013 there was no significant difference between outside reserve and partial reserve (PERMANOVA, p-value = 0.923) whereas there was a significant difference in 2019 (PERMANOVA, p-value = 0.008): in 2019, the density functions showed a slight shift of the basal diameter to the right for the colonies in full reserve.
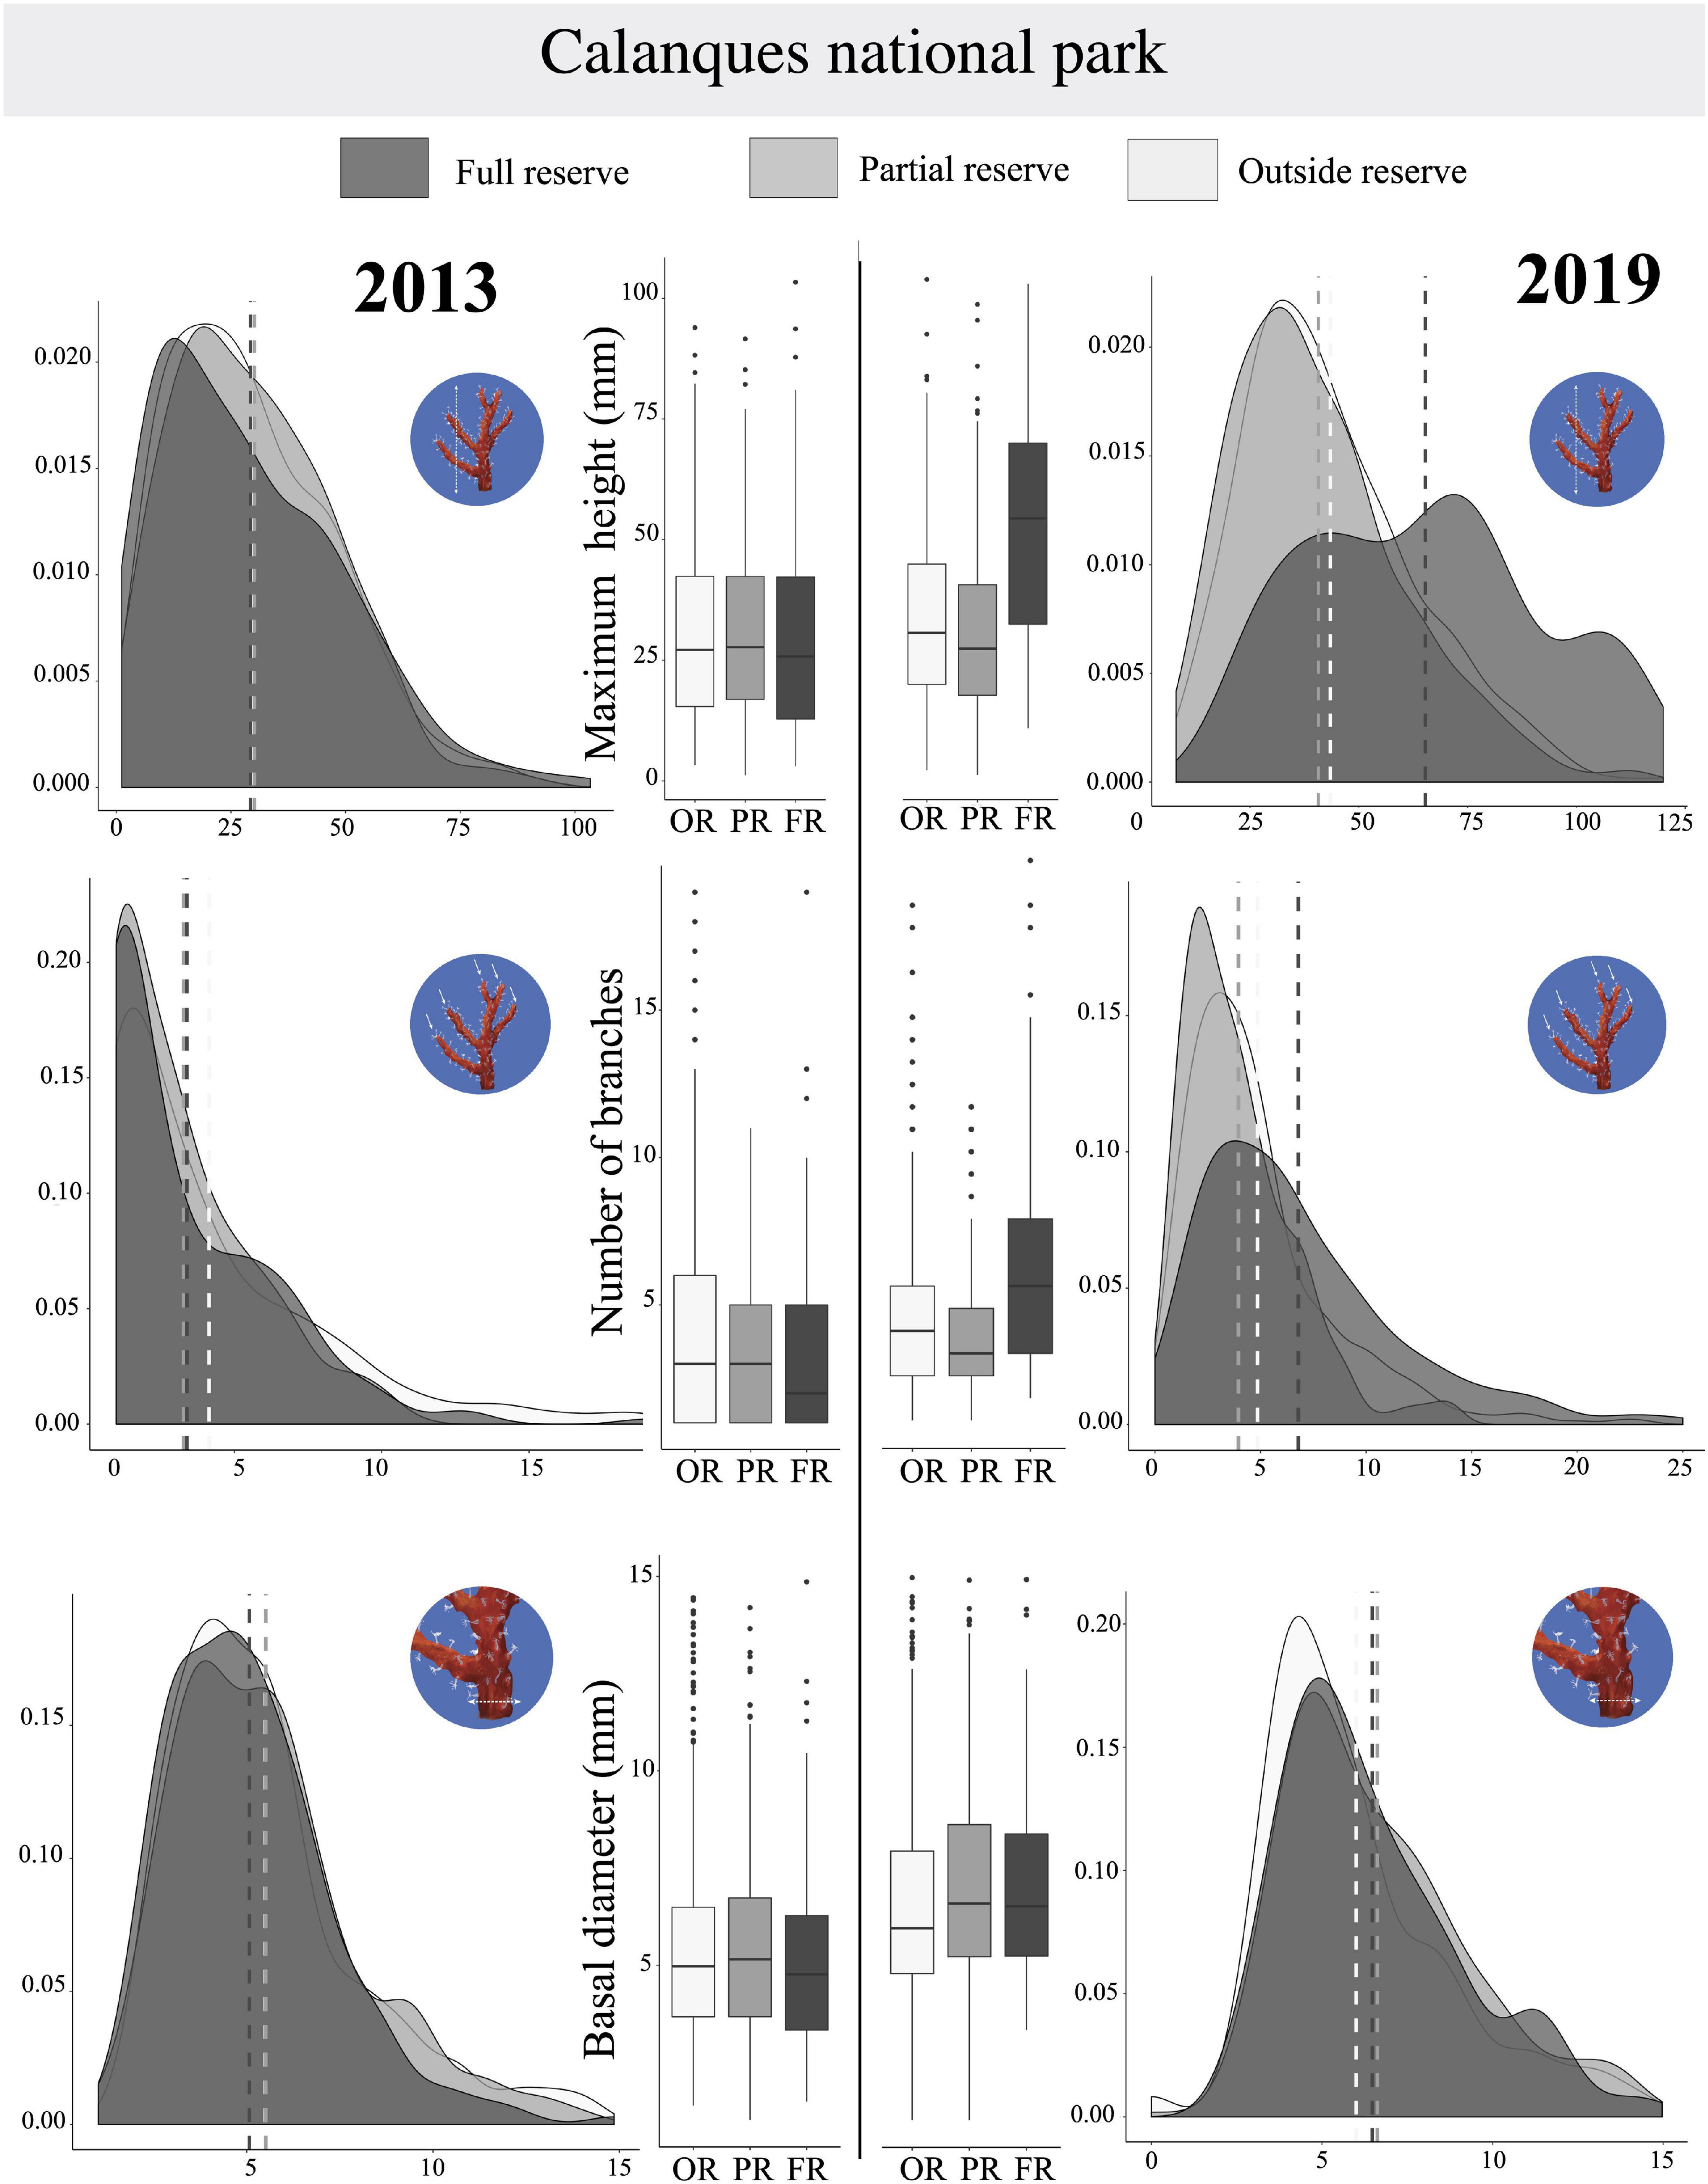
Figure 9. For Calanques National Park, representation of probability density functions and Tuckey boxplots by protection levels for each year for the variables (i) Maximum height (mm), (ii) Number of branches, and (iii) Basal diameter (mm). Sites outside reserve (in clear), in partial reserve (in medium gray), in full reserve (in dark). On density functions, mean are shown in a dotted line; Boxplots indicate the median (bold line near the center), the first and third quartile (the box), the extreme values where distance from the box is at most 1.5 times the inter-quartile range (whiskers), and remaining outliers (dark circles).
This study provides valuable demographic data obtained through photogrammetry to help infer the long-term effects of effective protection on red coral populations in 2 Mediterranean MPAs, which encompass an important geographic scale (up to about 450 km).
In our BACI design, for the Calanques National Park, we highlighted a significant interaction between protection and year on colony scale metrics (for the multivariate matrix, for maximum height, basal diameter, and for number of branches) reflecting the apparition of a reserve effect in 2019 whereas it was absent in 2013. Indeed in 2013, right after the MPA was created, no significant differences existed between colonies located outside reserve and inside reserve regarding maximum height and number of branches. However in 2019 the mean number of branches as well as the maximum height were significantly higher inside. Additionally we have seen that probability densities had changed between 2013 and 2019 for the 3 metrics at the colony scale with distinct patterns for those inside vs. outside no-take zones. These results seem to reflect the effectiveness of no-take zones where impacts are limited (coral harvesting interdiction, as well as regulated fishing) and the conditions are thus favorable to red coral. These results provide evidence for reinforced protection zones effectiveness for red coral conservation and therefore of its habitat in the Calanques National Park. Establishment of no-take zones has benefited red coral populations by limiting exploitation as well as accidental destruction by fishing gear and overall enhanced conservation conditions.
South Riou populations (RRS_20 and RRS_40) showed growth rates overpassing what is known in the wild. Previous studies already shown very high fertility on this site (Garrabou and Harmelin, 2002) and equivalent growth rates have already been obtained in a controlled environment (Goff et al., 2017). Local environmental conditions might explain these observed growth rates: little light and low temperatures [around 13°C in February; and 20°C in August (Vielzeuf et al., 2013)], proximity to a major coastal upwelling zone (Millot and Wald, 1980), influencing the diversity of organisms on the substrate (Oscarella spp., Reniera fulva, Crella mollior, Aplysina cavernicola as well as overpulids and bryozoa), lack of competition (Montero-Serra et al., 2018) as well as the composition of the microbiome (Van de Water et al., 2018). Castelvieil (CAS) observed a still different dynamic. A decrease in the maximum size was observed between 2013 and 2019 (36.62 ± 21.4–29.05 ± 14.37 mm) and in the number of branches (5.7 in 2013; 2.85 in 2019). These results reflect a mechanical destruction that was also detected by image analysis. This illustrates the effectiveness of the photogrammetric monitoring method to detect one-off events.
Concerning Cerbère-Banyuls reserve, descriptors differed from 2012 to 2020, illustrating a global natural growth of colonies. Moreover, a strong protection effect is present whatever the year, suggesting conservation measures maintain its efficiency to protect red coral.
We have highlighted a significant difference between protection levels: there is a significant effect of the protection status on maximum height and number of branches. We have also highlighted a significant effect of the interaction between year and protection status for the number of branches and maximum height, which reveals that between 2012 and 2020 the gap widens between populations from different protection statuses and in particular between partial and full reserve.
Thus, the forty years of protection carried out by the Cerbère-Banyuls reserve have significantly influenced the populations of red coral. The colonies within the full reserve are larger and more tree-like than those located in the partial reserve and outside the reserve (where both professional fishing and recreational diving are allowed). In fact, a maximum size gradient is observed according to the protection gradient: it has been observed that the maximum size is significantly greater in the full reserve, decreases in the partial reserve and was even smaller outside the reserve.
Given the current state of populations within the reserve, it seems conservation measures set by the Cerbère-Banyuls reserve such as limited use, security and guarding measures show efficiency. This is consistent with the conclusions of many authors who highlight the effectiveness of strengthened measures such as no-take zones for marine ecosystems conservation (Sala et al., 2018; Zupan et al., 2018). Our results are thus arguments encouraging perpetuating or even strengthening these measures. In addition, it should be reminded that deep populations may be able to constitute a genetic refuge for populations (Priori et al., 2013; Cannas et al., 2016) and therefore could also be the subject of conservatory measures.
Thus, our results are consistent with the conclusions of many authors who emphasize the effectiveness of enhanced measures such as no-take zones for the conservation of marine ecosystems (Sala et al., 2018; Zupan et al., 2018). The old CB reserve still show efficiency to conserve its red coral populations, and a 5-year step allowed the appearance of a reserve effect in the recently settled Calanques national park. Our study sets a comparative data baseline and thus makes it possible to follow the dynamics of red coral which is essential: understanding the life cycle of long-lived species subjected to both exploitation and natural disturbances is an essential prerequisite for conservation (Garrabou and Harmelin, 2002).
Red coral is endemic to the Mediterranean but subject to various regulations depending on the area considered, which can sometimes be a source of conflict (Cau et al., 2013; Bruckner, 2014; Cannas et al., 2016; Cattaneo-Vietti et al., 2016). It appears to be a need for harmonization of management practices at the species range level because public authorities do not seem to follow: in 2020, red coral was still not listed under the CITES (Convention on International Trade in Endangered Species of Wild Fauna and Flora).
Achieving red coral conservation and broadly coralligenous habitats in the Mediterranean needs an adaptation of managers to local needs for conservation at the range scale (Giakoumi et al., 2013; Vassallo et al., 2018). Enhanced protection measures such as no-take zones and full reserves have been demonstrated to be the most effective in protecting marine biodiversity and new initiatives need to be taken (Casale et al., 2018; Sala et al., 2018). However only 0.04% of the Mediterranean Sea is affected by such measures to date (PISCO., 2016). Investigating the socio-economic impacts of management measures and governance perception by users appears to be a good way to better understand the territory in order to manage it. Finally, such work could provide a global vision of both management and conservation of red coral in the Mediterranean and act in favor of the species and its habitat (Costantini and Abbiati, 2016).
Aurelle et al. (2011) showed that the genetic structures of red coral populations corresponded to the habitat gaps available between Marseille and Catalonia as well as in the Adriatic. This highlights the need of reinforced conservation measures across the range. Some authors emphasize the need to include the conservation of genetic variation and population structure as one of the goals of red coral management (Santangelo et al., 2012; Cattaneo-Vietti et al., 2016) while others recall its functionality within the coralligenous (Ballesteros, 2006). This induces the need to take local initiatives to conserve the species and in particular shallow perennial populations such as those of Cerbère-Banyuls and Calanques national park when global warming and extreme climatic events are a growing threat in the face of thermo-tolerance of 25°C (Torrents, 2007).
Our study populations are located at the edge of the range of the French Mediterranean, in areas whose hydrogeographic conditions explain why they are the least impacted by massive mortality episodes due to extreme weather events (Bally and Garrabou, 2007; Garcia-Rubies et al., 2009; Calvo et al., 2011; Crisci et al., 2011).
However, the evolving risk minimization strategy (Stearns, 1992; Bramanti et al., 2005; Torrents, 2007; Linares et al., 2010; Torrents and Garrabou, 2011) that red coral seems to follow is adapted to species in habitats where environmental conditions are stable but could pose serious challenges for the conservation of shallow populations in the current context of climate change (Linares et al., 2013). It could therefore be interesting to study population genetics by comparing Calanques national park and Cerbère-Banyuls populations to understand their resilience to future disruptions such as the introduction of invasive species, major climate events similar to those of 1999 or 2003 and more broadly global climate change.
However, if shallow populations are the most resistant due to their exposure to significant seasonal variations in temperature (Ledoux et al., 2010; Haguenauer et al., 2013), deep populations might be able to repopulate shallower ones (Bongaerts et al., 2017), reflecting the importance of implementing conservation measures for the latter. Thus, global strategies appear capital while defining management measures at the local level, particularly through MPA managers networking (e.g., MedPAN). This highlights a real need for a monitoring network for vulnerable ecosystems (Danovaro et al., 2017; Montero-Serra et al., 2018) and more, the need to involve MPA managers and stakeholders in conservation and not only surveillance. Subsequently, an interest could be focused on implementing measures to restore populations in the Mediterranean (Aurelle et al., 2011; Montero-Serra et al., 2018).
In the present study, photogrammetry tools were used at the scale of the quadrats. However, it might be interesting to think about the scale of the underwater landscape. Seascape as indeed been proven to be an adequate study scale to better understand marine life mechanisms (Cuadros et al., 2017; Smeltz et al., 2019). In this context, modeling via photogrammetry can provide information on species coverage and in particular the spatial dynamics of sessile species over time (Burns et al., 2015; Casella et al., 2017; Ferrari et al., 2017a, b). Indeed, if the image processing takes longer than for a study using photoquadrats, the information that can be extracted from them is unprecedented. During a study using photoquadrats, biases may appear, especially if the field operator is different between the field campaigns: the exact location of the sites can be tricky. This study allows to minor human bias in comparison to in situ study: site localization might not be easy in turbid waters context such as in Cerbère-Banyuls.
Representing a site at the scale of the seascape helps limit these bias. 3D modeling of seascapes allows to locate the distribution of red coral patches on a landscape scale and thus realize their position within the coralligenous habitat: overhanging rocks. Modeling can make it possible to take account of changes in the distribution of fixed fauna and it could be interesting to develop these tools for the conservation of red coral populations in MPAs. These tools might give better insight of population dynamics of sessile organisms throughout time (Burns et al., 2015; Ferrari et al., 2016, 2017b). Besides, the use of photogrammetry still lacks to study coralligenous habitats and particularly relations between coralligenous 3D structure and its associated vagile fauna and communities.
Finally, our results underlined once more the need to engage conservation efforts in the Mediterranean to conserve sessile fauna. All of these data highlighted the effectiveness of MPAs and the real need to structure a monitoring network for these vulnerable ecosystems (Danovaro et al., 2017; Montero-Serra et al., 2018) and in particular of these populations of indicator species. In this sense, initiatives exist to use coralligenous species (gorgonians, corals) as indicators. Such indicators are the subject of current discussions within the framework of the European framework directives and it is desirable that these consultations lead to the long-term support and sustainability of such large-scale spatial surveillance networks. With this long-term objective, we highlighted in our study the usefulness of photogrammetry and 3D metrics as efficient and cost-effective methods allowing large-scale and long term monitoring based on reliable tools.
The raw data supporting the conclusions of this article will be made available by the authors, without undue reservation.
AC, PD, and OB designed the experiments. AC and OB managed the funding acquisition and performed the field work. JR and AC compiled and analyzed output data and designed and wrote the first version of the manuscript. JR, AC, and PD prepared the revised version of the manuscript. All authors discussed the results and implications and commented on the manuscript at all stages and contributed extensively to the work presented in this manuscript.
This study was funded within the framework of the long term monitoring program of both MPAs: In the Calanques of Marseilles by the Calanques National Park and in the Cerbère-Banyuls Natural Marine Reserve by the Conseil Départemental des Pyrénées Orientales and the Parc Naturel Marin du Golfe du Lion (OFB).
The authors declare that the research was conducted in the absence of any commercial or financial relationships that could be construed as a potential conflict of interest.
All claims expressed in this article are solely those of the authors and do not necessarily represent those of their affiliated organizations, or those of the publisher, the editors and the reviewers. Any product that may be evaluated in this article, or claim that may be made by its manufacturer, is not guaranteed or endorsed by the publisher.
The authors thank the numerous collaborators that contributed to the research on red coral ecology. The authors are also grateful to AF and KP for reviewing the manuscript.
The Supplementary Material for this article can be found online at: https://www.frontiersin.org/articles/10.3389/fmars.2021.639334/full#supplementary-material
Anderson, M. J. (2001). Permutation tests for univariate or multivariate analysis of variance and regression. Can. J. Fish. Aquat. Sci. 58, 626–639. doi: 10.1139/f01-004
Anderson, M. J., Gorley, R. N., and Clarke, K. R. (2008). PERMANOVA+ for PRIMER: Guide to software and statistical methods. Plymouth: Primer-E, 214.
Aurelle, D., Ledoux, J.-B., Rocher, C., Borsa, P., Chenuil, A., and Féral, J.-P. (2011). Phylogeography of the red coral (Corallium rubrum): inferences on the evolutionary history of a temperate gorgonian. Genetica 139:855. doi: 10.1007/s10709-011-9589-6
Ballesteros, E. (2006). Mediterranean coralligenous assemblages: a synthesis of present knowledge (PhD Thesis). thesis of present knowledge. Oceanogr. Mar. Biol. 44, 123–195. doi: 10.1201/9781420006391.ch4
Bally, M., and Garrabou, J. (2007). Thermodependent bacterial pathogens and mass mortalities in temperate benthic communities: a new case of emerging disease linked to climate change. Glob. Change Biol. 13, 2078–2088. doi: 10.1111/j.1365-2486.2007.01423.x
Bongaerts, P., Riginos, C., Brunner, R., Englebert, N., Smith, S. R., and Hoegh-Guldberg, O. (2017). Deep reefs are not universal refuges: reseeding potential varies among coral species. Sci. Adv. 3:e1602373. doi: 10.1126/sciadv.1602373
Bonhomme, P., Berman, L., Le Direach, L., Bianchimani, O., Rouanet, E., Bonhomme, D., et al. (2015). Réalisation de l’état zéro des zones de non- prélèvement du Parc national des Calanques - Année 2013-2014. Marseille: GIS Posidonie Publisher.
Bramanti, L., Magagnini, G., De Maio, L., and Santangelo, G. (2005). Recruitment, early survival and growth of the Mediterranean red coral Corallium rubrum (L 1758), a 4-year study. J. Exp. Mar. Biol. Ecol. 314, 69–78. doi: 10.1016/j.jembe.2004.08.029
Bramanti, L., Movilla, J., Guron, M., Calvo, E., Gori, A., Dominguez-Carrió, C., et al. (2013). Detrimental effects of ocean acidification on the economically important Mediterranean red coral (Corallium rubrum). Glob. Change Biol. 19, 1897–1908. doi: 10.1111/gcb.12171
Bruckner, A. (2014). Advances in management of precious corals in the family Corallidae: are new measures adequate? Curr. Opin. Environ. Sustain. 7, 1–8. doi: 10.1016/j.cosust.2013.11.024
Bruckner, A. W. (2009). Rate and extent of decline in Corallium (pink and red coral) populations: existing data meet the requirements for a CITES Appendix II listing. Mar. Ecol. Prog. Ser. 397, 319–332. doi: 10.3354/meps08110
Burns, J., and Delparte, D. (2017). Comparison of commercial structure-from-motion photogrammety software used for underwater three-dimensional modeling of coral reef environments. Int. Arch. Photogramm. Remote Sens. Spat. Inf. Sci. 42:127. doi: 10.5194/isprs-archives-xlii-2-w3-127-2017
Burns, J., Delparte, D., Gates, R., and Takabayashi, M. (2015). Integrating structure-from-motion photogrammetry with geospatial software as a novel technique for quantifying 3D ecological characteristics of coral reefs. PeerJ 3:e1077. doi: 10.7717/peerj.1077
Bythell, J., Pan, P., and Lee, J. (2001). Three-dimensional morphometric measurements of reef corals using underwater photogrammetry techniques. Coral Reefs 20, 193–199. doi: 10.1007/s003380100157
Calvo, E., Simó, R., Coma, R., Ribes, M., Pascual, J., Sabatés, A., et al. (2011). Effects of climate change on Mediterranean marine ecosystems: the case of the Catalan Sea. Clim. Res. 50, 1–29. doi: 10.3354/cr01040
Cannas, R., Sacco, F., Cau, A, Cuccu, D., Follesa, M. C., and Cau, A. (2016). Genetic monitoring of deep-water exploited banks of the precious Sardinia coral Corallium rubrum (L., 1758): useful data for a sustainable management. Aquat. Conserv. Mar. Freshw. Ecosyst. 26, 236–250. doi: 10.1002/aqc.2522
Casale, P., Broderick, A. C., Camiñas, J. A., Cardona, L., Carreras, C., Demetropoulos, A., et al. (2018). Mediterranean sea turtles: current knowledge and priorities for conservation and research. Endanger. Species Res. 36, 229–267. doi: 10.3354/esr00901
Casella, E., Collin, A., Harris, D., Ferse, S., Bejarano, S., Parravicini, V., et al. (2017). Mapping coral reefs using consumer-grade drones and structure from motion photogrammetry techniques. Coral Reefs 36, 269–275. doi: 10.1007/s00338-016-1522-0
Cattaneo-Vietti, R., Bo, M., Cannas, R., Cau, A., Follesa, C., Meliadò, E., et al. (2016). An overexploited Italian treasure: past and present distribution and exploitation of the precious red coral Corallium rubrum (L., 1758) (Cnidaria: Anthozoa). Ital. J. Zool. 83, 443–455. doi: 10.1080/11250003.2016.1255788
Cau, A., Cannas, R., Sacco, F., and Follesca, M. (2013). Adaptive management plan for red coral (Corallium rubrum) in the GFCM competence area. Rome: FAO.
Clarke, K. R., Gorley, R. N., Somerfield, P. J., and Warwick, R. M. (2014). Change in marine communities: an approach to statistical analysis and interpretation. Plymouth: Primer-E Ltd.
Costantini, F., and Abbiati, M. (2016). Into the depth of population genetics: pattern of structuring in mesophotic red coral populations. Coral Reefs 35, 39–52. doi: 10.1007/s00338-015-1344-5
Crisci, C., Bensoussan, N., Romano, J.-C., and Garrabou, J. (2011). Temperature anomalies and mortality events in marine communities: insights on factors behind differential mortality impacts in the NW Mediterranean. PLoS One 6:e23814. doi: 10.1371/journal.pone.002381
Cuadros, A., Moranta, J., Cardona, L., Thiriet, P., Pastor, J., Arroyo, N. L., et al. (2017). Seascape attributes, at different spatial scales, determine settlement and post-settlement of juvenile fish. Estuar. Coast. Shelf Sci. 185, 120–129. doi: 10.1016/j.ecss.2016.12.014
Danovaro, R., Aguzzi, J., Fanelli, E., Billett, D., Gjerde, K., Jamieson, A., et al. (2017). An ecosystem-based deep-ocean strategy. Science 355, 452–454. doi: 10.1126/science.aah7178
Drap, P., Merad, D., Mahiddine, A., Seinturier, J., Gerenton, P., Peloso, D., et al. (2014). In situ underwater measurements of red coral: non-intrusive approach based on coded targets and photogrammetry. Int. J. Herit. Digit. Era 3, 123–139. doi: 10.1260/2047-4970.3.1.123
Drap, P., Merad, D., Mahiddine, A., Seinturier, J., Gerenton, P., Peloso, D., et al. (2013a). “Automating the measurement of red coral in situ using underwater photogrammetry and coded targets,” in Proceedings of the XXIV International CIPA Symposium, Strasbourg, France.
Drap, P., Merad, D., Seinturier, J., Mahiddine, A., Peloso, D., Boï, J.-M., et al. (2013b). Underwater programmetry for archaeology and marine biology: 40 years of experience in Marseille, France, in Proceedings of the Digital Heritage International Congress (DigitalHeritage), (France: IEEE), 97–104.
Ferrari, R., Figueira, W. F., Pratchett, M. S., Boube, T., Adam, A., Kobelkowsky-Vidrio, T., et al. (2017a). 3D photogrammetry quantifies growth and external erosion of individual coral colonies and skeletons. Sci. Rep. 7:16737.
Ferrari, R., Malcolm, H. A., Byrne, M., Friedman, A., Williams, S. B., Schultz, A., et al. (2017b). Habitat structural complexity metrics improve predictions of fish abundance and distribution. Ecography 41, 1077–1091 doi: 10.1111/ecog.02580
Ferrari, R., McKinnon, D., He, H., Smith, R. N., Corke, P., González-Rivero, M., et al. (2016). Quantifying Multiscale Habitat Structural Complexity: A Cost-Effective Framework for Underwater 3D Modelling. Remote Sens. 8:113. doi: 10.3390/rs8020113
Flemming, N. C. (1972). Relative chronology of submerged Pleistocene marine erosion features in the western Mediterranean. J. Geol. 80, 633–662. doi: 10.1086/627793
Garcia-Rubies, A., Mateo, M. A., Hereu, B., Coma, R., Teixidó, T., Garrabou, Q., et al. (2009). “Preliminary assessment of the impact of an extreme storm on Catalan Mediterranean shallow benthic communities,” in Poster at the 11th Plinius Conference on Mediterranean Storms, Barcelona.
Garrabou, J., and Harmelin, J.-G. (2002). A 20-year study on life-history traits of a harvested long-lived temperate coral in the NW Mediterranean: insights into conservation and management needs. J. Anim. Ecol. 71, 966–978. doi: 10.1046/j.1365-2656.2002.00661.x
Garrabou, J., Perez, T., Sartoretto, S., and Harmelin, J. G. (2001). Mass mortality event in red coral Corallium rubrum populations in the Provence region (France, NW Mediterranean). Mar. Ecol. Prog. Ser. 217, 263–272. doi: 10.3354/meps217263
Giakoumi, S., Sini, M., Gerovasileiou, V., Mazor, T., Beher, J., Possingham, H. P., et al. (2013). Ecoregion-Based Conservation Planning in the Mediterranean: Dealing with Large-Scale Heterogeneity. PLoS One 8:e76449. doi: 10.1371/journal.pone.0076449
Gibson, R., Atkinson, R., and Gordon, J. (2006). Mediterranean coralligenous assemblages: a synthesis of present knowledge. Oceanogr. Mar. Biol. Annu. Rev. 44, 123–195.
Goff, C. L., Tambutté, E., Venn, A. A., Techer, N., Allemand, D., and Tambutté, S. (2017). In vivo pH measurement at the site of calcification in an octocoral. Sci. Rep. 7:11210. doi: 10.1038/s41598-017-10348-4
Haguenauer, A., Zuberer, F., Ledoux, J.-B., and Aurelle, D. (2013). Adaptive abilities of the Mediterranean red coral Corallium rubrum in a heterogeneous and changing environment: from population to functional genetics. J. Exp. Mar. Biol. Ecol. 449, 349–357. doi: 10.1016/j.jembe.2013.10.010
Ledoux, J.-B., Garrabou, J., Bianchimani, O., Drap, P., Féral, J.-P., and Aurelle, D. (2010). Fine-scale genetic structure and inferences on population biology in the threatened Mediterranean red coral, Corallium rubrum. Mol. Ecol. 19, 4204–4216 doi: 10.1111/j.1365-294x.2010.04814.x
Lester, S. E., Halpern, B. S., Grorud-Colvert, K., Lubchenco, J., Ruttenberg, B. I., Gaines, S. D., et al. (2009). Biological effects within no-take marine reserves: a global synthesis. Mar. Ecol. Prog. Ser. 384, 33–46. doi: 10.3354/meps08029
Linares, C., Bianchimani, O., Torrents, O., Marschal, C., Drap, P., and Garrabou, J. (2010). Marine Protected Areas and the conservation of long-lived marine invertebrates: the Mediterranean red coral. Mar. Ecol. Prog. Ser. 402, 69–79. doi: 10.3354/meps08436
Linares, C., Cebrian, E., Kipson, S., and Garrabou, J. (2013). Does thermal history influence the tolerance of temperate gorgonians to future warming? Mar. Environ. Res. 89, 45–52. doi: 10.1016/j.marenvres.2013.04.009
Linares, C., Garrabou, J., Hereu, B., Diaz, D., Marschal, C., Sala, E., et al. (2012). Assessing the Effectiveness of Marine Reserves on Unsustainably Harvested Long−Lived Sessile Invertebrates. Conserv. Biol. 26, 88–96. doi: 10.1111/j.1523-1739.2011.01795.x
Lo Basso, L., and Raveux, O. (2018). Introduction. Le Corail, un Kaléidoscope Pour L’étude de la Méditerranée Dans le Temps Long. Rives Méditérannéennes 7–15. doi: 10.4000/rives.5566
Ludvigsen, M., Eustice, R., and Singh, H. (2006). Photogrammetric models for marine archaeology. Paper Presented at the OCEANS 2006, IEEE, Boston, MA.
Marschal, C., Garrabou, J., Harmelin, J., and Pichon, M. (2004). A new method for measuring growth and age in the precious red coral Corallium rubrum (L.). Coral Reefs 23, 423–432. doi: 10.1007/s00338-004-0398-6
Millot, C., and Wald, L. (1980). The effect of Mistral wind on the Ligurian current near Provence. Amsterdam: Elsevier.
Montero-Serra, I., Garrabou, J., Doak, D. F., Figuerola, L., Hereu, B., Ledoux, J.-B., et al. (2018). Accounting for life-history strategies and timescales in marine restoration. Conserv. Lett. 11:e12341. doi: 10.1111/conl.12341
Perez, T., Garrabou, J., Sartoretto, S., Harmelin, J., Francour, P., and Vacelet, J. (2000). Massive mortality of marine invertebrates: an unprecedented event in northwestern Mediterranean. C. R. Acad. Sci. III 323, 853–865.
PISCO. (2016). La Science des aires marines protégées (3ème édition, Méditerranée). France: University of Nice Sophia Antipolis.
Priori, C., Mastascusa, V., Erra, F., Angiolillo, M., Canese, S., and Santangelo, G. (2013). Demography of deep-dwelling red coral populations: age and reproductive structure of a highly valued marine species. Estuar. Coast. Shelf Sci. 118, 43–49. doi: 10.1016/j.ecss.2012.12.011
R Core Team (2017). R: A Language and Environment for Statistical Computing. Vienna: R Foundation for Statistical Computing.
Royer, J.-P., Nawaf, M., Merad, D., Saccone, M., Bianchimani, O., Garrabou, J., et al. (2018). Photogrammetric Surveys and Geometric Processes to Analyse and Monitor Red Coral Colonies. J. Mar. Sci. Eng. 6:42. doi: 10.3390/jmse6020042
Sala, E., Lubchenco, J., Grorud-Colvert, K., Novelli, C., Roberts, C., and Sumaila, R. (2018). Assessing real progress towards effective ocean protection. Mar. Policy 91, 11–13. doi: 10.1016/j.marpol.2018.02.004
Santangelo, G., Abbiati, M., Giannini, F., and Cicogna, F. (1993). Red coral fishing trends in the western Mediterranean Sea during the period 1981-1991. Sci. Mar. 57, 139–143.
Santangelo, G., Cupido, R., Cocito, S., Bramanti, L., Tsounis, G., and Iannelli, M. (2012). “Demography of long-lived octocorals: survival and local extinction,” in Proceedings of the 12th International Coral Reef Symposium, Cairns, 9–13.
Smeltz, T. S., Harris, B. P., Olson, J. V., and Sethi, S. A. (2019). A seascape-scale habitat model to support management of fishing impacts on benthic ecosystems. Can. J. Fish. Aquat. Sci. 76, 1836–1844. doi: 10.1139/cjfas-2018-0243
Torrents, O. (2007). Biologie des populations du corail rouge Corallium rubrum (L. 1758) de Méditerranée nord-occidentale. PhD Thesis. Marseille: Université de la Méditerraneé Aix-Marseille II.
Torrents, O., and Garrabou, J. (2011). Fecundity of red coral Corallium rubrum (L.) populations inhabiting in contrasting environmental conditions in the NW Mediterranean. Mar. Biol. 158, 1019–1028. doi: 10.1007/s00227-011-1627-5
Tsounis, G., Rossi, S., Gili, J.-M., and Arntz, W. (2006). Population structure of an exploited benthic cnidarian: the case study of red coral (Corallium rubrum L.). Mar. Biol. 149, 1059–1070. doi: 10.1007/s00227-006-0302-8
Underwood, A. (1992). Beyond BACI: the detection of environmental impacts on populations in the real, but variable, world. J. Exp. Mar. Biol. Ecol. 161, 145–178. doi: 10.1016/0022-0981(92)90094-q
Underwood, A. (1981). Techniques of analysis of variance in experimental marine biology and ecology. Oceanogr. Mar. Biol. Annu. Rev. 19, 513–605.
Van de Water, J. A. J. M., Voolstra, C. R., Rottier, C., Cocito, S., Peirano, A., Allemand, D., et al. (2018). Seasonal Stability in the Microbiomes of Temperate Gorgonians and the Red Coral Corallium rubrum Across the Mediterranean Sea. Microb. Ecol. 75, 274–288. doi: 10.1007/s00248-017-1006-y
Vassallo, P., Bianchi, C. N., Paoli, C., Holon, F., Navone, A., Bavestrello, G., et al. (2018). A predictive approach to benthic marine habitat mapping: efficacy and management implications. Mar. Pollut. Bull. 131, 218–232. doi: 10.1016/j.marpolbul.2018.04.016
Vielzeuf, D., Garrabou, J., Gagnon, A., Ricolleau, A., Adkins, J., Günther, D., et al. (2013). Distribution of sulphur and magnesium in the red coral. Chem. Geol. 355, 13–27. doi: 10.1016/j.chemgeo.2013.07.008
Zapata-Ramírez, P. A., Scaradozzi, D., Sorbi, L., Palma, M., Pantaleo, U., Ponti, M., et al. (2013). Innovative study methods for the Mediterranean coralligenous habitats. Adv. Oceanogr. Limnol. 4, 102–119. doi: 10.4081/aiol.2013.5339
Keywords: MPAs, photogrammetry, Corallium rubrum, reserve effect, BACI design
Citation: Richaume J, Cheminée A, Drap P, Bonhomme P, Cadene F, Ferrari B, Hartmann V, Michez N and Bianchimani O (2021) 3D Photogrammetry Modeling Highlights Efficient Reserve Effect Apparition After 5 Years and Stillness After 40 for Red Coral (Corallium rubrum) Conservation in French MPAs. Front. Mar. Sci. 8:639334. doi: 10.3389/fmars.2021.639334
Received: 08 December 2020; Accepted: 29 July 2021;
Published: 30 August 2021.
Edited by:
John H. R. Burns, University of Hawai‘i at Hilo, United StatesReviewed by:
Atsuko Fukunaga, University of Hawai‘i at Mānoa, United StatesCopyright © 2021 Richaume, Cheminée, Drap, Bonhomme, Cadene, Ferrari, Hartmann, Michez and Bianchimani. This is an open-access article distributed under the terms of the Creative Commons Attribution License (CC BY). The use, distribution or reproduction in other forums is permitted, provided the original author(s) and the copyright owner(s) are credited and that the original publication in this journal is cited, in accordance with accepted academic practice. No use, distribution or reproduction is permitted which does not comply with these terms.
*Correspondence: Adrien Cheminée, YWRyaWVuLmNoZW1pbmVlQHNlcHRlbnRyaW9uLWVudi5jb20=
Disclaimer: All claims expressed in this article are solely those of the authors and do not necessarily represent those of their affiliated organizations, or those of the publisher, the editors and the reviewers. Any product that may be evaluated in this article or claim that may be made by its manufacturer is not guaranteed or endorsed by the publisher.
Research integrity at Frontiers
Learn more about the work of our research integrity team to safeguard the quality of each article we publish.