 Danielle E. Verna
 Mark S. Minton
 Gregory M. Ruiz
94% of researchers rate our articles as excellent or good
Learn more about the work of our research integrity team to safeguard the quality of each article we publish.
Find out more
ORIGINAL RESEARCH article
Front. Mar. Sci., 16 July 2021
Sec. Marine Conservation and Sustainability
Volume 8 - 2021 | https://doi.org/10.3389/fmars.2021.638955
Biological invasions often result from transfers of organisms during trade activities. In coastal ecosystems, commercial ships are a dominant source of species transfers globally, and ships’ ballast water (BW) is a major focus of biosecurity management and policy to reduce invasions. While trade drives shipping patterns, diverse vessel types and behaviors exist such that the quantitative relationship between trade and BW dynamics is still poorly resolved, limiting both science and management. Here, we evaluated a new method to predict BW discharge using trade data, by explicitly considering known BW practices according to vessel and commodity type. Specifically, we estimated the relationship between tonnage of overseas exports and BW discharge volume for San Francisco Bay (SFB), California, as a model system to demonstrate this approach. Using extensive datasets on shipborne exports and BW discharge, we (a) evaluated spatial and temporal patterns across nearly 20 ports in this estuary from 2006 to 2014 and (b) developed a predictive model to estimate overseas BW discharge volume from foreign export tonnage for the whole estuary. Although vessel arrivals in SFB remained nearly constant from 2006 to 2014, associated tonnage of exported commodities more than doubled and BW discharge more than tripled. Increased BW volume resulted from increased frequency and per capita discharge of bulk carriers from Asia and tankers from western Central America and Hawaii, reflecting shifts in direction of commodity movement. The top 11 export commodities (59% of total export tonnage) were transported on bulk carriers or tankers. In a multivariate linear model, annual tonnage of these top 11 export commodities by vessel type were strong predictors of total bay-wide overseas BW discharge (adjusted R2 = 0.92), creating the potential to estimate past or future BW delivery in SFB. Bulk export tonnage provides valuable insights into BW flux, since most BW discharge to ports is driven by trade of bulk commodities and the behavior of bulk and tank ships. BW discharge data are unavailable for many regions and time periods, whereas trade data are widely available and can provide a reliable proxy estimate of BW volume and geographic source, which are both critical to evaluate invasion risk.
Biological invasions by non-indigenous species (NIS) are a leading cause of ecological change and economic impact (Mack et al., 2000; Pysek and Richardson, 2010), and no global region is immune to invasions. In marine ecosystems, coastal bays and estuaries are hotspots for invasions as centers of human populations, creating focal points for the transfer of organisms via trade (Ruiz et al., 2000a). Over the past century, the growth and expansion of transportation, commerce, and accompanying development in coastal areas positively influence risk of invasion (Hulme, 2009; Dafforn et al., 2015), with the degree of international trade a key measure of a country’s NIS abundance (Westphal et al., 2008).
Although global trade includes several mechanisms or vectors that transfer coastal organisms among geographic regions, commercial ships connect ports throughout the world and are a dominant source of invasions resulting from vast numbers of organisms moved by ballast water (BW) and hull biofouling (Ruiz et al., 2000b, 2011; Bailey et al., 2020). BW is used to maintain vessel stability, draft, and trim. Water taken on in one port or location entrains a diverse community of organisms that are discharged at subsequent ports of call, creating a large-scale transfer of organisms that can colonize new bioregions. A large ship can transfer more than 50,000 metric tons of BW across oceans in 8–10 days, typically sourced in coastal ports, and the United States alone receives over 180 million metric tons of BW from overseas vessels each year (National Ballast Information Clearinghouse, 2016). Most of this BW is delivered by bulk and tank cargo vessels, which transport bulk dry and liquid commodities, respectively. These vessel types generally deliver bulk commodities in one direction and return without cargo in the opposite direction, carrying BW to maintain stability. As a result, bulk commodity vessels often contribute the majority of BW to ports compared to other vessel types, such as containerships or cruise ships that carry cargo on each voyage (Verling et al., 2005; Minton et al., 2015; Davidson et al., 2018). Due to such differences in vessel operations among ship types, total vessel arrivals are often not a good proxy for BW deliveries in space or time, whereas the volume of BW received at a port may often be linked intrinsically to the volume of commercial bulk exports, such as oil (crude and refined), grain, or coal (Carney et al., 2017).
Although not a precise predictor, greater volumes of BW discharge are expected to result in greater propagule supply and likelihood of introducing NIS (Minton et al., 2005; National Research Council, 2011). As a result, changes in the scale and direction of trade can have direct consequences on the transport and introduction of NIS across space and time, and such changes are linked directly to the flux of commodities among ports. Furthermore, both frequency and magnitude of organism transfers, or propagule pressure, are expected generally to increase invasion likelihood (Simberloff, 2009; National Research Council, 2011). However, maritime trading partners do not all present equal probability of invasions. Ports located in environmentally similar regions are often prone to successful exchange of species, such as the western United States and China (Meyerson and Mooney, 2007). Thus, assessments of vector strength, trade partners, and environmental match are often used to evaluate potential changes in NIS risk (Gibbs and Browman, 2015).
While several countries require vessels to report data on volume and source of BW discharges, such data are not yet collected and available in most countries (e.g., Zhang et al., 2017). Even where present, these data sets began in the late 1990s. Thus, comprehensive data is rare for most countries and ports around the world and is truly limited to the past few decades even when available. This paucity of BW data in most global regions in space or time limits understanding of quantitative relationships between shipping and invasions that are desired in both invasion science and management.
To date, few studies have used trade data to evaluate its quantitative relationship with BW delivery and the possible application of predicting changes in BW discharge volumes over time (Carney et al., 2017; Holzer et al., 2017). Here, we combine extensive data on vessel arrivals, BW discharge volume, and cargo import/export data to evaluate the relationship between trade and BW delivery over 9 years in San Francisco Bay (SFB), California, a highly invaded estuary with diverse commercial shipping. Our approach explicitly considers differences in the operational profile of different vessel types, with respect to BW and cargo, and measured changes in BW discharge frequency, volume, and source region as key variables in invasion dynamics. This approach has potential broad application to predict BW delivery in diverse regions or time periods where trade data are available.
San Francisco Bay is a large estuary located in central coastal California, United States, that has nearly 20 commercial shipping ports frequented by foreign and domestic vessel traffic, ranging from San Francisco and Oakland in the lower bay to Sacramento and Stockton in the upper estuary.
The area is home to roughly 7.5 million people with a diverse range of aquatic habitats and associated biota (Cloern and Jassby, 2012). The estuary receives freshwater input from the Sacramento and San Joaquin Rivers, which transport runoff from 40% of California’s surface area (Nichols et al., 1986), though the volume of freshwater input varies annually and water is often diverted or dammed before reaching the estuary (Cohen and Carlton, 1998). The upper reaches of the estuary, including Suisun Bay and eastward, are low salinity, nutrient rich, turbid waters with limited primary production. The lower bay is also rich in nutrients but conversely is a high salinity, high productivity area with large tidal influences (Cloern and Jassby, 2012).
To examine BW discharge and vessel arrival patterns to SFB over time, we extracted data from the National Ballast Information Clearinghouse1 (NBIC) for a 9-year period from 2006 through 2014 (National Ballast Information Clearinghouse, 2016). Following 2004, nearly every commercial vessel operating in United States waters was required to submit a Ballast Water Management Reporting Form to the NBIC at each arrival, and the NBIC estimates that compliance with the reporting requirements is approximately 94% nationwide. The data collected on these forms includes BW source and discharge locations and volumes, arrival locations, vessel types, and presence/absence of BW management. We characterized BW that was sourced and vessels that arrived from beyond the 200 nautical mile exclusive economic zone (EEZ) as overseas, and BW that was sourced and vessel that transited solely within the EEZ were characterized as coastwise.
While we examined all commercial vessels, we focused particular attention on bulk and tank vessels arriving from overseas, since these vessel types were expected to deliver most of the BW. For these two vessel types, we examined the distribution of arrivals and BW discharge among SFB dominant arrival ports, which differ in salinity characteristics, including: Alameda, Antioch, Benicia, Carquinez, Concord, Crockett, Martinez, Oakland, Pittsburg, Redwood City, Richmond, Rodeo, Sacramento, San Francisco, San Rafael, Stockton, and Suisun Bay. Further, we identified dominant overseas source bioregions for bulk and tank vessel traffic to SFB. For bulk carriers, these bioregions were EAS-1 through EAS-VIII (East Asian Seas) and NWP-1 through NWP-5 (North West Pacific), and included the countries of China, Indonesia, Japan, North Korea, South Korea, Thailand, Taiwan, Vietnam, Malaysia, Singapore, and Philippines. For tankers, the following bioregions were dominant overseas sources: NEP-VI through NEP-IX (North East Pacific) and SEP-H (South East Pacific) along the west coast of Central America (Figure 1; Kelleher et al., 1995).
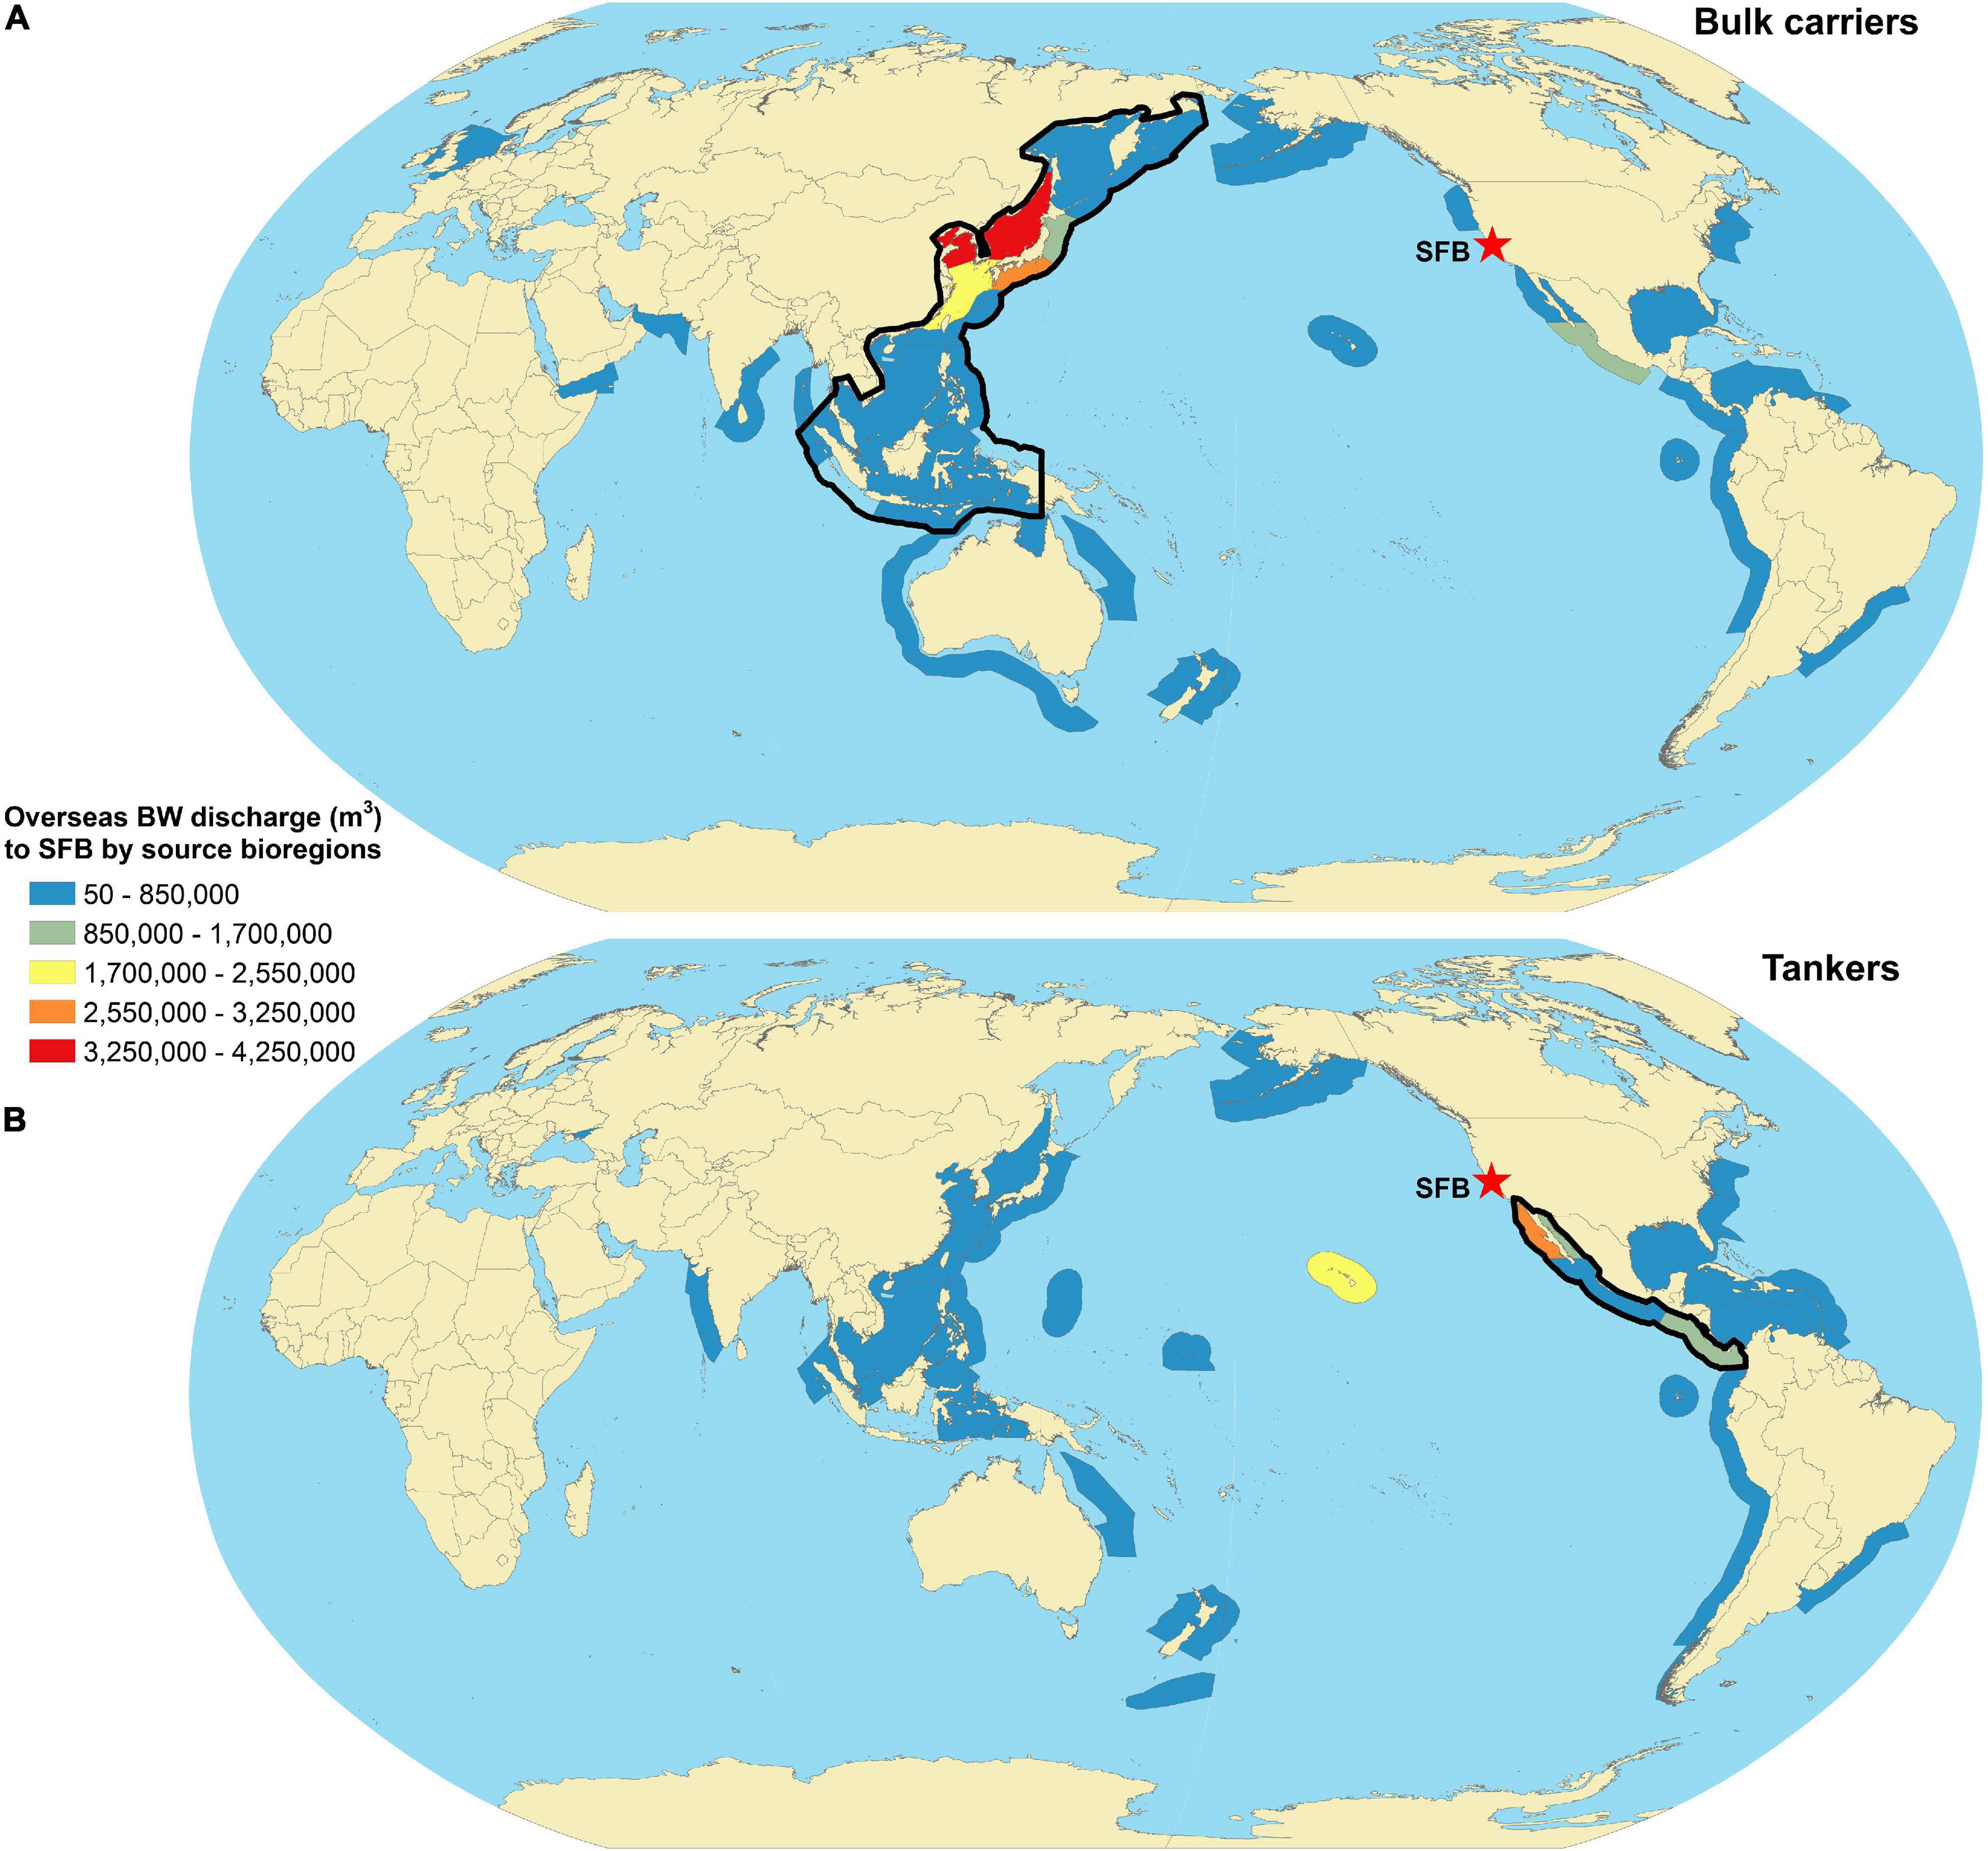
Figure 1. Total ballast water (BW) discharged in San Francisco Bay (SFB) by source bioregions, from 2006 through 2014, (A) bulk carriers and (B) tankers. Cumulative discharge volume (m3) per source bioregion is indicated by color. Bioregions outlined in black on each map represent those considered Asia and western Central America (upper and lower, respectively) and shown in Table 1.
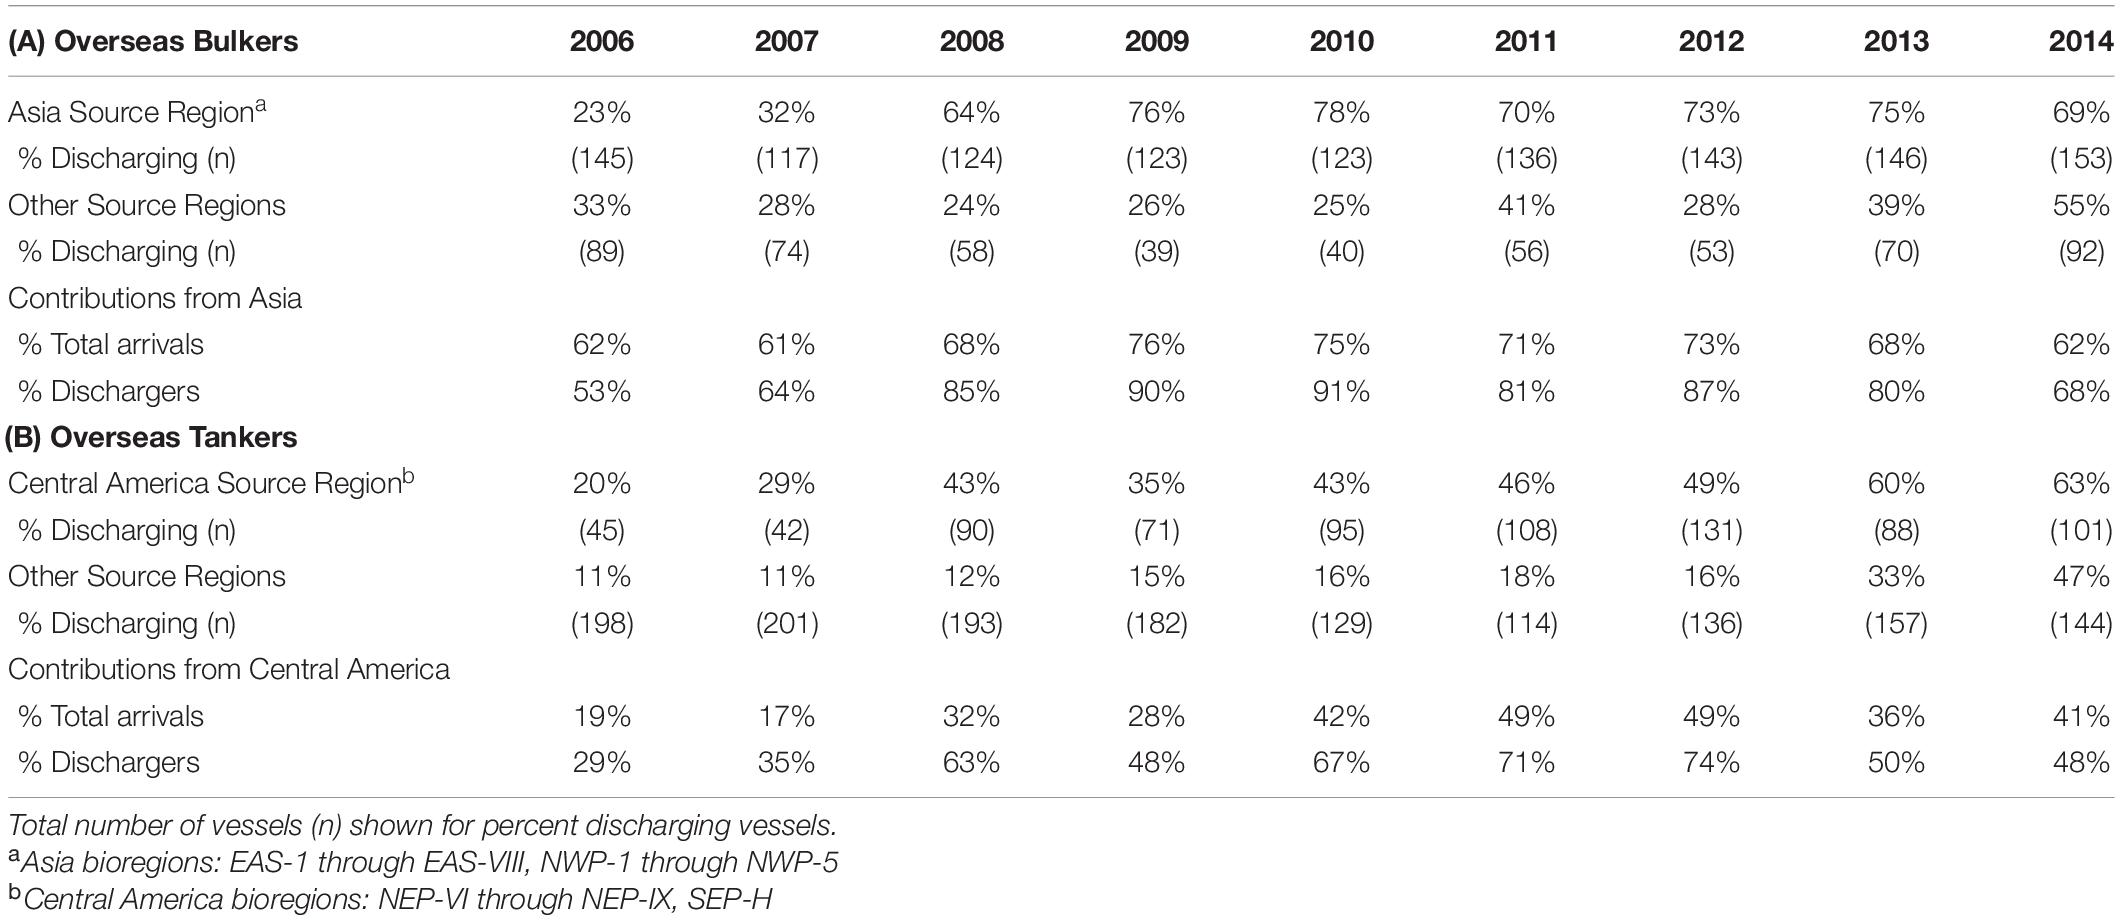
Table 1. The proportion of vessel arrivals and ballast water discharge to San Francisco Bay from (A) overseas bulk carriers (bulkers) from Asia and remaining bioregions, and (B) overseas tankers from Central America and remaining bioregions.
To examine spatial and temporal trade patterns to ports in SFB, we extracted data from USA Trade Online, a publicly available online database provided by the US Census Bureau2, over the same 9-year period (USA Trade Online, 2019). The database provided annual and monthly measures of import and export commodities for the ports of Alameda, Carquinez Strait, Crockett, Martinez, Oakland, Redwood City, Richmond, Sacramento, San Francisco, and Stockton, however, data for Sacramento was not available after 2010. Commodity data were categorized using the Harmonized Commodity Description and Coding Systems (HS codes) introduced in 1988. These classification codes consist of a series of two-digit chapters (e.g., 27: Mineral Fuels, Mineral Oils and Products of their Distillation; Bituminous Substances; Mineral Waxes) containing four- and six-digit subcategories with increasing resolution (e.g., 271019 Petroleum oils and oils from bituminous minerals, not containing biodiesel, not crude, not waste oils). Based on the spatial heterogeneity in arrivals and discharge by vessel type, we identified the commodities (six-digit codes) associated with bulk and tank vessels in each port.
We assessed the contribution of various vessel types to arrivals and BW discharge over the 9-year period to SFB. For bulk and tank vessels, we estimated the total BW discharge volume, frequency of discharge, and per capita discharge per year. In addition, we identified the relative contribution of discharge by bulk and tank vessels according to both BW source and discharge port in SFB.
Using a combination of data from the NBIC and USA Trade Online, we developed a linear model for SFB that estimates the relationship between the tonnage of exports transported by bulk and tank vessels and the total volume of overseas BW discharge. Trade statistics were unavailable for some ports for which BW data were available (Benicia, Concord, Pittsburg, Rodeo, and Suisun Bay).
From 2006 through 2014, SFB received a reported 33,558 arrivals and 55,584,402 m3 of BW. The number of annual arrivals remained consistent through time (3,729 ± 141, mean ± standard deviation) and was dominated by coastwise vessels (79%). Container, tank, and bulk vessels were the primary types to call on ports in SFB. In sharp contrast, the volume of BW discharge increased 84% over the 9-year period. While coastwise BW discharge declined slightly, the volume of overseas BW more than tripled by 2014 (Figure 2). Bulk and tank vessels discharged most BW, and these two vessel types accounted for 87% of the total volume and 91% of the overseas volume.
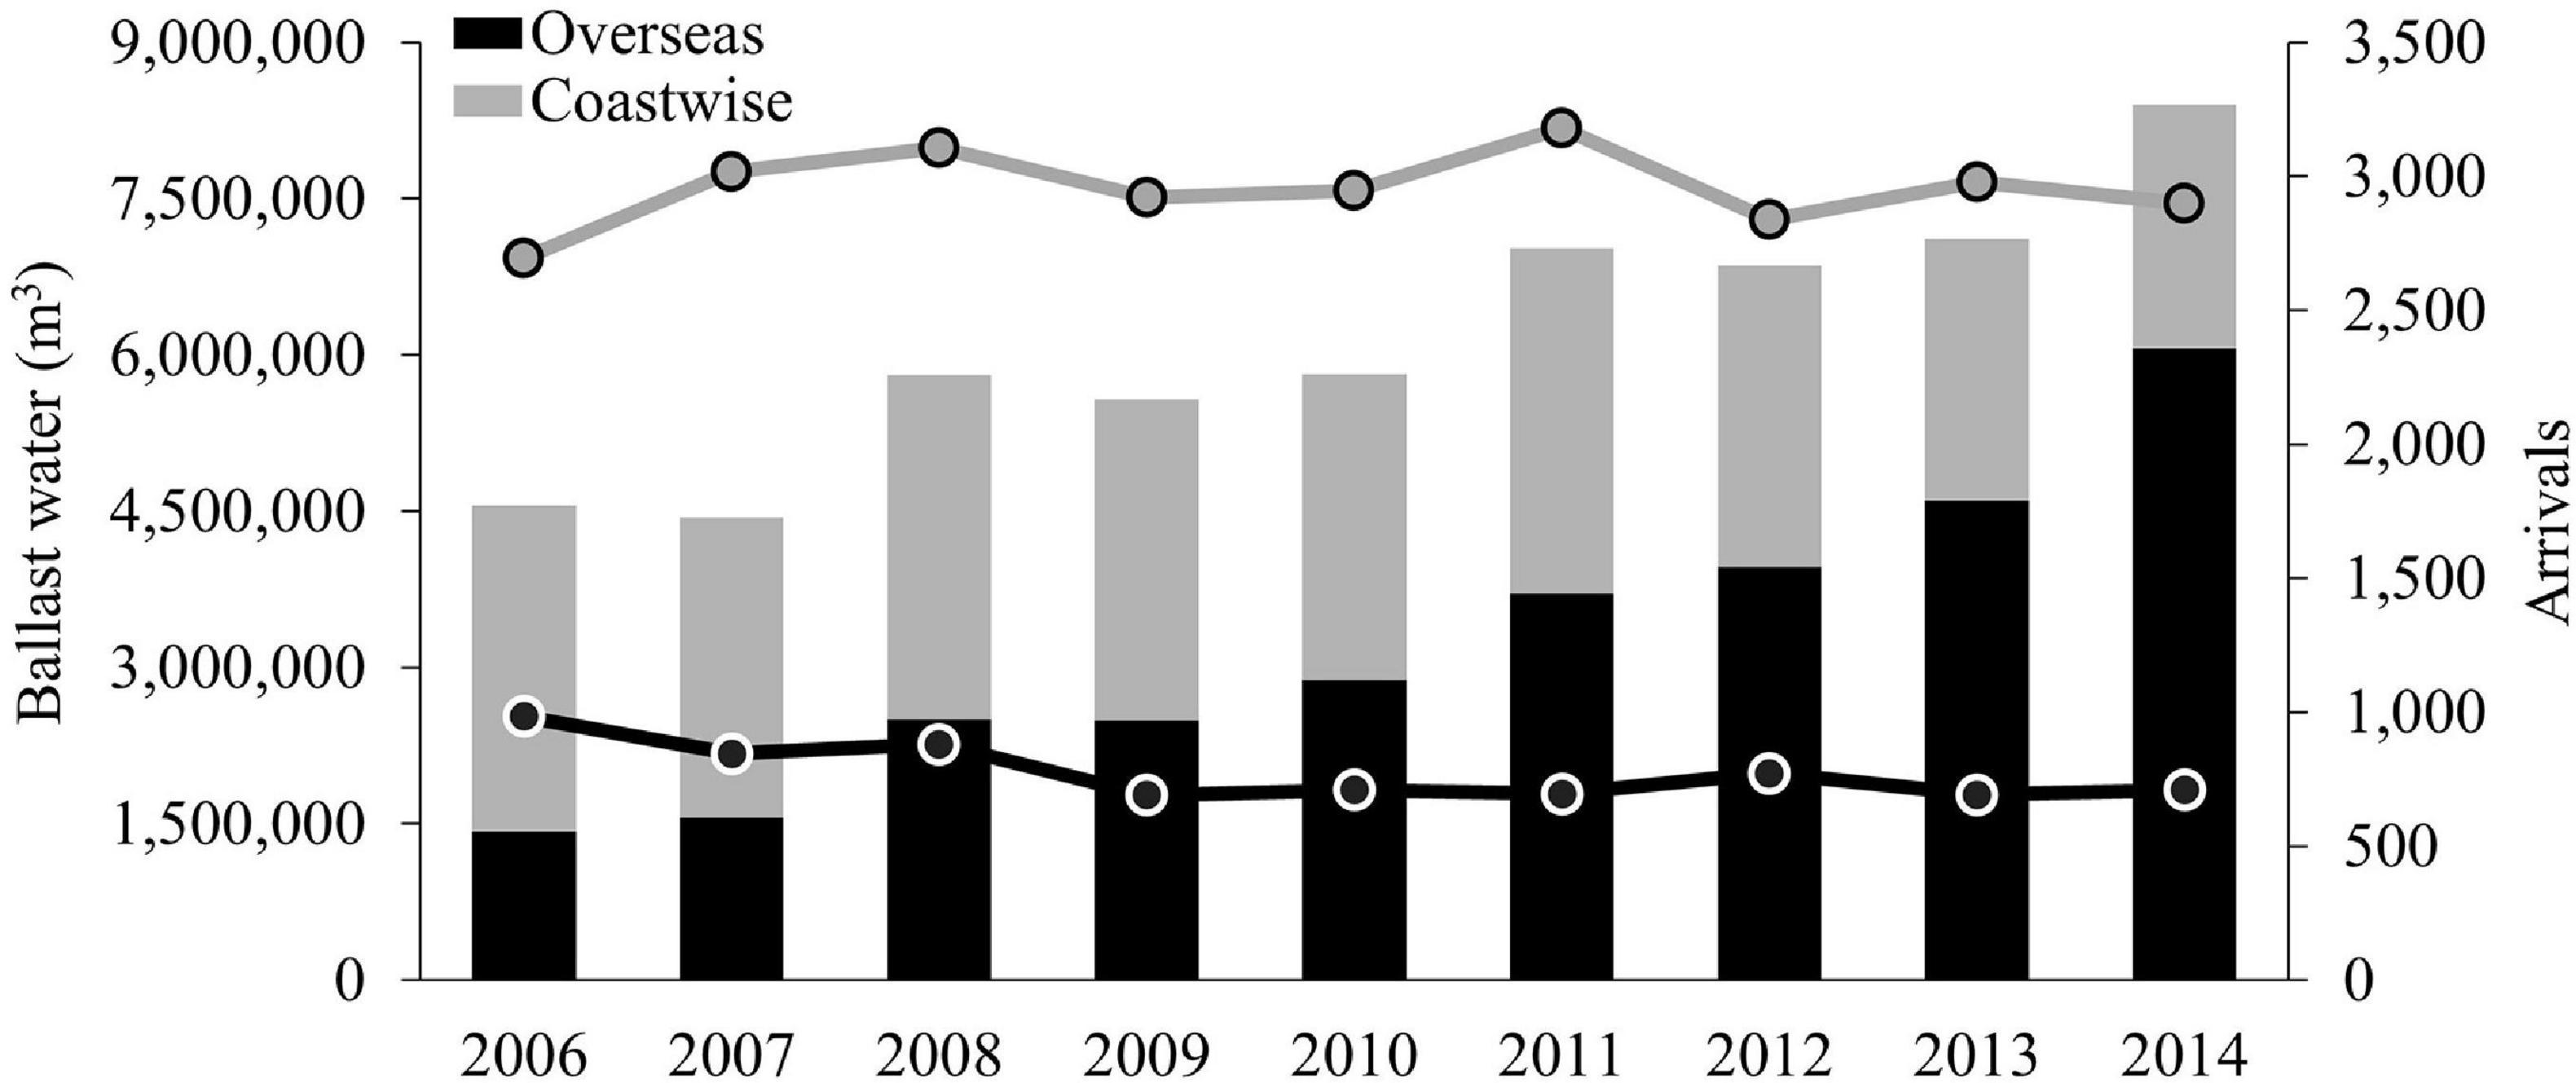
Figure 2. Annual contributions of overseas and coastwise ballast water discharge (bars) and arrivals (lines) to San Francisco Bay by commercial vessels.
The growth in reported BW discharge from overseas sources was driven specifically by bulk and tank vessels. While the number of overseas bulk and tank vessel arrivals fluctuated little during our study period (Figure 3A), the cumulative annual volume of overseas BW discharged by each vessel type increased over 5-fold across the 9 years (Figure 3B). This temporal growth was the combined result of a dramatic increase in the number and proportion of discharging vessels (Figure 3C) and a rise in the mean volume per vessel discharge (Figure 3D).
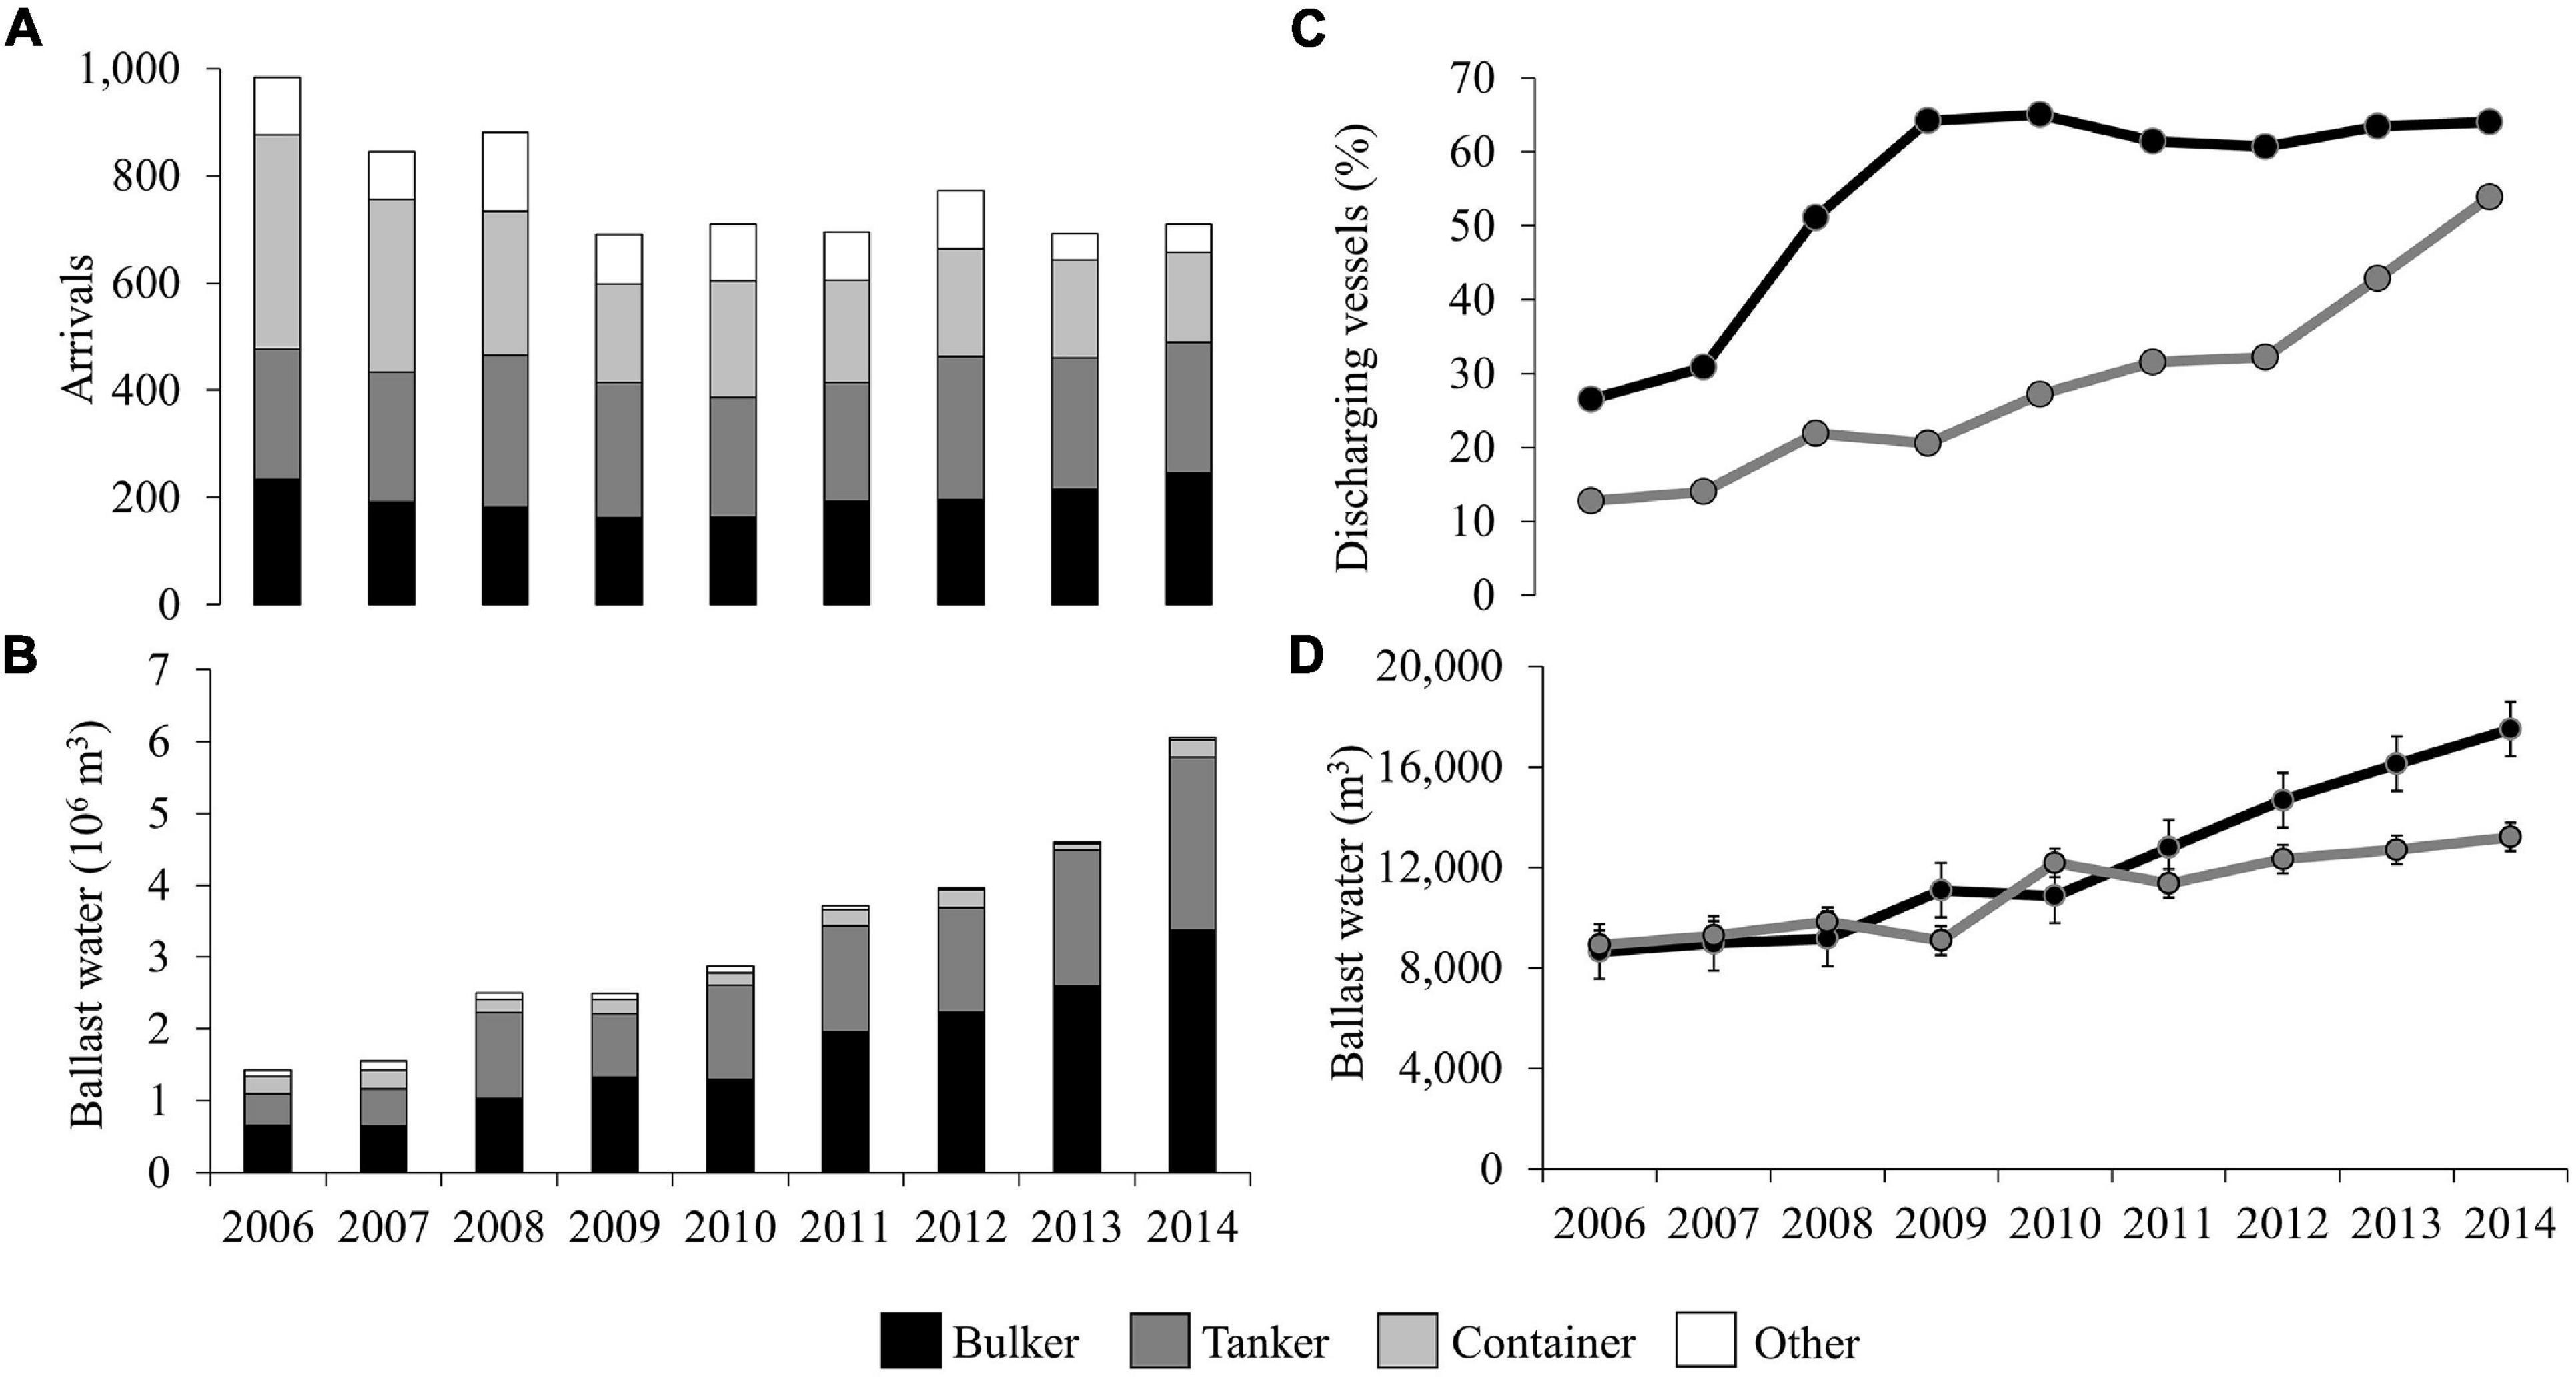
Figure 3. Annual variation by vessel type for overseas (A) arrivals, (B) ballast water discharge, (C) percentage discharging arrivals, and (D) mean discharge volume of those vessels reporting discharge to San Francisco Bay. Error bars in panel (D) represent standard error. Panels (C,D) show growth in bulk carriers (bulkers) and tankers only.
Ballast water from bioregions of eastern Asia adjacent to Japan, China, and South Korea accounted for 70% of all overseas bulk carrier discharge (Figure 1A). The observed overall increase in BW discharge by bulk carriers in SFB (Figure 3B) was caused largely by a growing contribution of vessels from Asia, and primarily China (Supplementary Figure 1A). While the contribution of bulk carrier arrivals from Asia fluctuated between 62 and 76% of total arrivals (across all regions), the frequency of discharging vessels increased three-fold from Asia across the 9 years, accounting for 80–90% of all discharge events by bulk carriers from 2008 to 2013 (Table 1A), and the percent of discharging vessels was much higher than that of other source regions.
In contrast, the Pacific coast of Central America was the dominant source region of overseas BW discharge for tankers (Figure 1B), representing 53% of total volume discharged to SFB by overseas tank vessels from 2006 through 2014. The annual discharge volume from this source region grew more than four-fold over the 9 years, with most coming from Mexico (Supplementary Figure 1B). The increasing contribution of BW from Central America resulted from both an increase of vessel arrivals and percent discharging from this region (Table 1B). Hawaii was also a major source region for BW discharge by tankers arriving to SFB across years (Figure 1B), but the relative contribution to annual arrivals and BW discharge was smaller than Central America and declined over time (Supplementary Table 1).
It is also noteworthy that the overseas arrivals and BW discharge in SFB differ among specific ports and show a broad regional pattern with respect to the estuary’s salinity gradient (Figure 4). Bulk vessels tended to call on ports in the upper estuary such as Benicia, Pittsburg, Stockton, and Sacramento where bulk exports of rice to Japan, coal to Mexico, and iron ore to China were most common. This low salinity area received two-third of overseas bulk carrier BW discharged in SFB (Figure 4B). Conversely, tankers frequently called on ports in the lower bay such as Richmond and San Francisco, where exports of oil to Central America were common. This high salinity area received two-thirds of the Bay’s overseas BW discharge from tankers (Figure 4B).
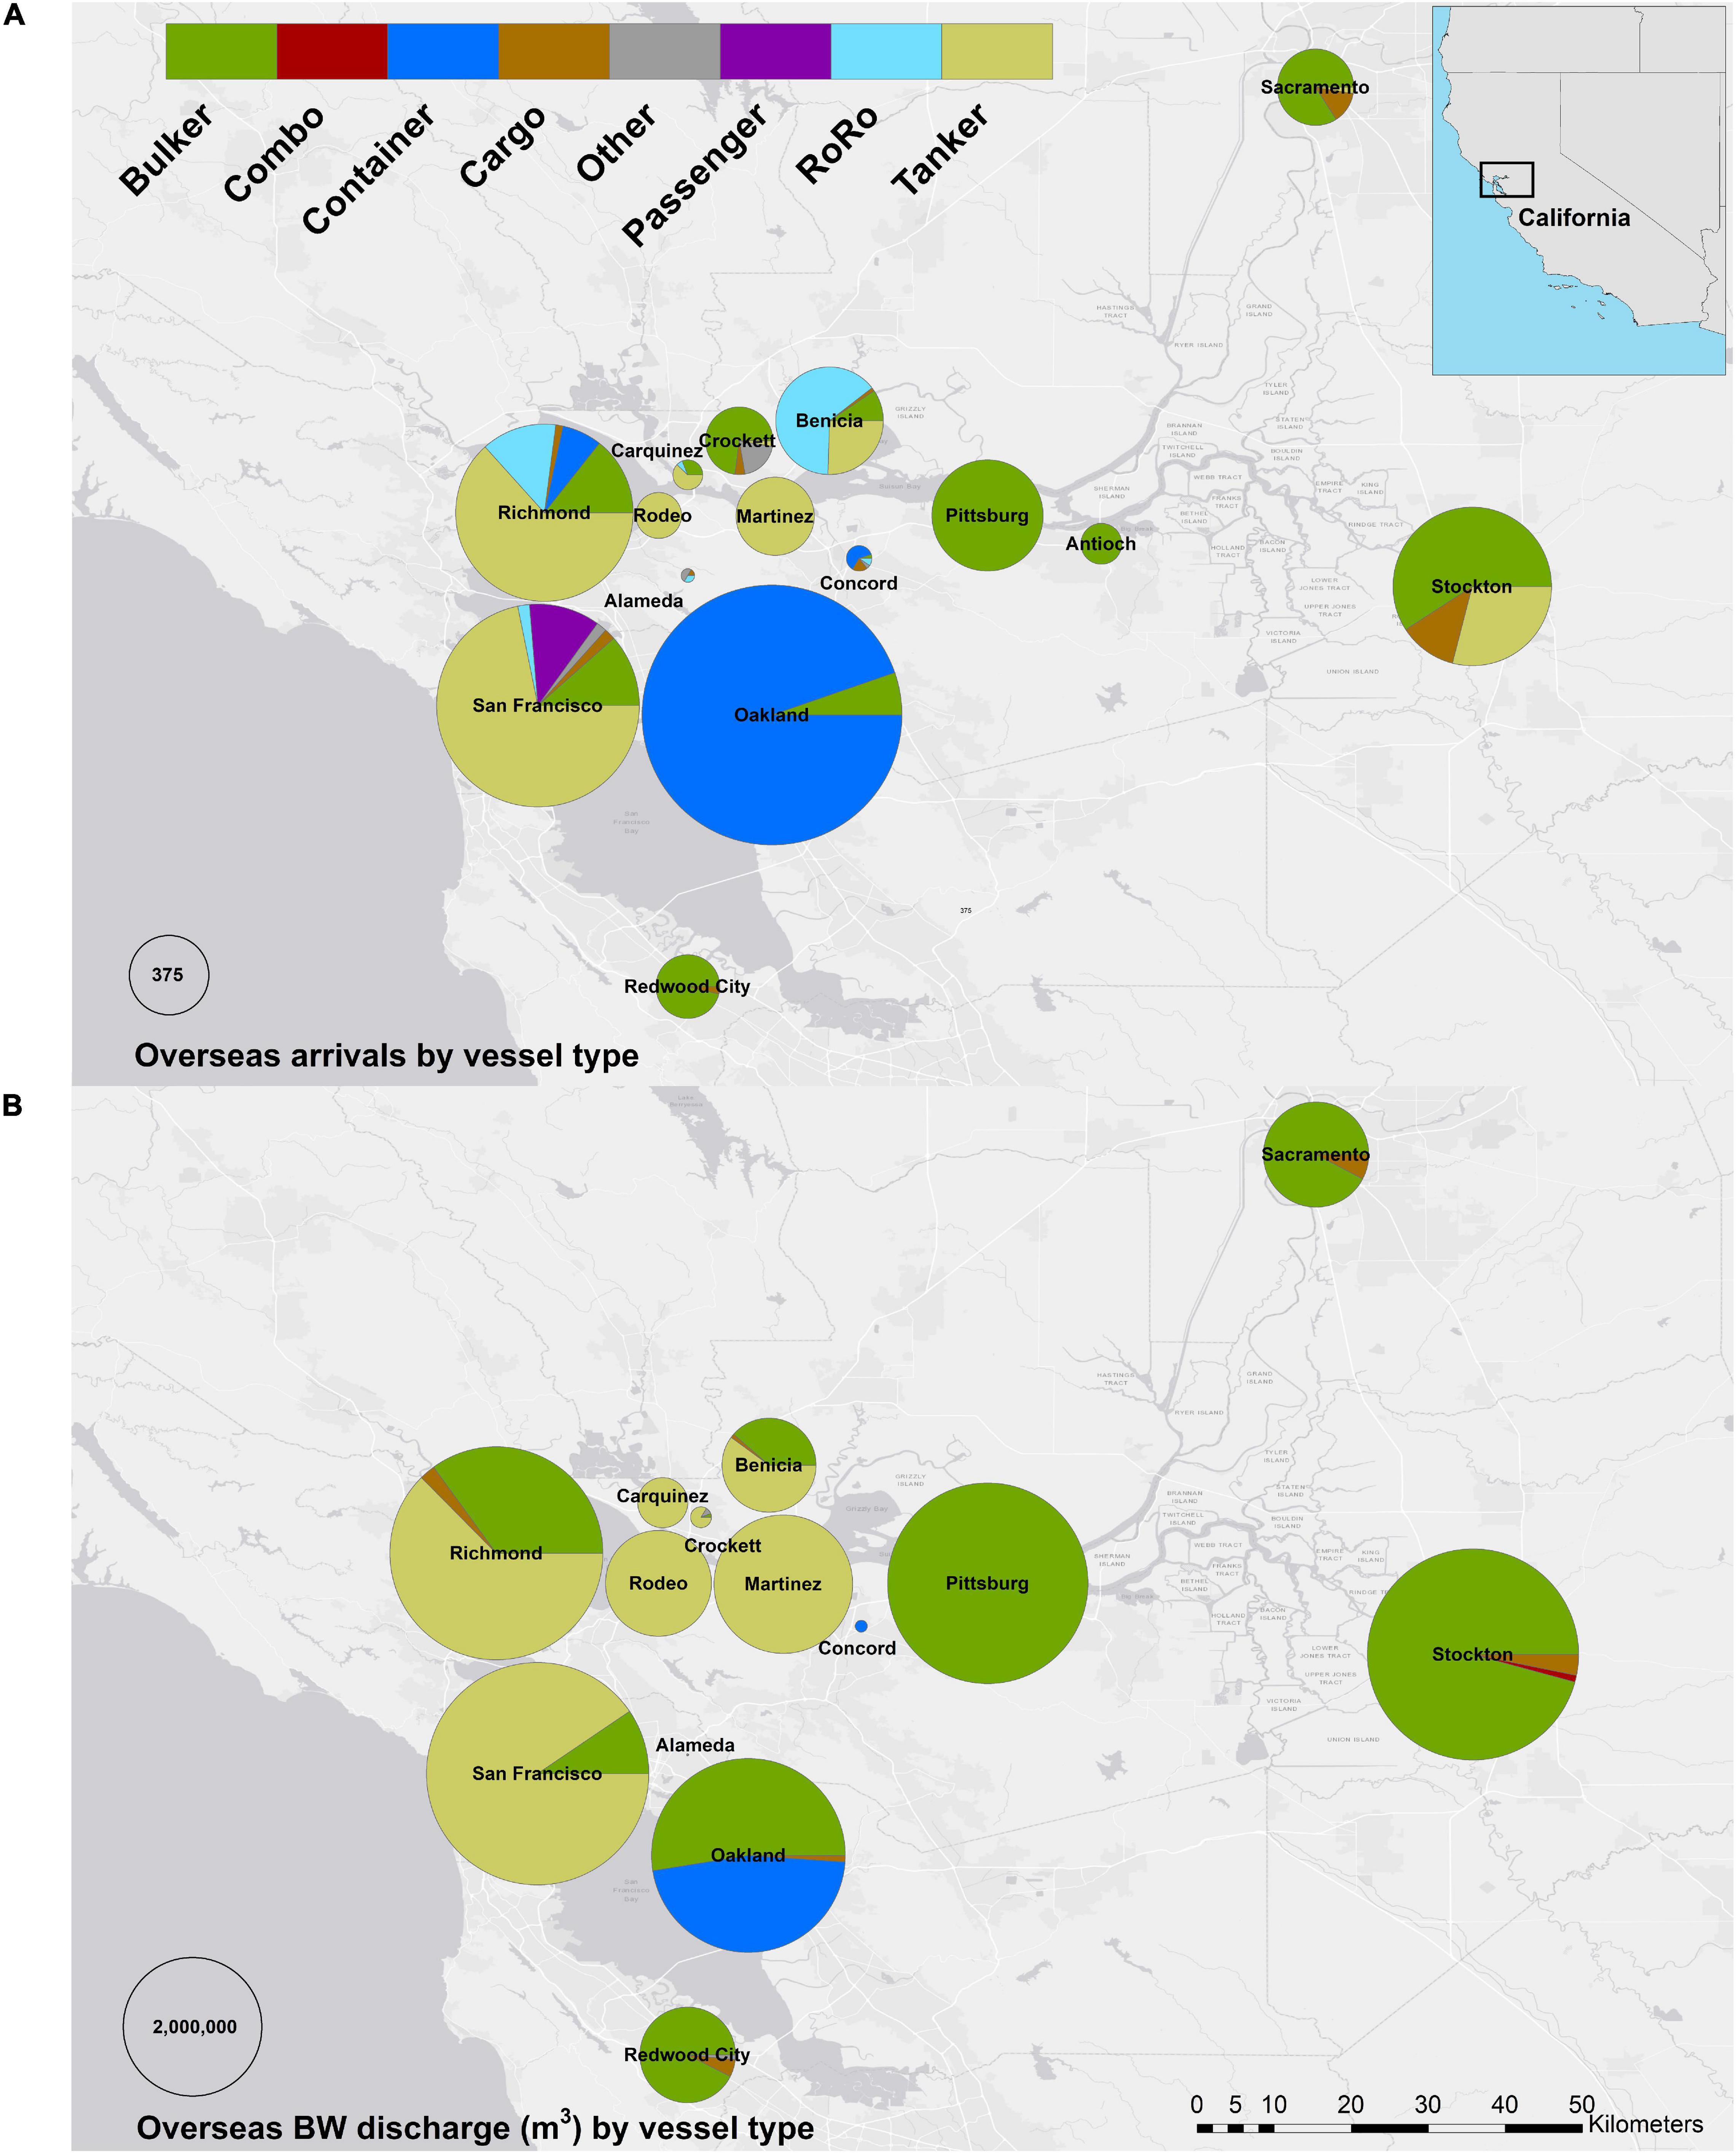
Figure 4. The relative contribution of vessel type to (A) total overseas vessel arrivals and (B) overseas ballast water discharge to ports within San Francisco Bay from 2006 through 2014. Scale is shown in bottom left of each figure for arrivals (A) and discharge (B).
The change in overseas BW discharge by bulk and tank vessels was directly related to (and driven by) increased export of bulk commodities. Overall, there were nearly 4,500 six-digit export commodities from ports within SFB, and total tonnage of these exports increased annually and more than doubled from 2006 through 2014. The top eleven commodities by tonnage were bulk commodities, transported by bulk or tank vessels, and accounted for 59% of total shipping exports. More specifically, eight of these eleven commodities were transported by bulk carriers (e.g., waste products, petroleum coke, coal, rice) and three were transported by tankers (petroleum oils) (Figure 5).

Figure 5. The annual tonnage (bars) of the top eleven commodities exported from San Francisco Bay and the annual volume (line) of overseas ballast water discharge. The type of vessel that exported each commodity is noted as bulk carrier (B) or tanker (T). These top 11 commodities comprised 59% of the total export tonnage.
There was a strong relationship between foreign exports and overseas BW discharge volume among years, for bulk and tank vessels, both alone and together. The relationship between the tonnage of the top eight export commodities from bulk carriers (106 kg) and the volume of overseas BW (103 m3) discharged by bulk carriers in SFB can be described by
The relationship between the tonnage of the top three export commodities from tankers (106 kg) and the volume of overseas BW (103 m3) discharged by tankers can be described by
A multivariate linear model of the relationship between the annual tonnage of the top eleven export commodities and the total annual overseas BW discharge volume received throughout SFB can be described by
where y is the annual volume of overseas BW discharge (103 m3); x1 = annual tonnage of exports transported by tankers (106 kg); x2 = annual tonnage of exports transported by bulk carriers (106 kg); and an adjusted R2 = 0.92.
This study elucidates the quantitative effects of trade exports on BW discharge characteristics, including volume and source region. It is generally understood that trade drives shipping and BW delivery, affecting invasion dynamics on a global scale (Ruiz et al., 2000a; Hulme, 2009; Kaluza et al., 2010; Seebens et al., 2013; Sardain et al., 2019; Bailey et al., 2020). Fluctuations in commodity supply, product demand, and emergence of new trade routes and partners all affect the number, tempo, and type of vessel calls at a port. Yet, how exactly this converts to BW delivery has been more elusive, since (a) most vessels do not discharge BW upon arrival (Miller et al., 2011; Minton et al., 2015) and (b) BW discharge varies by both vessel type and specific export commodity. As a result, the number of vessel arrivals alone is a poor proxy for BW discharge volume and organism transfer, as our data and other studies show (Figure 3; Verling et al., 2005; Miller et al., 2011; Minton et al., 2015; Davidson et al., 2018). Several past studies have adopted coarse estimates of BW by vessel types, using an average value sometimes adjusted for vessel size, but this approach largely ignores the high level of variation and directionality of BW versus cargo transfers within vessel type. Here, we explicitly evaluated selective commodity exports, focusing on bulk dry and liquid cargo associated with larger discharge volumes from bulk and tank vessels (compared to other vessel types), to develop a model that explains >90% of temporal variation in overseas BW discharge volume across all ships and ports in SFB.
Using detailed knowledge of transportation logistics for specific cargos and ship types, our approach provides a predictive model for BW discharge volume that may be applicable broadly to other locations or time periods. We suggest the general approach is likely to be robust, representing an improvement of past methods for estimation, because it relies on a mechanistic understanding of BW transfer associated with specific cargo and vessel types. Importantly, this approach also is accessible in most regions. Given that BW discharge data are only available recently (and for a very limited number of countries), whereas trade and ship arrival data exist commonly with broad spatial and temporal coverage, such a modeling approach has considerable appeal and potential as a general tool for both backcasting and forecasting BW delivery as well as its relationship to invasion dynamics. Estimated volumes of BW are critical in assessing invasion risk to port systems and management strategies to mitigate this risk, including capacity of barge-based or shore-based treatment facilities being considered for some ports. Furthermore, this approach may be useful for assessing biosecurity threats under shifts in trade patterns and partners that influence vessel behavior, cargo types, and connectivity between source/recipient ports.
However, we recognize that our analysis currently evaluates only a short snapshot of time and is limited to one major port system. We are encouraged by the strong relationship between trade of bulk commodities and total BW discharge volume, creating new opportunities to clarify the historical record for SFB such as effects of changing trade on BW quantity and source regions as well as associated invasion patterns. The response of invasions to shifts in trade and BW delivery remains a key knowledge gap, for both invasion science and management, which is impeded by limited data on BW history and propagule delivery (National Research Council, 2011; Ruiz et al., 2013). The utility of our model to help in these respects requires further testing and validation, both across time within SFB and in other regions.
This general approach expands upon previous work on the relationship of BW discharge associated with particular bulk cargo. Several studies highlight the dominant contribution of bulk carrier and tanker vessels to total BW discharge volume at ports around the world (Carlton et al., 1995; Miller et al., 2011; David et al., 2012, 2018; Cope et al., 2015; Minton et al., 2015; Verna et al., 2016). Temporal measures of the relationship between bulk cargo and BW quantities focus primarily on single commodities and ship type. For example, coal exports by bulk carriers explains most of the variation in overseas BW delivery in Chesapeake Bay, driving a surge in both BW volume and propagule supply between 2005 and 2013 (Carney et al., 2017). Similarly, projections of liquefied natural gas exports from the United States anticipate substantially greater BW discharge from tankers, primarily along the US Gulf Coast (Holzer et al., 2017). Here, we apply a similar approach to a broad list of bulk commodities, across multiple types of bulk and tank vessels, allowing us to explain the large temporal changes in BW discharge observed for SFB over 9 years.
Our analysis shows how expanding bulk exports resulted in a surge in overseas BW flux from particular geographic source regions, arriving to different portions of SFB. Each source and arrival port has consequences for associated biota and invasion opportunities. The location of a trade partner obviously affects the biological composition of BW discharge. Here, BW delivery from China and Mexico expanded greatly during our study, driving a three-fold increase in total discharge to SFB. Although it is generally expected that increasing propagule supply increases the likelihood of new invasions (Simberloff, 2009; National Research Council, 2011), environmental conditions and the quality of organisms also affect the outcome (Verling et al., 2005; Seebens et al., 2016). While we did not evaluate environmental match directly, it appears that China may be a more potent source for new invasions than Central America, given the many successful past invasions from this region to SFB and coastal biota detected in BW moved between these regions (Cohen and Carlton, 1995; Choi et al., 2005; Winder et al., 2011). Moreover, BW discharge from bulk carriers occurred in the upper reaches of the estuary (Figure 4) where salinities are reduced, and we note that many of the past invasions from Asia were in low salinity habitats. This suggests that both climate and salinity provide a good match for colonization of species arriving with BW from Asia, and the increase in BW may represent an elevated chance of new invasions associated with bulk carriers.
The increase in BW discharge and source regions reflect the underlying shifts in trade exports per port in SFB, where more exports increased the volume and frequency of discharge events. For example, in the port of Stockton, a change from importing to exporting commodities caused a temporal shift in the proportion of bulk carriers that discharged BW. Arrivals to Stockton fell from 2006 through 2009 as bulk imports of Portland cement from China (distributed to western United States) declined. Arrivals then rebounded and grew through 2014, coinciding with a spike in exports of iron ore and coal to China and Mexico. Meanwhile, from 2006 to 2014 the proportion of vessels that discharged BW increased annually from 8 to 70%. When bulk carriers imported commodities, they discharged little BW. As bulk exports grew and became the leading reason for vessel arrivals, the port received a 20-fold increase in BW volume.
In contrast to bulk carriers, the surge in BW from tankers reflected a shift in trade dynamics with Central America and, to a lesser extent, Hawaii. The proportion of overseas tankers that discharged BW sourced in Mexico peaked from 2010 to 2012, coinciding with a peak in exports of oil commodities from SFB to that country. Oil exports to Mexico then declined in 2013 and 2014 as exports of coal skyrocketed (transported by bulk rather than tank vessels). At the same time, more tanker BW began to arrive from Central America because of increased oil exports, particularly to Guatemala and El Salvador. Tanker BW discharge from Hawaii rose concurrently. Overall, the proportion of discharging overseas tankers grew annually over the 9 years (Table 1B), though sourced from varying coastal ecosystems.
The type of vessel used to transport commodities also influences the location of discharge, reflecting specialization of ports and associated infrastructure. With the combined shipping pressure of bulk and tank vessels in ports throughout SFB, most of the area routinely received BW. However, the upper estuary (low salinity) was dominated by bulk carrier discharge, and the lower bay (high salinity) received primarily tanker discharge (Figure 4). For example, the high salinity port of Richmond has terminals capable of handling both dry and liquid bulk cargo, but three oil commodities accounted for most (68%) of total exports and two-thirds of the BW received there was discharged by overseas tankers.
Trade statistics can provide considerable insight into vessel movement patterns and the associated flux of BW as a leading source of coastal species transfer and invasions. Our study expands upon previous exploration of the trade-BW relationship to provide estimates of BW flux at higher resolution and accuracy, using operational profiles of different vessels types according to cargo type and direction of trade. Our approach also allows some comparison of environmental match between source and recipient regions as a coarse proxy of relative similarity and perhaps invasion opportunity. While these are important variables, which contribute to invasion outcomes, they are not sufficient to characterize the associated propagule supply characteristics and invasion probability.
In general, the three-fold increase in annual overseas BW discharge observed in SFB is likely to have increased total propagule delivery from overseas sources, although organism concentrations are notoriously variable in space and time, differing among source regions, voyage conditions, seasons, and years (Smith et al., 1999; Verling et al., 2005; Briski et al., 2013b; Carney et al., 2017). We further expect the increase in BW from China in particular to result in increased probability of invasions to SFB from this region based on past invasion history associated with trade (as noted earlier). However, the relationship between propagule supply and invasion outcome is still poorly resolved, with high uncertainty of expected responses (National Research Council, 2011; Wonham et al., 2013), resulting from limited available data to adequately characterize the number of species as well as frequency and concentrations delivered through time.
It is noteworthy that nearly all (>98%) of overseas BW discharged to SFB in our study was reported to be managed with either exchange (flushing of tanks) in open ocean or a treatment technology required to reduce the concentration of coastal organisms (National Research Council, 2011). In some regions, BW exchange plus treatment may be used to further reduce delivery of freshwater organisms (Briski et al., 2013a). Implementation of BW management has likely reduced the propagule supply of coastal biota arriving in BW compared to historical BW discharge concentrations from Asia and elsewhere (but see Carney et al., 2017). If indeed the case, the residual risk of colonization is uncertain, as we have entered a new era where concentrations of organisms in BW are below historical conditions. Today, the extent to which concentrations of coastal organisms are below a critical threshold for successful invasions remains a major question in invasion ecology and management (Ruiz and Carlton, 2003; National Research Council, 2011).
There is typically a lag time from species arrival to population growth and detection (Sakai et al., 2001; Crooks, 2005; Bailey et al., 2020). Moreover, the ability to estimate changes in invasion rate with statistical confidence are especially challenging, given that most of the available data are limited to occurrence records instead of repeated measures that aim to detect change in SFB and elsewhere (Costello and Solow, 2003; Solow and Costello, 2004; Costello et al., 2007; Ruiz et al., 2011). Thus, evaluation of the full effect of changes in vessel behavior documented here will require both time and detailed analyses.
Shipping is a major driver of biological invasions in coastal ecosystems, resulting from organisms transferred with vessel BW and biofouling (Bailey et al., 2020). Here, we use SFB as a model system to develop a method to predict BW discharge based on trade data, quantifying how the direction, magnitude, and location of trade drives overseas BW discharge by ships in this major port system. We developed a predictive model for BW discharge using trade export data by focusing on bulk commodities associated with bulk carriers and tankers. Our approach has the potential for broad application since such trade data are available in space and time around the world. Moreover, this approach may provide a key measure of BW flux to support biosecurity management in many global regions where comprehensive data on BW discharge is lacking. Further testing and validation of this method is now required in other ports and regions to fully evaluate potential applications for estimating BW flux and invasion risk.
Publicly available datasets were analyzed in this study. This data can be found here: National Ballast Information Clearinghouse (http://invasions.si.edu/nbic/) and USA Trade Online (https://usatrade.census.gov/).
GR and MM identified the study approach. MM and DV gathered the data. DV led data analysis and writing. All authors contributed to interpretations, writing, and gave final approval for manuscript submission.
This work was supported by funding from the California State Lands Commission, the Smithsonian Environmental Research Center, and the Alaska Education Tax Credit contributed by the Groundfish Forum to the Fisheries, Aquatic Science, and Technology Laboratory at Alaska Pacific University.
The authors declare that the research was conducted in the absence of any commercial or financial relationships that could be construed as a potential conflict of interest.
The authors thank the reviewers for their valuable feedback on this manuscript.
The Supplementary Material for this article can be found online at: https://www.frontiersin.org/articles/10.3389/fmars.2021.638955/full#supplementary-material
Bailey, S. A., Brown, L., Campbell, M. L., Canning-Clode, J., Carlton, J. T., Castro, N., et al. (2020). Trends in the detection of aquatic non-indigenous species across global marine, estuarine and freshwater ecosystems: a 50-year perspective. Divers. Distrib. 26, 1780–1797. doi: 10.1111/ddi.13167
Briski, E., Allinger, L. E., Balcer, M., Cangelosi, A., Fanberg, L., Markee, T. P., et al. (2013a). Multidimensional approach to invasive species prevention. Environmen. Sci. Technol. 47, 1216–1221.
Briski, E., Bailey, S. A., Casas-Monroy, O., DiBacco, C., Kaczmarka, I., Lawrence, J. E., et al. (2013b). Taxon- and vector-specific variation in species richness and abundance during the transport stage of biological invasions. Limnol. Oceanogr. 58, 1361–1372. doi: 10.4319/lo.2013.58.4.1361
Carlton, J. T., Reid, D. M., and van Leeuwen, H. (1995). Shipping Study. The Role of Shipping in the Introduction of Nonindigenous Aquatic Organisms to the Coastal Waters of the United States (other than the Great Lakes) and an Analysis of Control Options. The National Sea Grant College Program/Connecticut Sea Grant Project R/ES-6. Report Number CG-D-11-95. Government Accession Number AD-A294809. Washington, DC: Department of Transportation, United States Coast Guard.
Carney, K. J., Minton, M. S., Holzer, K. K., Miller, A. W., McCann, L. D., and Ruiz, G. M. (2017). Evaluating the combined effects of ballast water management and trade dynamics on transfers of marine organisms by ships. PLoS ONE 12:e0172468. doi: 10.1371/journal.pone.0172468
Choi, K. H., Kimmerer, W., Smith, G., Ruiz, G. M., and Lion, K. (2005). Post-exchange zooplankton in ballast water of ships entering the San Francisco Estuary. J. Plankton Res. 27, 707–714. doi: 10.1093/plankt/fbi044
Cloern, J. E., and Jassby, A. D. (2012). Drivers of change in estuarine-coastal ecosystems: discoveries from four decades of study in San Francisco Bay. Rev. Geophys. 50:RG4001. doi: 10.1029/2012RG000397
Cohen, A. N., and Carlton, J. T. (1995). Nonindigenous Aquatic Species in a United States Estuary: A Case Study of the Biological Invasions of the San Francisco Bay and Delta. Washington, DC: U.S. Fish and Wildlife Service and National Sea Grant College Program (Connecticut Sea Grant).
Cohen, A. N., and Carlton, J. T. (1998). Accelerating invasion rate in a highly invaded estuary. Science 279, 555–558. doi: 10.1126/science.279.5350.555
Cope, R. C., Prowse, T. A. A., Ross, J. V., Wittmann, T. A., and Cassey, P. (2015). Temporal modelling of ballast water discharge and ship-mediated invasion risk to Australia. R. Soc. Open Sci. 2:150039. doi: 10.1098/rsos.150039
Costello, C., Springborn, M., McAusland, C., and Solow, A. (2007). Unintended biological invasions: does risk vary by trading partner? J. Environ. Econ. Manag. 54, 262–276. doi: 10.1016/j.jeem.2007.06.001
Costello, C. J., and Solow, A. R. (2003). On the pattern of discovery of introduced species. Proc. Natl. Acad. Sci. U.S.A. 100, 3321–3323. doi: 10.1073/pnas.0636536100
Crooks, J. A. (2005). Lag times and exotic species: the ecology and management of biological invasions in slow-motion. Ecoscience 12, 316–329. doi: 10.2980/i1195-6860-12-3-316.1
Dafforn, K. A., Glasby, T. M., Airoldi, L., Rivero, N. K., Mayer-Pinto, M., and Johnston, E. L. (2015). Marine urbanization: an ecological framework for designing multifunctional artificial structures. Front. Ecol. Environ. 13:82–90. doi: 10.1890/140050
David, M., Gollasch, S., and Penko, L. (2018). Identification of ballast water discharge profiles of a port to enable effective ballast water management and environmental studies. J. Sea Res. 133, 60–72. doi: 10.1016/j.seares.2017.03.001
David, M., Perkovic, M., Suban, V., and Gollasch, S. (2012). A generic ballast water discharge assessment model as a decision supporting tool in ballast water management. Decis. Support Syst. 53, 175–185. doi: 10.1016/j.dss.2012.01.002
Davidson, I. C., Scianni, C., Minton, M. S., and Ruiz, G. M. (2018). A history of ship specialization and consequences for marine invasions, management and policy. J. Appl. Ecol. 55, 1799–1811. doi: 10.1111/1365-2664.13114
Gibbs, M. T., and Browman, H. I. (2015). Risk assessment and risk management: a primer for marine scientists. ICES J. Mar. Sci. 72, 992–996. doi: 10.1093/icesjms/fsu232
Holzer, K. K., Muirhead, J. R., Minton, M. S., Carney, K. J., Miller, A. W., and Ruiz, G. M. (2017). Potential effects of LNG trade shift on transfer of ballast water and biota by ships. Sci. Total Environ. 580, 1470–1474. doi: 10.1016/j.scitotenv.2016.12.125
Hulme, P. (2009). Trade, transport and trouble: managing invasive species pathways in an era of globalization. J. Appl. Ecol. 46, 10–18. doi: 10.1111/j.1365-2664.2008.01600.x
Kaluza, P., Kölzsch, A., Gastner, M. T., and Blasius, B. (2010). The complex network of global cargo ship movements. J. R. Soc. Interface 7, 1093–1103. doi: 10.1098/rsif.2009.0495
Kelleher, G., Bleakley, C., and Wells, S. (1995). A Global Representative System of Marine Protected Areas, Volume 2–4. Washington, DC: The World Bank.
Mack, R. N., Simberloff, D., Lonsdale, W. M., Evans, H., Clout, M., and Bazzaz, F. A. (2000). Biotic invasions: causes, epidemiology, global consequences, and control. Ecol. Appl. 10, 689–710. doi: 10.1890/1051-0761(2000)010[0689:bicegc]2.0.co;2
Meyerson, L. A., and Mooney, H. A. (2007). Invasive alien species in an era of globalization. Front. Ecol. Environ. 5:199–208. doi: 10.1890/1540-9295(2007)5[199:iasiae]2.0.co;2
Miller, A. W., Minton, M. S., and Ruiz, G. M. (2011). Geographic limitations and regional differences in ships’ ballast water management to reduce marine invasions in the contiguous United States. Bioscience 61, 880–887. doi: 10.1525/bio.2011.61.11.7
Minton, M. S., Miller, A. W., and Ruiz, G. M. (2015). “Implications for ships type on delivery and management of ballast water,” in Biological Invasions in Changing Ecosystems, ed. J. Canning-Clode (Berlin: De Gruyter Open Ltd), 343–364. doi: 10.1515/9783110438666-021
Minton, M. S., Verling, E., Miller, A. W., and Ruiz, G. M. (2005). Reducing propagule supply and coastal invasions via ships: effects of emerging strategies. Front. Ecol. Environ. 3:304–308. doi: 10.1890/1540-9295(2005)003[0304:rpsaci]2.0.co;2
National Ballast Information Clearinghouse (2016). NBIC Online Database. Washington, DC: United States Coast Guard, doi: 10.5479/data.serc.nbic
National Research Council (NRC) (2011). Assessing the Relationship Between Propagule Pressure and Invasion Risk in Ballast Water. Washington, DC: The National Academies Press, 144.
Nichols, F. H., Cloern, J. E., Luoma, S. N., and Peterson, D. H. (1986). The modification of an estuary. Science 231, 567–573.
Pysek, P., and Richardson, D. (2010). Invasive species, environmental change and management, and health. Annu. Rev. Environ. Resour. 35, 25–55. doi: 10.1146/annurev-environ-033009-095548
Ruiz, G. M., and Carlton, J. T. (2003). Invasive Species: Vectors and Management Strategies. Washington, DC: Island Press.
Ruiz, G. M., Fofonoff, P. W., Ashton, G., Minton, M. S., and Miller, A. W. (2013). Geographic variation in marine invasions among large estuaries: effects of ships and time. Ecol. Appl. 23, 311–320. doi: 10.1890/11-1660.1
Ruiz, G. M., Fofonoff, P. W., Carlton, J. T., Wonham, M. J., and Hines, A. H. (2000a). Invasion of coastal marine communities in North America: apparent patterns, processes, and biases. Annu. Rev. Ecol. Syst. 31, 481–531. doi: 10.1146/annurev.ecolsys.31.1.481
Ruiz, G. M., Fofonoff, P. W., Steves, B., Foss, S. F., and Shiba, S. N. (2011). Marine invasion history and vector analysis of California: a hotspot for western North America. Divers. Distrib. 17, 362–373. doi: 10.1111/j.1472-4642.2011.00742.x
Ruiz, G. M., Rawlings, T. K., Dobbs, F. C., Drake, L. A., Mullady, T., Huq, A., et al. (2000b). Global spread of microorganisms by ships. Nature 408, 49–50. doi: 10.1038/35040695
Sakai, A. K., Allendorf, F. W., Holt, J. S., Lodge, D. M., Molofsky, J., With, K. A., et al. (2001). The population biology of invasive species. Annu. Rev. Ecol. Syst. 32, 305–332.
Sardain, A., Sardain, E., and Leung, B. (2019). Global forecasts of shipping traffic and biological invasions to 2050. Nat. Sustainabil. 2, 274–282. doi: 10.1038/s41893-019-0245-y
Seebens, H., Gastner, M. T., and Blasius, B. (2013). The risk of marine bioinvasion caused by global shipping. Ecol. Lett. 16, 782–790. doi: 10.1111/ele.12111
Seebens, H., Schwart, N., Schupp, P. J., and Blasius, B. (2016). Predicting the spread of marine species introduced by global shipping. Proc. Natl. Acad. Sci. U.S.A. 113, 5646–5651. doi: 10.1073/pnas.1524427113
Simberloff, D. (2009). The role of propagule pressure in biological invasions. Annu. Rev. Ecol. Evol. Syst. 40, 81–102. doi: 10.1146/annurev.ecolsys.110308.120304
Smith, L. D., Wonham, M. J., McCann, L. D., Ruiz, G. M., Hines, A. H., and Carlton, J. T. (1999). Invasion pressure to a ballast-flooded estuary and an assessment of inoculant survival. Biol. Invasions 1, 67–87.
Solow, A. R., and Costello, C. J. (2004). Estimating the rate of species introductions from the discovery record. Ecology 85, 1822–1825. doi: 10.1890/03-3102
USA Trade Online (2019). Electronic publication, United States Census Bureau, U.S. Department of Commerce. Available online at: https://usatrade.census.gov/index.php (accessed November 2018).
Verling, E., Ruiz, G. M., Smith, L. D., Galil, B., Miller, A. W., and Murphy, K. R. (2005). Supply-side invasion ecology: characterizing propagule pressure in coastal ecosystems. Proc. R. Soc. B 272, 1249–1257. doi: 10.1098/rspb.2005.3090
Verna, D. E., Harris, B. P., Holzer, K. K., and Minton, M. S. (2016). Ballast-borne marine invasive species: exploring the risk to coastal Alaska, USA. Manag. Biol. Invasions 7, 199–211. doi: 10.3391/mbi.2016.7.2.08
Westphal, M. I., Browne, M., MacKinnon, K., and Noble, I. (2008). The link between international trade and the global distribution of invasive alien species. Biol. Invasions 10, 391–398. doi: 10.1007/s10530-007-9138-5
Winder, M., Jassby, A. D., and Nally, R. M. (2011). Synergies between climate anomalies and hydrological modifications facilitate estuarine biological invasions. Ecol. Lett. 14, 749–757. doi: 10.1111/j.1461-0248.2011.01635.x
Wonham, M. J., Byers, J. E., Grosholz, E. D., and Leung, B. (2013). Modeling the relationship between propagule pressure and invasion risk to inform policy and management. Ecol. Appl. 23, 1691–1706. doi: 10.1890/12-1985.1
Keywords: invasive species, maritime trade, San Francisco Bay, vector management, biosecurity, ballast water
Citation: Verna DE, Minton MS and Ruiz GM (2021) Trade Exports Predict Regional Ballast Water Discharge by Ships in San Francisco Bay. Front. Mar. Sci. 8:638955. doi: 10.3389/fmars.2021.638955
Received: 08 December 2020; Accepted: 24 June 2021;
Published: 16 July 2021.
Edited by:
Wen-Cheng Wang, National Taiwan Normal University, TaiwanReviewed by:
Peter Paul Stehouwer, SGS Institut Fresenius, GermanyCopyright © 2021 Verna, Minton and Ruiz. This is an open-access article distributed under the terms of the Creative Commons Attribution License (CC BY). The use, distribution or reproduction in other forums is permitted, provided the original author(s) and the copyright owner(s) are credited and that the original publication in this journal is cited, in accordance with accepted academic practice. No use, distribution or reproduction is permitted which does not comply with these terms.
*Correspondence: Danielle E. Verna, dmVybmFkQHNpLmVkdQ==
Disclaimer: All claims expressed in this article are solely those of the authors and do not necessarily represent those of their affiliated organizations, or those of the publisher, the editors and the reviewers. Any product that may be evaluated in this article or claim that may be made by its manufacturer is not guaranteed or endorsed by the publisher.
Research integrity at Frontiers
Learn more about the work of our research integrity team to safeguard the quality of each article we publish.