 Sunniva Løviknes
 Knut H. Jensen
 Bjørn A. Krafft
 Valantine Anthonypillai1
 Leif Nøttestad
- 1Institute of Marine Research, Bergen, Norway
- 2Department of Biology, University of Bergen, Bergen, Norway
Fin whales (Balaenoptera physalus) and humpback whales (Megaptera novaeangliae) are commonly found in the Norwegian Sea during the summer months. Records from around 1995 to 2004 show that their distribution patterns were mainly associated with those of macro-zooplankton. More recent studies conducted from 2009 to 2012 demonstrate marked shifts, with fin whale distribution related to pelagic fish distribution, decreasing densities of humpbacks, and increased densities of toothed whales. During the same period, historically large abundances of pelagic planktivorous fish in the Norwegian Sea were reported. The goals of this study were to examine the summer distribution of fin and humpback whales from 2013 to 2018 and to assess the potential association between distribution and environmental impact factors. Results suggest a pronounced northerly shift in distribution for both species, a feeding hotspot for fin whales at the shelf area between Svalbard and Norway, and one near Bear Island for humpback whales. Fin whale distribution was associated with that of blue whiting (Micromesistius poutassou) and capelin (Mallotus villosus), whereas humpback whale distribution was associated with that of euphausiids (Meganyctiphanes norvegica, Thysanoessa longicaudata, and Thysanoessa inermis), capelin, and herring (Clupea harengus). However, a significant negative spatial correlation was found between whale occurrence and the widely expanding population of northeast Atlantic mackerel (Scomber scombrus). The results of this study suggest that the prey composition of fin and humpback whales in recent years contain a large proportion of fish. The apparent northerly shift in the distribution of these whale species is largely determined by the availability of prey, but it likely is also impacted by direct or indirect interspecific interactions, especially with killer whales (Orcinus orca). Such large-scale pronounced changes in distribution seem to confirm a high degree of plasticity in fin and humpback whale feeding in the Norwegian Sea.
Introduction
How whales navigate during long-distance migration is still unknown, but theories include learning by experience and from conspecifics, and the use of the Earth’s magnetic field, position of the sun, and bathymetric patterns (Dawbin, 1966; Stern, 2002; Horton et al., 2011; Garrigue et al., 2015). Little is known about the degree to which whales alter their migration routes or the plasticity of their habitat choice and distribution (Stern, 2002). However, the general perception is that baleen whales display strong site fidelity with little variation (Mackintosh, 1966; Katona and Beard, 1990; Clapham et al., 1993; Clapham, 2009).
Fin whales (Balaenoptera physalus) and humpback whales (Megaptera novaeangliae), which are both baleen whales, make annual feeding trips to high latitudes in summer and reside at tropical latitudes during the winter months, where calving typically occurs (Aguilar, 2009; Clapham, 2002, 2009; Nøttestad and Olsen, 2004; Horton et al., 2011). Traditional feeding grounds for humpbacks and fin whales in the Northeast Atlantic are located on the continental shelf areas near Iceland, Jan Mayen, Bear Island, coastal northern Norway, and Svalbard representing both the northern part of the Norwegian Sea and southwestern part of the Barents Sea ecosystems (Aguilar, 2009; Clapham, 2009; Víkingsson et al., 2009, 2015; Nøttestad et al., 2014c, 2015b; Moore et al., 2019). Unlike toothed whales, these species do not use echolocation to obtain information about their surroundings, communicate, or find food, although they may use smell to detect prey species at the surface (Tyack, 1986; Clapham, 2009). Fin and humpback whales feed on a variety of organisms depending on prey availability (Kawamura, 1980; Aguilar, 2009; Clapham, 2009), but they focus primarily on euphausiids (krill) and fish (Skern-Mauritzen et al., 2009; Moore et al., 2019). Their preferred prey in the Northeast Atlantic seems to be krill and small schooling fish species such as capelin (Mallotus villosus), herring (Clupea harengus), mackerel (Scomber scombrus), and blue whiting (Micromesistius poutassou) (Piatt and Methven, 1992; Nøttestad and Olsen, 2004; Skern-Mauritzen et al., 2009).
Structural changes and dynamics in the Norwegian Sea’s physical environment and biological species and biomass composition have been reported since the 2000s and onward (MacLeod et al., 2005; Loeng and Drinkwater, 2007; Laidre et al., 2010; Nøttestad et al., 2014c, 2015a; ICES (International Council for the Exploration of the Sea), 2016a, 2018a; NAMMCO, 2018; Frantzen et al., 2019). These changes include shifts in geographical nutrient levels, production, and distribution as well as a highly dynamic temperature regime in the Norwegian Sea between years (MacLeod et al., 2005; Learmonth et al., 2006; Simmonds and Isaac, 2007; Laidre et al., 2008; Simmonds and Eliott, 2009; Víkingsson et al., 2009, 2014, 2015; Nøttestad et al., 2014c, 2015a).
Surveys of the abundance and distribution of cetaceans in the Norwegian Sea and adjacent waters have been conducted regularly since 1987 (Øien, 1990; Nøttestad and Olsen, 2004; Pike et al., 2005; Víkingsson et al., 2009; Nøttestad et al., 2014c, 2015b; NAMMCO, 2018; Moore et al., 2019). Generally, whale sightings recorded in 2006 and 2007 (Nøttestad et al., 2014c) did not differ from those from the previous 10–15 years in terms of distribution and cetacean species composition (Skjoldal et al., 2004; Øien, 2009; Víkingsson et al., 2009). Distributions of both fin and humpback whales were associated with high densities of krill and amphipods (Nøttestad et al., 2014c). However, based on survey results from 2009 to 2012, Nøttestad et al. (2015b) reported that fin whales had switched to a more pronounced fish diet and that a very small number of humpback whales where observed in this area. During this same time period, historically large abundances of pelagic planktivorous fish such as Norwegian spring-spawning herring, northeast Atlantic mackerel, and blue whiting were reported in the Norwegian Sea (Utne et al., 2012; Berge et al., 2015; Nøttestad et al., 2016a; ICES (International Council for the Exploration of the Sea), 2018b). Consequently, more toothed whales were concentrated in this ecosystem during this period, including long-finned pilot whales (Globicephala melas) and killer whales (Orcinus orca). Because fin whales are large and swim fast, they do not have significant predators apart from the killer whale (Ford and Reeves, 2008; Aguilar, 2009). Predation by killer whales does not appear to be a significant factor for humpback whales (Clapham, 2000), except for young calves (Ford and Reeves, 2008). The presence of killer whales in the Norwegian Sea (Nøttestad et al., 2014b) may influence the spatial distribution of fin and humpback whales due to their avoidance of direct contact and potential predation risk posed by killer whales.
The goals of this study were to quantify and better understand the spatio-temporal distribution, overlap, and feeding ecology of fin and humpback whales within the dynamic and productive Norwegian Sea ecosystem. Sighting data for these two large baleen whale species were collected in July and August during six consecutive years from 2013 to 2018, and these data were compared to the corresponding available data for a wide spectrum of potential pelagic prey species and relevant physical parameters (temperature, bottom depth, and topography).
Materials and Methods
Data Collection
Data were collected during the International Ecosystem Summer Surveys in the Nordic Seas (IESSNS) during six consecutive summer seasons from 2013 to 2018 (Nøttestad et al., 2013; Nøttestad et al., 2014a; Nøttestad et al., 2014b; Nøttestad et al., 2014c; Nøttestad et al., 2015a; Nøttestad et al., 2015b; Nøttestad et al., 2016a; Nøttestad et al., 2016b; Nøttestad et al., 2017; ICES (International Council for the Exploration of the Sea), 2018b; Figure 1). The data used herein were obtained from the Norwegian vessels surveying in the Norwegian Sea (Figure 1; ICES (International Council for the Exploration of the Sea), 2013, 2018b).
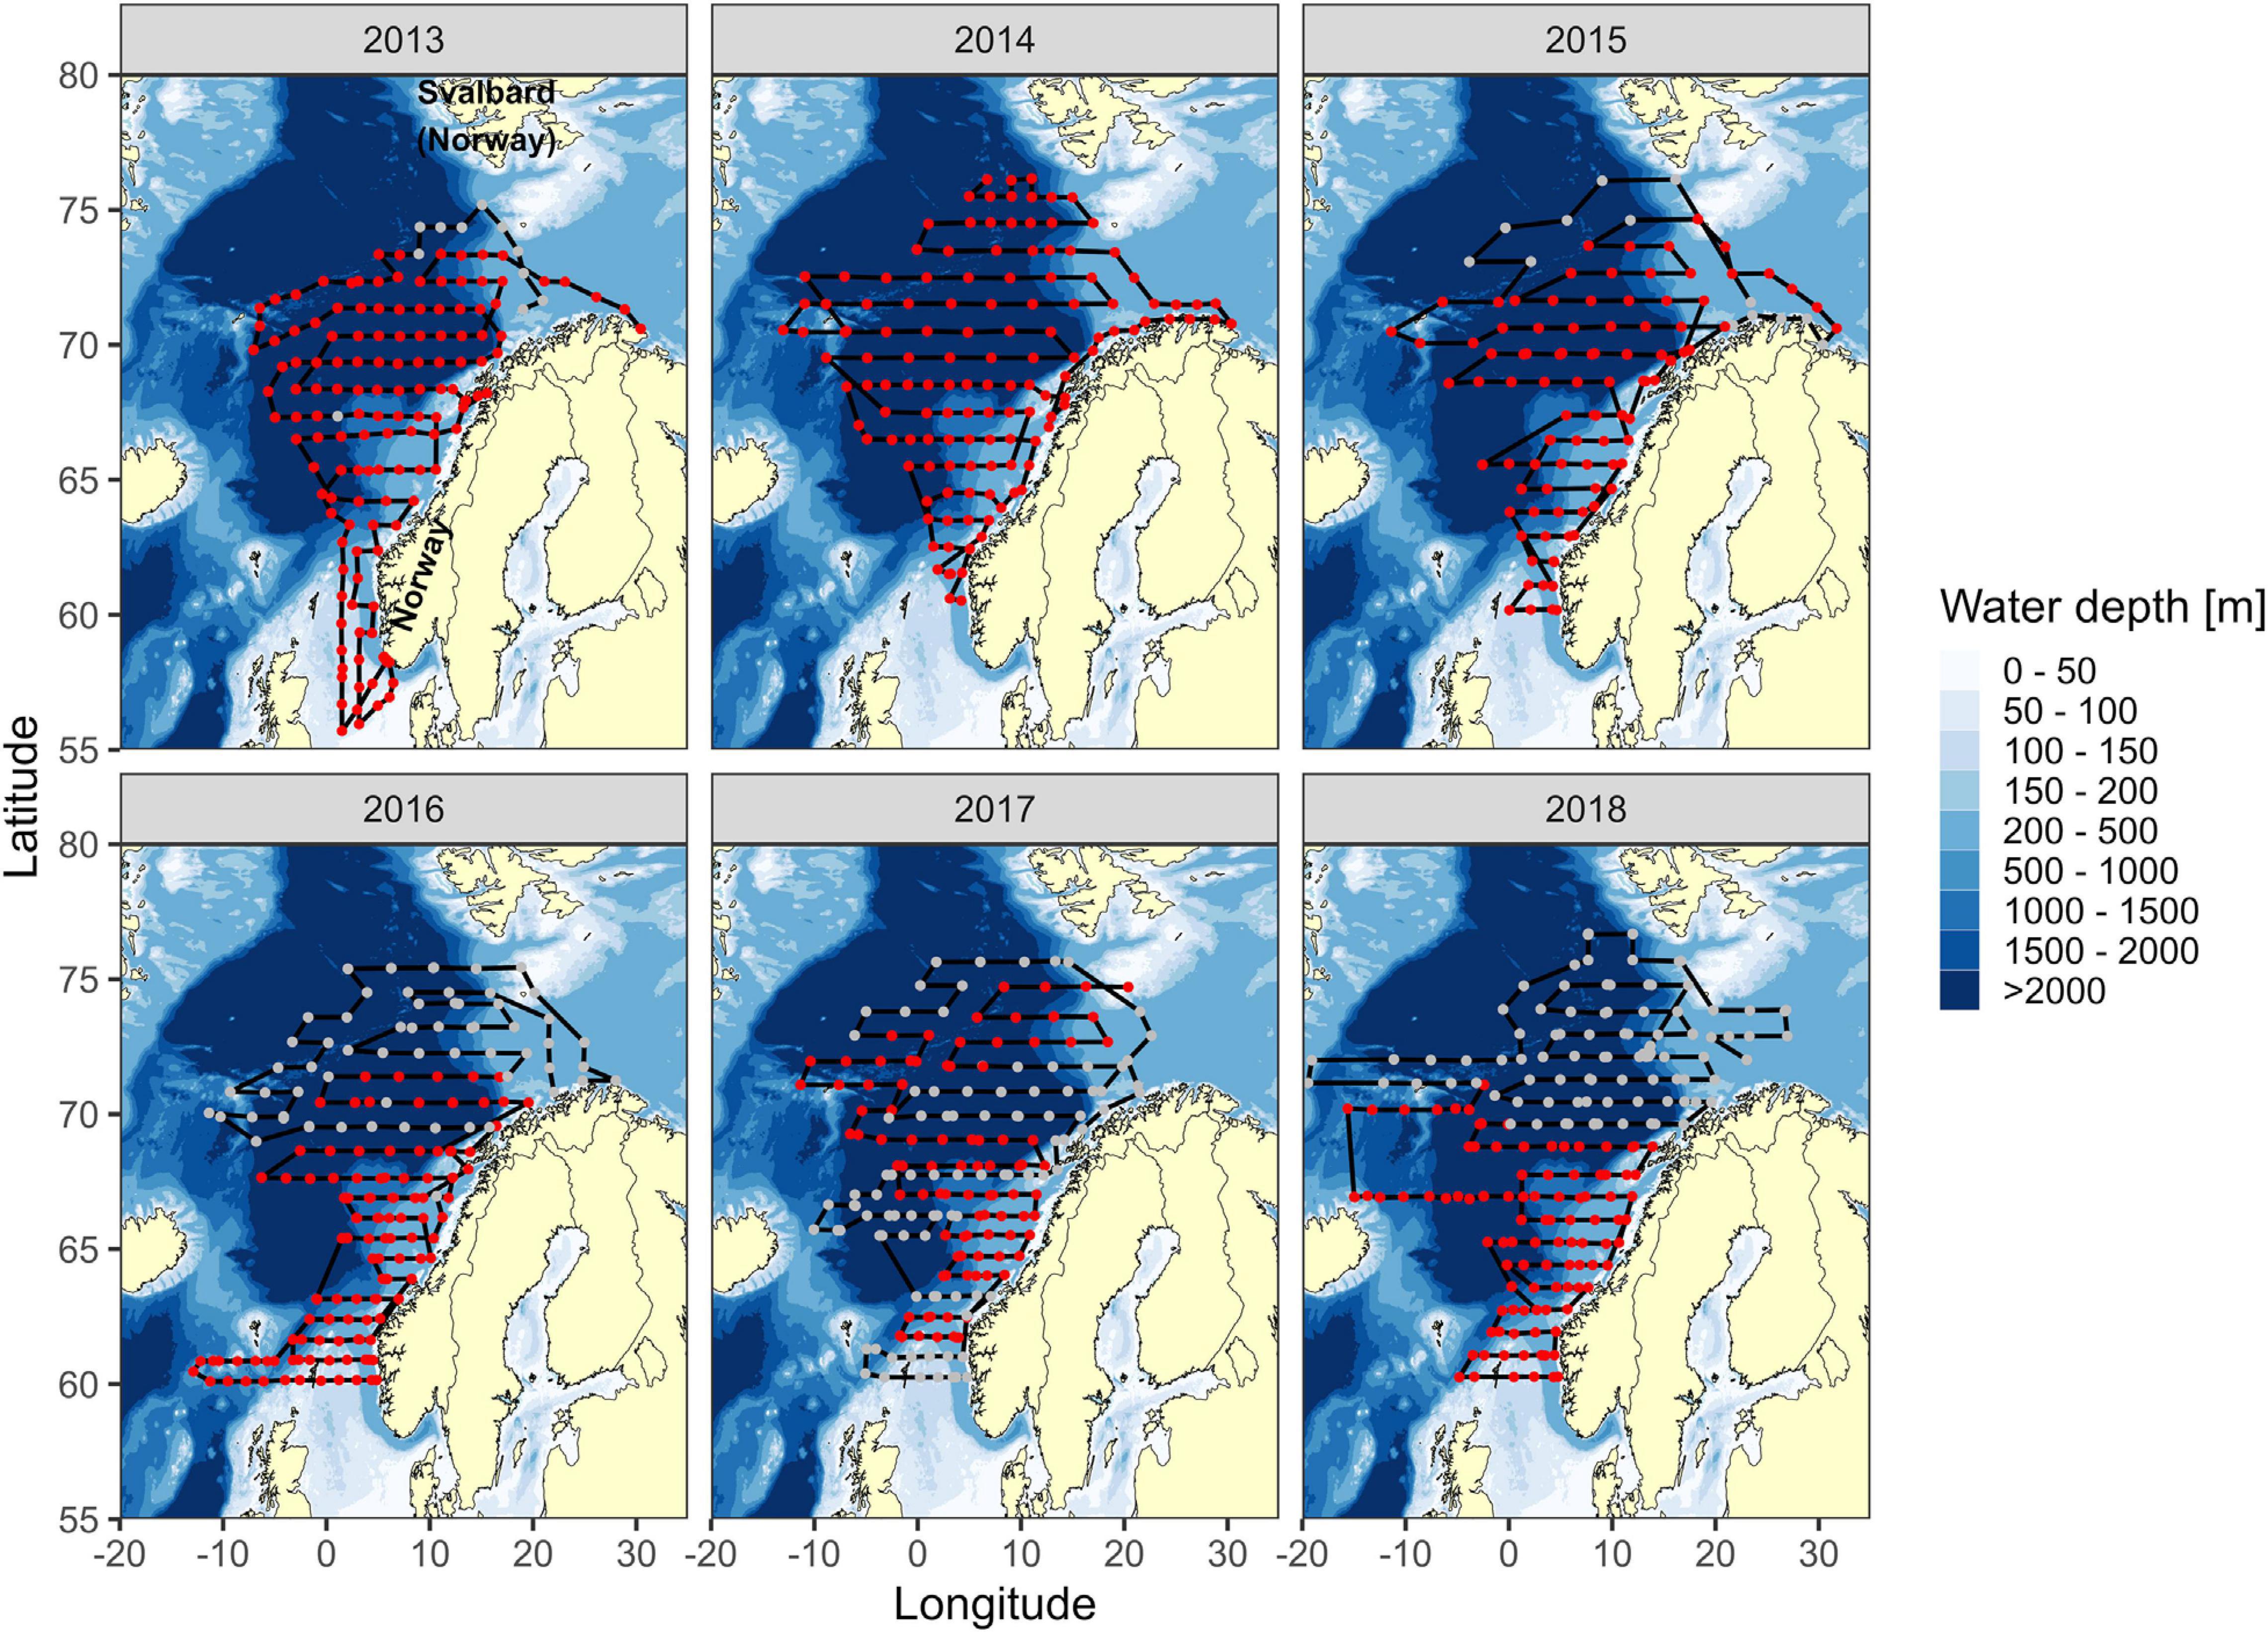
Figure 1. Survey area in the Norwegian Sea during the IESSNS from 2013 to 2018. Each year was covered by two Norwegian vessels. Lines illustrate cruise tracks, and data points along the lines represent stations for biological (trawl and zooplankton) and oceanographic (CTD casts) data sampling. Gray data points represent stations where zooplankton and CTD casts could not be included for further statistical analyses in this study.
The vessels followed predetermined transect lines at a nominal speed of 10 knots, and each sampling station was spaced approximately 60 nautical miles apart (Table 1). Cetacean sightings were made with the naked eye and binoculars between stations and when possible documented with photographs and video. The visual observations were made from the vessel bridge or bridge roof top (9–11 m above sea level) by designated whale observers during all light hours. All cetaceans observed were registered with time, position, number, and species or the nearest taxonomic group possible.
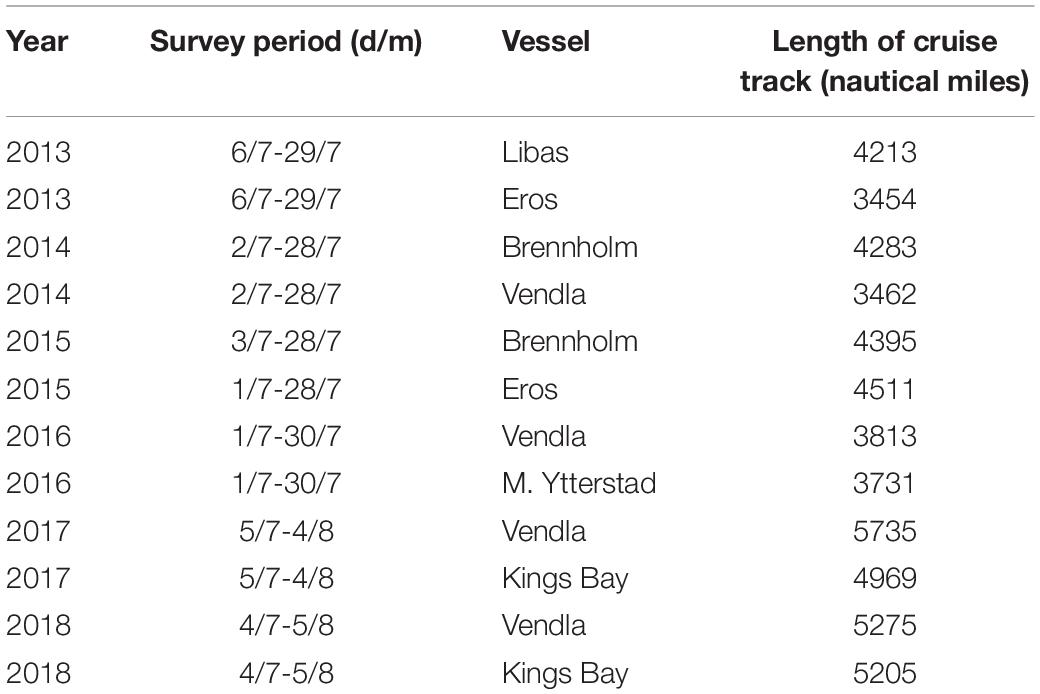
Table 1. Survey effort during IESSNS by Norwegian vessels in July and August, 2013–2018.
Station work included collection of meso- and macro-zooplankton and nekton. To collect meso- and to some extent macro-zooplankton, a 180 μm meshed WPII net with an mouth opening of 0.25 m2 was hauled vertically from 200 m, or 5 m above the bottom at shallower stations, at 0.5 m/s. The size ranges of meso- and macro-zooplankton sampled with the WPII net ranged between 1 to approximately 45 mm. The net was rinsed with seawater on deck before the codend was emptied. Half of the samples were size fractioned, dried (24 h at 70°C), frozen, and weighed, and values were converted to biomass following the procedures described in the Working Group on International Pelagic Surveys (ICES (International Council for the Exploration of the Sea), 2014). The other half of the zooplankton samples were fixated in 4% formaldehyde and borax buffered seawater for taxonomic species determination on shore. Nekton and macro-zooplankton were sampled using a Multpelt 832 trawl (mesh size 22 mm in codend). The trawling depth of the sampling trawl was 0–35 m. Trawl gear methods for rigging and operations followed the manual for International Pelagic Surveys (ICES (International Council for the Exploration of the Sea), 2013, 2014). Trawl catches were sorted to the nearest taxonomic level, counted, and weighed.
A SEABIRD (Sea-Bird Scientific, Bellevue, WA, United States) Conductivity Temperature Depth (CTD) sensor or SAIV (SAIV A/S, Environmental Sensors and Systems, Bergen, Norway) CTD sensor was hauled vertically from 0 to 500 m depth at each station. Bottom depth was extracted from the National Oceanic and Atmospheric Administration using the function getNOAA.bathy (NOAA)1 from the marmap package (Pante and Simon-Bouhet, 2013). The area between Norway and Svalbard is characterized by a shallow shelf region dividing the Norwegian Sea from the Barents Sea, with depths varying from 100 to 400 m in the east and dropping down to depths of >1000 m further west into the deep Norwegian Sea ecosystem (Figure 1).
Data Analysis
Data were analyzed and figures and maps were created using R, version 3.6.3 (R Development Core Team)2. Separate maps showing sightings and kernel areas of fin whales, humpback whales, and killer whales were created by using the R libraries maps and mapdata (Becker and Wilks, 1993; Brownrigg, 2018) and ggplot2 (Wickham, 2016). Kernel areas were determined by two-dimensional kernel density estimation (kde2d). Each kde2d was performed by pooling observations for all years and using the stat_density_2d function from the ggplot2 package, which utilizes the kde2d function from the MASS library (Venables and Ripley, 2002). It is important to note that kde2d does not distinguish between land and water, so it smoothes the kernel areas across land points.
The kernel areas allowed us to evaluate whether abiotic or biotic measures differed between the areas where the whales normally occur compared to the other areas of the survey. Therefore, we divided sampling stations into two groups: those inside and outside the kernel areas. We then compared these two areas with respect to samples and measures, such as temperature and prey species abundance. Each variable was tested using a linear mixed-effects model (lme) or generalized linear mixed-effects model (glmm); lme was used when CTD data was the response variable and glmm was used when catch data or bottom depth was the response variable. In both type of models, year was set as a random effect factor to account for the clustering of observations within years.
To obtain an overview of where prey was found compared to the kernel areas of the whales, we created maps in which kernel areas of the whales were combined with catch data of potential prey. We only created these maps for fish prey, as data for small prey (e.g., krill) were incomplete and did not cover the whole survey area.
To explore whether fin and humpback whales avoid areas where mackerel normally is most abundant, we used the kde2d of each whale species and counted the number of times high catches of mackerel (defined as ≥ the median value of 500 kg) was found inside the kernel areas (success) compared to outside (failure) in a binomial test. Prior to analysis, we set the probability of this event to occur (success) to p = 0.2. This probability was conservative because the kernel density area of each whale species was much larger than 20% of the area covered by high catches of mackerel. We used the same method to test the spatial overlap between killer whales and mackerel and between killer whales and fin or humpback whales. For the latter two tests, success was defined as a killer whale sighting within the kernel area of fin or humpback whales independent of group size of killer whales in the sighting.
We tried to analyze our data using maximum entropy analysis to determine species niches and distribution. However, our data were not suitable for this method because the samples of small prey and environmental variables were incomplete. The model did not perform well and did not recognize the areas with highest density of whales, and therefore we do not report these results.
Results
A total of 608 cetacean observations, including 2565 individuals, were made in the Norwegian Sea during the IESSNS between 2013 and 2018. Thirteen different species were observed during the six summer seasons. Fin, humpback, killer, minke (Balaenoptera acutorostrata), and sperm (Physeter macrocephalus) whales as well as white-beaked dolphins (Lagenorhynchus albirostris) were observed every year. Other species were only observed in certain years: harbor porpoise (Phocoena phocoena) in 2013; bottlenose whale (Hyperoodon ampullatus) and sei whale (Balaenoptera borealis) in 2014; pilot whale in 2014 and 2016; white-sided dolphin (Lagenorhynchus acutus) from 2016 to 2018; and blue whale (Balaenoptera musculus) in 2018. In addition, 163 individuals were not identified to species, and they were distributed all over the Norwegian Sea.
Fin and humpback whales were among the most common species sighted; of the 608 observations, 133 (21.9%) were fin whales and 72 (11.8%) were humpback whales. Most observations were made between 70°N and 77°N and within 0°E to 30°E, which was the largest continuous kernel area for both whale species (Figure 2). Seventy-one individual (11.7% of the total) killer whales were sighted, and these observations were distributed between 75°N and 60°N and 10°W 20°E.
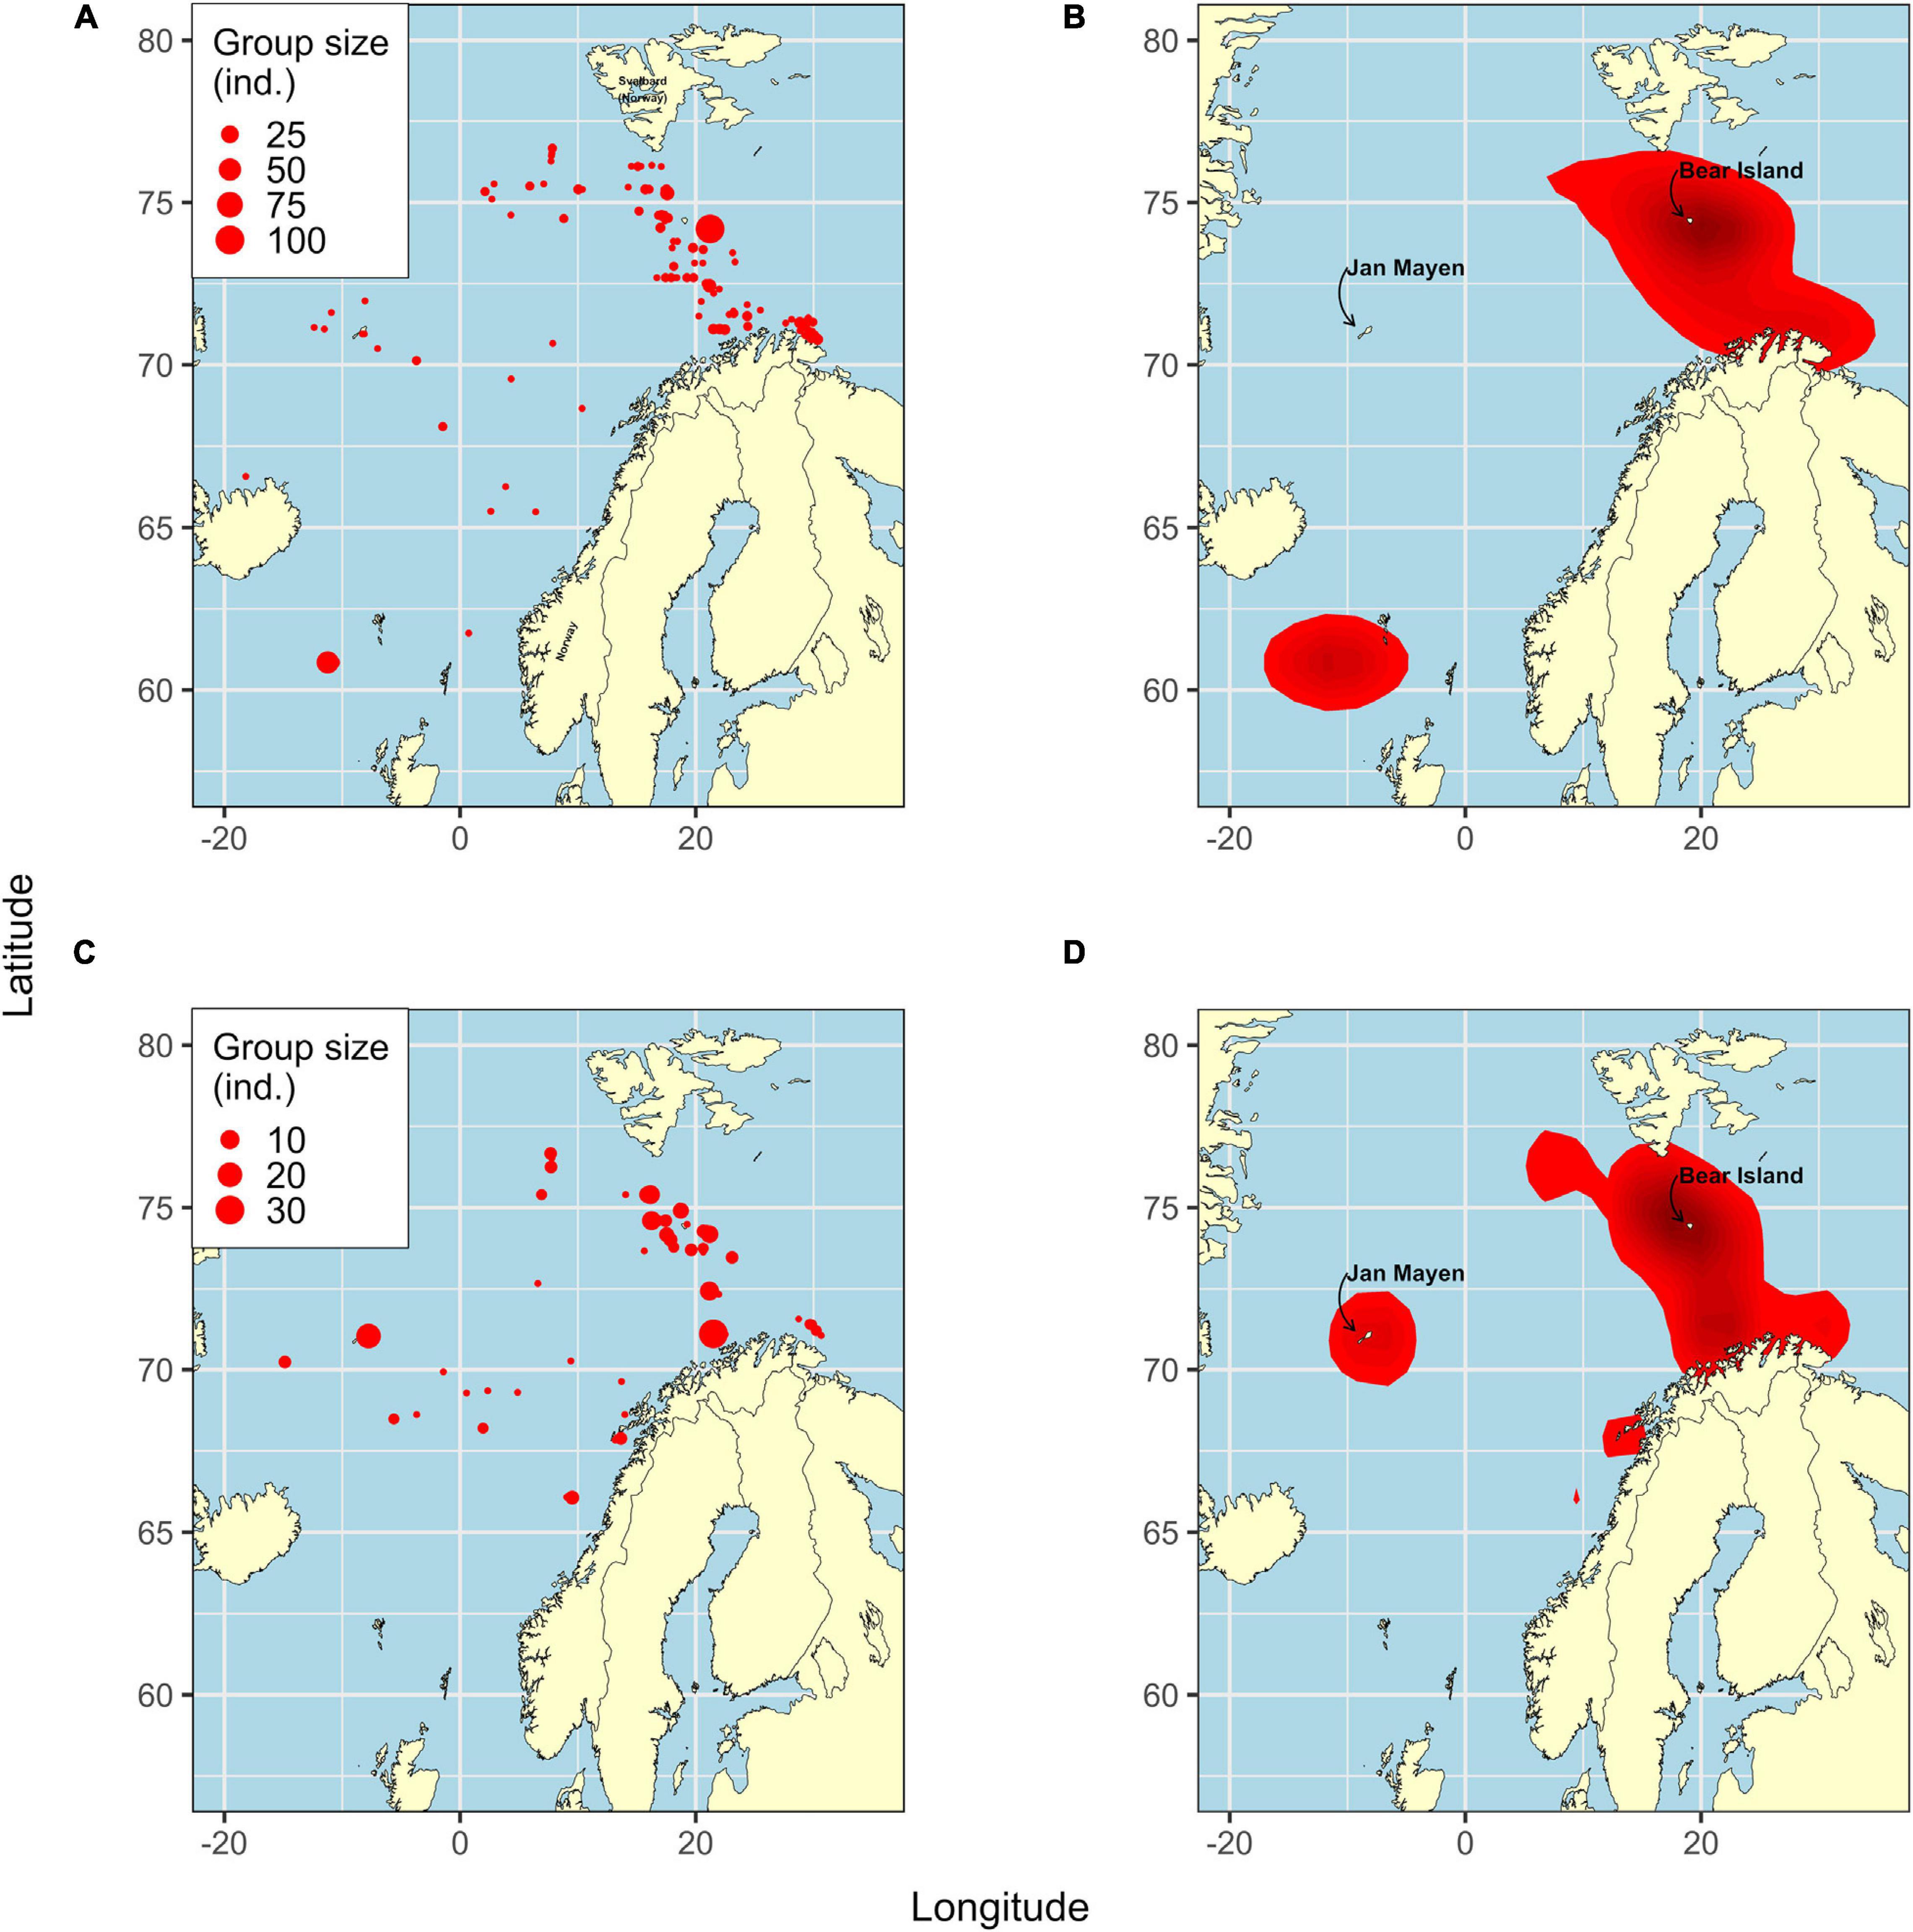
Figure 2. Fin (A,B) and humpback (C,D) whale distribution. Size of red points (left panels) represents the number of individuals from sightings from the IESSNS, 2013–2018. Red areas (right panels) represent kernel areas determined by two-dimensional kernel density estimation. Within each area, darker red denotes a higher probability of observing whales.
For both fin and humpback whales, the comparison between inside and outside the kernel areas showed a statistically significant difference for all four fish prey (mackerel, herring, capelin, and blue whiting) tested (Figure 3 and Tables 2, 3). However, with respect to biological significance, the clearest difference between inside and outside the kernel areas was for mackerel, with significantly fewer mackerel inside than outside for both of the baleen whale species.
Figure 3. Violin plots of biotic and abiotic variables from sampling stations inside versus outside kernel areas of fin (A panels) and humpback (B panels) whales. Different colors within a plot indicate significant differences determined by a generalized linear mixed-effects model (catch data and depth) or a linear mixed-effects model (CTD data). Solid circles represent predicted mean values from the models for which the random effect of year was taken into account. A violin plot is a mirrored density plot displayed in the same way as a boxplot (i.e., it illustrates data density along the y-axis). WPII is the plankton net for sampling meso- and macro-zooplankton.
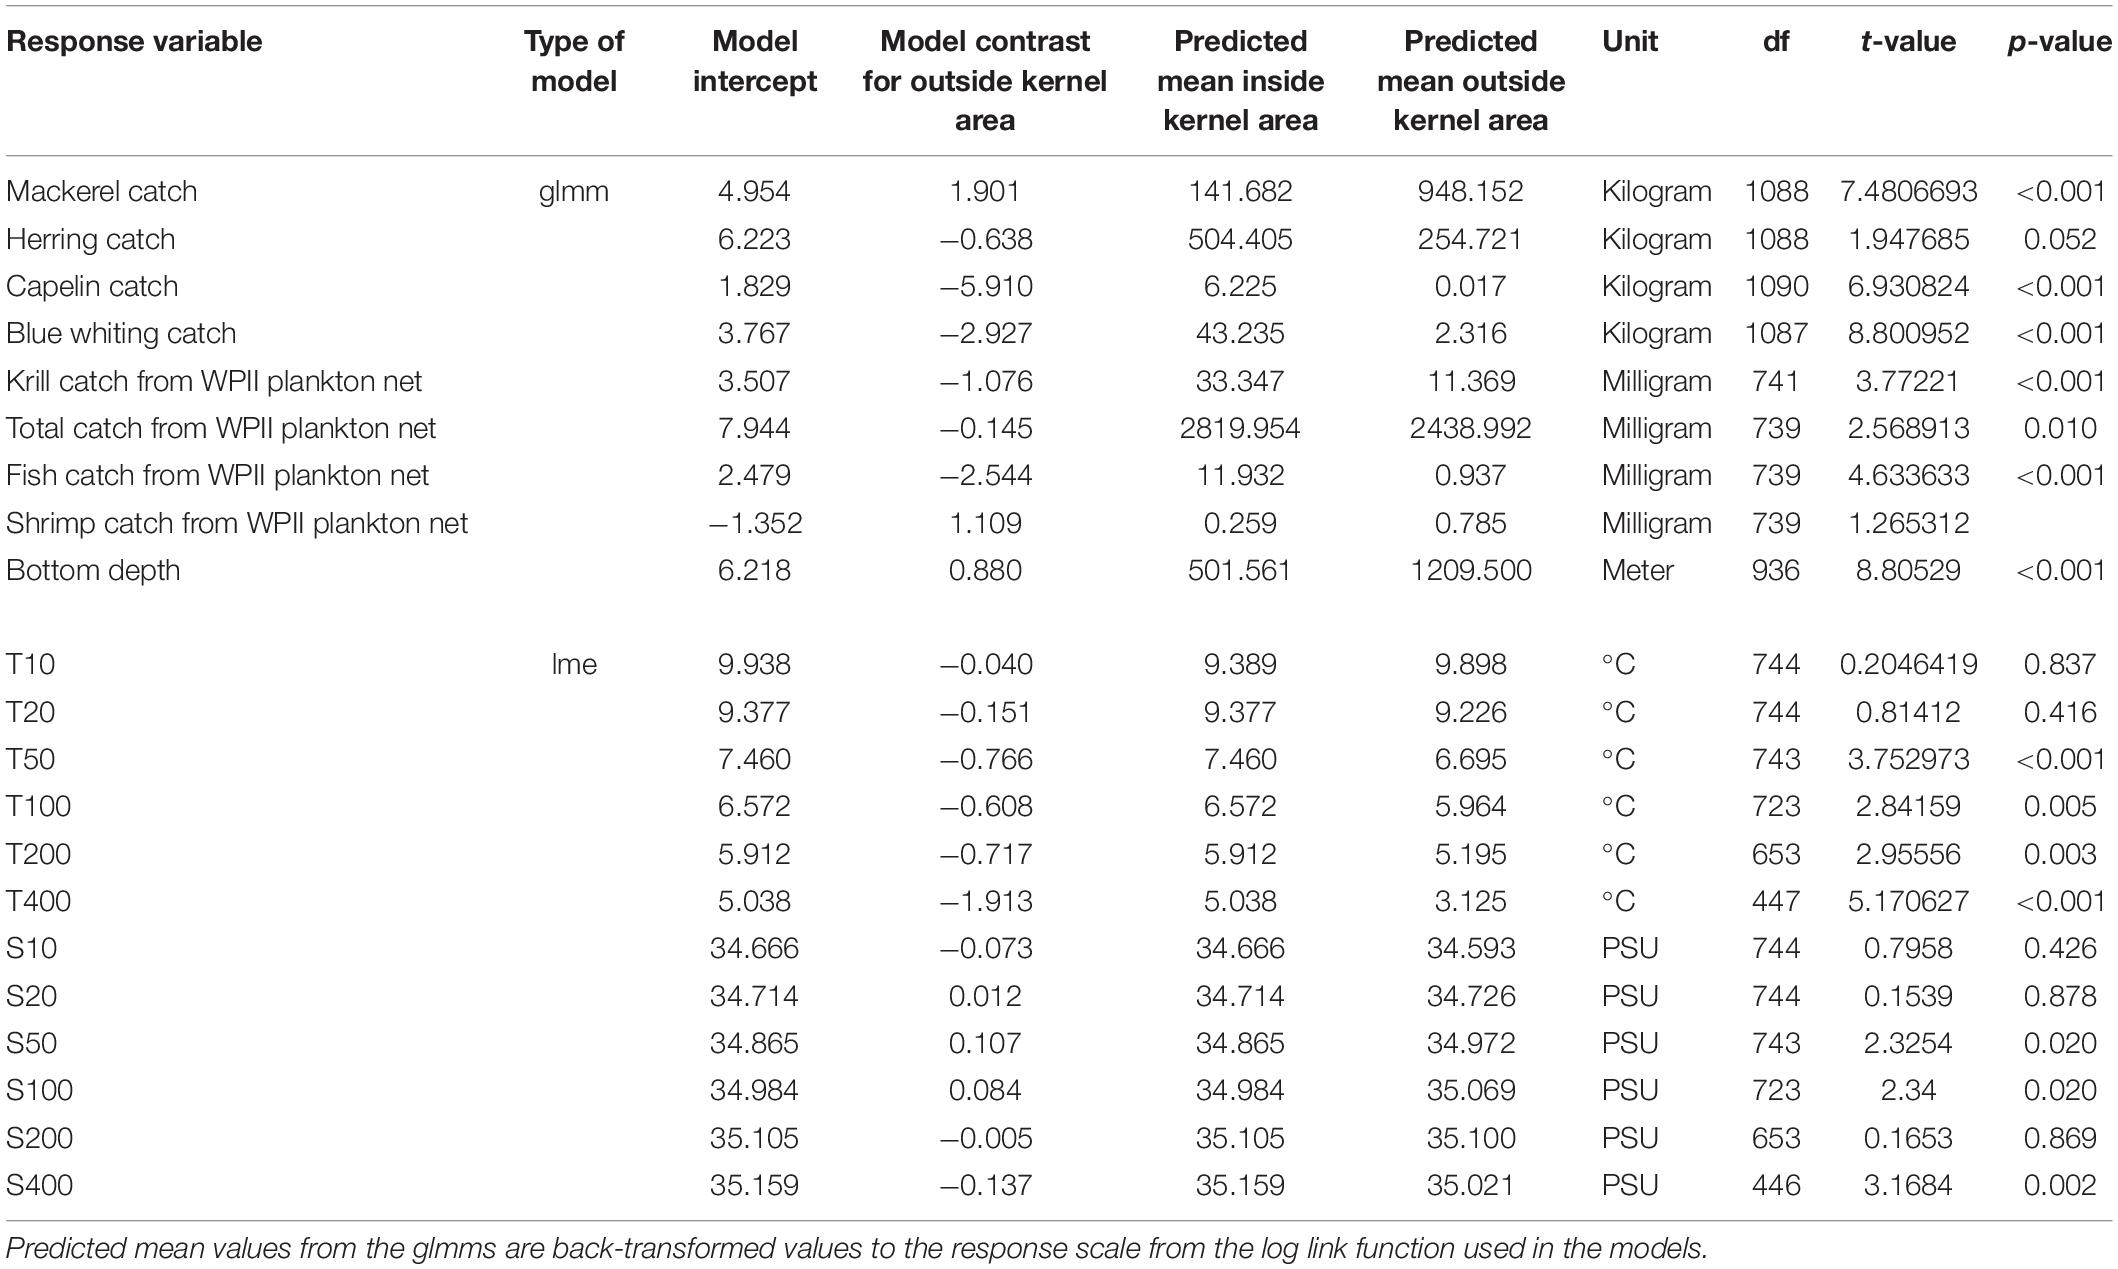
Table 2. Test statistics for biotic and abiotic factors compared between inside and outside the kernel areas of fin whales: glmm refers to the generalized linear mixed-effects model and lme refers to the linear mixed-effects model.
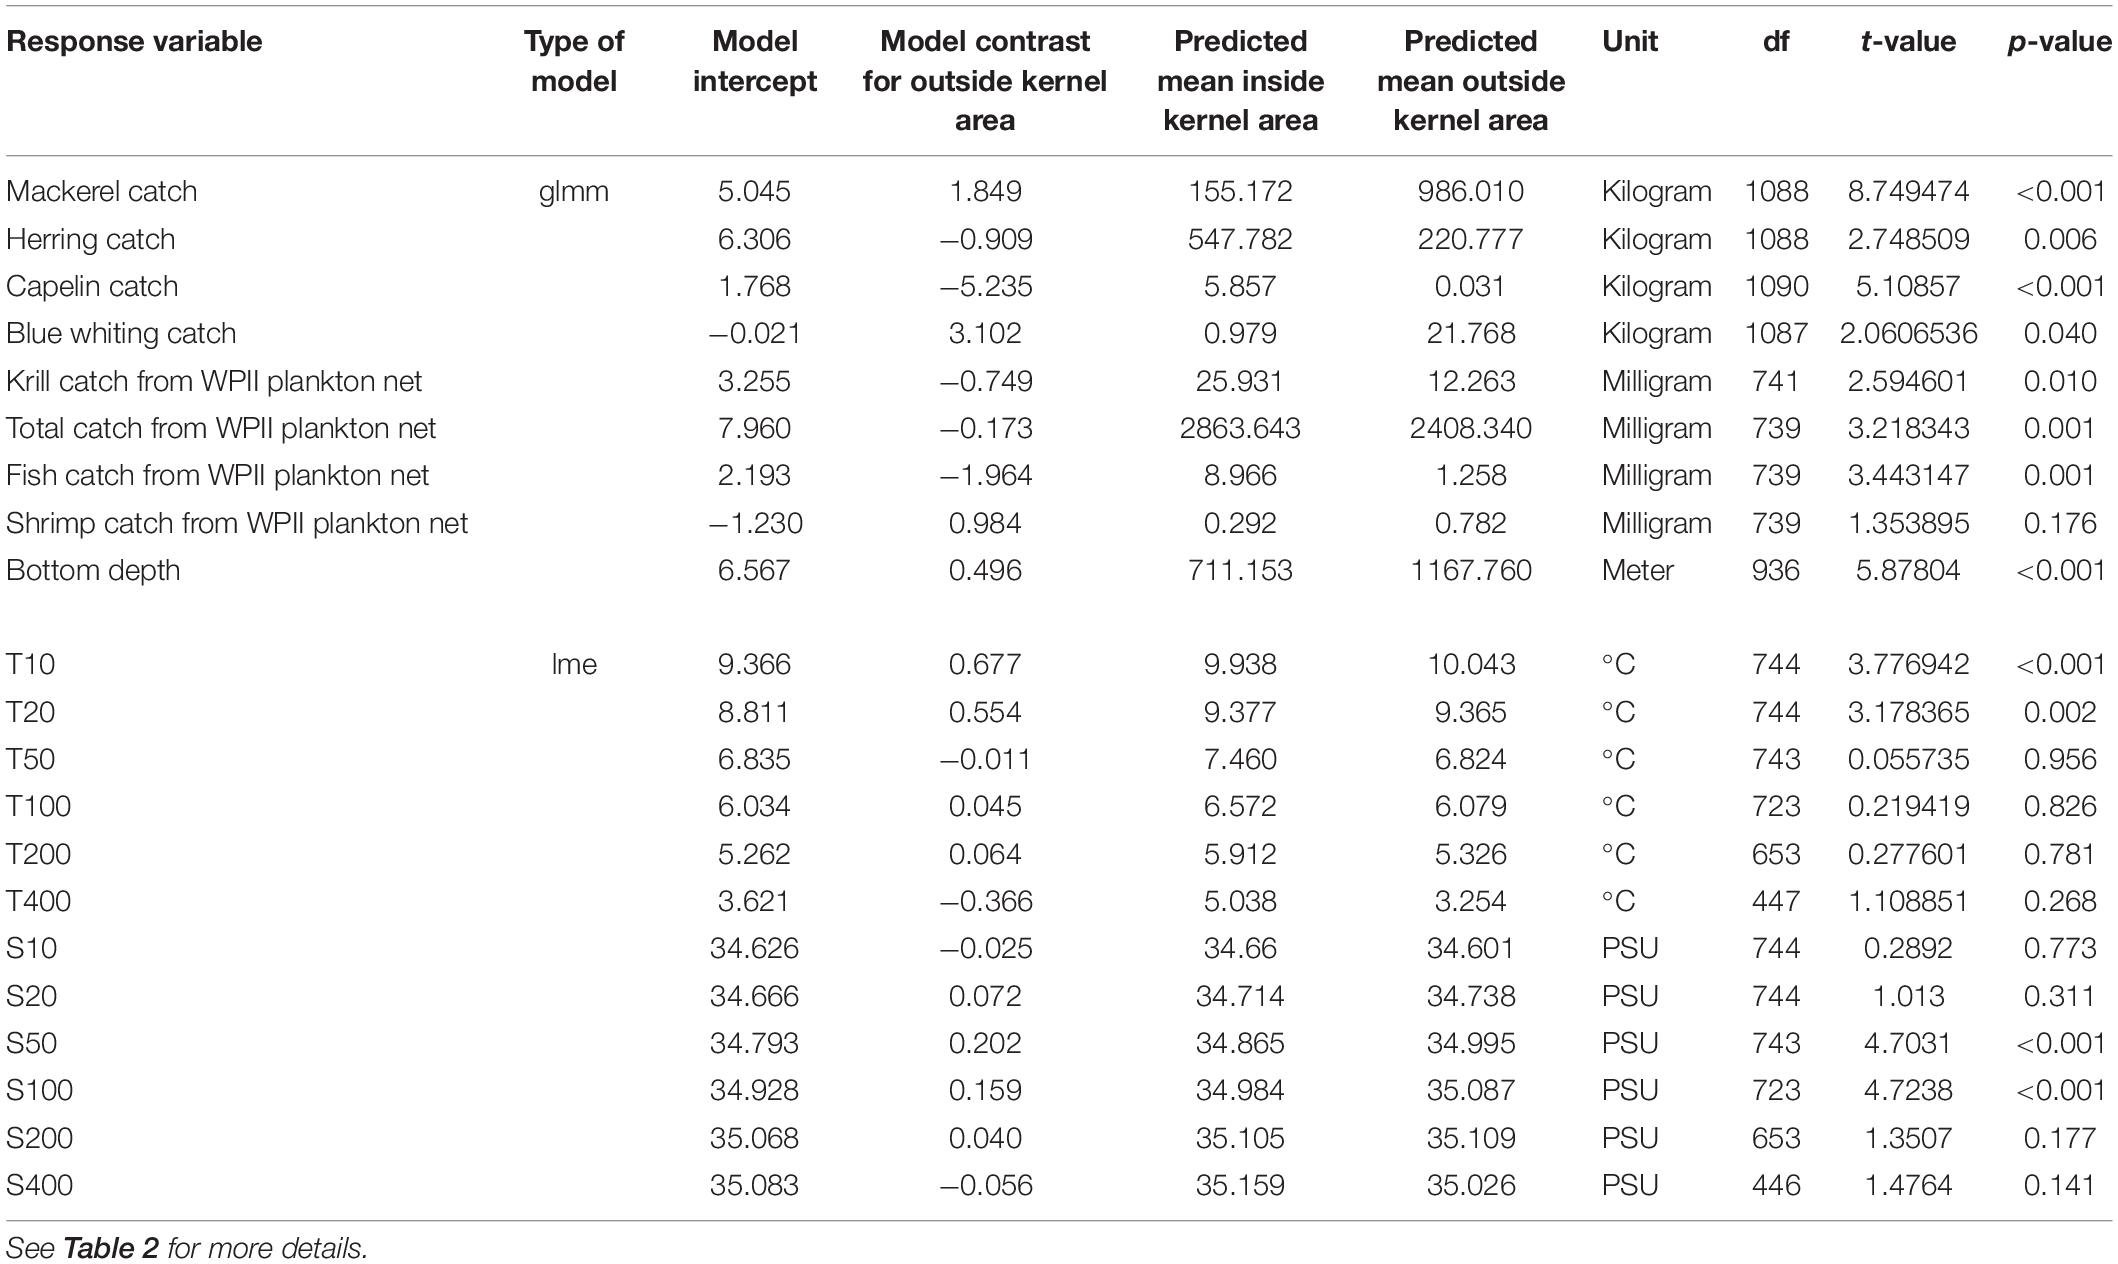
Table 3. Test statistics for biotic and abiotic factors compared between inside and outside the kernel areas of humpback whales.
The maps showing catch of the four main prey fish in the survey area compared to feeding hotspots of fin and humpback whales, showed that capelin was most positively associated with the two baleen whale species. The largest occurrences of capelin were found in the largest continuous hotspot area of the baleen whales (between Svalbard and mainland Norway) (Figure 4). For fin whales, a strong association between blue whiting and a hotspot area southwest of the Faroe Islands was also detected. This association was due to an observation of a large gathering of fin whales in 2016 together with a school of blue whiting. The strong association between fin whales and blue whiting may thus be over-inflated, due to the high numbers of fin whales recorded off the Faroes in 2016. The killer whale kernel area was more spread out throughout the study area and overlapped in large part with mackerel catches (Figure 5).
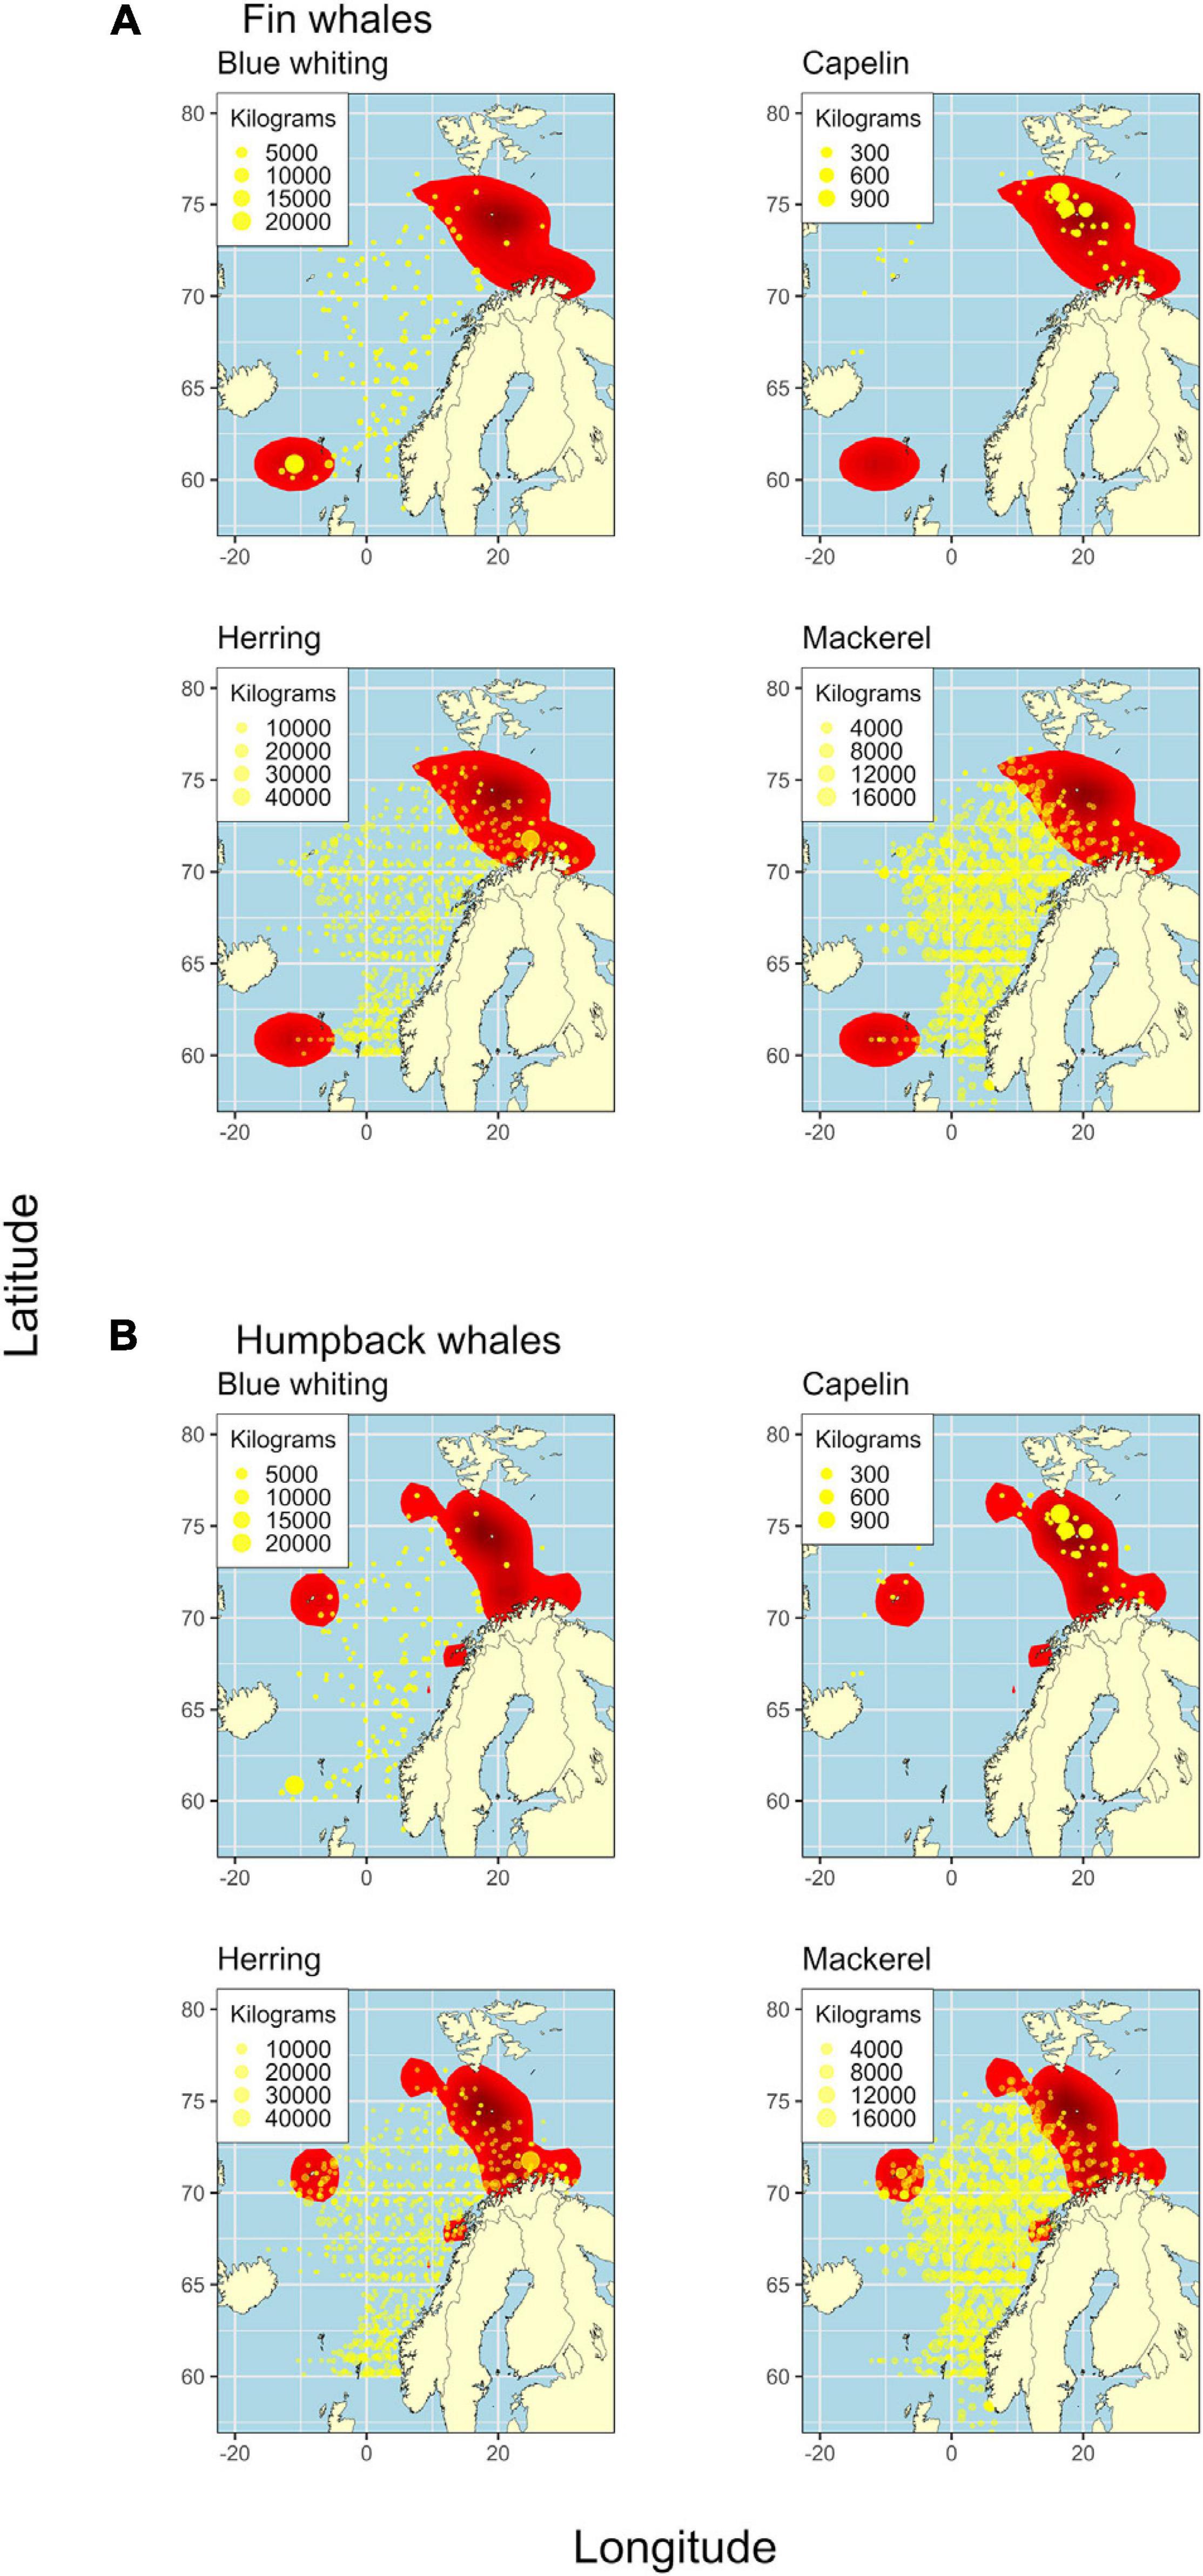
Figure 4. Fin (A panels) and humpback (B panels) whale kernel areas (red) and catch of potential prey fish at each sampling station (yellow points). Each cluster of four panels (A,B) shows the catch of blue whiting, capelin, herring, and mackerel, respectively.
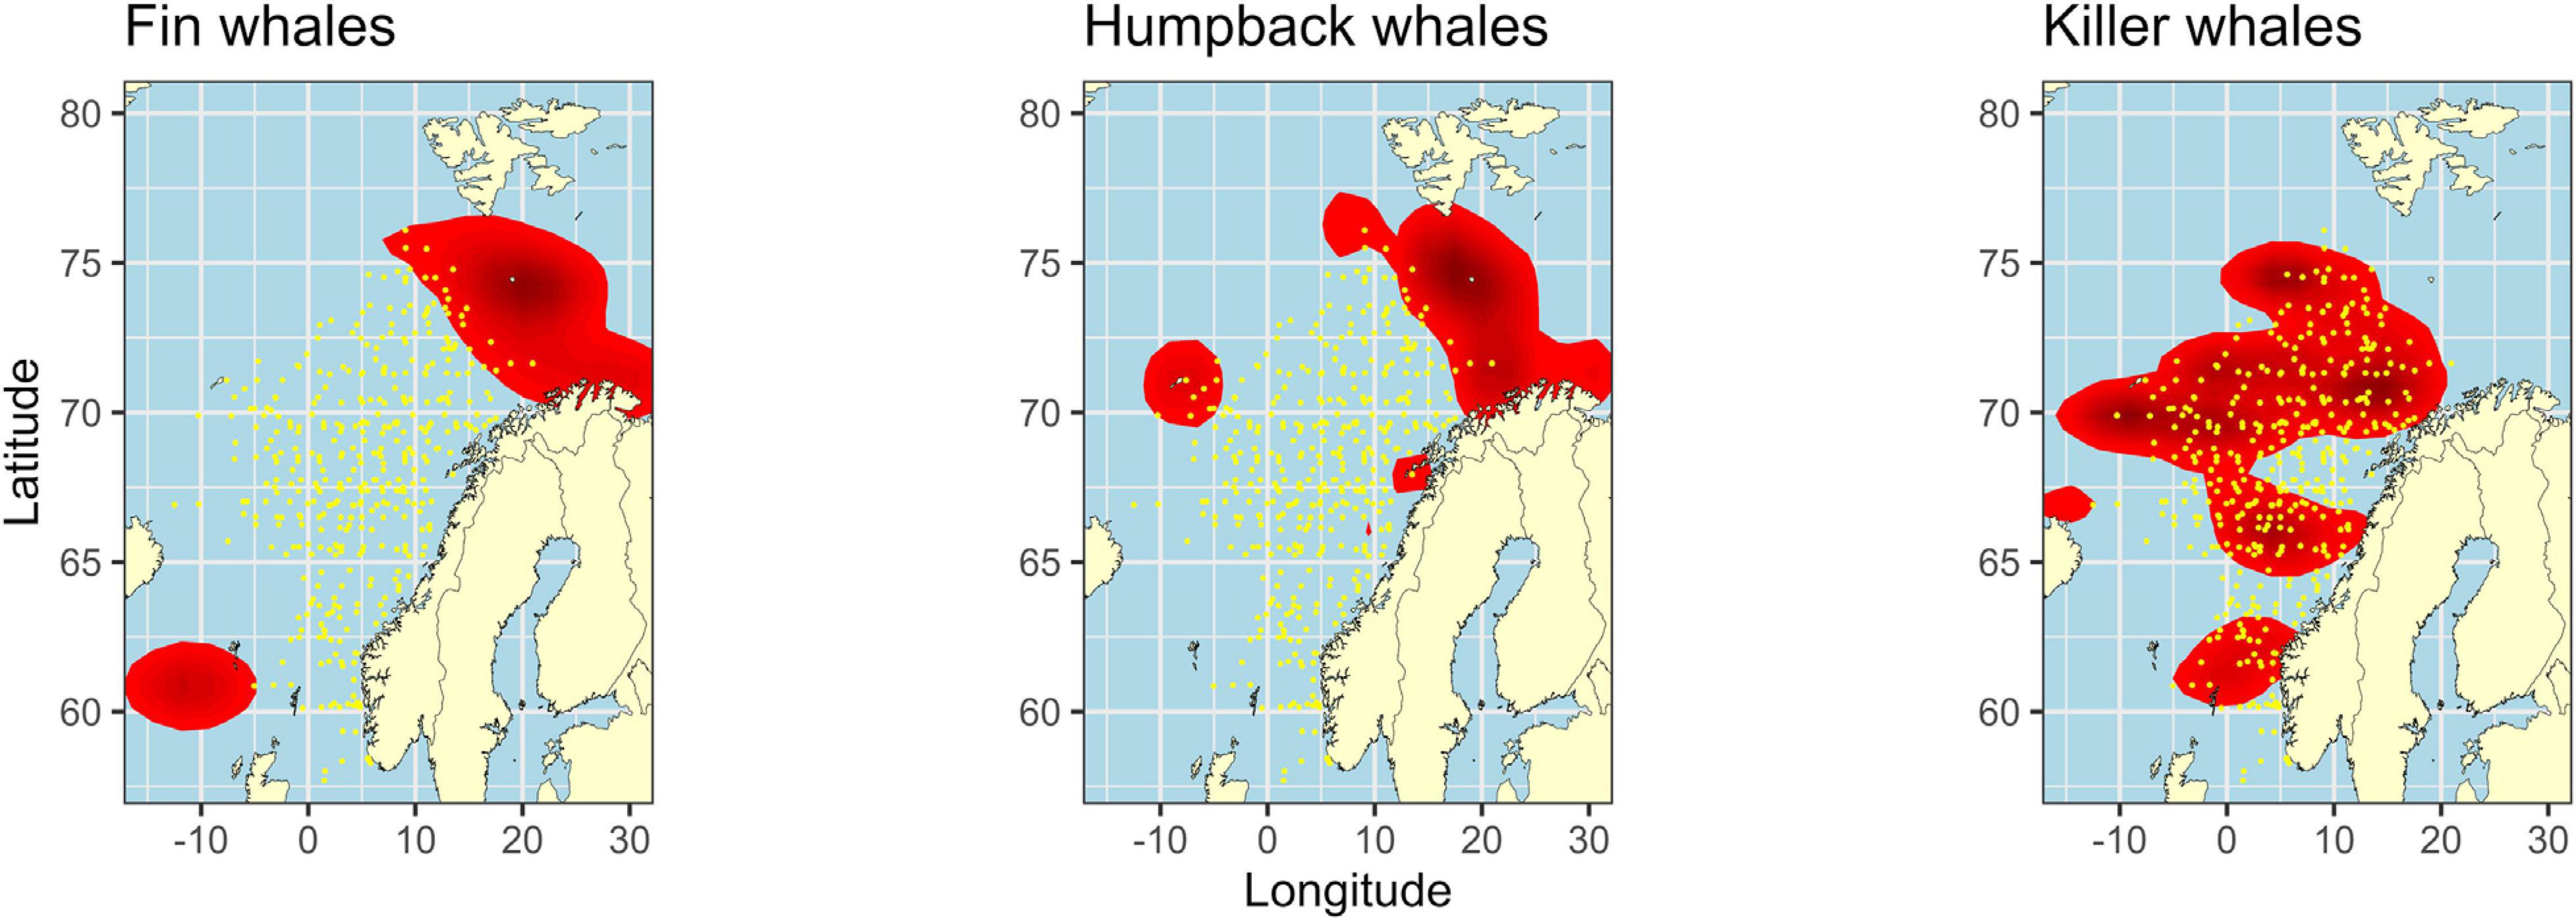
Figure 5. Overall spatial overlap between fin, humpback, or killer whale kernel areas (red) and high catches (≥median) of mackerel (yellow data points) from data collected in July and August, 2013–2018.
The hypothesis that fin and humpback whales avoid areas where mackerel normally is most abundant was supported by the significant lack of high catch samples of mackerel in the whales’ kernel areas than what was hypothesized under H0 (Figure 5, binomial tests; p < 0.001 for both species). Of the total number of high catch samples, only 4.66% and 5.54% were found within the kernel areas of fin and humpback whales, respectively. For killer whales, however, high catch samples of mackerel occurred significantly more often within the kernel areas than what was hypothesized under H0 (Figure 5, binomial tests; p < 0.001). Of the total number of high catch samples, 76.72% were found within the kernel areas of killer whales.
The tests of spatial overlap between killer and fin whales and between killer and humpback whales showed that significantly fewer sightings of killer whales were made within the kernel areas of the two baleen whale species than what was hypothesized under H0 (Figure 6, binomial tests; p < 0.001 for both species). Of the total number of killer whale sightings, 5.54% were made within the kernel areas of the two baleen whale species.
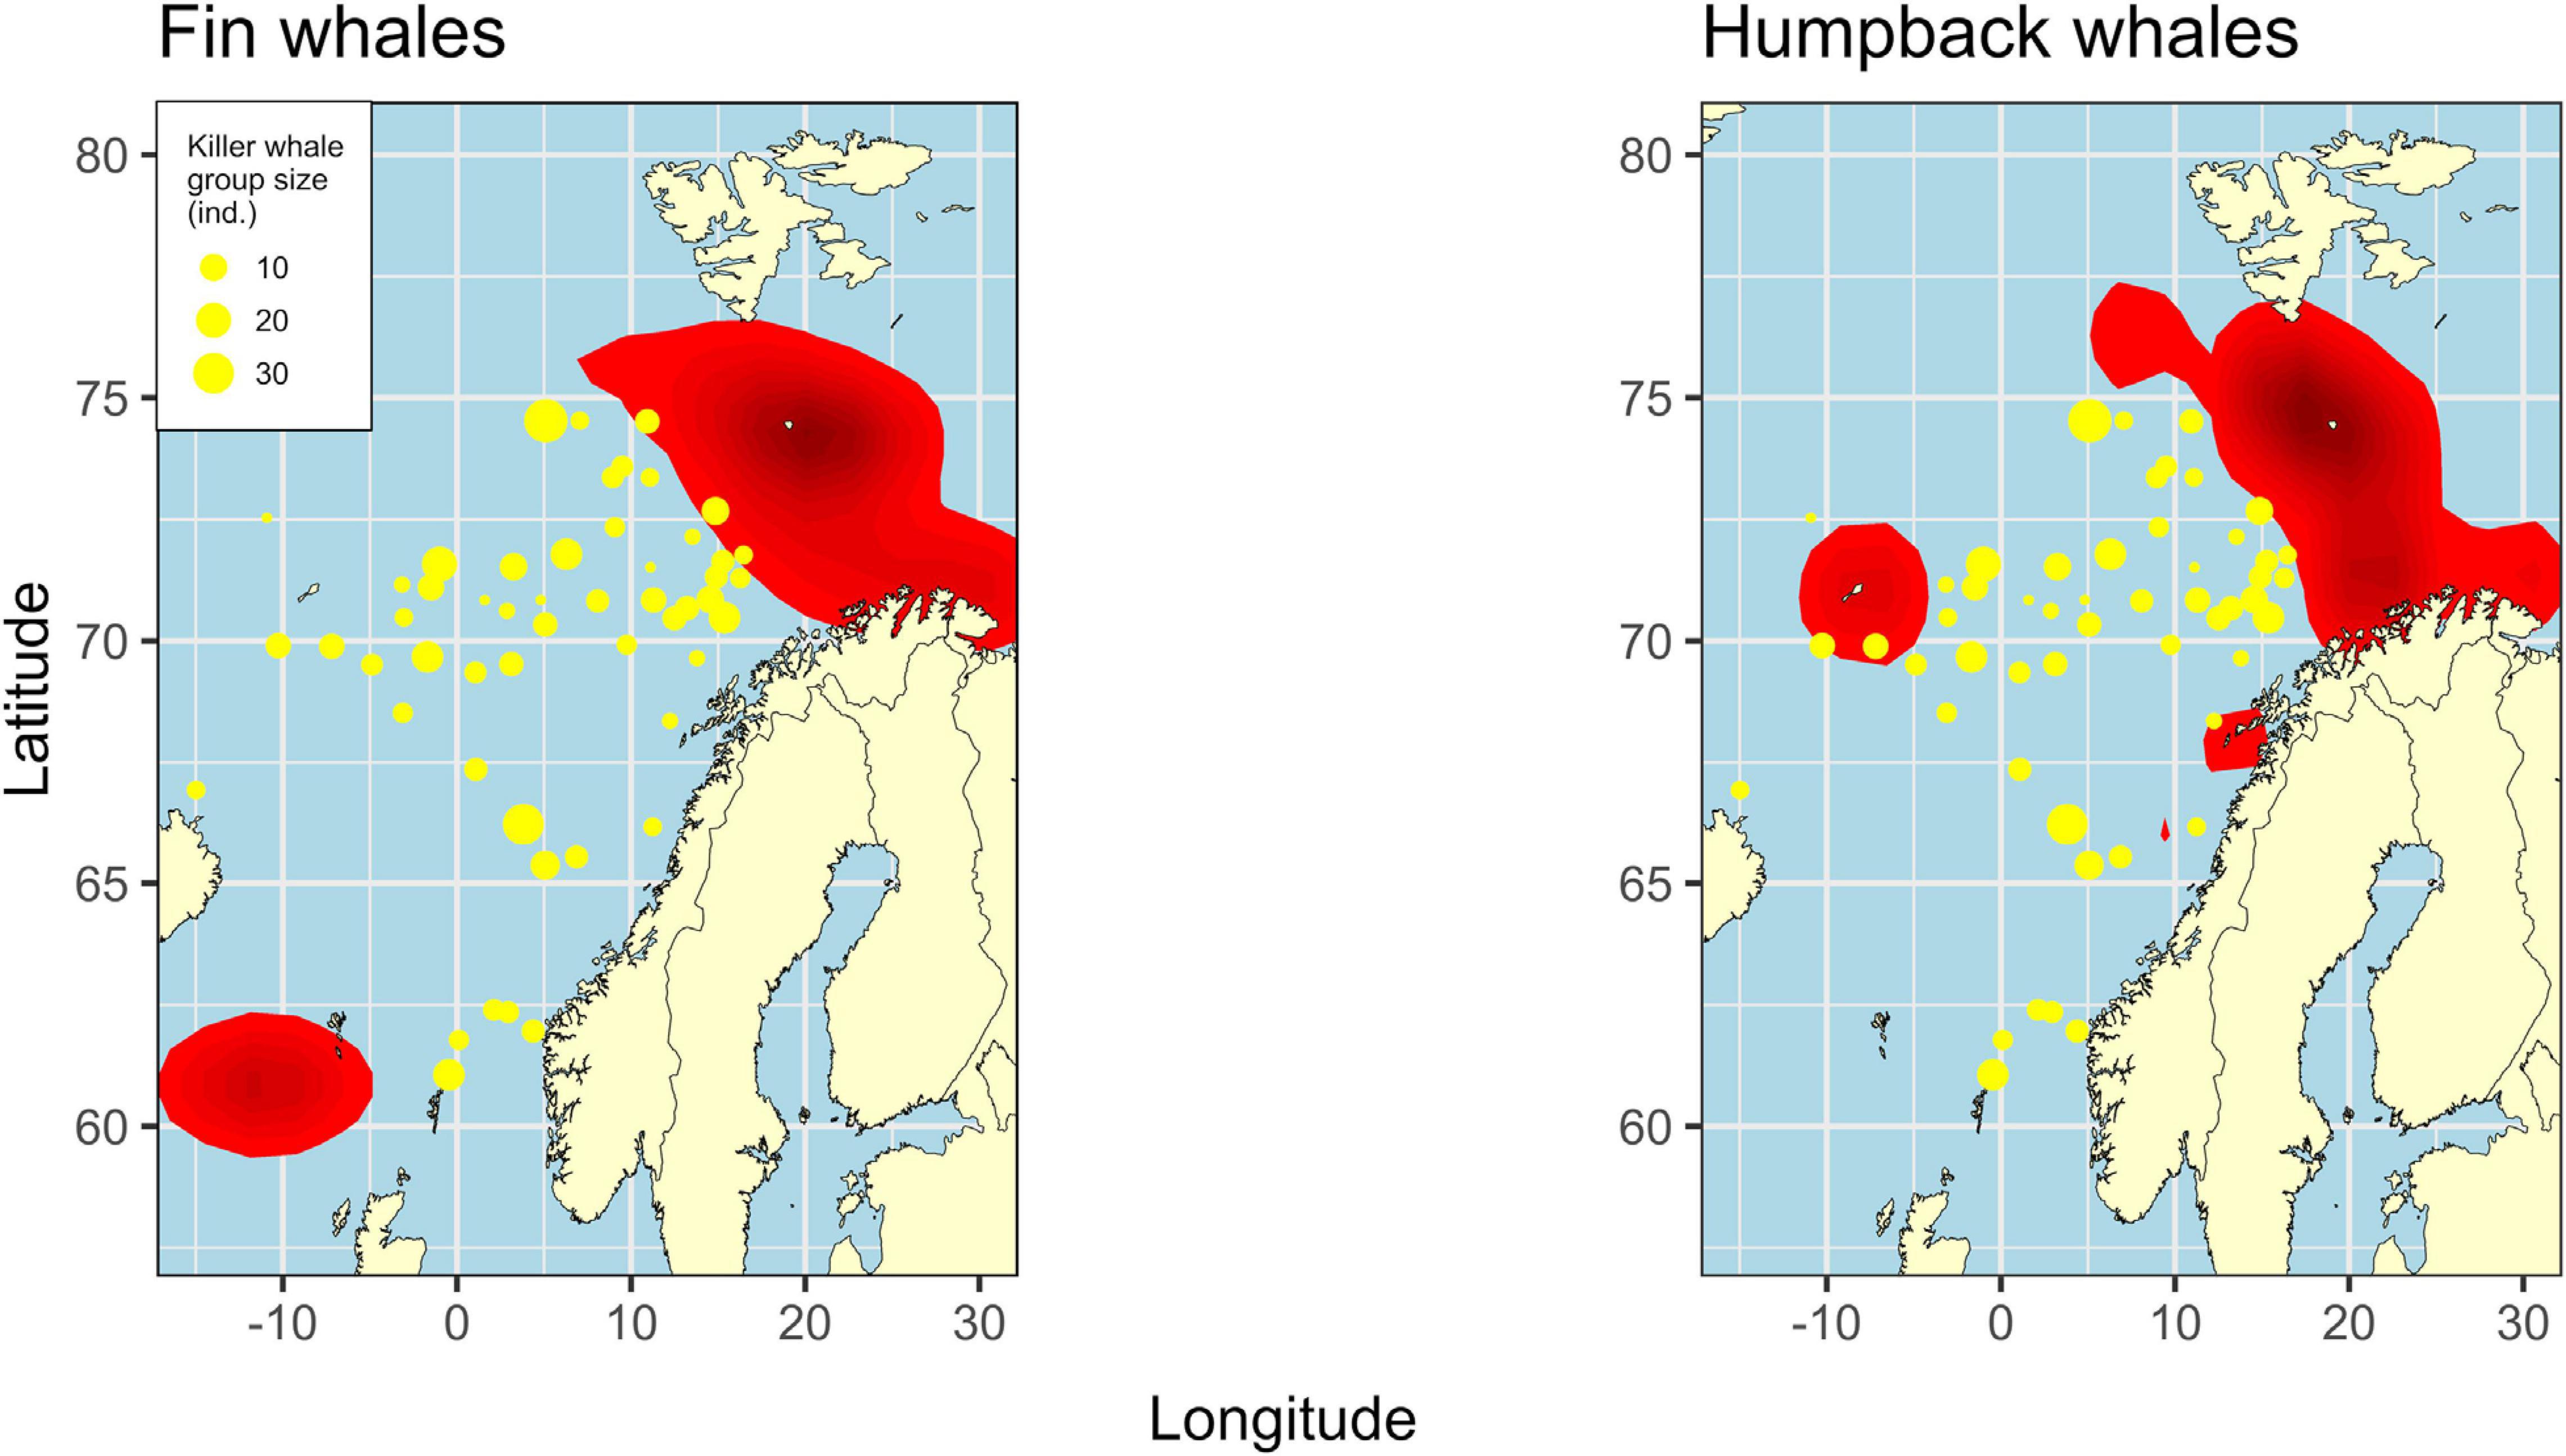
Figure 6. Fin or humpback whale kernel areas (red) and sightings of killer whales (yellow points) from data collected in July and August, 2013–2018.
Discussion
This large-scale multi-species field study conducted in the Norwegian Sea during the summers of 2013 through 2018 documents an interesting northern displacement trend of fin and humpback whales compared to previous relevant available ecological studies within this productive marine ecosystem (Nøttestad and Olsen, 2004; Skjoldal et al., 2004). A predictable distributional pattern of fin and humpback whales within the Norwegian Sea ecosystem as well as within the southwestern part of the Barents Sea was described for the late 1980s until 2006–2007 based on previous sighting and ecological studies (Christensen et al., 1992; Øien, 2009; Skern-Mauritzen et al., 2011; Nøttestad et al., 2014c). However, a distributional shift for these species occurred during 2009–2012 (Nøttestad et al., 2015b).
In our survey, the highest number of sightings of fin and humpback whales occurred north of 70°N and along shelf areas. Their distribution was linked to the available prey (several pelagic fish and macro-zooplankton species) in this highly productive area. Humpback whales were more abundant than fin whales in the area around Jan Mayen. The shelf area around Jan Mayen has traditionally been considered a highly productive area, with cold Arctic water providing high densities of herring, capelin, krill, amphipods, and other zooplankton species (Blindheim, 2004; Melle et al., 2004; Skjoldal, 2004). Earlier studies of fin and humpback whales describe these areas as important feeding grounds during the summer season (Christensen et al., 1992; Nøttestad and Olsen, 2004; Nøttestad et al., 2014c, 2015b). Fin whales depend on dense aggregations of prey due to their energetically costly method of lunge feeding; this also applies to humpback whales, although they use more diverse in feeding tactics (Piatt and Methven, 1992; Croll et al., 2001; Acevedo-Gutiérrez et al., 2002; Croll et al., 2005; Goldbogen et al., 2012, 2013).
Capelin appears to be an important and preferred prey species for humpback whales despite its decreasing abundance. Capelin stocks were relatively stable from the mid-2000s until 2013, when a decline began, and by 2016 the stock had collapsed (Hjermann et al., 2004; Huse et al., 2012; ICES (International Council for the Exploration of the Sea), 2017a,b). In our study, humpback whale distribution was positively correlated with capelin distribution, and humpbacks were more often found in large aggregations and annually in areas with high capelin catches. A large group of up to 100 fin whales was observed to be feeding on capelin, and a few other observations also noted feeding on capelin. The catches of capelin and the fin whale hotspot overlapped, indicating that they occurred in the same area. These findings indicate that capelin is an important prey species for both fin and humpback whales, which is supported by results of earlier studies (Piatt et al., 1989; Piatt and Methven, 1992; Aguilar, 2009; Clapham, 2002). Several cetacean species were observed in the Norwegian Sea, and many observations were near fin and humpback whales.
We also found significant negative spatial correlations between both fin and humpback whales and mackerel. These large baleen whales predominantly avoided overlap with the widely expanding mackerel population. Mackerel have been present in high abundance throughout the entire Norwegian Sea from around 2010 and onward (Nøttestad et al., 2016a; ICES (International Council for the Exploration of the Sea), 2019). One potential reason for the observed negative correlation is that although mackerel have the highest fat content among the available prey species, they also are faster swimmers and have advanced and highly dynamic anti-predator maneuvers (Iversen, 2004; Nøttestad et al., 2004, 2014b), which make them difficult for fin and humpback whales to catch during attacks. The active anti-predator maneuvers also inevitably increase energy costs for feeding fin and humpback whales (Acevedo-Gutiérrez et al., 2002; Nøttestad et al., 2004, 2014c, 2015b). Another potential explanation for the negative correlation is that important prey species, such as herring, capelin, and copepod feeding krill, may have been outcompeted for preferred food or displaced by hunting schools of hungry mackerel. Another plausible explanation is that killer whales exploiting mackerel as prey (Nøttestad et al., 2014b) pose a predation threat, especially to humpback whales and their calves (Ford and Reeves, 2008; Aguilar, 2009). This threat likely would cause fin and humpback whales to avoid the areas where killer whales forage on mackerel (Ford and Reeves, 2008). Observations of pods of killer whales overlapping significantly in space and time with mackerel in the Norwegian Sea during the summers from 2013 to 2018 confirms the patterns described previously by Nøttestad et al. (2014b). Furthermore, since we found a positive association between killer whales and mackerel, but not between mackerel and fin- and humpback whales, mackerel may simply not be a preferred prey species by fin- and humpback whales in the Norwegian Sea during summer.
Macro-zooplankton play a significant role as prey for large baleen whales, and we found that the distributions of humpback whales and krill were positively correlated. Krill is also associated with the shelf area in the southwestern part of the Barents Sea (Dalpadado and Skjoldal, 1991; Buchholz et al., 2010), and krill has also been shown to be an important prey species for both fin- and humpback whales in this region (Leonard and Øien, 2013 and Skern-Mauritzen et al., 2011). However, a shortcoming of this study was the lack of representative catches of macro-zooplankton, and the observed correlations likely should be higher. Macro-zooplankton included in this study, such as krill and amphipods, were sampled using vertical hauls with WPII nets from 0 to 200 m depth or by using a pelagic trawl. The WPII nets with small mesh size, a small mouth, and low hauling speed were designed to capture meso-zooplankton (Melle et al., 2004), and macro-zooplankton, such as krill, may escape or avoid the net. Additionally, the trawl used in this study was designed to catch pelagic fish. Unlike many pelagic fish species, krill are rarely herded by the side panels of the trawl when entering the mouth. Thus, using a trawl with coarse meshes in the panels near the mouth and decreasing mesh panels toward the codend provides the chance for a large proportion of krill to escape the trawl gear.
Herring is considered to be one of the most important prey species for fin and humpback whales, and a recent study of humpback whales in the Norwegian Sea positively correlated its distribution with that of herring in the northern Norwegian Sea (Aguilar, 2009; Nøttestad et al., 2002, 2015b; Nøttestad and Olsen, 2004). However, the recruitment of herring has been low since 2004, which is assumed to be partly due to the decrease and northern shift of zooplankton biomass (Melle et al., 2004; Sissener and Bjørndal, 2005; Toresen et al., 2019). Additionally, since 2009, Norwegian spring-spawning herring has been in decline (ICES (International Council for the Exploration of the Sea), 2017a). Herring catches in our study varied among the 6 years, with 2014 recording the highest catches and 2017–2018 having the lowest catches. Neither fin nor humpback whale distributions were correlated with catches of herring. In a study of the hunting tactics of fin whales on herring, Nøttestad et al. (2002) found that all interactions with herring took place at night when the schools were shallower than 200 m, which most likely is related to the energy limitations of the feeding tactics of fin whales. Herring catches in our study were not correlated with bottom depth, but the catch was spread throughout the Norwegian Sea and likely covered too great and diverse an area for the analysis to have detected a correlation. A connection between the shallow shelf area off the northern coast of Norway and the easier availability of herring for at least fin whales is plausible.
Blue whiting has also increased in abundance and distribution after around 2011 in the Norwegian Sea, but catches of this species were not correlated with distribution of either fin or humpback whales (Heino et al., 2008; Dolgov et al., 2010; Payne et al., 2012; Utne et al., 2012). However, blue whiting are not preferred prey of these whale species. Blue whiting is most often found at 100–600 m and can move up to shallower waters during its daily vertical migration (Monstad, 2004; Heino et al., 2008). A large aggregation of up to 50 fin whales was observed feeding on blue whiting in 2016 outside the Faroe Islands. This location was also where a very large catch of small juvenile blue whiting was collected at the same time. This finding suggests that fin whales are opportunistic in prey choice but are dependent on a foraging density threshold of their prey due to their energetically expensive feeding tactics.
Conclusion
The results of this large-scale ecosystem study suggest a northerly shift from the mid-1990s to the period 2013–2018 and pronounced hotspot feeding of fin and humpback whales off the northern coast of Norway, around Bear Island, and toward the southwestern part of Svalbard. At the same time, there has been historical spatial expansion of mackerel during summer into the northern part of the Norwegian Sea. Killer whales are a dominant predator on mackerel and may outcompete the baleen whales for this prey source, and direct interactions with these toothed whales may negatively affect fin and humpback whales. The large-scale pronounced changes in fin and humpback whale distributions confirm a high degree of plasticity for these large baleen whale species. Their response appears to be closely linked to relatively abrupt changes to the distribution, density, and behavior of available prey species. Furthermore, both fin and humpback whales seem to have shifted their distributions northwards to higher latitudes in the Norwegian Sea, probably to reduce prey competition with abundant and widely distributed pelagic schooling fish such as mackerel and/or reduce predation pressure from pods of hunting killer whales.
Data Availability Statement
The raw data supporting the conclusions of this article will be made available by the authors, without undue reservation.
Author Contributions
SL: wrote article as master project, contributed to the analysis and writing, and data collection and quality assurance. KJ: contributed to the statistical analysis and graphical production. BK: contributed to writing and supervising of SL. VA: contributed to data collection and producing annual marine mammal overview. LN: contributed to data collection, writing, and main supervisor to SL. All authors contributed to the article and approved the submitted version.
Funding
This study was part of a master program under Project 14922, which was supported by the Institute of Marine Research (IMR) and University of Bergen (UiB) in Norway. In addition, student travel grants were awarded to SL by UiB.
Conflict of Interest
The authors declare that the research was conducted in the absence of any commercial or financial relationships that could be construed as a potential conflict of interest.
Acknowledgments
We would like to thank the skippers and crew on board the chartered commercial state-of-the-art fishing vessels M/V “Libas,” M/V “Eros,” M/V “Brennholm,” M/V “Vendla,” M/V “M. Ytterstad,” and M/V “Kings Bay” for excellent collaboration and practical assistance during the International Ecosystem Summer Survey in the Nordic Seas (IESSNS) from 2013 to 2018 in the Norwegian Sea. We extend our gratitude to Nils Øien (IMR) for constructive criticism and to the reviewers for their suggestions for improving the manuscript.
Footnotes
References
Acevedo-Gutiérrez, A., Croll, D. A., and Tershy, B. R. (2002). High feeding costs limit dive time in the largest whales. J. Exp. Biol. 205, 1747–1753.
Aguilar, A. (2009). “Fin whale Balaenoptera physalus,” in Encyclopedia of Marine Mammals, 2nd edn, eds., W.F. Perrin, B. Würsig, and J. G. M. Thewissen (San Diego, CA: Academic Press), 1316.
Becker, R. A., and Wilks, A. R. (1993). “Maps in S” AT&T Bell Laboratories Statistics Research Report [93.2]. Denmark: ICES CM.
Berge, J., Heggland, K., Lønne, O. J., Cottier, F., Hop, H., Gabrielsen, G. W., et al. (2015). First records of Atlantic mackerel (Scomber scombrus) from the Svalbard archipelago, Norway, with possible explanations for the extension of its distribution. Arctic 68, 54–61. doi: 10.14430/arctic4455
Blindheim, J. (2004). “Oceanography and climate,” in The Norwegian Sea Ecosystem, 1st Edn, ed. H. R. Skjoldal (Trondheim: Tapir Academic Press), 65–96.
Buchholz, F., Buchholz, C., and Weslawski, J. M. (2010). Ten years after: krill as indicator of changes in the macro-zooplankton communities of two Arctic fjords. Polar Biol. 33, 101–113. doi: 10.1007/s00300-009-0688-0
Christensen, I., Haug, T., and Øien, N. (1992). Seasonal distribution, exploitation and present abundance of stocks of large baleen whales (Mysticeti) and sperm whales (Physeter macrocephalus) in Norwegian and adjacent waters. ICES J. Mar. Sci. 49, 341–355. doi: 10.1093/icesjms/49.3.341
Clapham, P. J. (2000). “The humpback whale: seasonal feeding and breeding in a baleen whale,” in Cetacean Societies, eds J. Mann, P. L. Tyack, R. Connor, and H. Whitehead (Chicago: University of Chicago Press), 173–196.
Clapham, P. J. (2002). “Humpback whale (Megaptera novaeangliae),” in Encyclopedia of Marine Mammals, 2nd Edn, eds W. F. Perrin, B. Wursig, and J. G. M. Thewiessen (New York, NY: Academic Press), 589–592.
Clapham, P. J. (2009). “Humpback whale Magaptera novaeangliae,” in Encyclopedia of Marine Mammals, 2nd Edn, eds W. F. Perrin, B. Wursig, and J. G. M. Thewiessen (San Diego, CA: Thewiessen Academic Press), 582–585. doi: 10.1016/B978-0-12-373553-9.00135-8
Clapham, P. J., Baraff, L. S., Carlson, C. A., Christian, M. A., Mattila, D. K., Mayo, C. A., et al. (1993). Seasonal occurrence and annual return of humpback whales, Megaptera novaeangliae, in the southern Gulf of Maine. Can. J. Zool. 71, 440–443. doi: 10.1139/z93-063
Croll, D. A., Acevedo-Gutiérrez, A., Tershy, B. R., and Urbán-Ramírez, J. (2001). The diving behavior of large whales: is dive duration shorter than predicted? Comp. Biochem. Physiol. A Mol. Integr. Physiol. 129, 797–809. doi: 10.1016/S1095-6433(01)00348-8
Croll, D. A., Marinovic, B., Benson, S., Chavez, F. P., Black, N., Ternullo, R., et al. (2005). From wind to whales: trophic links in a coastal upwelling system. Mar. Ecol. Prog. Ser. 289, 117–139. doi: 10.3354/meps289117
Dalpadado, P., and Skjoldal, H. R. (1991). Distribution and life history of krill from the Barents Sea. Polar Res. 10, 443–460. doi: 10.3402/polar.v10i2.6758
Dawbin, W. H. (1966). “The seasonal migratory cycle of humpback whales,” in Whales, Dolphins and Porpoises, ed. K. S., Norris, (Berkeley, CA: University of California Press), 145–170.
Dolgov, A. V., Johannesen, E., Heino, M., and Olsen, E. (2010). Trophic ecology of blue whiting in the Barents Sea. ICES J. Mar. Sci. 67, 483–493. doi: 10.1093/icesjms/fsp254
Ford, J. K. B., and Reeves, R. R. (2008). Fight or flight: antipredator strategies of baleen whales. Mammal Rev. 38, 50–86. doi: 10.1111/j.1365-2907.2008.00118.x
Frantzen, S., Grøsvik, B. E., Frie, A. E., Johansson, J., Skagseth, Ø, Kutti, T., et al. (2019). Status for Miljøet i Norskehavet. Overvåkingsgruppens Rapporter, Fisken og havet (2019–2). Bergen: Institute of Marine Research.
Garrigue, C., Clapham, P. J., Geyer, Y., Kennedy, A. S., and Zerbini, A. N. (2015). Satellite tracking reveals novel migratory patterns and the importance of seamounts for endangered South Pacific humpback whales. Royal Soc. Open Sci. 2:150489.
Goldbogen, J. A., Calambokidis, J., Croll, D. A., Mckenna, M. F., Oleson, E., Potvin, J., et al. (2012). Scaling of lunge-feeding performance in rorqual whales: mass-specific energy expenditure increases with body size and progressively limits diving capacity. Funct. Ecol. 26, 216–226. doi: 10.1111/j.1365-2435.2011.01905.x
Goldbogen, J. A., Friedlaender, A. S., Calambokidis, J., McKenna, M. F., Simon, M., and Nowacek, D. P. (2013). Integrative approaches to the study of baleen whale diving behavior, feeding performance, and foraging ecology. Bioscience 63, 90–100. doi: 10.1525/bio.2013.63.2.5
Heino, M., Engelhard, G. H., and Godø, O. R. (2008). Migrations and hydrography determine the abundance fluctuations of blue whiting (Micromesistius poutassou) in the Barents Sea. Fish. Oceanogr. 17, 153–163. doi: 10.1111/j.1365-2419.2008.00472.x
Hjermann, D., Stenseth, N. C., and Ottersen, G. (2004). Indirect climatic forcing of the Barents Sea capelin: a cohort effect. Mar. Ecol. Prog. Ser. 273, 229–238. doi: 10.3354/meps273229
Horton, T. W., Holdaway, R. N., Zerbini, A. N., Hauser, N., Garrigue, C., Andriolo, A., et al. (2011). Straight as an arrow: humpback whales swim constant course tracks during long-distance migration. Biol. Lett. 7, 674–679. doi: 10.1098/rsbl.2011.0279
Huse, G., Holst, J. C., Utne, K., Nøttestad, L., Melle, W., Slotte, A., et al. (2012). Effects of interactions between fish populations on ecosystem dynamics in the Norwegian Sea – results of the INFERNO project. Mar. Biol. Res. 8, 415–419. doi: 10.1080/17451000.2011.653372
ICES (International Council for the Exploration of the Sea) (2013). Working Document to Cruise Report of Working Group on Widely Distributed Stocks (WGWIDE) from the International Ecosystem Summer Survey in the Nordic Seas (IESSNS). Copenhagen: ICES.
ICES (International Council for the Exploration of the Sea) (2014). Working Document to Cruise report of Working Group on Widely Distributed Stocks (WGWIDE) from the International Ecosystem Summer Survey in the Nordic Seas (IESSNS). Copenhagen: ICES.
ICES (International Council for the Exploration of the Sea) (2019). Working Document to Cruise report of Working Group on Widely Distributed Stocks (WGWIDE) from the International Ecosystem Summer Survey in the Nordic Seas (IESSNS). Copenhagen: ICES.
ICES (International Council for the Exploration of the Sea) (2016a). ICES Report on Ocean Climate 2016. Prepared by the Working Group on Oceanic Hydrography Report No.339, 110. Copenhagen: ICES Cooperative Research.
ICES (International Council for the Exploration of the Sea) (2016b). Working Document to Cruise report of Working Group on Widely Distributed Stocks (WGWIDE) from the International Ecosystem Summer Survey in the Nordic Seas (IESSNS). Copenhagen: ICES.
ICES (International Council for the Exploration of the Sea) (2017a). Norwegian Sea ecoregion – Ecosystem overview. ICES Ecosystem Overviews. Copenhagen: ICES, 1–15.
ICES (International Council for the Exploration of the Sea) (2017b). Working Document to Cruise report of Working Group on Widely Distributed Stocks (WGWIDE) from the International Ecosystem Summer Survey in the Nordic Seas (IESSNS). Copenhagen: ICES.
ICES (International Council for the Exploration of the Sea) (2018a). Norwegian Sea ecoregion – Ecosystem overview. ICES Ecosystem Overviews. Copenhagen: ICES, 1–17.
ICES (International Council for the Exploration of the Sea) (2018b). Working Document to Cruise report of Working Group on Widely Distributed Stocks (WGWIDE) from the International Ecosystem Summer Survey in the Nordic Seas (IESSNS). Copenhagen: ICES.
Iversen, S. A. (2004). “Mackerel and horse mackerel,” in The Norwegian Sea ecosystem, 1st Edn, ed. H. R. Skjoldal (Trondheim: Tapir Academic Press), 289–300.
Katona, S. K., and Beard, J. A. (1990). Population Size, Migrations and Feeding Aggregations ofr the Humpback Whale (Megaptera novaeangliae) in the Western North Atlantic Ocean. Report of the International Whaling Commision (Special Issue 12) Cambridge: International Whaling Commision, 295–306.
Kawamura, A. (1980). A review of the food of balaenopterid whales. Sci. Rep. Whales Res. Inst. 32, 155–197.
Laidre, K. L., Heide-Jørgensen, M. P., Heagerty, P., Cossio, A., Bergström, B., and Simon, M. (2010). Spatial associations between large baleen whales and their prey in West Greenland. Mar. Ecol. Prog. Ser. 402, 269–284. doi: 10.3354/meps08423
Laidre, K. L., Stirling, I., Lowry, L. F., Wiig, Ø, Heide-Jørgensen, M. P., and Ferguson, S. H. (2008). Quantifying the sensitivity of arctic marine mammals to climate-induced habitat change. Ecol. Appl. 18, S97–S125. doi: 10.1890/06-0546
Learmonth, J. A., Macleod, C. D., Santos, M. B., Pierce, G. J., Crick, H. Q. P., and Robinson, R. A. (2006). Potential effects of climate change on marine mammals. Oceanogr. Mar. Biol. 44, 431–464.
Leonard, D., and Øien, N. (2013). Estimated Abundances of Cetacean Species in the Northeast Atlantic from Two Multiyear Surveys Conducted by Norwegian Vessels Between 2002–2013. Tromsø: NAMMCO Scientific Publications, 11. doi: 10.7557/7553.4695
Loeng, H., and Drinkwater, K. (2007). An overview of the ecosystems of the Barents and Norwegian Seas and their response to climate variability. Deep-Sea Res. Part II Top. Stud. Oceanogr. 54, 2478–2500. doi: 10.1016/j.dsr2.2007.08.013
Mackintosh, N. A. (1966). “The distribution of Southern blue and fin whales,” in Whales, Dolphins, and Porpoises, 1st Edn, ed. K. S. Norris (Berkeley, CA: University of California Press), 125–142.
MacLeod, C. D., Bannon, S. M., Pierce, G. J., Schweder, C., Learmonth, J. A., Herman, J. S., et al. (2005). Climate change and the cetacean community of North-West Scotland. Biol. Conserv. 124, 477–483. doi: 10.1016/j.biocon.2005.02.004
Melle, W., Ellertsem, B., and Skjoldal, H. R. (2004). “Zooplankton: the link to higher trophical levels,” in The Norwegian Sea Ecosystem, 1st Edn, ed. H. R. Skjoldal (Trondheim: Tapir Academic Press), 137–202.
Monstad, T. (2004). “Blue whiting,” in The Norwegian Sea ecosystem, 1st Edn, ed. H. R. Skjoldal (Trondheim: Tapir Academic Press), 263–288.
Moore, S. E., Haug, T., Vikingsson, G. A., and Stenson, G. B. (2019). Baleen whale ecology in arctic and subarctic seas in an era of rapid habitat alteration. Prog. Oceanogr. 176:102118. doi: 10.1016/j.pocean.2019.05.010
NAMMCO (2018). Report of the Workshop “Cetacean Abundance and Distribution in the North Atlantic”. 28 and 29 October 2017. Halifax, NS: NAMMCO.
Nøttestad, L., Anthonypillai, V., Oskarsson, G., Jónsson, S. P., Homrum, E. Í., Jansen, T., et al. (2015a). Cruise report from the International Ecosystem Summer Survey in the Nordic Seas (IESSNS) with M/V “Brennholm”, M/V “Eros”, M/V “Christian í Grótinum” and R/V “Árni Friðriksson”, 1 July–10 August 2015. ICES Working Group on Widely Distributed Stocks (WGWIDE). Spain: AZTI-Tecnalia.
Nøttestad, L., Anthonypillai, V., Tangen, Ø, Høines, Å, Utne, K. R., Oskarsson, G., et al. (2016a). Cruise Report from the International Ecosystem Summer Survey in Nordic Seas (IESSNS) with M/V “M. Ytterstad”, M/V “Vendla”, M/V “Tróndur í Gøtu“, M/V “Finnur Fríði” and R/V “Arni Fridriksson” 1–31 July 2016. Working Document to Working Group of Widely Distributed Stocks. Denmark: ICES.
Nøttestad, L., Anthonypillai, V., Tangen, Ø, Høines, Å, Utne, K. R., Oskarsson, G., et al. (2017). Cruise report from the International Ecosystem Summer Survey in the Nordic Seas (IESSNS) with M/V “Kings Bay”, M/V “Vendla”, M/V “Tróndur í Gøtu”, M/V “Finnur Fríði” and R/V “Árni Friðriksson”, 3rd of July–4th of August 2017. Denmark: ICES Working Group on Widely Distributed Stocks.
Nøttestad, L., Fernö, A., Misund, O. A., and Vabø, R. (2004). “Linking individual decisions, school patterns and population distribution,” in The Norwegian Sea Ecosystem, ed. H. R. Skjoldal (Trondheim: Tapir Academic Press), 227–262.
Nøttestad, L., Krafft, B. A., Anthonypillai, V., Bernasconi, M., Langård, L., Mørk, H. L., et al. (2015b). Recent changes in distribution and relative abundance of cetaceans in the Norwegian Sea and their relationship with potential prey. Front. Ecol. Evol. 2:83. doi: 10.3389/fevo.2014.00083
Nøttestad, L., and Olsen, E. (2004). “Whales and seals: top predators in the ecosystem,” in The Norwegian Sea Ecosystem, 1st Edn, Vol. 3, ed. H. R. Skjoldal (Trondheim: Tapir Academic Press), 95–434.
Nøttestad, L., Salthaug, A., Johansen, G. O., Anthonypillai, V., Tangen, Ø, Utne, K. R., et al. (2014a). Cruise Report from the Coordinated Ecosystem Survey (IESSNS) with M/V “Brennholm”, M/V “Vendla”, M/V “Finnur Fríði” and R/V “Arni Fridriksson” in the Norwegian Sea and surrounding waters, 2 July–12 August 2014. Working Document to Working Group of Widely Distributed Stocks. Denmark: ICES.
Nøttestad, L., Sivle, L. D., Fernö, A., Mackinson, S., Pitcher, T., and Misund, O. A. (2002). How whales influence herring school dynamics in a cold-front area of the Norwegian Sea. ICES J. Mar. Sci. 59, 393–400. doi: 10.1006/jmsc.2001.1172
Nøttestad, L., Sivle, L. D., Krafft, B. A., Anthonypillai, V., Bernasconi, M., Langøy, H., et al. (2014b). Prey selection of offshore killer whales Orcinus orca in the Northeast Atlantic in late summer: spatial associations with mackerel. Mar. Ecol. Prog. Ser. 499, 275–283. doi: 10.3354/meps10638
Nøttestad, L., Sivle, L. D., Krafft, B. A., Langård, L., Anthonypillai, V., Bernasconi, M., et al. (2014c). Ecological aspects of fin whale and humpback whale distribution during summer in the Norwegian Sea. Mar. Ecol. 35, 221–232. doi: 10.1111/maec.12075
Nøttestad, L., Utne, K. R., Anthonypillai, V., Tangen, Ø, Valdemarsen, J. W., Oskarsson, G., et al. (2013). Cruise Report from the Coordinated Ecosystem Survey (IESSNS) with M/V “Libas”, M/V “Eros”, M/V “Finnur Fríði” and R/V “Arni Fridriksson” in the Norwegian Sea and surrounding waters, 2 July–9 August 2013. Working Document to Working Group of Widely Distributed Stocks. Denmar.: ICES.
Nøttestad, L., Utne, K. R., Óskarsson, G. J., Jónsson, S. P., Jacobsen, J. A., Tangen, Ø, et al. (2016b). Quantifying changes in abundance, biomass and spatial distribution of Northeast Atlantic (NEA) mackerel (Scomber scombrus) in the Nordic Seas from 2007 to 2014. ICES J. Mar. Sci. 73, 359–373. doi: 10.1093/icesjms/fsv218
Øien, N. (1990). Sighting surveys in the Northeast Atlantic in July 1988: Distribution and abundance of cetaceans. Rep. Int. Whaling Commission 40, 499–511.
Øien, N. (2009). Distribution and abundance of large whales in Norwegian and adjacent waters based on ship surveys 1995-2001. NAMMCO Sci. Publicat. 7, 31–47. doi: 10.7557/3.2704
Pante, E., and Simon-Bouhet, B. (2013). marmap: a package for importing, plotting and analyzing bathymetric and topographic data in R. PLoS One. 8:e73051. doi: 10.1371/journal.pone.0073051
Payne, M. R., Egan, A., Fässler, S. M. M., Hátún, H., Holst, J. C., Jacobsen, J. A., et al. (2012). The rise and fall of the NE Atlantic blue whiting (Micromesistius poutassou). Mar. Biol. Res. 8, 475–487. doi: 10.1080/17451000.2011.639778
Piatt, J. F., and Methven, D. A. (1992). Threshold foraging behavior of baleen whales. Mar. Ecol. Prog. Ser. 84, 205–210. doi: 10.3354/meps084205
Piatt, J. F., Methven, D. a, Burger, A. E., McLagan, R. L., Mercer, V., and Creelman, E. (1989). Baleen whales and their prey in a coastal environment. Can. J. Zool. 67, 1523–1530. doi: 10.1139/z89-217
Pike, D. G., Gunnlaugsson, T., Øien, N., Desportes, G., Víkingsson, G. A., Paxton, C. G. M., et al. (2005). Distribution, abundance and trends in abundance of fin and humpback whales in the North Atlantic. Denmark: ICES CM.
Simmonds, M. P., and Eliott, W. J. (2009). Climate change and cetaceans: concerns and recent developments. J. Mar. Biol. Assoc. U.K. 89, 203–210. doi: 10.1017/S0025315408003196
Simmonds, M. P., and Isaac, S. J. (2007). The impacts of climate change on marine mammals: early signs of significant problems. Oryx 41, 19–26. doi: 10.1017/S0030605307001524
Sissener, E. H., and Bjørndal, T. (2005). Climate change and the migratory pattern for Norwegian spring-spawning herring – implications for management. Mar. Policy 29, 299–309. doi: 10.1016/j.marpol.2004.04.002
Skern-Mauritzen, M., Johannesen, E., Bjørge, A., and Øien, N. (2011). Baleen whale distributions and prey associations in the Barents Sea. Mar. Ecol. Prog. Ser. 426, 289–301. doi: 10.3354/meps09027
Skern-Mauritzen, M., Skaug, H., and Øien, N. (2009). “Line transects, environmental data and GIS: cetacean habitat and prey selection along the Barents Sea shelf edge,” in North Atlantic Sighting Surveys, Counting the Whales in the North Atlantic, Vol. 7, eds N. Øien and D. Pike (Tromsø: NAMMCO Scientific Publications), 179–200.
Skjoldal, H. R., Sætre, R., Fernö, A., Misund, O. A., and Røttingen, I. (eds) (2004). The Norwegian Sea Ecosystem. Trondheim: Tapir Academic Press.
Stern, S. J. (2002). ‘Migration and Movement Patterns’, Encyclopedia of Marine Mammals, 2nd Edn. New York, NY: Academic Press.
Toresen, R., Skjoldal, H. R., Vikebø, F., and Martinussen, M. B. (2019). Sudden change in longterm ocean climate fluctuations corresponds with ecosystem alterations and reduced recruitment in Norwegian spring-spawning herring (Clupea harengus, Clupeidae). Fish Fish. 20, 686–696. doi: 10.1111/faf.12369
Tyack, P. L. (1986). Population biology, social behavior and communication in whales and dolphins. Trends Ecol. Evolut. 1, 144–150.
Utne, K. R., Geir, H., Geir, O., Jens, H. C., Vladimir, Z., Jan, J. A., et al. (2012). Horizontal distribution and overlap of planktivorous fish stocks in the Norwegian Sea during summers 1995-2006. Mar. Biol. Res. 8, 420–441. doi: 10.1080/17451000.2011.640937
Víkingsson, G. A., Elvarsson, B. þ, Olafsdóttir, D., Sigurjónsson, J., Chosson, V., and Galan, A. (2014). Recent changes in the diet composition of common minke whales (Balaenoptera acutorostrata) in Icelandic waters. A consequence of climate change? Mar. Biol. Res. 10, 138–152. doi: 10.1080/17451000.2013.793812
Víkingsson, G. A., Pike, D. G., Desportes, G., Øien, N., Gunnlaugsson, T., and Bloch, D. (2009). Distribution and abundance of fin whales (Balaenoptera physalus) in the Northeast and Central Atlantic as inferred from the North Atlantic Sightings Surveys 1987-2001. Tromsø: NAMMCO Scientific Publications, 49. doi: 10.7557/3.2705
Víkingsson, G. A., Pike, D. G., Valdimarsson, H., Schleimer, A., Gunnlaugsson, T., Silva, T., et al. (2015). Distribution, abundance, and feeding ecology of baleen whales in Icelandic waters: have recent environmental changes had an effect? Front. Ecol. Evol. 3:6. doi: 10.3389/fevo.2015.00006
Keywords: cetacean, distribution, feeding ecology, site fidelity, plasticity, pelagic fish, spatial overlap
Citation: Løviknes S, Jensen KH, Krafft BA, Anthonypillai V and Nøttestad L (2021) Feeding Hotspots and Distribution of Fin and Humpback Whales in the Norwegian Sea From 2013 to 2018. Front. Mar. Sci. 8:632720. doi: 10.3389/fmars.2021.632720
Received: 23 November 2020; Accepted: 05 January 2021;
Published: 22 February 2021.
Edited by:
Xavier Pochon, Cawthron Institute, New ZealandReviewed by:
Simon David Berrow, Galway-Mayo Institute of Technology, IrelandTorstein Pedersen, UiT The Arctic University of Norway, Norway
Copyright © 2021 Løviknes, Jensen, Krafft, Anthonypillai and Nøttestad. This is an open-access article distributed under the terms of the Creative Commons Attribution License (CC BY). The use, distribution or reproduction in other forums is permitted, provided the original author(s) and the copyright owner(s) are credited and that the original publication in this journal is cited, in accordance with accepted academic practice. No use, distribution or reproduction is permitted which does not comply with these terms.
*Correspondence: Leif Nøttestad, bGVpZi5ub3R0ZXN0YWRAaGkubm8=; bGVpZi5ub2V0dGVzdGFkQGhpLm5v