 Evgeny Ivanov1*
 Arthur Capet1
 Emil De Borger2,3
 Steven Degraer3Eric J. M. Delhez4Karline Soetaert2
 Jan Vanaverbeke5
 Marilaure Grégoire1
- 1Modelling for Aquatic Systems, Department of Astrophysics, Geophysics and Oceanography, University of Liège, Liège, Belgium
- 2Royal Netherlands Institute of Sea Research (NIOZ), Department of Estuarine and Delta Systems, Utrecht University, Yerseke, Netherlands
- 3Marine Biology Research Group, Department of Biology, Ghent University, Ghent, Belgium
- 4Department of Aerospace and Mechanics, University of Liège, Liège, Belgium
- 5The Operational Directorate Natural Environment, Royal Belgian Institute of Natural Sciences (RBINS), Brussels, Belgium
Offshore wind farms (OWFs) are an important source of renewable energy accounting for 2.3% of the European Union's electricity demand. Yet their impact on the environment needs to be assessed. Here, we couple a hydrodynamic (including tides and waves) and sediment transport model with a description of the organic carbon and mineral particle dynamics in the water column and sediments. The model is applied to the Belgian Coastal Zone (BCZ) where OWFs currently occupy 7% of its surface area which is estimated to double in the next 5 years. The impact of OWFs on the environment is represented through the filtration of the water column and fecal pellets production by the blue mussel, the dominant fouling organism. Our model simulations show that the impact of biodeposition on the mud particle sedimentation and on sediment composition is small compared to the fluxes associated with tidal deposition and resuspension and the lateral inputs. In contrast, the total organic carbon (TOC) flux to the sediment is significantly altered inside the OWF perimeters and TOC deposition is increased up to 50% in an area 5 km around the monopiles. Further away, the TOC flux to the bottom decreases with a notable effect up to 30 km away. The major changes are found along the direction of the main residual current and tidal ellipse's major axis. In addition, sub-mesoscale gyres act as retention areas with increased carbon deposition. A future OWF in the BCZ will be located close to gravel beds in a Natura 2000 area, considered as vulnerable habitats and biodiversity hotspots. The different scenarios for this OWF, varying in turbine number and positioning, are compared in terms of impact on the carbon and mineral particle deposition flux in the BCZ and, particularly, to these gravel beds. The scenarios show that the number of turbines has only a slight impact on the TOC deposition flux, unlike their positioning that significantly alters the TOC flux to the gravel beds. The TOC deposition flux exceeds 50%, when the turbines are placed next to the gravel beds; while a limited increase is simulated, when the turbines are located the farthest possible from them.
1. Introduction
The European Union (EU) heavily invests in the development of renewable energy, and offshore wind farms (OWFs) are an important contributor. In 2019, a record amount of EU energy capacity of 3.6 GW was installed offshore (Komusanac et al., 2019). This accounts for 24% of newly installed capacity of all wind turbines, currently responsible for 15% of total energy production in the EU.
OWFs affect the surrounding sediment bed and associated benthic communities in many different ways. Each monopile foundation is protected by an artificial scour protection layer (e.g., gravels) that attracts fouling species who use it as a hard substrate. The underwater parts of turbine foundations also provide a substrate for fouling species, with the most abundant in the North Sea being the blue mussel Mytilus edulis, the amphipod Jassa herdmani and the plumose anemone Metridium senile (Krone et al., 2013; De Mesel et al., 2015). These organisms feed on the suspended particulate matter (SPM) in the water column, which they partially expel in the form of fecal pellets, further referred as FPs (Callier et al., 2006). Deposited FPs contain a large amount of carbon, and its influx into the sediment bed may disrupt the carbon balance and affect local ecosystems through changes in sedimentology and oxygen fluxes (Mirto et al., 2000; Christensen et al., 2003; Carlsson et al., 2010). Remote sensing (Vanhellemont and Ruddick, 2014) and in-situ measurements (Baeye and Fettweis, 2015) have shown SPM plumes over a kilometer in length in the wake of the turbines. Their exact origin is unknown, possibly it is a combination of biodeposited and resuspended materials with dynamically trapped SPM (Forster, 2018), due to the splitting of the current around the foundation and reconvergence downstream, (i.e., the island effect). These plumes show that the impact of OWFs is not local and may affect a much larger area than just the OWF perimeter.
Upscaling the local effect of particle filtration and biodeposition by fouling organisms beyond the concession area requires the combination of laboratory experiments, sampling campaigns, and modeling. Slavik et al. (2019) used a model to estimate that mussels living on monopile foundations could cause a depletion of 8% of the primary production (PP) in the large vicinity of the OWFs, and an increase far outside the OWF perimeter. Field observations are limited to the immediate vicinity of the turbines and show higher organic matter content, finer sediments and changing macrofaunal communities (Coates et al., 2014; Lefaible et al., 2018). However, a regional quantification of the biodeposition effects on organic and mineral particle fluxes to the bottom and resulting changes in the sediment composition is not yet available.
This paper targets the upscaling of biodeposition at the OWFs using the three-dimensional hydrodynamic model ROMS (Regional Ocean Modeling System) coupled with the wave model SWAN (Simulating WAves Nearshore), the sediment model CCSTM (Community Coastal Sediment Transport Model) and an upgraded version of the filtration model from Slavik et al. (2019), within the COAWST (Coupled Ocean-Atmosphere-Wave-Sediment Transport) framework (Warner et al., 2010). The model is applied to the Belgian Coastal Zone (BCZ), where the OWFs current concession area (CCA) occupies 238 km2, while for the next 5 years a new concession area (NCA) is planned, resulting in a doubling of the surface currently occupied by OWFs (Figure 1B). Different sets of simulations are performed (e.g., baseline, positioning scenarios) and compared in terms of the impact of OWF-induced biodeposition on the organic and mineral particle fluxes to the bottom. The simulations are analyzed with the aim of providing recommendations for a spatial design of the NCA that would reduce the changes in the TOC flux to the sediment in the Natura 2000 area and particularly on the protected gravel beds. In an accompanying paper (De Borger et al., 2020a), the consequences for sediment biogeochemistry of these scenarios are addressed.
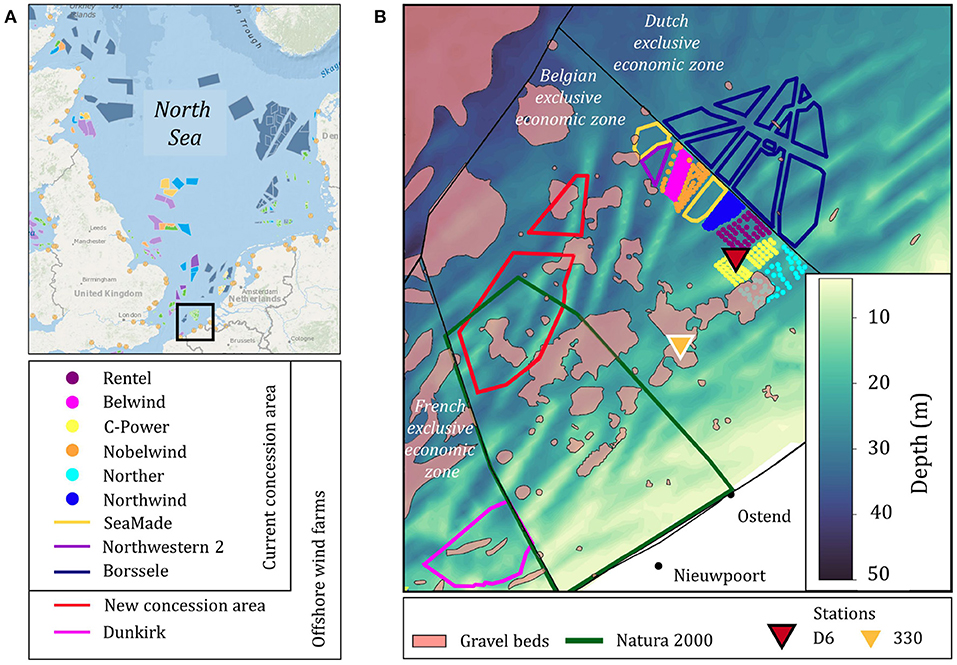
Figure 1. (A) Overview of North Sea OWFs from a website https://www.4coffshore.com/offshorewind/, accessed on 31/10/2020. Black rectangular corresponds to the right panel (BCZ). (B) The BCZ (black contour) and distribution of OWFs (see the legend on the lower-left corner; and for further details—Table 2) which were operational by April 2020 (colored dots) or were under construction or planned (colored contours). The thick green line represents the Natura 2000 protected area; the gravel beds that host hotspots of biodiversity are colored in red-brown.
2. Materials and Methods
2.1. Environmental Characteristics of the Investigated Area
The Southern Bight of the North Sea (SBNS) lies between the UK on the west and the European Union on the east and is connected with the Atlantic Ocean through the strait of Dover on the south and through the North Sea proper in the North (Figure 2A). The SBNS is divided into three major regions (Laevastu, 1963): two coastal areas are influenced by freshwater input from the continent or from Great Britain, while the middle area is dominated by the saline Atlantic water. The SBNS is influenced by periodic semi-diurnal tides, whose amplitude reaches up to 3 m. The residual water flow is directed toward the northeast, following the eastern branch of the Gulf Stream and North-Atlantic current. However, along the Belgian coast the flow can be perpendicular and even opposite due to the complex bathymetry and river inputs (Delhez and Carabin, 2001). In the winter, the main residual current is faster due to the influence of dominant SW winds (Ivanov et al., 2020), which expose the European coast to strong waves originating predominantly from the Dover strait (Neill and Hashemi, 2013). Those waves break at the shallow depths of the BCZ and play an important role in sediment resuspension (10% of the total bottom erosion in the BCZ; Fettweis and Van den Eynde, 2003). The sediment composition in the region is diverse, but sands are the dominant sediment class (Figure 2A). The strait of Dover, characterized by the strongest currents, has the highest content of coarse sediments. In the BCZ, near Zeebrugge and around the Scheldt estuary, vast Holocene mud fields can be found (Figure 2B), also in Fettweis and Van den Eynde (2003).
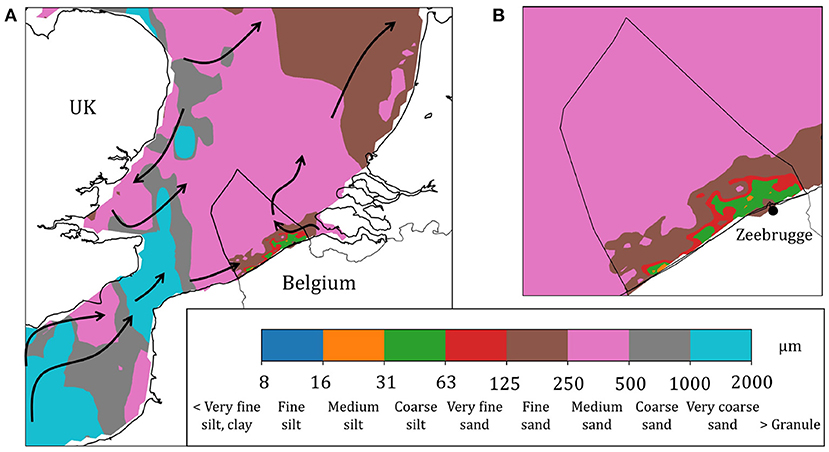
Figure 2. Distribution of median sediment grain size (composed from Verfaillie and Van Lancker (2006); Wilson et al. (2018)) over the SBNS (A) and BCZ (B) with the residual currents (black arrows) superimposed for the SBNS.
The SBNS and the BCZ have a huge potential for wind energy production (Schillings et al., 2012, see all operational and planned stations of the North Sea on Figure 1A). Despite already having several operational OWFs, Belgium is still well behind the European annual total of 15% of energy generated by wind power (data for 2019 by Komusanac et al., 2019). At the same time, Belgium is the only EU country (by 2019), where offshore wind energy generation (4645 GMW) is higher than the onshore (3474 GMW), with still a large prospect for further developments.
In the new Belgian Marine Spatial Plan 2020–20261 the Belgian government designated the NCA to build a new OWF (Figure 1B). However, the NCA overlaps with the northern part of the Vlaamse Banken2, an area that is protected under the European Natura 2000 network for the preservation of rare and endangered species and their habitats (Evans, 2012). A part of the Vlaamse Banken is characterized by the presence of gravel beds that serve as hotspots of biodiversity in the BCZ (Houziaux et al., 2008). These gravel beds cover ~580 km2 or ~17% of the BCZ and ~16% of the Natura 2000 area. Despite being called “gravel,” they are mostly gravelly sand, with sand and gravel being major components. In addition to the Belgian NCA, a French OWF is also planned near Dunkirk (Figure 1B), bordering the Belgian Natura 2000 and close to the gravel beds. The effect of this French OWF may eventually superimpose on that of the NCA.
The Belgian gravel beds and neighboring sandy habitats serve as a substrate for whelks, top snails and “dead man's fingers,” one of the northernmost corals, and form unique ecosystems with top members of the food chain including various fish, marine birds (e.g., terns) and seals (Degraer et al., 2009). They also act as breeding grounds for fish, including herring, which find shelter there. The Belgian gravel beds, however, suffer from mechanical disruption (i.e., aggregate extraction, that smother them through sedimentation of fine materials), from fishing activities (trawling) and in the future also possibly from construction works, e.g., OWF building (Lindeboom et al., 2011). These stressors endanger bottom integrity and may compromise the conservation of biodiversity associated with these gravel beds.
2.2. The Model
The hydrodynamic model ROMS, the wave model SWAN and the sediment model CCSTM are coupled within the COAWST framework (Warner et al., 2010) to simulate the organic and mineral particle dynamics governed by PP, sinking, deposition, and resuspension, as well as by the filtration and biodeposition processes associated to the OWF filtering communities. The capacity of the hydrodynamic model to represent temperature, salinity, vertical stratification, tidal and residual currents and water transport through the strait is extensively validated with in-situ and satellite observations in Ivanov et al. (2020). That paper also analyses the impact of atmospheric patterns on the simulated fields. The filtration model is based on Slavik et al. (2019), but has been modified to consider the vertical distribution of filter feeders along the monopile foundation and to include tidal dynamics, causing parts of the monopile to be only intermittently immersed (see further details in section 2.2.3 and Supplementary Material 3). Organic matter is described with two fractions, representing slow and fast degradable carbon pools.
Scenario simulations for the NCA monopile positionings are designed based on the different options that are envisaged for the new OWF. All scenarios for the NCA are similar in terms of the total amount of energy delivered, but differ as concerning the number of turbines, their distribution and installed nameplate capacity per turbine. Each scenario is mapped on the model grid, by assigning for each grid cell a number of monopiles and their diameter.
2.2.1. Coupled Modeling System COAWST
The hydrodynamics of the SBNS and eastern part of the English Channel (EC) is solved using the three-dimensional ROMS model. The model domain extends from 3°W to 6°E and from 49°N to 55°N with a horizontal resolution of 5 km. The BCZ is covered with a high resolution subdomain, with grid cells of 1 km long, two-way nested in the coarse resolution model. Over the vertical, terrain-following sigma-coordinates are used with 15 layers, with a refined resolution near the surface (several cm) and coarse resolution at the bottom (1–4 m, depending on the water depth). At the lateral open sea boundaries with the central North Sea and the EC, the products from the Copernicus Marine Environment Monitoring Service (CMEMS3) are used for temperature, salinity and velocities, and from TPXO (Egbert et al., 2010)—for the tides. The discharges from the major rivers (the Seine, the Thames, the Rhine, and the Maas) are imposed as point sources of water and heat, while the Scheldt is represented as a channel and its discharge is imposed 30 km inshore, at the city of Terneuzen. Daily-averaged river discharges and their water temperatures are taken from the data archive provided by the Swedish Meteorological and Hydrological Institute (SMHI, Lindström et al., 2010. At the air-sea interface, the model is forced with the hourly ECMWF Era-Interim product4 at a horizontal resolution of 0.125° interpolated on the model grid. Full details on the implementation of the ROMS hydrodynamics model in our domain can be found in Ivanov et al. (2020).
The sediment deposition and resuspension processes are tightly conditioned by the bottom drag due to wave action, in addition to tidal and residual currents. Therefore, the ROMS hydrodynamic model is coupled with the wave model SWAN using the Model Coupling Toolkit (MCT) implemented in COAWST (Warner et al., 2010). SWAN is forced at the open boundaries of the coarse grid by the hourly wave periods, heights and directions, acquired from the WaveWatch III product “glo_30m” (Tolman, 1989). SWAN was run on the same grid as ROMS using two way nesting. The vertical distribution of organic and mineral particles in the sediment is described by the CCSTM. The dynamics of sedimentary and water column particles is coupled through deposition and erosion processes that depend on local hydrodynamics (bottom shear stress, see section 2.2.2 and Supplementary Material 2 for details). The coupling of the ROMS, SWAN and CCSTM is described in Supplementary Material 1, while the validation of the wave model is provided in Supplementary Material 4.
2.2.2. Organic and Mineral Particle Model
Rather than representing the cycle of carbon from primary producers to detritus through heterotrophs, we short-circuited the food chain. Therefore the vertically integrated CMEMS primary production NORTHWESTSHELF_REANALYSIS_BIO_004_0115 is imposed as a surface organic carbon source for two classes of detrital carbon: the fast and slow degradable particulate organic carbon (POC), respectively POCf and POCs. Both POC compartments are subject to vertical sinking and to a loss term that lumps degradation and respiration processes (equations are described in Supplementary Material 2).
The CCSTM implemented in COAWST allows for the inclusion of an arbitrary number of cohesive and non-cohesive sediment classes. Here, the sediments are described through one class of (cohesive) mud (referred as SMUD) and two classes of (non-cohesive) sand: medium sand (median grain diameter D = 0.22 mm) and coarse sand (D = 0.7 mm), respectively referred as SSANDm and SSANDc. Three classes are necessary to account for muddy sediment texture, e.g., near the Belgian coast at Zeebrugge (Fettweis and Van den Eynde, 2003). Field campaign data (Toussaint et al., 2021) and regional sediment maps (Verfaillie and Van Lancker, 2006; Wilson et al., 2018) showed a wide range of median grain sizes for different stations over the domain, requiring multiple sediment classes for correct model parametrization. In addition, when POCf and POCs settle upon the sediment bed, they are also considered as cohesive sediment fractions and add to the fast and slowly degradable sedimentary carbon compartments (respectively SPOCf and SPOCs).
Each sediment class is represented in the model by its mass fraction that can vary in three dimensions: horizontally and vertically in the sediment bed. Sediment particles are transported vertically within the sediment bed through biodiffusion, while in the upper bed layer they are subjected to resuspension (see Supplementary Material 2 for the equations). Sediment class dynamics is governed by a set of parameters: median grain diameter, dry density, settling velocity, critical shear stresses for erosion and deposition, erodibility and porosity (see Table 1). Because mud has been extensively studied in the BCZ, most of its parameters such as the settling velocity, critical shear stresses for erosion and deposition and erodibility are available from studies of Fettweis and Van den Eynde (2003) and Mercier and Delhez (2007). However, there are relatively few studies of sand dynamics, and some of its parameter estimates may vary in an order of magnitude. Therefore sand parameters are mostly calibrated to fit the SPM observation for different tidal conditions (see section 3.1) and to keep the model at steady state (i.e., no trend of the medium and coarse sand fractions over the years of integration). For each sediment bed grid cell, the vertical profiles of total erodibility, critical erosion stress and biodiffusion are calculated as a mass fraction-weighted sum of each sediment class property.
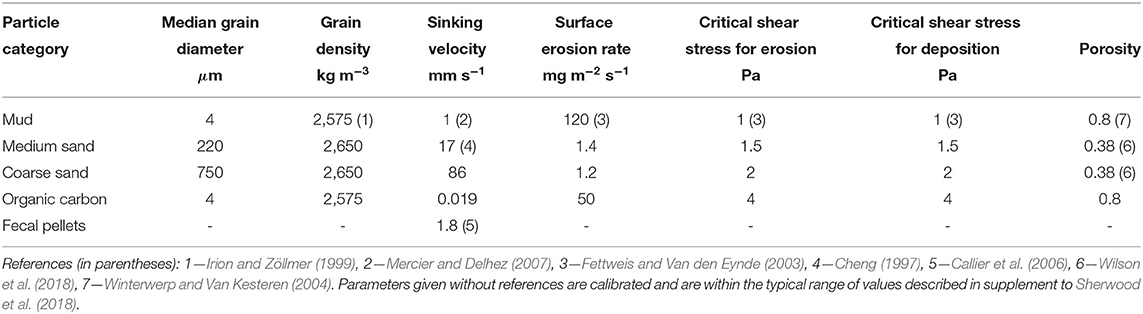
Table 1. Parameters associated with each modeled class of organic and non-organic particles.
Seventeen vertical layers are defined for the sediment bed: upper 10 layers (where biodiffusion is mostly active) are 1 cm thick, next 4 are 10 cm; last 3 are 50 cm thick. The biodiffusion coefficient is assumed to be horizontally uniform; however, vertically it varies according to a sigmoid function, with a value of 0.2 cm2 d−1 at 1 cm depth, 0.05 cm2 d−1 at 10 cm and 0 cm2 d−1 at 30 cm (based on Figure 8 from Zhang and Wirtz, 2017). In COAWST, the sediment bed can act as an entity (cohesive bed), or as an ensemble of separate sediment classes acting on its own (non-cohesive bed) or as a mixed bed, with a “cohesiveness” coefficient that depends on the mud quantity and defines how the bed behaves at each grid cell (Sherwood et al., 2018). Several tests were conducted with the settings similar to R-0 scenario from section 2.3, but using different options for the CCSTM model seabed characterization mode (i.e., cohesive, non-cohesive, mixed). Results were compared with in-situ observations and evidences from the literature for organic matter carbon content in the sediment, suspended sand concentration near the bottom during spring tides, TOC deposition at the stations and SPM concentration in the water column (more information in section 3.1), as well as for the steady-state of all the sediment classes. The “cohesive” formulation provided the best compromise in terms of model skills and was therefore adopted for the main simulations.
The spatial distribution of the mass fraction of mud and medium and coarse sand is initialized from a regional product of composite maps (Wilson et al., 2018), updated with the local grain size data from Verfaillie and Van Lancker (2006) and from the Belgian Science Policy project FaCE-iT (Functional biodiversity in a Changing sedimentary Environment: Implications for biogeochemistry and food webs in a managerial setting) field campaign of 2020. Although the flocculation process is not resolved by our model, the mud parametrization intrinsically accounts for flocculation through a higher sinking speed (Fettweis and Van den Eynde, 2003), which is particularly important to represent the mud fields near Zeebrugge. The initial distribution of SPOCf and SPOCs is estimated by prerunning the model for 1 year, acquiring the annual-averaged bottom fluxes of both carbon pools and then by estimating the steady-state concentration of carbon using the formula of the converging infinite geometric series. At the lateral boundaries, a concentration of mud of 100 mg m−3 is imposed at the Dover Strait (Mercier and Delhez, 2007); 36,000 mg m−3—at the Scheldt (Baeye and Fettweis, 2015) and 33,800 mg m−3 at the Rhine (Asselman, 1999).
Further technical details, including model equations and a list of state variables and parameters, are given in Supplementary Materials 2, 3.
2.2.3. Filtration Model
In the framework of the FaCE-iT project, one C-Power (the first Belgian OWF) turbine installed on a gravity-based foundation (Wu et al., 2019) was studied in detail during annual ship-based field campaigns in 2016–2019. Particularly, the abundance of fouling species was estimated in-situ, while the amount of produced FPs was estimated in a set of laboratory experiments6. The main biofouling organisms in the BCZ are the blue mussel Mytilus edulis, the amphipod Jassa herdmani and the plumose anemone Metridium senile, but the latter two have negligible biodeposition relative to that by the blue mussel (Vanaverbeke et al., 2020). Therefore, only mussels are considered in the filtration and biodeposition model. Blue mussels are assumed to be uniformly distributed between the mean sea surface level and 6 m of depth along the monopile foundation with a density of 6468 individuals m−2 (Kerckhof et al., 2010; De Mesel et al., 2015). For each monopile, the total amount of mussels that are involved in the filtration process (i.e., submerged) at a given time is calculated using the total surface area available for biofouling and the instant water level (see Supplementary Material 3 for details).
The mussels filter the two organic carbon pools (POCs and POCf) and inorganic fine particles (MUD) from the surrounding waters and produce feces with an enhanced sinking speed, that consist of organic (FPPOCs and FPPOCf) and inorganic particles (FPMUD). These fecal pellets rapidly sink to the bottom where they add to the mud and sedimentary carbon pools. Notice that in the water column TOC = POCs + POCf + FPPOCs + FPPOCf. The filtration model parameterizes the filtration, production of feces and respiration. Model formulations are based on the model from Slavik et al. (2019), that uses empirical relations of the filtration rate and available carbon by Bayne et al. (1993). In our implementation, filtration can only happen on the submerged part of the monopile foundation; tidal dynamics causes parts of the monopile to be exposed to the air at times.
The filtration model is embedded into COAWST as a part of the CCSTM to represent the impact of biofouling organisms on the SPM and sediment dynamics. A schematic representation of the organic and mineral particle model is shown on Figure 3, while details on its mathematical formulation and main hypotheses are presented in Supplementary Material 2.
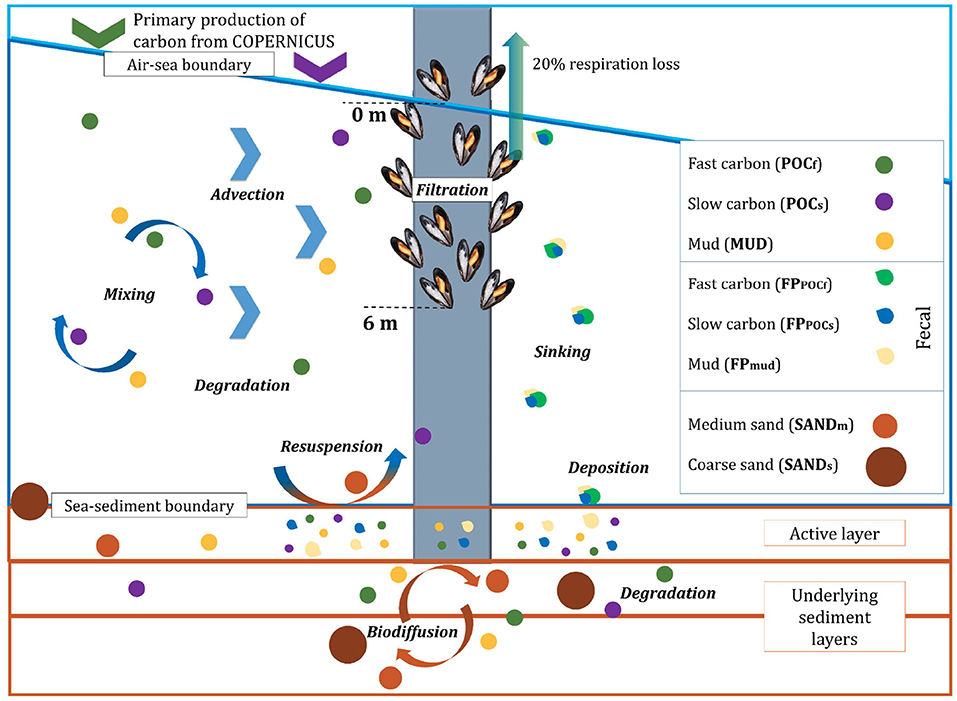
Figure 3. Schematic representation of the carbon and mineral particle model including the filtration model. The filtration model describes the transformation of organic and inorganic materials into fecal pellets that sink to the bottom to feed the sedimentary compartment.
2.2.4. Implementation of Wind Farms Distribution
The OWFs are represented in the model via two variables: mean monopile radius and number of monopiles per grid cell. The mean monopile radius (m) is used to calculate the area available for filtration by fouling organisms given an instant water level. Here, the area covered by mussels is considered to be an ideal cylinder. The number of monopiles per grid cell is used to calculate the total filtration rate and FPs production within a grid cell. It is assumed that all monopiles in a grid cell are of the same diameter (true for the fine resolution grid).
Table 2 summarizes the main characteristics of operational and planned OWFs, distributed across the model grid. Three types of turbine foundations are installed in the region of the BCZ: the large majority of them are monopiles, except for the first Belgian OWF C-Power, where 48 jacket foundations and 6 gravity-based foundations can be found (Wu et al., 2019). For the simplicity of computation of the biofouled area, it is assumed that all the turbine foundations are monopiles. If the exact coordinates of monopiles in an OWF are not available, monopiles foundations are distributed uniformly over model grid cells assigned to the OWF perimeter. This explains why the number of monopiles per grid cell can be a decimal number in Table 2. If no information is found regarding the monopile diameter, a diameter of 8 m is assumed. The new OWF at the NCA and Dunkirk OWF have the least available public information, because their construction has not yet started. For these two OWFs, only the total amount of energy delivered by each OWF is known, while information about the monopile type, their number (true for the new OWF at the NCA), turbine nameplate capacity, diameter, and location is not yet in the public domain.
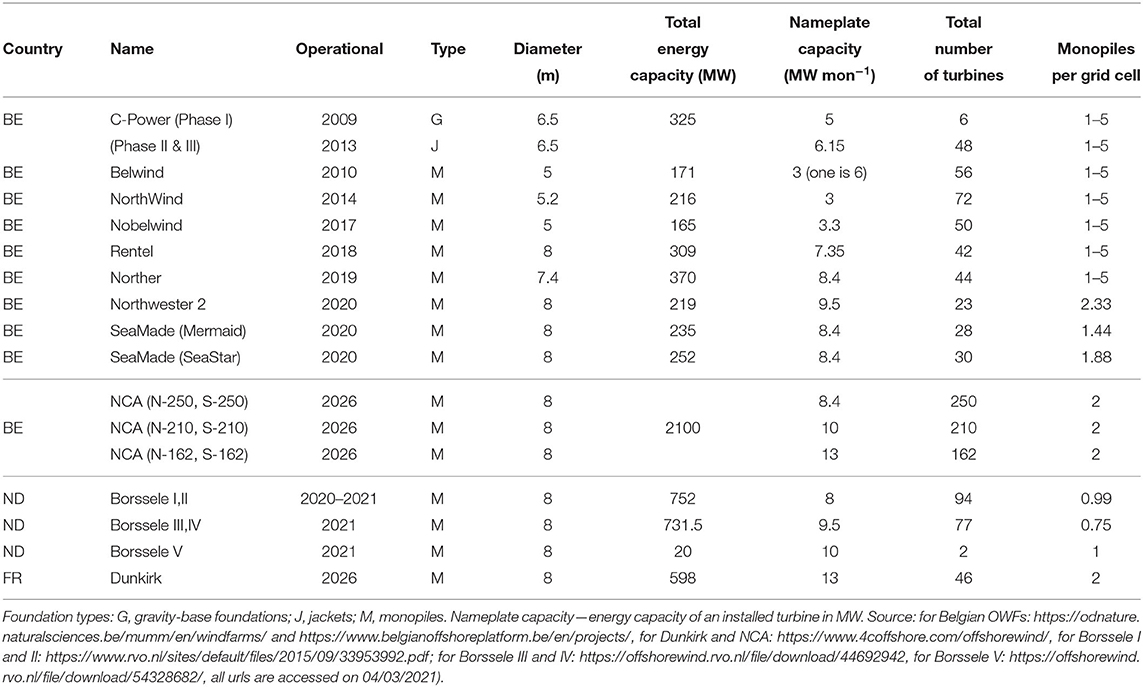
Table 2. Information about existing and planned OWFs (see Figure 1 for the localization of each OWF).
2.3. Scenarios Design and Policy-Driven Questions
During project meetings with representatives of the WWF-Belgium, concerns have been raised about a future OWF in the NCA, partially covering the Natura 2000 zone, that may impact its fragile gravel beds ecosystems in the negative way.
The stakeholders formulated two main policy-driven questions; therefore the developed scenario simulations and associated analyses were designed to answer them. Those questions are:
1. What is the design of the NCA in terms of number of turbines and location that would preserve the gravel beds?
2. If we place nevertheless the NCA turbines inside of the Natura 2000, what effect will it cause?
The scenarios have been defined as follows. The total amount of energy that will be delivered by the new OWF has already been known from https://www.4coffshore.com/offshorewind/, accessed on 31/07/2020. However, the design of the OWF in terms of number and placement of the turbines was not yet decided. Using information about the total energy to be delivered and the nominal capacity of different models of turbines in existing regional OWFs, we defined scenarios that vary in the number of turbines and placement (Figure 4 and Table 3). For the placement we chose two contrasted configurations. In the first positioning scenario, all the turbines are concentrated in the northern part of the NCA (i.e., the Northern placement, scenarios N-250, N-210, and N-162) in order to maximize the distance to the gravel beds. In the alternative scenario, the turbines are located in the south of the NCA overlapping with the gravel beds (i.e., the Southern placement, scenarios S-250, S-210, and S-162). Note, that even in the Northern scenario some monopile foundations need to be placed inside the Natura 2000 area to match the projected total energy production, but these turbines are still at least 2 km away from the closest gravel bed. Then, for each of these two positioning scenarios, we defined three sub-scenarios for the nominal capacity per turbine, based on examples from the region: one with 250 8.4-MW turbines (respectively N-250 and S-250) as currently installed in the SeaMaid or Norther OWFs, one with 210 10-MW turbines (respectively N-210 and S-210) as in the Dutch Borssele-V OWF and one with 162 13-MW turbines (respectively N-162 and S-162) as expected for the Dunkirk OWF (based on the total energy delivered and the projected number of turbines). For each scenario, a distance between monopiles of 9–18 times the rotor diameter (which is 100–150 m) is guaranteed to allow recovery of the wind (Choudhry et al., 2014). This means that we have 2 monopiles per km2 (i.e., per grid cell of the fine resolution grid).
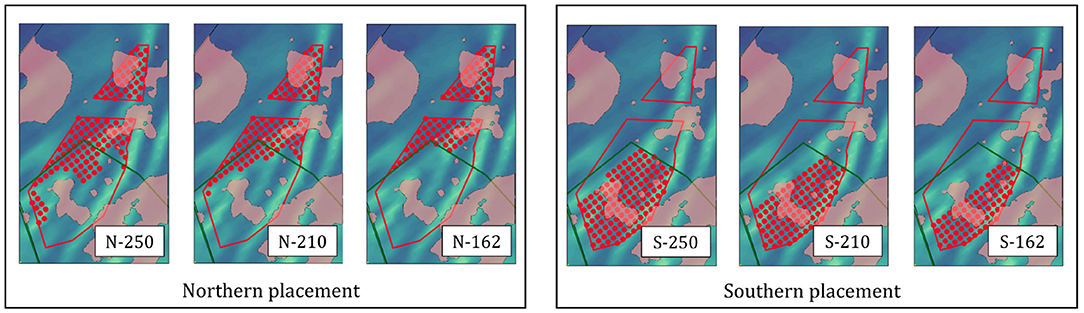
Figure 4. Mapping of the monopiles over the NCA under two scenarios of localization of the wind farm: Northern placement (N) avoids the gravel beds while Southern placement (S) overlays with the gravel beds. For each placement, we consider three types of installed nameplate capacity, resulting in 162, 210, and 250 monopiles. These scenarios are referred to as N-250, N-210, N-162, S-250, S-210, S-162. In each case, the total amount of delivered energy by the OWF at the NCA is fixed at 2100 MW.
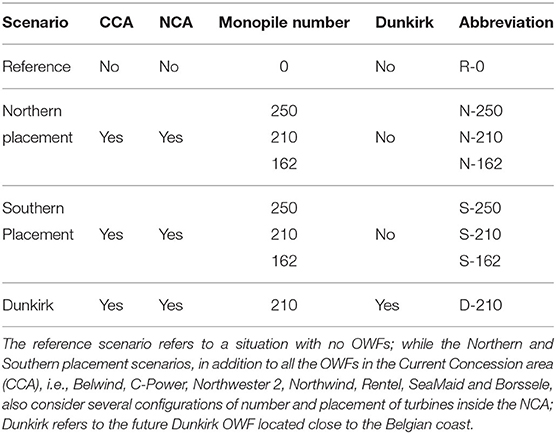
Table 3. List of scenarios that are selected for running the model.
The design of these 6 scenarios is targeted toward finding an optimal location of the turbines that would minimize the impact of the NCA on the Natura 2000 area and, in particular, on the gravel beds. We do not target a minimization of the costs associated with cable extension and maintenance of the monopile. We also ignore practical constraints due to the bathymetry that may prevent the building of monopile foundations at some places.
In addition, we performed a “Dunkirk” (D-210) scenario that considers the Dunkirk OWF (Table 3), because its concession zone is drawn very close to the BCZ and hence could potentially affect Natura 2000 ecosystems. For this scenario, we assume that the 46 monopiles of Dunkirk are built as close as possible to the BCZ, with a density of 2 monopiles per grid cell, in order to envisage the most unfavorable situation. For this additional scenario, we use the N-210 positioning scenario for turbines in the NCA. Lastly, we run the reference (R-0) scenario, without biodeposition associated with OWF biofouling organisms, to estimate the carbon deposition and sedimentary structure without human interventions. Each scenario is run for 1 year starting from the same initial conditions.
3. Results
In this section, we assess the ability of the model to simulate the seasonal dynamics and spatial distribution of SPM in comparison with a satellite product. The impact of the OWF biodeposition on the carbon and mud flux to the bottom is assessed under different scenarios (Table 3). Areas of statistically significant changes of the simulated annual average of the TOC deposition fluxes are identified using a t-test modified for auto-correlated time series (see Supplementary Material 6). In what follows, we will qualify as (non) significant changes, the changes in the TOC fluxes that do (not) result in annual average values that are found statistically significant. However, it should be noted that even changes in the carbon flux that do not result in statistically different annual averages can potentially impact the biogeochemistry and ecosystem. For instance, De Borger et al. (2020a) show that small but persistent changes in the TOC flux to the sediment can alter the carbon storage and remineralization process. We also highlight how the hydrodynamics (residual currents, tides, sub-mesoscale gyres) determine the spatial pattern of changes and the far-field effect. Simulated changes sometimes propagate far beyond the OWF border. The simulated waves (significant wave height, wave period) and associated shear stress are compared with tidal gauges and literature in Supplementary Material 4.
3.1. Validation of the Organic and Mineral Particle Model
The simulated SPM concentration in the water column is compared with the CMEMS inorganic SPM satellite product for the year 2019 (OCEANCOLOUR_ATL_OPTICS_L3_NRT_OBSERVATIONS_009_0347). Throughout the year, the simulated SPM content is higher along the coast than in the offshore. In winter, the SPM concentration increases everywhere in the BCZ and the SPM patch associated with the river plume becomes larger, because the bottom resuspension is enhanced by the wave action. This spatio-temporal pattern is in agreement with satellite observations (Figure 5A), even if we note that the observed plume is extending more offshore covering the area from France to the Netherlands. This mismatch is attributed to the underestimation by the model of the bottom stress along the coast due to the limited spatial resolution of the model and the complex bathymetry. It does not have an effect on the SPM at the CCA and NCA, because the SPM at the offshore station D6 is indeed quite well-simulated (see Figure 5C).
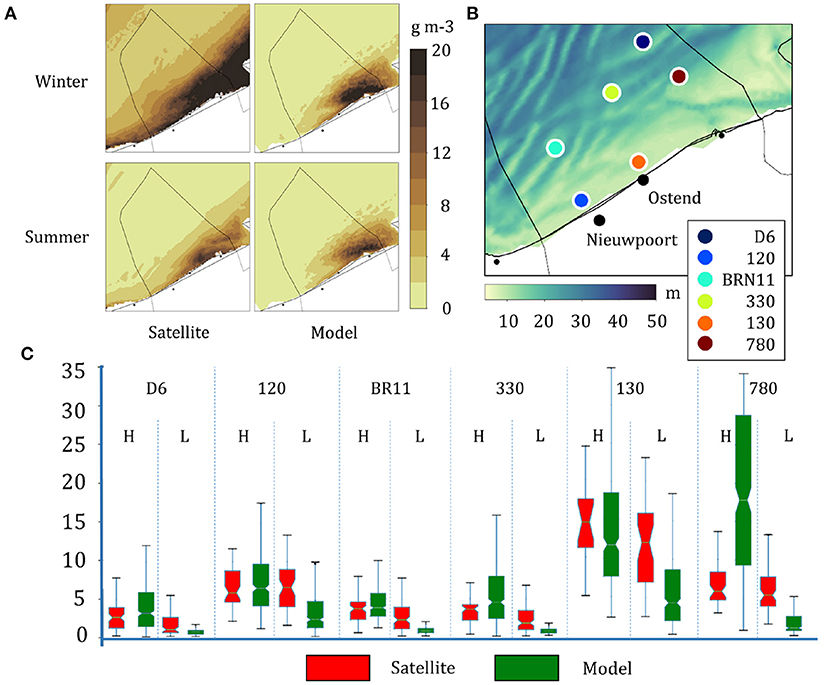
Figure 5. (A) Surface SPM in winter (top) and summer (bottom), left column—satellite, right column—model. (B) Positions of the monitoring stations (background—bathymetry). (C) Satellite and model SPM boxplots at those monitoring stations for spring (H) and neap (L) tide.
The comparison of the simulated SPM with that obtained from the satellite at monitoring stations (see positions on Figure 5B) for spring and neap tides shows a good agreement in terms of median values and ranges (Figure 5C), except for station 780, where the simulated mud concentration is too high during the spring tide, possibly because of too high bottom stress. Offshore, at station 330, SPM near the bottom reaches a concentration of 3 g m−3 during high tide, in line with observations by Baeye and Fettweis (2015). The model tends to underestimate SPM concentration during the neap tide (for all stations), and overestimate it during the spring tide (for all stations except st. 130).
The simulated spatial fluxes of organic carbon to the sediment are used in De Borger et al. (2020b) to force a diagenetic model that is run at monitoring stations (for model calibration). The diagenetic model (OMEXdia) estimates the flux of dissolved inorganic carbon (DIC) and sediment community oxygen consumption (SCOC), that can be compared with FaCE-iT field campaign data. The fitting of the OMEXdia-simulated DIC outflux and SCOC to these data allows to constrain the degradation and sinking rates of the organic carbon in our model. Using the parameters described in Table 1, we are able to simulate POC flux to the sediment that supplies OMEXdia-simulated SCOC and DIC outflux with a spatial variability and intensity that are consistent with the majority of the stations sampled during the FaCE-iT ship-based field campaigns 2017–2019 (see Supplementary Material 6).
3.2. Impact of OWFs on Carbon and Mineral Particle Flux to the Bottom of the BCZ: Scenario Simulations
Here, we show that the OWF biodeposition significantly changes the carbon flux into the sediment and alters the mud flux. This change sometimes propagates far beyond the OWF concession domain. We highlight how the hydrodynamics (residual currents, tides, sub-mesoscale gyres) determine the spatial pattern of changes and the far-field effect. For the different NCA scenarios we compare changes in the carbon fluxes to surrounding sediments.
3.2.1. General Features of the OWFs Footprint on Carbon Flux to the Seabed
The distribution of changes of relative values (>|1|%, D-210 scenario with respect to R-0 scenario) in the TOC flux to the bottom shows that the largest changes are found in the vicinity of 2 km around the monopile foundations, and exclusively consist of a flux increase up to 15% and more (Figures 6A,C). Note, here the “distance to the closest monopile” means the distance between the center of a grid cell and the closest grid cell containing at least one monopile; i.e., if a location is “5 km away from the monopile,” it means that it is 5 ± 1.4 km away. At 2–5 km from the monopile, the overall fluxes are still higher (1–10%), although this effect drastically decreases with an increasing distance (from 9% at 2 km down to 3% at 3 km; see Figure 6C). Beyond 5 km from the monopile, the carbon flux is lower compared to R-0 situation and reaches its maximum decrease of 2% at a distance of 9–13 km. The reduction of the flux however does not exceed 2% and hence is significantly smaller than the maximum increase of 2–15% simulated close to the monopile. A marginal (~0.5 %) decrease of the flux is also simulated further than 30 km away from the monopiles.
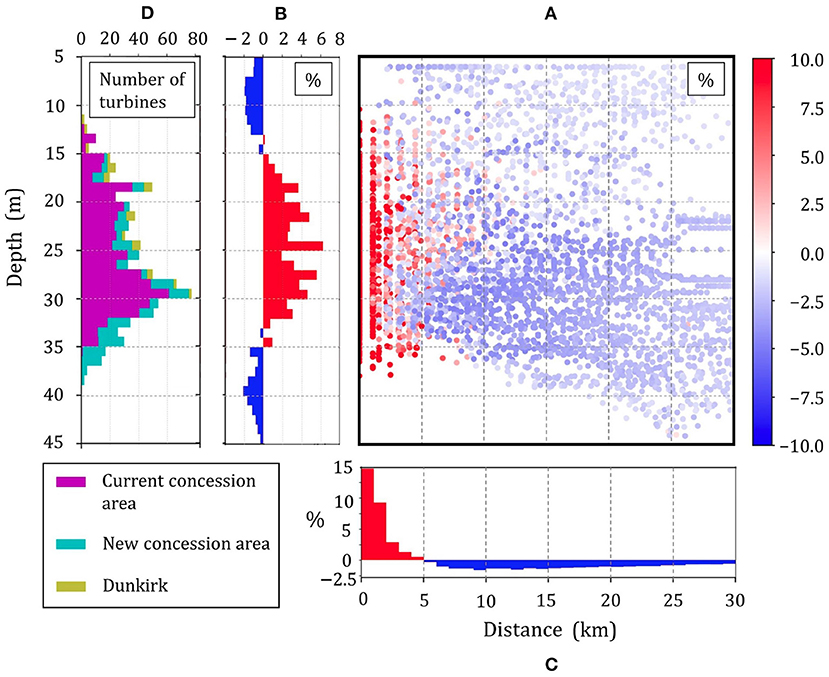
Figure 6. Changes in the annual TOC deposition flux (in %) under the D-210 scenario compared to the R-0 simulation. (A) Scatter plot of changes in TOC flux for each grid cell within 30 km of a closest monopile as a function of water depth and distance to the closest monopile. (B) Area-weighted annual TOC changes for each particular water depth; (C) Area-weighted annual TOC changes at each particular distance to the closest monopile; (D) Cumulative bar plot of the number of monopiles for each concession area as a function of the water depth.
The distribution of the changes in the carbon flux as a function of water depth (Figure 6B) shows that the depths between 16 and 32 m experience an increased TOC flux (up to 6%) to the bottom, while in the shallow waters (<15 m) and in the deep parts of the domain (up to 45 m deep) we simulate a decrease up to 2%. The 16–32 m depth range where we simulate an enhanced deposition corresponds to the depth where we find most of the monopiles (Figure 6D). However, most turbines are located at 29 m depth (Figure 6D); while the maximum increase in TOC fluxes is simulated at 24 m depth (Figure 6B). This difference indicates that the OWF impact is larger at shallower depths, with a possible explanation that shallower depths experience higher deposition of TOC under the same conditions of its production, because a smaller amount of TOC degrades while sinking, compared to the deeper regions.
3.2.2. Effect of the Hydrodynamics on the Carbon Flux
The horizontal pattern of changes in the TOC flux to the sediment (under the N-250 scenario) is aligned with the M2 tidal ellipse major axis in the SW–NE direction (M2 accounts for 70% of the amplitude of the tides in the region). The ebb and flood of the tidal current transport FPs up to 20–30 km away from the OWF (Figure 7A); while in the SE–NW direction (i.e., tidal ellipse's minor axis), moderate (>10%) changes do not extend beyond 2–3 km.
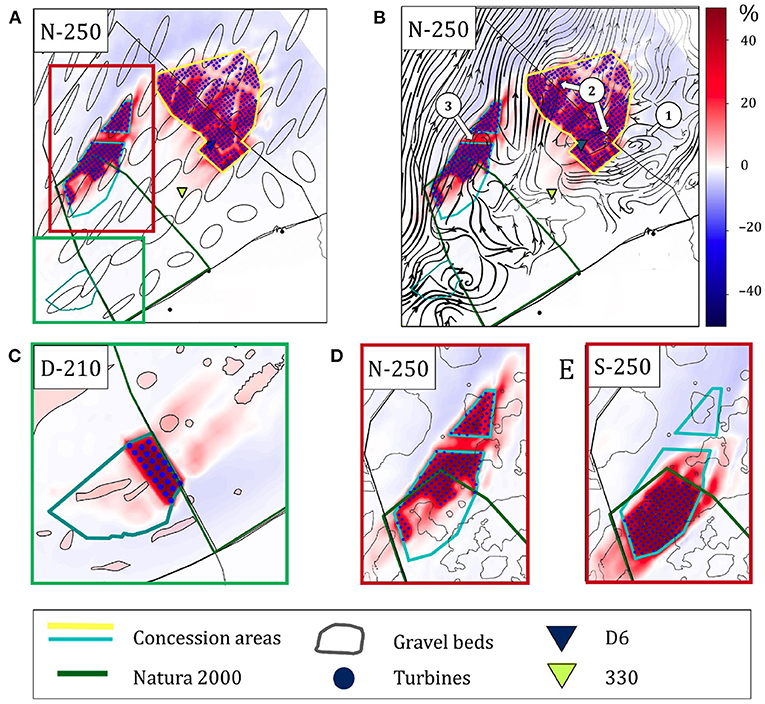
Figure 7. Spatial distribution of the annual change (%) in the TOC deposition flux integrated under N-250 scenario with superimposition of the M2 tidal ellipses (A) and the residual currents (B). Enumerated white circles denote retention gyres. In (A) the green and red rectangles correspond to cut-offs (C–E). Each blue dot represents two monopiles. (C) Changes (in %) in the TOC deposition flux under D-210 scenario compared to R-0 simulation. Blue dots—possible location of monopiles (each dot represents 2 monopiles) and blue frame—border of Dunkirk OWF. Green polygon—Natura 2000. Pink-semi transparent polygons—gravel beds. (D,E) Change (%) compared to the R-0 simulation of yearly-integrated TOC deposition flux: N-250 case and S-250 case, respectively.
The effect of residual currents8 results in the net transport of TOC in the NE direction (Figure 7B). More important, residual currents in the Natura 2000 area flow predominantly northward, transporting the filtered carbon outside the NCA and hence protecting the local gravel beds from an increased carbon flux. In between the CCA and NCA, the residual current is strong and flows northward. Here, the changes are moderate and no cumulative impact of the CCA and NCA is observed. The density of monopiles affects the amplitude of the maximum change. The largest increase of carbon flux (>50%) is observed where the monopile density is ≤ 2 km−2 (e.g., at Belwind, Northwind, C-Power, and the NCA).
In addition to the general pattern of change, the distribution of the TOC flux to the bottom displays a patch of an enhanced TOC deposition of a few kilometers in scale, that can be associated with the residual hydrodynamics (e.g., convergences, divergences, gyres), that are particularly intense in this region due to the complex bathymetry and interactions with riverine plumes (Ivanov et al., 2020). In particular, residual gyres act as retention areas for TOC, leading to marked patches of the enhanced carbon deposition. For example, the SE boundary of the CCA (Norther OWF) displays a sharp gradient of carbon flux change from a slight decrease (2–3%) to a 50% increase within 2–3 km (between gyres #1 and #2 on Figure 7B). This marked gradient is associated with the presence of a gyre (#1) that retains most of the filtered carbon close to the OWF. On the other hand, a residual flow around this gyre is responsible for spreading a share of the filtered TOC southward, therefore at station 330 (see Figure 7A), located more than 10 km away from the closest OWFs, a slight increase in carbon deposition is observed. Similarly, several patches of enhanced deposition changes are associated with large residual gyres in the CCA (#2) and NCA (#3), which act as retention areas, where the TOC can be locally degraded, limiting the spread of the material and hence reducing the far-field impact of the OWF biodeposition.
Model simulation under the D-210 scenario shows that the building of the new Dunkirk OWF close to the BCZ will result in an increase (up to 10%) of the TOC flux inside two “tongues” separated by an area of a slight decrease in TOC flux (Figure 7C). This reduced deposition area corresponds to a bottom dune with shallower depths. Therefore, the Dunkirk OWF redistributes the TOC flux to the sediment from the shallow regions to the deeper ones. We should note that the changes in TOC deposition flux to the local gravel beds is approximately five times smaller than the TOC flux changes caused by the NCA placement over the northern Natura 2000 gravel beds possibly due to the fact that for the Dunkirk OWF there are fewer projected monopiles.
3.2.3. Impact of the Design of the NCA on the Carbon Flux
Figures 7D,E zoom in on the NCA for the N-250 and S-250 scenarios compared to the R-0 simulation. They show the annual relative change of the TOC flux to the sediment. The patch of the carbon deposition in and around the CCA is the same for both cases and thus not shown. The patterns however are significantly different for the NCA, especially for the large gravel bed (pink color on Figure 8B), that is less impacted in the N-250 scenario compared to S-250. In N-250 scenario, this gravel bed faces a relative increase of TOC flux (~10%) in its northern part compared to R-0 scenario, with no flux alteration in its southern part. In S-250 scenario, the whole area of this gravel bed experiences a 50% TOC deposition flux increase compared to R-0 simulation.
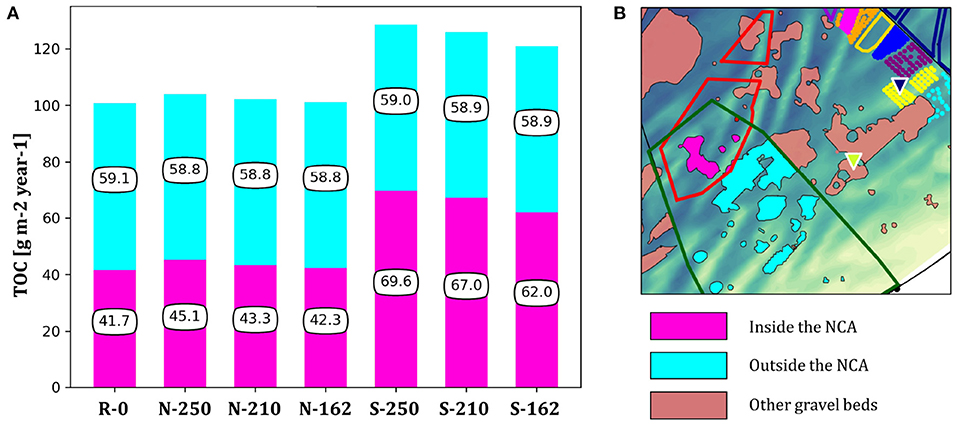
Figure 8. (A) Annual TOC fluxes to the gravel beds, simulated under the scenarios of monopiles distribution defined for the NCA in Table 3 and for R-0 scenario. The TOC fluxes are spatially averaged over the gravel beds located inside (cyan) and outside (pink) the NCA. (B) Position of gravel beds inside the NCA and Natura 2000 (pink) and outside of the NCA but inside the Natura 2000 (cyan).
Under the different scenarios for the NCA (Table 3), the TOC flux to the gravel beds inside and outside of the NCA was more affected by the positioning of the monopiles than by their total number (Figure 8). The simulated TOC flux to the gravel beds inside the NCA increases by 48% (S-162) up to 67% (S-250) in the case of the southern placement, and only by 1.5% (N-162) to 8% (N-250) in the case of the northern placement. Outside the NCA, the TOC flux to the gravel bed does not change substantially (<1%) on average, but spatial variability of this effect has been evidenced, with some gravel beds receiving a higher flux (up to 10%; further discussion in section 4.2).
3.3. OWFs Footprint on the Mud Flux to the Seabed
Similar to organic carbon, mud in the water column is filtered by mussels and integrated in FPs. However, the model shows that the contribution of biodeposition to the mud background deposition is marginal (i.e., less than 1%) and that the mud dynamics is mainly governed by the lateral inputs (from the Strait of Dover and the rivers) and by deposition/resuspension processes. The spatial distribution of the mud flux to the sediment due to biodeposition shows a marked seasonal variability similar to that of the suspended TOC in the water column (Figure 9) with the highest (> 200 mg m−2 d−1) values in summer when the mussel filtration rate is highest because of high rates of PP, whereas lowest values (biodeposition is suppressed by resuspension) are modeled in winter when the stronger bottom shear stress hampers deposition. The zone of increased mud flux to the bottom extends beyond the OWFs area following the general direction of the residual currents. Note that, since the model does not account for flocculation of fecal pellets and mineral fine particles, it may overestimate the mud dispersal and hence, underestimate the mud deposition around the wind farms (see further discussion in subchapter 4.3).
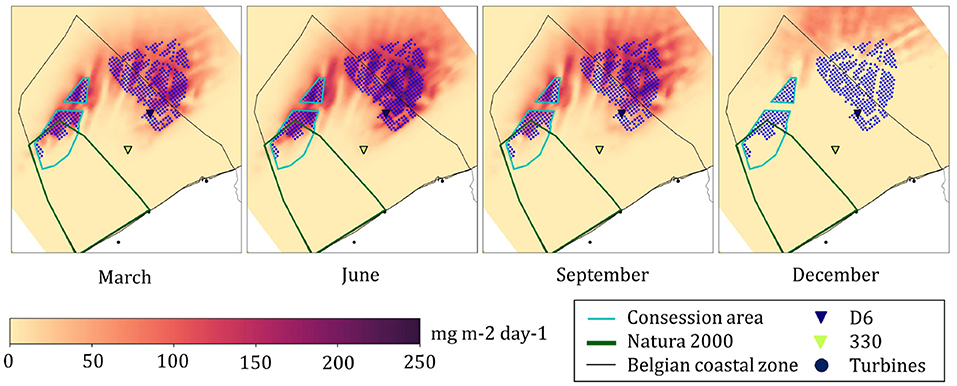
Figure 9. Flux of filtered mud (FPMUD) to the sediments for different months of the year under N-250 scenario.
4. Discussion
4.1. OWF Footprint on the Sedimentary Environment
The filtration of SPM in the water column and subsequent FPs production by fouling mussels on OWFs' monopiles result in a conversion of slowly sinking organic and inorganic SPM into fast sinking particles and a redistribution of particle fluxes to the sediment. While, sinking and in case of resuspension after deposition, FPs are transported by tidal and residual currents. The spatial pattern of the particle flux to the bottom thus reflects the local hydrodynamics around the monopile where they are produced. The area of influence of the monopiles depends on the settling velocity vs. transport, mixing conditions and bottom shear stress. Hence, due to the predominant offshore direction of the residual currents along the Belgian coast (especially in the eastern part) and the quasi-alongshore orientation of the tidal ellipses, no significant influence of the OWFs on the near-shore environment is found.
Our model simulations show that the inorganic mud content in the water column and in the sediment bed is marginally (less than 1%) modified by mussel biodeposition, because the order of magnitude of the filtration and FPs flux is small (Figure 9) compared to lateral transport and erosion of muds. In contrast, OWFs considerably modify the TOC flux to the bottom, establishing a zone with enhanced carbon deposition (by 2–15% on average, and up to 50% locally and sporadically) around the monopiles that stretches in the direction of the residual current, and is aligned with the major axis of the tidal ellipse. At the same time, larger regions, located mostly perpendicular to the main direction of the regional residual current and along the minor axis of the tidal ellipse, are affected by a moderate (up to 10%) decrease (Figure 7). This implies that the filtering action of OWF biofouling fauna concentrates the deposition of planktonic organic carbon around OWFs, that would otherwise be more homogeneously spread across the domain. A visible far-field effect in the form of a reduced deposition is simulated up to 30 km away from the monopile. On the smaller spatial scales, the changed deposition exhibits features associated with sub-mesoscale gyres. These gyres trap the FPs in their center and act as retention areas with enhanced deposition, degradation and reduced spreading. The area of statistically significant TOC deposition flux changes includes OWF perimeters, but can also stretch up to several km in the direction NE-direction, when the residual current is aligned with the major tidal axis.
The simulated enhanced carbon deposition up to 50% around the monopile area and in the center of sub-mesoscale gyres has the potential to alter the sedimentary environment in terms of composition, grain size and biogeochemistry. Indeed, the field studies in the area revealed a decrease in median grain size (from 427 to 312 μm) coinciding with an increase in organic matter content (from 0.4% up to 2.5%) in the vicinity of the turbines in Belgian OWFs (Coates et al., 2014; Lefaible et al., 2018).
4.2. OWFs Foodprint on the Natura 2000 Region
Model development and scenario definitions have been designed to address the concerns of policymakers about the positioning and number of NCA monopile foundations. More specifically, the number and placement of turbines have been investigated so as to minimize (and in possible to prevent) a negative effect on the Natura 2000 region and, in particular, to safeguard the nearby gravel beds. Model simulations, run under the different scenarios of the OWF design for the NCA, show that the number of installed turbines has an order of magnitude less impact on the TOC deposition flux than their positioning (Figure 8A). The statistical analysis has also confirmed that the area of statistically significant changes in the TOC deposition flux is much larger between two different placement scenarios of the same turbine energy capacity, than between two different energy capacity scenarios of the same placement (see Supplementary Figures 5B,C). The simulations demonstrate that when all the turbines are located in the northern part of the NCA, with only a reduced number in the Natura 2000, the increase of carbon deposition to the Natura 2000 gravel beds located within the NCA is nowhere higher than 10%. In contrast, when the turbines are all located in the southern part of the NCA, this increase exceeds 50%, and even some gravel beds outside the NCA are impacted. This might affect the preservation of the biodiversity of the gravel beds, through a possible negative impact on filter feeding organisms (Essink, 1999). Luckily, the NE-direction of regional residual currents and the alignment of the tidal ellipses with the coast favor the transport of material away from the Natura 2000 area, preserving the majority of gravel beds outside the NCA even in the case of a southern positioning, except for the northern part of the gravel bed located close to the NCA.
In the direction opposite of the residual current and beyond 5 km from the NCA, the carbon deposition flux decreases up to 10%. For instance, under the northern placement scenarios (Figure 7D), a large gravel bed which borders the NCA (the northernmost cyan-color gravel bed on Figure 8B) receives a decreased deposition flux. However, in the southern placement scenarios (Figure 7E), the northern part of this gravel bed is heavily impacted by the increased carbon deposition.
Considering the future Dunkirk OWF, the logical conclusion would be to place its turbine foundations as far as possible from the Belgian border to prevent them from affecting gravel beds in the eastern part of the Natura 2000 area. In the most extreme case as shown here, this OWF will increase TOC deposition to the closest Belgian gravel beds by 10% (however, this does not result in a change in the mean annual TOC flux that is found statistically significant).
4.3. Current Model Limitations
The model resolution of 1 km limits the tracing of small-scale spatial features in the carbon flux dynamics. Indeed most of the effects are located within 5 km from monopiles, which is close to our limit in spatial resolution. While, this approach is sound for a first assessment of the regional impact, it shows that finer resolution is needed to detail the small-scale part of this distribution (i.e., <10 km). Typically, one way to exploit this information would be to decide that a new level of nesting should be employed in a 10 km vicinity around OWFs.
According to the simulations, the impact of OWF biofouling filtration on the mud content in the upper layers of the sediment bed is negligible compared to the important mud remobilization through the action of tides (Figure 9). In the field, the mud component of feces can be much less resuspendable, if the FPs do not decompose quickly and thus are still large in size. In addition, the flocculation process may play an important role at the OWFs, but is not included into the model, because of lack of data on FP decomposition. Decomposing FPs can potentially form flocs from any combination of non-organic material and organic carbon. Unfortunately, current scientific knowledge is limited for the flocculation/decomposition process and for the dynamics of hybrid mineral and organic aggregates in general. Hence, including flocculation and FPs decomposition processes into the model could be considered as speculation, which complicates simulations without adding a trustworthy added value.
In this study, the impact of OWF on the environment is limited to the filtration and biodeposition effects associated with the biofouling mussels. However, wind turbines and their foundations affect the local hydrodynamics (e.g., currents, mixing) and winds intensity. For instance, the presence of monopiles foundations and scour protection layers alters the circulation and increases bottom roughness, shear stress, resuspension, mixing, and stratification (e.g., Grashorn and Stanev, 2016; Rennau et al., 2012). There are some evidences in the literature that monopile foundations may alter the mesoscale circulation with the generation of eddies (e.g., the Karman eddies, Simpson et al., 1982) associated to the splitting and merging of the current around the pylone (the so-called “island effect”) and upwelling-downwelling (Christiansen and Hasager, 2005) induced by alteration of the wind patterns (the “shadow effect” evidenced by van der Molen et al., 2014). This intensification of the mesoscale circulation and production of eddies may enhance the trapping of biodeposits but this effect has not been quantified here.
Remote sensing as well as some notable in-situ studies (e.g., Baeye and Fettweis, 2015) evidence the existence of a sediment wake around the monopiles. However, this wake should yet be sampled to determine the quantity of mud and carbon in there, to further upgrade the model with information regarding sediment classes of filtered matter. Hopefully, the advent of hyperspectral remote sensing and field work, scheduled to calibrate the analysis of those data, will provide further insights into the size class distribution and composition of marine suspended aggregates, and may therefore allow to advance marine modeling in that regard. However, the model resolution of 1 km2 can be a potential limitation in modeling of this wake, which stretches by only a couple of kilometers away from the monopile and is only several tenths of meters wide.
The model constraint, which keeps the proportion of filtered organic carbon to mud as 40:60 essentially limits the filtration capacity of mussels by the available carbon. This simplification is derived from a laboratory FP analysis, but in the field, under North Sea conditions, this proportion can be different. The model also does not take into account the seasonal cycle of mussels growth (i.e., the mussel mass is assumed constant at 300 mg), due to lack of field data, as well as their interannual variability. In the field, mussel clumps tend to grow until a certain critical size until they are dislocated and fall down. We also assumed that the mussels cover the upper 6 m of the monopile with an equal density, without taking into account some variability, not including mussels below the 6 m depth mark and mussels located above the mean sea level. In addition, in the field mussels can grow on each other, transforming the cylinder surface area into a 3D fractal-like surface, but we neglect this due to the lack of corresponding studies. Despite all these limitations, we used the best available estimates from the FaCE-iT ship-based field campaign data and laboratory analyses, combined with the knowledge from the literature. We may guess that implementation of all these biological and ecosystemic constraints and processes would give better results on the interannual scale (brief analysis in Supplementary Material 5), but only marginally better results on the spatial scale.
5. Conclusion
The European Green Deal targets climate neutrality at the Horizon 2050. This ambitious objective requires continuing decarbonizing the energy system by increasing the part of renewable energy. In this context, the number of OWFs has sprung along European coasts and everywhere in the world with consequences for marine biodiversity and biogeochemistry that are hardly known at ecosystem scale. Our tool allows to upscale the local effect of OWF biofouling communities on a single turbine foundation over the regional scale using a well-validated coupled hydrodynamic-wave-sediment-filtration model with taking into account potential synergistic and antagonistic effects of neighboring monopile foundations. Such tools are needed to support the implementation of the EU policies, including the Blue Growth strategy (Eikeset et al., 2018), the Marine Spatial Planning Directive, the Habitat Directive (Coffey and Richartz, 2003) and Marine Strategy Framework Directives, the latter through the assessment of Descriptor 6 “Seafloor integrity.”
Our main conclusions can be summarized as follows:
1. The filtering action of OWF biofouling fauna induces a significant increase in TOC deposition within the OWF perimeter that rarely stretches beyond it. Around the turbine (<2 km) the TOC flux to the seabed increases annually on average by 2–15% but this increase may amount to 50% in certain areas. This increase can potentially affect surrounding benthic communities.
2. Beyond 5 km from the monopile, the carbon flux decreases compared to the reference situation and reaches its maximum decrease at a distance of 9–13 km then decreases to 0.5% at 30 km. The decrease of the flux does not exceed 2% and hence is tangibly smaller than the increase.
3. Model simulations assess the extension of the impact and clearly highlight that the effect of OWFs on carbon dynamics is not spatially uniform but rather exhibits a high degree of variability in response to the local hydrodynamics and, in particular, residual and tidal circulation, wave- and current induced bottom stress and local gyres. In particular, these local gyres act as retention areas inside which the carbon deposition may be enhanced.
4. Hydrodynamics must be included in assessing the scale of potential OWF effects on marine communities. Our results suggest that placing monopile foundations at least 3 km downstream (following the residual circulation) from vulnerable communities (e.g., gravel beds ecosystems) can considerably limit strong alteration in TOC deposition flux. For the most cases, placing the OWF at least 7 km upstream would result in very little (<5%) overall changes in the local carbon flux. For the direction, orthogonal to the dominant M2 tidal ellipse, this distance shrinks down to 2–4 km, depending on the direction of the residual current.
5. The scenarios of the NCA design show that in a configuration where the turbines are not overlapping with the gravel beds and are located mostly outside the Natura 2000 area, the gravel beds are hardly affected and the simulated enhanced deposition is very local and less than 10%. In contrast, when the turbines are all located in the Natura 2000 area, partly overlapping with the gravel beds, the enhanced carbon deposition to some of them amounts to 50%, which will likely alter the preservation of their biodiversity. Contrary to their placement, changing the number of turbines (from 162 up to 250) significantly affects TOC deposition flux over a much smaller area.
In the shallowest region of the BCZ, the seasonal variability of the TOC flux to the bottom can amount to 70–80% which would suggest that the seabed communities of such regions are already adapted to the variability of the TOC flux. Further work is needed to connect the simulated changes in carbon deposition flux with the type of seabed communities in regions of OWFs.
Data Availability Statement
All datasets used for this study have been properly referenced first time they appeared in the text of the manuscript and later summarized in Acknowledgments. Details of the model setup are available here: https://github.com/Ezhen/COAWST_setup.git. The simulation results are available upon request by email to the corresponding author.
Author Contributions
EI: conceptualization, methodology, software, validation, formal analysis, and writing. AC: conceptualization, methodology, editing, and supervision. EDB: validation and editing. SD: editing and funding acquisition. ED: editing. KS: conceptualization, editing, supervision, and funding acquisition. JV: conceptualization, editing, and funding acquisition. MG: conceptualization, methodology, editing, supervision, writing, and funding acquisition. All authors contributed to the article and approved the submitted version.
Funding
The authors thank the Belgian Federal Science Policy Office (BELSPO) for financing the current research in the frames of the BRAIN FaCE-iT project (contract BR/154/A1/FaCE-It). This work has been supported by the JPI Ocean and Climate CE2COAST project coordinated by the Norwegian Institute for Water Research (NIVA).
Conflict of Interest
The authors declare that the research was conducted in the absence of any commercial or financial relationships that could be construed as a potential conflict of interest.
Acknowledgments
The authors thank the University of Liège for providing the needed infrastructure. Computational resources have been provided by the Consortium des Équipements de Calcul Intensif (CÉCI), funded by the Fonds de la Recherche Scientifique de Belgique (F.R.S.-FNRS) under Grant No. 2.5020.11 and by the Walloon Region. This work was also supported by data and infrastructure provided by VLIZ as part of the Flemish contribution to LifeWatch and by the European Centre for Medium-Range Weather Forecasting (ECMWF). This study has also been conducted using E.U. Copernicus Marine Service Information. Data used in this publication was made available by the EMODnet Geology project9 funded by the European Commission Directorate General for Maritime Affairs and Fisheries. These data were collected by RBINS (Van Lancker, 2009), BGS, BRGM. We also thank Toussaint et al. for the data used to parameterize the sediments used in this modeling exercise.
Supplementary Material
The Supplementary Material for this article can be found online at: https://www.frontiersin.org/articles/10.3389/fmars.2021.631799/full#supplementary-material
Footnotes
1. ^https://www.health.belgium.be/fr/consultation-publique-le-plan-damenagement-des-espaces-marins-pour-la-partie-belge-de-la-mer-du-nord#article (accessed October 31, 2020).
2. ^https://eunis.eea.europa.eu/sites/BEMNZ0001 (accessed July 29, 2020).
3. ^http://marine.copernicus.eu/
4. ^https://www.ecmwf.int/en/forecasts/datasets/browse-reanalysis-datasets (accessed October 31, 2020).
5. ^https://resources.marine.copernicus.eu/documents/PUM/CMEMS-NWS-PUM-004-011.pdf
6. ^Mavraki and Voet, unpublished.
7. ^https://resources.marine.copernicus.eu/?option=com_csw&view=details&product_id=OCEANCOLOUR_ATL_OPTICS_L3_NRT_OBSERVATIONS_009_034
8. ^Here, under “residual current” we mean an Eulerian circulation over the period of simulation, definition aligned with Ivanov et al. (2020).
References
Asselman, N. E. (1999). Suspended sediment dynamics in a large drainage basin: the River Rhine. Hydrol. Process. 13, 1437–1450. doi: 10.1002/(SICI)1099-1085(199907)13:10<1437::AID-HYP821>3.0.CO;2-J
Baeye, M., and Fettweis, M. (2015). In situ observations of suspended particulate matter plumes at an offshore wind farm, southern North Sea. Geomar. Lett. 35, 247–255. doi: 10.1007/s00367-015-0404-8
Bayne, B., Iglesias, J., Hawkins, A., Navarro, E., Heral, M., and Deslous Paoli, J.-M. (1993). Feeding behaviour of the mussel, Mytilus edulis: responses to variations in quantity and organic content of the seston. J. Mar. Biol. Assoc. U. K. 73, 813–829. doi: 10.1017/S0025315400034743
Callier, M. D., Weise, A. M., McKindsey, C. W., and Desrosiers, G. (2006). Sedimentation rates in a suspended mussel farm (Great-Entry Lagoon, Canada): biodeposit production and dispersion. Mar. Ecol. Prog. Ser. 322, 129–141. doi: 10.3354/meps322129
Carlsson, M. S., Glud, R. N., and Petersen, J. K. (2010). Degradation of mussel (Mytilus edulis) fecal pellets released from hanging long-lines upon sinking and after settling at the sediment. Can. J. Fisher. Aquat. Sci. 67, 1376–1387. doi: 10.1139/F10-067
Cheng, N.-S. (1997). Simplified settling velocity formula for sediment particle. J. Hydraul. Eng. 123, 149–152. doi: 10.1061/(ASCE)0733-9429(1997)123:2(149)
Choudhry, A., Mo, J.-O., Arjomandi, M., and Kelso, R. (2014). Effects of wake interaction on downstream wind turbines. Wind Eng. 38, 535–547. doi: 10.1260/0309-524X.38.5.535
Christensen, P. B., Glud, R. N., Dalsgaard, T., and Gillespie, P. (2003). Impacts of longline mussel farming on oxygen and nitrogen dynamics and biological communities of coastal sediments. Aquaculture 218, 567–588. doi: 10.1016/S0044-8486(02)00587-2
Christiansen, M. B., and Hasager, C. B. (2005). Wake effects of large offshore wind farms identified from satellite SAR. Remote Sens. Environ. 98, 251–268. doi: 10.1016/j.rse.2005.07.009
Coates, D. A., Deschutter, Y., Vincx, M., and Vanaverbeke, J. (2014). Enrichment and shifts in macrobenthic assemblages in an offshore wind farm area in the Belgian part of the North Sea. Mar. Environ. Res. 95, 1–12. doi: 10.1016/j.marenvres.2013.12.008
Coffey, C., and Richartz, S. (2003). The EU Habitats Directive: Generating Strong Responses. Institute for European Environmental Policy.
De Borger, E., Ivanov, E., Capet, A., Braeckman, U., Vanaverbeke, J., Grégoire., M., et al. (2020a). Offshore windfarm footprint of sediment organic matter mineralization processes. Front. Mar. Sci. 2021.
De Borger, E., Tiano, J., Braeckman, U., Rijnsdorp, A. D., and Soetaert, K. (2020b). Impact of bottom trawling on sediment biogeochemistry: a modelling approach. Biogeosci. Discuss. 18, 1–32. doi: 10.5194/bg-2020-328
De Mesel, I., Kerckhof, F., Norro, A., Rumes, B., and Degraer, S. (2015). Succession and seasonal dynamics of the epifauna community on offshore wind farm foundations and their role as stepping stones for non-indigenous species. Hydrobiologia 756, 37–50. doi: 10.1007/s10750-014-2157-1
Degraer, S., Braeckman, U., Haelters, J., Hostens, K., Jacques, T., Kerckhof, F., et al. (2009). Studie betreffende het opstellen van een lijst van potentiële Habitatrichtlijngebieden in het Belgische deel van de Noordzee. Eindrapport in opdracht van de Federale Overheidsdienst Volksgezondheid, Veiligheid van de Voedselketen en Leefmilieu. Directoraat-generaal Leefmilieu, Brussel.
Delhez, E., and Carabin, G. (2001). Integrated modelling of the Belgian coastal zone. Estuar. Coast. Shelf Sci. 53, 477–491. doi: 10.1006/ecss.1999.0628
Egbert, G. D., Erofeeva, S. Y., and Ray, R. D. (2010). Assimilation of altimetry data for nonlinear shallow-water tides: quarter-diurnal tides of the northwest european shelf. Continent. Shelf Res. 30, 668–679. doi: 10.1016/j.csr.2009.10.011
Eikeset, A. M., Mazzarella, A. B., Davidsdottir, B., Klinger, D. H., Levin, S. A., Rovenskaya, E., et al. (2018). What is blue growth? The semantics of “Sustainable Development” of marine environments. Mar. Policy 87, 177–179. doi: 10.1016/j.marpol.2017.10.019
Essink, K. (1999). Ecological effects of dumping of dredged sediments; options for management. J. Coast. Conserv. 5, 69–80. doi: 10.1007/BF02802741
Evans, D. (2012). Building the European Union's Natura 2000 network. Nat. Conserv. 1:11. doi: 10.3897/natureconservation.1.1808
Fettweis, M., and Van den Eynde, D. (2003). The mud deposits and the high turbidity in the Belgian-Dutch coastal zone, southern bight of the North Sea. Continent. Shelf Res. 23, 669–691. doi: 10.1016/S0278-4343(03)00027-X
Forster, R. (2018). The Effect of Monopile-Induced Turbulence on Local Suspended Sediment Patterns Around UK Wind Farms: Field Survey Report. An IECS report to The Crown Estate.
Grashorn, S., and Stanev, E. V. (2016). Kármán vortex and turbulent wake generation by wind park piles. Ocean Dyn. 66, 1543–1557. doi: 10.1007/s10236-016-0995-2
Houziaux, J., Kerckhof, F., Degrendele, K., Roche, M., and Norro, A. (2008). The Hinder Banks: Yet an Important Area for the Belgian Marine Biodiversity? ("HINDERS"). Belgian Science Policy Office, Final report-research in the framework of the BELSPO programme.
Irion, G., and Zöllmer, V. (1999). Clay mineral associations in fine-grained surface sediments of the North Sea. J. Sea Res. 41, 119–128. doi: 10.1016/S1385-1101(98)00041-0
Ivanov, E., Capet, A., Barth, A., Delhez, E. J., Soetaert, K., and Grégoire, M. (2020). Hydrodynamic variability in the Southern Bight of the North Sea in response to typical atmospheric and tidal regimes. Benefit of using a high resolution model. Ocean Modell. 154:101682. doi: 10.1016/j.ocemod.2020.101682
Kerckhof, F., Rumes, B., Jacques, T., Degraer, S., and Norro, A. (2010). Early development of the subtidal marine biofouling on a concrete offshore windmill foundation on the thornton bank (southern North Sea): first monitoring results. Underw. Technol. 29, 137–149. doi: 10.3723/ut.29.137
Komusanac, I., Daniel, F., and Guy, B. (2019). “Wind energy in Europe in 2019-trends and statistics,” in Wind Europe. Technical report. doi: 10.13140/RG.2.2.11631.38562
Krone, R., Gutow, L., Joschko, T. J., and Schröder, A. (2013). Epifauna dynamics at an offshore foundation-implications of future wind power farming in the North Sea. Mar. Environ. Res. 85, 1–12. doi: 10.1016/j.marenvres.2012.12.004
Laevastu, T. (1963). Surface Water Types of the North Sea and Their Characteristics. American Geographical Society of New York.
Lefaible, N., Braeckman, U., and Moens, T. (2018). Effects of Wind Turbine Foundations on Surrounding Macrobenthic Communities. Environmental Impacts of Offshore Wind Farms in the Belgian Part of the North Sea: Assessing and Managing Effect Spheres of Influence. Brussels: Royal Belgian Institute of Natural Sciences, OD Natural Environment, Marine Ecology and Management Section, 57–77.
Lindeboom, H., Kouwenhoven, H., Bergman, M., Bouma, S., Brasseur, S., Daan, R., et al. (2011). Short-term ecological effects of an offshore wind farm in the Dutch coastal zone; a compilation. Environ. Res. Lett. 6:035101. doi: 10.1088/1748-9326/6/3/035101
Lindström, G., Pers, C., Rosberg, J., Strömqvist, J., and Arheimer, B. (2010). Development and testing of the HYPE (Hydrological Predictions for the Environment) water quality model for different spatial scales. Hydrol. Res. 41, 295–319. doi: 10.2166/nh.2010.007
Mercier, C., and Delhez, E. (2007). Diagnosis of the sediment transport in the Belgian Coastal Zone. Estuar. Coast. Shelf Sci. 74, 670–683. doi: 10.1016/j.ecss.2007.05.010
Mirto, S., La Rosa, T., Danovaro, R., and Mazzola, A. (2000). Microbial and meiofaunal response to intensive mussel-farm biodeposition in coastal sediments of the western Mediterranean. Mar. Pollut. Bull. 40, 244–252. doi: 10.1016/S0025-326X(99)00209-X
Neill, S. P., and Hashemi, M. R. (2013). Wave power variability over the northwest European shelf seas. Appl. Energy 106, 31–46. doi: 10.1016/j.apenergy.2013.01.026
Rennau, H., Schimmels, S., and Burchard, H. (2012). On the effect of structure-induced resistance and mixing on inflows into the Baltic Sea: a numerical model study. Coast. Eng. 60, 53–68. doi: 10.1016/j.coastaleng.2011.08.002
Schillings, C., Wanderer, T., Cameron, L., van der Wal, J. T., Jacquemin, J., and Veum, K. (2012). A decision support system for assessing offshore wind energy potential in the North Sea. Energy Policy 49, 541–551. doi: 10.1016/j.enpol.2012.06.056
Sherwood, C. R., Aretxabaleta, A. L., Harris, C. K., Rinehimer, J. P., Verney, R., and Ferré, B. (2018). Cohesive and mixed sediment in the Regional Ocean Modeling System (ROMS v3. 6) implemented in the Coupled Ocean-Atmosphere-Wave-Sediment Transport Modeling System (COAWST r1234). Geosci. Model Dev. 11, 1849–1871. doi: 10.5194/gmd-11-1849-2018
Simpson, J., Tett, P., Argote-Espinoza, M., Edwards, A., Jones, K., and Savidge, G. (1982). Mixing and phytoplankton growth around an island in a stratified sea. Continent. Shelf Res. 1, 15–31. doi: 10.1016/0278-4343(82)90030-9
Slavik, K., Lemmen, C., Zhang, W., Kerimoglu, O., Klingbeil, K., and Wirtz, K. W. (2019). The large-scale impact of offshore wind farm structures on pelagic primary productivity in the southern North Sea. Hydrobiologia 845, 35–53. doi: 10.1007/s10750-018-3653-5
Tolman, H. L. (1989). The Numerical Model WAVEWATCH: A Third Generation Model for Hindcasting of Wind Waves on Tides in Shelf Seas. Faculty of Civil Engineering, Delft University of Technology. doi: 10.1061/9780872626874.037
Toussaint, E., De Borger, E., Braeckman, U., De Backer, A., Soetaert, K., and Vanaverbeke, J. (2021). Faunal and environmental drivers of carbon and nitrogen cycling along a permeability gradient in shallow North Sea sediments. Sci. Total Environ. 767:144994. doi: 10.1016/j.scitotenv.2021.144994
van der Molen, J., Smith, H. C., Lepper, P., Limpenny, S., and Rees, J. (2014). Predicting the large-scale consequences of offshore wind turbine array development on a North Sea ecosystem. Continent. Shelf Res. 85, 60–72. doi: 10.1016/j.csr.2014.05.018
Van Lancker, V. (2009). SediCURVE@ SEA: a multiparameter sediment database, in support of environmental assessments at sea.
Vanaverbeke, J., Braeckman, U., De Borger, E., Mavraki, N., Toussaint, E. E., Voet, H., et al. (2020). “Towards estimating the biogeochemical footprint of an offshore windfarm,” in Ocean Sciences Meeting 2020 (San Diego, CA: AGU).
Vanhellemont, Q., and Ruddick, K. (2014). Turbid wakes associated with offshore wind turbines observed with Landsat 8. Remote Sens. Environ. 145, 105–115. doi: 10.1016/j.rse.2014.01.009
Verfaillie, E., Van Lancker, V., and Van Meirvenne, M. (2006). Multivariate geostatistics for the predictive modelling of the surficial sand distribution in Shelf seas. Contin. Shelf Res. 26, 2454–2468. doi: 10.1016/j.csr.2006.07.028
Warner, J. C., Armstrong, B., He, R., and Zambon, J. B. (2010). Development of a coupled ocean-atmosphere-wave-sediment transport (COAWST) modeling system. Ocean Modell. 35, 230–244. doi: 10.1016/j.ocemod.2010.07.010
Wilson, R. J., Speirs, D. C., Sabatino, A., and Heath, M. R. (2018). A synthetic map of the northwest European Shelf sedimentary environment for applications in marine science. Earth Syst. Sci. Data 10, 109–130. doi: 10.5194/essd-10-109-2018
Winterwerp, J. C., and van Kesteren, W. G. M. (2004). Introduction to the Physics of Cohesive Sediment in the Marine Environment. New York, NY: Elsevier, 466.
Wu, X., Hu, Y., Li, Y., Yang, J., Duan, L., Wang, T., et al. (2019). Foundations of offshore wind turbines: a review. Renew. Sustain. Energy Rev. 104, 379–393. doi: 10.1016/j.rser.2019.01.012
Keywords: offshore wind farms, coupled models, COAWST, filtration model, sediment modeling, carbon deposition flux, blue mussel, biodeposition
Citation: Ivanov E, Capet A, De Borger E, Degraer S, Delhez EJM, Soetaert K, Vanaverbeke J and Grégoire M (2021) Offshore Wind Farm Footprint on Organic and Mineral Particle Flux to the Bottom. Front. Mar. Sci. 8:631799. doi: 10.3389/fmars.2021.631799
Received: 20 November 2020; Accepted: 03 May 2021;
Published: 02 June 2021.
Edited by:
Christian Grenz, UMR7294 Institut Méditerranéen d'océanographie (MIO), FranceReviewed by:
Carsten Lemmen, Helmholtz Centre for Materials and Coastal Research (HZG), GermanyNafsika Papageorgiou, University of Crete, Greece
Copyright © 2021 Ivanov, Capet, De Borger, Degraer, Delhez, Soetaert, Vanaverbeke and Grégoire. This is an open-access article distributed under the terms of the Creative Commons Attribution License (CC BY). The use, distribution or reproduction in other forums is permitted, provided the original author(s) and the copyright owner(s) are credited and that the original publication in this journal is cited, in accordance with accepted academic practice. No use, distribution or reproduction is permitted which does not comply with these terms.
*Correspondence: Evgeny Ivanov, ZXZnZW55Lml2YW5vdkB1bGllZ2UuYmU=