
94% of researchers rate our articles as excellent or good
Learn more about the work of our research integrity team to safeguard the quality of each article we publish.
Find out more
ORIGINAL RESEARCH article
Front. Mar. Sci., 09 April 2021
Sec. Marine Fisheries, Aquaculture and Living Resources
Volume 8 - 2021 | https://doi.org/10.3389/fmars.2021.631732
This article is part of the Research TopicCurrent Challenges in Providing Early Warning of Harmful Algal and Microbiological Risk to AquacultureView all 13 articles
 Keith Davidson1*
 Callum Whyte1
 Dmitry Aleynik1
 Andrew Dale1
 Steven Gontarek1
 Andrey A. Kurekin2Sharon McNeill1
 Peter I. Miller2Marie Porter1Rachel Saxon1
 Sarah Swan1
We present an on-line early warning system that is operational in Scottish coastal waters to minimize the risk to humans and aquaculture businesses in terms of the human health and economic impacts of harmful algal blooms (HABs) and their associated biotoxins. The system includes both map and time-series based visualization tools. A “traffic light” index approach is used to highlight locations at elevated HAB/biotoxin risk. High resolution mathematical modelling of cell advection, in combination with satellite remote sensing, provides early warning of HABs that advect from offshore waters to the coast. Expert interpretation of HAB, biotoxin and environmental data in light of recent and historical trends is used to provide, on a weekly basis, a forecast of the risk from HABs and their biotoxins to allow mitigation measures to be put in place by aquaculture businesses, should a HAB event be imminent.
Harmful algal blooms (HABs) are primarily natural phenomena that are characterized by increases in the density of certain phytoplankton species that are harmful to human use of the marine environment (Smayda, 1990). In many locations, these blooms are of particular concern to the finfish and shellfish aquaculture industries. The phytoplankton genera that are detrimental to these two related sectors are, in general, distinct.
Some HAB species cause “shellfish poisoning” that results from the human consumption of shellfish that have ingested toxic cells and then bio-accumulated the toxin within their flesh (Davidson and Bresnan, 2009; Berdalet et al., 2016). This significant danger has led to an extensive monitoring effort to minimize human health risk. For example, in the EU it is a regulatory requirement to monitor both the abundance of the causative phytoplankton and the concentration of biotoxins within shellfish flesh on a regular basis (Davidson et al., 2011). Harvesting restrictions are applied until toxins return below safe threshold levels and the shellfish are again fit for consumption.
Farmed fish are impacted, in general, by different HAB species through physical interference, de-oxygenation or ichthyotoxicity. While the vectoring of toxin to humans through fish consumption can occur (Berdalet et al., 2016), this is of most concern to wild fisheries in tropical latitudes (e.g., ciguatera fish poisoning). Hence, the impact of HABs on the large fish aquaculture operations of high latitude fjordic countries (Norway, Scotland, Chile, and Canada) is primarily economic, as a result of fish kills.
Early warning of the timing, location and magnitude of HABs and their associated biotoxins is of great value to coastal zone managers and the aquaculture industry, informing business planning and ensuring the protection of both human and fish health (Anderson et al., 2001, 2016; Davidson et al., 2016). Martino et al. (2020) demonstrated that blooms of the toxin producing dinoflagellate Dinophysis result in the loss of 15% of turnover of the Scottish shellfish industry, a value of ∼£ (GBP) 1.4 million. The Scottish finfish aquaculture sector is considerably larger in value, £ (GBP) 468 million direct gross value added (Scottish Government, 2020), but the financial impact of HABs are less easily determined due to the commercial sensitivity of fish kill data. However, studies in similar fjordic regions elsewhere have demonstrated the significant impact of HABs on the fish farming sector. For example, a HAB event killed eight million salmon in northern Norway in 2019 with a direct value of over 850 million NOK (Davidson et al., 2020), and a massive fish kill in Chile in 2016 following a bloom of the dictyochophyte Pseudochattonella caused the mortality of 39 million salmon with $ (USD) 800 million of economic impact (Anderson and Rensel, 2016).
Regulatory monitoring for shellfish biotoxin producing HAB species and their associated toxins is undertaken in most shellfish producing countries, typically on a weekly basis. In Scotland, this is overseen by the competent authority, Food Standards Scotland (FSS), and operated by CEFAS (biotoxins) and SAMS (phytoplankton), respectively.
The financial cost of HAB and biotoxin monitoring at all shellfish farms is prohibitive. Regulators therefore typically monitor only a representative sub-set of farms. In Scotland, this is carried out according to a “Pod” system. A Pod usually includes a number of relatively closely located shellfish-producing sites, for example, all the farms within a single fjordic sea loch. Within each Pod, a Representative Monitoring Point (RMP) is chosen that is considered representative of the Pod as a whole. A biotoxin result over the regulatory limit at this point will result in the closure of all the farms within the Pod.
While this approach is generally capable of safeguarding human health, it is not infallible. For example, in 2013, a large bloom of Dinophysis impacted the Scottish Shetland Islands where much of the country’s shellfish aquaculture is concentrated. It resulted in a very rapid increase in shellfish toxicity to high levels in less than the 1-week monitoring window (Figure 1). This led to toxin-contaminated mussels being harvested and consumed. Seventy people reported shellfish toxicity symptoms to food safety authorities, although the number affected is likely to be substantially higher. Subsequent analysis of this bloom (Whyte et al., 2014) indicated that it developed offshore and was rapidly advected by strong wind-driven westerly currents to the coastline where it impacted the aquaculture businesses.
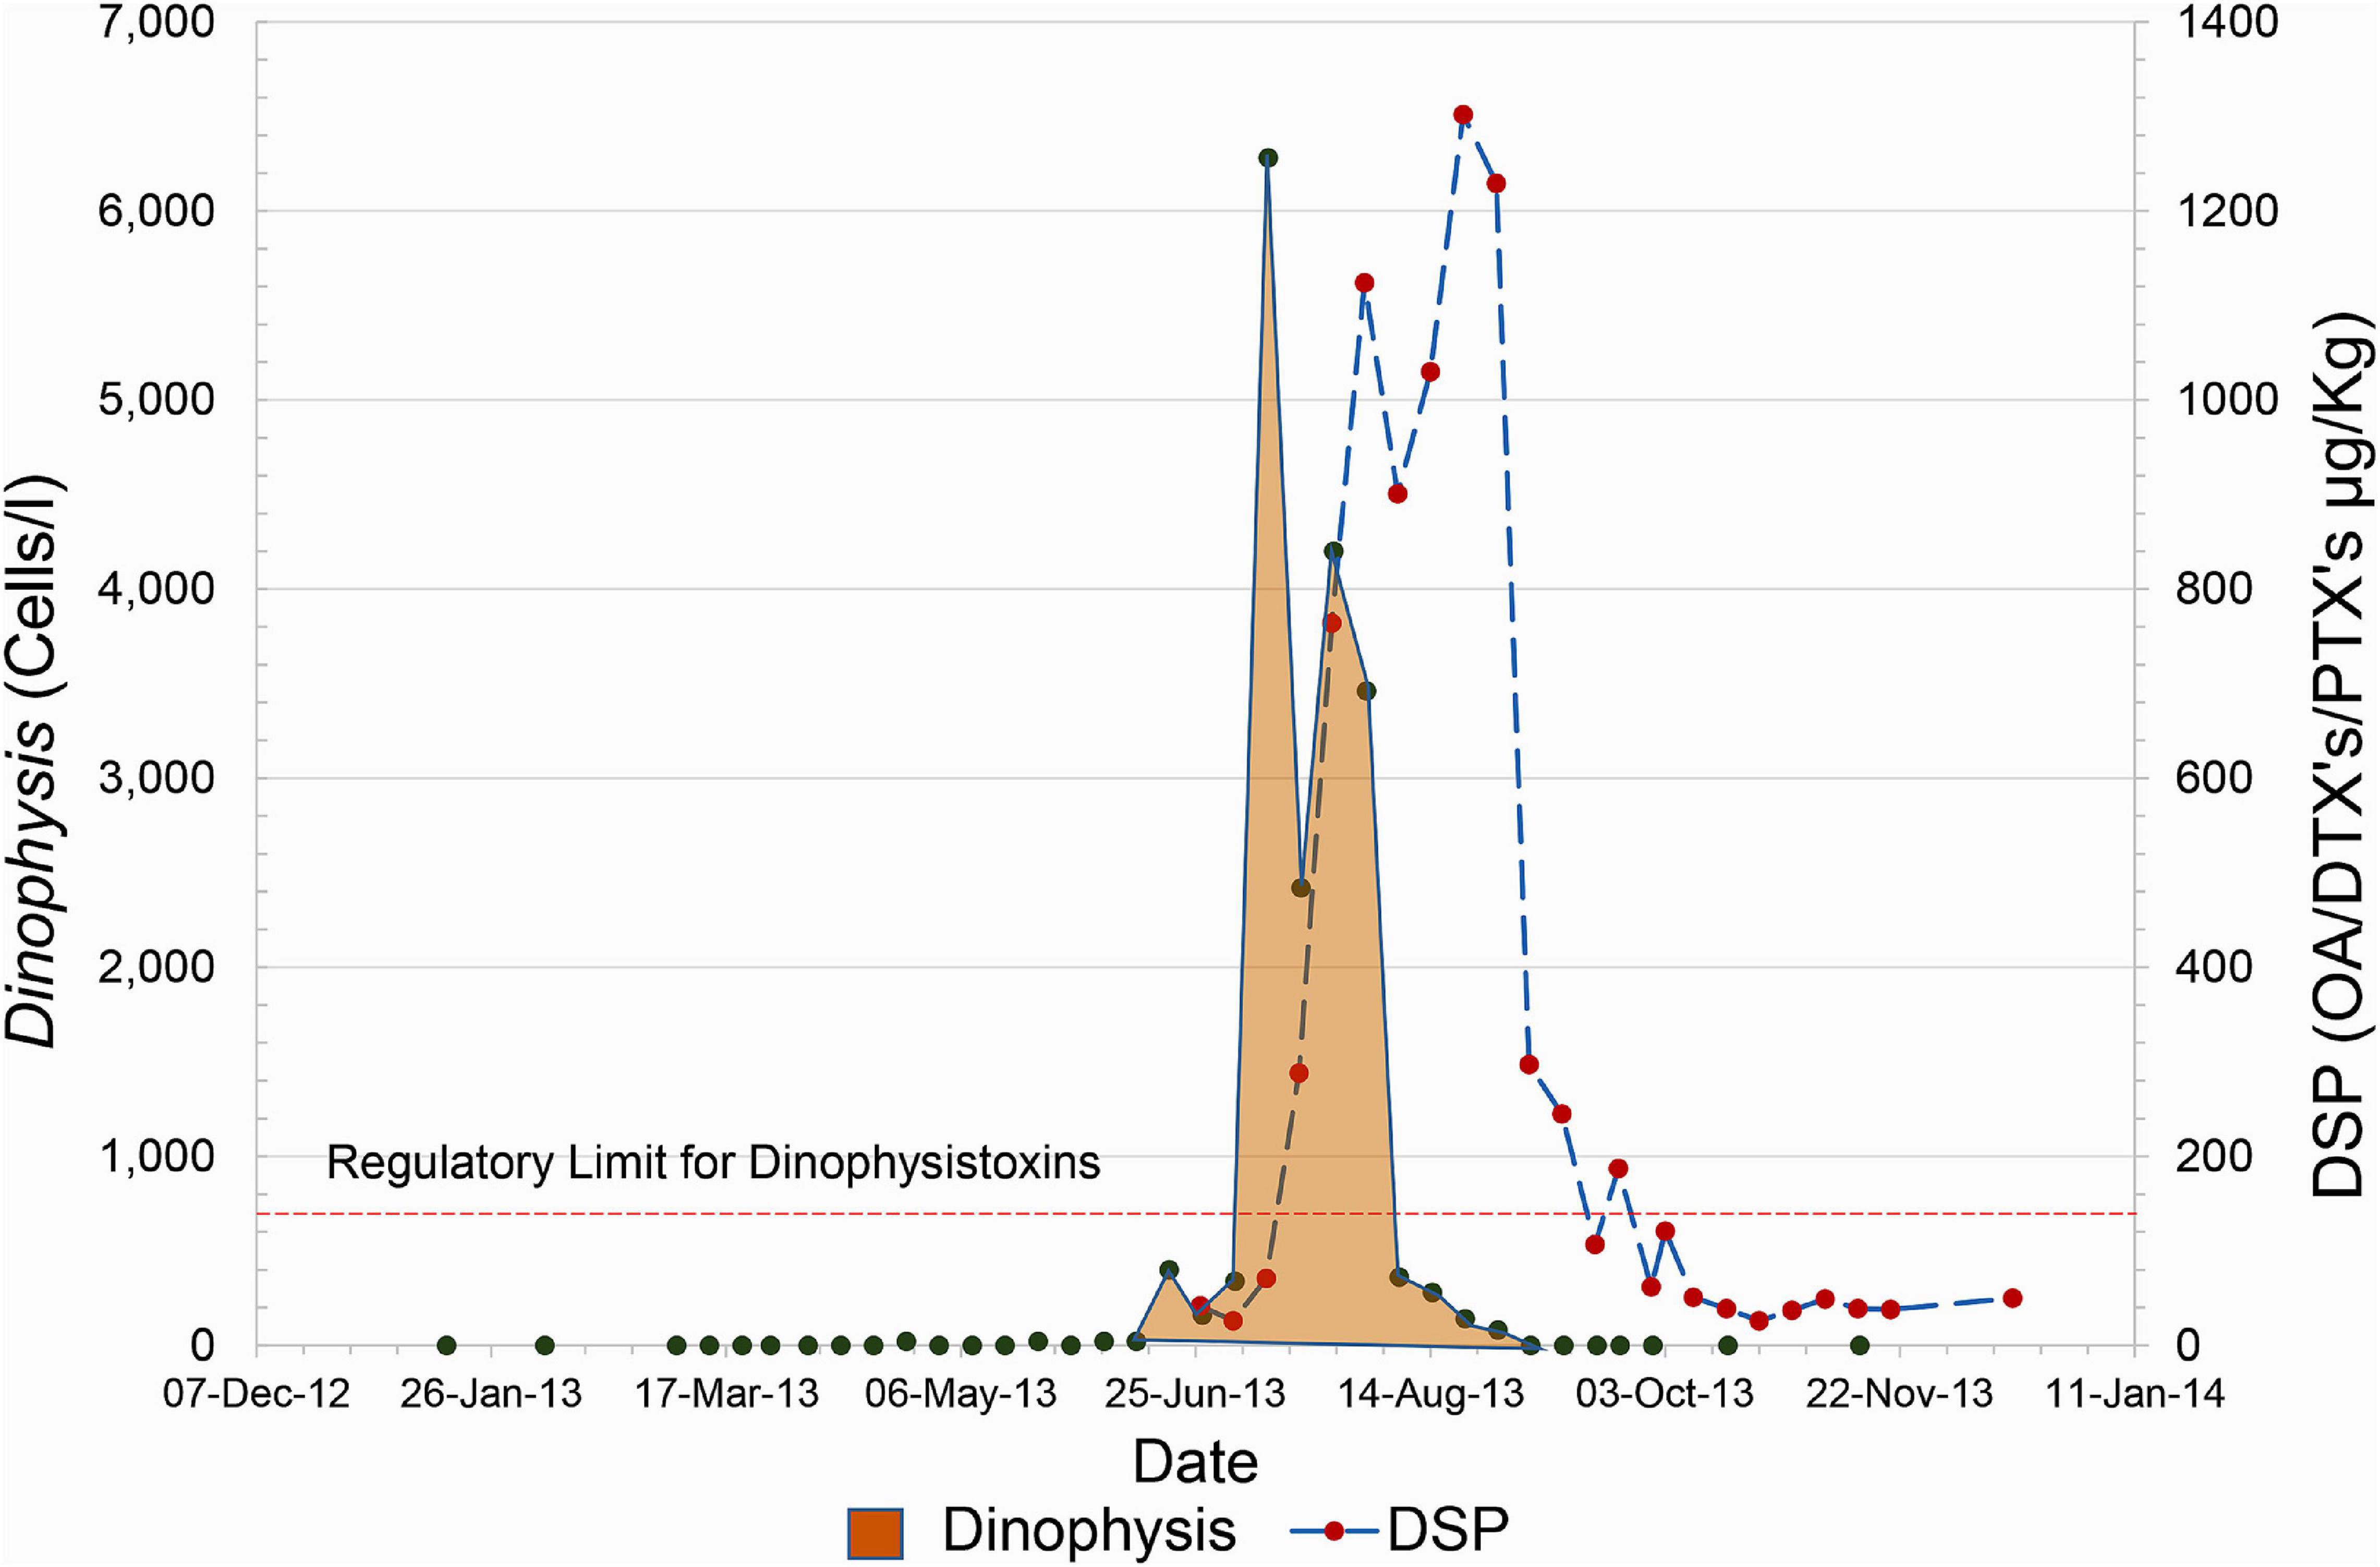
Figure 1. An example of the rapid rise of Dinophysis and associated toxins that occurred during the summer of 2013. The plot shown represents the evolution of the bloom in the site, East of Linga, however, this rapid increase was mirrored in sites along the West coast of the Shetland Islands.
Given, the significance of this event in terms of human health and public perception of shellfish safety, it led to increased effort to develop an early warning system for HABs in Scottish waters. Achieving this goal is, however, far from straightforward as different HAB genera exhibit different life cycles and changing density and toxicity (Berdalet et al., 2016; Wells et al., 2020). Variability in local or regional oceanography or hydrography is also thought to be critical to bloom location and timing (Gowen et al., 1998; Smayda, 2002; Paterson et al., 2017).
In Scottish waters there are eight different species/genera of HABs that are of concern in relation to their capacity to cause shellfish poisoning (Davidson et al., 2011), the most prevalent being Dinophysis, Pseudo-nitzschia, and Alexandrium; responsible for diarrhetic, amnesic and paralytic shellfish poisoning, respectively. The dinoflagellate Karenia mikimotoi (Davidson et al., 2009) and dense (spiny) diatom blooms (Bruno et al., 1989; Treasurer et al., 2003) are of greatest concern in relation to the health of farmed fish.
The EU FP7 “Applied Simulations and Integrated Modelling for the Understanding of Harmful Algal Blooms” (ASIMUTH) project developed a prototype HAB alert system for various locations on the western seaboard of Europe. This was achieved by combining regulatory phytoplankton monitoring and biotoxin data with satellite remote sensing and other information on current, recent, or modelled future marine conditions. In Scotland, HAB risk bulletins were prepared weekly, based on expert interpretation of the various data streams, for use by the aquaculture industry. Through a number of subsequent grants plus Scottish Government and aquaculture industry funding, we have further developed these early warning tools to provide a more advanced HAB and biotoxin alert system for Scottish waters as described here.
We produce four linked products all freely available to the aquaculture industry, other stakeholders and the general public through the https://www.HABreports.org/website. These are:
(1) An interactive, web-map based, spatial and temporal display of current and historical trends in HABs and biotoxins.
The website is written in HTML5, PHP and JavaScript: it utilizes the OpenLayers JavaScript Library to provide the main mapping functionality, along with the Proj4 JS Library to provide on-the-fly projection functionality between GPS Longitude\Latitude and the British National Grid projection. In addition, it uses a number of other JavaScript libraries to provide layout and charting capabilities. The backend data source for the map data is a PostgreSQL\PostGIS database, hosted on the SAMS Scientific Database server.
The monitoring data used to create the interactive web map are updated weekly from two sources: an excel format report detailing FSS regulatory monitoring biotoxin results generated by CEFAS, and the most recent regulatory HAB counts generated by SAMS. The data are consolidated by loading both into a single Microsoft Access database, where the data are checked for errors. Static map images (png) can then be bulk-exported for each species and toxin, for use in the weekly PDF bulletin (see section “Materials and Methods” below).
Forecast data for areas of interest, in the form of modelled particle tracking (see section “Discussion” below) is retrieved from the SAMS modelling cluster and incorporated into the Access database. These data are then uploaded to the backend database of the HABreports website, along with the PDF report, and are made available for download.
(2) A detailed risk assessment and HAB/biotoxin forecast bulletin for the Shetland Islands, which has the country’s greatest density of shellfish aquaculture.
The content of the bulletin, and the approach to data interpretation and display within it, was determined through discussion with industry (primarily the trade association Seafood Shetland) at a range of stakeholder meetings over several years. The bulletin takes the form of a PDF document that is available for download from the HABreports website and is also emailed directly to registered stakeholders.
The bulletin summarizes the current information relating to HAB and biotoxin concentrations in the Shetland Islands and includes a suite of data products that industry have indicated are of use to them when making harvesting and husbandry decisions.
Harmful algal bloom events can be advective in nature with blooms developing offshore and then being driven to the coast by means of winds and currents. While we can use a combination of remote sensing and modelling to forecast high biomass, fish killing K. mikimotoi, the low biomass shellfish toxin producers such as Dinophysis are not suitable for this approach as they cannot be detected by satellite. The bulletin therefore includes information on their densities at coastal monitoring sites and meteorological and oceanographic conditions, to provide an indication of when conditions may be suitable to promote onshore advection of these genera and hence when risk is elevated. Wind information is updated, using a combination of the wind direction and speed from the Shetland meteorological stations at Sumburgh and Scatsa. These data are presented as wind roses for the current time and for the preceding 3 weeks. A summary of the previous month is also provided. We also subset forecast currents from the Mercator-IBI36 model (Sotillo et al., 2015).
Industry is also interested in water temperature, as temperature-based stratification can often promote harmful blooms and relates to, for example, increases in the abundance of the parasites that cause amoebic gill disease. Hence, daily sea surface temperatures maps produced with the Multi-Satellite aggregated MUR-SST 1 km gridded dataset (Armstrong et al., 2012) provided by NASA Jet Propulsion Laboratory in Pasadena CA are also presented for the previous 5 days.
Charts of six-hourly wind, rain and temperature predictions for the next 3 days over the Shetland and Orkney region are based on localized implementation of a high-resolution 3-level nested Weather Research Forecasting WRF v4 model (Skamarock et al., 2008) run operationally at SAMS.
Satellite chlorophyll images that provide an indication of total phytoplankton biomass are generated using the OCEANCOLOUR_ATL_CHL_L4_NRT_OBSERVATIONS_009 _0937 product obtained from the CMEMS1 portal and based on satellite observations daily interpolated onto a 1 km grid by merging data from sensors on board SeaWiFS, MODIS-Aqua, MERIS, VIIRSN, and OLCI-S3A satellites.
These data also assist in the provision, within the bulletin, of an “expert interpretation” based forecast that applies our ecological understanding of HAB dynamics in Scottish waters. Expert interpretation is by its very nature at least a partially qualitative process, but one that relies on scientific understanding of the ecological and hydrodynamic processes underpinning blooms of the different harmful genera impacting a region.
(3) A web-based application of the FSS Toxin Traffic Light Guidance (TTLG) that quantifies risk at individual shellfish harvesting sites.
In 2014 FSS (then as part of the United Kingdom wide Food Standards Agency) developed a decision matrix to help food business operators (FBOs) in Scotland assess the safety of the shellfish they produce for human consumption (FSA, 2014). The matrix is populated with FSS Official Control monitoring program data from the Access database outlined in Section “Introduction” above. A flow diagram outlining the steps required to calculate the index (for Dinophysis) is presented in Supplementary Figure 1. The calculated output of the matrix known as the “Toxin Traffic Light Guidance” (TTLG) indicates the harvesting action and testing considerations that should follow. Based on the outcome of the TTLG decision matrix a green, amber or red risk is generated. Associated actions are:
• Green: no increase in end-product testing, the FBO should maintain routine verification checks.
• Amber: increased frequency of end-product testing or positive release.
• Red: cease harvesting unless there is evidence available that the product is safe.
(4) A mathematical model/satellite/coastal monitoring-based early warning system for advective HABs.
Our approach to achieve early warning of blooms that develop offshore is the satellite remote sensing-based detection of the bloom, followed by the application of a mathematical model to predict its subsequent temporal and spatial evolution. Within the HABreports website, we therefore currently provide an early warning system for fish killing K. mikimotoi, as this species can reach sufficiently high cell densities that it can be detected by satellite.
Remote sensing is undertaken using the HAB classification methodology of Kurekin et al. (2014), in which a linear discriminant analysis classifier is trained to identify ocean colour characteristics of known K. mikimotoi bloom events. The classifier is designed to identify HAB species in satellite images that dominate the phytoplankton ensemble and have a high cell concentration. It uses a machine learning approach to identify classification features from example satellite images of algal blooms, selected manually by browsing for matchups with historical records of HAB events. Visual masking of the location of “harmful bloom,” “non-harmful bloom,” and “no bloom” pixels forms the training dataset that is applied to calculate the parameters of the LDA classifier.
The classification is based on spectral features of the target phytoplankton species. In this study, the set of features comprised combinations of remote sensing reflectance (Rrs) from specific spectral bands of the MODIS sensor and spectral ratios of Rrs. A reduced subset of the most relevant features was automatically identified by an iterative Stepwise Discriminant Analysis (SDA) algorithm implemented in the statistical package “klaR” (Weihs et al., 2005). The selected features were used to classify satellite image pixels into “no bloom,” “non-harmful,” and “harmful” categories. An “unknown” class was added to represent water classes that are significantly different in spectral characteristics from any of known classes (Kurekin et al., 2014).
This classification methodology demonstrated its efficiency in solving complex HAB discrimination tasks with many unknown factors and errors in satellite measurements. The statistical approach based on the LDA classifier reduced the effect of errors in ocean colour measurements. Training of the classifier using examples of HAB events allowed us to incorporate different HAB properties and adapt to variability in pigment content and community size structure. Introduction of the “unknown” class contributed to better discrimination of water classes with high sediment or dissolved organic matter concentration, resulting in fewer false alarms.
We then classify each MODIS ocean colour scene in near-real time and compile a median composite HAB risk map for the last 7 days, in order to gain cloud-free coverage of most areas. We identify ‘particles’ that represent areas with an elevated HAB risk from the satellite classifier using a three-stage algorithm. Firstly, the “HAB risk” and “unknown class” likelihood maps are smoothed by applying a median filter of size 10 × 10 pixels (11 × 11 km). Secondly, map regions with “HAB risk” >0.6 and “unknown” likelihood <0.5 are selected as regions of elevated HAB risk. Finally, the image pixels in the selected regions are replaced with particles located on a regular grid of 22 km spacing. Each particle records the coordinates, HAB risk (“harmful” likelihood) value, date and time.
Shellfish biotoxin producing genera do not reach a sufficiently high cell density in Scottish waters to be visible from satellite remote sensing and hence their offshore detection is not possible. However, weekly cell counts obtained from the FSS regulatory monitoring program can be used to identify developing blooms in coastal locations. Modelling of the development of these blooms gives information on their potential to impact other aquaculture sites through transport on the coastal current.
Harmful algal bloom alerts from either remote sensing or coastal monitoring are then used to initiate the mathematical model-based HAB alert systems that predict the offshore-onshore advection or along-coast movement of these blooms within the aquaculture regions of Scotland.
On the west coast of the mainland (and adjacent islands) we use the WeStCOMS v2 model (Aleynik et al., 2016). This unstructured grid, free-surface, hydrostatic model is based on the open source Finite Volume Community Ocean Model (FVCOM) (Chen et al., 2011). As the WeStCOMS domain does not reach the Shetland Islands, an alternative approach was taken for this region using the 1/36° Iberian-Biscay-Irish Mercator-Ocean daily forecasting model IBI36QV5R1 with a regular horizontal grid spacing of approximately 2 km (Sotillo et al., 2015). This model will be referred to as Mercator-IBI36.
WeStCOMS-FVCOM provides the flexibility in mesh size distribution required to resolve the complex fjordic coastline and islands of the region, allowing enhanced predictions of bloom progression. The model’s open lateral boundaries are forced with output from a relatively high resolution (2 km) North-East Atlantic ROMS operational model, provided by the Marine Institute, Ireland (Dabrowski et al., 2016). Tides at the boundaries are derived from the Oregon State University inverse barotropic tidal solution (Egbert and Erofeeva, 2002). Fresh-water discharge and sea-surface forcing are supplied from a coupled regional Weather Research Forecasting (WRF v4) (Skamarock et al., 2008) system which we run simultaneously using a High Performance Computing system at SAMS.
To have confidence in our model predictions we validated the predictions and reliability of each model. Statistical evaluation of WeStCOMS performance is presented in Aleynik et al. (2016). A further validation of diffusion characteristics was performed in October 2019 in Loch Linnhe on the Scottish west coast using Rhodamine-WT dye, which was released into surface waters near the eastern shore (Dale et al., 2020). A CTD equipped with a rhodamine fluorometer was used to trace the dye during sequential transects.
To validate the performance of the Mercator-IBI36 model in Scottish waters, we undertook the deployment of 16 drifters east of the southern tip of Shetland, between 3°W and 4°W on 28th September 2015. The drifters consisted of eight Coastal Ocean Dynamics Experiment (CODE) style surface drifters and eight Surface Velocity Program (SVP) style drifters, drogued to follow the water at 15 m. Drifters were released in pairs of ‘surface’ and ‘drogued.’ Both styles of drifter followed the water with a downwind slip of approximately 0.1% of the wind speed (Niiler et al., 1995; Poulain and Gerin, 2019). In the model, we seeded the same number of neutrally buoyant virtual drifters at the same times, depths and locations as the actual drifters.
In the “Results” Section below, we demonstrate the use of the HABreports products through a series of examples.
The right-hand panel of the front page of the HABreports website consists of an interactive map of Scotland. Two exemplar versions of the front page are presented in Figure 2.
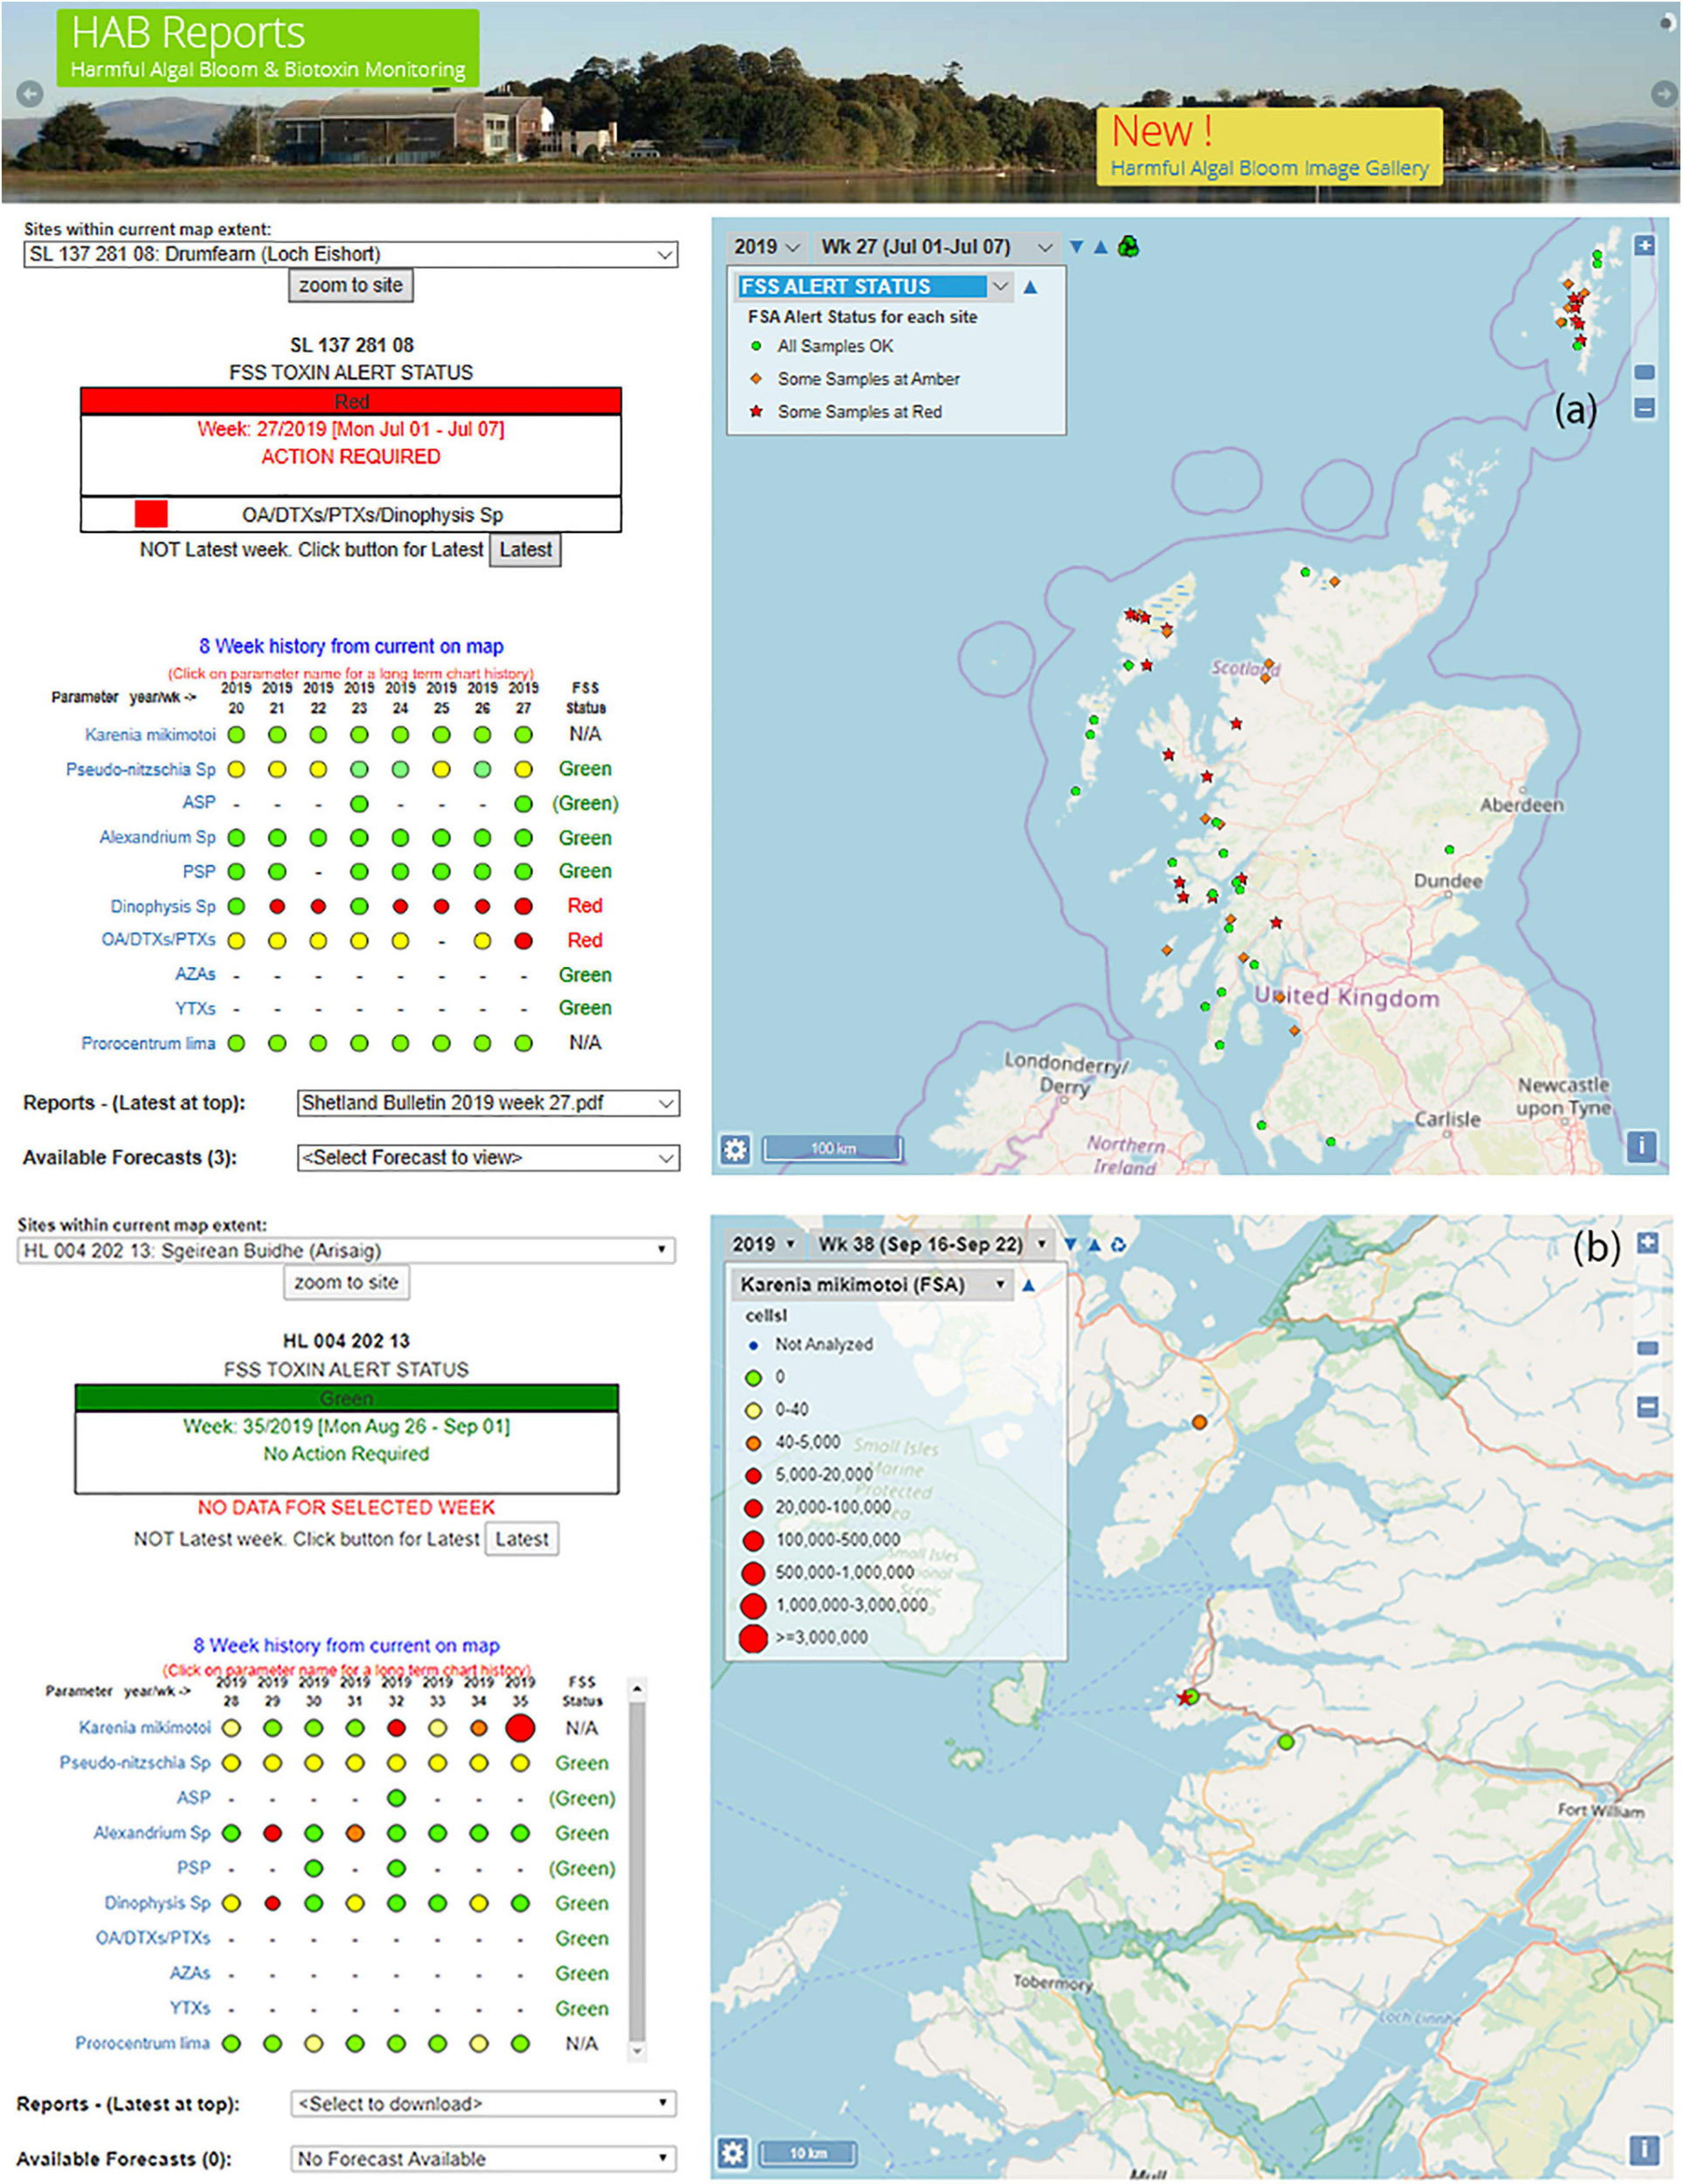
Figure 2. Views (a) of front page of the of HABreports.org website for (a) the week of 1st of July 2019 at which time the selected site (Loch Eishort) had a red TTLG alert due to elevated concentration of Dinophysis and its associated toxins and (b) an enlarged view of the map component of the HABreports web site in which the abundance concentration of Karenia mikimotoi exceed 2.5 M cells⋅L–1 for the week of 26th of August 2019 at the Arisaig site (star).
For easy interpretation, each monitored site is identified by one of three symbols. A green circle indicates that all HAB genus/species and associated biotoxins are below regulatory threshold. An amber diamond indicates that at least one HAB species or shellfish biotoxin is elevated, but still below regulatory threshold. A red star indicates that a parameter (HAB or biotoxin) exceeds regulatory threshold at the site (Figure 2a).
A drop-down menu allows the user to interrogate this information more closely by selecting any monitored species or toxin using a further system of colour- and size-coded circular symbols (Figure 2b). Blue indicates that the site was not monitored for the particular parameter in the week of interest. Green represents a zero count, yellow represents non-zero but low concentration, amber represents elevated concentrations that remain below regulatory threshold, and red indicates that the site is above regulatory threshold. The size of these red symbols increases with concentration, to allow easy identification of areas with the greatest risk. By hovering the cursor over a particular site in the map view, the user is able to confirm the site name and its unique FSS Site Identification Number (SIN). Information is also presented on the indicator shellfish species, the date of sample collection and the concentration of the parameter of choice (i.e., HAB genus/species or biotoxin).
There is also an option to interrogate the data for specific areas of the country in more detail. For any selected site, the HABreports website displays an 8-week summary of the status of each toxin and HAB organism (Figures 2a,b left-hand panel). By clicking on a specific parameter it is then possible to see the time series in both graphical and numerical form back to 2005 when monitoring began in its current form (not shown). This facility allows users to evaluate the inter-annual trends at particular locations.
On the basis of current funding, the detailed weekly risk assessment and forecast “bulletin” for the shellfish and finfish aquaculture industries is produced for the Shetland Islands, which account for ∼75% of Scotland’s shellfish production, but is easily extendable to other regions.
The bulletin currently runs to 12 pages summarizing HAB, biotoxin and environmental information and hence is not fully reproduced here. Rather, the pages that summarize HAB and shellfish biotoxin concentrations from the week of 1st July 2019 are presented as an example. These data are displayed in both map (Figure 3A) and schematic (Figure 3B) form. This graphical display allows industry to easily interpret results at their farm(s) in light of data from adjacent sites. Maps are also produced for the previous 3 weeks to allow easy visualization and interpretation of temporal trends. Maps of each HAB organism and associated toxin are displayed on an individual page, one above the other, to allow comparison between cells and associated toxicity and their temporal and spatial evolution.
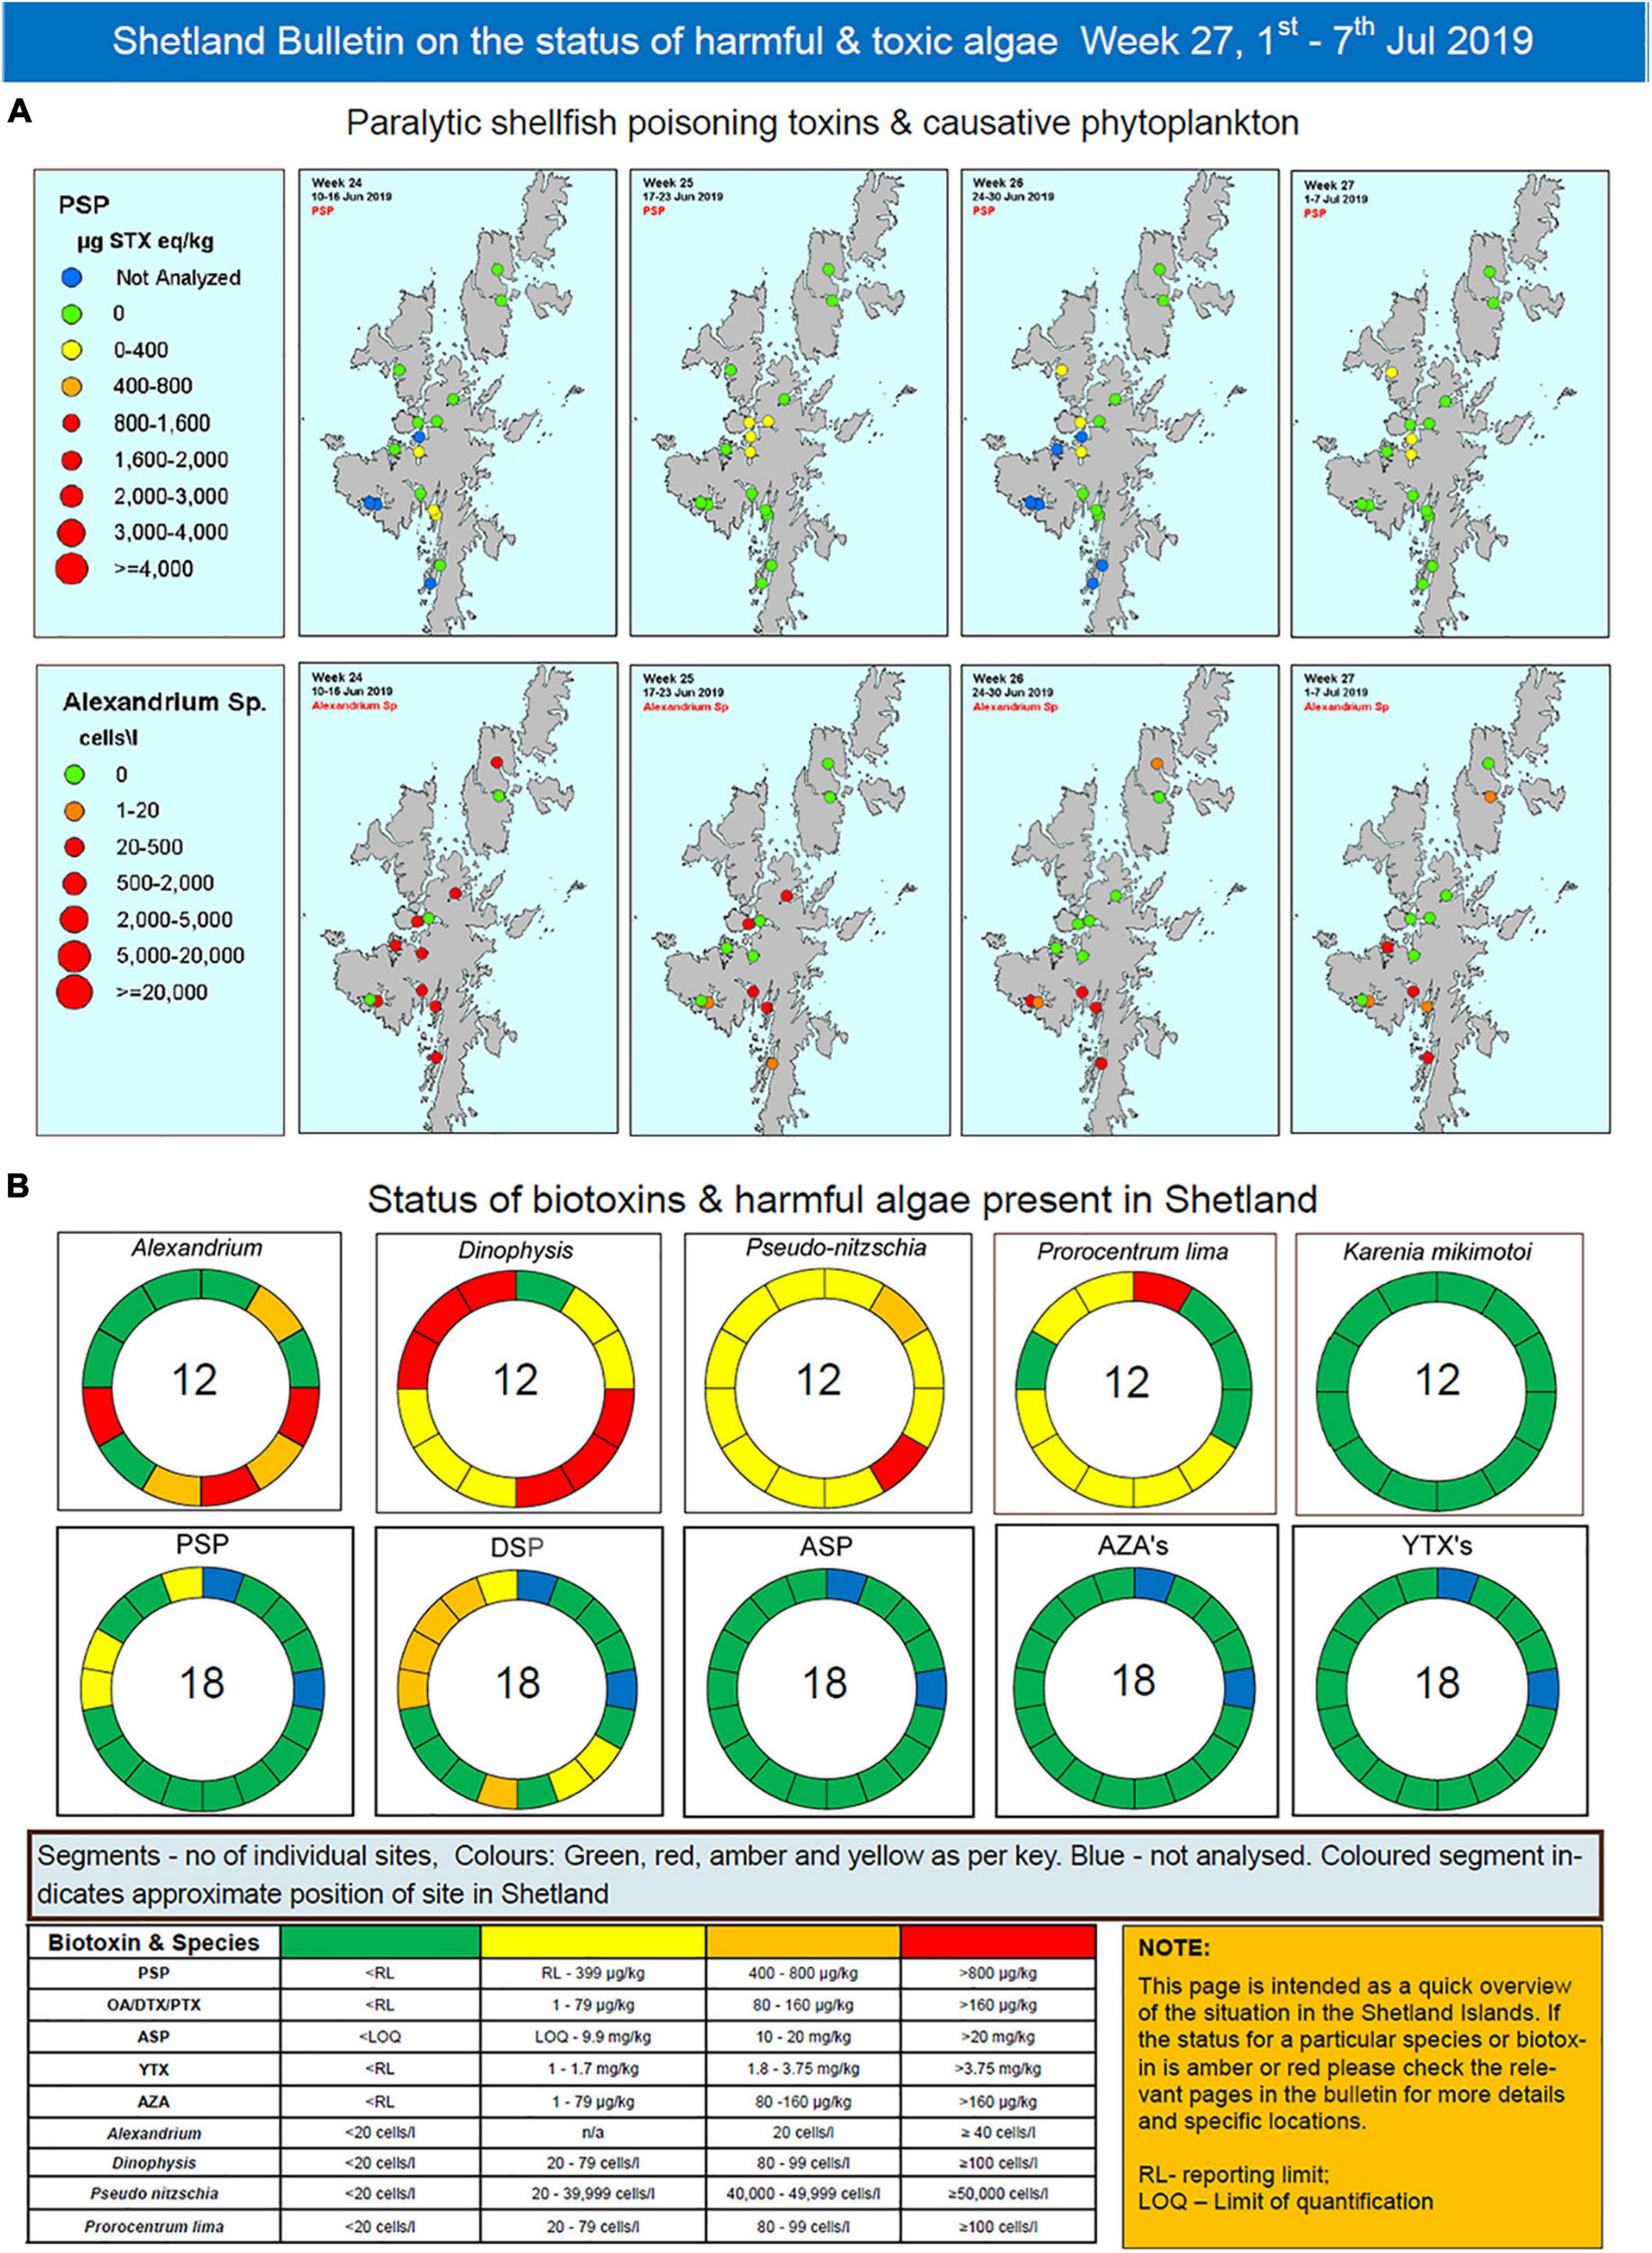
Figure 3. Exemplar pages from the detailed Shetland Islands bulletin for the week of 1st of July 2019 representing (A) a map based view of paralytic shellfish toxins and their causative phytoplankton (Alexandrium sp.) and (B) a schematic “donut” presentation of the Shetland Islands representing the locations and concentrations of the different species and toxins present.
Each weekly bulletin contains a summary page that reports the current state of the major HAB organisms and shellfish toxins. Based on expert interpretation of these data and the associated environmental information detailed above we provide a forecast for the following week of the HAB/biotoxin risk for the region. Figure 4 illustrates the combination of different relevant data streams that an “expert” might use in conjunction with their ecological understanding of a harmful species to produce a bloom/biotoxin forecast for the following week. Our success rate for predicting incidences of the three major shellfish toxin syndromes [Diarrhetic Shellfish Poisoning (DSP) from Dinophysis, Paralytic Shellfish Poisoning (PSP) from Alexandrium and Amnesic Shellfish Poisoning (ASP) from Pseudo-nitzschia] is presented in Table 1.
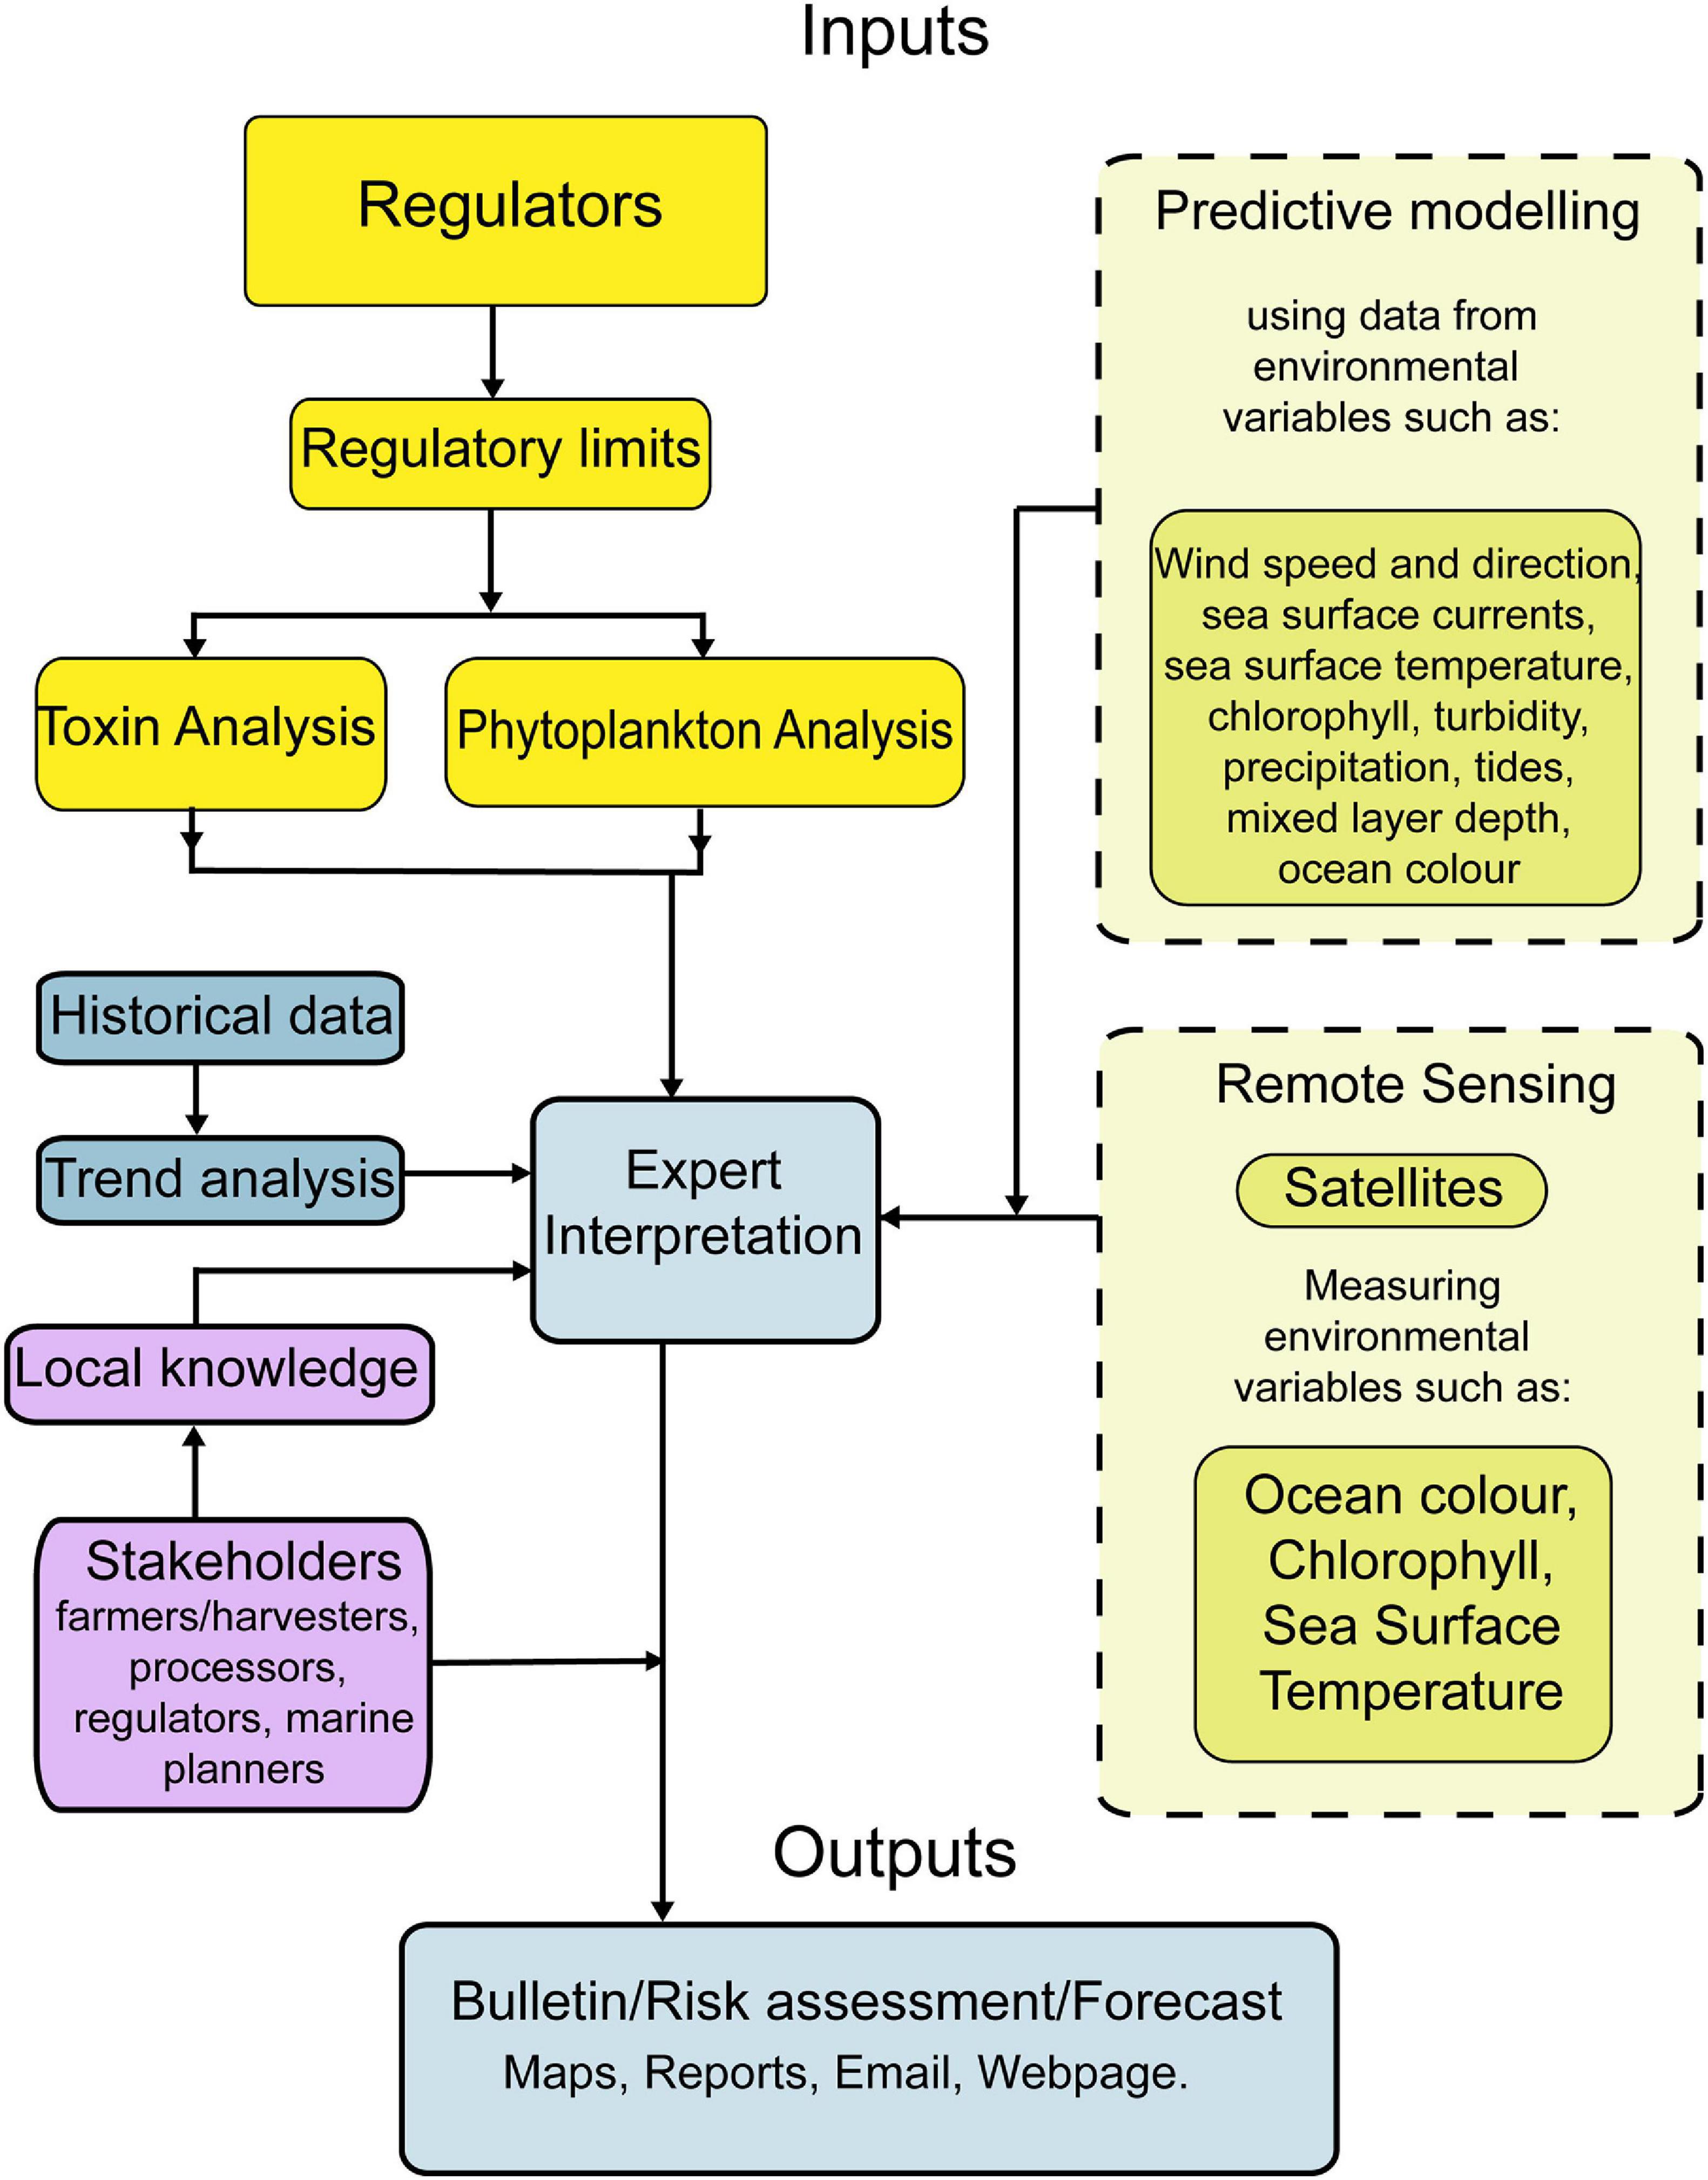
Figure 4. Data streams that contribute to the expert interpretation based HAB/biotoxin forecast.
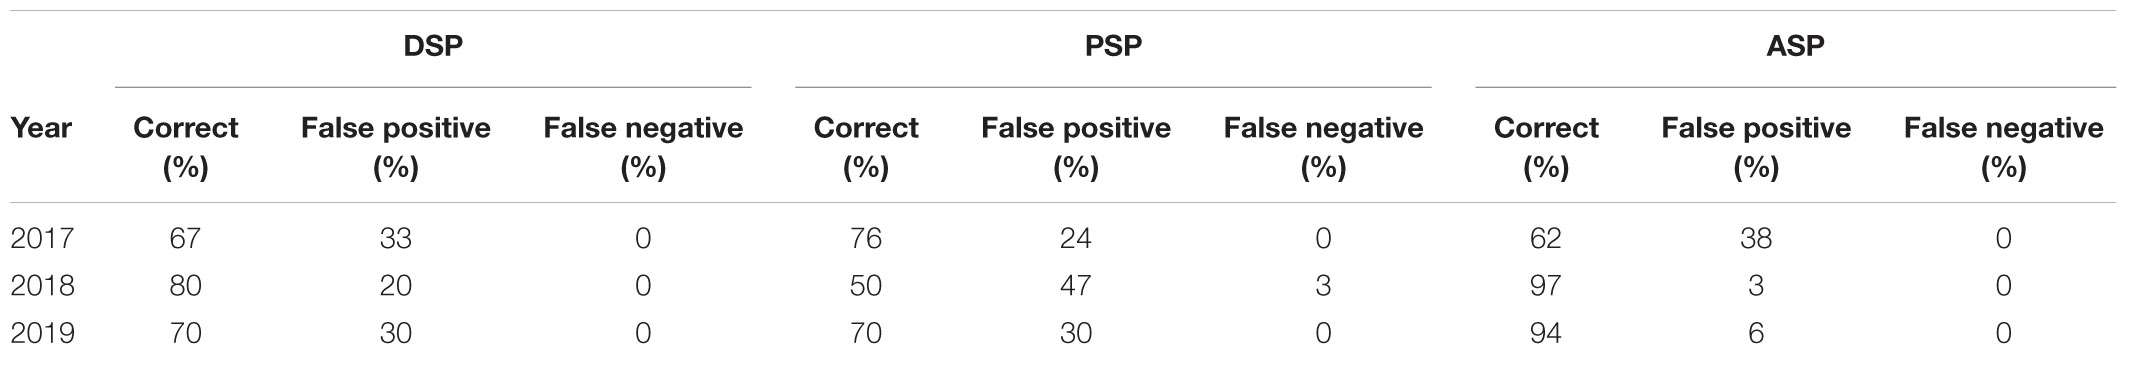
Table 1. Expert interpretation success for the HABreports system 2017–2019.
Supplementary Figure 4 illustrates a range of the predictive tools included within HABreports that may be used when determining the likelihood of an algal bloom. Below follows an example of how these sources of data may be used to support the development of a risk forecast. Supplementary Figures 4B,C show the forecasted sea surface currents for two consecutive days during week 26 (22–28 June 2020). A strong shelf-edge current can be seen in the top left of the diagram. Within the region of interest for forecasting, shown in close up in Supplementary Figure 4C, relatively strong surface currents can be seen flowing around the top of the Shetland Islands and down the eastern coast. Experience tells us that these currents often bring phytoplankton cells into the eastern voes. Additionally, from chlorophyll concentration measured in the waters around the Shetland Islands on the 23rd of June (Supplementary Figure 4A), we can see what appears to be a tongue of chlorophyll stretching along the edge of the Faroes-Shetland trough and extending around the northern coast of the Shetland Islands. This corresponds to an area of warmer, stratified surface water that can be seen in Supplementary Figure 4E. Finally, Supplementary Figure 4D shows the mean wind direction observed at the meteorological stations at Sumburgh and Scatsa airports on Shetland for the previous week. We can see that the prevailing winds came from the South East. Indeed, the prevailing wind for the previous 2 weeks was also from the East. Combining information from these various sources led us to predict that there would be a moderate to high probability of an accumulation of Pseudo-nitzschia cells in the north-easterly facing voes on Shetland during Week 26. As we can see in Supplementary Figure 4F, such an event did indeed occur with Pseudo-nitzschia reaching high concentrations in Dales Voe (red dot).
The TTLG decision matrix is presented in Figure 5. The left-hand side of the front page of the HABreports site (Figure 2) displays the calculated value of the TTLG for any selected location as red/amber/green.
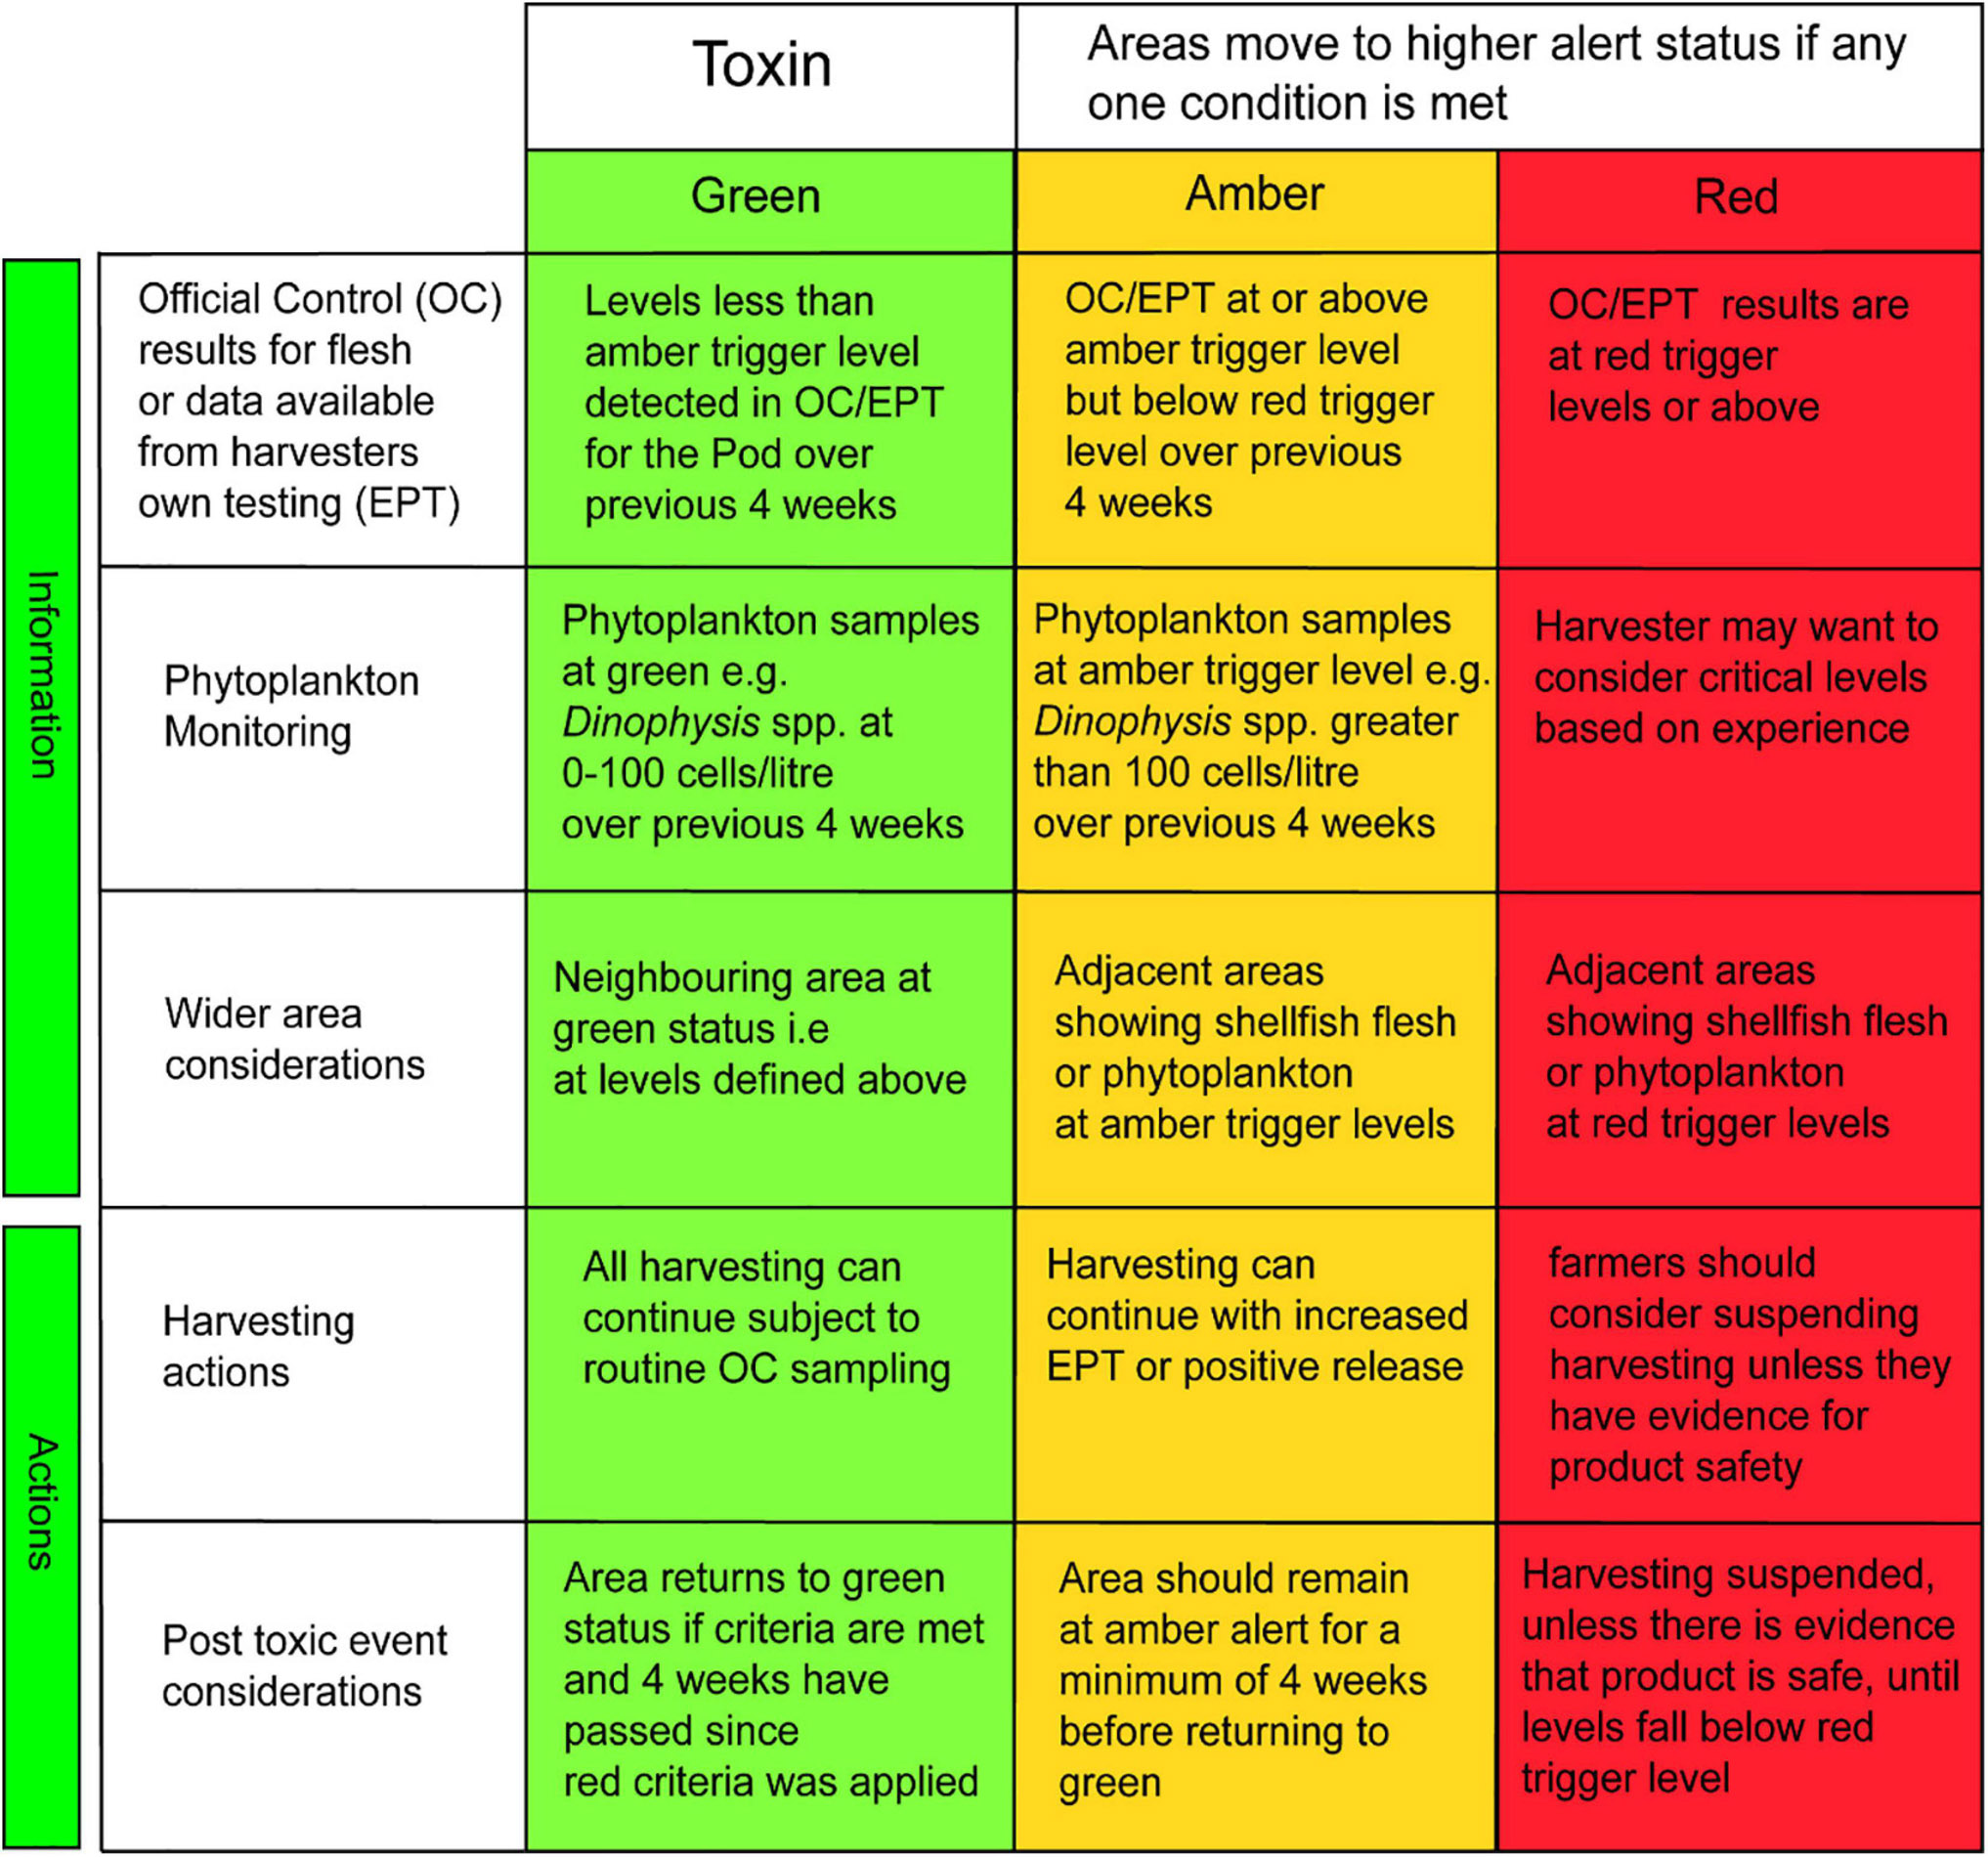
Figure 5. The TLTG decision matrix: separate specific matrices are used for each toxin/phytoplankton group based on their relevant trigger levels. Each matrix is split into two sections. The top three rows describe the information that should be available to the shellfish farmers regarding phytoplankton and toxin analysis at their site and in adjacent sites. The bottom two rows describe the recommended actions taken following a toxic outbreak.
Should there be a red or amber warning, the HABreports site also displays which parameters are elevated in concentration and hence have led to this result. In the example presented in Figure 2a the data generate a red TTLG warning on the basis of elevated Dinophysis and its toxins. Figure 2b demonstrates high abundance of K. mikimotoi, but this organism is not a shellfish toxin producer and hence does not influence the TTLG. Pseudo-nitzschia abundance is somewhat elevated, but only modestly, and as ASP toxins are low, the TTLG index is green in this case.
The TTLG and the map/time series displays give information on the current and historical status of HAB and biotoxin concentrations within a Pod. From this, a user can identify the course of action to take based on the current HAB/biotoxin status of their site, and assess current trends (for example, identify a developing harmful bloom) or evaluate historical precedent for harmful events at a particular location or time of year. However, while valuable, these tools are effectively a “now-cast.” To provide a forward-looking forecast it is necessary to utilize both mathematical modelling and expert interpretation, as discussed below.
The WeStCOMS model domain extends from the Isle of Man in the south to Cape Wrath in the north and about 30 miles west of the Hebrides (Figure 6). As noted above, validation of this model is reported by Aleynik et al. (2016). In the additional dye release experiments reported here, winds increased substantially from 2–3 ms–1 to 10 ms–1, with direction favorable for driving fresh surface waters across the loch toward the experimental region. This led to freshening of surface waters and downward displacement of dye-laden water, the timing of which were well represented in the model (Figure 7).
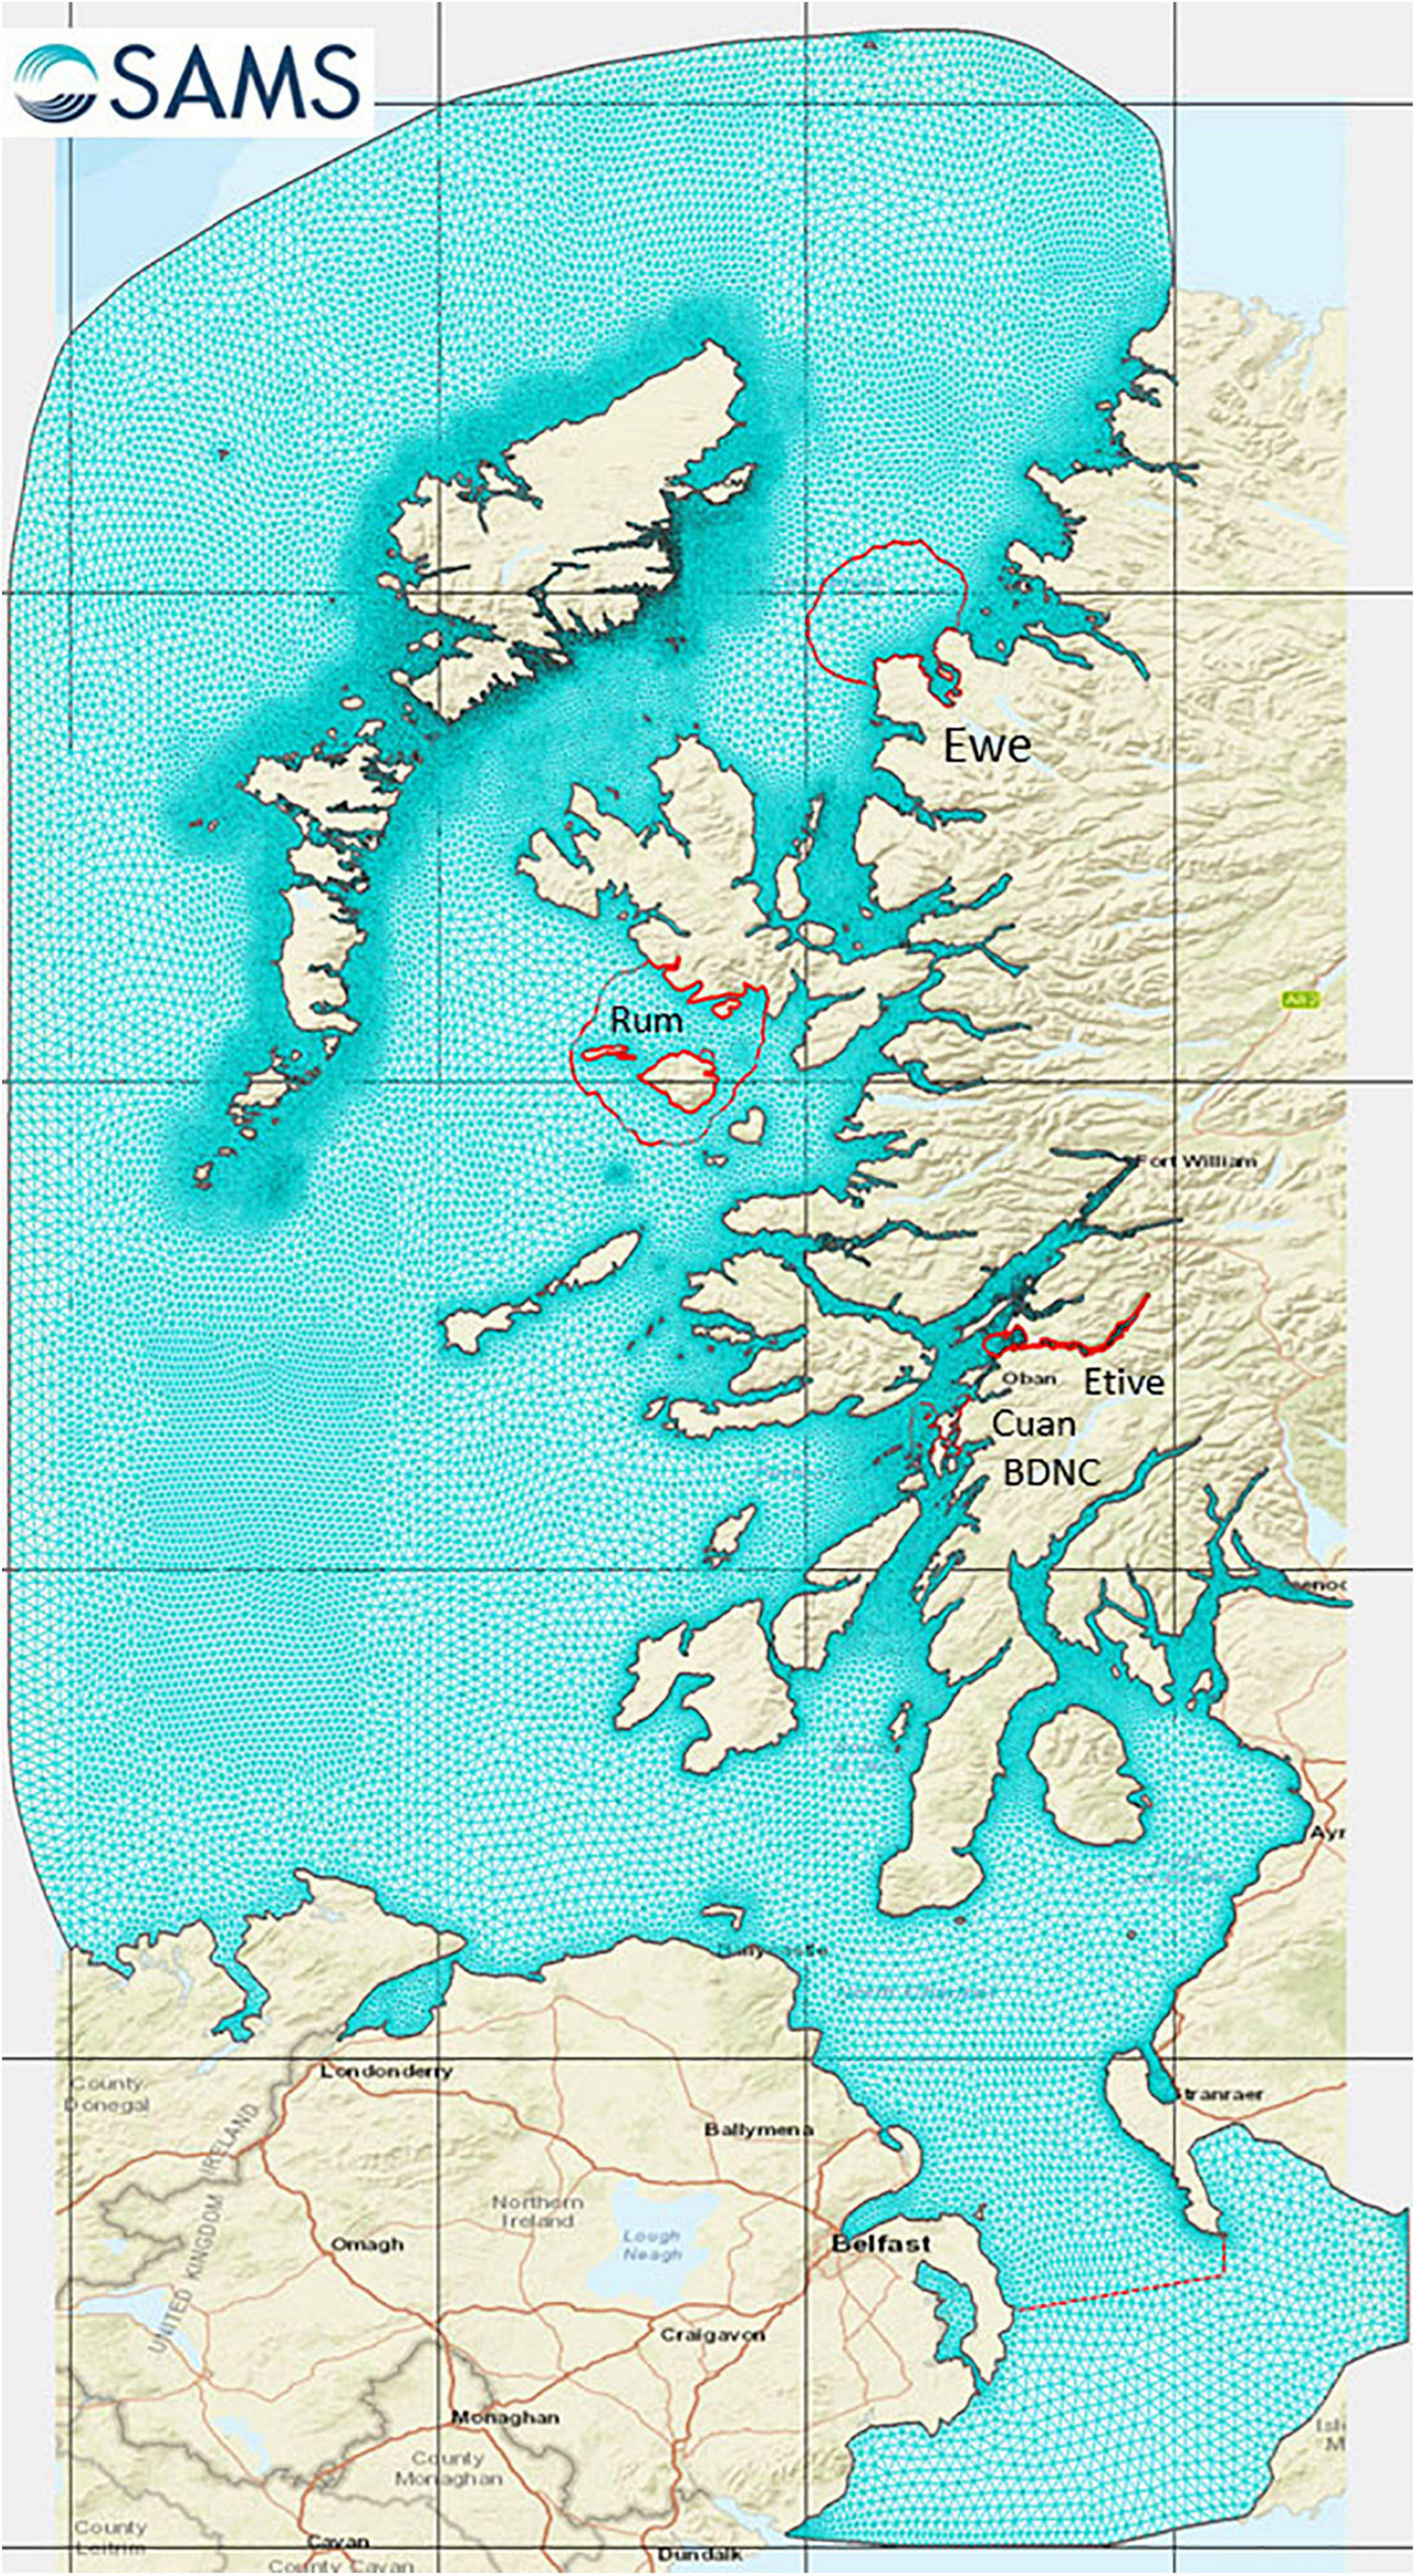
Figure 6. The West Scotland Coastal Ocean Modelling System (WeStCOMS-FVCOM) model domain.
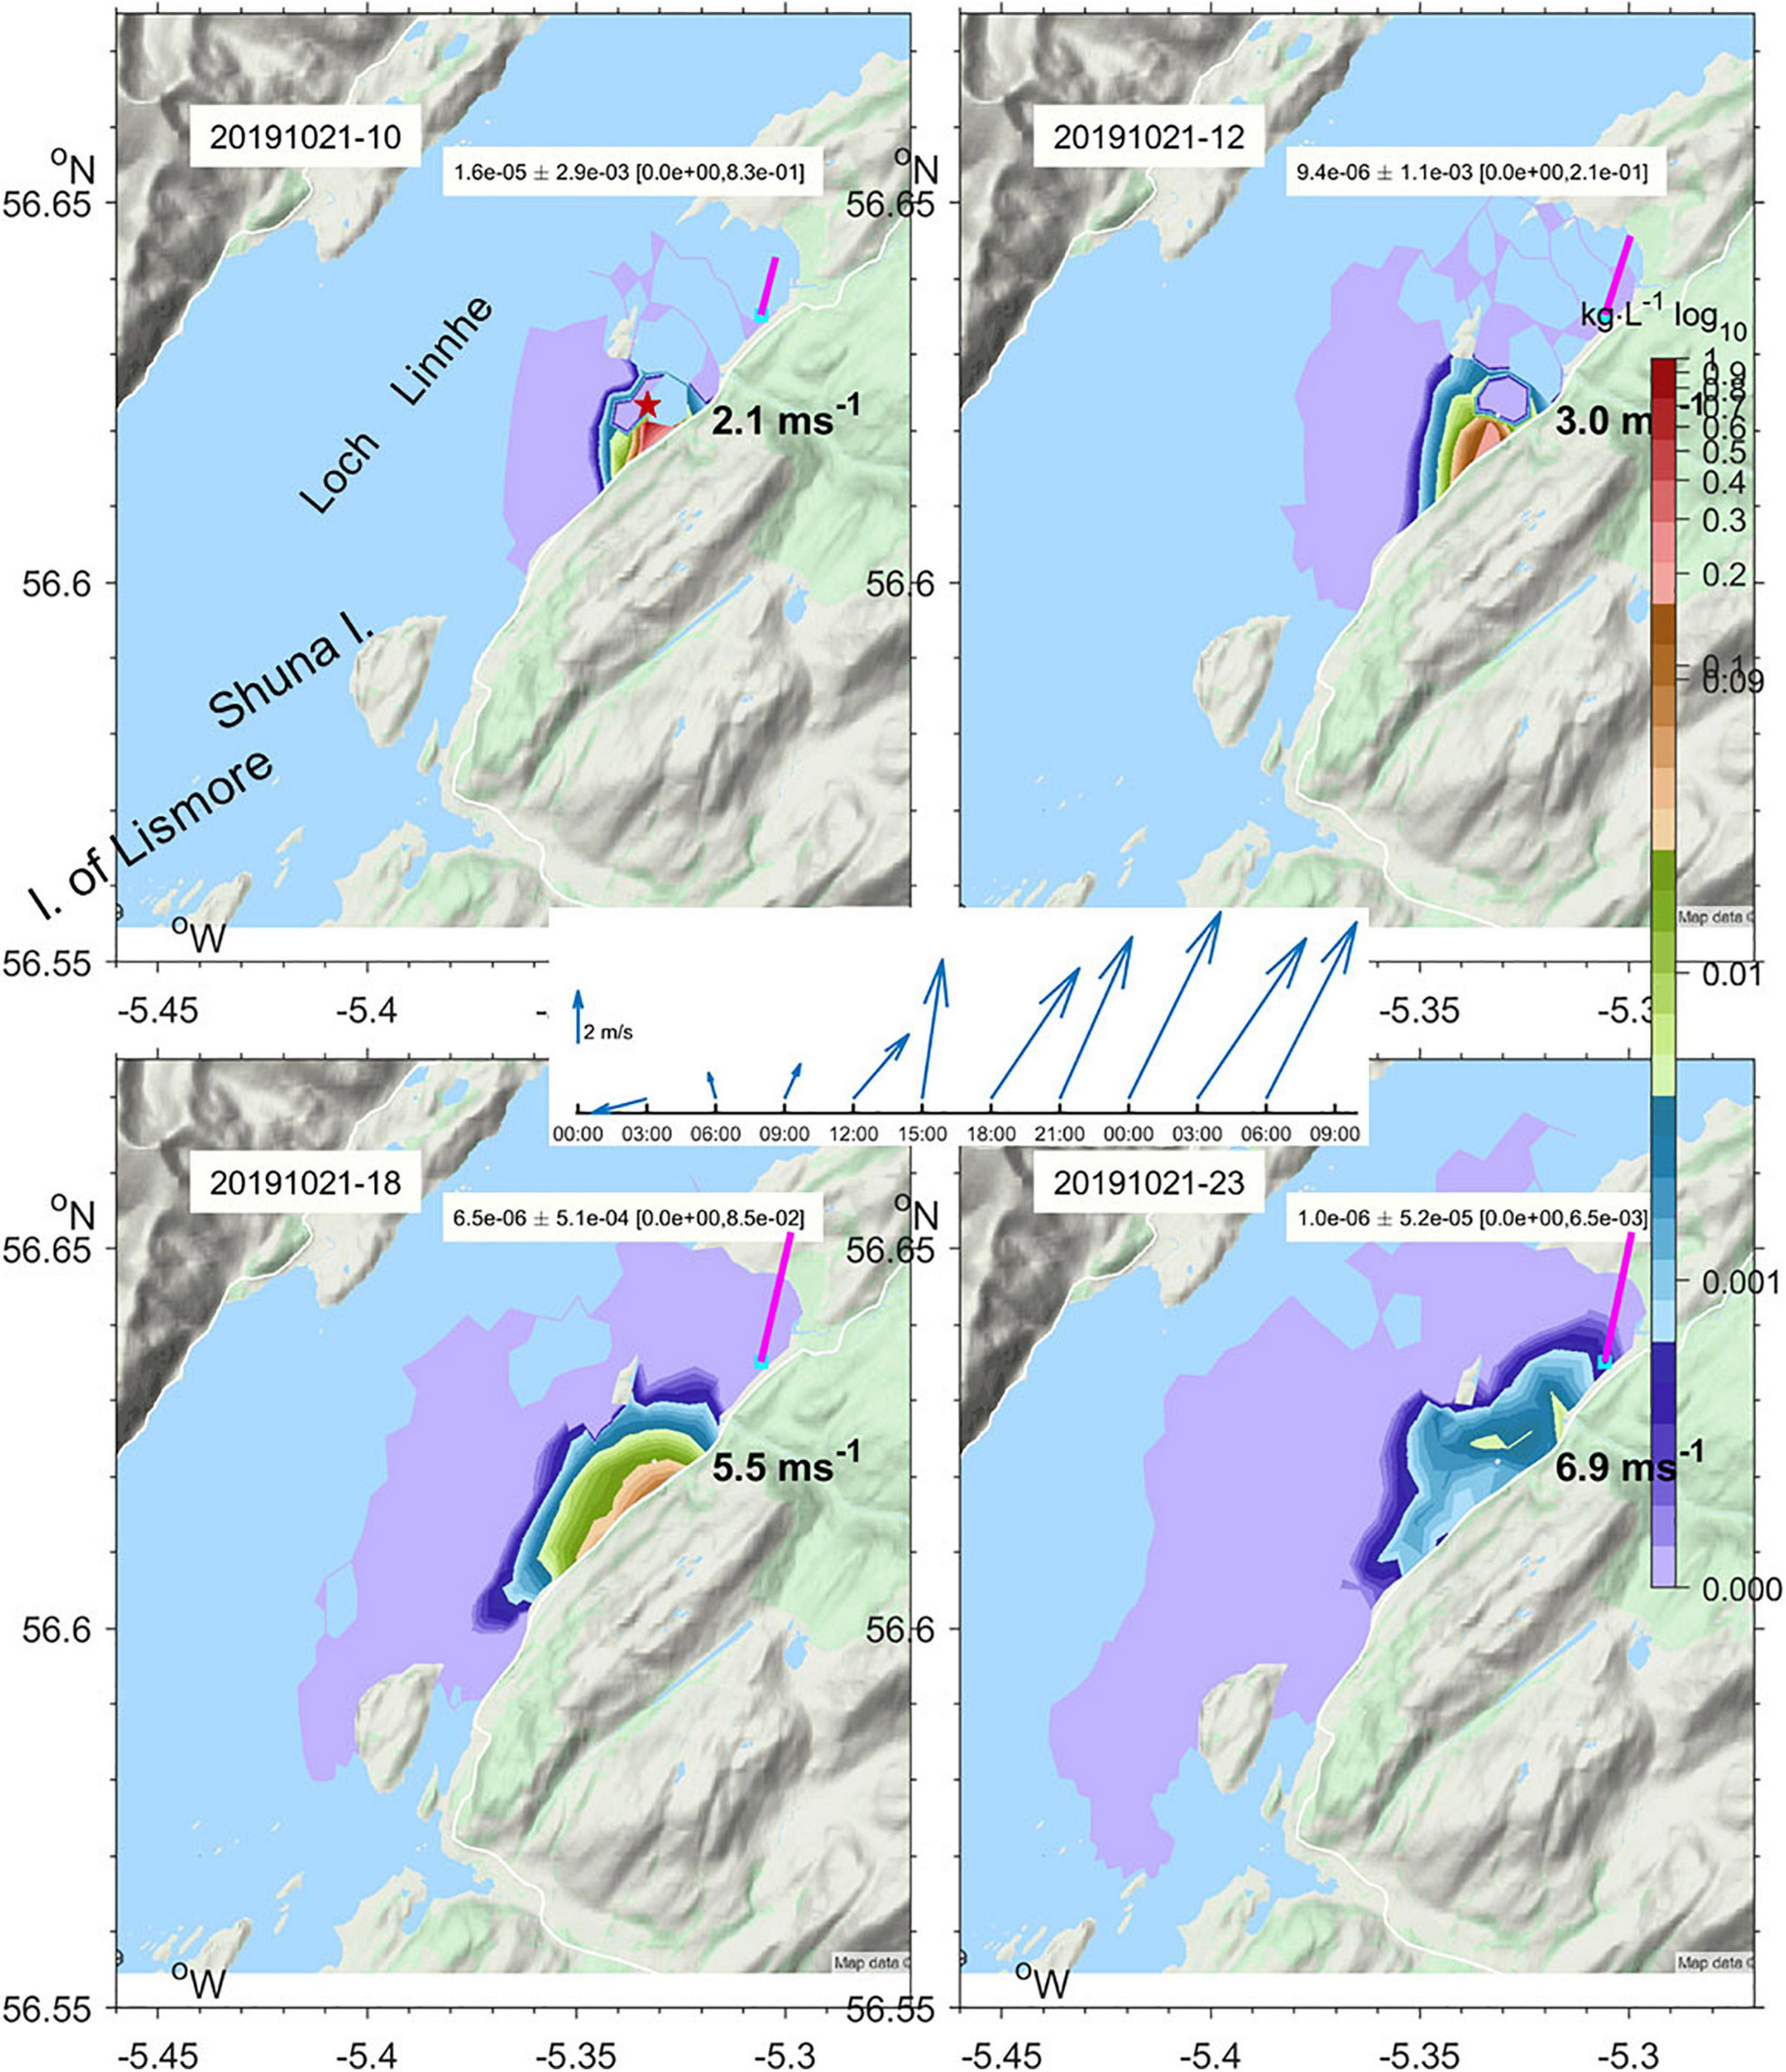
Figure 7. Subsurface maximum concentration of Rhodamine-WT Dye under the tide and prevailing wind (vectors) predicted by WeStCOMS v2 model on 21st October 2019 at 10, 12, 18, and 23 GMT. The site where dye was released at 09:21 is marked with a star.
For the Mercator-IBI36 model, validation also demonstrated good agreement between the reported drifter GPS location every hour from deployment as they tracked toward and beyond Shetland (Supplementary Figure 2). The tracks from real drifter fixes were sub-sampled to the nearest mid-day (12:00) and a ‘virtual drifter’ was advected for the next 24 h starting from the observed drifter location, then the iterations were repeated over several days as shown in Supplementary Figure 3. Thus, the model has a finite-difference scheme in space and an explicit 4th order Runge-Kutta scheme in time with the assumption that the modelled velocity field was stationary during discreet (hour-long) tracking time intervals. The distances between observed and ‘virtual’ drifter positions are summarized in Table 2. Good agreement between model and experiment was achieved with the modelling performance of the deeper drifters exceeding the shallow ones in terms of the virtual-observed separation distances after 2–3 weeks with averaged values (deep) Δr15 = 8.4 ± 6.0 and (shallow) Δr0 = 11.3 ± 8.7 km. After removal of the outliers (>2σ exceeding the averaged), model prediction deviations from the observed tracks further reduced (5.7 ± 2.9 and 7.3 ± 3.8 km, respectively, for lowered and sub-surface drifters). These estimates provide the expected error range in the predictions of virtual particle advection using the daily-averaged, sub-surface velocity field of the Mercator-IBI36 model. In complicated coastal environments, unstructured grid solutions often demonstrate better skill and a narrower range of separation distances (2.7–8 km) was achieved for WeStCOMS-based simulations of SVP drifters released during the summer 2013 FASTNET experiment (Aleynik et al., 2016), which remained within the cloud of virtual drifters over several days in relatively calm weather and tide conditions.
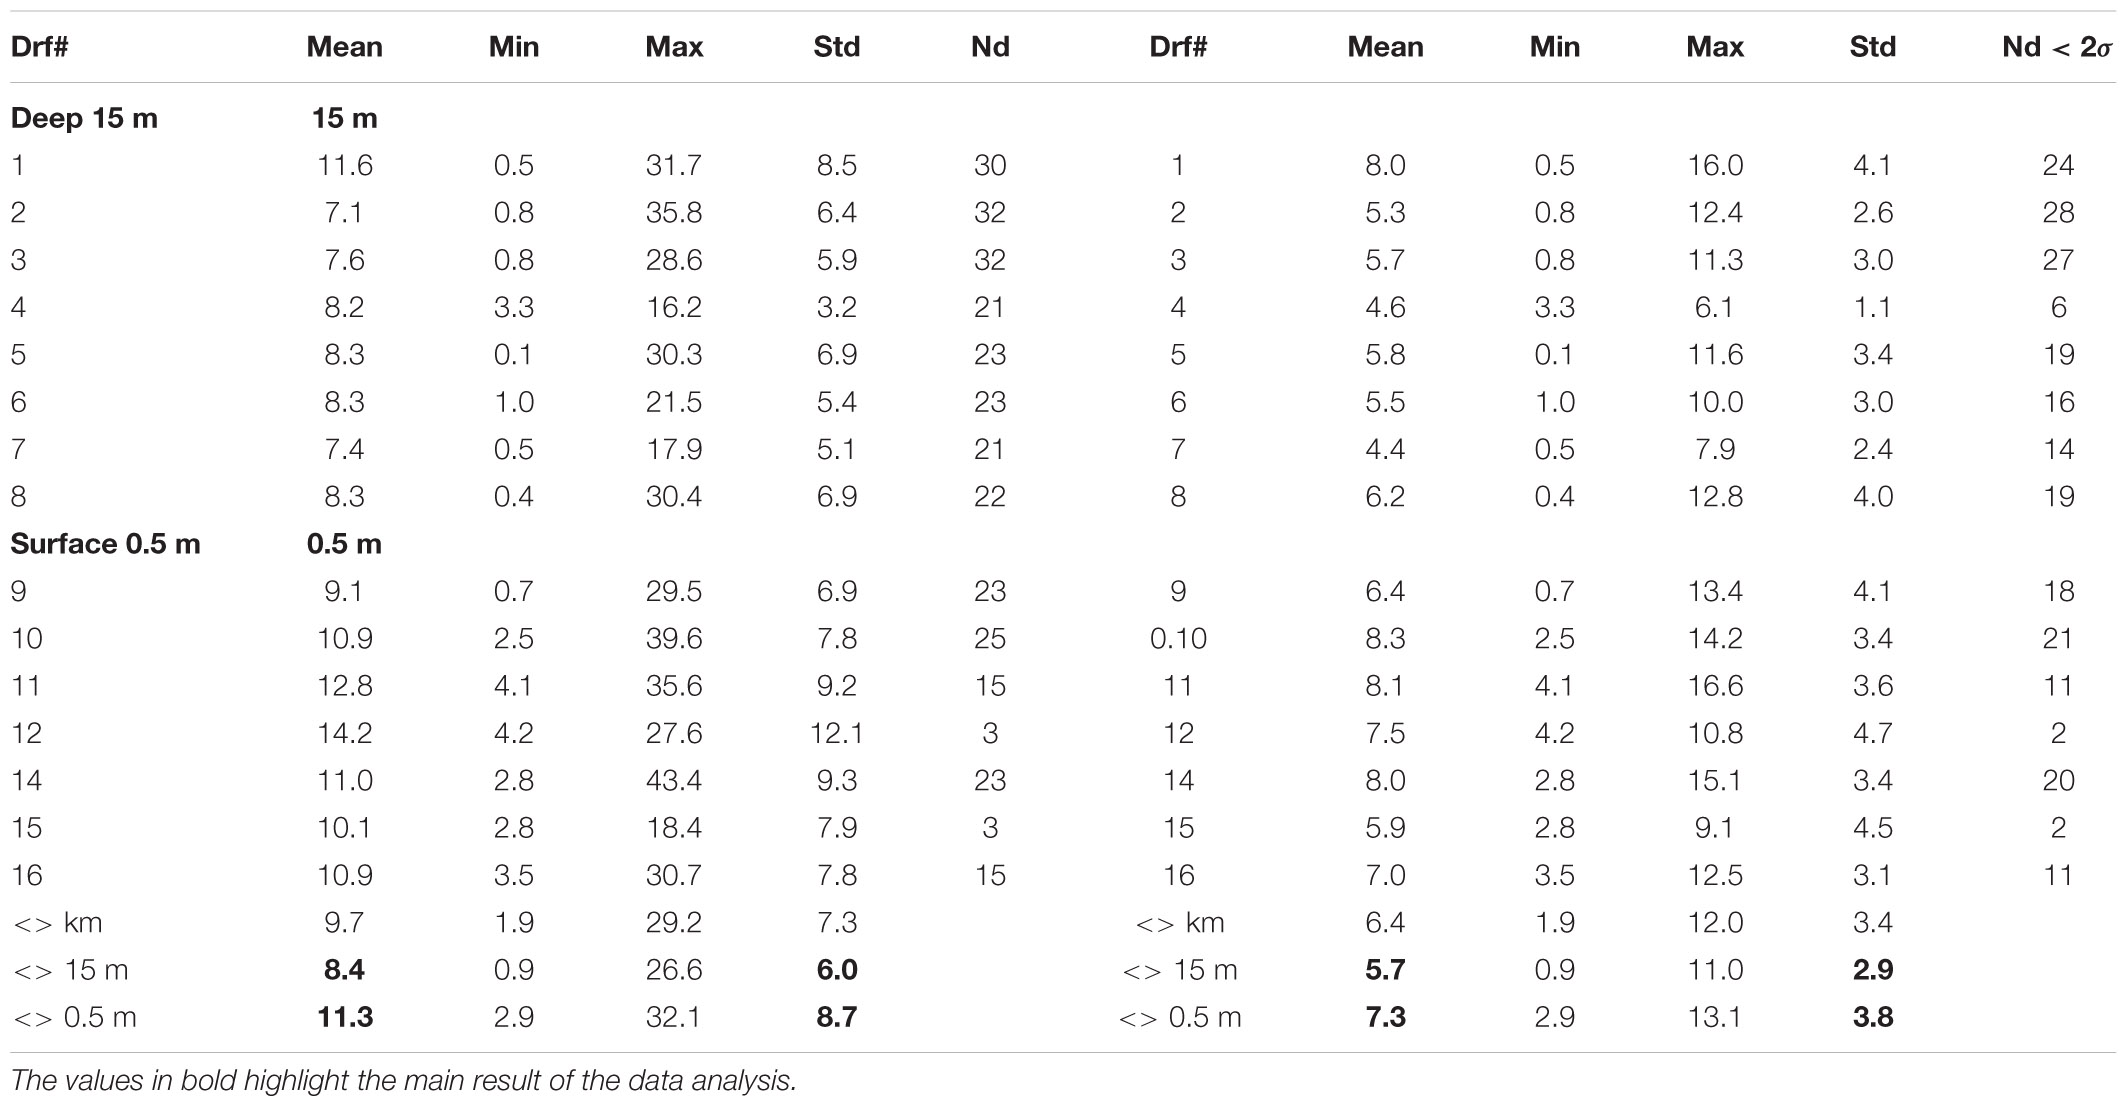
Table 2. Statistical estimates of the Mercator-IBI36 daily-averaged model skill based on the 24-h track separation distances of 16 observed and model drifters and their averaged <Δr> values shown separately for deep (15 m) and the near-surface (0.5 m) layers for all samples (left) and excluding values exceeding 2 standard deviations (right).
Should a developing harmful bloom be flagged by either remote sensing analysis or from in situ samples from coastal monitoring, the timing, location and magnitude of this event is identified. An example satellite derived HAB risk map is shown in Figure 8. The map uses colour coding to represent the risk for three classes: “harmful” bloom in red; “non-harmful” bloom in green and “no bloom” in blue. The saturation of red and other colours in the map indicates the degree of HAB risk. The “unknown” class in Figure 8 is shown in gray, representing data with spectral signatures that cannot be discriminated by the classifier, for example water types with high concentration of suspended particulate matter (SPM) and coloured dissolved organic matter (CDOM), coccolithophore blooms, etc. Land and missing data over water due to cloud cover or sun glint are shown in black. This automatically initiates a model run, with virtual particles being placed at the center of bloom location. The trajectory of these particles is then displayed as an animation on the HABreports website. In 2019 three K. mikimotoi events were detected, allowing us to provide 5-day early warning simulations of their predicted trajectories. Simulation of cell advection over 5 days with the Mercator-IBI36 model (left) and with enhanced details in WeStCOMS-FVCOM model (right) are shown in Figure 9.
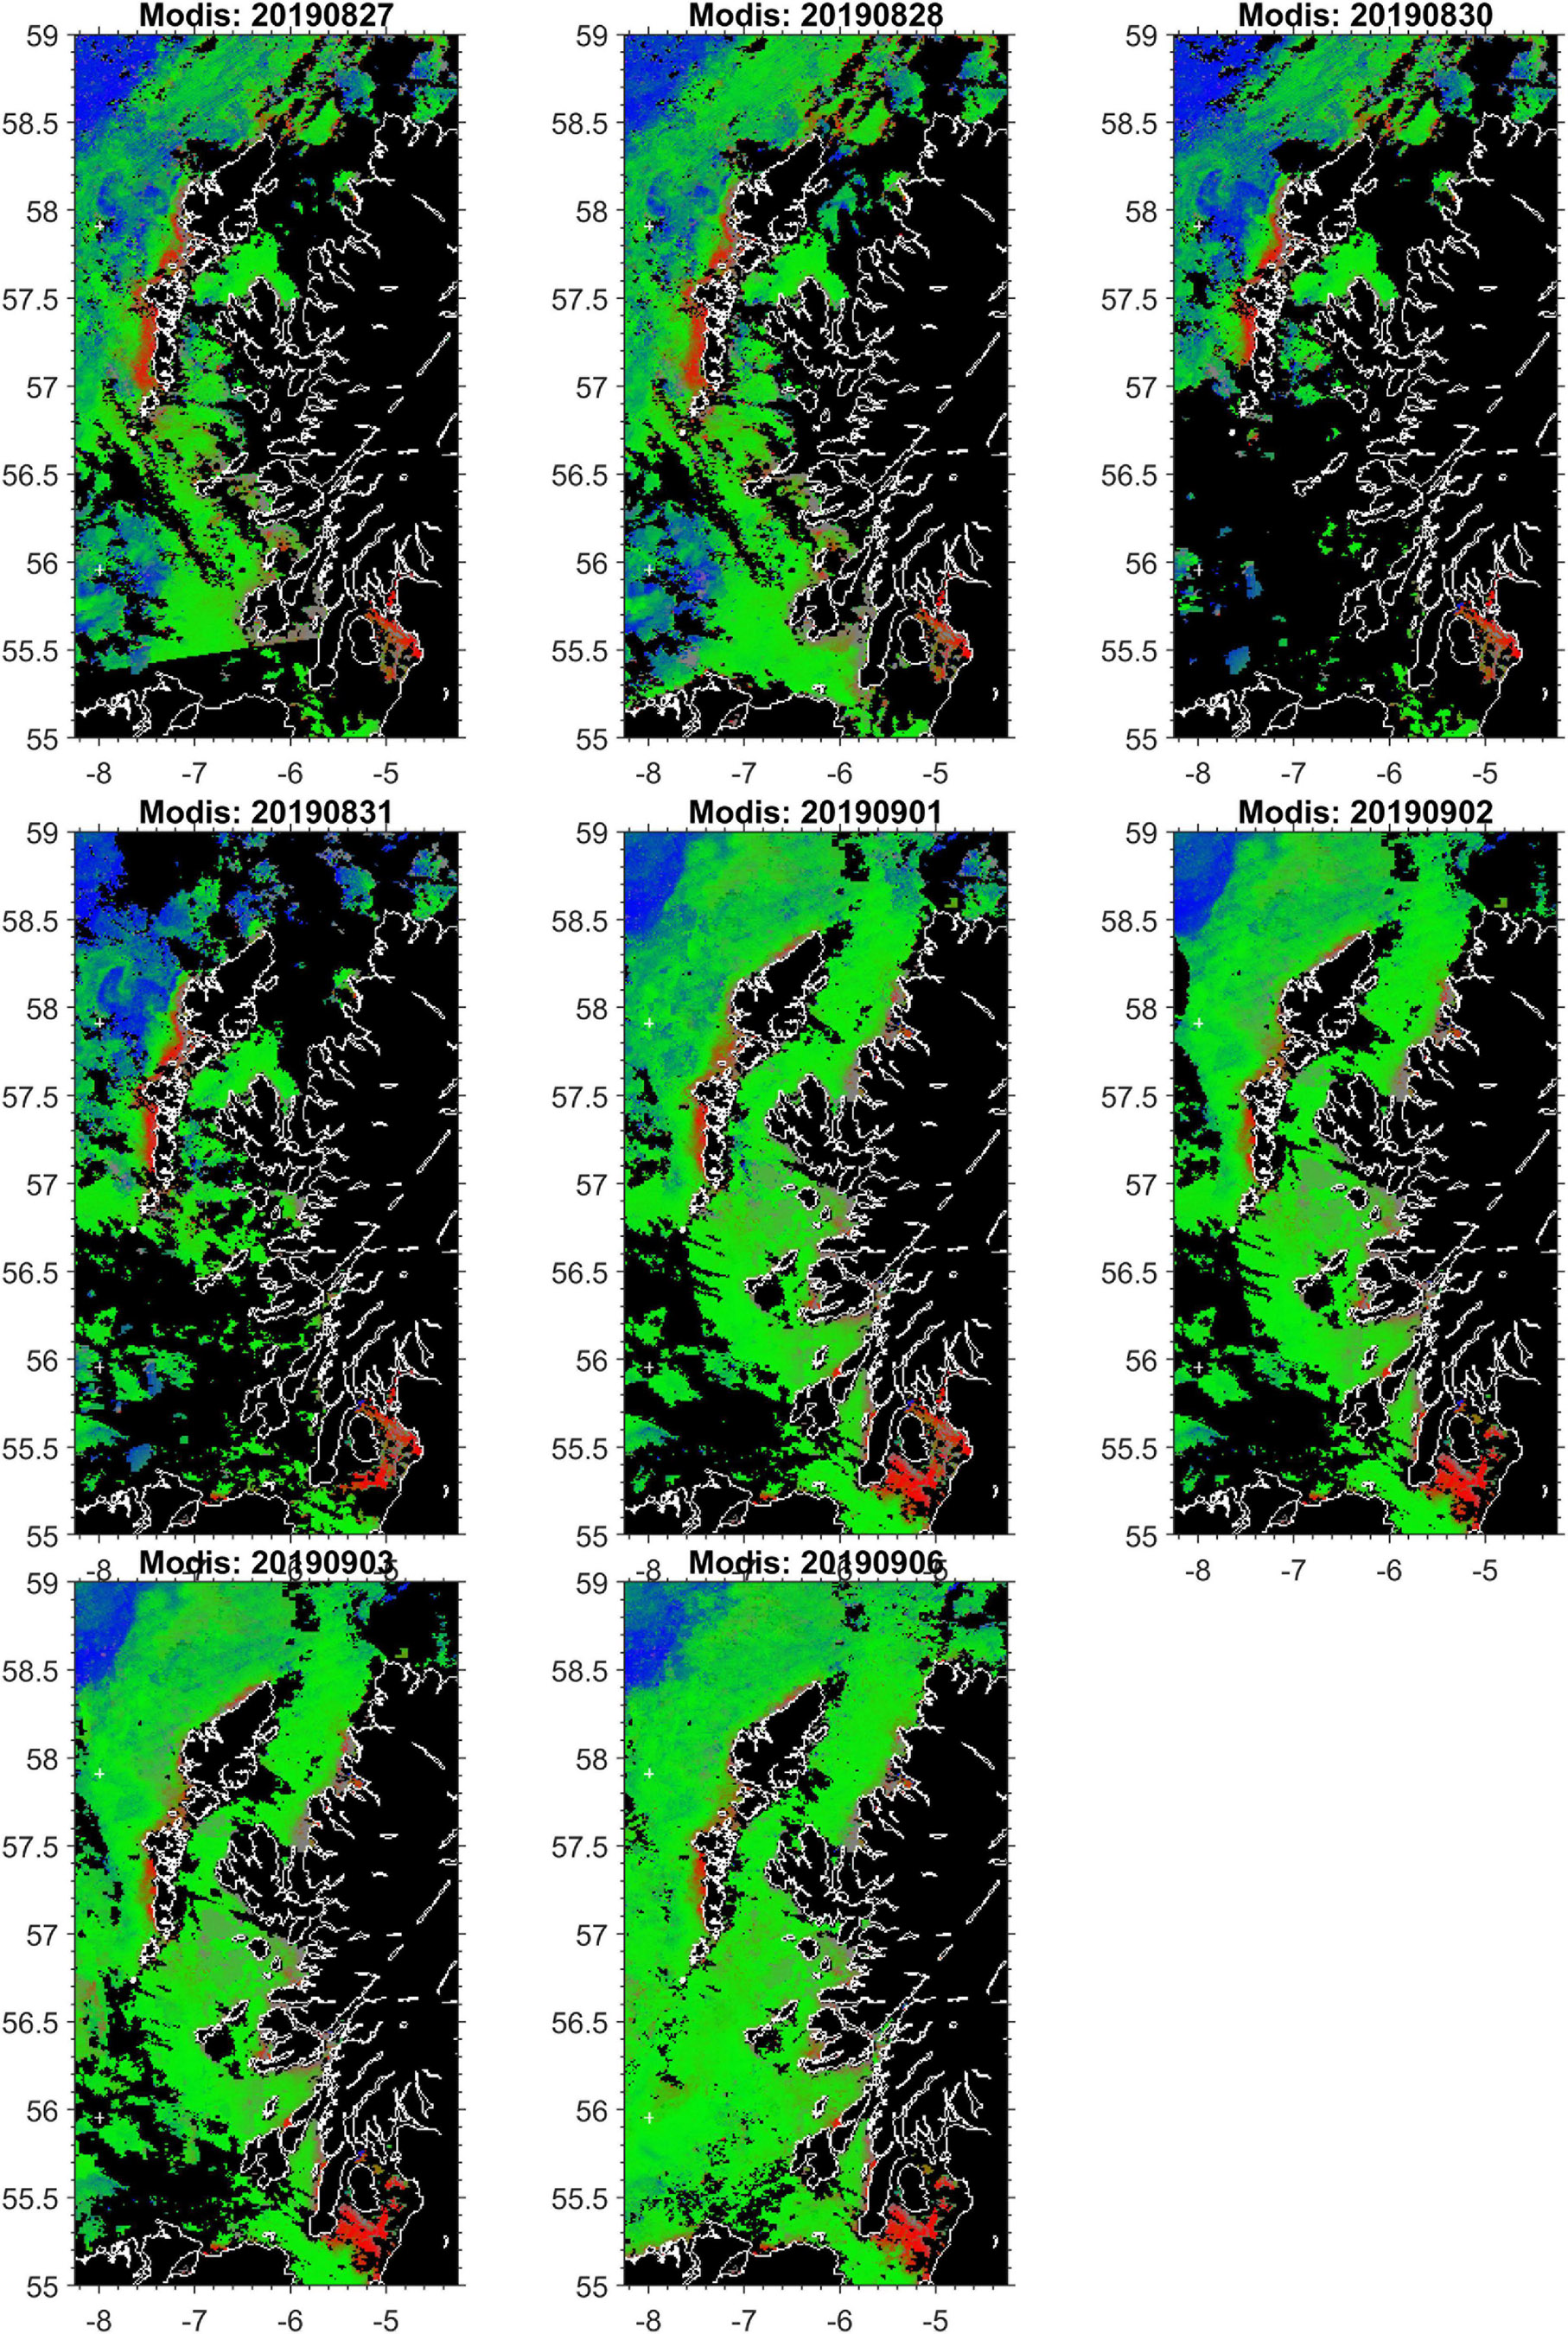
Figure 8. An exemplar remote sensing based HAB risk map: elevated HABs-risk for Karenia mikimotoi was detected in Modis-satellite sea-surface colour analysis charts over 2 weeks (35 and 36) in August–September 2019 along the western coast of Hebrides and the ‘false alarm’ in the Sea of Clyde.
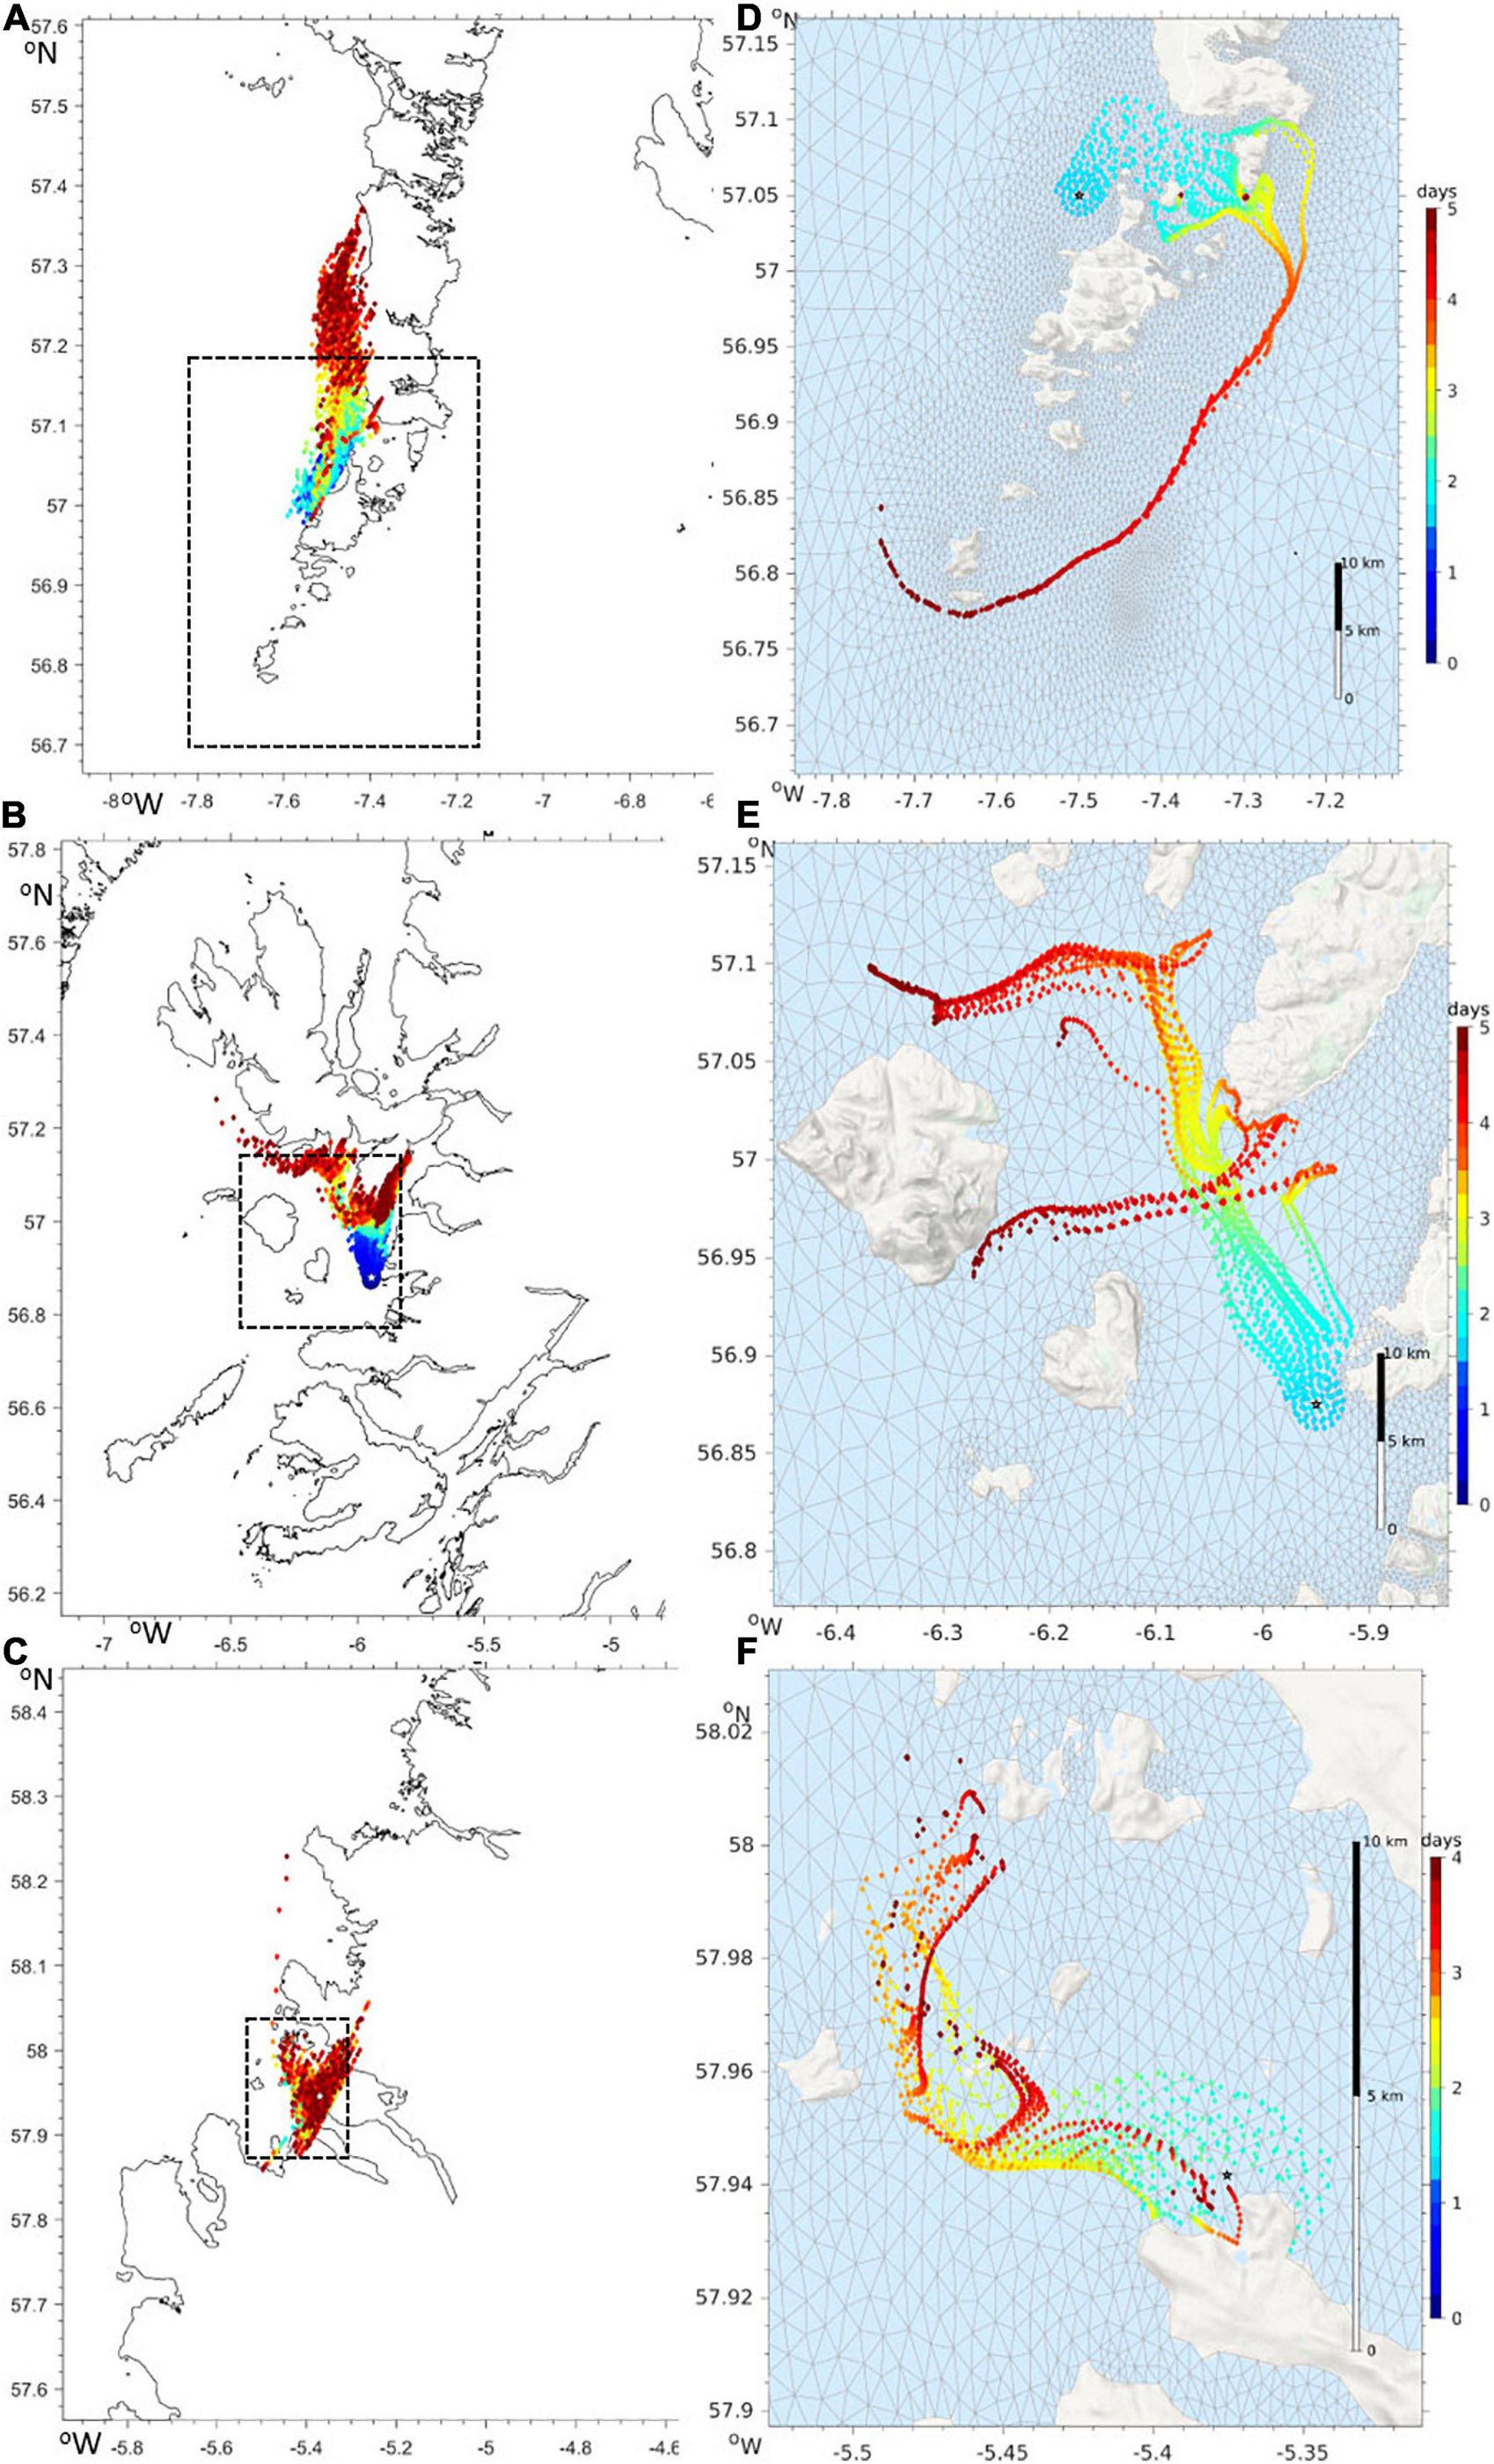
Figure 9. Advection of virtual particles driven by surface currents in the Mercator-IBI36 (A–C) and WeStCOMS-FVCOM (D–F) hydrodynamic models. The colours show the forecast over next 5 days since after noon of 2019/08/27. Modelled particles were launched from the locations with the highest abundances of Karenia-mikimotoi near the Isle of Barra (A,D), on Arisaig (B,E) and in Loch Kinnaird (C,F). The areas on the right hand WeStCOMS simulations are highlighted in the left-hand Mercator-IBI36 plots by a dashed rectangle.
Harmful algal bloom prediction has many similarities to weather forecasting. In the same way as we expect northern hemisphere summers to be warmer than winters, we expect most HAB events in these regions in summer months as a result of the increased temperature, irradiance and resultant stratification of the water column: conditions that promote (harmful) dinoflagellate growth (Smayda and Reynolds, 2003). However, for useful forecasts we require more spatially and temporally resolved predictions of short-term harmful events and a methodology to rapidly inform interested stakeholders.
While the HAB and biotoxin monitoring that is required in the EU and by other food safety authorities is generally sufficient to safeguard human health, as demonstrated by the 2013 Scottish shellfish poisoning event, it is not capable of providing 100% consumer protection. As the costs and logistical constraints of monitoring all aquaculture sites are significant, in Scotland sentinel sites (RMPs) that represent a number of farming locations (Pods) are sampled. A risk assessment by FSS indicated that the current weekly monitoring program reduces risk of HAB generated human illness from shellfish poisoning to less than 1% (Holtrop et al., 2016). As FBOs, the responsibility to ensure that harvested shellfish is safe for human consumption falls on the shellfish growers and hence methods to further reduce this risk are required.
As illustrated by the 2013 human toxicity incident, it is possible for shellfish to become toxic very rapidly and hence the industry often undertakes end-product testing of shellfish toxicity as a positive release system. However, such testing is both time consuming and expensive and hence HAB forecasts allow this to be undertaken in a targeted rather than blanket manner.
Regulatory HAB monitoring does not safeguard shellfish aquaculture businesses from the economic impacts of HAB events such as extended farm closures or product recalls. Furthermore, as fish killing HAB events in Scotland and Europe are not thought to have human health implications, regulatory monitoring does not extend to finfish aquaculture. HAB and biotoxin forecasting systems are therefore required to minimize health and business risk, allowing operators to take mitigation measures such as extra end-product testing, moving harvesting to a different location until toxins have depurated from shellfish, or deploying barrier methods such as bubble curtains or tarpaulins at fish farms (Brown et al., 2019; Gallardo-Rodríguez et al., 2019).
Regulatory monitoring results are released by the regulator in a spreadsheet format that can be difficult to interpret spatially and includes no temporal information. Hence, in discussion with the aquaculture industry, we developed our map-based approach so that information can easily be interpreted in time and space. The TTLG system was evaluated by McLeod and McLeod (2016), who found that it provided an improved level of protection for consumers of shellfish in Scotland. However, the work also highlighted that only around 50% of Scotland’s FBOs undertook their own calculation of the TTLG. Given that negative public perception of shellfish related human health events will impact the industry indiscriminately, this low take-up was of concern. McLeod and McLeod (2016) demonstrated that smaller FBOs were less likely to follow the TTLG. This may be through lack of confidence in their ability to undertake the calculations on a weekly basis, and/or lack of staff resource. Hence, the calculation and dissemination of the TTLG index for all actively monitored shellfish harvesting sites in Scottish waters via HABreports mitigates risk for all operators.
For some HAB organisms, we have sufficient data to be able to forecast regional or even local patterns and trends at a seasonal level. For example, a link between the initiation of Dinophysis blooms and the upwelling season in north west Spain has been established (Diaz et al., 2016), as has a seasonal separation of Pseudo-nitzschia delicatissima and seriata taxonomic groups. The former is thought to be non-toxic in Scottish waters and is primarily observed in spring and the latter is potentially toxic and primarily observed in summer and autumn (Fehling et al., 2006; Rowland-Pilgrim et al., 2019). However, this understanding is rarely sufficient to allow forecast of risk in a specific location. As many HAB events are spatially and temporally variable, often differing in magnitude and location from year to year, “useful” HAB risk assessment requires a greater resolution than seasonal. An understanding of the underlying ecology and drivers of bloom events, along with the observational platforms and predictive approaches to identify and forecast developing blooms, is therefore necessary for useful expert interpretation.
Scotland has not experienced the major raphidophyte blooms that impact other salmon farming regions. The last reported incident was a bloom of “flagellate X” in 1982 (Smayda, 2006). The dinoflagellate Karenia mikimotoi is the organism of greatest concern, with periodic blooms being observed in Scotland and adjacent regions (Silke et al., 2005; Davidson et al., 2009). Spiney diatoms may also cause fish kills (Bruno et al., 1989; Treasurer et al., 2003) in the region, but these are typically identified by “in house” fish farm cell counts and are not routinely reported in the scientific literature or regulatory monitoring and are therefore less easy to include in our forecasts.
In contrast to shellfish biotoxin producing species there are no accepted threshold densities of concern for fish killing HABs. Karenia mikimotoi is thought to result in fish kills at cell densities in excess of 10 million cells L–1 (Davidson et al., 2009), but clearly industry wishes an early warning before this density is reached. Hence, when our satellite classifier “HAB risk” exceeds > 0.6 with “unknown” likelihood of less than 0.5 a bloom is identified as being of elevated HAB risk, triggering a model run. When K. mikimotoi densities in coastal monitoring samples exceed background levels this is reported in the bulletin, with cell densities exceeding 100,000 L–1 generating a model run.
Harmful algal blooms may develop in situ or be advected from another location. In Scottish waters blooms of at least three of the four most important genera, Dinophysis, Pseudo-nitzschia, and Karenia are thought to develop offshore and be advected to the coast (Fehling et al., 2012; Whyte et al., 2014; Gillibrand et al., 2016; Paterson et al., 2017). While the fourth important genus, Alexandrium, develops from local cyst beds, Alexandrium blooms have been shown to be advected long distances when conditions are favorable (Anderson et al., 2014). Historically, the use of mathematical models in HAB forecasting was limited by physical and biological constraints (Davidson et al., 2016). Shelf wide physical oceanographic models lacked the necessary spatial resolution of model grid to resolve the complexities of the near coast environments where aquaculture is located. The physiology of many HAB organisms is insufficiently understood to produce credible operational biological models, particularly if they exist as a minor component of the biomass of a complex food web. Hence, while the development of biologically based operational HAB models remains a major challenge, even for high biomass blooms, physical models have developed such that robust operational models exist for most shelf seas. The use of such models to simulate the Lagrangian transport of known HABs provides a further potential mechanism for HAB early warning. However, as HAB events are controlled by the biological response to the environment, detailed forward prediction is limited to the timescale that we might hope to predict environmental change to a reasonable level of accuracy, i.e., likely a maximum of ∼1–2 weeks.
Examples of operational forecast systems are relatively few, but those that exist typically include a combination of monitoring, modelling and expert interpretation. For example, the Gulf of Maine Alexandrium catenella (as. A. fundyense) forecasts include both cyst surveys and high-resolution mathematical modelling of the region (McGillicuddy et al., 2005; He et al., 2008) to predict transport of excysted cells. In the Gulf of Mexico and the east coast of Florida, NOAA produce HAB nowcasts of Karenia brevis bloom location and 3- to 4-day forecasts of respiratory irritation risk from the aerosols that are generated by this species (Stumpf et al., 2009). Similarly, the California-Harmful Algae Risk Mapping (C-HARM) model estimates the probability of Pseudo-nitzschia blooms on the basis of physical circulation models, satellite remote-sensing of the ocean colour and chlorophyll and statistical models (Anderson et al., 2016). In Ireland, the Marine Institute releases alerts similar to those we report here for Scotland, including modelled HAB prediction for Bantry Bay for the following 3 days, based on a detailed understanding of the water exchange in that location (Raine et al., 2010; Cusack et al., 2016; Dabrowski et al., 2016).
The Scottish west coast is the second longest coastline in Europe and the waters to the west of Scotland, in common with other fjordic aquaculture regions, are complex. The region contains water masses from the Irish Sea and Atlantic (Ellett, 1979; McKay et al., 1986) supplemented by local freshwater runoff and Irish shelf waters (Fernand et al., 2006). Existing medium and low-resolution hydrodynamic models that use a structured (i.e., evenly spaced) computational grid are incapable of resolving important features (islands, fjords) and interconnections (straits). The development of the WeStCOMS unstructured grid model was therefore crucial to our ability to forecasts HABs in this region as it provided the necessary resolution on the fjordic coastline. While the coast of Shetland is also complex, it does not exhibit the large number of coastal islands that are found adjacent to the Scottish mainland and hence adequate simulation of HABs advecting from offshore to the coastal zone was achieved with the Mercator-IBI36 model.
Expert interpretation is a critical component of our forecasts, allowing the synthesis of a number of different (and sometimes contradictory) indicators to evaluate risk. In the three full years of operation of our system (2017–2019) our mean success rate for predicting incidences of the three major shellfish toxin syndromes, DSP from Dinophysis, PSP from Alexandrium and ASP from Pseudo-nitzschia, was 74% (Table 1). Greatest success (97%) has been with Pseudo-nitzschia mediated events that are often related to periods of poor summer weather in which water stratification may partially break down. Our lowest success rate is for Alexandrium mediated PSP toxicity. However, this is partly due to the severity (possible fatality) of PSP and hence the need to take a very conservative approach to risk assessment, in this case resulting in a higher proportion of false positives. This ensures that false negatives, that have a potentially serious health implication, are minimized.
Regulatory HAB monitoring is conducted to genus level, but the three HAB genera of greatest concern to the shellfish aquaculture industry in Scotland all exhibit variable toxicity at the species level. For example, Swan et al. (2018) demonstrated different shellfish toxicity resulting from blooms of Dinophysis acuminata and Dinophysis acuta in the Clyde Sea. Touzet et al. (2010) found both toxic and non-toxic strains of Alexandrium in the Shetland Islands, and Fehling et al. (2005, 2004) demonstrated that the toxicity of Pseudo-nitzschia can vary in response to the availability of nutrients and change in other environmental conditions. Hence alerts and forecasts are undertaken on a precautionary basis on the assumption that a bloom may be toxic.
For our Lagrangian particle models to be effective, they require accurate information on bloom size and location sufficiently far in advance that early warning can be provided. Satellite derived remote sensing is currently able to report areas of high phytoplankton biomass in near surface waters, and in some cases identify which organism is present. A challenge is therefore to develop complementary observational approaches, particularly for the shellfish biotoxin producing organisms that rarely dominate the phytoplankton biomass. For example, studies have demonstrated that some HAB species can be present in thin (potentially <1 m in thickness) layers of limited geographical extent, often associated with strong density interfaces in the water column, and at a depth not detectable by satellite remote sensing (Gowen et al., 1998; Touzet et al., 2010).
Developments in marine autonomous vehicles offer the potential for advances in HAB detection, potentially being able to identify HABs that display such sub-surface maxima (Seegers et al., 2015) or occur in thin layers (Farrell et al., 2012). For example, Siemering (2017) was able to identify a Phaeocystis bloom to the west of Scotland from a sea-glider deployment in 2015. Going forward, sensors capable of discriminating harmful from benign phytoplankton at low concentrations are required. Examples of this technology include the Environmental Sample Processor developed that provides in situ collection and analysis of water samples (Scholin et al., 2017) and the imaging Flowcytobot (Olson and Sosik, 2007), although further development is required to make such instruments affordable for routine application.
Our system is currently operational for Scottish waters. However, most of the techniques are easily applied elsewhere. The TTLG approach is being trialed in other European countries thought the Atlantic Arc Interreg project PRIMROSE and we are currently developing a HABreports system for Malaysia to provide enhanced early warning of HAB events in that country.
The datasets presented in this study can be found in online repositories. The names of the repository/repositories and accession number(s) can be found below: https://thredds.sams.ac.uk/thredds/catalog/scoat-drifters/catalog.html.
KD designed the study and wrote the manuscript. SS was responsible for biological data collection. CW, SG, SM, and RS undertook bulletin production and dissemination. AD, MP, and DA were responsible for physical oceanography and modelling. PM and AK undertook the remote sensing. All authors contributed to the article and approved the submitted version.
This work was funded by the BBSRC/NERC Sustainable Aquaculture program grant “Minimizing the risk of harm to aquaculture and human health from advective harmful algal blooms through early warning” BB/M025934/1 (KD, CW, AD, DA, MP, RS, SS, and SM). It has also benefited from support from the EU Interreg projects “Predicting the Impact of Regional Scale Events on the Aquaculture Sector” (PRIMROSE) (KD, CW, AK, SG, and PM), “Collaborative Oceanography and Monitoring for Protected Areas and Species” (COMPASS) (AD) and the UKRI projects “Satellite-based monitoring of harmful algal blooms and water quality for aquaculture farms” (Shelleye) NE/P011004/1 (PM, AK, and KD), “Combining Autonomous Observations and Models for Predicting and Understanding Shelf Seas” (CAMPUS) NE/R00675X/1 (KD and DA) and “Evaluating the Environmental Conditions Required for the Development of Offshore Aquaculture (Off-Aqua)” BB/S004246/1 (KD, AD, and DA).
The authors declare that the research was conducted in the absence of any commercial or financial relationships that could be construed as a potential conflict of interest.
The Supplementary Material for this article can be found online at: https://www.frontiersin.org/articles/10.3389/fmars.2021.631732/full#supplementary-material
Supplementary Figure 1 | This flow chart illustrates the steps taken to determine the toxin traffic light guidance status for a given week for the toxin/causative phytoplankton pair Okadaic acids/Dinophysis.
Supplementary Figure 2 | The paths of drifters released to the west of Shetland in September 2015. Black shows 15-m-drogued SVP-style drifters. Magenta shows surface CODE-style drifters.
Supplementary Figure 3 | Daily tracks of the observed (red) and virtual (blue) drifters seeded into (a) the surface and (b) 15 m depth at the times and locations of observed drifters. Virtual drifters were advected by currents derived from the daily-averaged Mercator-IBI36 model velocity field.
Supplementary Figure 4 | This figure displays the various panels referred to in the case study (see section “Case Study: Combining Data Sources and Expert Interpretation to Forecast Risk”). Panel (A) shows chlorophyll concentrations observed around Shetland on the 21st June 2020, data courtesy the CMEMS (marine.copernicus.eu) portal. Panel (B) shows forecasted sea surface currents for the 23rd June 2020. Data courtesy Mercator-IBI36 model (Sotillo et al., 2015). Panel (C) shows a magnified section of panel (B). Panel (D) shows a wind rose of wind directions and wind speeds around the Shetland Islands during week 26. Panel (E) illustrates sea surface temperatures around the Shetland Islands on the 22nd of June, data courtesy Multi-Satellite aggregated MUR-SST 1 km gridded dataset, JPL, NASA (Armstrong et al., 2012). Panel (F) is a map of Shetland with the concentrations of observed Pseudo-nitzschia in actively monitored shellfish harvesting sites indicated by yellow and red dots. Yellow dots indicate locations where low concentrations were found whereas red dots indicate locations where concentrations were in excess of official control monitoring trigger levels.
Aleynik, D., Dale, A. C., Porter, M., and Davidson, K. (2016). A high resolution hydrodynamic model system suitable for novel harmful algal bloom modelling in areas of complex coastline and topography. Harmful Algae 53, 102–117. doi: 10.1016/j.hal.2015.11.012
Anderson, C. R., Kudela, R. M., Kahru, M., Chao, Y., Rosenfeld, L. K., Bahr, F. L., et al. (2016). Initial skill assessment of the california harmful algae risk mapping (C-HARM) system. Harmful Algae 59, 1–18. doi: 10.1016/j.hal.2016.08.006
Anderson, D., Anderson, P., Bricelj, V., Cullen, J., and Rensel, J. E. J. (2001). Monitoring and management strategies for harmful algal blooms in coastal waters. APEC #201-MR-01.1, Asia PacificEconomic Program. Paris: Singapore, and Intergovernmental Oceanographic Commission.
Anderson, D., and Rensel, J. (2016). Harmful Algal Blooms Assessing Chile’s Historic HAB Events of 2016 A Report Prepared for the. Glob. Aquac. Alliance 19. Available Online at: https://www.aquaculturealliance.org/wp-content/ (accessed March 24, 2021).
Anderson, D. M., Keafer, B. A., Kleindinst, J. L., McGillicuddy, D. J., Martin, J. L., Norton, K., et al. (2014). Alexandrium fundyense cysts in the gulf of maine: long-term time series of abundance and distribution, and linkages to past and future blooms. Deep. Res. Part II Top. Stud. Oceanogr. 103, 6–26. doi: 10.1016/j.dsr2.2013.10.002
Armstrong, E. M., Wagner, G., Vazquez-Cuervo, J., and Chin, T. M. (2012). Comparisons of regional satellite sea surface temperature gradients derived from MODIS and AVHRR sensors. Int. J. Remote Sens. 33, 6639–6651. doi: 10.1080/01431161.2012.692832
Berdalet, E., Fleming, L. E., Gowen, R., Davidson, K., Hess, P., Backer, L. C., et al. (2016). Marine harmful algal blooms, human health and wellbeing: challenges and opportunities in the 21st century. J. Mar. Biol. Assoc. U.K. 2015, 61–91. doi: 10.1017/S0025315415001733
Brown, A. R., Lilley, M., Shutler, J., Lowe, C., Artioli, Y., Torres, R., et al. (2019). Assessing risks and mitigating impacts of harmful algal blooms on mariculture and marine fisheries. Rev. Aquac. 12, 1663–1688. doi: 10.1111/raq.12403
Bruno, D. W., Dear, G., and Seaton, D. D. (1989). Mortality associated with phytoplankton blooms amongst farmed atlantic salmon, Salmo salar L., in Scotland. Aquaculture 78, 217–222. doi: 10.1016/0044-8486(89)90099-9
Chen, C., Beardsley, R., and Cowles, G. (2011). An Unstructured Grid Finite-Volume Coastal Ocean Model: FVCOM User Manual. Amherst, MA: University of Massachusetts.
Cusack, C., Cusack, C., Dabrowski, T., Lyons, K., Berry, A., and Westbrook, G. (2016). Harmful algal bloom forecast system for SW Ireland. part II: Are operational oceanographic models useful in a HAB warning system? harmful algal bloom forecast system for SW Ireland. Part II Are operational oceanographic models useful in a HAB warnin. Harmful Algae 53, 86–101. doi: 10.1016/j.hal.2015.11.013
Dabrowski, T., Lyons, K., Nolan, G., and Berry, A. (2016). Harmful algal bloom forecast system for SW Ireland. Part I: description and validation of an operational forecasting model harmful algal bloom forecast system for SW ireland. part I: description and validation of an operational forecasting model. Harmful Algae 53, 64–76. doi: 10.1016/j.hal.2015.11.015
Dale, A. C., Allen, C., Venables, E., Beaton, J., and Aleynik, D. (2020). Dye tracer dispersion studies in support of bath treatment models for fish farms. Scotland: Scottish Aquaculture Research Forum.
Davidson, K., Anderson, D. M., Mateus, M., Reguera, B., Silke, J., Sourisseau, M., et al. (2016). Forecasting the risk of harmful algal blooms. Harmful Algae 53, 1–7. doi: 10.1016/j.hal.2015.11.005
Davidson, K., and Bresnan, E. (2009). Shellfish toxicity in UK waters: a threat to human health? Environ. Health 8:S12. doi: 10.1186/1476-069X-8-S1-S12
Davidson, K., Jardine, S., Martino, S., Myre, G., Peck, L., Raymond, R., et al. (2020). “The Economic Impacts of Harmful Algal Blooms on Salmon Cage Aquaculture,” in GlobalHAB. Evaluating, Reducing and Mitigating the Cost of Harmful Algal Blooms: A Compendium of Case Studies, ed. V. L. Trainer 84–94.
Davidson, K., Miller, P., Wilding, T. A., Shutler, J., Bresnan, E., Kennington, K., et al. (2009). A large and prolonged bloom of Karenia mikimotoi in scottish waters in 2006. Harmful Algae 8, 349–361. doi: 10.1016/j.hal.2008.07.007
Davidson, K., Tett, P., and Gowen, R. (2011). “Harmful Algal Blooms,” in Marine Pollution & Human Health, eds R. Hester and R. Harrison 95–127.
Diaz, P., Ruiz-villarreal, M., Pazos, Y., Moita, T., Dı, P. A., and Reguera, B. (2016). Climate variability and Dinophysis acuta blooms in an upwelling system. Harmful Algae 53, 145–159. doi: 10.1016/j.hal.2015.11.007
Egbert, G. D., and Erofeeva, S. Y. (2002). Efficient inverse modelling of barotropic ocean tides. J. Atmos. Ocean. Technol. 19, 183–204. doi: 10.1175/1520-04262002019<0183:EIMOBO<2.0.CO;2
Ellett, D. (1979). Some oceanographic features of hebridean waters. Proc. R. Soc. Edinburgh 77B, 61–74. doi: 10.1017/s026972700001263x
Farrell, H., Gentien, P., Fernand, L., Lunven, M., Reguera, B., González-Gil, S., et al. (2012). Scales characterising a high density thin layer of Dinophysis acuta ehrenberg and its transport within a coastal jet. Harmful Algae 15, 36–46. doi: 10.1016/j.hal.2011.11.003
Fehling, J., Davidson, K., and Bates, S. S. (2005). Growth dynamics of non-toxic Pseudo-nitzschia delicatissima and toxic P. seriata (Bacillariophyceae) under simulated spring and summer photoperiods. Harmful Algae 4, 763–769. doi: 10.1016/j.hal.2004.11.002
Fehling, J., Davidson, K., Bolch, C., and Tett, P. (2006). Seasonality of Pseudo-nitzschia spp. (Bacillariophyceae) in western Scottish waters. Mar. Ecol. Prog. Ser. 323, 91–105. doi: 10.3354/meps323091
Fehling, J., Davidson, K., Bolch, C. J., and Bates, S. S. (2004). Growth and domoic acid production by Pseudo-nitzschia seriata (Bacillariophyceae) under phosphate and silicate limitation. J. Phycol. 40, 674–683. doi: 10.1111/j.1529-8817.2004.03213.x
Fehling, J., Davidson, K., Bolch, C. J. S., Brand, T. D., and Narayanaswamy, B. E. (2012). The relationship between phytoplankton distribution and water column characteristics in north west european shelf sea waters. PLoS One 7:e34098. doi: 10.1371/journal.pone.0034098
Fernand, L., Nolan, G. D., Raine, R., Chambers, C. E., Dye, S. R., White, M., et al. (2006). The irish coastal current: a seasonal jet-like circulation. Cont. Shelf Res. 26, 1775–1793. doi: 10.1016/j.csr.2006.05.010
FSA (2014). Managing Shellfish Toxin Risks, Guidance for harvesters and Processors. Available Online at: https://www.foodstandards.gov.scot/downloads/managing-shellfish-toxins-guidance.pdf (accessed March 24, 2021).
Gallardo-Rodríguez, J. J., Astuya-Villalón, A., Llanos-Rivera, A., Avello-Fontalba, V., and Ulloa-Jofré, V. (2019). A critical review on control methods for harmful algal blooms. Rev. Aquac. 11, 661–684. doi: 10.1111/raq.12251
Gillibrand, P. A., Siemering, B., Miller, P. I., and Davidson, K. (2016). Individual-based modelling of the development and ttansport of a Karenia mikimotoi bloom on the north-west european continental shelf. Harmful Algae 53, 118–134. doi: 10.1016/j.hal.2015.11.011
Gowen, R. J. R., Raine, R., Dickey-Collas, M., and White, M. (1998). Plankton distributions in relation to physical oceanographic features on the southern malin shelf, august 1996. ICES J. Mar. Sci. 55, 1095–1111. doi: 10.1006/jmsc.1998.0418
He, R., McGillicuddy, D. J., Keafer, B. A., and Anderson, D. (2008). Historic 2005 toxic bloom of Alexandrium fundyense in the western gulf of maine: 2. coupled biophysical numerical modelling. J. Geophys. Res. 113:C07040. doi: 10.1029/2007JC004602
Holtrop, G., Swan, S. C., Duff, B., Wilding, T., Narayanaswamy, B. E., and Davidson, K. (2016). Risk assessment of the Scottish monitoring programme for the marine biotoxins in shellfish harvested from classified production areas: review of the current sampling scheme to develop an improved programme based on evidence of risk. Available Online at: https://www.foodstandards.gov.scot/publications-and-research/publications/risk-assessment-of-the-scottish-monitoring-programme-for-the-marine-biotoxi (accessed March 24, 2021).
Kurekin, A. A., Miller, P. I., and Van der Woerd, H. J. (2014). Satellite discrimination of Karenia mikimotoi and Phaeocystis harmful algal blooms in european coastal waters: merged classification of ocean colour data. Harmful Algae 31, 163–176. doi: 10.1016/j.hal.2013.11.003
Martino, S., Gianella, F., and Davidson, K. (2020). An approach for evaluating the economic impacts of harmful algal blooms: the effects of blooms of toxic Dinophysis spp. on the productivity of scottish shellfish farms. Harmful Algae 99:101912. doi: 10.1016/j.hal.2020.101912
McGillicuddy, D. J., Anderson, D. M., Lynch, D. R., and Townsend, D. W. (2005). Mechanisms regulating large-scale seasonal fluctuations in Alexandrium fundyense populations in the gulf of maine: results from a physical–biological model. Deep Sea Res. Part II Top. Stud. Oceanogr. 52, 2698–2714. doi: 10.1016/j.dsr2.2005.06.021
McKay, W. A., Baxter, J. M., Ellett, D., and Meldrum, D. T. (1986). Radiocaesium and circulation patterns west of scotland. J. Environ. Radioact. 4, 205–232. doi: 10.1016/0265-931x(86)90011-1
McLeod, C., and McLeod, D. (2016). Evaluation of the Shellfish Traffic Light Toxin Guidance for Food Standards Scotland. Scotland, USA: Food Standards Scotland.
Niiler, P. P., Sybrandy, A. S., Bi, K., Poulain, P. M., and Bitterman, D. (1995). Measurements of the water-following capability of holey-sock and TRISTAR drifters. Deep sea res. part I oceanogr. Res. Pap. 42, 1951–1964. doi: 10.1016/0967-0637(95)00076-3
Olson, R. J., and Sosik, H. M. (2007). A submersible imaging-in-flow instrument to analyze nano-and microplankton: imaging flowcytobot. Limnol. Oceanogr. Methods 5, 195–203. doi: 10.4319/lom.2007.5.195
Paterson, R. F., McNeill, S., Mitchell, E., Adams, T., Swan, S. C., Clarke, D., et al. (2017). Environmental control of harmful dinoflagellates and diatoms in a fjordic system. Harmful Algae 69, 1–17. doi: 10.1016/j.hal.2017.09.002
Poulain, P.-M., and Gerin, R. (2019). Assessment of the water-following capabilities of CODE drifters based on direct relative flow measurements. J. Atmos. Ocean. Technol. 36, 621–633. doi: 10.1175/JTECH-D-18-0097.1
Raine, R., McDermott, G., Silke, J., Lyons, K., Nolan, G., and Cusack, C. (2010). A simple short range model for the prediction of harmful algal events in the bays of southwestern ireland. J. Mar. Syst. 83, 150–157. doi: 10.1016/j.jmarsys.2010.05.001
Rowland-Pilgrim, S., Swan, S. C., O’Neill, A., Johnson, S., Coates, L., Stubbs, P., et al. (2019). Variability of amnesic shellfish toxin and Pseudo-nitzschia occurrence in bivalve molluscs and water samples–analysis of ten years of the official control monitoring programme. Harmful Algae 87:101623. doi: 10.1016/j.hal.2019.101623
Scholin, C., Birch, J., Jensen, S., Massion, E., Pargett, D., Preston, C., et al. (2017). The quest to develop ecogenomic sensors: A 25-Year history of the environmental sample processor (ESP) as a case study. Oceanography 30, 100–113. doi: 10.5670/oceanog.2017.427
Scottish Government. (2020). Estimation of the Wider Economic Impacts of the Aquaculture Sector in Scotland. Available Online at: https://www.scottishsalmon.co.uk/sites/default/files/2020-09/estimation-wider-economic-impacts-aquaculture-sector-scotland.pdf (accessed March 24, 2021).
Seegers, B. N., Birch, J. M., Marin, R., Scholin, C. A., Caron, D. A., Seubert, E. L., et al. (2015). Subsurface seeding of surface harmful algal blooms observed through the integration of autonomous gliders, moored environmental sample processors, and satellite remote sensing in southern california. Limnol. Oceanogr. 60, 754–764. doi: 10.1002/lno.10082
Siemering, B. (2017). Environmental drivers and advective transport of harmful phytoplankton in North West European Shelf Seas. Scotland: Univeristy of Aberdeen.
Silke, J., O’Beirn, F., and Cronin, M. (2005). Karenia mikimotoi: an exceptional dinoflagellate bloom in western Irish waters, summer 2005. Mar. Envon. Health series 21, 1649–1653.
Skamarock, W. C., Klemp, J. B., Dudhia, J., Gill, D. O., Barker, D. M., Duda, M. G., et al. (2008). A Description of the Advanced Research WRF Version 3. NCAR Technical Note (475). Colorado, U S A: University Corporation for Atmospheric Research, 125.
Smayda, T. J. (1990). “Novel and nuisance phytoplankton blooms in the sea - evidence for a global epidemic,” in ler, L., Anderson, D. (Eds.), Toxic Marine Phytoplankton, eds E. Granéli and B. Sundstrom (New York: Elsevier), 29–40.
Smayda, T. J. (2002). Turbulence, watermass stratification and harmful algal blooms: an alternative view and frontal zones as “pelagic seed banks.”. Harmful Algae 1, 95–112. doi: 10.1016/S1568-9883(02)00010-0
Smayda, T. J. (2006). Scottish Executive Environment Group Harmful Algal Bloom Communities in Scottish Coastal Waters: Relationship to Fish Farming and Regional Comparisons – A Review. Available online at www.scotland.gov.uk/Publications/2006/02/03095327/0 (accessed March 24, 2021).
Smayda, T. J., and Reynolds, C. S. (2003). Strategies of marine dinoflagellate survival and some rules of assembly. J. Sea Res. 49, 95–106. doi: 10.1016/S1385-1101(02)00219-8
Sotillo, M. G., Cailleau, S., Lorente, P., Levier, B., Aznar, R., Reffray, G., et al. (2015). The myocean IBI ocean forecast and Reanalysis systems: operational products and roadmap to the future copernicus service. J. Oper. Oceanogr. 8, 63–79. doi: 10.1080/1755876X.2015.1014663
Stumpf, R. P., Tomlinson, M. C., Calkins, J. A., Kirkpatrick, B., Fisher, K., Nierenberg, K., et al. (2009). Skill assessment for an operational algal bloom forecast system. J. Mar. Syst. 76, 151–161. doi: 10.1016/j.jmarsys.2008.05.016
Swan, S. C., Turner, A. D., Bresnan, E., Whyte, C., Paterson, R. F., McNeill, S., et al. (2018). Dinophysis acuta in scottish coastal waters and its influence on diarrhetic shellfish toxin profiles. Toxins 10:399. doi: 10.3390/toxins10100399
Touzet, N., Davidson, K., Pete, R., Flanagan, K., McCoy, G. R., Amzil, Z., et al. (2010). Co-occurrence of the west european (Gr.III) and north american (Gr.I) ribotypes of Alexandrium tamarense (dinophyceae) in shetland, scotland. Protist 161, 370–384. doi: 10.1016/j.protis.2009.12.001
Treasurer, J. W., Hannah, F., and Cox, D. (2003). Impact of a phytoplankton bloom on mortalities and feeding response of farmed atlantic salmon, salmo salar, in west scotland. Aquaculture 218, 103–113. doi: 10.1016/S0044-8486(02)00516-1
Weihs, C., Ligges, U., Luebke, K., and Raabe, N. (2005). “klaR analyzing German business cycles,” in Data Analysis and Decision Support, eds D. Baier, R. Decker, and L. Schmidt-Thieme (Berlin: Springer-Verlag), 335–343. doi: 10.1007/3-540-28397-8_36
Wells, M. L., Karlson, B., Wulff, A., Kudela, R., Trick, C., Asnaghi, V., et al. (2020). Future HAB science: directions and challenges in a changing climate. Harmful Algae 91:101632. doi: 10.1016/j.hal.2019.101632
Keywords: harmful algal blooms, biotoxins, early warning, remote sensing, modelling
Citation: Davidson K, Whyte C, Aleynik D, Dale A, Gontarek S, Kurekin AA, McNeill S, Miller PI, Porter M, Saxon R and Swan S (2021) HABreports: Online Early Warning of Harmful Algal and Biotoxin Risk for the Scottish Shellfish and Finfish Aquaculture Industries. Front. Mar. Sci. 8:631732. doi: 10.3389/fmars.2021.631732
Received: 20 November 2020; Accepted: 18 March 2021;
Published: 09 April 2021.
Edited by:
Jose Luis Iriarte, Austral University of Chile, ChileReviewed by:
Rowena Fay Stern, Marine Biological Association of the United Kingdom, United KingdomCopyright © 2021 Davidson, Whyte, Aleynik, Dale, Gontarek, Kurekin, McNeill, Miller, Porter, Saxon and Swan. This is an open-access article distributed under the terms of the Creative Commons Attribution License (CC BY). The use, distribution or reproduction in other forums is permitted, provided the original author(s) and the copyright owner(s) are credited and that the original publication in this journal is cited, in accordance with accepted academic practice. No use, distribution or reproduction is permitted which does not comply with these terms.
*Correspondence: Keith Davidson, a2VpdGguZGF2aWRzb25Ac2Ftcy5hYy51aw==
Disclaimer: All claims expressed in this article are solely those of the authors and do not necessarily represent those of their affiliated organizations, or those of the publisher, the editors and the reviewers. Any product that may be evaluated in this article or claim that may be made by its manufacturer is not guaranteed or endorsed by the publisher.
Research integrity at Frontiers
Learn more about the work of our research integrity team to safeguard the quality of each article we publish.