 Peter J. Wright
 Alice Doyle
 John B. Taggart2
 Andrew Davie
- 1Marine Scotland Science, Aberdeen, United Kingdom
- 2Institute of Aquaculture, University of Stirling, Stirling, United Kingdom
- 3Joint Nature Conservation Committee, Aberdeen, United Kingdom
It is increasingly recognised that sustainable exploitation of marine fish requires the consideration of population diversity and associated productivity. This study used a combination of genotypic screening and phenotypic traits to define the scale of population structuring in Atlantic cod inhabiting the northern North Sea (ICES Sub-division 4a) and Scottish west coast (ICES Division 6a). The genetic analysis indicated an isolation by distance pattern with an even finer scale structuring than previously reported, that persisted over a decade and between feeding and spawning seasons. Spatial variation in phenotypic traits reflected genetic variation with cod maturing later and at a larger size near the Viking Bank in 4a. The identified population structuring provides an explanation for differences in historic changes in maturation schedules and the temperature exposure recorded in previous electronic tagging studies. The study also highlights how the mismatch between stock divisions and population units is leading to a misunderstanding about stock recovery.
Introduction
Conserving population diversity is a key part of the UN Convention on Biological Diversity as it promotes persistence and adaptability in taxa (Balmford et al., 2005). Although the need to account for intraspecific genetic diversity has been widely acknowledged (Hilborn et al., 2003; Ruzzante et al., 2006) and overfishing has been related to a decline in genetic diversity across a wide range of marine fishes (Pinsky and Palumbi, 2014), it is still rarely considered in marine fisheries management. This is because the stock units upon which management advice is based often do not match the scale of population structuring (Stephenson, 2002; Barth et al., 2017). While these stock units are assumed to be a geographically discrete group of fish with the same vital rates, they usually reflect a compromise between biological evidence, data availability and management requirements (Stephenson, 2002). Failure to recognise the appropriate scale of population processes may mask changes in the sub-stock components and lead to biased estimates of abundance and overexploitation of less productive populations (Smedbol and Stephenson, 2001). Accounting for within-stock differences in productivity is far more important to management than just the knowledge of population structuring, because of the assumption of homogeneity in vital rates (Stephenson, 2002). Despite advances in the genetic and tagging tools available, few studies have related genetic differentiation with vital rates in marine fish. Consequently, in order to provide advice on conserving population diversity and sustainable exploitation in marine fish, there is a need for studies that characterise both population distribution and productivity.
Reproductive traits have often been used as a proxy of populations' vital rates or productivity as they are shaped by regional variation in growth and reproductive success while also responding rapidly to local differences in environmental conditions (Pianka, 1976; Wright, 2014). Accurate information on maturity at age is also needed for analytical assessments to estimate spawning stock biomass and biomass reference levels. While inter-annual variation in maturity-size relationships are affected by growth rate (Godø and Moksness, 1987) and temperature (Tobin and Wright, 2011) there have also been substantial downward shifts in maturation reaction norms that are related to historical fishing pressure rather than either of these natural factors (Devine et al., 2012). Consequently, a move to conserving population diversity requires information on the appropriate scale of variation in maturity at size and age.
Atlantic cod, Gadus morhua, is well-suited to studying population diversity and reproductive traits as there is already considerable information on both genetic divergence (Bradbury et al., 2013; Barth et al., 2017) and variation in maturity and fecundity (Wright and Rowe, 2019). Like most marine fish the level of genetic differentiation based on unlinked neutral SNPs appears to be very low in Atlantic cod (Bradbury et al., 2013; Berg et al., 2015) with most reported genomic divergence being related to polymorphic chromosomal rearrangements linked to adaptive loci (Bradbury et al., 2013; Berg et al., 2015; Sodeland et al., 2016; Fairweather et al., 2018). However, these genomic regions of adaptive divergence appear very relevant for advising on the appropriate scale for stock management as they appear to reflect reproductive barriers linked to local environmental adaptation and migratory phenotypes (Bradbury et al., 2013; Barth et al., 2017; Kess et al., 2019). Variations in reproductive traits at scales less than the fished stock have been widely reported in this species (Marteinsdottir and Begg, 2002; Yoneda and Wright, 2004), although only in Norwegian coastal cod has this variability been related to genetic differences (Olsen et al., 2009). Downward trends in reaction norms toward smaller and earlier age at maturation have been widely reported for many cod stocks (Devine et al., 2012), and regional differences in these trends within the North Sea have been linked to historic differences in fishing effort (Wright et al., 2011).
In the North Sea (International Council for the Exploration of the Sea, ICES Division 4) and off the Scottish west coast (ICES 6a), studies of single nucleotide polymorphic (SNP) markers of spawning cod provide evidence of barriers to gene flow between the deeper north east North Sea region between 100 and 200 m and the shallower shelf region throughout these two stock areas, except for the Clyde Sea (Heath et al., 2014). Genetic isolation of the north east North Sea population is also evident in more recent studies (Sodeland et al., 2016; Fairweather et al., 2018). Analyses of otolith chemistry, comparing larval, juvenile, and adult parts for the same year-class in the North Sea, suggests that this reproductive isolation is maintained by a combination of hydrographical isolation of early life-stages and either fidelity or natal homing of later stages (Wright et al., 2006a, 2018; Svedäng et al., 2010; Neat et al., 2014). Spatio-temporal differences in maturity at size seem to be consistent with the scale of mixing suggested by tagging (Wright et al., 2006a; Neat et al., 2014), with differences found among cod in the north west, north east and southern North Sea and Scottish west coast (Yoneda and Wright, 2004; Wright et al., 2011). However, small differences in the geographic region selected can have a substantial impact on maturity at size, as evident from differences reported for the north east (Wright et al., 2011) and northern North Sea (Heath et al., 2014). Hence, there is a need to examine how reproductive traits co-vary with genetic variation.
In this study, we examine how variation in growth and maturity relates to population scale in Atlantic cod across two stock areas; the North Sea (ICES 4) and Scottish west coast (ICES 6a). Building on Heath et al. (2014) and the emerging focus on chromosomal rearrangements, we extend the range of sampled locations to better define population boundaries across the region and consider genomic variation at both spawning and feeding times in 2013–14 and compare with samples collected in 2002–3 including some samples used in Heath et al. (2014). Regions of genetic discontinuity are then compared to the spatial variation in length and maturity at age. By this means we test whether variation in reproductive traits are linked to population diversity.
Materials and Methods
Sampling
As cod are known to aggregate to spawn (Wright and Rowe, 2019) but tend to disperse when feeding, we sampled in autumn, shortly after the time they allocate energy to secondary gametogenesis (November–December), and thereafter during spawning (February–March). A total of 721 cod were sampled in November to December in 2013, when early stages of oogenesis could be detected histologically (Yoneda and Wright, 2005) and a further 803 during the spawning season between February and March (Gonzalez-Irusta and Wright, 2016) in 2013 and 2014. Of these 1,524 fish, a sub-sample of 658 were selected from six locations and the two periods for SNP identification (Figure 1). Cod were sampled by bottom trawl from the region 57°N to 61°N and 7°W to 5°E from both commercial and research vessels. A further sample of 386 cod collected over the same region in February–March 2002–3 (n = 254) and August–November 2003 (n = 132) for an earlier study (see Heath et al., 2014) were used to provide a temporal comparison for genetic analysis.
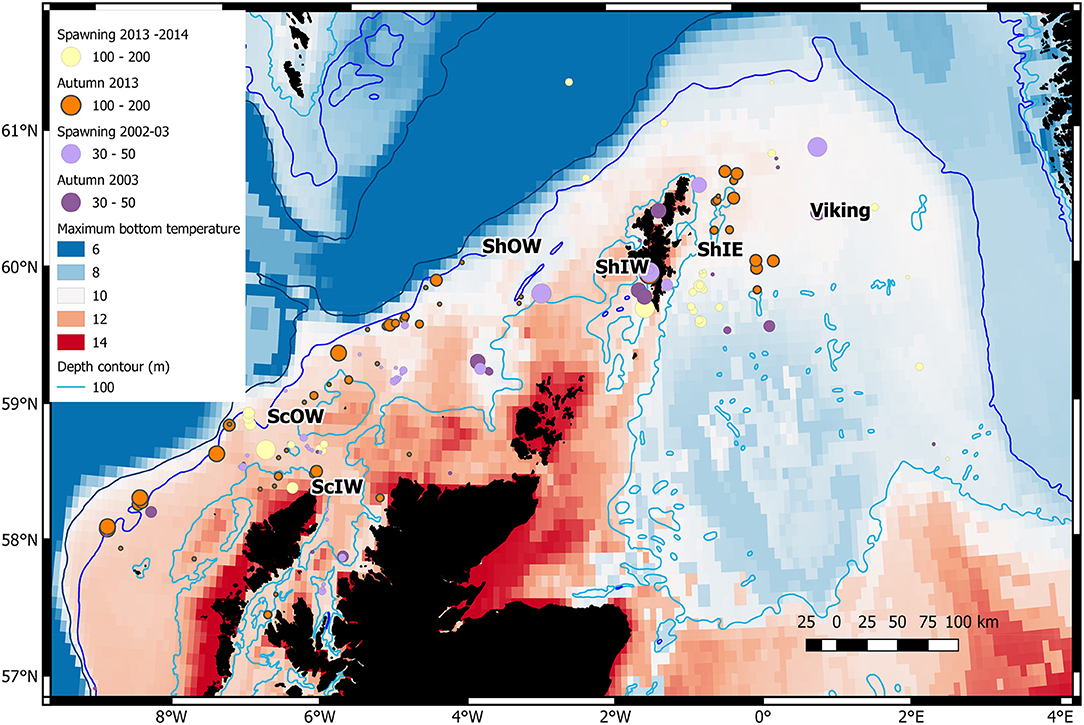
Figure 1. Distribution of genetic samples in relation to maximum seasonal bottom temperature (°C) for the spawning and autumn seasons in sampled years. The centre of 6 areas identified in Table 1 are indicated. Circle diameters are related to sample size (note larger sample sizes in 2013–14). The 200 m depth contour is also shown.
All cod > 11 cm TL were sampled for sex, maturity stage, and total length (±0.5 cm). Sagitta otoliths were taken for all samples for annual age estimation. For all cod from the February/March data set and all male cod from the November–December dataset, maturity stage was determined macroscopically according to ICES guidelines (Bucholtz et al., 2007). Female cod (N = 418) from the November/December samples were staged histologically to ensure that early maturation commitment, evident from oocytes in cortical aveoli and vitellogenesis stages (Yoneda and Wright, 2005), was identified. Ovary tissue was fixed and stored in 10% neutral buffered formalin solution before being embedded in paraffin wax, sectioned at 2 μm using a rotary microtome RM2155 (Leica Instruments GmbH) and stained with haematoxylin and eosin. Gill clips from sampled fish were preserved in 100% ethanol for the SNP analysis.
In order to model maturity at size variation, the two spawning datasets were supplemented with similar data extracted from the 1st quarter ICES International Bottom Trawl surveys (http://ices.dk/data/data-portals/Pages/DATRAS.aspx); the North Sea International Bottom Trawl Survey (NS-IBTS; 2002–3 and 2013–2014), the Scottish West Coast Bottom Trawl Survey (SWC-IBTS; 2002–3) and the Scottish West Coast Groundfish Survey (SCOWCGFS; 2013–2014). The NS-IBTS takes place in January–February whilst the Scottish West Coast surveys are in February–March. Combined with the dedicated sampling this provided a sample size of 10,139 cod.
Growth and Maturity Analysis
Variation in total length (L, mm) for a given age in relation to decimal latitude and longitude was examined with the addition of sex and year, treated as factors. A generalised additive model (GAM) with a Gaussian distribution was used to account for the non-linear trends with latitude and longitude. Model selection was made by forward selection of variables based on a significant decrease in residual deviance and reduction in the Akaike information criteria (AIC).
Spatial variation in maturity (M) was modelled using a binomial GAM with a logit link according to:
where M is the proportion mature (0/1), latitude and longitude are continuous variables and age (A) and the two periods of study (P: 2002–3 and 2013–14) were treated as factors. Sexes were examined separately given previous evidence for sex related differences in maturity at size (Wright et al., 2011). The same model was examined for between season differences in female maturity, but with the period term representing the feeding and spawning sampling times in 2013–14. Due to over dispersion in the survey data, a quasi-binomial link function was used where variance is given by the dispersion parameter multiplied by the mean. As there were few cod aged >5, all analyses were restricted to ages 2–5. Model selection was made by forward selection of variables based on a significant decrease in residual deviance. All models were implemented in R (ver. 3.6.2) using mgcv and MASS libraries (R Core Team, 2019).
DNA Extraction and RAD Library Construction
DNA was extracted from ethanol preserved gill samples using a salt extraction method and treated with RNase to remove residual RNA from the sample. Each sample was quantified by fluorimetry (Quibit) quantitation and quality assessed by agarose gel electrophoresis, and was finally diluted to a concentration of 50 ng.μL−1 in 5 mmol.L−1 Tris, pH 8.5.
SNP Identification
In order to identify a reduced panel of informative SNPs, adopting a similar approach to that used in recent studies of a nearby geographic region (Barth et al., 2017), DNA samples from 20 individuals from each of the six locations from the contemporary February–March sampling window were taken forward into RAD analysis. A double digest RAD library (Peterson et al., 2012) was constructed according to the methodology of Brown et al. (2016) and Manousaki et al. (2016). Briefly, the restriction enzymes Sbf1 and Sph1 were used to digest c. 25 ng of genomic DNA from each sample, followed by ligation of individual-specific combinations of P1 and P2 adapters, allowing subsequent post-hoc segregation of all samples. The library was run twice on an Illumina MiSeq platform (v2 chemistry, 300 cycle kit, 161 base paired-end reads; Illumina, Cambridge, UK) to generate sufficient data coverage (34.1M paired-end reads, EBI Project accession number PRJEB41987). Data were compiled and processed using STACKS (v1.27, Catchen et al., 2013) (see Supplementary Methods for a full description of library construction and ddRAD sequence data processing). Initial genotype analyses of the six population samples included Hardy-Weinberg equilibrium testing and pairwise population Fst computations, performed, using default parameters, in GENEPOP on the Web v 4.2 (Raymond and Rousset, 1995; Rousset, 2008), while ARLEQUIN v 3.5 (Excoffier and Lischer, 2010) was used to preliminarily examine for signatures of directional selection by implementing a hierarchal island model (20,000 simulations, 100 demes per group, 10 groups) and using an outlier threshold of P = 0.05. Following this screening, 90 loci with a minor allele frequency ≥0.15 in at least one of the test populations and an Fst ≥0.03 were identified as being putative loci which could be informative for population structuring in the study range. None showed evidence of a selection signal from this, admittedly small, dataset (n = 20 per population). Due to both project financial and time constraints the candidate list needed further reduction for practical large scale population screening. The SNP loci were ranked in descending Fst value and those toward the top of the list, likely to have the greatest population discriminatory potential, were considered for allele-specific assay design. Further filtering/cheques were applied to identify and remove RAD loci containing repetitive regions (using Tandem Repeat Finder, Benson, 1999) and to ensure that selected loci showed a confirmed sequence alignment (blastn, Altschul et al., 1990; E-value range 2.1 e−73-5.7 e−76 and ID range 98.1–100%) within the cod genome (gadMor1, accessed April 2015). A total of 13 loci (Supplementary Table 2) were finally selected for allele-specific PCR design using the KASP on demand genotyping system (KASPTM v4.0, LGC Genomics, UK), and a total of 1,044 samples (Table 1) were genotyped by LGC genomics.
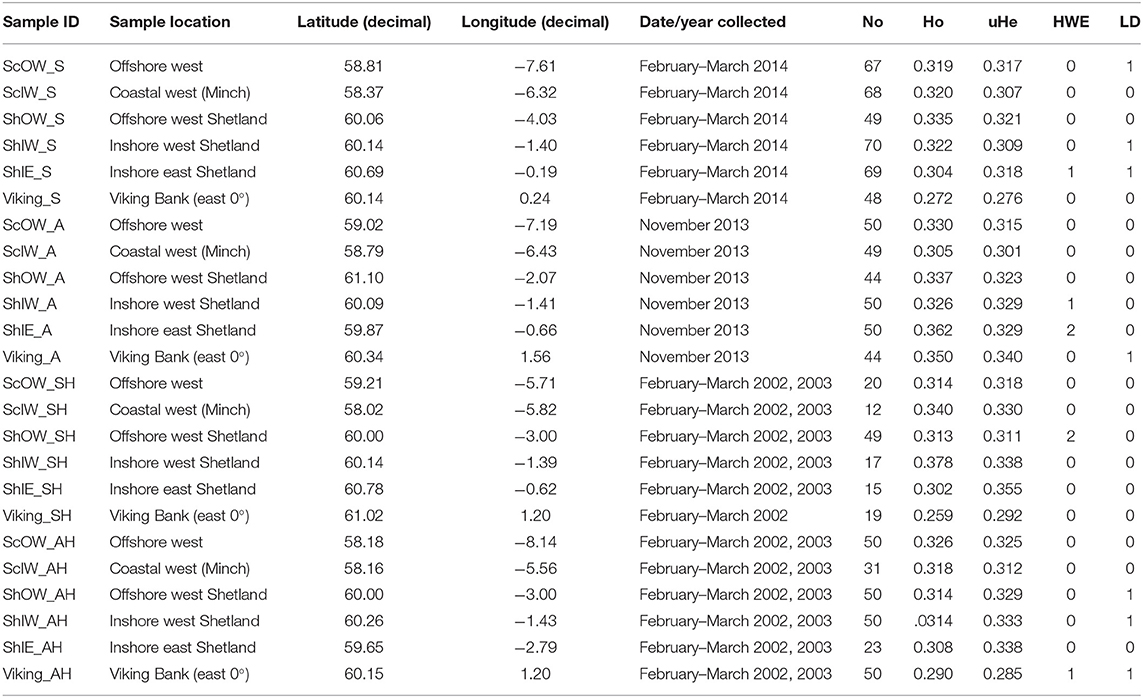
Table 1. Overview of sample origin, and summary of population specific SNP marker (n = 13) performance listing unbias observed (Ho) and expected (uHe) heterozygosity, as well as the number of markers which deviate from Hardy-Weinberg equilibrium (HWE) or Linkage Disequilibrium (LD).
Genetic Analysis
For the full data set (Table 1), allele frequencies and unbiased expected (uHe) and observed (Ho) heterozygosity were estimated using the package GenAlEx 6.5 (Peakall and Smouse, 2006; Smouse and Peakall, 2012). Departure from Hardy Weinberg equilibrium (HWE) and linkage disequilibrium (LD) for each pair of SNPs was tested in each population using GENEPOP on the web. Type I error rates were corrected for by using a sequential Bonferroni procedure for both tests. Genetic differentiation was tested using the Analysis of Molecular Variance (AMOVA) (999 permutations) using GenAlEx 6.5 as well as by pairwise Fst (1,000 permutations) using GENEPOP on the web. Bayesian clustering analysis (STRUCTURE v2.3.4, Pritchard et al., 2000) was performed using an admixture model and correlated allele frequencies among populations, as well as providing sampling information as a prior in order to improve accuracy in detecting population structure. An initial K value optimisation trial was run with the number of iterations at each K value set to 5, an initial burn-in of 50 000, and 100,000 MCMC repetitions for the range of K values being assessed. The K range values were set according to the scenario being assessed, ranging from 1 to the maximum number of areas/populations present. These results were then assessed using CLUMPAK software (Kopelman et al., 2015). The most likely K was calculated for each scenario according to both the log probability of the data and the Evanno method. Thereafter, each dataset was re-run in STRUCTURE with the number of iterations set to 10 for the most likely K value, an initial burn-in of 250,000 and 500,000 MCMC repetitions. Results were compiled using CLUMPAK. Geographic distance among the six sampled areas (Viking, SHIE, ShIW, ShOW, ScIW, ScOW) shown in Figure 1 were calculated from the average position for each area by season and then using the NNJOIN plugin in QGIS to estimate the linear distance among them, unless land was crossed and then the nearest sea distance was estimated. Pairwise estimates of genetic distance [Fst/(1-Fst)] were compared with the corresponding geographic distance in a linear regression.
Results
Spatial Variation in Length at Age
Location, in terms of latitude and longitude, explained the highest model deviance in length for all age-groups (Table 2), with a decline from south west to north east (Figure 2). There was no linear trend in length variation, except for the effect of latitude on age 3 cod. A difference in length among sampled years was only found for age 2 cod (p = 0.02). Sex had a significant effect on length for ages 3 and 4 across the study area (p < 0.01), with males being slightly shorter at age. No interactions were significant and none of the models explained a high percentage of the deviance, with the highest being for age 3 cod.
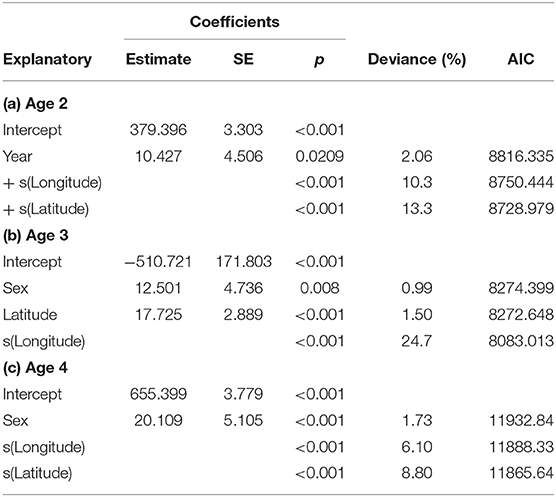
Table 2. GAM model coefficients, deviance explained and AIC for length in relation to year, longitude, latitude and sex for ages 2–4.
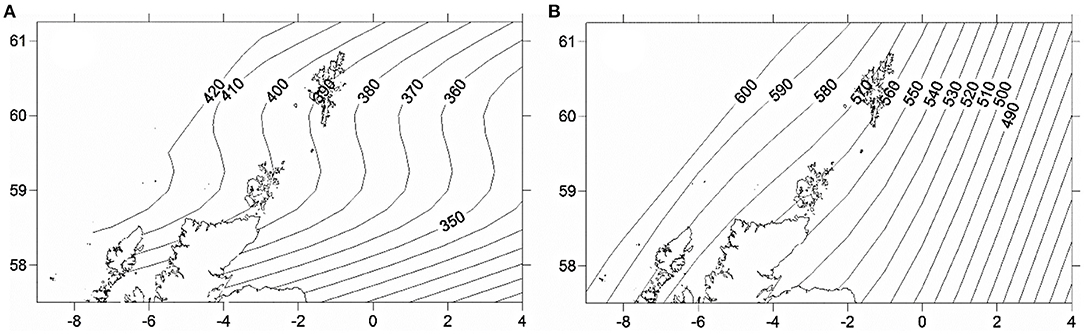
Figure 2. Predicted spatial variation in length at age 2 (A) and 3 (B) across the study area in 2014. Numbers refer to length (mm) at age isolines showing decrease from west to east.
Spatial Variation in Length at Maturity
Maturity relationships indicated significant effects of length, age, longitude, latitude and period (Table 3). Length at maturity increased from west to east in both females (Figure 3) and males for both study periods. This variation was linked to age, with a predicted 48% of age 2 females mature at 400 mm TL in the far west (ScOW) while none were observed to be mature in the Viking region in the 2013–14 period. Similarly, a predicted 80% of age 2 males were mature at 400 mm TL in the far west (ScOW) compared to 23% in the Viking region in the 2013–14 period. A slightly higher proportion of males and females were mature at length and age in the earlier period but there was no significant interaction between period and longitude in females (p = 0.46) or males (p = 0.07) indicating a similar spatial trend over time. A comparison of maturity relationships for autumn and spawning females in 2013–14 found no effect of season (p = 0.53) but with similar significant effects of length, age, longitude, and latitude to the period model (Table 4). The spatial trend in female maturity for just the genetic samples in 2013–14 was consistent with that evident from all surveyed sources, with later and larger size at maturity in the Viking region (Supplementary Table 3).
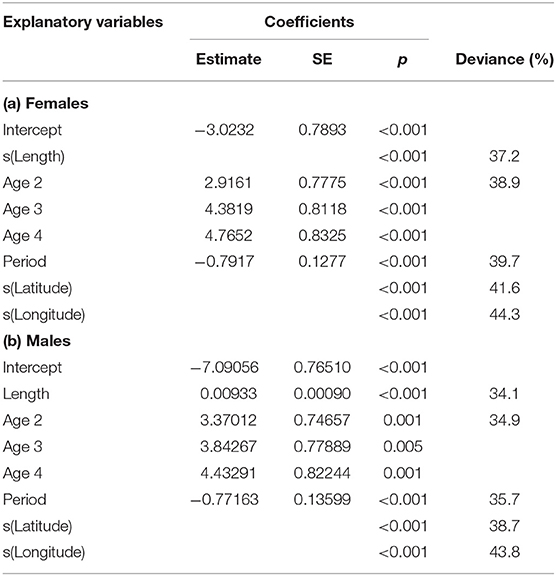
Table 3. GAM model coefficients and deviance explained for sex-related maturity in relation to length, age, period (decade), longitude, and latitude.
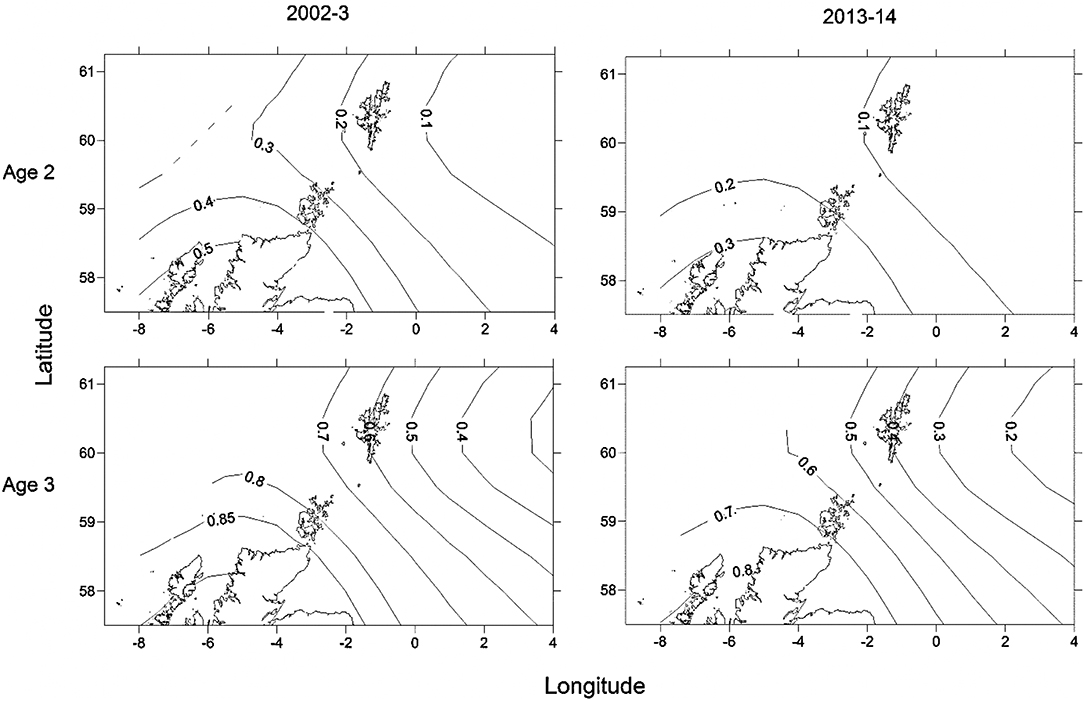
Figure 3. Predicted spatial variation in proportion mature for an age 2, 40 cm and an age 3, 50 cm female for the two sampling periods. Numbers refer to proportion mature at age isolines showing the decrease in proportion mature from south west to north east.
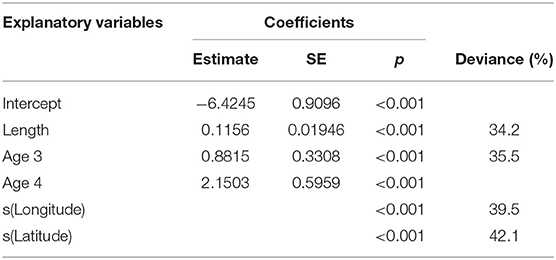
Table 4. Minimum adequate GAM model coefficients and deviance explained for female maturity in relation to length, age, longitude, and latitude for the comparison between seasons.
Evidence of Spatial and Temporal Population Structuring
No SNP loci showed consistent deviations from Hardy-Weinberg equilibrium or linkage disequilibrium across populations (Table 1). Outlier analysis identified one loci (SNP_8) as a candidate for directional selection within the dataset, this was retained for the population structure analysis. When the dataset was segregated into the four discrete sampling periods, hierarchical AMOVA analysis revealed significant values at all levels (among periods, among populations within periods and within populations) (Table 5). The differentiation observed among populations within periods was far greater than among periods themselves, implying a temporal stability in the population structuring. Global Fst over all SNPs was low but statistically significant (0.045, P = 0.001), with 36 and 33% of all pairwise comparisons within the contemporary and historic datasets, respectively, being significant. Following sequential Bonferroni correction for multiple comparisons this was reduced to 11 and 17%, respectively (Table 6). There was clear and consistent evidence of longitudinal differentiation with ScIW and Viking locations being differentiated (Fst 0.032–0.1371) during the spawning and autumn seasons in both the contemporary and earlier datasets. The presence of this longitudinal cline is also alluded to by the STRUCTURE analysis for all datasets (Figure 4).
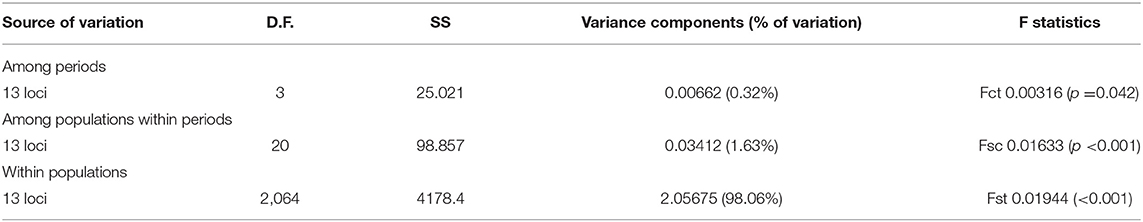
Table 5. Hierarchical AMOVA based on sampling periods.
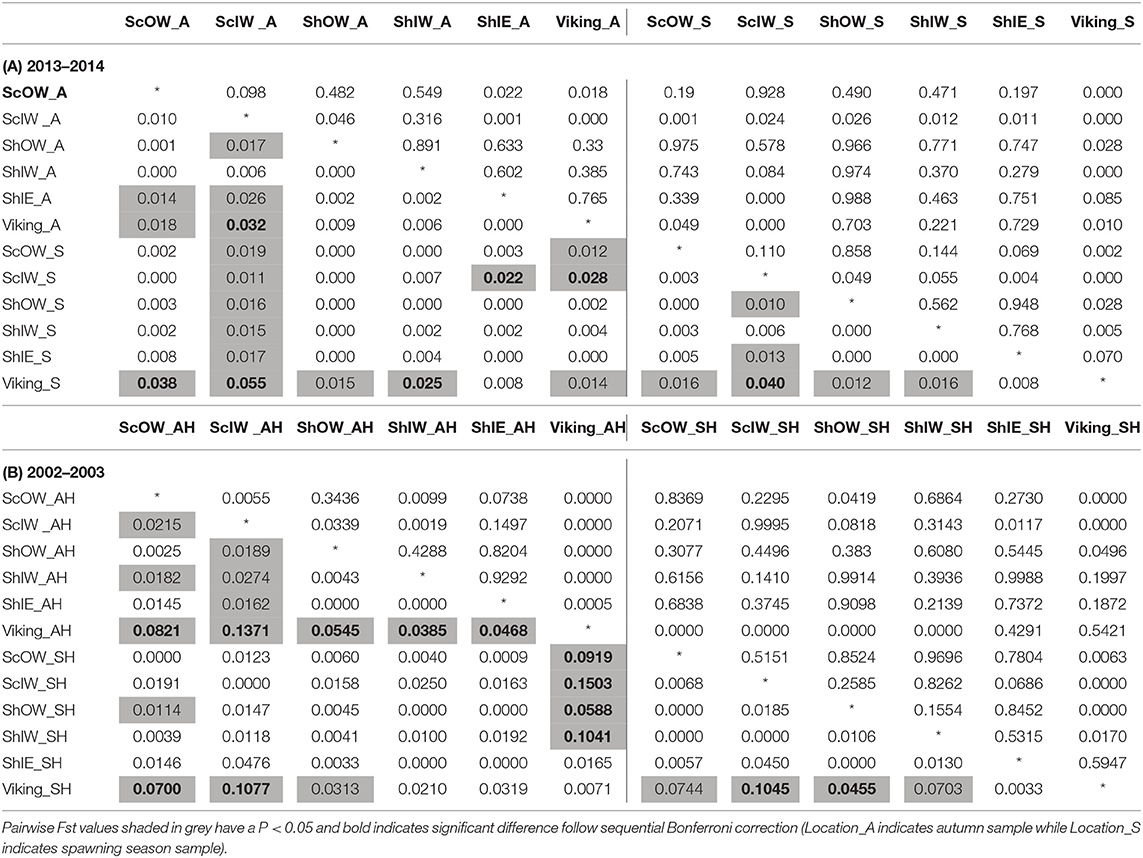
Table 6. Genetic differentiation between sample locations during (A) 2013–2014, (B) 2002–2003: pairwise Fst (below diagonal) and P-value after 1,000 permutations (above diagonal).
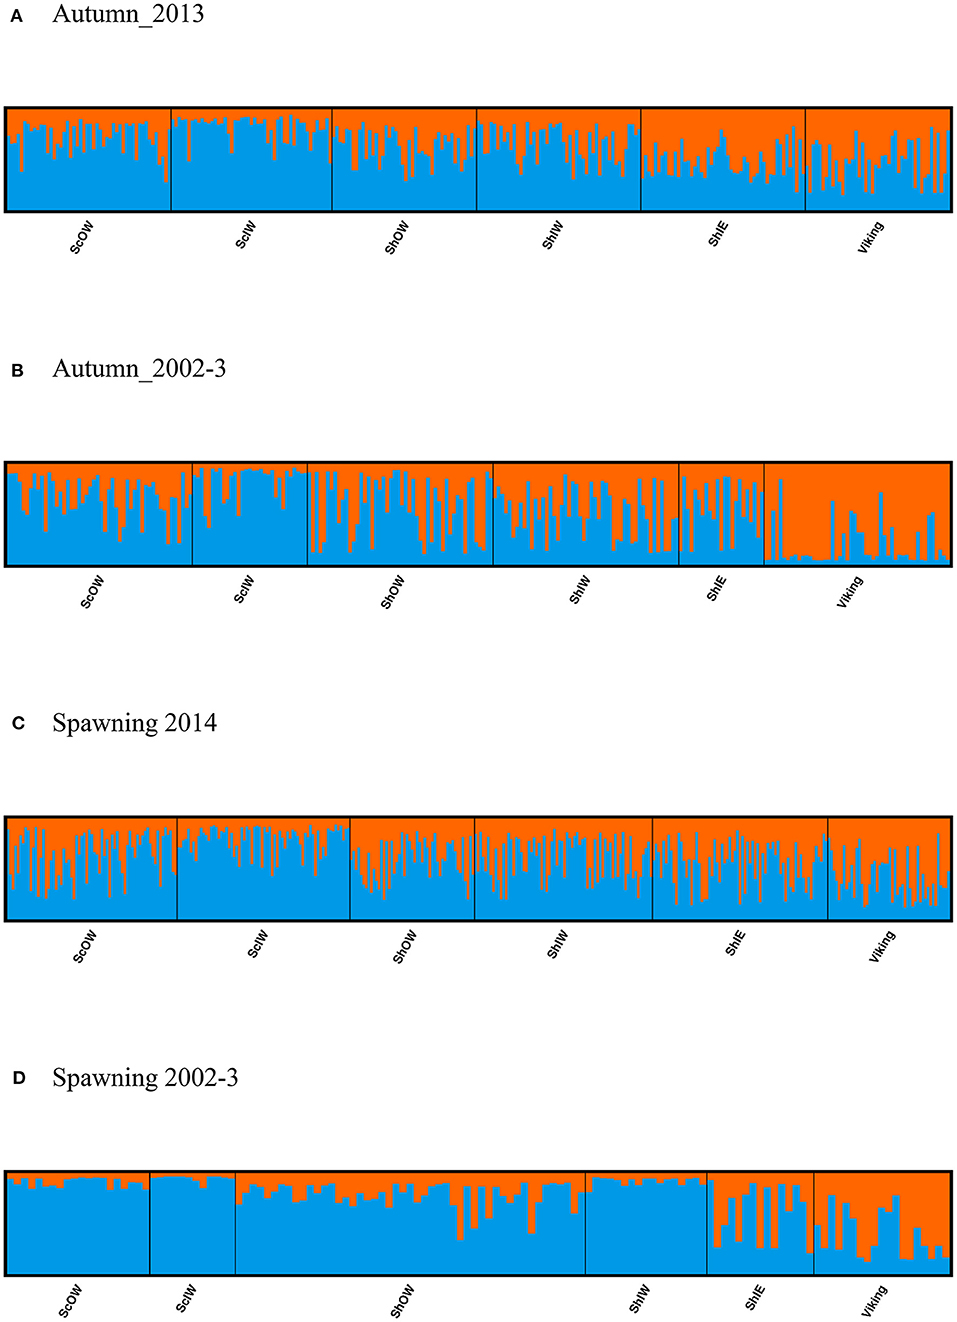
Figure 4. Results from clustering analysis using STRUCTURE with a K value of 2, population groupings are ordered to reflect geographical connectivity with individuals within a given location sorted in ascending longitudinal order for samples captured in (A,B) the Autumn and (C,D) spawning season.
Hierarchical AMOVAs per locus showed that SNP_8, which had been identified by outlier analysis to be a candidate locus under selection, as well as SNP_9 and SNP_10, all showed highly significant differentiation among populations where the average Fst was 0.0974, 0.0441 and 0.0195 per locus, respectively. Furthermore, all three loci localised to Linkage group 12 (LG12; Supplementary Table 4). When allele frequency is plotted in relation to sample longitudinal order it is clear that for both SNP_8 and SNP_10 there is a consistent longitudinal cline in allele frequency, which is suggestive of isolation by distance within the study area (Figure 5). A comparison of genetic distance with geographic separation in 2014 was also consistent with an isolation by distance trend (r2 = 0.30; P = 0.001; Figure 6), although pairwise Viking and ScIW comparisons were positive outliers with high leverage to this relationship. Conversely, the pairwise comparison between ShIW and ScOW was a negative outlier, and there was no significant difference in pairwise Fst between sites within the region to the west of Shetland except for ScIW (Table 6).
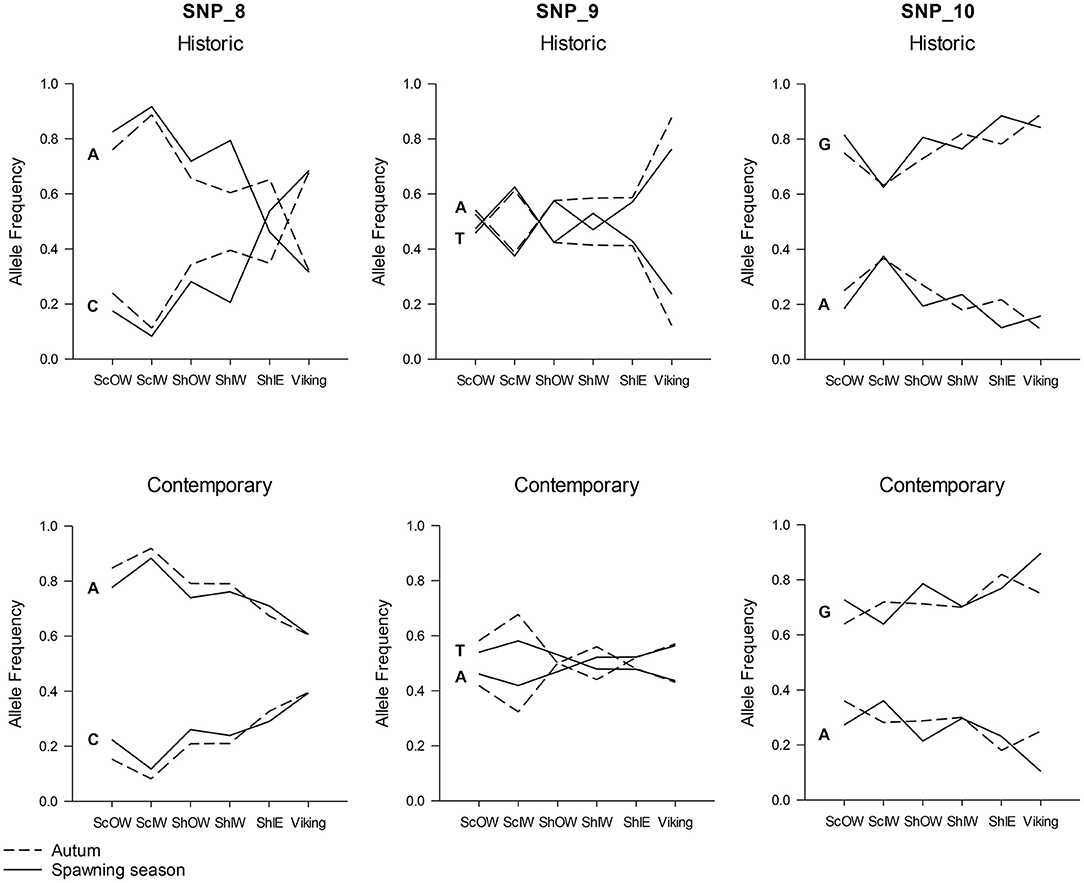
Figure 5. Change in allele frequency in loci SNP_8, SNP_9, and SNP_10 in relation to sample location with the data separated into early (above) and contemporary (below) sample series as well as taken during the spawning season (solid line) and the Autumn (broken line).
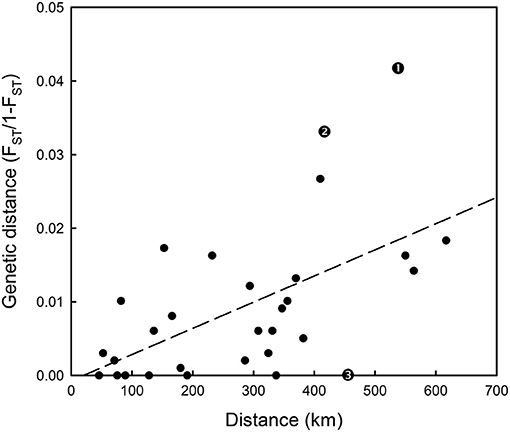
Figure 6. Isolation by distance plot based on 2013–14 spawning and autumn Fst results in Table 6 and geographical separation between samples. Fitted linear regression line is also shown. Residuals with large leverage are indicated as follows: 1-Viking and ScIW spawning, 2-Viking and ScIW autumn, 3-ShIW and ScOW autumn.
Discussion
Through the combination of phenotypic and genetic evidence this study demonstrates that spatial variation in life history traits linked to productivity reflect population structure. While spatial differences in maturity and size have previously been reported within the study area, with evidence for long term differences in maturation schedules (Yoneda and Wright, 2004; Wright et al., 2011), the fine scale analysis presented here demonstrates that this variation is related to the presence of two population units, identified as the Viking and Dogger demes by Heath et al. (2014). The fine spatial sampling of the present study has helped to define the geographic extent of adults from this Viking deme, which corresponds to the deep basin >100 m depth east of the Shetland Isles, where cod experience much cooler summer and autumn temperatures than elsewhere on the north west European shelf (Neat et al., 2014). Many larval and early juveniles from the Viking deme area appear to be advected into the Skagerrak from which they make a return migration by the time they mature (Barth et al., 2017; Wright et al., 2018). Based on the disappearance of the majority of age 2 cod from the Skagerrak (Svedäng and Svenson, 2006) and the appearance of high age 2 and 3 densities in Viking in the 1st and 3rd quarter IBTS (ICES, 2019a), this return migration is likely to occur prior to maturation.
The seasonally persistent longitudinal differentiation in both genetic and maturity at size differences provides the first evidence for year round fidelity of the population demes to their spawning areas. This is important as many fish populations, including other cod populations (Neuenfeldt et al., 2013), are known to mix outside the spawning period, which makes it difficult to consider alternative stock boundaries for monitoring and assessment. Year round fidelity can allow for a change in the stock boundaries into management areas that more closely reflect the population structure, as was the case for sandeels (Ammodytes marinus) in the North Sea (Wright et al., 2019). The indication of limited seasonal movement of cod in this study is consistent with predicted movement of individual cod based on electronic tagging records (Wright et al., 2006a; Neat et al., 2014). It suggests that the Viking population deme probably does not extend further west than around 1°W.
As with recent studies, large FST differences observed were related to genomic regions previously reported to be under selection (Berg et al., 2016; Sodeland et al., 2016; Barth et al., 2017), suggesting adaptive genomic divergence however, truly biologically distinct populations were not demonstrated. Studies of adaptive genomic divergence (Barth et al., 2019; Kess et al., 2019) and movements in other Atlantic cod stocks (Robichaud and Rose, 2004; Neuenfeldt et al., 2013) suggest two general population types; small coastal resident populations exhibiting year round fidelity and larger populations of seasonal migrants. The temporal persistence of genetic differences within the present study area, coupled to tag based evidence on adult and juvenile movements (Wright et al., 2006a,b, 2018; Neat et al., 2014), appear to at least partially conform to this pattern.
The three loci which showed highly significant population differentiation, and which included the putative marker under directional selection, were located on Linkage group 12 (LG12). Genome scans of North Sea, western Baltic and fjord-type cod have previously identified high genomic differentiation in inverted regions on LG12 (Sodeland et al., 2016; Barth et al., 2019). This inversion region, in which these three new markers co-locate, has been reported to associate with temperature preference rather than migratory vs. non-migratory ecotypes, based on studies from both sides of the Atlantic (Berg et al., 2016, 2017). This association to environmental preference is further rationalised by studies demonstrating the region contains genes associated with temperature and oxygen regulation (Bradbury et al., 2010; Berg et al., 2015). Thus, this inversion could be a prime candidate for a barrier mechanism that might act through either intrinsic (genome incompatibilities) or extrinsic (fitness effect associated with the environment) isolation. The current study utilised ddRAD as a tool to identify de novo SNP markers, as has been used in numerous other commercially relevant species (e.g., Helle et al., 2020), that could be considered informative on population structure within the focused study area. Given that the 3 loci within this inversion identified by the current work provides further independent corroboration of the potential significance of this genomic region, a further higher resolution investigation would be warranted. The longitudinal trend in allele frequency change found in this study appears to match regional temperature differences, being warm in the west and markedly cooler east of the Shetland Isles in depths >100 m (see Figure 1). Indeed, electronic tags have found that cod released in the Viking sample area experience an average temperature of 8.4°C and a range of just 1.5°C, compared to 9.6°C and an annual variation of 7–12°C for those released around Shetland and the west coast (Neat et al., 2006, 2014).
Genetic differences followed an isolation by distance pattern along a west-east gradient across the study area. Dahle et al. (2018) demonstrated a similar north–south gradient in genetic differentiation of cod along the Norwegian coast, without any distinct change in genetic variation (i.e., allelic diversity or heterozygosity). However, along the Norwegian coast, the barrier to movement is more obvious than in this study, as the cod there inhabit fjords for their entire life-cycle (Knutsen et al., 2018), while in the present study area only cod in Shetland (ShIW) and the coastal waters in the Minch and Lewis (ScIW) show high fidelity as juveniles and adults (Neat et al., 2006; Wright et al., 2006a,b). Given the longitudinal genetic gradient from west to east it is difficult to be precise about the cut-off between the two demes. However, there were significant pairwise Fst differences between Viking spawners and those west of Shetland with large positive departures from the isolation by distance trend between Viking and ScIW. Conversely, the lack of significant pairwise Fst differences among samples to the west of Shetland out to the offshore west (ScOW) may suggest a greater exchange, which would be consistent with the wide extent of adult movements in this region (Easey, 1987; Wright et al., 2006a). The Shetland coastal cod (ShIE) appear to extend onto the western edge of waters >100 m depth to around 1°W during the spawning period. Given their geographic proximity as well as tagging evidence that cod released near the east coast of Shetland and near Viking Bank have overlapping ranges east of Shetland outside the spawning season (Wright et al., 2006b; Neat et al., 2014), the genetic similarity between these two sample areas would be expected.
This study provided some evidence of genomic divergence between the west coast cod in coastal waters of the Outer Hebrides and North Rona (ScIW) and those further offshore (ScOW). It is acknowledged that the limited marker panel will have restricted the ability of the current study to resolve population components thus further genetic evidence is needed to confirm reproductive isolation. However, the separation the genetic analysis alludes to, would be consistent with the limited year round movements evident from tag-recapture studies in the area (Wright et al., 2006a). Movement of young of the year to spawning grounds estimated from otolith chemistry also suggests there is no connectivity between this area and that ~100 kms south (Wright et al., 2006b). Nursery and spawning grounds are found in close proximity to one another in ScIW (Wright et al., 2006a; Gibb et al., 2007) consistent with resident cod populations found elsewhere (Bradbury et al., 2011; Grabowski et al., 2011). The temporal stability of this pattern of structuring between samples collected a decade apart further supports the evidence for limited mixing.
The apparent reduction in genetic differences and allele frequency in the contemporary samples compared with that from the previous decade may be evidence of a greater admixture of western and Viking cod in recent times. This suggests some flexibility in population boundaries over time. The late 1990s and early 2000s, when the Heath et al. (2014) samples were obtained, reflected the lowest recorded stock biomass for both North Sea and west of Scotland cod, but there has since been some recovery in the northern North Sea (ICES, 2019a,b). Past analyses of research vessel survey data have suggested that cod may show density dependent habitat selection (Blanchard et al., 2005) and so it is possible that populations have expanded and with greater overlap between the western and Viking populations of cod.
Cod were larger at age in western waters compared to the deeper northern North Sea. Spatial differences in length at age across the study area appear to persist, based on the lack of a year effect for ages 3 and 4 and the similarity with the findings of Yoneda and Wright (2004). Waters in the west of the study area are the warmest, while coastal waters experience strong seasonal shifts (Berx and Hughes, 2009). Hence, the apparent faster growth in western waters probably reflects a positive effect of temperature, as cod growth in length remains positive up to a peak of 10°C (Righton et al., 2010) and electronic tags have recorded that fish from these waters experience temperatures close to this peak in spring and summer months, with an average annual temperature 1.2°C higher than that experienced by those inhabiting Viking Bank (Neat et al., 2014).
The large difference in maturity at length between Viking and other populations is reflected in maturity at age, with no females maturing at age 2 as was historically the case (Wright et al., 2011). The spatial variation in maturity at size at variation can explain published differences between the north east (Wright et al., 2011) and northern North Sea (Heath et al., 2014). Due to uncertainty about the spatial scale of maturity at size variation first reported by Yoneda and Wright (2004), Wright et al. (2011) grouped cod east of the meridian in waters >100 m depth into a north east group in order to examine temporal shifts in the probabilistic maturation reaction norm. This area would have included most of the Viking group evident from this study, and explains the similar length at 50% maturity between that and the present study. In contrast, the length at 50% maturity reported by Heath et al. (2014) in the early 2000s was over 20 cm smaller than that found in this study, which probably reflects the use of the ICES standard roundfish area 1, that extends from 4°W to 4°E (ICES, 2012), which would combine the early maturing coastal cod from Shetland with those from Viking.
From a fisheries management perspective, the fine scale genetic and maturity analysis indicates that the North Sea (4) and Scottish west coast (6a) stock units do not correspond to biological populations as the divergence in both genetic and maturity at size between the two demes was further east than the 4°W boundary used in the current stock areas (ICES, 2019a,b). Although there was an increase in cod in the northern North Sea from 2006 to 2017, neither stock has fully recovered (ICES, 2019a,b). Since 2011, there has been some recovery of cod biomass within the study area including the northern most part of the west coast. In contrast, there has been very little recovery in southern and central parts of the west of Scotland cod stock (ICES, 2019b), which, based on past genetic and otolith chemistry, appear to be part of one or more other populations (Wright et al., 2006b; Heath et al., 2014). The spawning stock biomass of the west of Scotland cod is very low according to ICES (2019b), which has led to a zero catch for this stock. Hence, the ability to identify recovery within a population is being compromised by inappropriate stock boundaries.
Past failure to ensure sustainable fishing mortality at a population level appears to be reflected in present day maturation schedules of many cod populations. For example, Olsen et al. (2009) proposed that only the pattern of intense harvesting could explain genetically related fine-scale variation in maturation reaction norms of coastal cod along the Norwegian coast. Differences in maturity at size and age off the north and south coast of Iceland also have been linked to differences in historical patterns of fishing mortality as well as growth (Marteinsdottir and Begg, 2002; Grabowski et al., 2011). In the present study area, fishing pressure was historically much higher in coastal areas (Engelhard et al., 2014) during the period when North Sea coastal populations have undergone large changes in maturation schedules (Wright et al., 2011). There is some suggestion from past changes in egg density and areas where spawning adults are no longer recorded that some historic spawning grounds have been lost in Scottish coastal waters (Wright and Rowe, 2019). As small, resident populations tend to inhabit coastal grounds, it is possible that some small components of the stocks have been lost. Other examples of a loss of cod spawning grounds have been reported, such as some in the Gulf of Maine (Ames, 2004). In such coastal areas the spatial scale of genetic differentiation can be very small, as studies of Norwegian coastal cod have demonstrated (Dahle et al., 2018). Hence, the present study highlights the need for measures to conserve population diversity as well as the current focus on stock biomass.
Data Availability Statement
The datasets presented in this study can be found in online repositories. The names of the repository/repositories and accession number(s) can be found at: European Nucleotide Archive (accession: ERP125845) and FigShare (10.6084/m9.figshare.13469298).
Author Contributions
PW jointly designed the study, analysed the phenotypic data, and led the writing. ADo organised sample collection, performed much of the DNA extraction, genetic analysis, and contributed to the writing. JT performed the RAD Library Construction and contributed to the genetic analysis and writing. ADa jointly designed the study, analysed the genetic data, and co-led the writing. All authors contributed to the article and approved the submitted version.
Funding
This work was funded by Fishing Industry Science Alliance project 01/13 and Scottish Government project SU01N0, ADo was funded by a Marine Alliance Science and Technology Scotland PhD studentship.
Conflict of Interest
The authors declare that the research was conducted in the absence of any commercial or financial relationships that could be construed as a potential conflict of interest.
Acknowledgments
We wish to thank Kenny Coull and Chevonne Angus and all the fish samplers from the Scottish Fishermen's Federation, Marine Scotland Science, and North Atlantic Fisheries College.
Supplementary Material
The Supplementary Material for this article can be found online at: https://www.frontiersin.org/articles/10.3389/fmars.2021.630515/full#supplementary-material
References
Altschul, S. F., Gish, W., Miller, W., Myers, E. W., and Lipman, D. J. (1990). Basic local alignment search tool. J. Mol. Biol. 215, 403–410. doi: 10.1016/S0022-2836(05)80360-2
Ames, E. P. (2004). Atlantic cod stock structure in the Gulf of Maine. Fisheries 29, 10–28. doi: 10.1577/1548-8446(2004)29[10:ACSSIT]2.0.CO;2
Balmford, A., Bennun, L., Ten Brink, B., Cooper, D., Côté, I. M., and Crane, P. (2005). The convention on biological diversity's 2010 target. Science 307, 212–213. doi: 10.1126/science.1106281
Barth, J. M., Berg, P. R., Jonsson, P. R., Bonanomi, S., Corell, H., and Hemmer-Hansen, J. (2017). Genome architecture enables local adaptation of Atlantic cod despite high connectivity. Mol. Ecol. 26, 4452–4466. doi: 10.1111/mec.14207
Barth, J. M. I., Villegas-Ríos, D., Freitas, C., Moland, E., Star, B., and André, C. (2019). Disentangling structural genomic and behavioural barriers in a sea of connectivity. Mol. Ecol. 28, 1394–1411. doi: 10.1111/mec.15010
Benson, G. (1999). Tandem repeats finder: a program to analyze DNA sequences. Nucleic Acids Res. 27, 573–580. doi: 10.1093/nar/27.2.573
Berg, P. R., Jentoft, S., Star, B., Ring, K. H., Knutsen, H., and Lien, S. (2015). Adaptation to low salinity promotes genomic divergence in Atlantic cod (Gadus morhua L.). Genome Biol. Evol. 7, 1644–1663. doi: 10.1093/gbe/evv093
Berg, P. R., Star, B., Pampoulie, C., Bradbury, I. R., Bentzen, P., Hutchings, J. A., et al. (2017). Trans-oceanic genomic divergence of Atlantic cod ecotypes is associated with large inversions. Heredity 119, 418–428. doi: 10.1038/hdy.2017.54
Berg, P. R., Star, B., Pampoulie, C., Sodeland, M., Barth, J. M., and Knutsen, H. (2016). Three chromosomal rearrangements promote genomic divergence between migratory and stationary ecotypes of Atlantic cod. Sci. Rep. 6:23246. doi: 10.1038/srep23246
Berx, B., and Hughes, S. L. (2009). Climatology of surface and near-bed temperature and salinity on the north-west European continental shelf for 1971–2000. Cont. Shelf Res.29, 2286–2292. doi: 10.1016/j.csr.2009.09.006
Blanchard, J. L., Mills, C., Jennings, S., Fox, C. J., Rackham, B. D., and Eastwood, P. D. (2005). Distribution abundance relationships for North Sea Atlantic cod (Gadus morhua): observation versus theory. Can. J. Fish Aquat. Sci. 62, 2001–2009. doi: 10.1139/f05-109
Bradbury, I. R., Hubert, S., Higgins, B., Borza, T., Bowman, S., and Paterson, I. G. (2010). Parallel adaptive evolution of Atlantic cod on both sides of the Atlantic Ocean in response to temperature. Proc. R. Soc. Lond. 277, 3725–3734. doi: 10.1098/rspb.2010.0985
Bradbury, I. R., Hubert, S., Higgins, B., Bowman, S., Borza, T., and Paterson, I. G. (2013). Genomic islands of divergence and their consequences for the resolution of spatial structure in an exploited marine fish. Evol. Biol. 6, 450–461. doi: 10.1111/eva.12026
Bradbury, I. R., Hubert, S., Higgins, B., Bowman, S., Paterson, I. G., and Snelgrove, P. V. (2011). Evaluating SNP ascertainment bias and its impact on population assignment in Atlantic cod, Gadus morhua. Mol. Ecol. Resour. 11, 218–225. doi: 10.1111/j.1755-0998.2010.02949.x
Brown, J. K., Taggart, J. B., Bekaert, M., Wehner, S., Palaiokostas, C., Setiawan, A. N., et al. (2016). Mapping the sex determination locus in the hāpuku (Polyprion oxygeneios) using ddRAD sequencing. BMC Genomics 17:448. doi: 10.1186/s12864-016-2773-4
Bucholtz, R. H., Tomkiewicz, J., Vitale, F., Dalscov, J., Wilhelms, I., Sell, A., et al. (2007). Manual to determine gonadal maturity of North Sea cod (Gadus morhua L.). ICES, 2007. Report of the Working Group on Maturity Staging of Cod, Whiting, Haddock and Saithe (WKMSCWHS), 13–16 November 2007. Copenhagen. p. 36.
Catchen, J., Hohenlohe, P. A., Bassham, S., Amores, A., and Cresko, W. A. (2013). Stacks: an analysis tool set for population genomics. Mol. Ecol. 22, 3124–3140. doi: 10.1111/mec.12354
Dahle, G., Quintela, M., Johansen, T., Westgaard, J.-I., Besnier, F., and Aglen, A. (2018). Analysis of coastal cod (Gadus morhua L.) sampled on spawning sites reveals a genetic gradient throughout Norway's coastline. BMC Genet. 19:42. doi: 10.1186/s12863-018-0625-8
Devine, J. A., Wright, P. J., Pardoe, H. E., and Heino, M. (2012). Comparing rates of contemporary evolution in life-history traits for exploited fish stocks. Can. J. Fish. Aquat. Sci. 69, 1105–1120. doi: 10.1139/f2012-047
Easey, M. W. (1987). English Cod Tagging Experiments to the North of Scotland 1977–1979. ICES CM 1987/G:48. Available online at: https://www.ices.dk/sites/pub/CM%20Doccuments/1987/G/1987_G48.pdf
Engelhard, G. H., Righton, D. A., and Pinnegar, J. K. (2014). Climate change and fishing: a century of shifting distribution in North Sea cod. Glob. Change Biol. 20, 2473–2483. doi: 10.1111/gcb.12513
Excoffier, L., and Lischer, H. E. (2010). Arlequin suite ver 3.5: a new series of programs to perform population genetics analyses under Linux and Windows. Mol. Ecol. Resour. 10, 564–567. doi: 10.1111/j.1755-0998.2010.02847.x
Fairweather, R., Bradbury, I. R., Helyar, S. J., de Bruyn, M., Therkildsen, N. O., Bentzen, P., et al. (2018). Range-wide genomic data synthesis reveals trans-atlantic vicariance and secondary contact in Atlantic cod. Ecol. Evol. 8, 12140–12152. doi: 10.1002/ece3.4672
Gibb, F. M., Gibb, I. M., and Wright, P. J. (2007). Isolation of Atlantic cod (Gadus morhua) nursery areas. Mar. Biol. 151, 1185–1194. doi: 10.1007/s00227-006-0565-0
Godø, O. R., and Moksness, E. (1987). Growth and maturation of Norwegian coastal cod and Northeast Arctic cod under different conditions. Fish. Res. 5, 235–242. doi: 10.1016/0165-7836(87)90043-9
Gonzalez-Irusta, J., and Wright, P. J. (2016). Spawning grounds of Atlantic cod (Gadus morhua) in the North Sea. ICES J. Mar. Sci. 73, 304–315. doi: 10.1093/icesjms/fsv180
Grabowski, T. B., Thorsteinsson, V., McAdam, B. J., and Marteinsdóttir, G. (2011). Evidence of segregated spawning in a single marine fish stock: sympatric divergence of ecotypes in Icelandic cod? PLoS ONE 6:e17528. doi: 10.1371/journal.pone.0017528
Heath, M. R., Culling, M. A., Crozier, W. W., Fox, C. J., Gurney, W. S. C., Hutchinson, W. F., et al. (2014). Combination of genetics and spatial modelling highlights the sensitivity of cod (Gadus morhua) population diversity in the North Sea to distributions of fishing. ICES J. Mar. Sci. 71, 794–807. doi: 10.1093/icesjms/fst185
Helle, K., Quintela, M., Taggart, J. B., Seliussen, B., Dahle, G., Glover, K. A., et al. (2020). Development of SNP for the deep-sea fish blue ling, Molva dypterygia (Pennant, 1784) from ddRAD sequencing data. Conserv. Genet. Resour. 12, 231–237. doi: 10.1007/s12686-019-01107-w
Hilborn, R., Quinn, T. P., Schindler, D. E., and Rogers, D. E. (2003). Biocomplexity and fisheries sustainability. Proc. Natl. Acad. Sci. U.S.A. 100, 6564–6568. doi: 10.1073/pnas.1037274100
ICES (2012). Manual for the International Bottom Trawl Surveys. SISP 1-IBTS. Series of ICES Survey Protocols. VIII, 68. Available online at: https://www.ices.dk/sites/pub/Publication%20Reports/ICES%20Survey%20Protocols%20(SISP)/SISP1-IBTSVIII.pdf
ICES (2019a). Working Group on the Assessment of Demersal Stocks in the North Sea and Skagerrak (WGNSSK). ICES Scientific Reports, 1:7. Copenhagen.
ICES (2019b). Report of the Working Group for the Celtic Seas Ecoregion. ICES Scientific Reports, 1:29. Copenhagen.
Kess, T., Bentzen, P., Lehnert, S. J., Sylvester, E. V. A., Lien, S., Kent, M. P., et al. (2019). A migration-associated supergene reveals loss of biocomplexity in Atlantic cod. Sci. Adv. 5:eaav2461. doi: 10.1126/sciadv.aav2461
Knutsen, H., Jorde, P. E., Hutchings, J. A., Hemmer-Hansen, J., Grønkjær, P., and Jørgensen, K. E. M. (2018). Stable coexistence of genetically divergent Atlantic cod ecotypes at multiple spatial scales. Evol. Biol.11, 1527–1539. doi: 10.1111/eva.12640
Kopelman, N. M., Mayzel, J., Jakobsson, M., Rosenberg, N. A., and Mayrose, I. (2015) Clumpak: a program for identifying clustering modes packaging population structure inferences across K. Mol. Ecol. Resour. 15, 1179–1191. doi: 10.1111/1755-0998.12387
Manousaki, T., Tsakogiannis, A., Taggart, J. B., Palaiokostas, C., Tsaparis, D., Lagnel, J., et al. (2016). Exploring a non-model teleost genome through RAD sequencing - Linkage mapping in Common Pandora, Pagellus erythrinus and comparative genomic analysis. G3 Genes Genomes Genet. 6, 509–519. doi: 10.1534/g3.115.023432
Marteinsdottir, G., and Begg, G. A. (2002). Essential relationships incorporating the influence of age, size and condition on variables required for estimation of reproductive potential in Atlantic cod Gadus morhua. Mar. Ecol. Prog. Ser. 235, 235–256. doi: 10.3354/meps235235
Neat, F., Bendall, V., Berx, B., Wright, P., Cuaig, M. Ó., and Townhill, C. (2014). Movement of Atlantic cod around the British Isles. J. Appl. Ecol.51, 1564–1574. doi: 10.1111/1365-2664.12343
Neat, F. C., Wright, P. J., Zuur, A. F., Gibb, I. M., Gibb, F. M., Tulett, D., et al. (2006). Residency and depth movements of a coastal group of Atlantic cod (Gadus morhua L.). Mar. Biol. 148, 643–654. doi: 10.1007/s00227-005-0110-6
Neuenfeldt, S., Righton, D., Neat, F., Wright, P., Svedäng, H., and Michalsen, K. (2013). Migrations of Atlantic cod in the NE Atlantic: then, now and the future. J. Fish Biol. 82, 741–763. doi: 10.1111/jfb.12043
Olsen, E. M., Carlson, S. M., Gjøsæter, J., and Stenseth, N. C. (2009). Nine decades of decreasing phenotypic variability in Atlantic cod. Ecol. Lett.12, 622–631. doi: 10.1111/j.1461-0248.2009.01311.x
Peakall, R., and Smouse, P. E. (2006). GENALEX 6: genetic analysis in excel. Population genetic software for teaching and research. Mol. Ecol. Notes 6, 288–295. doi: 10.1111/j.1471-8286.2005.01155.x
Peterson, B. K., Weber, J. N., Kay, E. H., Fisher, H. S., and Hoekstra, H. E. (2012). Double digest RADseq: an inexpensive method for de novo SNP discovery and genotyping in model and non-model species. PLoS ONE 7:e37135. doi: 10.1371/journal.pone.0037135
Pianka, E. (1976). Natural selection of optimal reproductive tactics. Am. Zool.16, 775–784. doi: 10.1093/icb/16.4.775
Pinsky, M. L., and Palumbi, S. R. (2014). Meta-analysis reveals lower genetic diversity in overfished populations. Mol. Ecol. 23, 29–39. doi: 10.1111/mec.12509
Pritchard, J. K., Stephens, M., and Donnelly, P. (2000). Inference of population structure using multilocus genotype data. Genetics 155, 945–959. Available online at: https://www.genetics.org/content/155/2/945
Raymond, M., and Rousset, F. (1995). GENEPOP (version 1.2): population genetics software for exact tests and ecumenicism. J. Hered 86, 248–249. doi: 10.1093/oxfordjournals.jhered.a111573
Righton, D. A., Andersen, K. H., Neat, F., Thorsteinsson, V., Steingrund, P., and Svedäng, H. (2010). Thermal niche of Atlantic cod Gadus morhua: limits, tolerance and optima. Mar. Ecol. Prog. Ser. 420, 1–13. doi: 10.3354/meps08889
Robichaud, D., and Rose, G. A. (2004). Migratory behaviour and range in Atlantic cod: inference from a century of tagging. Fish Fish. 5, 185–214. doi: 10.1111/j.1467-2679.2004.00141.x
Rousset, F. (2008). genepop'007: a complete re-implementation of the genepop software for Windows and Linux. Mol. Ecol. Resour. 8, 103–106. doi: 10.1111/j.1471-8286.2007.01931.x
Ruzzante, D. E., Mariani, S., Bekkevold, D., André, C., Mosegaard, H., and Clausen, L. A. (2006). Biocomplexity in a highly migratory pelagic marine fish, Atlantic herring. Proc. R. Soc. Lond. 273, 1459–1464. doi: 10.1098/rspb.2005.3463
Smedbol, R., and Stephenson, R. (2001). The importance of managing within species diversity in cod and herring fisheries of the north-western Atlantic. J. Fish Biol. 59, 109–128. doi: 10.1111/j.1095-8649.2001.tb01382.x
Smouse, R. P. P., and Peakall, R. (2012). GenAlEx 6.5: genetic analysis in excel. Population genetic software for teaching and research—an update. Bioinformatics 28, 2537–2539. doi: 10.1093/bioinformatics/bts460
Sodeland, M., Jorde, P. E., Lien, S., Jentoft, S., Berg, P. R., and Grove, H. (2016). “Islands of Divergence” in the Atlantic cod genome represent polymorphic chromosomal rearrangements. Genome Biol. Evol. 8, 1012–1022. doi: 10.1093/gbe/evw057
Stephenson, R. L. (2002). “Stock structure and management structure: an ongoing challenge for ICES,” in ICES Marine Science Symposia, Vol. 215 (Helsinki), 305–314.
Svedäng, H., André, C., Jonsson, P., Elfman, M., and Limburg, K. E. (2010). Migratory behaviour and otolith chemistry suggest fine-scale sub-population structure within a genetically homogenous Atlantic Cod population. Environ. Biol. Fishes 89, 383–397. doi: 10.1007/s10641-010-9669-y
Svedäng, H., and Svenson, A. (2006). Cod Gadus morhua L. populations as behavioural units: inference from time series on juvenile abundance in the eastern Skagerrak. J. Fish Biol. 69, 151–164. doi: 10.1111/j.1095-8649.2006.01272.x
Tobin, D., and Wright, P. J. (2011). Temperature effects on female maturation in a temperate marine fish. J. Exp. Mar. Biol. Ecol. 403, 9–13. doi: 10.1016/j.jembe.2011.03.018
Wright, P. (2014). Are there useful life history indicators of stock recovery rate in gadoids? ICES J. Mar. Sci. 71, 1393–1406. doi: 10.1093/icesjms/fsu100
Wright, P. J., Christensen, A., Regnier, T., Rindorf, A., and van Deurs, M. (2019). Integrating the scale of population processes into fisheries management, as illustrated in the sandeel, Ammodytes marinus. ICES J. Mar. Sci. 76, 1453–1463. doi: 10.1093/icesjms/fsz013
Wright, P. J., Galley, E., Gibb, I. M., and Neat, F. C. (2006a). Fidelity of adult cod to spawning grounds in Scottish waters. Fish. Res. 77, 148–158. doi: 10.1016/j.fishres.2005.10.008
Wright, P. J., Millar, C. P., and Gibb, F. M. (2011). Intrastock differences in maturation schedules of Atlantic cod, Gadus morhua. ICES J. Mar. Sci. 68, 1918–1927. doi: 10.1093/icesjms/fsr111
Wright, P. J., Neat, F. C., Gibb, F. M., Gibb, I. M., and Thordarson, H. (2006b). Evidence for metapopulation structuring in cod from the west of Scotland and North Sea. J. Fish Biol. 69, 181–199. doi: 10.1111/j.1095-8649.2006.01262.x
Wright, P. J., Régnier, T., Gibb, F., Augley, J., and Devalla, S. (2018). Assessing the role of ontogenetic movement in maintaining population structure in fish using otolith microchemistry. Ecol. Evol. 8, 7907–7920. doi: 10.1002/ece3.4186
Wright, P. J., and Rowe, S. (2019). “Reproduction and spawning,” in Atlantic Cod: The Bio-Ecology of the Fish, 1st Edn, ed G. Rose (London: John Wiley & Sons Ltd), 87–132.
Yoneda, M., and Wright, P. J. (2004). Temporal and spatial variation in reproductive investment of Atlantic cod Gadus morhua in the northern North Sea and Scottish west coast. Mar. Ecol. Prog. Ser. 276, 237–248. doi: 10.3354/meps276237
Keywords: population structure, phenotypic traits, gene flow, adaptation, Atlantic cod, fishery management
Citation: Wright PJ, Doyle A, Taggart JB and Davie A (2021) Linking Scales of Life-History Variation With Population Structure in Atlantic Cod. Front. Mar. Sci. 8:630515. doi: 10.3389/fmars.2021.630515
Received: 18 November 2020; Accepted: 11 January 2021;
Published: 05 February 2021.
Edited by:
Hui Zhang, Institute of Oceanology (CAS), ChinaReviewed by:
Yulong Li, Institute of Oceanology (CAS), ChinaShengyong Xu, Zhejiang Ocean University, China
Copyright © 2021 Wright, Doyle, Taggart and Davie. This is an open-access article distributed under the terms of the Creative Commons Attribution License (CC BY). The use, distribution or reproduction in other forums is permitted, provided the original author(s) and the copyright owner(s) are credited and that the original publication in this journal is cited, in accordance with accepted academic practice. No use, distribution or reproduction is permitted which does not comply with these terms.
*Correspondence: Peter J. Wright, cC5qLndyaWdodEBtYXJsYWIuYWMudWs=
†These authors share first authorship