 Gabriella Pantó
 Francesca Pasotti
 Lara Macheriotou
 Ann Vanreusel
- Biology Department, Marine Biology Research Group, Ghent University, Ghent, Belgium
This study provides a snapshot of the largely understudied meiobenthic and nematode communities in the Prince Gustav Channel (PGC) and Duse Bay (DB). We compared five stations sampled at different water depths along the shelf and investigated their meiobenthic community structure. We approached nematode biodiversity combining traditional taxonomic identification and high throughput sequencing (HTS), with the use of Amplicon Sequence Variants (ASVs). Additionally, we characterized the environment by primary production proxies, grain size and seasonal ice conditions. Our results suggest that the availability of organic matter and its freshness are responsible for the high densities found at all depths. However, potential factors influencing the high local and regional variability of meiofauna density and biodiversity are less clear. A bathymetric transect consisting of three stations in DB (200, 500, and 1,000 m depth) showed increasing pigment concentrations in the first centimeters of the sediment vertical profile with increasing water depth, whereas the meiofauna densities showed the opposite trend. The deepest station of DB seems to function as a sink for fine material as supported by the higher silt fraction and higher organic matter concentrations. When comparing the two basins in the PGC (1,000 and 1,250 m) and the one in DB (1,000 m), differences in terms of environmental variables, meiofaunal densities, and composition were observed. The deepest basin in PGC is located further South (closer to the highly unstable Larsen area), and marked differences with the other basins suggest that it might be experiencing different conditions as a result of its presence near the summer ice margin and its more elongated topography. Both, the shallowest and the deepest stations showed the highest number of unique sequences, suggesting a more biodiverse nematode assemblage. The morphological identification did not show significant differences in the biodiversity of all stations, differently from the ASVs approach. However, the lack of reference sequences in online databases and the thickness of nematode’s cuticule are still important issues to consider as they potentially lead to underestimations of biodiversity and functional traits.
Introduction
Ecosystem dynamics of the sea-bottom are strongly influenced by the density and diversity of organisms inhabiting marine sediments. Macro- and meiofauna organisms have proven to be especially important in investigating biodiversity, as well as characterizing ecosystem dynamics both in shallow and deep waters (Schratzberger and Ingels, 2018). Benthic communities have a positive effect on ecosystem functions by modifying the environment they inhabit, for instance facilitating the biodegradation of organic matter by microbial activity stimulation and influencing the vertical redox potential of sediments by bioturbation (Zeppilli et al., 2018; Hoffmann et al., 2019; Gogina et al., 2020). Even though meiofauna (>32 μm, <1 mm) has been historically understudied because of the tediousness of sampling and identifying such small size organisms (Schratzberger and Ingels, 2018), it plays a key role in aquatic sediments. By feeding on both microalgae and bacteria and being consumed by higher trophic levels, meiofauna taxa can be both, consumers, and producers (Vinagre et al., 2012; Carpentier et al., 2013; Schmid-Araya et al., 2016; Schratzberger and Ingels, 2018). The reduced size of meiofauna makes them extremely sensitive to even the slightest changes in sediment grain size and structure (Taheri et al., 2017; Korbel et al., 2019), but also in oxygen availability and organic load within the sediment (Hoffmann et al., 2018). Because of their short generation time and direct benthic development, free-living nematodes in particular may be able to reveal environmental perturbations on a small spatial and temporal scale, as confirmed in several studies (Kennedy and Jacoby, 1999; Moreno et al., 2011; Semprucci et al., 2015). As they represent >90% of the metazoans inhabiting marine sediments, nematodes are also considered good proxies for assessing benthic biodiversity, especially in relation to meiobenthic influence on ecosystem dynamics. In light of possible climatic changes, the analysis of the biodiversity in extremely sensitive habitats might shed light on potential impacts of ongoing and future climate stressors.
Despite polar regions being particularly sensitive to such climatic alterations, Antarctic marine-shelf habitats are still amongst the least studied on Earth. Their accessibility is limited due to logistic difficulties in light of their remoteness and the regional climatic conditions of the Antarctic (Cook et al., 2005) yet the high diversity and abundance of their biological assemblages and related ecosystem services that they provide are of main interest for a number of scientific questions. The Antarctic Peninsula (AP) is known for being one of the most impacted regions by anthropogenic global warming, which results in catastrophic events such as ice-shelf collapse, glacier thinning (Martín et al., 2009; Kunz et al., 2012), acceleration (Pritchard and Vaughan, 2007) and recession (Cook et al., 2005; Davies et al., 2012). The AP has experienced rates of atmospheric warming greater than the global mean (Vaughan et al., 2003) and a loss of 28 000 km2 of ice shelves since the 1960s (Cook and Vaughan, 2010). The Eastern Antarctic Peninsula (EAP) is particularly affected by variations in westerly circumpolar winds which are responsible for basal melting leading to the thinning and eventually the collapse of ice shelves (Oppenheimer, 1998; Rignot and Jacobs, 2002; Polvani et al., 2011; Pritchard et al., 2012). From a global warming perspective, it is appropriate to assume that further increase of average global temperatures will lead to dramatic and irreversible changes in the AP (Etourneau et al., 2019; Siegert et al., 2019), especially the already unstable EAP ice shelf.
The ecosystem of the AP is characterized by high primary productivity, with large phytoplanktonic blooms that have a bottom-up effect in sustaining the regional food web, strictly linked to the seasonality of sea-ice dynamics (Prezèlin et al., 2000; Nardelli et al., 2018). When the sea ice has melted and the ocean surface is exposed to solar radiation, conditions are favorable for phytoplankton to grow, and productivity reaches its maximum (Moline and Prezelin, 1996). Previously ice-covered benthic areas seasonally experience a shift to higher phytoplanktonic abundance due to the temporary system transition to more open waters (Montes-Hugo et al., 2009). Because primary productivity is of crucial importance for shaping the communities of benthic organisms living in shallow and deep sediments, ice cover and changes in ice dynamics (determining a shift to open water systems and possibly changing the amount of OM depositing on the seafloor) are essential players when studying the meiofauna community of polar ecosystems.
While morphological identification is still a common practice used in meiofauna diversity assessments, the development of molecular techniques as high throughput sequencing (HTS) has opened the possibility to analyze a larger set of samples in a much shorter timeframe, often resulting in faster and more reliable analysis (Brannock et al., 2018; Steyaert et al., 2020). Molecular approaches can overcome some of the limitations of microscope-based identification: for example, the detection of cryptic species (i.e., individuals with same morphological features but different DNA sequences) is not possible based solely on morphological identification. Traditional meiofauna identification is in fact time-consuming and requires a specific expertise, thus molecular techniques are being increasingly used as alternative diagnostic approach (Dell’ Anno et al., 2015; Fonseca et al., 2017; Macheriotou et al., 2019). Disadvantages of the molecular analysis for species identification mainly lie in the incompleteness of online databases used to assign the taxonomical label to a specific DNA sequence and the need to find the right marker for a specific community (Ahmed et al., 2015). Nevertheless, many studies of the last decade have proven this approach to be particularly useful when dealing with such abundant organisms as nematodes, particularly by means of DNA metabarcoding and the use of Amplicon Sequence Variants (ASVs) (Macheriotou et al., 2020; Steyaert et al., 2020).
By analyzing the meiofauna and specifically nematodes along a depth gradient in Duse Bay (DB) and by comparing two adjacent deep basins in the Prince Gustav Channel (PGC), the following hypothesis were tested: (i) the community composition and density of meiofauna and nematodes along a bathymetric transect in DB is dependent on changes with depth and the related environmental variables; (ii) meiobenthic community structure in the three deep basins is dependent on local small-scale variability drivers and seasonal sea-ice cover; (iii) the use of ASVs efficiently provides accurate information on the connectivity of nematode communities along the shelf and thus possible gene flow between stations.
Materials and Methods
Study Sites and Sampling Methodology
The focus of this study are the meiobenthic communities of the PGC and DB, both situated in the EAP. The PGC is a 6–7 km narrow seaway enclosed between the Trinity Peninsula and the James Ross and Vega Islands, northeast of the AP. The bathymetry of the channel is characterized by a “U-shaped” 1,000–1,250 m deep trough with steep walls interrupted by shallow ledges, which separate the deep basins (Camerlenghi et al., 2002). As part of the AP, the PGC has been characterized by the collapse of its ice-shelf since the late 1980s. The glacier dynamics in the region are particularly sensitive to ice-shelf back pressure (which slows down the ice-shelf movement toward the ocean); in fact, the rapid retreat of glaciers after a collapse event seems to be common in the PGC and Larsen A and B districts (Rott et al., 2002). This is confirmed by the disintegration of the PGC ice shelf and Larsen A embayment in 1995 and the northern and central sections of the Larsen B embayment in March 2002, which resulted in considerable ice losses due to intensified ice discharge (Shuman et al., 2011). Mass reduction has been recorded until recent times, and frontal retreat and intensification of calving fluxes is expected to occur in correlation to glaciers which showed significant temporal variations of ice flow during recent years (Rott et al., 2018). DB is a sheltered inlet situated on the south side of the Trinity Peninsula, between Tabarin Peninsula and View Point (Figure 1). It is characterized by extremely rapid glacier loss compared to the rest of the region, together with Larsen Inlet, Sjögren Inlet, and Eyrie Bay (Davies et al., 2012). The topography of the area is characterized by a steep slope. Understanding that limited information is available on the benthic ecology of DB, this study represents an initiative for further studies in the area. The designated sites for this study were two deep basins along the PGC at 1,250 and 1,000 m, and a bathymetric transect in DB (200, 500, and 1,000 m depth; Table 1). The study area and sampling stations are shown in Figure 1.
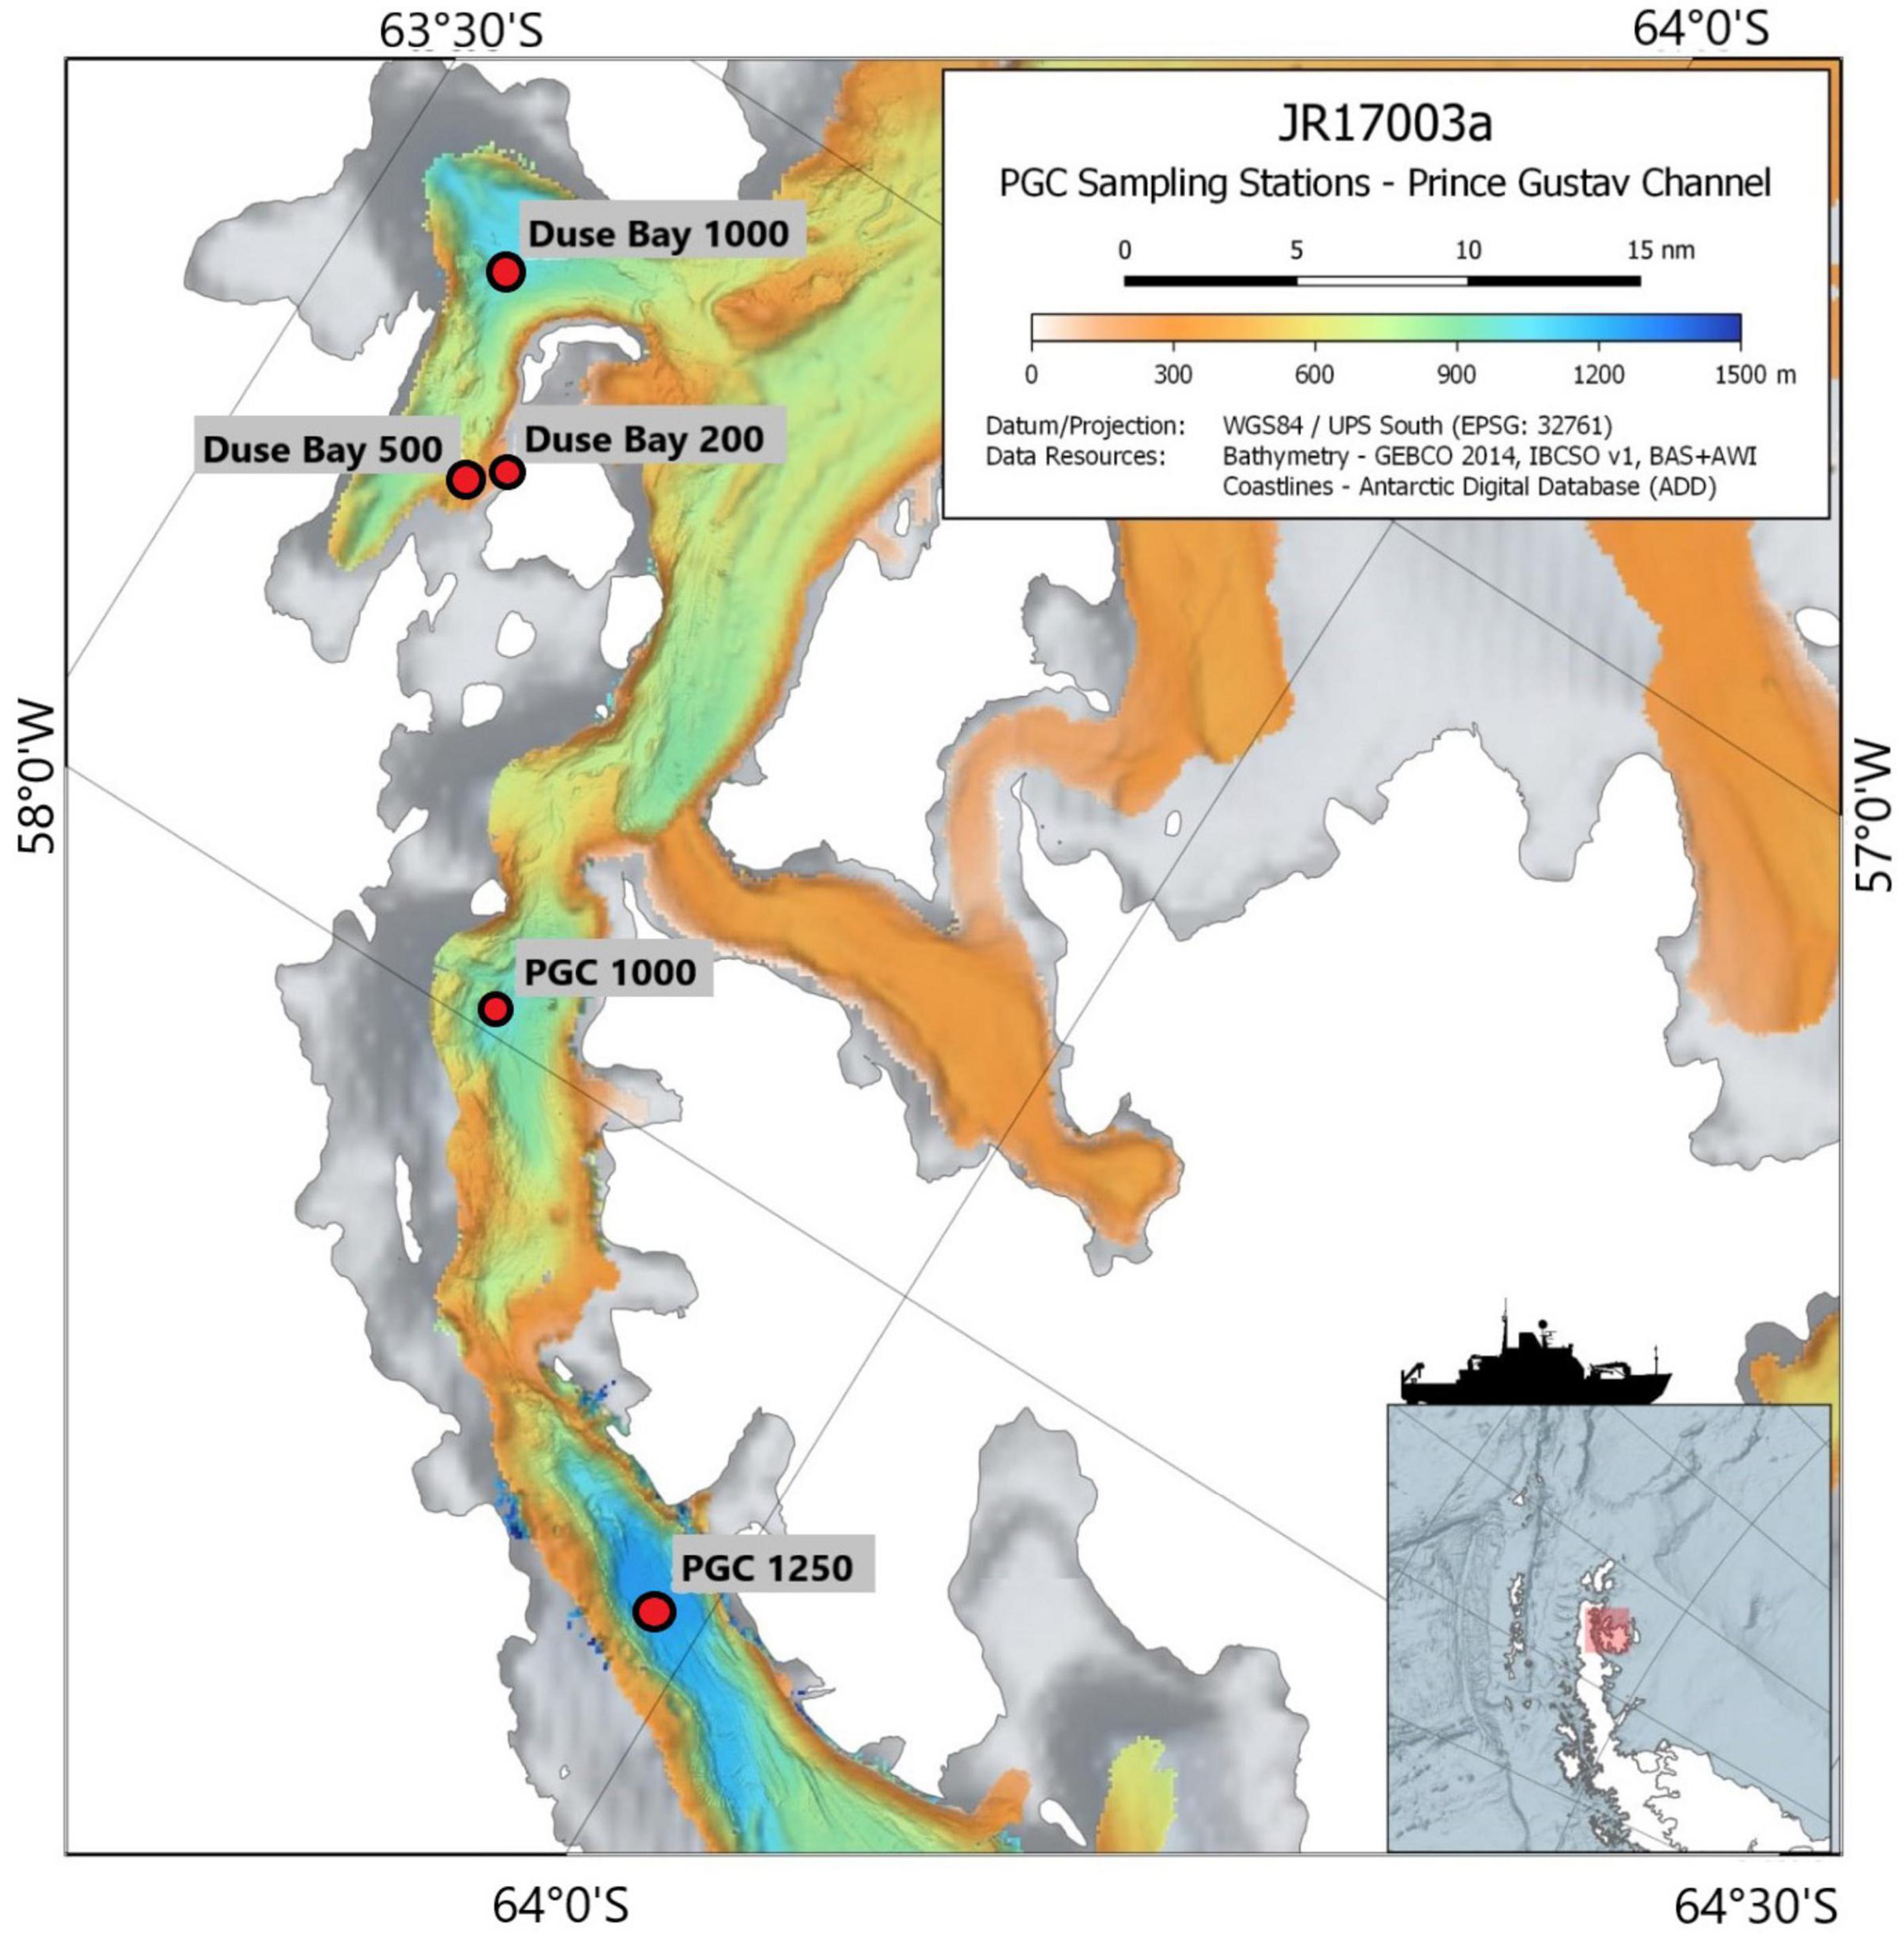
Figure 1. Sampling stations in the Prince Gustav Channel (PGC, 1,000 and 1,250 m) and Duse Bay (DB, 1,000, 500, and 200 m). Bathymetric map courtesy of: “British Antarctic Survey” and “Bathymetry Group of the Alfred-Wegener-Institute.”
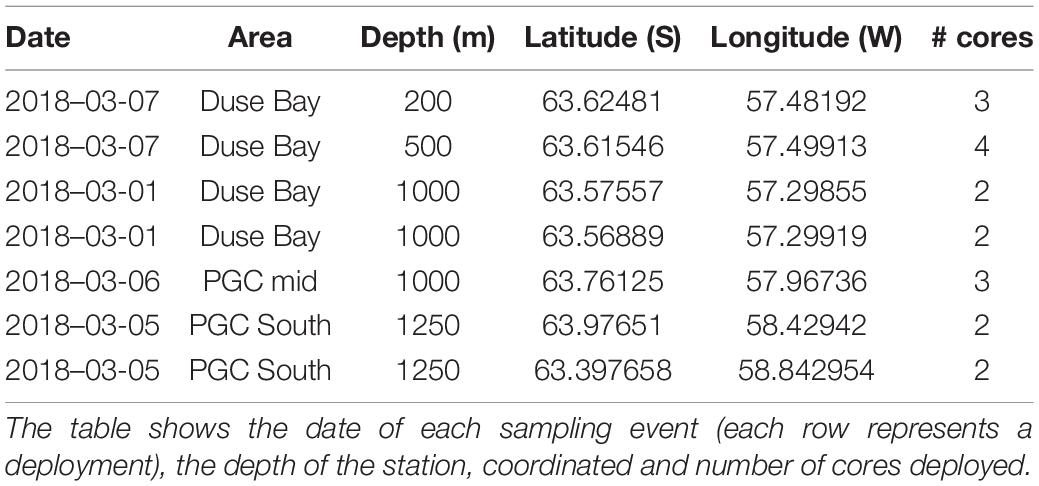
Table 1. Overview of stations sampled during the RRS James Clark Ross cruise JR17003a (February–March 2018).
Sampling was carried out during the RRS James Clark Ross cruise JR17003a in February-March 20181. Sediment samples were collected using a 12-core Multicorer (MUC) type Oktopus, each core having an inner diameter of 10 cm. At each station three to four cores were collected from the same or different MUC deployments, as shown in Table 1. Limitations on the amount of deployments were dictated during the cruise by the ice conditions and time constraints. Overlying water from each intact core was filtered over a 32-μm sieve and preserved with the corresponding sediment sample. For each core, the sediment was divided in equal horizontal slices of 2 cm, down to 8 cm depth. In turn, each slice was equally divided in two subsamples and preserved in different conditions according to the prospected analysis. Specifically, the first half was stored in a 250 mL container and fixed with 4% formaldehyde (buffered with pre-filtered seawater) for morphological meiofauna community analysis (density, biodiversity). The second half was placed in plastic bags and frozen at −80°C for molecular analysis of meiofauna (i.e., metabarcoding) and for the examination of environmental variables (pigments, organic matter, sediment grain size).
Environmental Parameters: Pigments and Granulometry Data
From the frozen sliced cores, 250 mg of sediment was subsampled from each layer for phytopigment analysis. Environmental parameters included phaeopigments, organic matter and sediment grain size (Table 2). Pigments were extracted with acetone (90%, 8 mL), ultrasonicated for 30 s and further extracted overnight at 4°C. Subsequently, samples were centrifuged for 10 min at 4,000 rpm (4°C) and the supernatant was filtered through 0.2 μm Polytetrafluoroethylene (PTFE) membrane filters (VWR International). As described by Van Heukelem and Thomas (2001), pigments were then separated on a HPLC equipped with a cooled auto-sampler, column heater, a photodiode array detector and a fluorescence detector as described. Authentic pigment standards together with compounds isolated from reference cultures were used to calibrate the system following the Scientific Committee on Oceanic Research (SCOR) protocols (DHI, Denmark). Finally, the concentration of individual pigments was calculated using the response factor of standard pigments (Van Heukelem and Thomas, 2001) and it is reported as μg/g. Sample preparation for total organic carbon (TOC; expressed as% Corg w/w – weight of carbon to total weight of sediment) and total nitrogen (TN) (expressed as % N) was performed by first drying and homogenizing the sediment. Subsequently, 37% HCl (purity grade) was added to TOC samples for decalcification. TOC and TN contents were measured using Flash 2000 NC Sediment Analyser from Interscience. Grain size was estimated using the Mastersizer Hydro 2000G (MALVERN) particle size analyser: the measurable particle range size is between 0.01 and 2,000 μm in volume percent. The grain size classes used were the following: clay (<4 μm), silt (4–63 μm), and sand (63–500 μm). Grain size distributions were evaluated with the Mastersizer 2000 5.4 program.
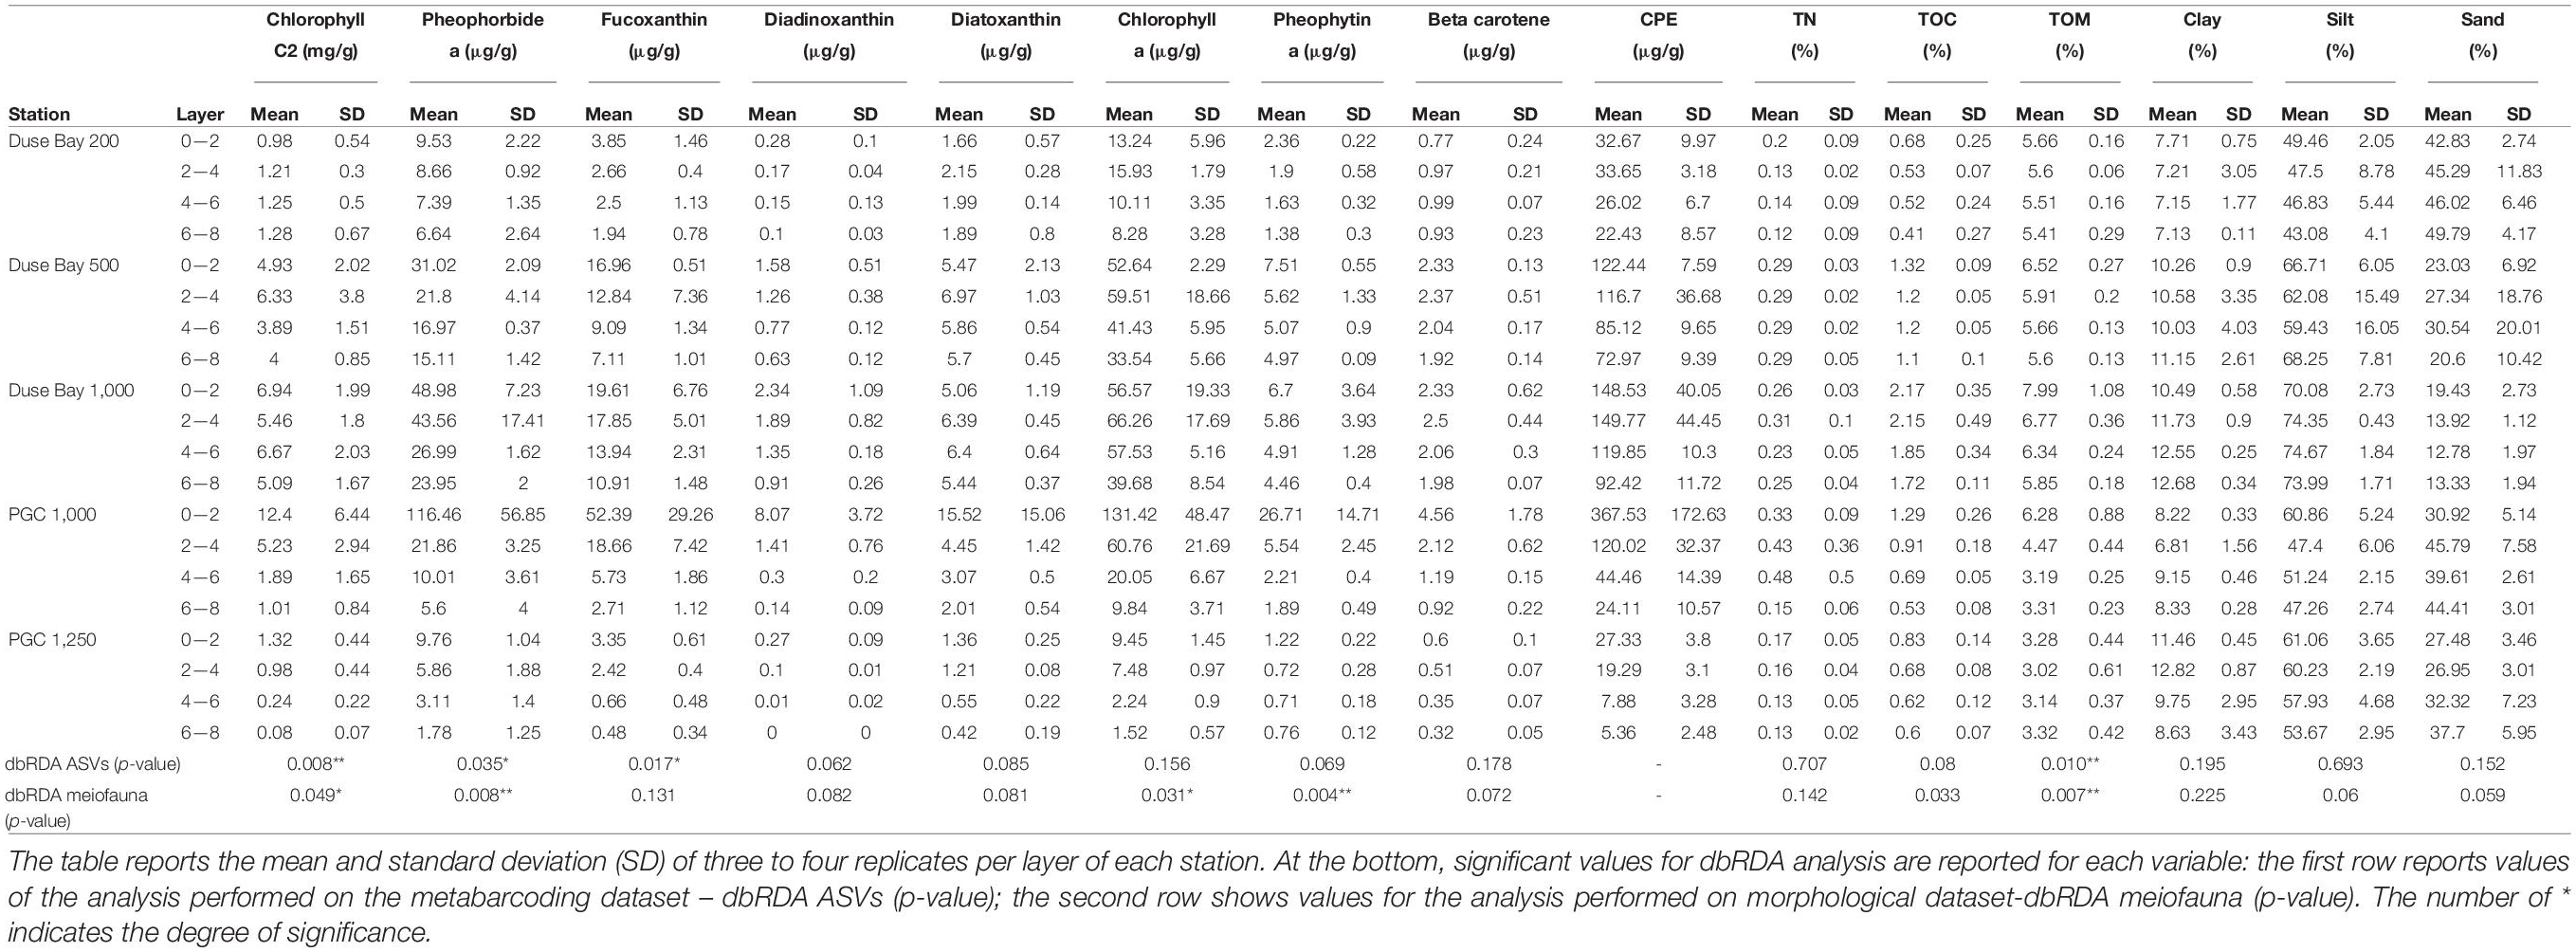
Table 2. Concentration of all the environmental variables analyzed.
Meiofauna Extraction and Characterization
The volume of each sample was recorded after sedimentation in a 250 mL cylinder before extracting the meiofauna fraction. Samples fixed in 4% formaldehyde were then sieved over a 1,000-μm sieve on top of a 32 μm sieve. Organisms larger than 1,000-μm (macrofauna) were dyed with Rose Bengal (0.5 g L–1) and stored in 4% formaldehyde for further analysis. The meiofauna fraction (between 1,000 and 32 μm) was extracted by density-gradient centrifugation (3 × 12 min, at 3,000 rpm) with the colloidal silica polymer LUDOX HS40, with a specific density of 1.18 g/cm3 (protocol described in Heip et al., 1982; Vanhove et al., 1999). The resulting extracted sample was finally dyed with Rose Bengal (0.5 g L–1) and stored in 4% formaldehyde. The meiofauna was counted at the stereomicroscope. The counting of the most abundant taxon (Nematoda) was performed with the use of an eight-chambered meiofauna sample-splitter (Jensen, 1982). Three out of the eight chambers were randomly chosen as sub-replicates to count nematodes, copepods and copepoda nauplii. Organisms were initially identified to higher taxon level, and results were standardized to individuals per 10 cm–2. We conducted a preliminary inspection on the entire sediment vertical profile at each station to establish which layer hosted the majority of the organisms. The first 2 cm of the sediment are expected to harbor the majority of meiofaunal taxa, which has been reported in previous studies (Ingels et al., 2012) and confirmed by the results of the vertical abundance analysis in this study (Supplementary Annex A). Quantification of meiofauna was performed on three replicates (A–C) per station: the abundance analysis of the first replicate (A) was done along the complete depth gradient whereas for the other two replicates only the first 0–2 cm layer was considered. Given the high patchiness and variability of nematode communities within the sediments, it might be necessary to assume a high standard deviation also in the deeper layers of the sediment. For these reasons, the results of the vertical gradient analysis (Supplementary Annex A) must be interpreted with care and such considerations taken into account.
Taxonomical Identification of Nematoda
At each station, 80 nematodes specimens from three replicates were picked out from 0 to 2 cm layer, transferred to anhydrous glycerol (Seinhorst, 1959) and mounted on glass slides for identification to genus level. The relatively low number of nematodes identified per replicate (in other studies the number ranges between 100 and 200 specimens), and the choice to analyze only the first 0–2 cm layer is related to the time-consuming identification process and the weight of the morphological analysis in this study. Further, the most abundant genera and their species would be represented in correct proportions in the small subsample used for morphological identification, and their relative importance within the sample would be still the highest. This would constitute meaningful support information to the molecular dataset (ASVs). The molecular analysis allows the identification of a higher number of individuals in a shorter timeframe and (hypothetically) with more accuracy, hence metabarcoding analysis (ASVs) was prioritized for biodiversity assessment over the use of the morphological dataset, which was instead used to integrate any missing information. The Taxonomical classification was carried out following the online key for free living marine nematodes (NeMysKey©, Bezerra et al., 2021) and the pictorial key from Warwick et al. (1998), based on relevant morphological traits (buccal cavity, tail, amphid, and reproductive organs). Nematode were then divided into trophic guilds following the subdivision suggested by Wieser (1953), considering the structure of their buccal cavities. Specifically, the guilds were: selective deposit feeders (1A) with small buccal cavities mainly feeding on bacteria; non-selective-deposit feeders (1B), characterized by a larger unarmed buccal cavity expected to feed on detritus and particulate organic matter; epistrate feeders (2A), with one or more small teeth to perforate the outer shell of unicellular organisms such as microalgae; predators/omnivores (2B), usually larger nematodes with cuticularized teeth (and possibly strong mandible structures) that predate on other meiofauna organisms and/or ingest detritus particles.
Metabarcoding Analysis
DNA Extraction
The molecular analysis of meiofauna was performed on the entire vertical profile (0–8 cm) of all frozen samples (three to four replicates per station). Samples frozen at −80°C were initially defrosted and meiofauna was extracted following the density-gradient centrifugation procedure using LUDOX HS40. The sieved samples were stored in CTAB in 1.5 mL Eppendorf tubes and frozen at −20°C. Genomic DNA extraction was performed by adding 6 μL proteinase-K (10 mg/mL) to the defrosted samples and centrifuging for 5 min at 14,000 rpm at room temperature. The formed pellet was grounded and bead-beaten for 2 min at 30 cycles/s in order to break nematodes’ membranes and tubes were then incubated for 1 h at 60°C before adding ammonium acetate (250 μL, 7.5 M). The samples were then centrifuged for 10 min at 14,000 rpm and 750 μL of the supernatant were transferred into a sterile 2.0 mL Eppendorf tube; subsequently 750 μL of cold 80% isopropanol was added. Tubes were incubated for 30 min at room temperature and centrifuged for 10 min at 14,000 rpm at 4°C. After the removal of the supernatant, samples were incubated on ice for 30 min with 1 mL of washing buffer (solution of 10 mM ammonium acetate in 76% ethanol) to remove salts. Tubes were centrifuged for 5 min at 14,000 rpm at 4°C, the supernatant was removed and the pellet was stored in 20 μL of sterile milliQ water. The samples were then stored frozen at −20°C.
Library Preparation and Sequencing
Using the “16S Metagenomic Sequencing Library Preparation” protocol (Amplicon et al., 2013) SSU_F_04-SSU/22_R primers (GCTTGTCTCAAAGATTAAGCC and TCCAAGGAAGGCAGCAGGC, respectively) were assembled with Illumina overhang adapters. The above mentioned primers were used to amplify the 18S (V1–V2 region) ribosomal locus of each sample in triplicate, using the PCR conditions shown in Annex B (Supplementary Material). The PCR mix comprised 8.4 μL of PCR-grade H2O, 4 μL Phusion Buffer, 4 μL Dye, 0.4 μL dNTP (10 mM), 1 μL forward and reverse primer (10 μM), 0.2 μL Phusion Hot Start II High Fidelity Polymerase (New England BioLabs, United States) and 1 μL DNA template, for a total sample volume of 20 μL. All DNA templates were initially diluted 1/10,000: failed amplifications were readjusted with lower ratios (1/1,000, 1/100, and 1/10 dilutions depending on the sample). To confirm amplification of the DNA, PCR products were run on a 1% agarose electrophoresis gel and triplicates pooled. Samples were then purified using Agencourt AMPure XP beads and run on Bioanalyzer 2100 to confirm length and size distribution of the PCR fragments. The FC131-1002 NexteraXT Index Kit (Illumina, United States) and Kapa High Fidelity PCR kit (Kapa Biosystems, United States) were used to implement library indexing. The mix consisted of 11.25 μL PCR-grade water, 5 μL Buffer, 0.75 μL dNTPs (10 mM), 2.5 μL Index1 and Index2, 0.5 μL Kapa Hot Start High Fidelity Polymerase and 2.5 μL PCR product. Index PCR conditions are shown in Annex B (Supplementary Material). Indexed PCR products were then purified a second time using Agencourt AMPure XP beads; they were run on a Bioanalyzer 2100 to confirm successful indexing and DNA concentration of each sample was measured using Qubit® dsDNA High Sensitivity Assay Kit. Finally, biological replicates were pooled and sequenced at Edinburgh Genomics on an Illumina MiSeq-v3 2 × 300 bp paired-end read run2.
Sequence Data Analysis
The removal of gene-specific adapter sequences was performed using Cutadapt (v1.12) where sequences were truncated from the 5′ and 3′ read ends. By truncating the forward and reverse reads (respectively at 225 and 250 bp), ASVs were generated, following the Dada2 tutorial3. Subsequently, taxonomic assignment of ASVs was performed in Qiime1 (assign_taxonomy.py) using the Naive Bayesian RDP28 classifier, with an estimate confidence of 0.80 (Macheriotou et al., 2019). The process was completed in two steps: the first step included the employment of a large eukaryotic reference training set (Silva release 123 for Qiime1, 99% OTUs and UGent nematode Sanger sequences; n = 20,201); the second step consisted in the extraction and isolation of all the ASVs which were identified as “Nematoda,” in order to have a comprehensive list of nematode sequences separated from the rest of the meiofauna species. The taxonomic assignment (until genus level) was then completed using another, smaller training set (2,178 sequences) containing nematodes exclusively. Finally, the samples were rarefied to the lowest count (n = 25,258) (Qiime1, alpha_rarefaction.py), for further statistical analyses.
Statistical Analysis
Environmental Variables and Morphological Dataset
The meiofauna community dataset and the environmental parameters were initially subjected to univariate data exploration to assess the dispersion of the data. Afterward, a multivariate analysis on the 0–2 cm layer of the meiofauna community data and all environmental variables was performed. This was done with a non-parametric permutational analysis of variance (PERMANOVA) in both cases. Subsequently, a PermDisp analysis (permutational analysis of multivariate dispersion) was used to test for differences in meiofauna densities between groups (Stations). A pairwise comparison was then performed on significant results. For the analysis of morphologically identified meiofauna, a two-factor design was used (the fixed factor “Station” and the factor “Replicate” nested into “Station”), whereas a three-factor design was adopted in the analysis of the environmental variables (the fixed factor “Station,” the factor “Replicate” nested into “Station” and the fixed “Layer” factor). For the environmental parameters’ analysis, a resemblance matrix was calculated based on Euclidean distances, whereas a Bray–Curtis similarity matrix was used for the meiofauna community. Meiofauna abundance data were fourth root transformed prior to the analysis in order to decrease the influence of most abundant taxa (i.e., Nematoda). Environmental parameters – Chlorophyll C2, Pheophorbide a, Fucoxanthin, Diadinoxanthin, Diatoxanthin, Chlorophyll a, Pheophytin, Beta Carotene, CPE, TN, TOC, total organic matter (TOM) – with different units were analyzed together (Table 2) hence normalization was carried out prior to the analyses. Multicollinearity of environmental parameters was tested by means of correlation matrix (Pearson’s method). A distance-based redundancy analysis (dbRDA) was used to investigate the relationship between meiofauna and the environmental variables. This was based on Bray–Curtis distance and included automatic data standardization using the “metaMDSdist” argument. Environmental parameters were considered as predictor variables. To graphically visualize the different variation of the environmental variables between stations, a principal component analysis (PCA) was performed both on the complete dataset and subsets considering the significant factors of the dbRDA (Table 2). For the analysis of biodiversity, individual numbers of nematode species identified by morphological identification were standardized to ind/10 cm2 prior to further statistical analysis. Biodiversity indexes were used to test the degree of diversity at each station, particularly the Shannon–Wiener test and the Simpson’s test were performed on the dataset. All analysis were performed with the “vegan” and “ggplot2” packages on Rstudio (v 3.6.1) versions 2.5–5 and 3.2.1.
Amplicon Sequence Variants Dataset
A multivariate analysis on the entire depth gradient (0–8 cm) of the ASVs dataset was performed (all replicates). The non-parametric PERMANOVA was used on the nematodes’ subset, followed by a PermDisp analysis (permutational analysis of multivariate dispersion). A three-factor design was adopted in the analysis of nematodes’ ASVs (the fixed factor “Station,” the factor “Replicate” nested into “Station” and the fixed “Layer” factor) using the Bray–Curtis similarity matrix. Data were fourth root transformed prior to the analysis in order to decrease the influence of the most abundant genera. A non-metric Multi-dimensional Scaling (nMDS) was subsequently performed on the relative abundance of nematode genera. The dbRDA was calculated to study the relationship between the nematodes community and the environmental variables at each station. The distance matrix was based on Bray–Curtis dissimilarity matrix and data were standardized using the “metaMDSdist” argument. An “adonis” analysis confirmed the significance of the model used. Environmental parameters were considered as independent variables while nematode community was the response variable. All above mentioned analysis were performed in Rstudio (version 3.6.1) using the “vegan,” and “ggplot2” packages (versions 2.5–5 and 3.2.1, respectively). To graphically visualize the intersection of the five ASVs datasets (where each station is a set), UpSet plots were generated using the “UpsetR” package (version 1.4.0) in Rstudio. The Upset plot shows the commonality between overlapping datasets (intersection between groups): it gives information both on the unique sequences present at a specific site and on the number of sequences shared between selected datasets (i.e., stations). Further biodiversity tests were performed by means of diversity indexes, particularly the Shannon–Wiener (H), Simpson (D), and inverse Simpson’s (1/D) indexes. Although both indexes provide similar information on communities’ diversity, they are differently influenced by species abundance, particularly the Shannon index is more affected by richness and rare species, while Simpson’s index gives more weight to common species. The use of both indexes can provide a more complete set of information on diversity. A PERMANOVA analysis was performed on the biodiversity indexes to test for significant differences between stations.
Results
Grain Size
Clay content of the 0–2 cm layer was rather constant among stations, ranging between 7 and 11%. In contrast, silt percentage was higher in DB 1,000 m (73%) and the two deep basins in PGC where it represented about 73 and 50% of the sediment, respectively. The three stations in DB clearly show a decreasing silt gradient with decreasing depth, from 73% (1,000 m) to 64% (500 m) to 46% (200 m). Interestingly, the two deep basins in PGC had a sand concentration more similar to DB 200 m than DB 1,000 m, although the silt fraction was high at all stations (Supplementary Annex C). In general, the grain size composition did not differ much along the sediment depth gradient, with all four layers showing similar concentrations (Table 2).
Pigments and Organic Material
The highest values of CPE in the 0–2 cm layer were observed in PGC 1,000 m (367.5 ± 172.63 μg/g), greatly exceeding that of the other stations (values ranging between 32.7 and 148.5 μg/g, see Supplementary Annex C). A clear increase along the bathymetric transect in DB was visible: a mean value of 32.7 ± 9.97 μg/g was observed at 200 m depth, 122.4 ± 7.59 μg/g at 500 m and 148.5 ± 40.05 μg/g at 1,000 m. The most southern and deepest station at PGC (1,250 m) showed the lowest concentration of CPE (27.3 ± 3.8 μg/g) and Chlorophyll a (9.45 ± 1.45 μg/g). The results of the Chl-a: CPE ratio were similar across stations, ranging between 0.34 and 0.43 (Supplementary Annex C). TOM showed high values in all the stations except PGC 1,250 m, where the lowest value was recorded (3.28 ± 0.44%), and followed no specific vertical gradient distribution within the sediment layers (Supplementary Annex D). The Chl-a vertical gradient did not decrease with sediment depth in DB in contrast to the PGC stations (Figure 2). In fact, the Chl-a was most abundant in the 2–4 cm layer in all three stations of DB. The vertical gradient of CPE followed the same trend as Chl-a, except for the DB 200 m station, where the amount of Chl-a decreased with depth (Supplementary Annex E and Figure 2, respectively).
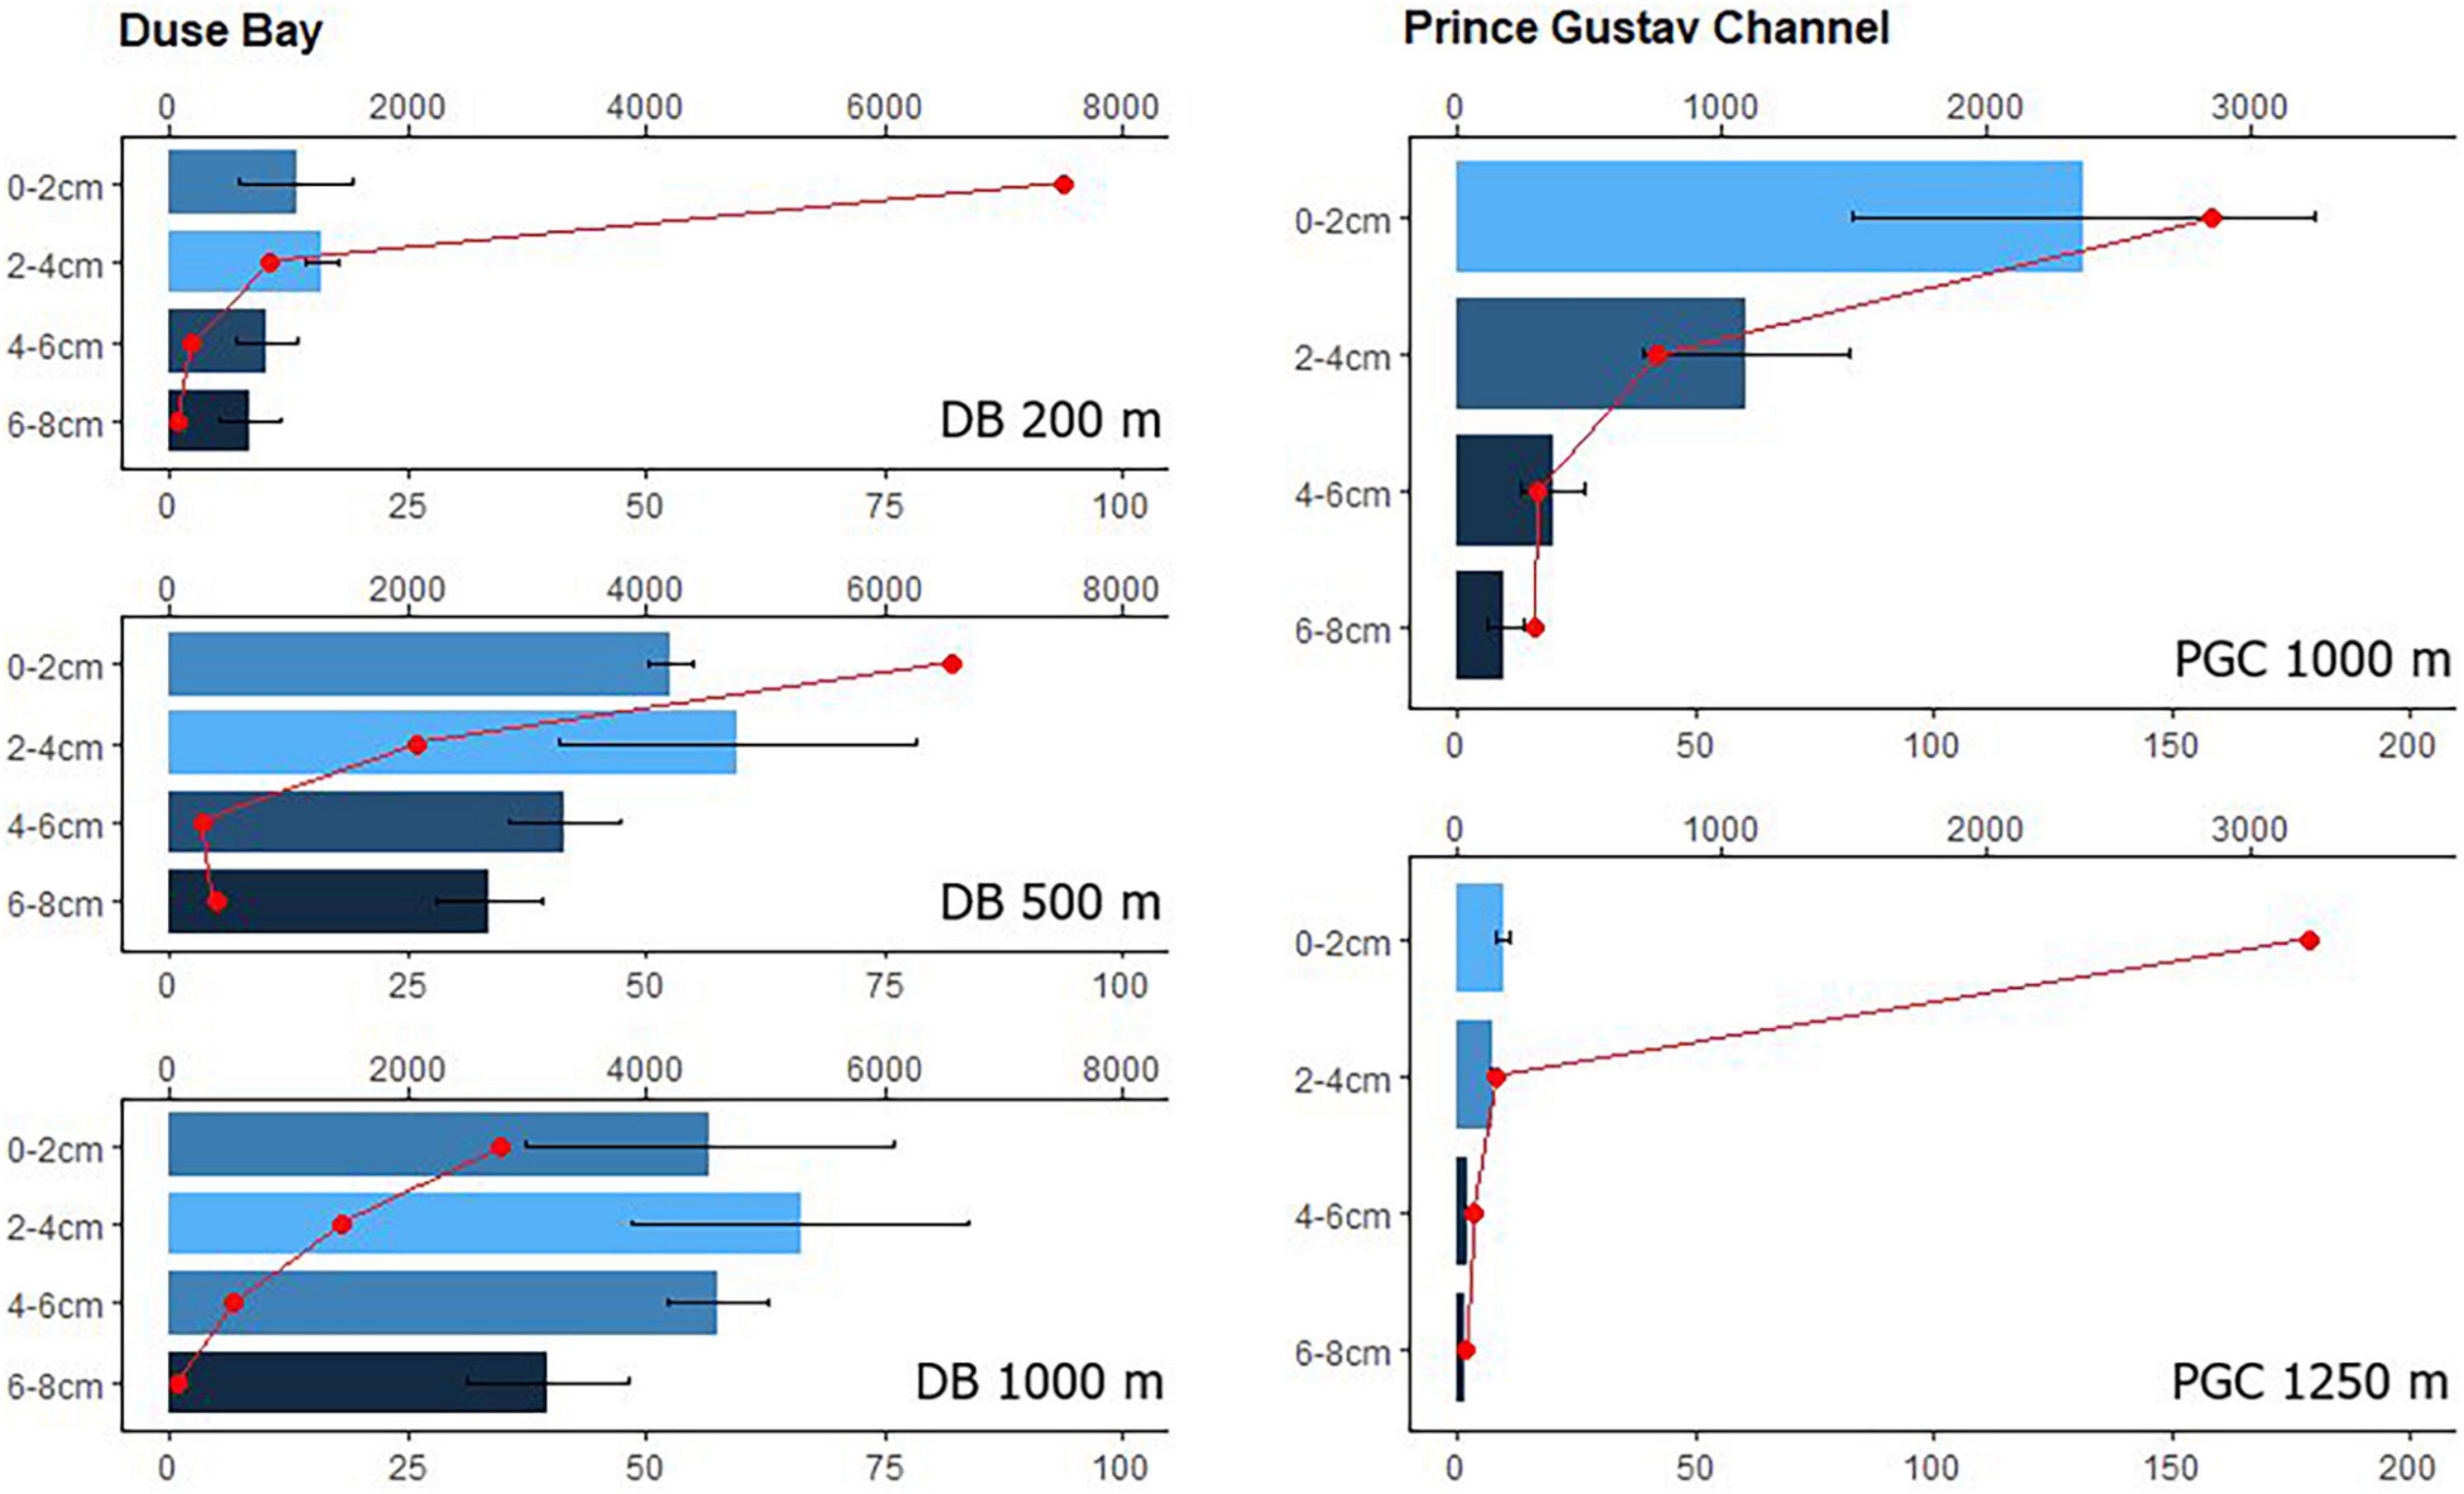
Figure 2. Comparison between Duse Bay stations (from the top 200 m, 500 m and 1,000 m depth) and the Prince Gustav Channel (from the top 1,000 m and 1,250 m depth). The barplot shows Chl-a concentrations (μg/g, bottom axis, plus Sd) within the sediment layers (0–2, 2–4, 4–6, and 6–8 cm). Meiofauna distribution within the same layers expressed in ind 10 cm–2 (upper axis) was plotted over the barplot. One replicate per layer was used to calculate meiofauna densities. Note the difference in scale between DB and PGC stations.
Environmental Characterization
The multivariate PERMANOVA analysis on environmental parameters resulted in a significant p-value (p < 0.05) for the “Station” factor, indicating statistically significant differences between stations. However, the permutation test for the homogeneity of dispersion (PermDisp) was significant, indicating that the differences in the dispersion of the group variance may influence the main test result and thus require caution in interpreting its significance. The PCA (Figure 3) shows separation of the group ellipses (confidence interval 0.95), pointing at differences in environmental variables between the different stations and depths. Some degree of overlap was only observed for the shallowest DB station and the nearest deep PGC station (1,000 m). The sum of the two main principal components (PC1 and PC2) explains together 73.22% of the variance. The main variables contributing along the PC1 axis are the ratio between Chlorophyll-a and CPE (Chloroplastic Pigment Equivalent; Chl-a:CPE), TOC and TN ratio (TOC:TN) and TOM concentration. The dbRDA resulted in a significant value (p < 0.05) for some of the pigments, phaeopigments, and TOM (Table 2) suggesting a correlation between the amount of fresh and/or degraded organic material and the meiofauna structure at each station.
Figure 3. Principal component analysis (PCA) of a subset of environmental characteristics of the sediment of all layers combined (i.e., 0–2, 2–4, 4–6, and 6–8 cm). Particularly, Chlorophyll a, CPE, Chl:CPE ratio, TOM, TOC:TN ratio, Clay, Silt and Sand parameters were considered. Confidence ellipses were plotted around group mean points, represented as larger symbols on the plot.
Meiofauna Densities and Composition
Results for meiofauna densities are displayed in Table 3. The highest densities were recorded in DB, with similar values (in the order of 6,000 individuals (ind) 10 cm–2) at 500 and 200 m. Slightly lower values were detected in the two 1,000 m deep basins (one in DB and one in PGC), with abundances ranging in the order of 4,000 ind 10 cm–2). The lowest values were observed in PGC 1,250 m (2,339.524 ± 785.2732 ind 10 cm–2 ± SD), but it is noteworthy to mention that the SD value is high. The univariate PERMANOVA analysis on densities showed a significant p-value (p < 0.05) for the “Station” factor and the PermDisp was non-significant for the same. The vertical distribution of total meiofauna within the sediment followed a depth gradient analogous across all stations, where the 0–2 cm layer showed the highest densities. At each sampling site, nematodes were the major component of the meiofauna, constituting between 69 and 91% of the total abundance (Supplementary Annex F). Besides nematodes, the main groups present in the samples were nauplii (3–12%) and Copepoda (4–11%) in the first 0–2 cm layer, with similar relative densities at each of the stations of the bathymetric transect in DB. A different structure could be noticed in PGC, where both groups showed slightly lower densities at 1,000 m and particularly lower at 1,250 m (Supplementary Annex G).
Table 3. Number of individuals per 10 cm–2 of the 0–2 cm layer showed as mean, followed by standard deviation (SD) values.
Nematode Biodiversity
Amplicon Sequence Variants Analysis
The metabarcoding analysis resulted in a total of 7,175 ASVs belonging to the Eukarya domain, of which 2,564 were assigned the label “Nematoda.” It was possible to assign a genus to 40.6% of the sequences, whereas the 59.4% of them remained “Unassigned.” Nevertheless, all ASVs (including the “Unassigned”) were included in the biodiversity analysis (biodiversity tests and UpSet plot), whereas the NMDS and trophic analysis was only based on the genus-assigned ASVs. A total of 49 genera were identified across all stations, of which the most abundant were Molgolaimus, Daptonema, Halalaimus, Chromadorita, Sabatieria, and Bathylaimus (>11%). The PERMANOVA analysis performed on the ASVs dataset resulted in a significant p-value for the fixed factor “Station,” as well as the nested factor “Layer” (Table 4), suggesting that differences were also present in the vertical profile. The PermDisp test performed after the PERMANOVA analysis was non-significant for both factors. A pairwise comparison was performed subsequently, however, no significant results were detected. Hence, the interpretation of data must consider this issue. The intersection between datasets (all layers pooled together) is visualized in Figure 4. Here we observe that the majority of sequences (27.4%) were unique to PGC 1,250 m when all layers were considered followed by the shallowest one in DB 200 m (17.4%). As shown in the NMDS performed on the HTS dataset (Figure 5), the PGC 1,250 m and DB 200 m ellipses are markedly separated from each other and from the other stations, suggesting high variation in the assemblages of these two sites compared with the other stations. The DB 200 m ellipse was observed at a similar distance from PGC 1,250 m and DB 1,000 m, although some of DB 200 m sample points are closer to the ones in PGC 1,250 m than DB 1,000 m. This vicinity implies some degree of similarity between the two stations (DB 200 m and PGC 1,250 m) despite being located in different areas. The middle stations, regardless of area, were less isolated and closer to each other in the plot, with PGC 1,000 m and DB 500 m overlapping. This proximity implies a certain amount of similarity between the community composition of the two stations. The dbRDA analysis to investigate relationships between environmental variables and nematode diversity resulted in a significant value (p < 0.05) for the main pigments and TOM (Table 2), indicating some degree of association between the organic matter in the sediments and nematodes community structure. The results of the Shannon–Wiener (H), Simpson (D) and inverse Simpson’s (1/D) tests are shown in Table 5. Results show the mean value of each station (all replicates, all layers considered). The Shannon diversity index showed a high degree of biodiversity at all stations, with DB 500 m having the highest values (4.172) and PGC 1,250 the lowest (3.450). These are confirmed by both the Simpson’s test and its inverse, which is positively correlated to the Shannon index. Inverse Simpson’s values are in fact particularly high at all station, suggesting high biodiversity at all sites, and especially at DB 500 (35.150); the lowest value was recorded at PGC 1,250 (15.188). However, the PERMANOVA analysis performed on biodiversity indexes did not result in significant values for any of the ones considered.
Table 4. Permutational analysis of variance results for the metabarcoding dataset, considering the three factors “Station,” “Layer,” and “Replicate” and the interaction between significant values (Station*Layer).
Figure 4. UpSet plot of all ASVs assigned a “Nematoda” label (all layers considered, three to four replicates). The left barplot (Set Size) represents the total number of ASVs per station; the bottom plot shows every possible intersection between sets and the top barplot displays their occurrence.
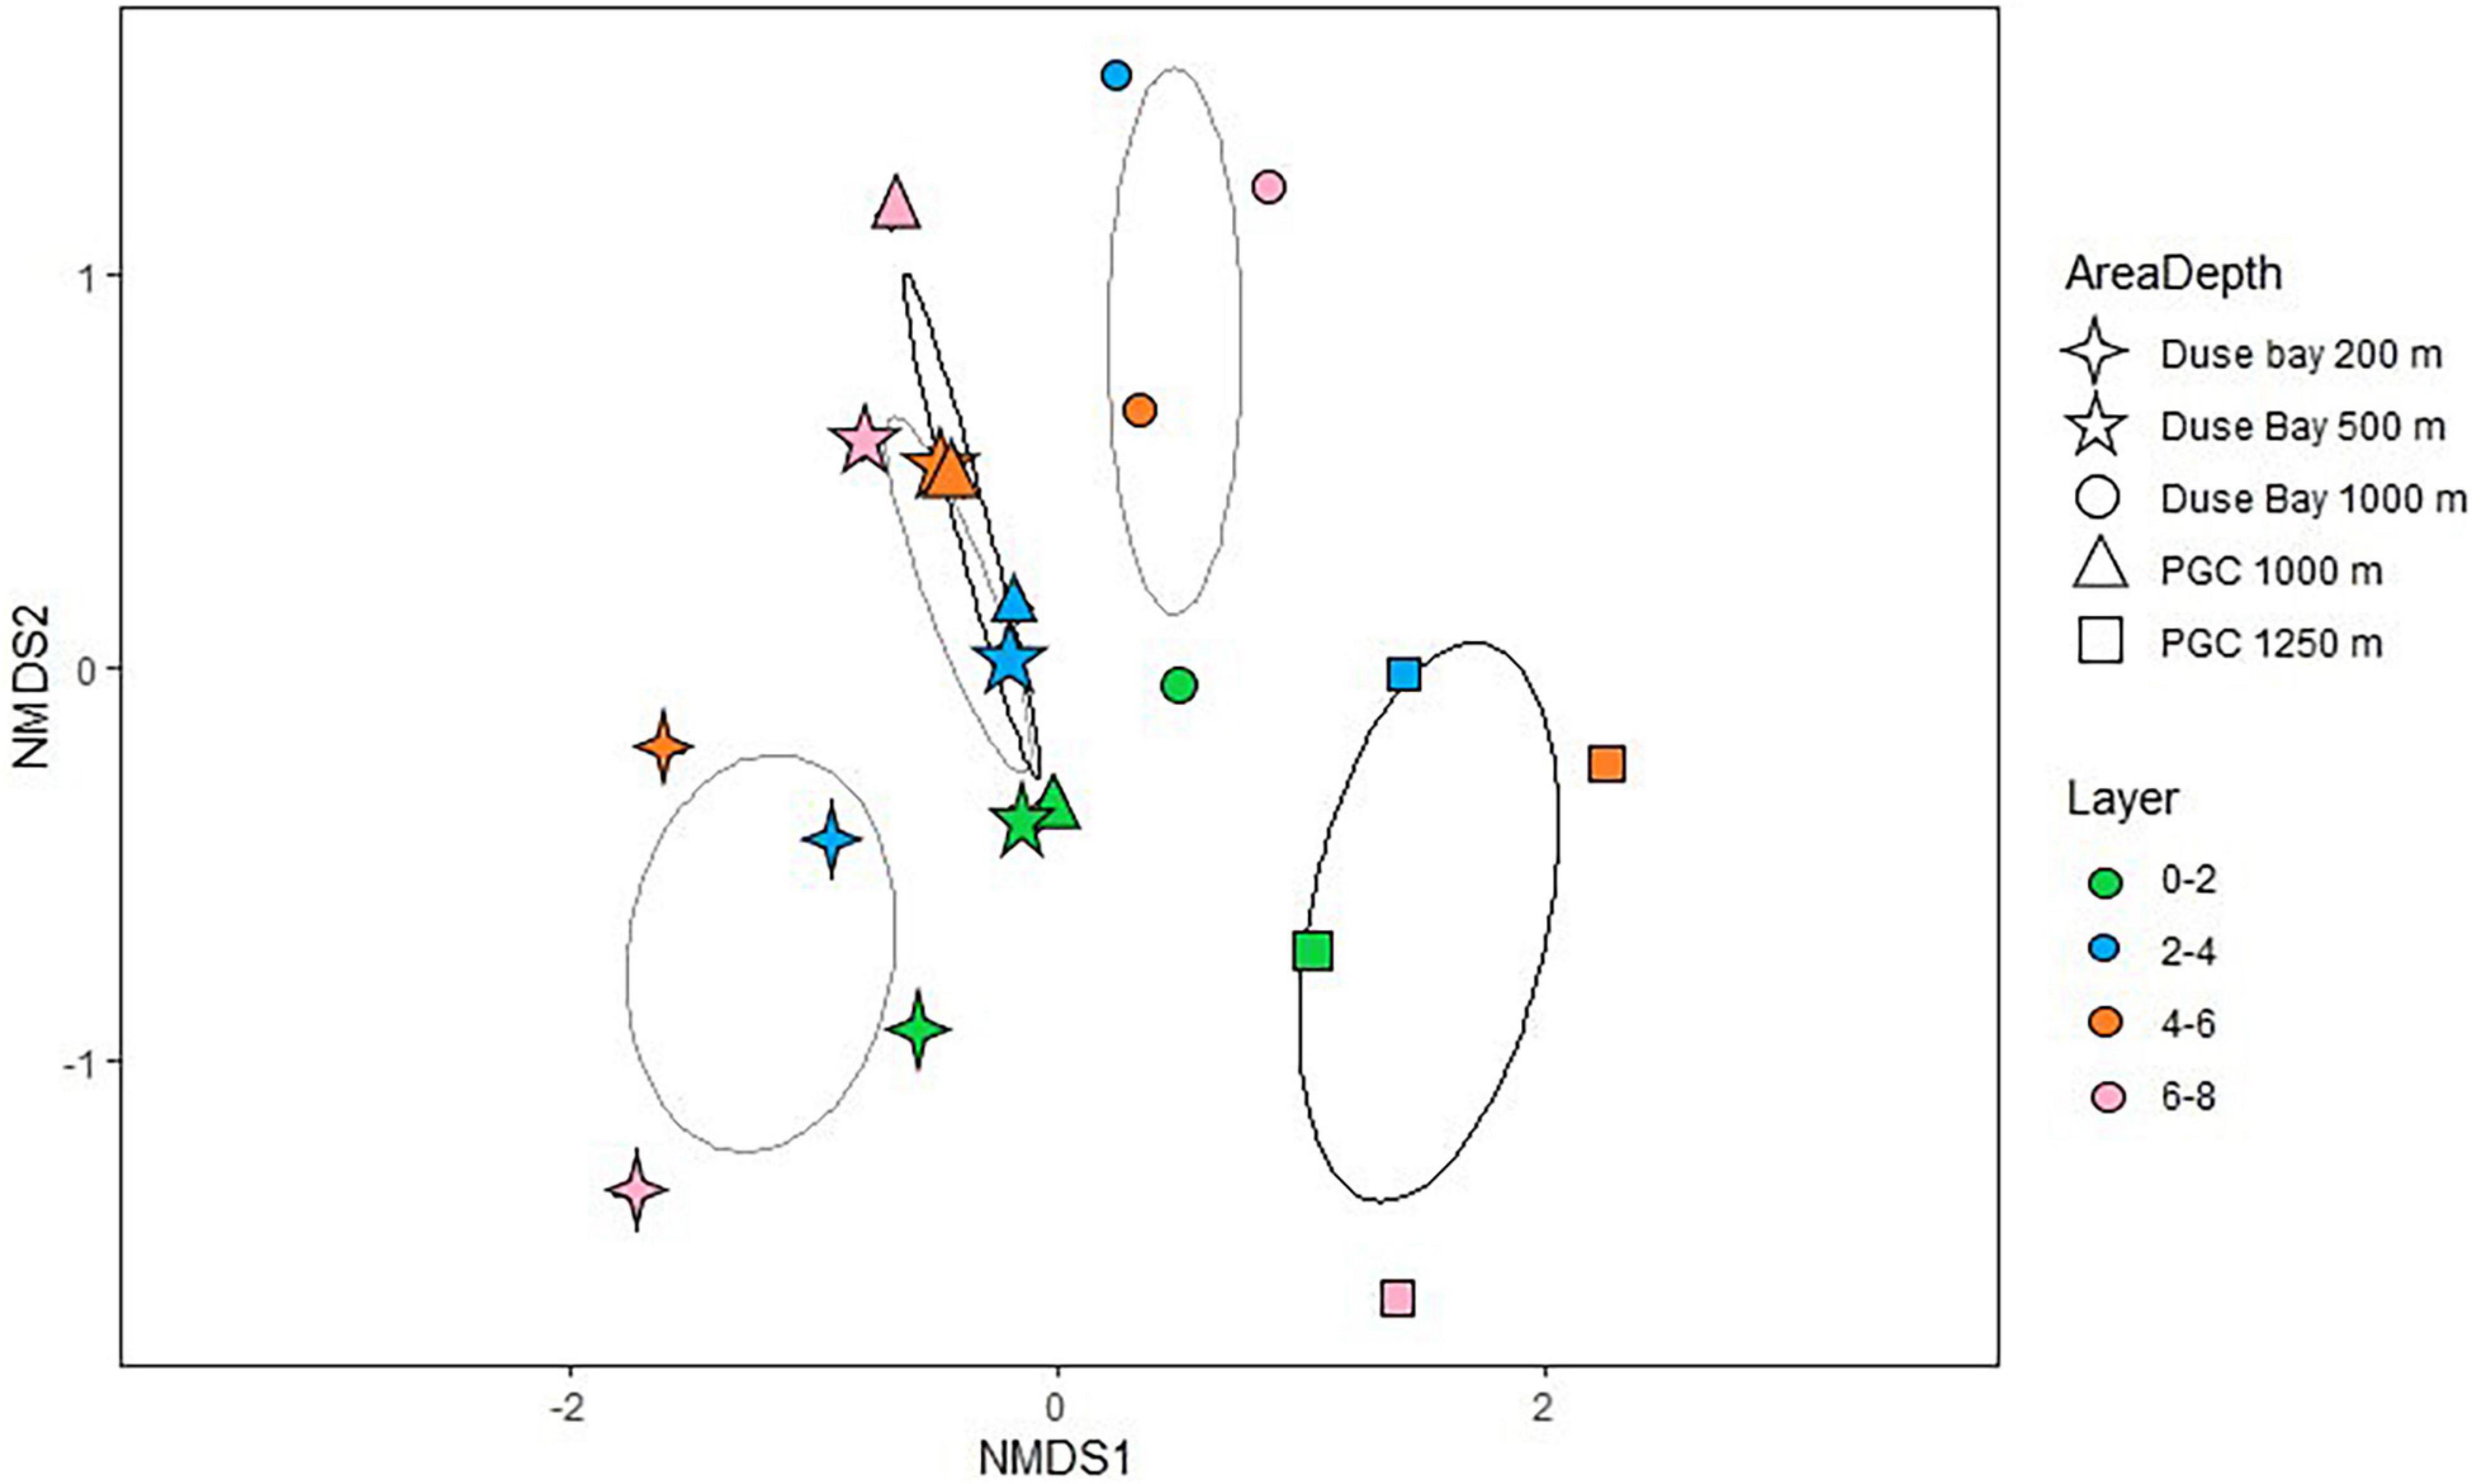
Figure 5. Non-metric Multi-dimensional Scaling analysis performed on the ASVs dataset (three to four replicates per station, all layers considered). The lighter ellipses represent the Duse Bay area, while the darker ones belong to the PGC stations. The further segregated ellipses (lower part of the graph) belong to DB 200 m and PGC 1,250 m, whereas an overlap between DB 500 m and PGC 1,000 m is clearly visible, with DB 1,000 m located closer to the “middle stations.”
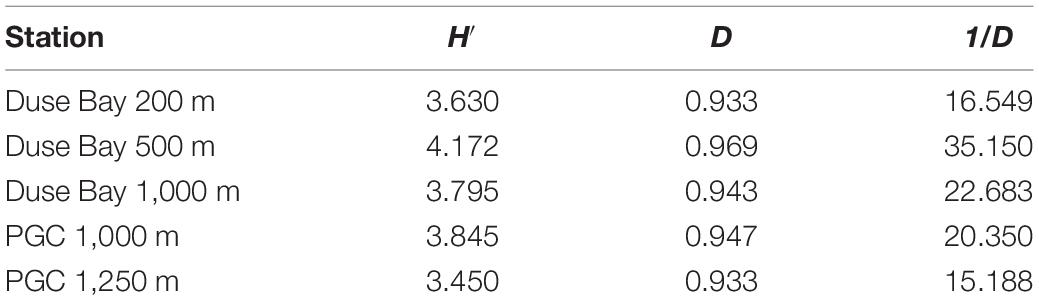
Table 5. Significant values for biodiversity indexes: Shannon–Wiener (H′), Simpson (D), inverse Simpson (1/D) on the metabarcoding dataset (ASVs).
Morphological Identification of Nematodes
A total of 107 nematode genera and 121 morphospecies were identified across the set of subsamples of 80 individuals per sample (0–2 cm, 3 samples per station). The greatest biodiversity was detected at 1,000 PGC and PGC 1,250 m (48 and 47 genera respectively in two replicates per station combined), although a substantial number of genera were observed at each sampling site (43 genera in DB 200 m; 39 in DB 500 m; and 45 in DB 1,000 m). The NMDS performed on this dataset (Supplementary Annex H) showed a large distance between the assemblages of the stations in DB (with DB 200 m and DB 500 m particularly isolated), while PGC 1,000 m was located at a similar distance from DB 1,000 m and PGC 1,250 m, when considering all data points. At each station, a few genera (e.g., Desmodora in DB 200 and Chromadorita in PGC 1,250 m) seem to dominate the assemblage (18.7 and 13.2%, respectively), while the majority of taxa represented less than 2% of the community. Figure 6 shows the comparison between the most abundant genera detected via morphological identification and ASVs analysis. Although the number of genera detected per station was almost identical, the community composition at each station differed. When ASVs were used, the genus Daptonema was dominant, constituting the 32.6% of all nematode genera at DB 500 m, whilst it represented only 11.4% in the morphological dataset at the same station. Similarly, in PGC 1,250 m Chromadorita was the most abundant genus using both identification methods: however, it represented 29.3% of all nematode genera when ASVs were used and only the 13.2% in the morphological dataset. It is worth noting that the genus Desmodora was absent in the ASVs at DB 200 m, while it represented the most abundant genus (18.7%) when the sample was identified morphologically.
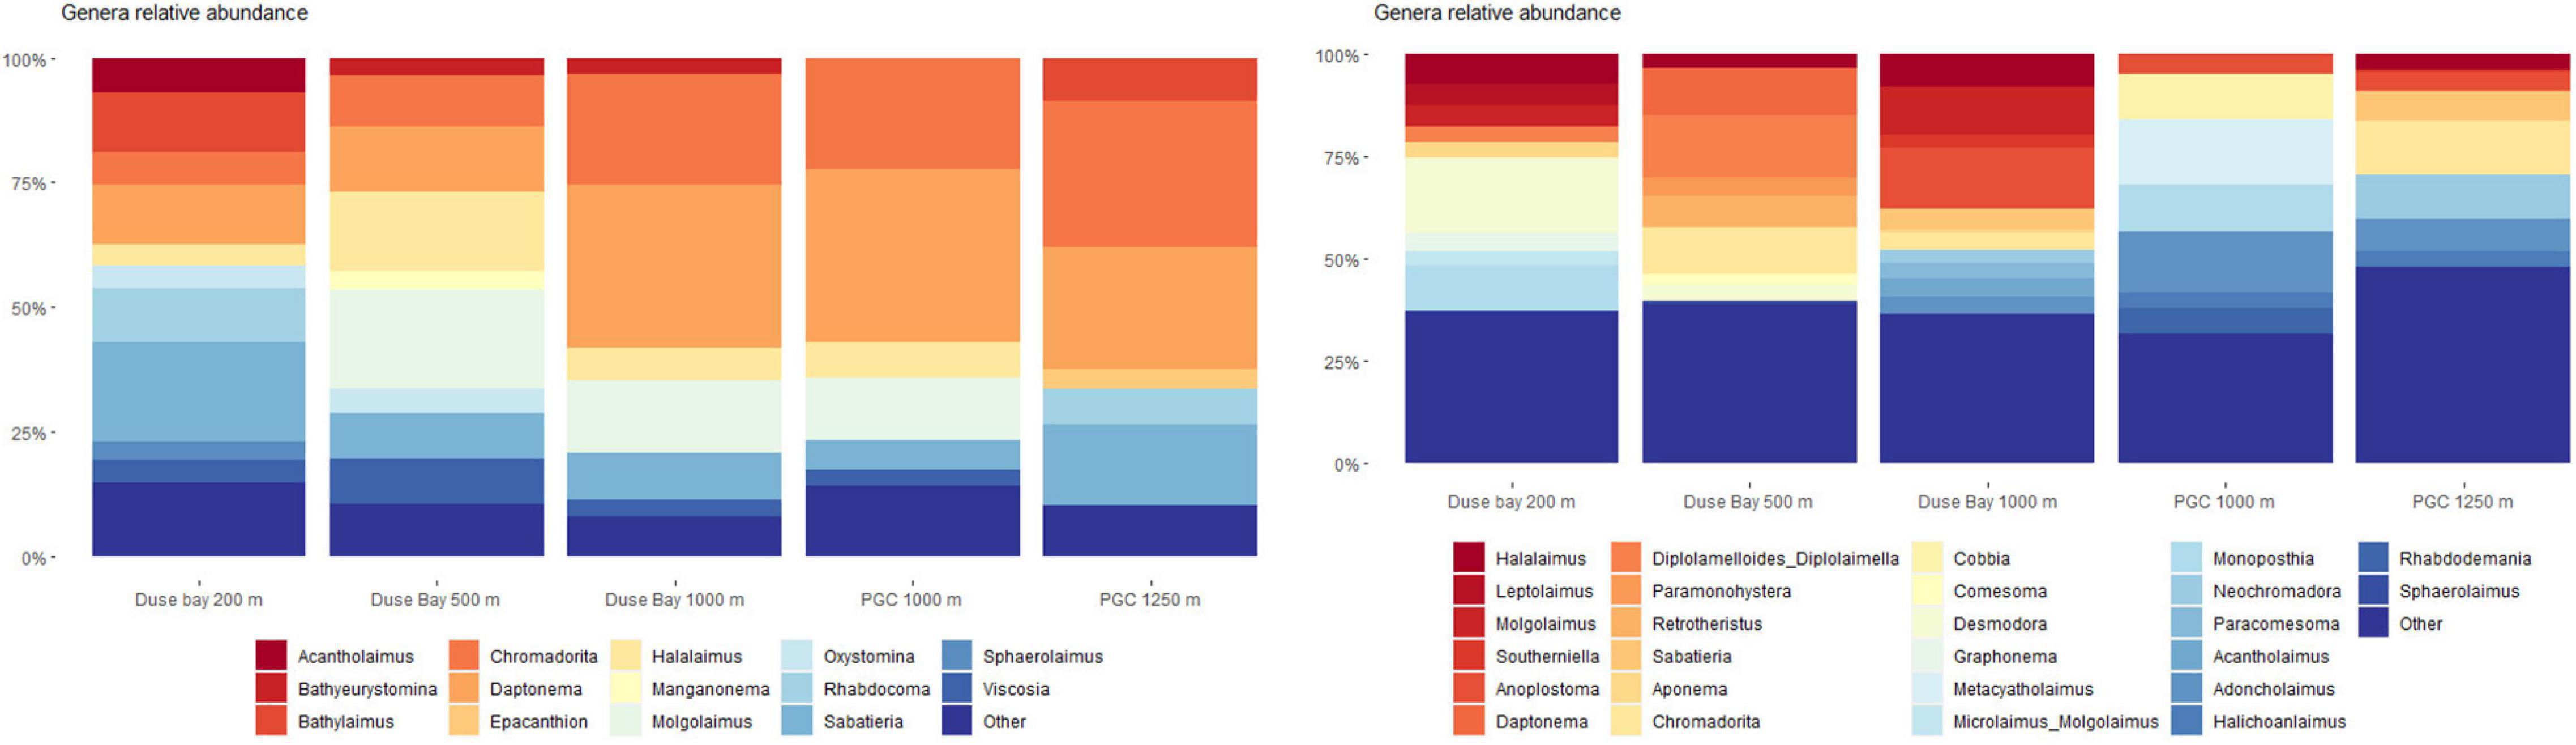
Figure 6. Nematodes community composition for the most abundant genera (>3%). Comparison between ASVs (A) and morphologically identified dataset (B); less abundant genera (<3%) were pooled in the “Other” item. From left to right, image sequence of ice melting in the Eastern Antarctic Peninsula during the 4 months preceding the JR17003a research campaign. Satellite images source: https://worldview.earthdata.nasa.gov.
Trophic Guilds Analysis
The analysis of the trophic structure of nematode communities is shown in Supplementary Annex J. The first barplot (Supplementary Annex JA) shows the trophic composition of the ASVs dataset based on the assigned genera, where non-selective deposit feeders (Supplementary Annex JB) comprised between 46 and 61% of all the trophic groups both in DB and the PGC. Selective deposit feeders were the second most abundant trophic group in DB 200 m and DB 1,000 m (26% in both the stations), while epistrate feeders (2A) had similar percentages in DB 500 m, PGC 1,000 m and PGC 1,250 m (22, 22, and 30%, respectively). On the right (Supplementary Annex JB), the trophic analysis performed on the morphological dataset is shown, where epistrate feeders were dominant at all stations (between 31 and 50%).
Discussion
This study investigates the meiobenthos of DB and the PGC for the first time and sets the foundation to understand the benthic ecological dynamics in these areas by applying a unique combination of taxonomical identification and DNA analysis of organisms, with a focus on nematodes. In general, high levels of biodiversity were detected across stations in both areas (Table 5 and Figure 4), which are most likely associated to the abundance and freshness of food.
The DB Bathymetric Transect
Environmental Characterization
The local warming of the AP is responsible for increased algal blooms in the region, related to ice-shelf melting and calving events, which affect the abundance, structure, and dynamics of benthic organisms to a great extent (Veit-Köhler et al., 2018). Because of their tight connection with the sediment organic pool, meiofauna reflects the local dynamics of benthic-pelagic coupling processes. The structure of meiofauna communities in terms of densities and biodiversity are strictly linked to the amount of available organic matter. This is in turn dependent on deposition dynamics occurring in the upper water column. In general, the Chl-a and CPE values in DB were higher than those observed at similar depths in the AP (Vanhove et al., 2004; Hauquier et al., 2015), but relatively low in the DB 200 m station, where they showed an average concentration four times lower than that of the other DB stations (Table 2). The lower Chl-a values at the shallowest DB station, coincides with lower TOM concentrations and a higher sand fraction compared to the deeper DB stations. Sediment grain size also plays a crucial role in determining the infaunal assemblage structure and diversity since it relates to the organic matter accumulation/remineralization and oxygen penetration through the sediment. Sediment oxygenation has been observed to have a significant effect on meiofauna abundance and composition considering that different taxa have specific tolerances for oxygen availability (Schratzberger et al., 2006; Vanreusel et al., 2010). The sediment composition is highly affected by the lithology of parent rocks, the local mixing with recycled detritus (Dinis et al., 2017) together with the deposition and stratification of glacial and subglacial meltwater finer particles (Meslard et al., 2018). The latter are regularly resuspended in the water column because of local storms in shallow waters which is less the case in the deeper parts. The finer sediment composition in the deeper DB stations (DB 500 and 1,000 m, Table 2) was possibly a consequence of subglacial ablation and the associated disaggregation of the overlying sediment and its mixing with debris. Coupled with local hydrodynamics and geomorphology, this likely determined the transport of finer particles, i.e., silt, to deeper parts of the bay (Lawson, 1982; Nokes et al., 2019; Perolo et al., 2019), hence resulting in a muddier, soft sediment habitat compared to the shallowest station.
Meiofauna Community Structure
Differences in the sediment food availability of the 200 m station were not reflected in the meiofauna densities of the first 0–2 cm of the sediment, since they were equally high in the 500 m station and even higher at 1,000 m despite the lower chlorophyll-a values. In general, the meiofauna densities in the shallower stations (200 and 500 m) in DB were within the range of those found at other Antarctic shelf locations (Vanhove et al., 1995; Ingels et al., 2006; B_West station, Hauquier et al., 2015). High meiofauna densities are often related to the accumulation of phytoplanktonic organisms in the form of detritus on the surface of shelf sediments. Due to the cold temperatures of Antarctic waters, the process of degradation of the phytodetritus is slower compared to other areas, thus organic matter may accumulate in the form of “foodbanks” (Mincks et al., 2008; Smith et al., 2008). These organically rich sediments which are able to sustain the benthic densities throughout the year, preventing a reduction in biomass during austral winter months. High Chl-a and TOM concentration might be explained by such dynamics. The high densities found at DB 200 m corresponding to lower Chl-a and TOM concentration, might be due to the grazing action of benthic organisms on the food source prior to sampling, which would explain how such high abundances were sustained despite the low values of organic matter recorded. This is confirmed by the dbRDA performed on densities, which highlighted a significant correlation between organic matter and meiofauna abundances (Table 2). Copepods were the second most abundant taxon after nematodes (∼9.03% of the total meiofauna density in DB 200 m and ∼6.16% in DB 500 m; Supplementary Annex G), which is not surprising, considering that they are able to feed on both microalgae and bacteria (De Troch et al., 2005). The meiofauna densities seemed to decrease with increasing sediment depth, thus hosting the majority of the total meiofauna in the first 0–2 cm layer (Supplementary Annex A). The TOM followed the same decreasing vertical gradient, with higher concentrations in the first 0–2 cm layer. However, the Chl-a was distributed in a contrasting pattern in all DB stations, with the second sediment layer (2–4 cm) being the one with higher concentrations (Figure 3). The subsurface maximum of Chl-a in the DB stations might be in indication of the presence of larger benthic organisms (macrofauna) which are often responsible for burial of fresh phytodetritus into the deeper sediment layers (Furukawa, 2001; Lohrer et al., 2004; Meysman et al., 2006; Barsanti et al., 2011; van de Velde and Meysman, 2016). Biological interactions, such as the occurrence of macrobenthic organisms, are known to have a strong effect on the small-scale variability of nematodes, due to predator-prey dynamics and competition for food. The diversity of larger consumers has in fact been shown to be a crucial aspect in regulating the access of meiofauna to shared food sources (Nascimento et al., 2011). Although no macrofauna data are available in this study, it is still central to highlight the potential impact of these organisms. The values of CPE and Chl-a were highest at DB 1,000 m and corresponded to lower average meiofauna densities (although with a higher standard deviation). Macroalgal decay and accumulation of organic matter can lead to hypoxic conditions of the sediment surface (Pasotti et al., 2014; Hoffmann et al., 2018), influencing the abundance and composition of meiofauna assemblages. The possible hypoxic conditions of the sediment at this station was also suggested by the presence of the genus Anoplostoma, which was recorded in high numbers (15% of all nematode genera at this station) by morphological identification but not in the ASVs dataset (probably linked to the limited sequences deposited in online databases, see section “Morphological Identification Versus Metabarcoding: Drawbacks and Interpretation of Data”). This nematode genus is categorized as a selective deposit feeder often recorded in organically enriched sediments of mangrove ecosystems and muddy estuarine sediment types (Surey-Gent, 1981; Li and Guo, 2016), which are usually associated with hypoxic conditions, hence lower meiofauna abundances (Zeppilli et al., 2018). Moreover, one of the most abundant genera according to the ASVs dataset (Supplementary Annex H) was Sabatieria, which is also known for being tolerant of hypoxic/anoxic conditions in several environments (Wetzel et al., 2002; Steyaert et al., 2007; Franzo et al., 2019).
Nematode Biodiversity in the DB Area
Based on the molecular analysis of the ASVs, the degree of biodiversity in DB was observed to be very high at all stations, as confirmed by the Shannon (H), Simpson (D), and inverse Simpson’s (1/D) indexes (Table 5). The most diverse station was found to be DB 500 m in contrast to the highest number of unique ASVs (n = 446) recorded at 200 m when considering all sediment layers. The visual results of the UpSet plot (Figure 4) show a decrease of unique sequences in relation to depth, which suggests less biodiversity at the deepest site of the area (DB 1,000 m, 320 ASVs). This is in contrast with the H and 1/D values, which show little difference between stations, with slightly lower values for DB 200 m. Since the UpSet plot visualization is based on a presence/absence matrix, the reason behind such contrasts is likely due to the influence of richness (for H) and samples number (for D and 1/D), which rely on a distance-based similarity matrix. Moreover, the high values of the Shannon and inverse Simpson indexes suggest a uniform distribution of the species at all sites, confirmed by the non-significant PERMANOVA performed to test differences in biodiversity between stations. Previous studies show that nematode diversity is more often dependent on local environmental characteristics and hydrodynamics than bathymetry (Danovaro et al., 2013; Gambi et al., 2014). Also in this study, there was no evidence of increasing biodiversity in relation to depth, whereas differences between stations were more associated to the availability and freshness of food source (Table 2). The non-selective deposit feeder Daptonema was detected at all stations in DB, with highest concentrations at DB 200 m (Supplementary Annex J). This cosmopolitan genus has a long history of records in Antarctic waters, ranging from shallow to deeper sediments (Vanhove et al., 1999; Hauquier et al., 2015; Stark et al., 2020). Surprisingly only 11 ASVs were uniquely shared among all the DB stations (Figure 4), whereas the majority were unique to each station, thus it seems likely that the local biodiversity might have been influenced by gene flow external to DB, or by local hydrodynamics and seasonal sea-ice cover. A crucial element in determining the diversity of nematode communities are in fact local currents and the potential colonization from relatively close areas (Boeckner et al., 2009).
The Deep Basins
Ice Cover and Influence on Sediment Characteristics
The changes in sea-ice cover, sea-ice melting, and ice-shelf collapse have a major impact on the intensity and frequency of phytoplankton blooms, and as a consequence, on the primary productivity of the ocean surface in Antarctica (Buffen et al., 2007; Duprat et al., 2016; Van Leeuwe et al., 2018). Satellite images4 show that in the period preceding the JR17003a campaign, the sea ice started melting in proximity of the DB area at the end of December 2017, continuing the retreat southwards along the narrow seaway between James Ross Island and the Trinity Peninsula (Figures 7, 8). In fact, this melting allowed DB to be ice-free by the end of January 2018, almost contemporarily in all the stations of the area, together with the 1,000 m station in PGC. However, it looks like the southernmost station (PGC 1,250 m), was free of ice just by mid-February, almost 1 month later. This melting pattern might partly explain the over 10-fold higher Chl-a content in the first 0–2 cm layer in the PGC 1,000 m station, compared to the PGC 1,250 m station which showed the lowest Chl-a. Studies on the Larsen A and B Area, south of the PGC, have shown that newly ice-free regions stimulate phytoplanktonic blooms, affecting the total meiofauna density (Hauquier et al., 2015) and often increasing the abundance and biodiversity of nematodes (Raes et al., 2010). Although the two PGC stations are geographically close and of similar depth, the much lower quantities of Chl-a in PGC 1,250 m resulted in only 1.7 times lower meiofauna densities (Supplementary Annex G). Given the longer ice cover at this station it is possible that at the time of sampling a potential phytoplanktonic bloom had not yet taken place, with the meiofauna still thriving on food reserves from the previous year. To confirm these assumptions, a more detailed study on the timing of sea-ice retreat and the related spring phytoplankton bloom would be of significant importance. Other variables to consider are sea-ice thickness, water turbidity and the amount of freshening, which determines the stability of the water column and has a strong influence on phytoplanktonic blooms (Kang et al., 2001; Buffen et al., 2007). The distribution of sea ice depends on a number of factors which fluctuate seasonally and annually, namely wind intensity, wind direction and coastal currents (Scambos et al., 2009; Holland and Kwok, 2012; Stuecker et al., 2017). In light of the large variability of sea-ice extent and duration, dynamics relating to sea-ice cover are indeed particularly difficult to assess.
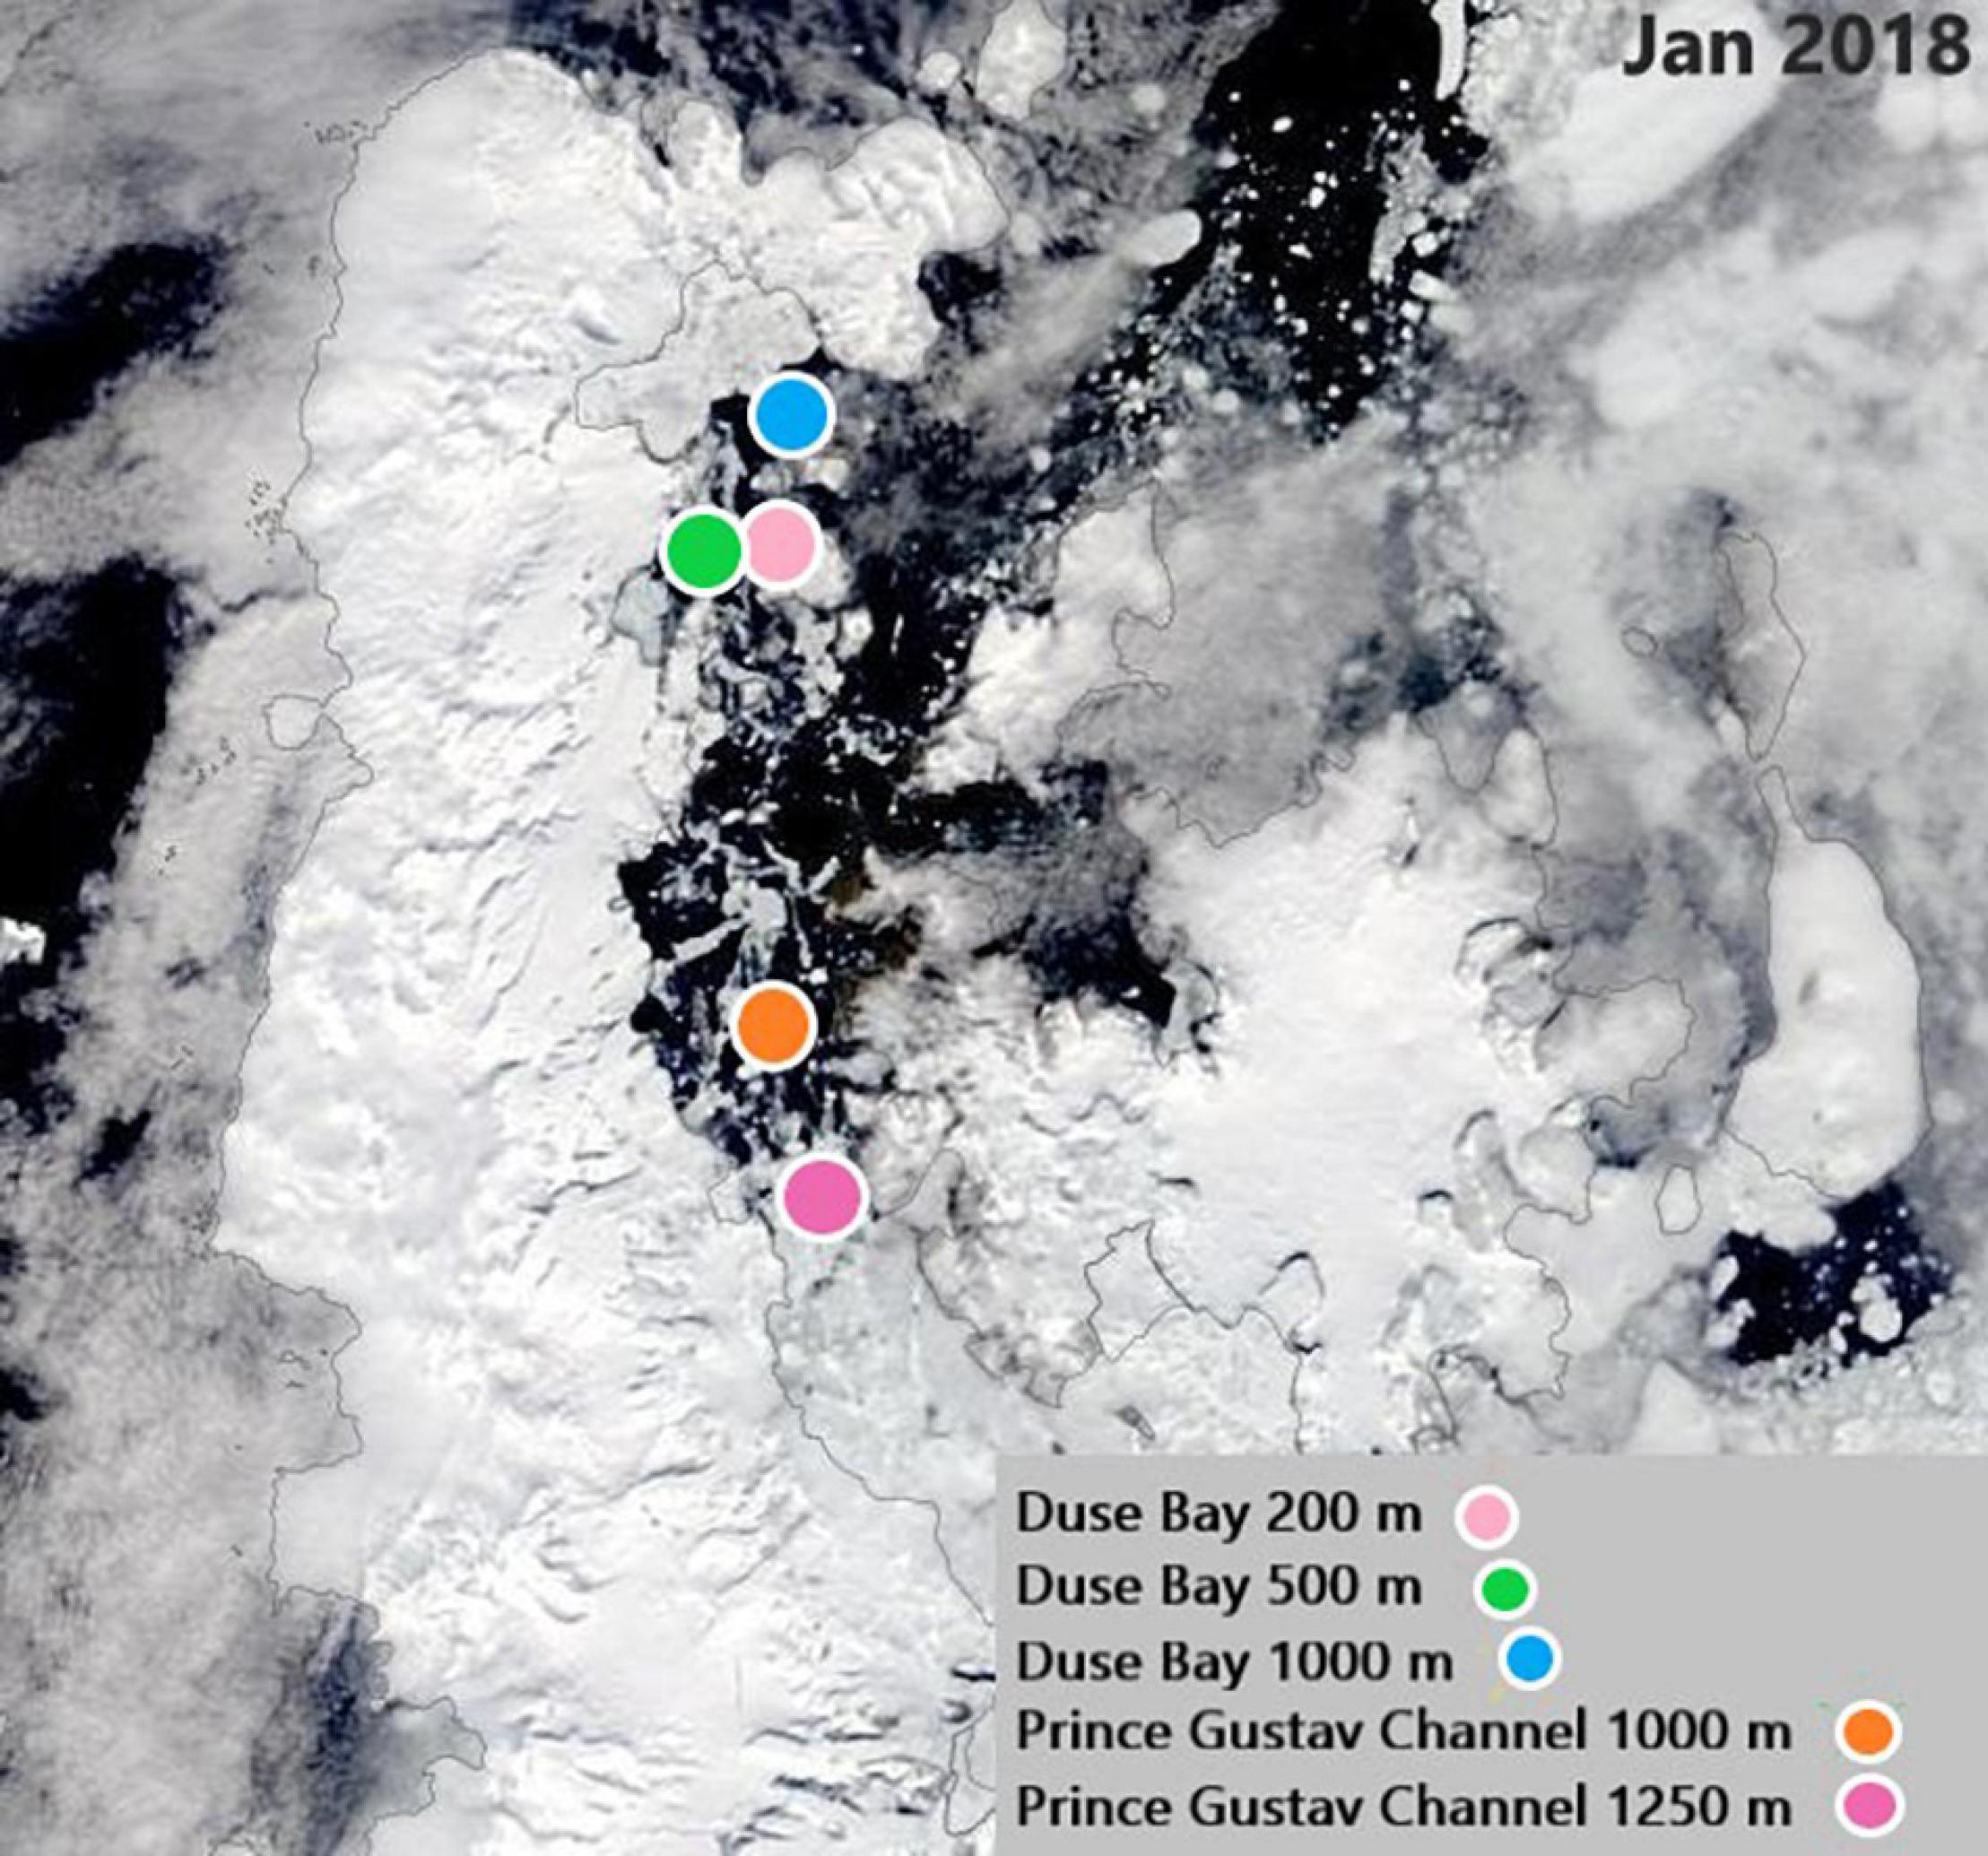
Figure 7. Satellite image of the sampling Area in January 2018, with PGC 1250 still covered by sea-ice while the rest of the stations are ice-free. The different colors indicate each station in the PGC and DB, as shown in the legend. Satellite images source: https://worldview.earthdata.nasa.gov.
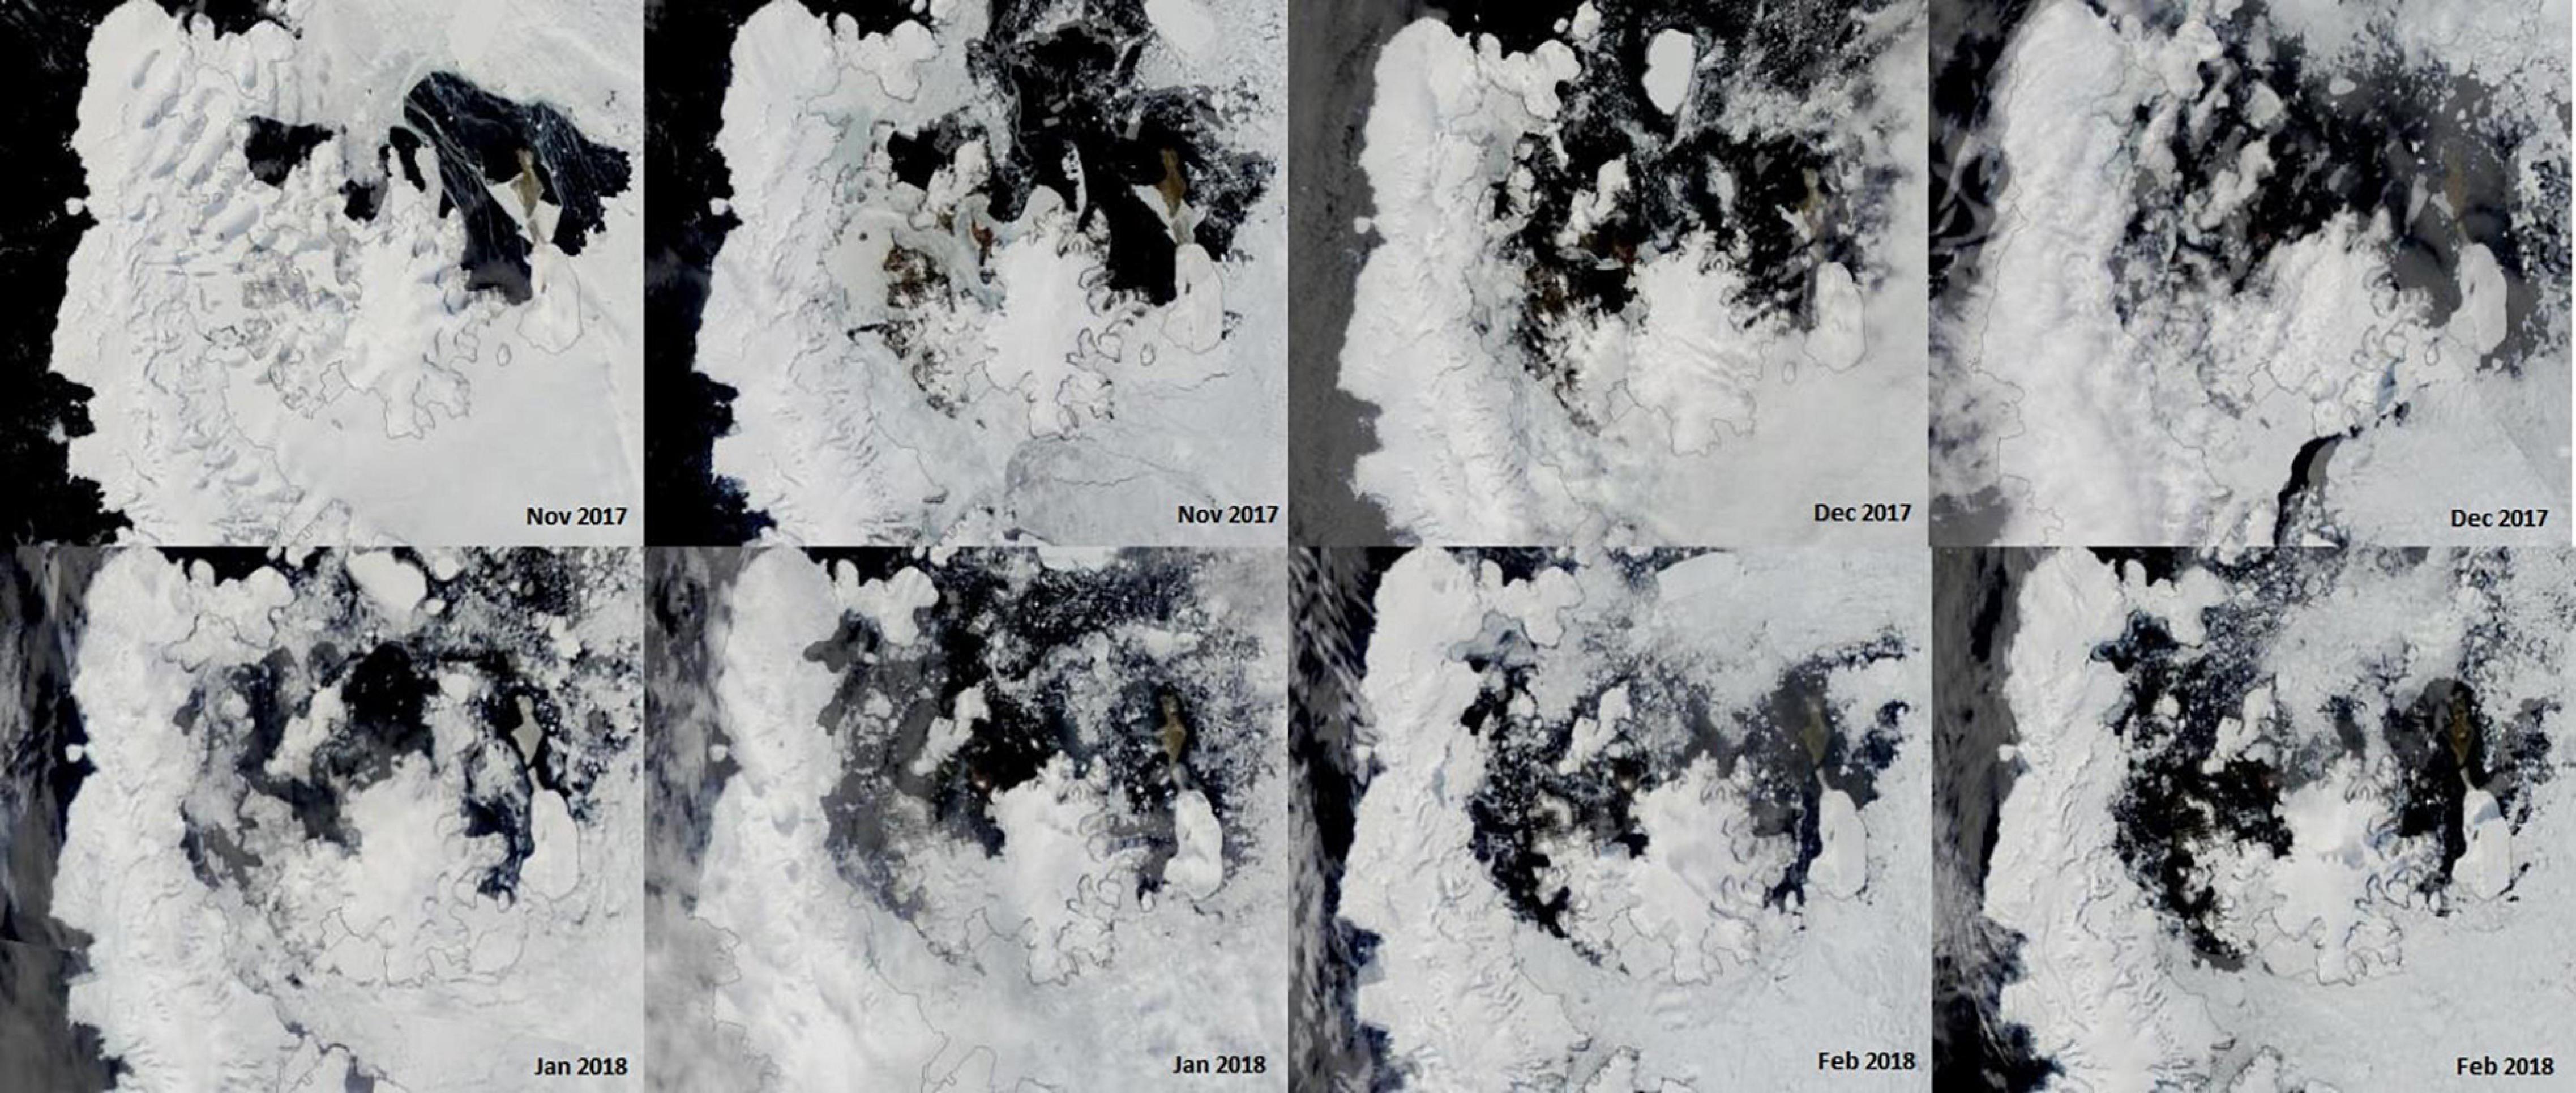
Figure 8. From left to right, image sequence of ice melting in the Eastern Antarctic Peninsula during the four months preceding the JR17003a research campaign. Satellite images source: https://worldview.earthdata.nasa.gov.
Meiofauna Densities and Structure in the Deep Basins
The meiofauna abundance in the deepest PGC station (1,250 m) were lower compared to the other two basins (DB 1,000 m and PGC 1,000 m), but still high or similar in comparison to other findings at similar depths (Vanhove et al., 1995; Vermeeren, 2002; Ingels et al., 2011). Even though the lowest values of CPE and Chl-a were recorded at this deep site, the amount of food and its freshness, seemed in fact sufficient to sustain relatively high meiofauna abundances, with pigment concentrations within the range of those found in previous studies from adjacent areas (Hauquier et al., 2015). The two 1,000 m basins in DB and PGC seem to be acting as a sink for organic matter as they display the highest abundance of TOM in the whole region, and particularly PGC 1,000 m which exhibited almost double the Chl-a concentration compared to DB 1,000 m. The relative abundance of nauplii and copepods was also high in some stations (particularly copepods at DB 1,000 m and PGC 1,000 m, and nauplii at DB 1,000 m, Annex G). Nauplii are early larval stages of mainly copepods, and their assemblage can be a proxy for environmental changes. They are highly sensitive to environmental stressors, and indicate the recruitment of copepods, hence their reproductive success (Bunker and Hirst, 2004; Gonçalves et al., 2010; Darnis et al., 2019). The variability of larval stages is typically linked to the availability and quantity of food, thus potentially representing a proxy of surface primary productivity in DB. The difference in density of nauplii between the three deep basins (DB 1,000 m, PGC 1,000 m, and PGC 1,250 m) with four times lower densities in the PGC compared to DB might be due to a number of variables, such as differences in bottom currents, resuspension potential and vertical mixing of the two areas, since they have been shown to alter oxygen and food availability in the deep sediments (Isla et al., 2006). Based on the UpSetR plot analysis (Figure 4) and the NMDS performed on the first 0–2 cm layer of the three basins (DB 1,000 m, PGC 1,000 m, and PGC 1,250 m, Figure 5), marked differences in nematode community structure and abundance were visible. The dominant genera were shared among stations (i.e., Sabatieria, Molgolaimus, and Daptonema), albeit in different proportions. When all the sediment layers were considered, the deep PGC 1,250 m showed the highest number of unique ASVs (n = 703, Figure 4) and only 63 ASVs were shared among all stations. Shannon and Simpson’s indexes showed higher values for PGC 1,000 m, suggesting increased biodiversity at this site. However, biodiversity indexes were relatively high at all stations, and showed no significant differences between stations. As frequently reported in other areas worldwide (Raes et al., 2007; Semprucci et al., 2010), also in this study it seems that local small-scale variability has more influence on community structure than depth or even larger spatial distances. The differences in biodiversity through the sediment layers might be of great importance in order to explain the gene flow dynamics in the EAP (Derycke et al., 2013). In fact, endobenthos and especially nematodes mainly depend on passive transportation of individuals (i.e., via bottom currents) for their dispersal, given that they do not have a pelagic larval stage (Hauquier et al., 2017). Hence, their resuspension in the water column is expected to be influenced by their vertical segregation in the sediment (Eskin and Palmer, 1985). This might explain the relatively low abundance of shared ASVs and the distance of ellipses in the NMDS analysis even between geographically close stations (i.e., PGC 1,000 m and PGC 1,250 m), which are expected to be influenced by similar hydrodynamics and sea-ice melting patterns. The deepest basin, more isolated from the rest of the stations but closer to the open waters of the Weddell Sea, shows lower amounts of TOM, CPE and Chl-a and lower densities but the highest number of unique nematode ASVs. As the dbRDA analysis was significant for organic matter and chlorophyll a, suggesting one more time some degree of correlation between food source and nematodes community structure, phytoplanktonic dynamics regulated by local ice-cover are to be considered. It is appropriate to assume that differences between the 1,000 m stations and PGC 1,250 m might be linked to the different ice cover influence on the basins (from sedimentation rates to phytoplanktonic bloom effects), probably together with local physical variables such as bottom currents. Raes et al. (2010) found that higher nematode biodiversity in the B_South station (located south of the Larsen B area) was linked to a longer ice-free period, and open to potential phytoplanktonic blooms. According to their study, quick colonizers might have invaded the relatively new space, free of ice after the retreat of the ice shelf in 1995. The deep basin in PGC 1,250 m might have experienced similar colonization dynamics, also because of its proximity to more open waters of the Weddell Sea, which might have acted as a source for colonizers and food.
Morphological Identification Versus Metabarcoding: Drawbacks and Interpretation of Data
The documentation of nematodes has traditionally been performed via morphological identification (Vanhove et al., 1995; Fabiano and Danovaro, 1999; Lee et al., 2001; Tarjan and Keppner, 2008; Vanreusel et al., 2010). However, such work is known for being particularly time consuming and tedious, and it requires specific skills and deep knowledge of the taxa at hand. With the development of new molecular techniques, it has been proven that DNA metabarcoding is able to increase detection sensitivity, which in turn improves the ability to document dispersion of organisms, their connectivity and biodiversity (Fonseca et al., 2017). However, even new techniques such as metabarcoding are subject to drawbacks, and need to be perfectioned (Deagle et al., 2018). In this study we combined both approaches, using the morphological identification to integrate the data collected from the bio-molecular analysis. In general, a large number of genera per station was observed with both methods: the 0–2 cm layer seemed to host the majority of nematode diversity, with slightly more genera observed in the morphological identification (Supplementary Annex I). However, the composition of each station differed notably between the two methods, with many genera undetected in the ASVs dataset. In fact, a total of 107 genera was identified by morphological identification, and only 49 via metabarcoding. It is important to emphasize that differing results of nematode diversity may lead to different interpretation of the data, especially in regard to the assignment of nematode trophic groups and their relative abundance throughout the assemblage (Figure 6 and Supplementary Annex J). For example, the dominance of the morphologically identified genus Desmodora in DB 200 m (18.7%), indicated that the main trophic group at this station was represented by epistrate feeders (2A), suggesting that the much lower Chl-a concentration recorded at that station might be the result of grazing pressure by these organisms (probably coupled with macrobenthic grazing). However, the absence of Desmodora ASVs, leads to an opposite result where non-selective deposit feeders were the majority, probably influenced by the marked presence of Molgolaimus and Daptonema (Figure 6 and Annex J). Macheriotou et al., 2020 (under review) also highlighted a similar problem: although Desmodora was identified as dominant by morphological identification in a Mozambique channel site, it was absent from the ASVs analysis. This was most likely explained by failed PCR amplification, which might have been hindered by the thick cuticle typical for this genus. Given the inclusion of eight Desmodora sequences in the database, it is likely that these specimens would have been identified in the event of successful PCR amplification. While this explanation is in general satisfactory, it is worth considering also another matter: the possible lack of this particular Desmodora sequence in online databases. The majority of known species are indeed based on descriptions from few specimens originating from a small number of localities, which poses the problem of natural variation (Coomans, 2002). Although we would expect Desmodora to be identified at least to genus level, it is plausible to assume that one or more Desmodora sequences from Antarctica had not been included in ASVs databases yet, thus resulting in a lack of information on this organism. The lack of nematode sequences in online databases results in an incomplete coverage of nematode diversity, which is confirmed in this study also by the amount of non-identified sequences in the dataset (59.4% “Unassigned” ASVs). Finally, the mismatch between morphologically identified organisms and ASVs might also be linked to subjective bias, based on personal skills, eyesight, knowledge of the taxonomist, and the differentiation between related genera is not always easy (Vanreusel et al., 2010).
Conclusion
The meiobenthic community of the three stations in DB showed a distinct differentiation following the bathymetric gradient. The meiofauna densities decreased with depth along the transect, in contrast with the concentrations of Chl-a and TOM, which were instead increasing. The lower meiofauna density, despite the high food availability at the deepest DB station, was possibly due to hypoxic conditions of the sediments, as suggested by the presence of the genus Anoplostoma, and the higher concentration of TOM. Nematode diversity was higher at the shallowest stations, probably due to heterogeneity of the habitat and food source availability. The three deep basins in DB (1,000 m) and in the PGC (one at 1,000 m and one at 1,250 m depth) were different both in terms of meiofauna densities, pigments, TOM and nematode biodiversity, despite similar depths. Although meiofauna densities in the two 1,000 m basins were similarly high, the deeper PGC 1,250 m showed the lowest densities compared to the other stations. High biodiversity was detected at all stations. The dominant taxa were shared among the stations, however, PGC 1,250 m showed the highest number of unique nematode sequences. The PGC 1,250 m station is indeed located in a more elongated, less isolated basin and likely more impacted by the sea-ice system and the Weddell Sea, hence subject to external colonization. Our data suggest that meiofauna community structure was influenced by the simultaneous action of different variables, including food availability, habitat heterogeneity and seasonal sea-ice dynamics. In general, local physical processes might have had a strong influence both on the densities and on the connectivity of the stations considered. The application of morphological identification to assess nematode biodiversity proved to be a valuable tool, especially to identify less abundant or rare specimens, but nevertheless time consuming and influenced by subjective bias. HTS offers a faster, more sensitive, less laborious option: however, there is a necessity to improve the coverage of reference sequence databases and the potential limitation concerning thicker nematode’s cuticules must be taken into consideration. These issues suggest it is premature to completely abandon the traditional taxonomic identification of meiofauna organisms. On the contrary, future studies might benefit from an integrated approach of the two methods. Moreover, given the morphological natural variation of meiofauna in Antarctica and the presence of rare species, it would be of interest to create a genetic sequence database solely for Antarctic meiobenthos, especially nematodes. The data presented in this study constitute an initial investigation of meiofauna communities in these areas and their link to abiotic variables. In this regard it provides precious baseline information which could feed into future investigations for the creation of time series of temporal variability of the EAP.
Data Availability Statement
The data presented in this study are deposited in the Dryad repository, access number 10.5061, doi: 10.5061/dryad.n8pk0p2tr. The data is publicly available.
Author Contributions
AV performed the field-sampling, designed, and coordinated the study. GP processed the samples, performed the statistical analysis, and drafted the manuscript. FP participated in the statistical design and writing. LM participated in the molecular analysis and bioinformatics. All authors contributed to the reviewing process.
Funding
This work contributes to project BR/154/A1-Recto of the Belgian Science Policy (BELSPO/BRAIN). The environmental and molecular research was carried out with infrastructure funded by EMBRC Belgium (FWO project GOH3817N).
Conflict of Interest
The authors declare that the research was conducted in the absence of any commercial or financial relationships that could be construed as a potential conflict of interest.
Publisher’s Note
All claims expressed in this article are solely those of the authors and do not necessarily represent those of their affiliated organizations, or those of the publisher, the editors and the reviewers. Any product that may be evaluated in this article, or claim that may be made by its manufacturer, is not guaranteed or endorsed by the publisher.
Acknowledgments
The authors wish to thank the Principal Scientist Katrin Linse from the British Antarctic Survey for the coordination of the scientific program and the captain and crew of RRS James Clark Ross for the logistic support during the JR17003a expedition. Bruno Vlaeminck, Bart Beuselinck, Annelien Rigaux, Annick Van Kenhove, and Guy De Smet are thanked for their help with analysis of abiotic variables and preparation of biological samples.
Supplementary Material
The Supplementary Material for this article can be found online at: https://www.frontiersin.org/articles/10.3389/fmars.2021.629706/full#supplementary-material
Footnotes
- ^ https://www.bodc.ac.uk/resources/inventories/cruise_inventory/report/16954/
- ^ https://genomics.ed.ac.uk/
- ^ https://benjjneb.github.io/dada2/index.html
- ^ https://worldview.earthdata.nasa.gov
References
Ahmed, M., Sapp, M., Prior, T., Karssen, G., and Back, M. (2015). Nematode taxonomy: from morphology to metabarcoding. Soil Discuss. 12, 1175–1220. doi: 10.5194/soild-2-1175-2015
Amplicon, P. C. R., Clean-Up, P. C. R., and Index, P. C. R. (2013). 16s Metagenomic Sequencing Library Preparation. Available online at: https://support.illumina.com/documents/documentation/chemistry_documentation/16s/16s-metagenomic-library-prep-guide-15044223-b.pdf (accessed March 15, 2019).
Barsanti, M., Delbono, I., Schirone, A., Langone, L., Miserocchi, S., Salvi, S., et al. (2011). Sediment reworking rates in deep sediments of the Mediterranean Sea. Sci. Total Environ. 409, 2959–2970. doi: 10.1016/j.scitotenv.2011.04.025
Bezerra, T. N., Eisendle, U., Hodda, M., Holovachov, O., Leduc, D., Mokievsky, V., et al. (2021). Nemys: World Database of Nematodes. Available online at: http://www.marinespecies.org/imis.php?module=dataset&dasid=66 (accessed February 10, 2019).
Boeckner, M. J., Sharma, J., and Proctor, H. C. (2009). Revisiting the meiofauna paradox: dispersal and colonization of nematodes and other meiofaunal organisms in low- and high-energy environments. Hydrobiologia 624, 91–106. doi: 10.1007/s10750-008-9669-5
Brannock, P. M., Learman, D. R., Mahon, A. R., Santos, S. R., and Halanych, K. M. (2018). Meiobenthic community composition and biodiversity along a 5500 km transect of Western Antarctica: a metabarcoding analysis. Mar. Ecol. Prog. Ser. 603, 47–60. doi: 10.3354/meps12717
Buffen, A., Leventer, A., Rubin, A., and Hutchins, T. (2007). Diatom assemblages in surface sediments of the northwestern Weddell Sea, Antarctic Peninsula. Mar. Micropaleontol. 62, 7–30. doi: 10.1016/j.marmicro.2006.07.002
Bunker, A. J., and Hirst, A. G. (2004). Fecundity of marine Planktonic copepods: global rates and patterns in relation to chlorophyll a, temperature and body weight. Mar. Ecol. Prog. Ser. 279, 161–181. doi: 10.3354/meps279161
Camerlenghi, A., Domack, E., Rebesco, M., Gilbert, R., Ishman, S., Leventer, A., et al. (2002). Glacial morphology and post-glacial contourites in northern Prince Gustav Channel (NW Weddell Sea, Antarctica). Mar. Geophys. Res. 22, 417–443. doi: 10.1023/A:1016399616365
Carpentier, A., Como, S., Dupuy, C., Lefrançois, C., and Feunteun, E. (2013). Feeding ecology of Liza spp. in a tidal fl at: evidence of the importance of primary production (bio fi lm) and associated Meiofauna. J. Sea Res. 92, 86–91. doi: 10.1016/j.seares.2013.10.007
Cook, A. J., Fox, A. J., Vaughan, D. G., and Ferrigno, J. G. (2005). Retreating glacier fronts on the Antarctic Peninsula over the past half-century. Science 308, 541–544. doi: 10.1126/science.1104235
Cook, A. J., and Vaughan, D. G. (2010). Overview of areal changes of the ice shelves on the Antarctic Peninsula over the past 50 years. Cryosphere 4, 77–98. doi: 10.5194/tc-4-77-2010
Danovaro, R., Carugati, L., Corinaldesi, C., Gambi, C., Guilini, K., Pusceddu, A., et al. (2013). Multiple spatial scale analyses provide new clues on patterns and drivers of deep-sea nematode diversity. Deep Sea Res. Part II Top. Stud. Oceanogr. 92, 97–106.
Darnis, G., Wold, A., Falk-Petersen, S., Graeve, M., and Fortier, L. (2019). Could offspring predation offset the successful reproduction of the arctic copepod Calanus hyperboreus under reduced sea-ice cover conditions? Prog. Oceanogr. 170, 107–118. doi: 10.1016/j.pocean.2018.11.004
Davies, B. J., Carrivick, J. L., Glasser, N. F., Hambrey, M. J., and Smellie, J. L. (2012). Variable glacier response to atmospheric warming, Northern Antarctic Peninsula, 1988-2009. Cryosphere 6, 1031–1048. doi: 10.5194/tc-6-1031-2012
De Troch, M., Steinarsdóttir, M., Chepurnov, V., and Ólafsson, E. (2005). Grazing on diatoms by harpacticoid copepods: species-speciWc density-dependent uptake and microbial gardening. Aquat. Microb. Ecol. 39, 135–144.
Deagle, B. E., Clarke, L. J., Kitchener, J. A., Polanowski, A. M., and Davidson, A. T. (2018). Genetic monitoring of open ocean biodiversity: an evaluation of DNA metabarcoding for processing continuous plankton recorder samples. Mol. Ecol. Resources 18, 391–406. doi: 10.1111/1755-0998.12740
Dell’ Anno, A., Carugati, L., Corinaldesi, C., and Riccioni, G. (2015). Unveiling the biodiversity of deep-sea nematodes through metabarcoding: are we ready to bypass the classical taxonomy? PLoS One 10:e0144928. doi: 10.1371/journal.pone.0144928
Derycke, S., Backeljau, T., and Moens, T. (2013). Dispersal and gene flow in free-living marine nematodes. Front. Zool. 10:1. doi: 10.1186/1742-9994-10-1
Dinis, P., Garzanti, E., Vermeesch, P., and Huvi, J. (2017). Climatic zonation and weathering control on sediment composition (Angola). Chem. Geol. 467, 110–121. doi: 10.1016/j.chemgeo.2017.07.030
Duprat, L. P. A. M., Bigg, G. R., and Wilton, D. J. (2016). Enhanced Southern Ocean marine productivity due to fertilization by giant icebergs. Nat. Geosci. 9, 219–221. doi: 10.1038/ngeo2633
Eskin, R. A., and Palmer, M. A. (1985). Suspension of marine nematodes in a turbulent tidal creek: species patterns. Biol. Bull. 169, 615–623.
Etourneau, J., Sgubin, G., Crosta, X., Swingedouw, D., Willmott, V., Barbara, L., et al. (2019). Ocean temperature impact on ice shelf extent in the eastern Antarctic Peninsula. Nat. Commun. 10, 8–15. doi: 10.1038/s41467-018-08195-6
Fabiano, M., and Danovaro, R. (1999). Meiofauna distribution and mesoscale variability in two sites of the Ross Sea (Antarctica) with contrasting food supply. Polar Biol. 22, 115–123. doi: 10.1007/s003000050398
Fonseca, V. G., Sinniger, F., Gaspar, J. M., Quince, C., Creer, S., Power, D. M., et al. (2017). Revealing higher than expected meiofaunal diversity in Antarctic sediments: a metabarcoding approach. Sci. Rep. 7, 1–11. doi: 10.1038/s41598-017-06687-x
Franzo, A., Asioli, A., Roscioli, C., Patrolecco, L., Bazzaro, M., Del Negro, P., et al. (2019). Influence of natural and anthropogenic disturbances on foraminifera and free-living nematodes in four lagoons of the Po delta system. Estuar. Coast. Shelf Sci. 220, 99–110. doi: 10.1016/j.ecss.2019.02.039
Furukawa, Y. (2001). Biogeochemical consequences of macrofauna burrow ventilation. Geochem. Trans. 2:83.
Gambi, C., Pusceddu, A., Benedetti-Cecchi, L., and Danovaro, R. (2014). Species richness, species turnover and functional diversity in nematodes of the deep Mediterranean S ea: searching for drivers at different spatial scales. Glob. Ecol. Biogeogr. 23, 24–39.
Gogina, M., Zettler, M. L., Vanaverbeke, J., Dannheim, J., Van Hoey, G., Desroy, N., et al. (2020). Interregional comparison of benthic ecosystem functioning: community bioturbation potential in four regions along the NE Atlantic shelf. Ecol. Indic. 110:105945. doi: 10.1016/j.ecolind.2019.105945
Gonçalves, A. M. M., Pardal, M. A., Marques, S. C., De Troch, M., and Azeiteiro, U. M. (2010). Distribution and composition of small-size zooplankton fraction in a temperate shallow estuary (Western Portugal). Fresenius Environ. Bull. 19, 3160–3176.
Hauquier, F., Leliaert, F., Rigaux, A., Derycke, S., and Vanreusel, A. (2017). Distinct genetic differentiation and species diversification within two marine nematodes with different habitat preference in Antarctic sediments. BMC Evol. Biol. 17:120. doi: 10.1186/s12862-017-0968-1
Hauquier, F., Suja, L. D., Gutt, J., Veit-Köhler, G., and Vanreusel, A. (2015). Different oceanographic regimes in the vicinity of the Antarctic Peninsula reflected in benthic nematode communities. PLoS One 10:e0137527. doi: 10.1371/journal.pone.0137527
Heip, C., Vincx, M., Smol, N., and Vranken, G. (1982). The systematics and ecology of marine free-living nematodes. Helminthological Abstracts Series B, Plant Nematology 51, 1–31.
Hoffmann, R., Al-Handal, A. Y., Wulff, A., Deregibus, D., Zacher, K., Quartino, M. L., et al. (2019). Implications of glacial melt-related processes on the potential primary production of a microphytobenthic community in potter cove (Antarctica). Front. Mar. Sci. 6:655. doi: 10.3389/fmars.2019.00655
Hoffmann, R., Pasotti, F., Vázquez, S., Lefaible, N., Torstensson, A., MacCormack, W., et al. (2018). Spatial variability of biogeochemistry in shallow coastal benthic communities of Potter Cove (Antarctica) and the impact of a melting glacier. PLoS One 13:e0207917. doi: 10.1371/journal.pone.0207917
Holland, P. R., and Kwok, R. (2012). Wind-driven trends in Antarctic sea-ice drift. Nat. Geosci. 5, 872–875. doi: 10.1038/ngeo1627
Ingels, J., Tchesunov, A. V., and Vanreusel, A. (2011). Meiofauna in the gollum channels and the whittard canyon, celtic margin-how local environmental conditions shape nematode structure and function. PLoS One 6:e020094. doi: 10.1371/journal.pone.0020094
Ingels, J., Vanhove, S., De Mesel, I., and Vanreusel, A. (2006). The biodiversity and biogeography of the free-living nematode genera Desmodora and Desmodorella (family Desmodoridae) at both sides of the Scotia Arc. Polar Biol. 29, 936–949. doi: 10.1007/s00300-006-0135-4
Ingels, J., Vanreusel, A., Brandt, A., Catarino, A. I., David, B., De Ridder, C., et al. (2012). Possible effects of global environmental changes on Antarctic benthos: a synthesis across five major taxa. Ecol. Evol. 2, 453–485. doi: 10.1002/ece3.96
Isla, E., Gerdes, D., Palanques, A., Gili, J. M., and Arntz, W. (2006). Particle fluxes and tides near the continental ice edge on the eastern Weddell Sea shelf. Deep. Res. II 53:866.
Kang, S.-H., Kang, J.-S., Lee, S., Chung, K. H., Kim, D., and Park, M. G. (2001). Antarctic phytoplankton assemblages in the marginal ice zone of the northwestern Weddell Sea. J. Plankton Res. 23, 333–352.
Kennedy, A. D., and Jacoby, C. A. (1999). Biological indicators of marine environmental health: meiofauna - a neglected benthic component? Environ. Monit. Assess. 54, 47–68.
Korbel, K. L., Stephenson, S., and Hose, G. C. (2019). Sediment size influences habitat selection and use by groundwater macrofauna and meiofauna. Aquat. Sci. 81, 1–10. doi: 10.1007/s00027-019-0636-1
Kunz, M., King, M. A., Mills, J. P., Miller, P. E., Fox, A. J., Vaughan, D. G., et al. (2012). Multi-decadal glacier surface lowering in the Antarctic Peninsula. Geophys. Res. Lett. 39, 1–5. doi: 10.1029/2012GL052823
Lawson, D. (1982). Mobilization, movement and deposition of active subaerial sediment flows, matanuska glacier, Alaska. J. Geol. 90, 279–300. doi: 10.1086/628680
Lee, H., Vanhove, S., Peck, L. S., and Vincx, M. (2001). Recolonisation of meiofauna after catastrophic iceberg scouring in shallow Antarctic sediments. Polar Biol. 24, 918–925. doi: 10.1007/s003000100300
Li, Y., and Guo, Y. (2016). Two new free-living marine nematode species of the genus Anoplostoma (Anoplostomatidae) from the mangrove habitats of Xiamen Bay, East China Sea. J. Ocean Univ. China 15, 11–18. doi: 10.1007/s11802-016-2896-x
Lohrer, A. M., Thrush, S. F., and Gibbs, M. M. (2004). Bioturbators enhance ecosystem function through complex biogeochemical interactions. Nature 431, 1092–1095. doi: 10.1038/nature03042
Macheriotou, L., Guilini, K., Bezerra, T. N., Tytgat, B., Nguyen, D. T., Phuong Nguyen, T. X., et al. (2019). Metabarcoding free-living marine nematodes using curated 18S and CO1 reference sequence databases for species-level taxonomic assignments. Ecol. Evol. 9, 1211–1226. doi: 10.1002/ece3.4814
Macheriotou, L., Rigaux, A., Derycke, S., and Vanreusel, A. (2020). Phylogenetic clustering and rarity imply risk of local species extinction in prospective deep-sea mining areas of the clarion-clipperton fracture zone. Proc. R. Soc. B 287:20192666. doi: 10.1098/rspb.2019.2666
Martín, C., Gudmundsson, G. H., Pritchard, H. D., and Gagliardini, O. (2009). On the effects of anisotropic rheology on ice flow, internal structure, and the age-depth relationship at ice divides. J. Geophys. Res. Earth Surf. 114, 1–18. doi: 10.1029/2008JF001204
Meslard, F., Bourrin, F., Many, G., and Kerhervé, P. (2018). Suspended particle dynamics and fluxes in an Arctic fjord (Kongsfjorden, Svalbard). Estuar. Coast. Shelf Sci. 204, 212–224. doi: 10.1016/j.ecss.2018.02.020
Meysman, F. J. R., Galaktionov, O. S., Gribsholt, B., and Middelburg, J. J. (2006). Bioirrigation in permeable sediments: advective pore-water transport induced by burrow ventilation. Limnol. Oceanogr. 51, 142–156. doi: 10.4319/lo.2006.51.1.0142
Mincks, S. L., Smith, C. R., Jeffreys, R. M., and Sumida, P. Y. G. (2008). Trophic structure on the West Antarctic Peninsula shelf, detritivory and benthic inertia revealed by d13C and d15N analysis. Deep. Res. 55:2502.
Moline, M. A., and Prezelin, B. B. (1996). Long-term monitoring and analyses of physical factors regulating variability in coastal Antarctic phytoplankton biomass, i n situ productivity and taxonomic composition over subseasonal, seasonal and interannual time scales. Mar. Ecol. Prog. Ser. 145, 143–160.
Montes-Hugo, M., Doney, S. C., Ducklow, H. W., Fraser, W., Martinson, D., Stammerjohn, S. E., et al. (2009). Recent Changes in Phytoplankton communities associated with rapid regional climate change along the Western Antarctic Peninsula. Science 323, 1470–1473.
Moreno, M., Semprucci, F., Vezzulli, L., Balsamo, M., Fabiano, M., and Albertelli, G. (2011). The use of nematodes in assessing ecological quality status in the Mediterranean coastal ecosystems. Ecol. Indic. 11, 328–336. doi: 10.1016/j.ecolind.2010.05.011
Nardelli, S., Kohut, J., Schofield, O., Waite, N., Brown, M., Saba, G., et al. (2018). Changes in the upper ocean mixed layer and phytoplankton productivity along the West Antarctic Peninsula. Philos. Trans. R. Soc. A Math. Eng. Sci. 376, 20170173. doi: 10.1098/rsta.2017.0173
Nascimento, F. J. A., Karlson, A. M. L., and Elmgren, R. (2011). Diversity of larger consumers enhances interference competition effects on smaller competitors. Oecologia 166, 337–347. doi: 10.1007/s00442-010-1865-0
Nokes, C. R., Bostock, H. C., Strachan, L. J., and Hadfield, M. G. (2019). Hydrodynamics and sediment transport on the North Canterbury Shelf, New Zealand. New Zeal. J. Mar. Freshw. Res. 55, 1–20. doi: 10.1080/00288330.2019.1699584
Oppenheimer, M. (1998). Global warming and the stability of the West Antarctic Ice Sheet. Nature 393, 325–332.
Pasotti, F., Convey, P., and Vanreusel, A. (2014). Potter Cove, west Antarctic Peninsula, shallow water meiofauna: a seasonal snapshot. Antarct. Sci. 26, 554–562. doi: 10.1017/S0954102014000169
Perolo, P., Bakker, M., Gabbud, C., Moradi, G., Rennie, C., and Lane, S. N. (2019). Subglacial sediment production and snout marginal ice uplift during the late ablation season of a temperate valley glacier. Earth Surf. Process. Landf. 44, 1117–1136. doi: 10.1002/esp.4562
Polvani, L. M., Waugh, D. W., Correa, G. J., and Son, S. W. (2011). Stratospheric ozone depletion: the main driver of twentieth-century atmospheric circulation changes in the Southern Hemisphere. J. Clim. 24, 795–812. doi: 10.1175/2010JCLI3772.1
Prezèlin, B. B., Hofmann, E. E., Mengelt, C., and Klinck, J. M. (2000). The linkage between Upper Circumpolar Deep Water (UCDW) and phytoplankton assemblages on the west Antarctic Peninsula continental shelf. J. Mar. Res. 58, 165–202.
Pritchard, H. D., Ligtenberg, S. R. M., Fricker, H. A., Vaughan, D. G., Van Den Broeke, M. R., and Padman, L. (2012). Antarctic ice-sheet loss driven by basal melting of ice shelves. Nature 484, 502–505. doi: 10.1038/nature10968
Pritchard, H. D., and Vaughan, D. G. (2007). Widespread acceleration of tidewater glaciers on the Antarctic Peninsula. J. Geophys. Res. Earth Surf. 112, 1–10. doi: 10.1029/2006JF000597
Raes, M., De Troch, M., Ndaro, S. G. M., Muthumbi, A., Guilini, K., and Vanreusel, A. (2007). The structuring role of microhabitat type in coral degradation zones: a case study with marine nematodes from Kenya and Zanzibar. Coral Reefs 26, 113–126. doi: 10.1007/s00338-006-0184-8
Raes, M., Rose, A., and Vanreusel, A. (2010). Response of nematode communities after large-scale ice-shelf collapse events in the Antarctic Larsen area. Glob. Chang. Biol. 16, 1618–1631. doi: 10.1111/j.1365-2486.2009.02137.x
Rignot, E., and Jacobs, S. S. (2002). Rapid Bottom melting Widespread near Antarctic Ice sheet grounding lines. Science 296, 2020–2023. doi: 10.1126/science.1070942
Rott, H., Abdel Jaber, W., Wuite, J., Scheiblauer, S., Floricioiu, D., Van Wessem, J. M., et al. (2018). Changing pattern of ice flow and mass balance for glaciers discharging into the Larsen A and B embayments, Antarctic Peninsula, 2011 to 2016. Cryosphere 12, 1273–1291. doi: 10.5194/tc-12-1273-2018
Rott, H., Rack, W., Skvarca, P., and De Angelis, H. (2002). Northern Larsen Ice Shelf, Antarctica: further retreat after collapse. Ann. Glaciol. 34, 277–282. doi: 10.3189/172756402781817716
Scambos, T., Fricker, H. A., Liu, C.-C., Bohlander, J., Fastook, J., Sargent, A., et al. (2009). Ice shelf disintegration by plate bending and hydro-fracture: satellite observations and model results of the 2008 Wilkins ice shelf break-ups. Earth Planet. Sci. Lett. 280, 51–60. doi: 10.1016/j.epsl.2008.12.027
Schmid-Araya, J. M., Schmid, P. E., Tod, S. P., and Esteban, G. F. (2016). Trophic positioning of meiofauna revealed by stable isotopes and food web analyses. Ecology 97, 3099–3109.
Schratzberger, M., and Ingels, J. (2018). Meiofauna matters: the roles of meiofauna in benthic ecosystems. J. Exp. Mar. Bio. Ecol. 502, 12–25. doi: 10.1016/j.jembe.2017.01.007
Schratzberger, M., Warr, K., and Rogers, S. I. (2006). Patterns of nematode populations in the southwestern North Sea and their link to other components of the benthic fauna. J. Sea Res. 55, 113–127. doi: 10.1016/j.seares.2005.07.002
Seinhorst, J. W. (1959). A rapid method for the transfer of nematodes from fixative to anhydrous glycerin. Nematologica 4, 67–69.
Semprucci, F., Colantoni, P., Baldelli, G., Rocchi, M., and Balsamo, M. (2010). The distribution of meiofauna on back-reef sandy platforms in the Maldives (Indian Ocean). Mar. Ecol. 31, 592–607. doi: 10.1111/j.1439-0485.2010.00383.x
Semprucci, F., Sbrocca, C., Rocchi, M., and Balsamo, M. (2015). Temporal changes of the meiofaunal assemblage as a tool for the assessment of the ecological quality status. J. Mar. Biol. Assoc. U.K. 95, 247–254. doi: 10.1017/S0025315414001271
Shuman, C. A., Berthier, E., and Scambos, T. A. (2011). 2001-2009 elevation and mass losses in the Larsen A and B embayments, Antarctic Peninsula. J. Glaciol. 57, 737–754. doi: 10.3189/002214311797409811
Siegert, M., Atkinson, A., Banwell, A., Brandon, M., Convey, P., Davies, B., et al. (2019). The Antarctic Peninsula under a 1.5°C global warming scenario. Front. Environ. Sci. 7:102. doi: 10.3389/fenvs.2019.00102
Smith, C. R., Mincks, S., and DeMaster, D. J. (2008). The FOODBANCS project, Introduction and sinking fluxes of organic carbon, chlorophyll-a and phytodetritus on the western Antarctic Peninsula continental shelf. Deep. Res. II 55:2404.
Stark, J. S., Mohammad, M., McMinn, A., and Ingels, J. (2020). Diversity, abundance, spatial variation, and human impacts in marine Meiobenthic nematode and copepod communities at casey station, East Antarctica. Front. Mar. Sci. 7:480. doi: 10.3389/fmars.2020.00480
Steyaert, M., Moodley, L., Nadong, T., Moens, T., Soetaert, K., and Vincx, M. (2007). Responses of intertidal nematodes to short-term anoxic events. J. Exp. Mar. Bio. Ecol. 345, 175–184. doi: 10.1016/j.jembe.2007.03.001
Steyaert, M., Priestley, V., Osborne, O., Herraiz, A., Arnold, R., and Savolainen, V. (2020). Advances in metabarcoding techniques bring us closer to reliable monitoring of the marine benthos. J. Appl. Ecol. 57, 2234–2245.
Stuecker, M. F., Bitz, C. M., and Armour, K. C. (2017). Conditions leading to the unprecedented low Antarctic sea ice extent during the 2016 austral spring season. Geophys. Res. Lett. 44, 9008–9019. doi: 10.1002/2017GL074691
Surey-Gent, S. C. (1981). Distribution of Anoplostoma viviparum (Nematoda) in Southampton Water sediments. Mar. Biol. 62, 157–160.
Taheri, M., Bastami, K. D., and Yazdani, M. (2017). “The role of the sediment conditions in shaping meiofauna spatial distribution in the shallow water of the south Caspian Sea,” in Proceedings of the First International Conference on Oceanography for West Asia (Tehran: Civilica).
Tarjan, A. C., and Keppner, E. J. (2008). Illustrated Key to the Genera of Free-Living Marine Nematodes in the Superfamily Chromadoroides Exclusive of the Chromadoridae. Available online at: https://entnemdept.ufl.edu/creatures/nematode/marine_nematodes.htm (accessed December 8, 2019).
van de Velde, S., and Meysman, F. J. R. (2016). The influence of bioturbation on iron and sulphur cycling in marine sediments: a model analysis. Aquat. Geochem. 22, 469–504.
Van Heukelem, L., and Thomas, C. S. (2001). Computer-assisted high-performance liquid chromatography method development with applications to the isolation and analysis of phytoplankton pigments. J. Chromatogr. A 910, 31–49. doi: 10.1016/S0378-4347(00)00603-4
Van Leeuwe, M. A., Tedesco, L., Arrigo, K. R., Assmy, P., Meiners, K. M., Rintala, J., et al. (2018). Microalgal community structure and primary production in Arctic and Antarctic sea ice: a synthesis. Elem. Sci. Anthropocene 6:4.
Vanhove, S., Arntz, W., and Vincx, M. (1999). Comparative study of the nematode communities on the southeastern Weddell Sea shelf and slope (Antarctica). Mar. Ecol. Prog. Ser. 181, 237–256. doi: 10.3354/meps181237
Vanhove, S., Vermeeren, H., and Vanreusel, A. (2004). Meiofauna towards the South sandwich trench (750-6300 m), focus on nematodes. Deep. Res. Part II Top. Stud. Oceanogr. 51, 1665–1687. doi: 10.1016/j.dsr2.2004.06.029
Vanhove, S., Wittoeck, J., Desmet, G., Van den Berghe, B., Herman, R. L., Bak, R. P. M., et al. (1995). Deep-sea meiofauna communities in Antarctica: structural analysis and relation with the environment. Mar. Ecol. Prog. Ser. 127, 65–76.
Vanreusel, A., Fonseca, G., Danovaro, R., Cristina, M., Ferrero, T., Gad, G., et al. (2010). The contribution of deep-sea macrohabitat heterogeneity to global nematode diversity. Mar. Ecol. 31, 6–20. doi: 10.1111/j.1439-0485.2009.00352.x
Vaughan, D. G., Marshall, G. J., Connolley, W. M., Parkinson, C., Mulvaney, R., Hodgson, D. A., et al. (2003). Recent rapid regional climate warming on the Antarctic Peninsula. Clim. Chang. 60, 243–274.
Veit-Köhler, G., Durst, S., Schuckenbrock, J., Hauquier, F., Durán Suja, L., Dorschel, B., et al. (2018). Oceanographic and topographic conditions structure benthic meiofauna communities in the Weddell Sea, Bransfield Strait and Drake Passage (Antarctic). Prog. Oceanogr. 162, 240–256. doi: 10.1016/j.pocean.2018.03.005
Vermeeren, H. (2002). Biogeografie van Antarctische Diepzeenematoden: Species Turn-Over in Dominante Genera van de Familie Chromadoridae. MSc thesis. Gent: Universiteit Gent.
Vinagre, C., Salgado, J. P., Mendonça, V., Cabral, H., and Costa, M. J. (2012). Isotopes reveal fl uctuation in trophic levels of estuarine organisms, in space and time. J. Sea Res. 72, 49–54. doi: 10.1016/j.seares.2012.05.010
Warwick, R. M., Platt, H. M., and Somerfield, P. J. (1998). “Freeliving marine nematodes part III Monhysterids: pictorial key to world genera and notes for the identification of British species,” in Synopses of the British Fauna (New Series) 53, eds R. S. K. Barnes and J. H. Crothers (Shrewsbury: Field Studies Council), 296.
Wetzel, M. A., Weber, A., and Giere, O. (2002). Re-colonization of anoxic/sulfidic sediments by marine nematodes after experimental removal of macroalgal cover. Mar. Biol. 141, 679–689. doi: 10.1007/s00227-002-0863-0
Wieser, W. (1953). Die Beziehung zwischen Mundhohlengestalt, ernahrungsweise und vorkommen bei freilebenden marinen Nematoden. Ark. Zool. 4, 439–484.
Keywords: Eastern Antarctic Peninsula, benthos, nematodes, Prince Gustav Channel, Duse Bay, metabarcoding, ASVs, biodiversity
Citation: Pantó G, Pasotti F, Macheriotou L and Vanreusel A (2021) Combining Traditional Taxonomy and Metabarcoding: Assemblage Structure of Nematodes in the Shelf Sediments of the Eastern Antarctic Peninsula. Front. Mar. Sci. 8:629706. doi: 10.3389/fmars.2021.629706
Received: 15 November 2020; Accepted: 18 June 2021;
Published: 23 July 2021.
Edited by:
Katrin Linse, British Antarctic Survey, United KingdomReviewed by:
Gritta Veit-Köhler, Senckenberg am Meer Wilhelmshaven, GermanyFederica Semprucci, University of Urbino Carlo Bo, Italy
Copyright © 2021 Pantó, Pasotti, Macheriotou and Vanreusel. This is an open-access article distributed under the terms of the Creative Commons Attribution License (CC BY). The use, distribution or reproduction in other forums is permitted, provided the original author(s) and the copyright owner(s) are credited and that the original publication in this journal is cited, in accordance with accepted academic practice. No use, distribution or reproduction is permitted which does not comply with these terms.
*Correspondence: Gabriella Pantó, R2FicmllbGxhLlBhbnRvQFVHZW50LmJl