
94% of researchers rate our articles as excellent or good
Learn more about the work of our research integrity team to safeguard the quality of each article we publish.
Find out more
ORIGINAL RESEARCH article
Front. Mar. Sci., 21 April 2021
Sec. Marine Conservation and Sustainability
Volume 8 - 2021 | https://doi.org/10.3389/fmars.2021.629230
This article is part of the Research TopicHabitat and Distribution Models of Marine and Estuarine Species: Advances for a Sustainable FutureView all 15 articles
 Kevin D. Friedland1*
 Elizabeth T. Methratta2
 Andrew B. Gill3
 Sarah K. Gaichas4
 Tobey H. Curtis5
 Evan M. Adams6
 Janelle L. Morano7
 Daniel P. Crear8
 M. Conor McManus9
 Damian C. Brady10
States in the Northeast United States have the ambitious goal of producing more than 22 GW of offshore wind energy in the coming decades. The infrastructure associated with offshore wind energy development is expected to modify marine habitats and potentially alter the ecosystem services. Species distribution models were constructed for a group of fish and macroinvertebrate taxa resident in the Northeast US Continental Shelf marine ecosystem. These models were analyzed to provide baseline context for impact assessment of lease areas in the Middle Atlantic Bight designated for renewable wind energy installations. Using random forest machine learning, models based on occurrence and biomass were constructed for 93 species providing seasonal depictions of their habitat distributions. We developed a scoring index to characterize lease area habitat use for each species. Subsequently, groups of species were identified that reflect varying levels of lease area habitat use ranging across high, moderate, low, and no reliance on the lease area habitats. Among the species with high to moderate reliance were black sea bass (Centropristis striata), summer flounder (Paralichthys dentatus), and Atlantic menhaden (Brevoortia tyrannus), which are important fisheries species in the region. Potential for impact was characterized by the number of species with habitat dependencies associated with lease areas and these varied with a number of continuous gradients. Habitats that support high biomass were distributed more to the northeast, while high occupancy habitats appeared to be further from the coast. There was no obvious effect of the size of the lease area on the importance of associated habitats. Model results indicated that physical drivers and lower trophic level indicators might strongly control the habitat distribution of ecologically and commercially important species in the wind lease areas. Therefore, physical and biological oceanography on the continental shelf proximate to wind energy infrastructure development should be monitored for changes in water column structure and the productivity of phytoplankton and zooplankton and the effects of these changes on the trophic system.
The provision of ecosystem goods and services is intersecting with the rapid development of the offshore wind industry in continental shelf seas, an effort in energy generation designed in part to ameliorate the effects of climate change (Causon and Gill, 2018; UNEP, 2019). Shelf seas account for the majority of seafood production of the World Ocean (Costanza et al., 2014), which raises particular concern about the impacts that energy infrastructure will have on fisheries and dependent communities (Hooper et al., 2015; Carpenter, 2020). Therefore, we have a growing need to develop assessment methods to understand the intersection of fisheries resources with potential offshore wind energy areas.
Interactions between wind energy production and fisheries resources occur across trophic levels and life stages, during each phase of energy infrastructure development, and through biotic and abiotic pathways (Boehlert and Gill, 2010; Pezy et al., 2020). The exploration and construction phases of offshore wind development bring periodic elevated noise levels to the marine environment through increased vessel traffic, seismic survey methods, and, in most cases of fixed foundation turbines, impulse pile driving (Wahlberg and Westerberg, 2005; Hatch et al., 2008). Acoustic changes to the marine environment can cause sublethal physiological effects (Popper and Hawkins, 2019) and mortality, as well as changes in movement, behavior, habitat utilization, and migration patterns for numerous marine taxa (Boehlert and Gill, 2010; Brandt et al., 2018). Once installed and operating, wind turbine foundations create new hard bottom habitats that enhance the recruitment of native and non-native benthic invertebrates (De Mesel et al., 2015). The resulting artificial reefs attract fish species seeking food and refuge (Wilhelmsson et al., 2006). Shells and other biogenic materials associated with reef organisms are deposited in the surrounding environment, increasing sediment organic content and nutrient concentrations, and thus modifying benthic community composition (Wilding, 2014). Furthermore, the network of power cables associated with wind farms emits electromagnetic fields, which have the potential to affect behavior and movement of commercially valued and migratory species (Hutchison et al., 2020).
Localized hydrodynamic regime changes at the scale of individual turbines and wind farms occur as currents pass structures, modifying downstream turbulence, surface wave energy, and upwelling patterns (Bakhoday-Paskyabi et al., 2018). Much larger scale effects (∼80 km from structures) on hydrodynamics and vertical stratification are possible through the impact of wind wakes and dynamic coupling of the ocean and atmospheric systems (Carpenter et al., 2016). Physical and biological oceanographic processes are directly linked through numerous mechanisms, including the vertical and horizontal transport of macro- and micro- nutrients to primary producers, and changes in the distribution of suspended particulates, and the effect of this suspended matter on the depth of the photic zone. Altered hydrodynamic patterns could affect primary production as well as upper trophic levels. These conceptual linkages have been demonstrated with empirical data in the southern North Sea that revealed increased vertical mixing at an offshore wind farm resulting in the transport of nutrients to the surface mixed layer and subsequent uptake by phytoplankton in the photic zone (Floeter et al., 2017). Changes in water column properties (water temperature, dissolved oxygen, and suspended matter concentration) have also been linked to altered zooplankton community structure at offshore wind farms in China (Wang et al., 2018). Increased primary production could have important implications for the productivity of bivalves and other macro-benthic suspension feeders, representing a major component of artificial reef communities that form on turbine foundations (Slavik et al., 2019; Mavraki et al., 2020). In total, these effects may propagate to upper trophic levels, particularly predatory fish on and around the turbines (Pezy et al., 2020).
Assessing the effects of offshore wind on fisheries resources requires that we know what to measure, what survey designs to use, and how to coordinate that information with existing surveys that support regional stock assessments (Wilding, 2014; Methratta, 2020). Our traditional view of how fish habitat is defined is rapidly changing; there is expanding evidence suggesting that fish habitats can be determined by biological variables related to primary and secondary production patterns (Weber et al., 2018; Mazur et al., 2020). This highlights the need to continue, or expand, current sampling efforts related to the water column parameters such as phytoplankton and zooplankton and suspended sediment material.
Currently in the United States, the offshore wind energy developers are required by the Federal Agency responsible for permitting and management of the offshore waters [the Bureau of Ocean Management (BOEM)], to consider essential fish habitat (EFH) designations developed by the National Marine Fisheries Service (NMFS) for fishery management plans to help assess species and habitat impacts. While EFH has benefits in its availability and mostly standardized development across species, it is a comparatively coarse representation of a given species’ distribution and habitat reliance, and can be based on sparse or discontinuously collected observations (Moore et al., 2016). EFH may encompass the broad range of a species’ distribution and its habitats, but does not generally discern if there are focal or highly preferred habitat areas within that distribution, or if there are seasonal shifts in distribution. Species distribution models (SDMs) can complement EFH by providing higher resolution distribution probabilities within EFH and identify influential environmental parameters and habitat suitability. Various types of SDMs have been developed using fishery-dependent or -independent data to both hindcast and forecast species distributions and habitat suitability relative to spatial fisheries management needs (Hazen et al., 2018; Crear et al., 2020).
Offshore wind energy capacity is developing rapidly across the Northeast US Continental Shelf ecosystem (NES), with most projects currently in a pre-construction planning and assessment phase. There are considerable data gaps and a need for additional baseline information to support the assessment of these impacts on marine resources in this highly productive region. The goal of this study was to characterize the use of wind energy lease areas by fish and macroinvertebrate species sampled in resource abundance surveys on the NES and identify species with a high dependency on lease area habitats. These species might be considered for prioritized attention and research by fisheries management. The characterization was based on habitat or SDMs developed using machine learning techniques. These models provided species occurrence probability and biomass productivity at spatial scales related to BOEM lease areas. The relative importance of habitats was characterized for use by each species, including the change in dependency on these habitats over time, and the biological and physical aspects of the ecosystem that shaped habitat. The models in this study draw on a range of lower trophic level variables to provide context for identifying ecosystem properties that would merit monitoring before, during, and after installing energy-generating structures.
We studied the distribution of fish and macroinvertebrates occurring in the NES, a well-studied marine system along the western boundary of the North Atlantic Ocean. We fit SDMs estimating occupancy and biomass habitats onto a 0.1-degree grid, termed the estimation grid (Figure 1A). The boundaries of eleven wind energy lease areas are identified as either existing lease areas, E1–E7, or proposed areas, P1–P4. Each lease area will be composed of a number of parcels of varying size (boundaries as of May 2020). A single convex hull was drawn around the parcels of each lease area and was the basis for spatial data extraction representing that area; hence, this was exclusive of any cable corridors. Since depth distribution is an important factor, bathymetric relief and key depth contours are shown in Figure 1B, along with identifying areas within the NES commonly referred to in the text.
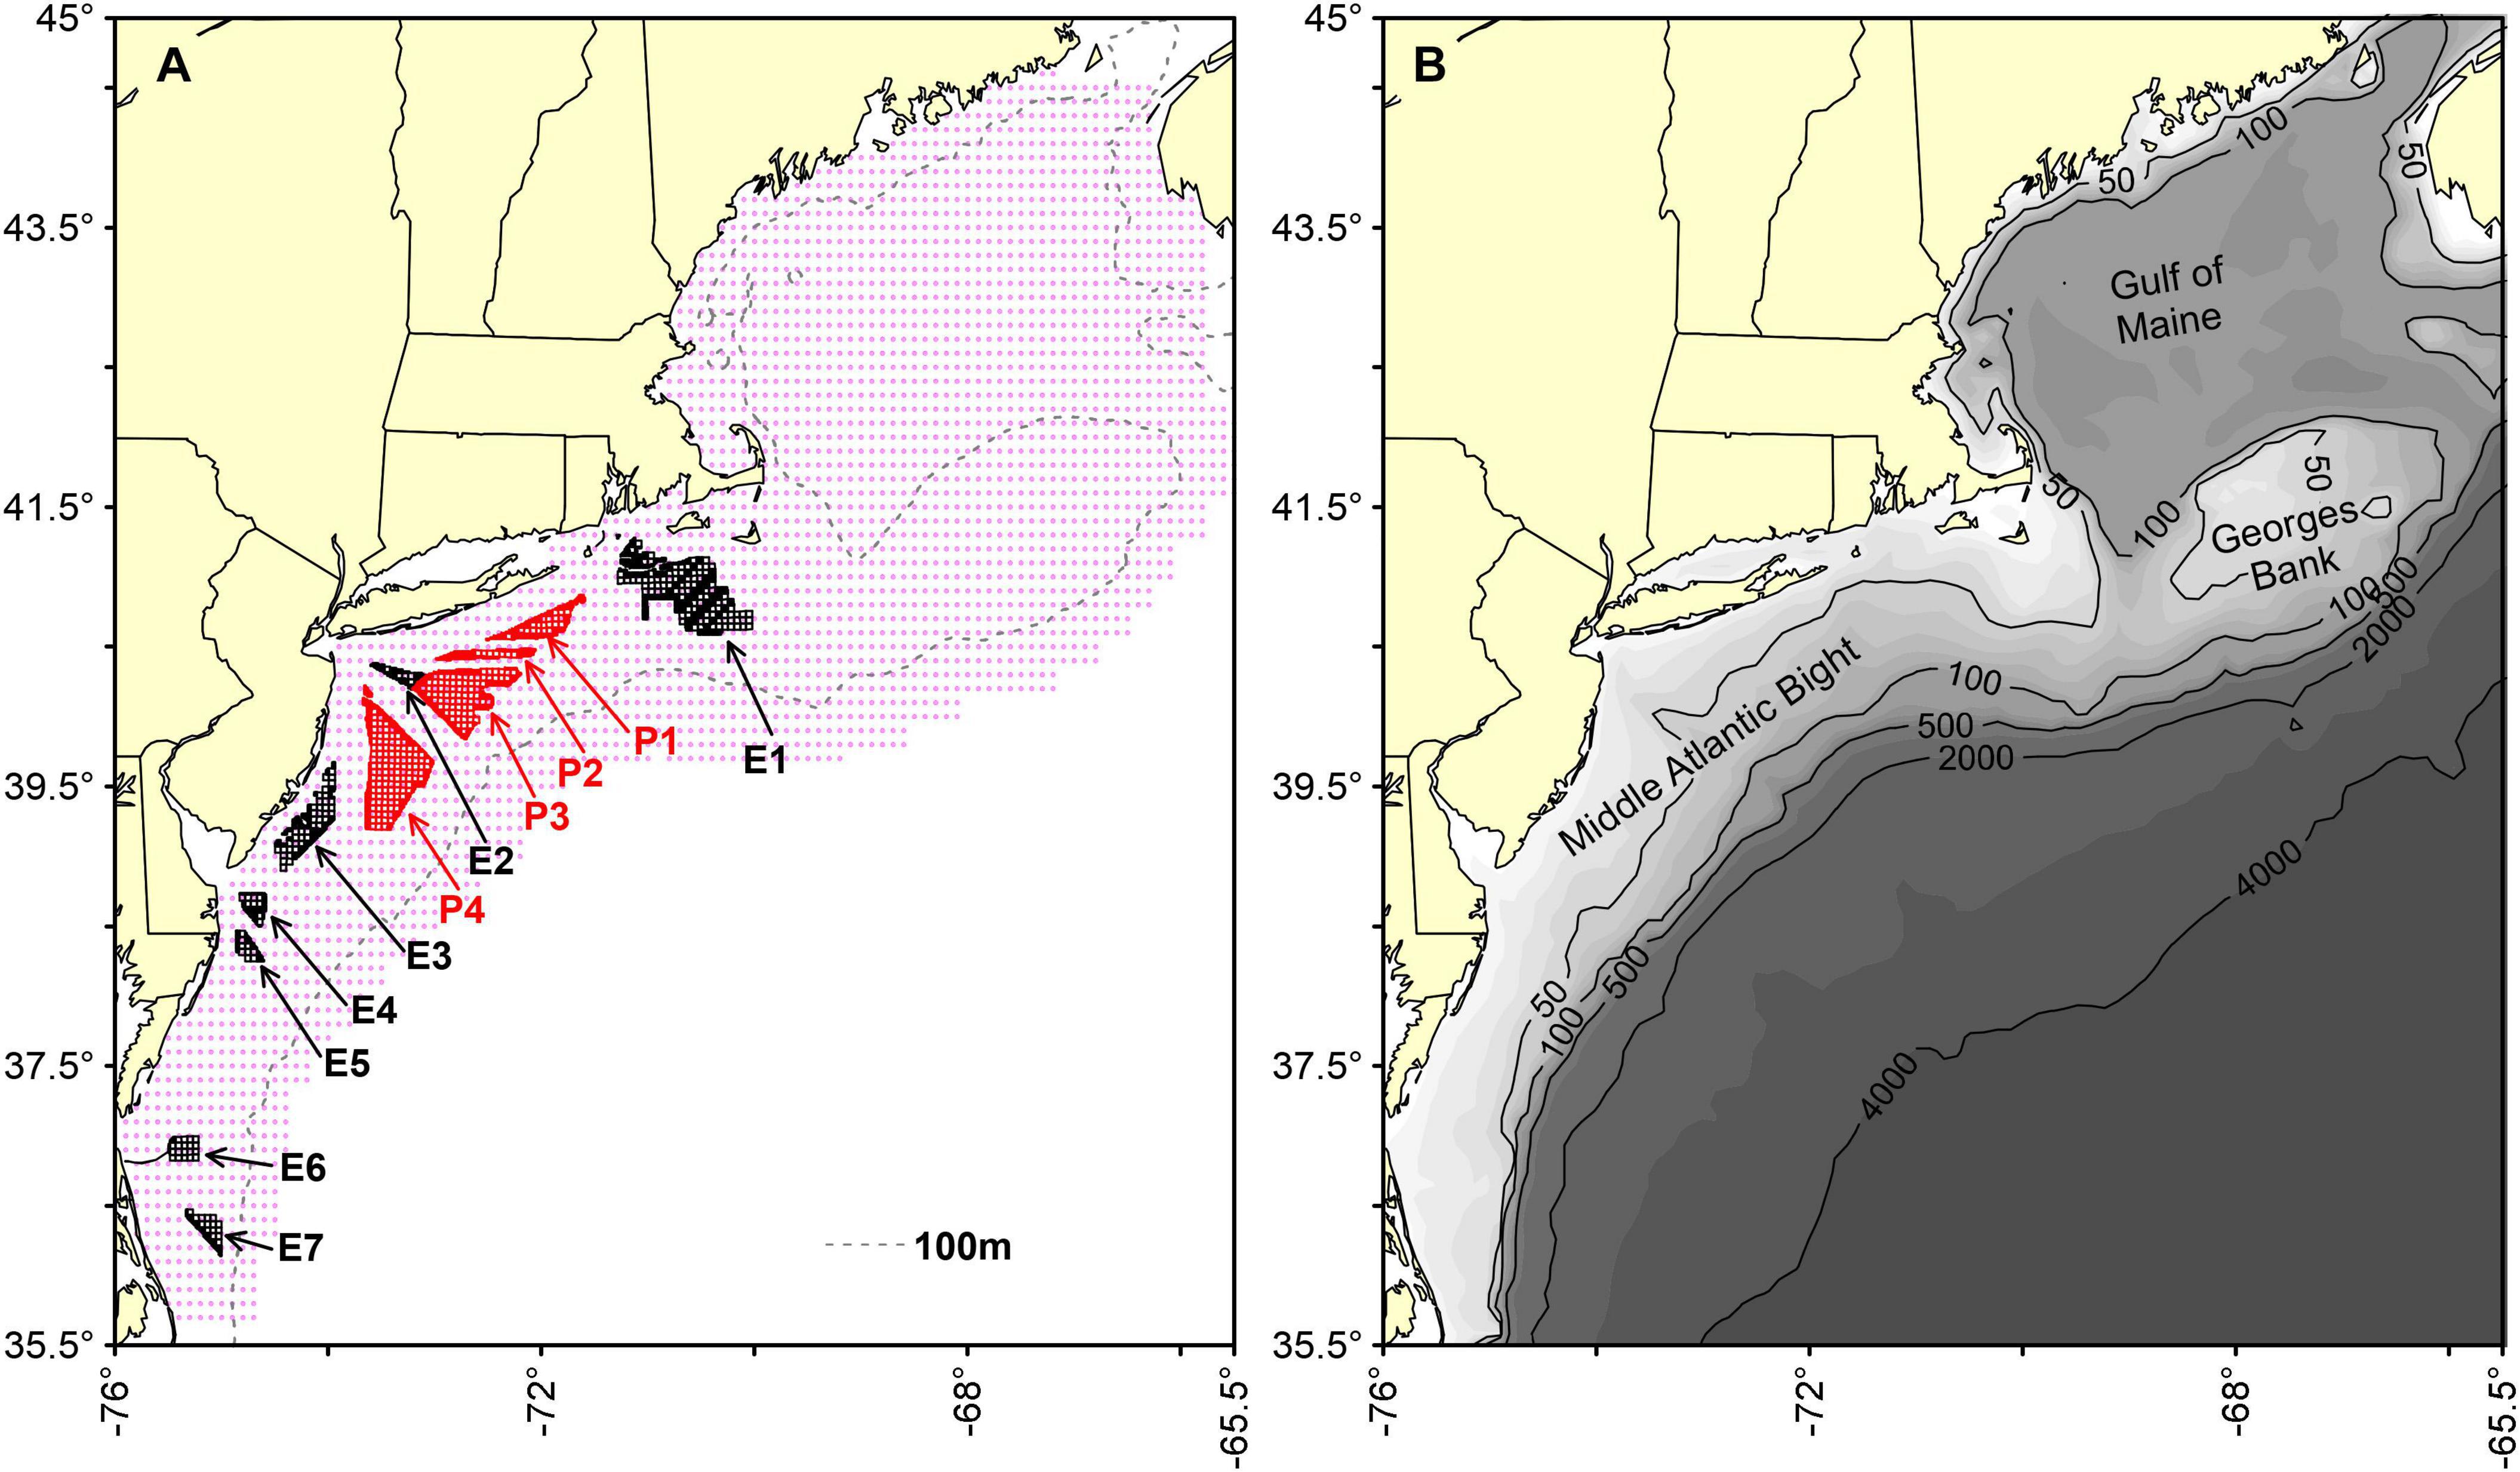
Figure 1. Map of the study system showing the estimation grid (red dots) for habitat models (A) and bathymetry (B). Existing (black outlines) and proposed (red outlines) energy lease sites on the Northeast US Shelf are labels E1 through E7 and P1 through P4, respectively. Bathymetric relief, key depth contours, areas of significance within the NES are also presented.
The basis of the study was a series of SDMs incorporating habitat features for taxa captured in a fishery-independent bottom trawl survey conducted in the NES. The bottom trawl survey has been conducted by the Northeast Fisheries Science Center each year since 1963 in the fall and spring since 1968, occupying upward of 300 stations during each season and is based on a random stratified design (Desprespatanjo et al., 1988). Catches were standardized for various correction factors related to vessels and gears used in the time series (Miller et al., 2010). The survey catch provided the binary response of presence or absence for each taxa as the response variable in classification models, and catch per unit (log10[CPUE kg tow–1 + 1]) of biomass used as continuous variables in the regression models that can be thought of as a biomass habitat metric (see Data Availability Statement). Though time series of catch data extend back to the 1960s, the time series of the analysis was limited to the period 1976–2018 due the availability of other data described below.
Physical and biological environmental data used as predictor variables included dynamic variables that changed annually with recurring sampling and static variables that were held constant over time. The suite of predictors can be summarized over five general categories (Table 1). Physical environmental variables, including surface and bottom water temperature and salinity were collected contemporaneously with survey trawl samples with Conductivity/Temperature/Depth (CTD) instruments (see Data Availability Statement). Temperature and salinity were initially tested as dynamics variables; however, salinity was found to be a weak predictor and was applied as a static variable, which enabled training and fitting the models over the period 1976–2018. Depth of the survey station (meters) was a static variable in the analysis.
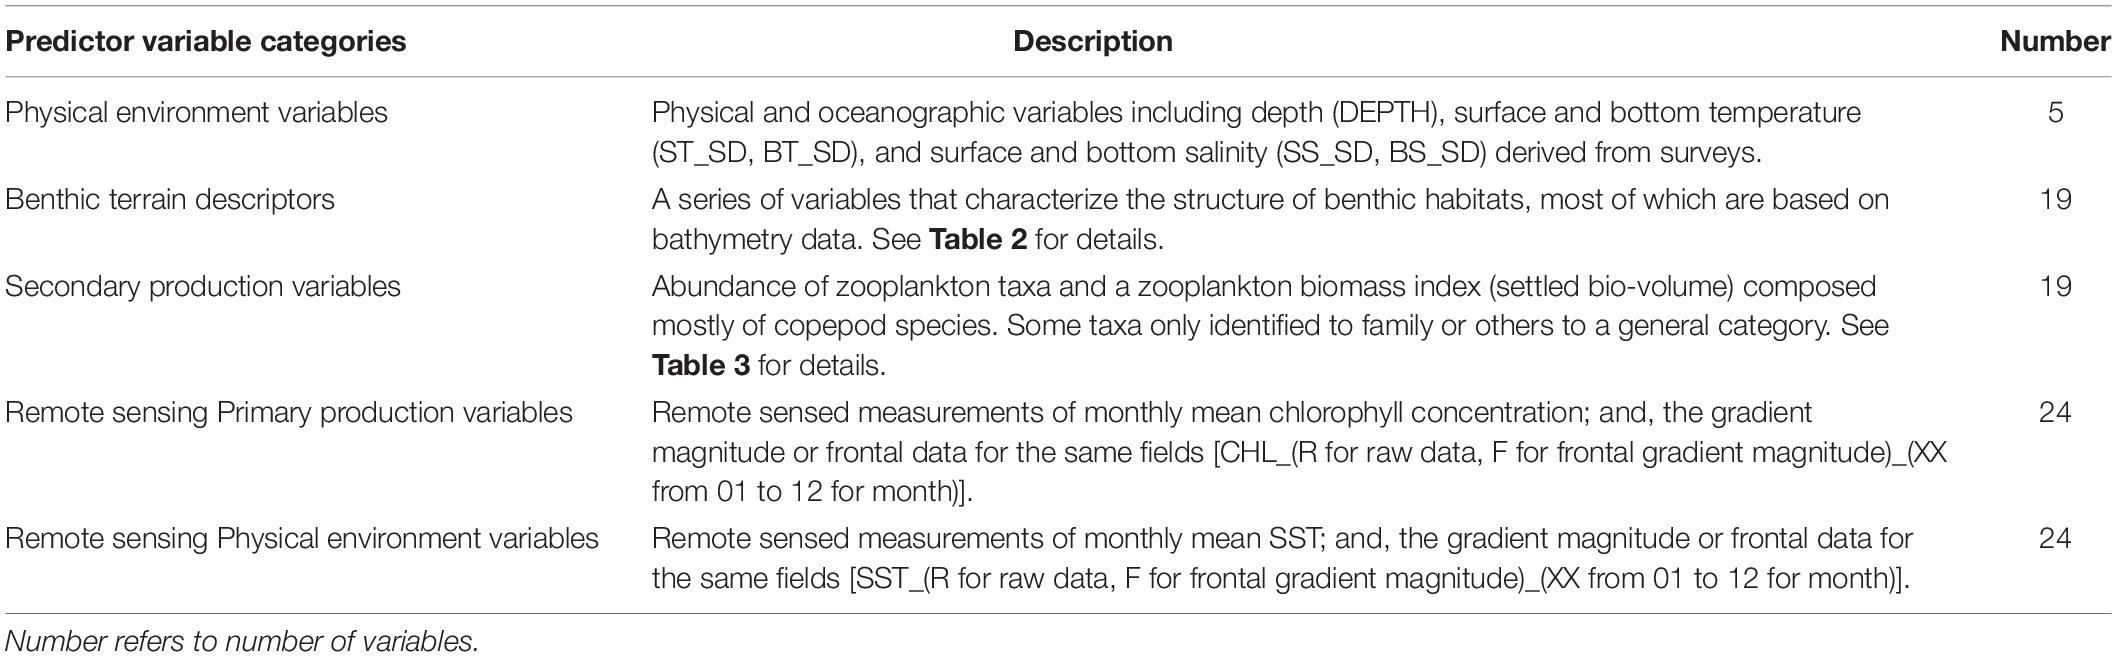
Table 1. Summary of predictor variables used in the development of spring and fall presence/absence and biomass habitat models.
In addition to the dynamic station temperature variables, remote sensing sea surface temperature (SST) fields were used to derive a complementary set of static physical environment variables. SST fields from the MODIS Terra sensor were used to generate monthly mean SST data and monthly gradient magnitude, or frontal fields of the SST (see Data Availability Statement). There are many methods used to identify fronts (Belkin and O’Reilly, 2009) in oceanographic data that usually utilize some focal filter to reduce noise and then identify gradient magnitude with a Sobel filter. Calculations were performed in R using the “raster” package (version 2.6-7) by applying a three by three mean focal filter and a Sobel filter to generate x and y derivatives, which were then used to calculate gradient magnitude.
Benthic terrain descriptors included a series of static variables that characterize the shape and complexity of the substrate. Most benthic terrain variables were derived from the depth measurements, such as vector ruggedness, rugosity, and slope (Table 2). Other variables described the substrate itself, such as benthic sediment grain size. The vorticity of benthic currents was also considered a benthic terrain variable. These variables were sampled to match the position of a survey trawl.

Table 2. Summary of benthic terrain predictor variables used in the development of spring and fall presence/absence and biomass habitat models.
Biological covariates included predictor variables representing lower trophic level primary and secondary production. Primary production variables were monthly chlorophyll concentration static variables developed from a multi-sensor remote sensing data source. These data were merged using the Garver, Siegel, Maritorena Model algorithm (Maritorena et al., 2010) obtained from the Hermes GlobColour website and provided data over the period of 1997–2016 (see Data Availability Statement). As with the remote sensing SST data, monthly gradient magnitude (i.e., chlorophyll frontal fields) were also developed. Both the SST and chlorophyll concentration variables were sampled to match the position of a survey trawl.
Secondary production variables were based on zooplankton abundances measured by the Ecosystem Monitoring Program (EcoMon), which conducts shelf-wide bimonthly random-stratified surveys of the NES (Kane, 2007). Zooplankton are collected obliquely through the water column to a maximum depth of 200 m using paired 61-cm Bongo samplers equipped with 333-micron mesh nets (see Data Availability Statement). We used the density estimates (number per 100 m3) of the 18 most abundant taxonomic categories and a biomass indicator (settled bio-volume) as potential predictor variables (Table 3). The zooplankton time series has some missing values, which were ameliorated by summing data over 5-year time steps for each seasonal period and interpolating a complete field using ordinary kriging. For example, zooplankton data for spring 2000 would include the available data from tows made during the period 1998–2002. The zooplankton variables were sampled to match the date (season) and position of the survey trawl.
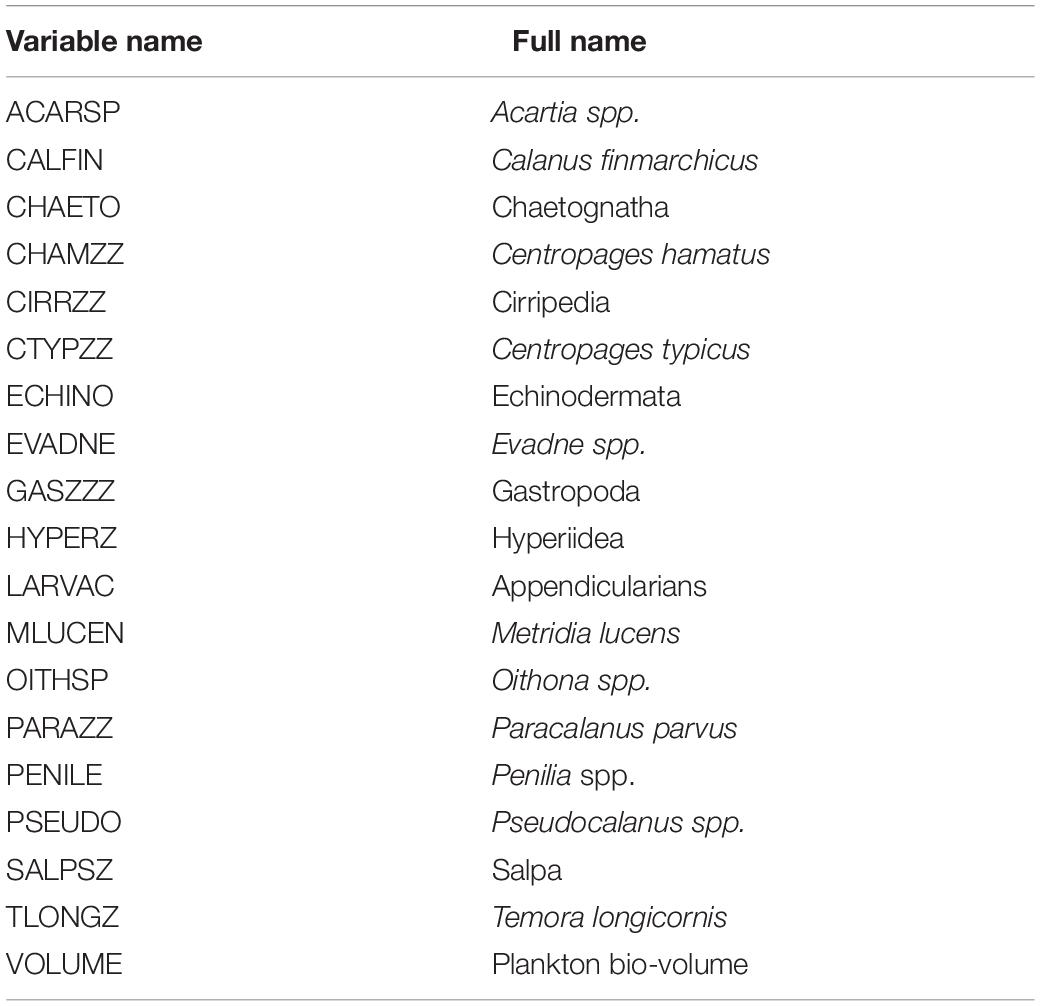
Table 3. Summary of zooplankton predictor variables used in the development of spring and fall presence/absence and biomass habitat models.
Seasonal SDMs were developed using the approach as reported in Friedland et al. (2020); however, salinity variables were static fields as opposed to dynamic. Random Forest models based on occurrence were fit as classification models of the presence or absence of taxa in a trawl tow and yielded an occurrence probability; hereafter, these models are referred to as presence/absence models and the estimates of habitat from these models is referred to as occupancy habitat. Random Forest models based on biomass were fit as regression models of the catch rate of taxa in weight and yielded an index of biomass; hereafter, these models are referred to as biomass models and their output as biomass habitat. Random forest machine learning models were fit (Cutler et al., 2007) using the “randomForest” R package (version 4.6-14). Random forest models can achieve comparable predictive power to other statistical methods (Smolinski and Radtke, 2017). Prior to fitting the model, the independent variables were tested for multi-collinearity among the predictors using the multi-collinear command from R package “rfUtilities” (version 2.1-5) with a p-level of 0.1; highly correlated variables were eliminated from the analysis. From this reduced set of predictors, the final model variables were selected utilizing the model selection criteria of Murphy et al. (2010) as implemented in rfUtilities. This procedure ranks the importance of model variables based on the change in mean squared error as a ratio of the maximum model improvement error (termed MIR). A range of models are fit and all variables with MIRs above a given threshold are retained; the threshold is selected to minimize the number of variables in the model while minimizing the mean squared error and maximizing the variation explained (see Supplementary Material for example R code). The presence/absence models were evaluated for fit based on out-of-bag classification accuracy using the AUC or Area Under the ROC Curve index using the “irr” package in R (version 0.84.1), applying an optimized classification threshold probability. Models with an AUC of at least 0.73 were deemed satisfactory, a level associated with the lowest performing model that was included in the study. Biomass model regressions were evaluated for fit using the root mean squared log error statistic based on the R package “Metrics” (version 0.1.4). The 96 candidate species selected were consistently abundant taxa from the survey, occurring in at least 150 trawl tows; separate seasonal (spring and fall/autumn) models were fit reflecting the two seasonal surveys. From this candidate list, a subgroup of species with satisfactory presence/absence model fits were used to estimate occupancy and biomass habitats over the estimation grid for the same period of the training data, 1976–2018.
The study had four goals: (1) identify the species with habitats overlapping the wind energy lease areas; (2) characterize the relative importance of lease areas to species modeled in the study; (3) characterize the change over time in habitat value to species in the lease areas; and (4) determine which aspects of the ecosystem were critical in shaping habitat in the lease areas.
To achieve the first goal, an index representing the reliance of a species on lease area habitats was developed that utilized both seasonal habitat scores (limited to the occurrence probabilities only) for species and a relative score based on the ratio of habitat scores within a lease area to overall habitat score for the NES. A habitat score for a lease area was the median of occurrence probability for a species that fell within a convex hull that circumscribed a lease area, while the habitat score for the NES was the median of occurrence probability over the entire NES. Within a season, the index was incremented by one if the median habitat score across the lease areas averaged >0.1, by one if the average habitat score plus the 95% confidence interval was >0.1, and by one if the habitat scores in at least one lease area was >0.1. The 0.1 threshold was selected to represent those species with a clear presence in an area. Similarly, the index was incremented by one if the median ratio across the lease areas averaged >1, by one if the average ratio plus the 95% confidence interval was >1, and by one if the ratio in at least one lease area was >1. For a species with a satisfactory model fit in a single season, the index could range from 0 to 6, and for a species with satisfactory models in both seasons, the index could range from 0 to 12. The species were divided by their index scores into four groups: “high reliance” for species with indices from 12 to 10; “moderate reliance” for species with indices from 9 to 6; “low reliance” for species with indices from 5 to 1; “no reliance” for species with indices of 0. High reliance species consistently showed high utilization of lease areas in both seasons, moderate reliance species generally showed high utilization in at least one season, low reliance species generally showed low utilization in both seasons, and no reliance species did not show utilization in either season.
For the second goal, species occupancy and biomass habitat were compared across lease areas and with respect to the geographical position and size of the lease areas. For each lease area, the number of species for which the ratio exceeded 0.7 was summed, with the same exercise repeated for biomass habitat. The threshold value of 0.7 was determined by testing values from 1 to 0.5; the 0.7 level represented a breakpoint where lower thresholds did not dramatically increase the number of species included. The numbers of spring and fall species were averaged to represent the relative roles of lease areas in respect to species occurrence and biomass. In addition, species counts by model and season were associated with four properties of the lease areas: latitude, longitude, distance to the coast, and area of the lease area. The correlations between species number and the four properties were tested with Spearman rank order correlation.
For the third goal, trend in habitat use was evaluated using a non-parametric test of time series (1976–2018) trend using the R package “zyp” (version 0.10-1.1). We used the Yue et al. (2002) method to estimate Theil-Sen slopes and performed an auto-correlation corrected Mann–Kendall test of trend. The trend in occupancy and biomass habitat was evaluated for the high reliance species grouping and plotted against median occurrence probability and biomass habitat scores.
For the fourth goal, variable importance in the presence/absence models were evaluated for the models associated with the species in the high reliance grouping. Importance was based on five performance measures: the number of times a variable was the root variable (i.e., variable associated with the root node); the mean minimum node depth for the variable; Gini index of node impurity decreases; prediction accuracy decrease; and, the proportion of models for which the variable was among the 10 highest ranked variables. The first four of these indices was computed using the “randomForestExplainer” R package (version 0.10.0); as customary, the times a root variable was plotted against the mean minimum depth variable and the Gini index was plotted against the accuracy decrease variable. All the performance measures were used in a principal components (PCs) analysis to provide an overall rank of variables across species based on PC 1.
The species modeled in this study included both finfish and macroinvertebrate taxa. Of the initial candidate species, 93 taxa had a seasonal presence/absence model with an AUC score of at least 0.73 and were thus included in the study (Table 4). Based on the performance of the seasonal presence/absence model, complementary biomass model results were also considered. Not all species with a satisfactory model fit in one season (i.e., spring or fall) had a satisfactory fit in the other season. Hence, we had model results for 83 taxa in the spring and 89 in the fall, with 80 taxa having models in both seasons.
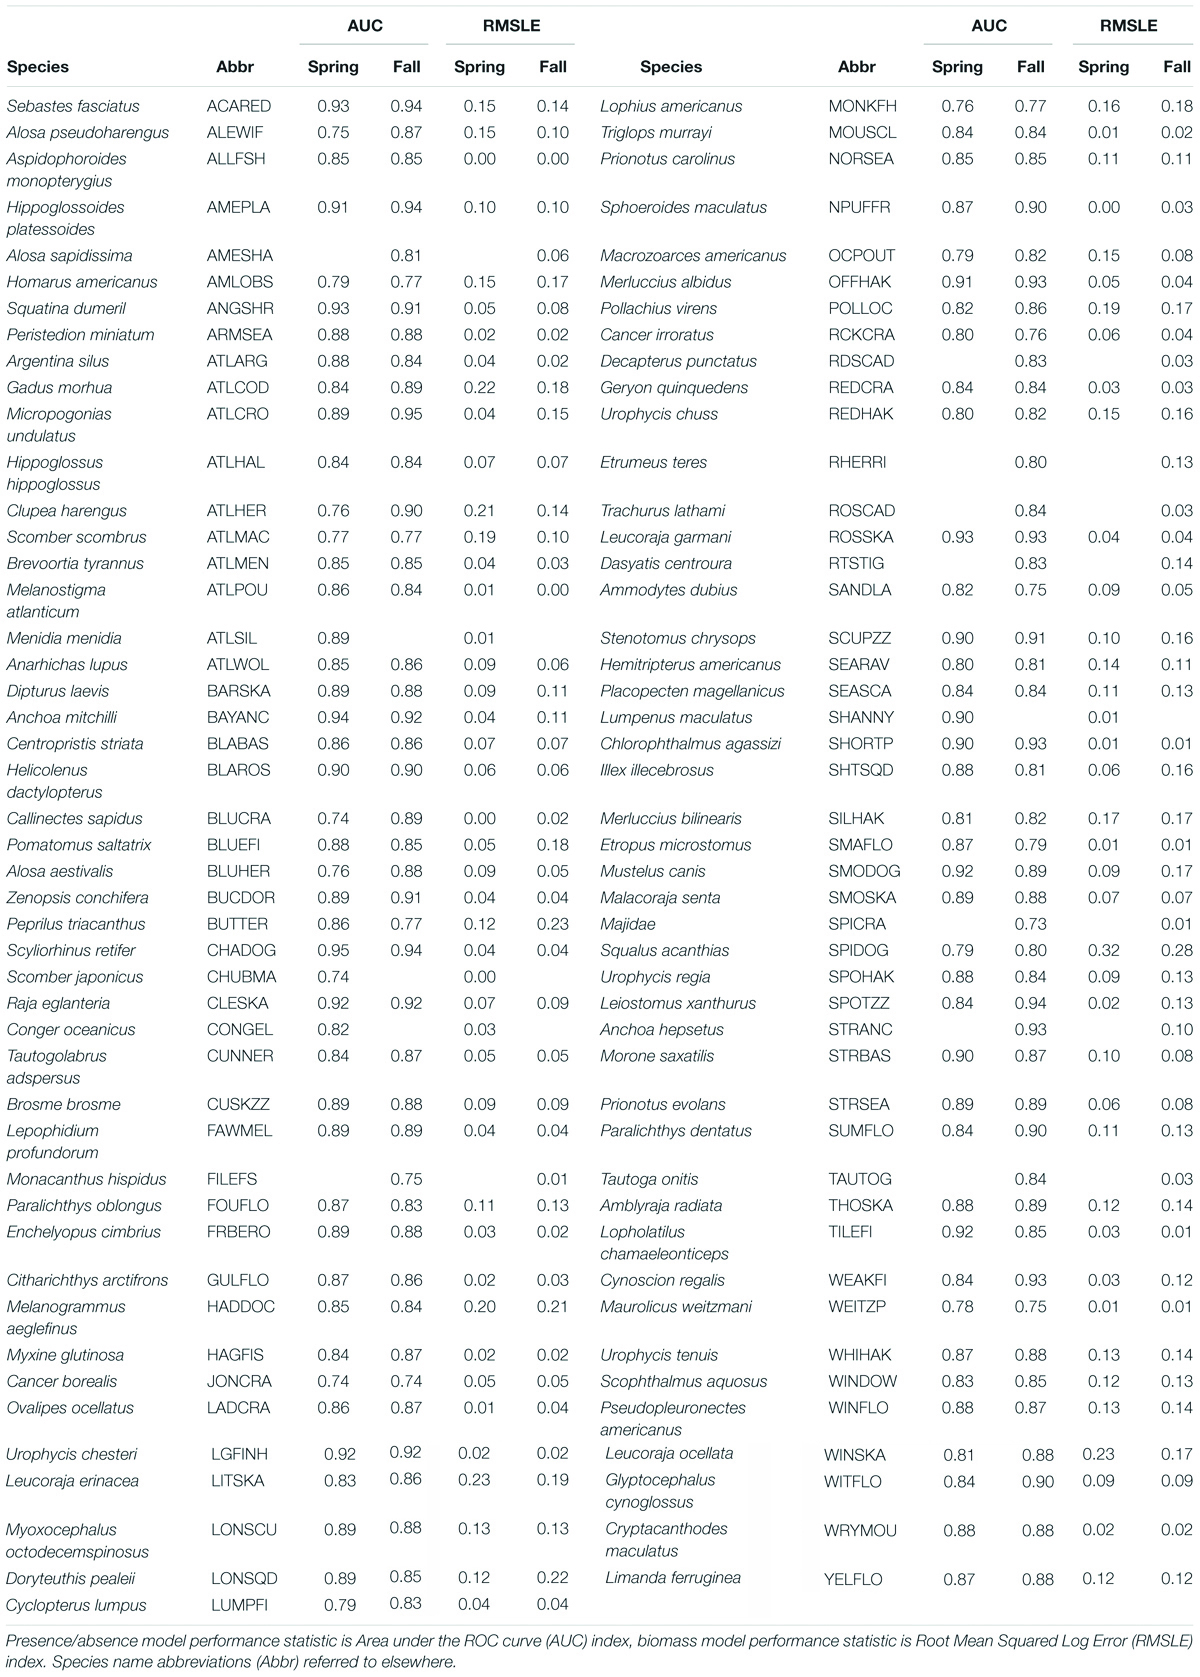
Table 4. Species with presence/absence and biomass habitat models based on spring and fall survey data.
Using our index based on habitat scores and ratios of habitat scores, we identified four groupings of species that reflected the importance of the lease area habitats. Twenty species fell within the criteria for the high reliance grouping (Table 5 and see Supplementary Material). Since the minimum score for this grouping was 10, all high reliance species had both spring and fall model data included in the study. The high reliance grouping included demersal and pelagic fish and invertebrate species, including cephalopods (squid) and decapods (crab). There were 31 species in the moderate reliance group, some of which were only considered for one season. Like the high reliance group, there were finfish and invertebrates among the taxa in the moderate reliance group and many of the single season species were small pelagic taxa. Twenty-six species were in the low use grouping, many of which fell within the single season category. Finally, there were 16 taxa in the no-reliance group; while they can occur in the lease areas their reliance was below the required threshold.
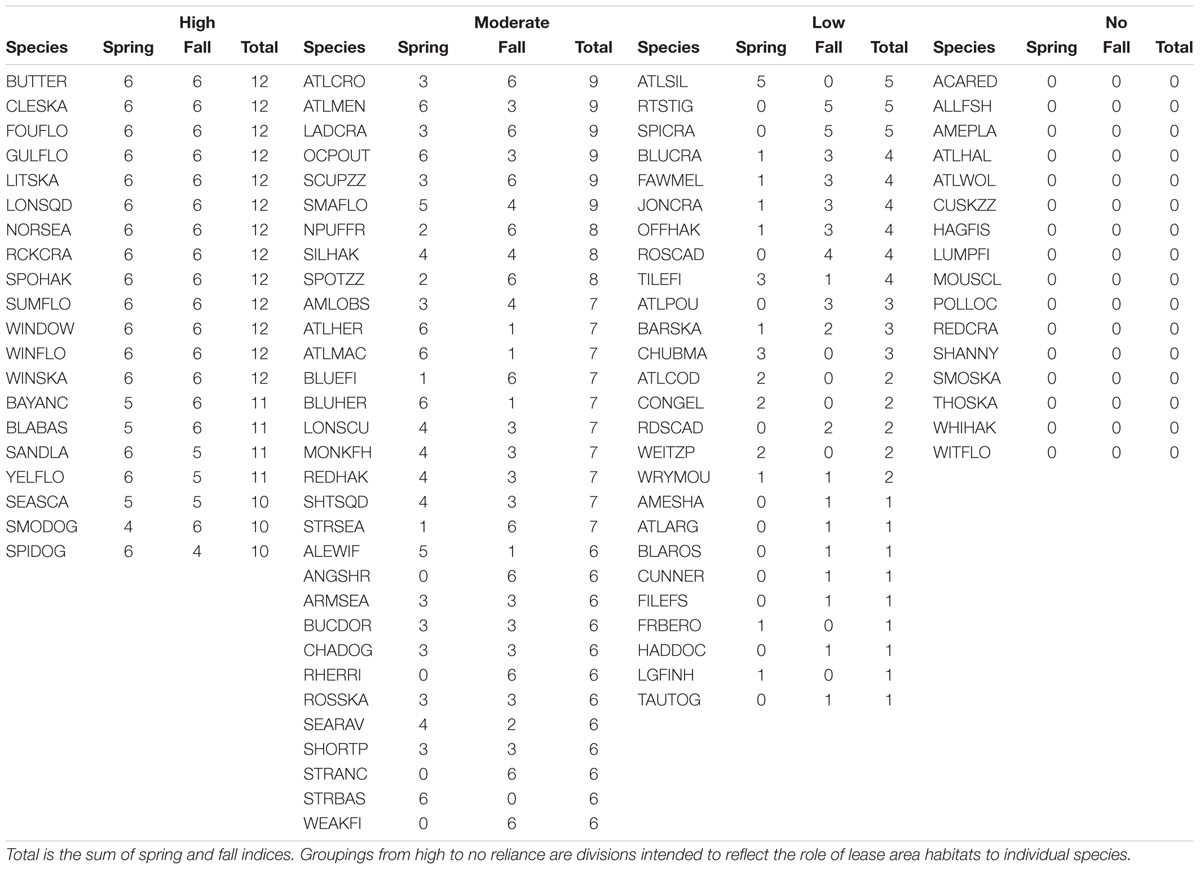
Table 5. Species groups and their relative reliance on wind lease areas, based on the sum of habitat indices where Spring is the sum of habitat score indices triggered for spring distributions and Fall, likewise to spring.
Habitat in the lease areas varied widely between depictions based on the output of the presence/absence and biomass models. Averaged over season and lease areas and with ratios exceeding 0.7, approximately 38 species used the lease areas as occupancy habitat compared to 42 species that utilized the areas as biomass habitat (Figures 2A,B). The areas with the highest number of species making use of the lease areas as occupancy habitat included E1 and P3 and among the lowest were areas E2 through E5, which were located inshore. The areas with the highest number of species using the lease areas as biomass habitat included E1 and P1, two of the more northerly lease areas. The lease areas with the lowest number of species making use of the lease areas as biomass habitat included E2 through E5, the same areas with low numbers of species using the lease areas as occupancy habitat.

Figure 2. Mean of spring and fall species counts with lease area to NES ecosystem ratio of >0.7 for occurrence (A) and biomass (B) model output. See Figure 1 for area abbreviations.
When species counts were related to parameters reflecting the position and size of the lease areas, distinct trends emerged. The number of species with ratios > 0.7 for presence/absence models were uncorrelated with latitude in the spring but correlated in the fall season (Figures 3A,C). However, there appears to be a stronger relationship between the number of species and latitude for the biomass habitat, which is significant in both seasons (Figures 3B,D). Though not explicitly tested with the correlation coefficient, biomass model responses appeared non-linear and suggested lower counts at middle latitudes. There was significant correlation with longitude of the lease areas for both presence/absence and biomass models in both seasons (Figures 4A–D), suggesting higher species counts with more eastern lease areas. Counts from spring presence/absence models were positively correlated with distance to the coast of the lease areas (Figures 5A,C); however, the relationship in the fall data is less developed. The biomass model counts were also positively related to distance to the coast, although these relationships were non-significant (Figures 5B,D). Size of the lease area may be playing a role in species counts; however, the correlations for presence/absence and biomass models were relatively weak (Figure 6).
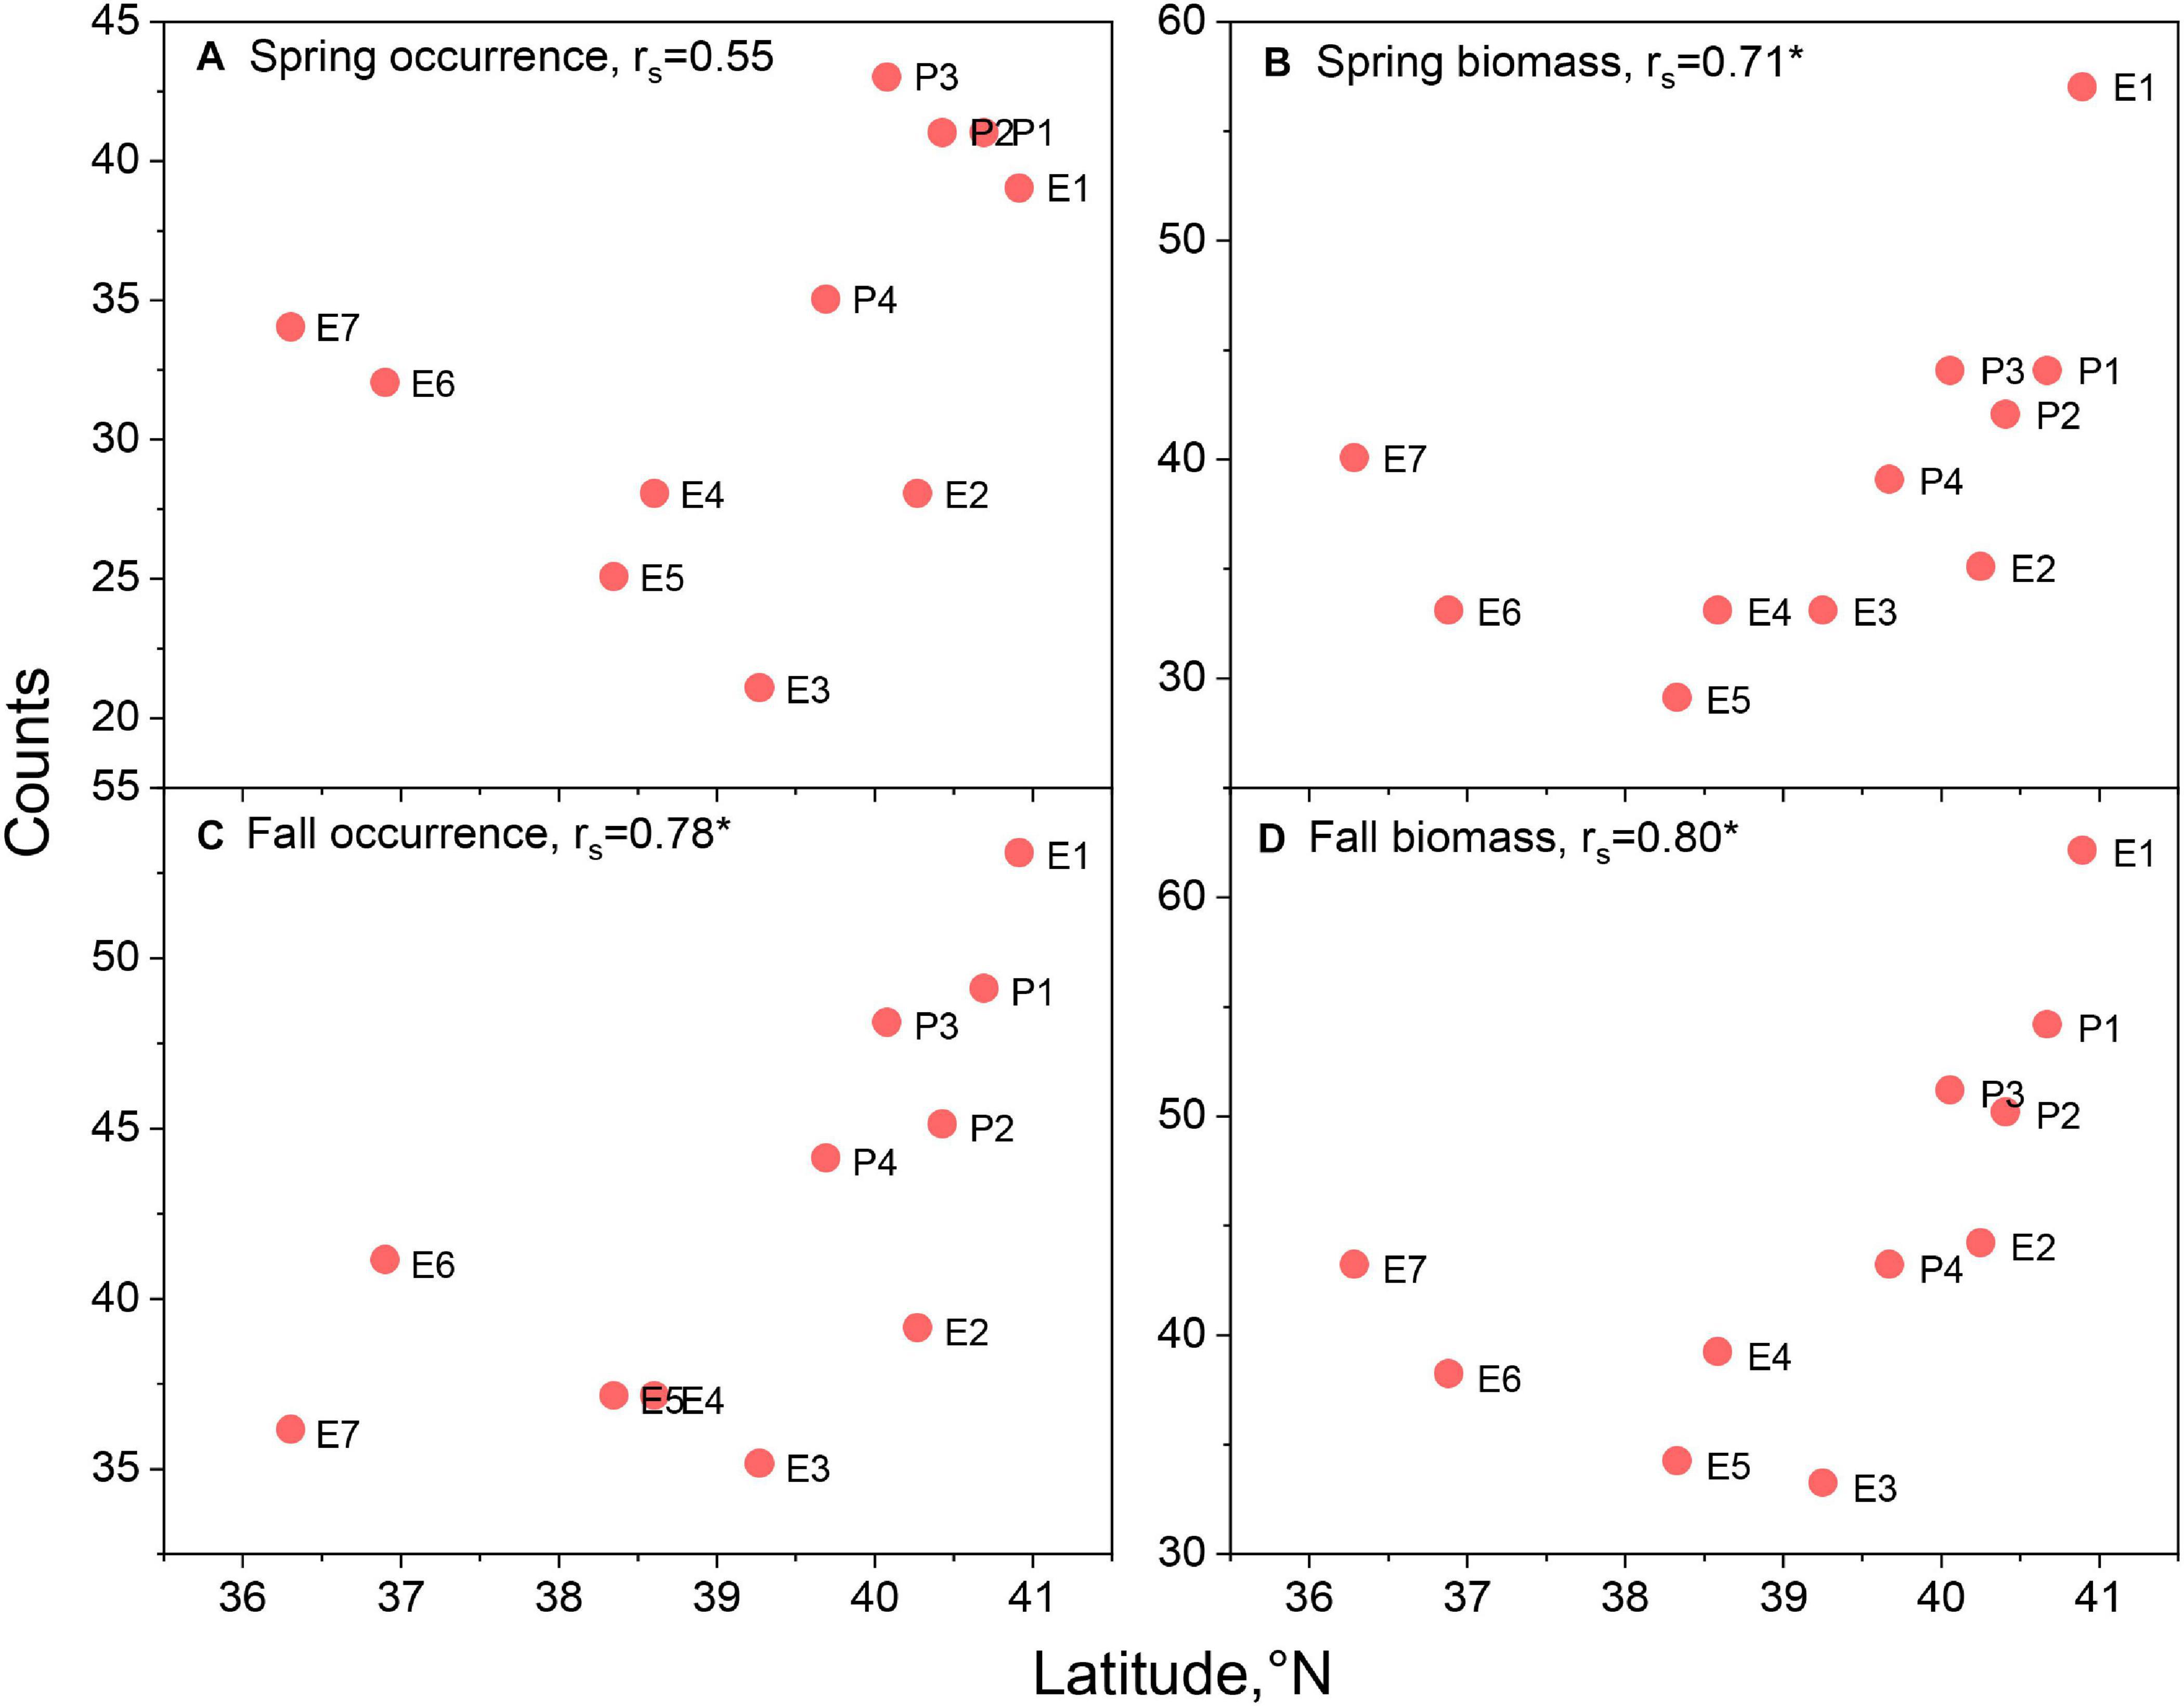
Figure 3. Species counts with lease area to ecosystem ratio of >0.7 versus centroid latitude of the respective lease area for spring occurrence (A) and biomass (B) models and fall occurrence (C) and biomass (D) models. Spearman rank order correlations, rs, noted in panel titles with significant correlations marked with asterisk. See Figure 1 for area abbreviations.

Figure 4. Species counts with lease area to ecosystem ratio of >0.7 versus centroid longitude of the respective lease area for spring occurrence (A) and biomass (B) models and fall occurrence (C) and biomass (D) models. Spearman rank order correlations, rs, noted in panel titles with significant correlations marked with asterisk. See Figure 1 for area abbreviations.
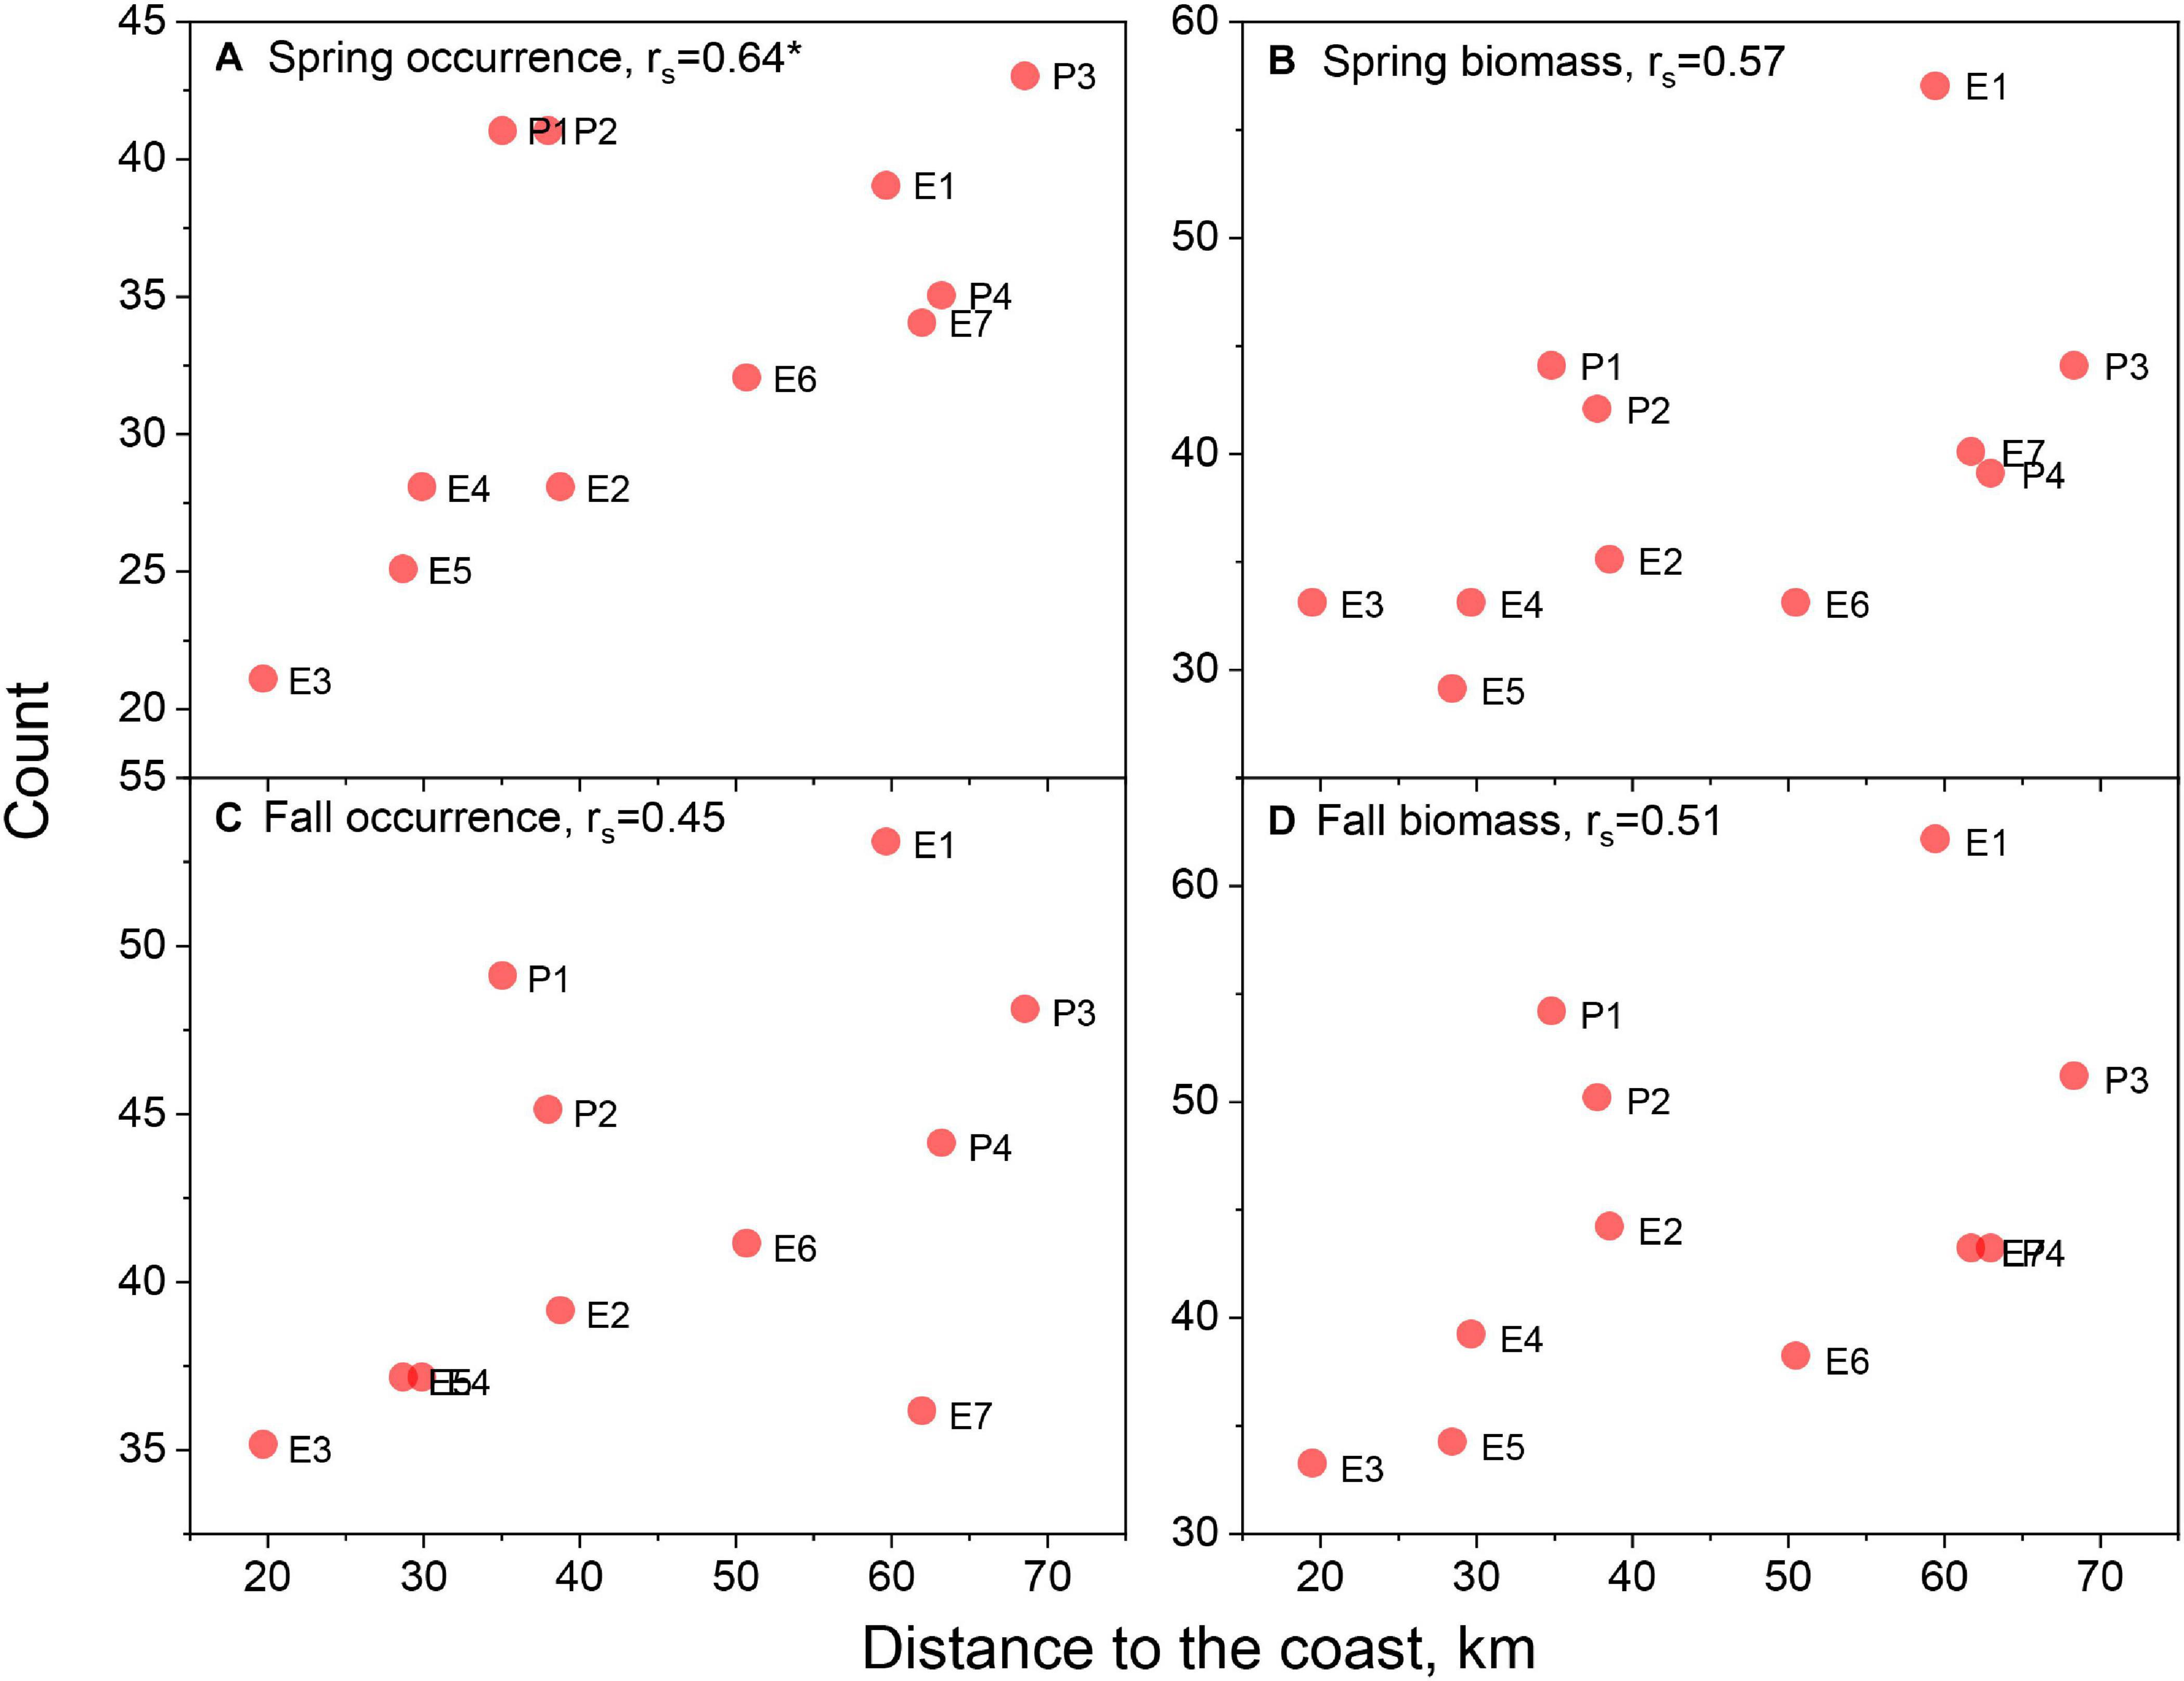
Figure 5. Species counts with lease area to ecosystem ratio of >0.7 versus centroid distance to the coast of the respective lease area for spring occurrence (A) and biomass (B) models and fall occurrence (C) and biomass (D) models. Spearman rank order correlations, rs, noted in panel titles with significant correlations marked with asterisk. See Figure 1 for area abbreviations.
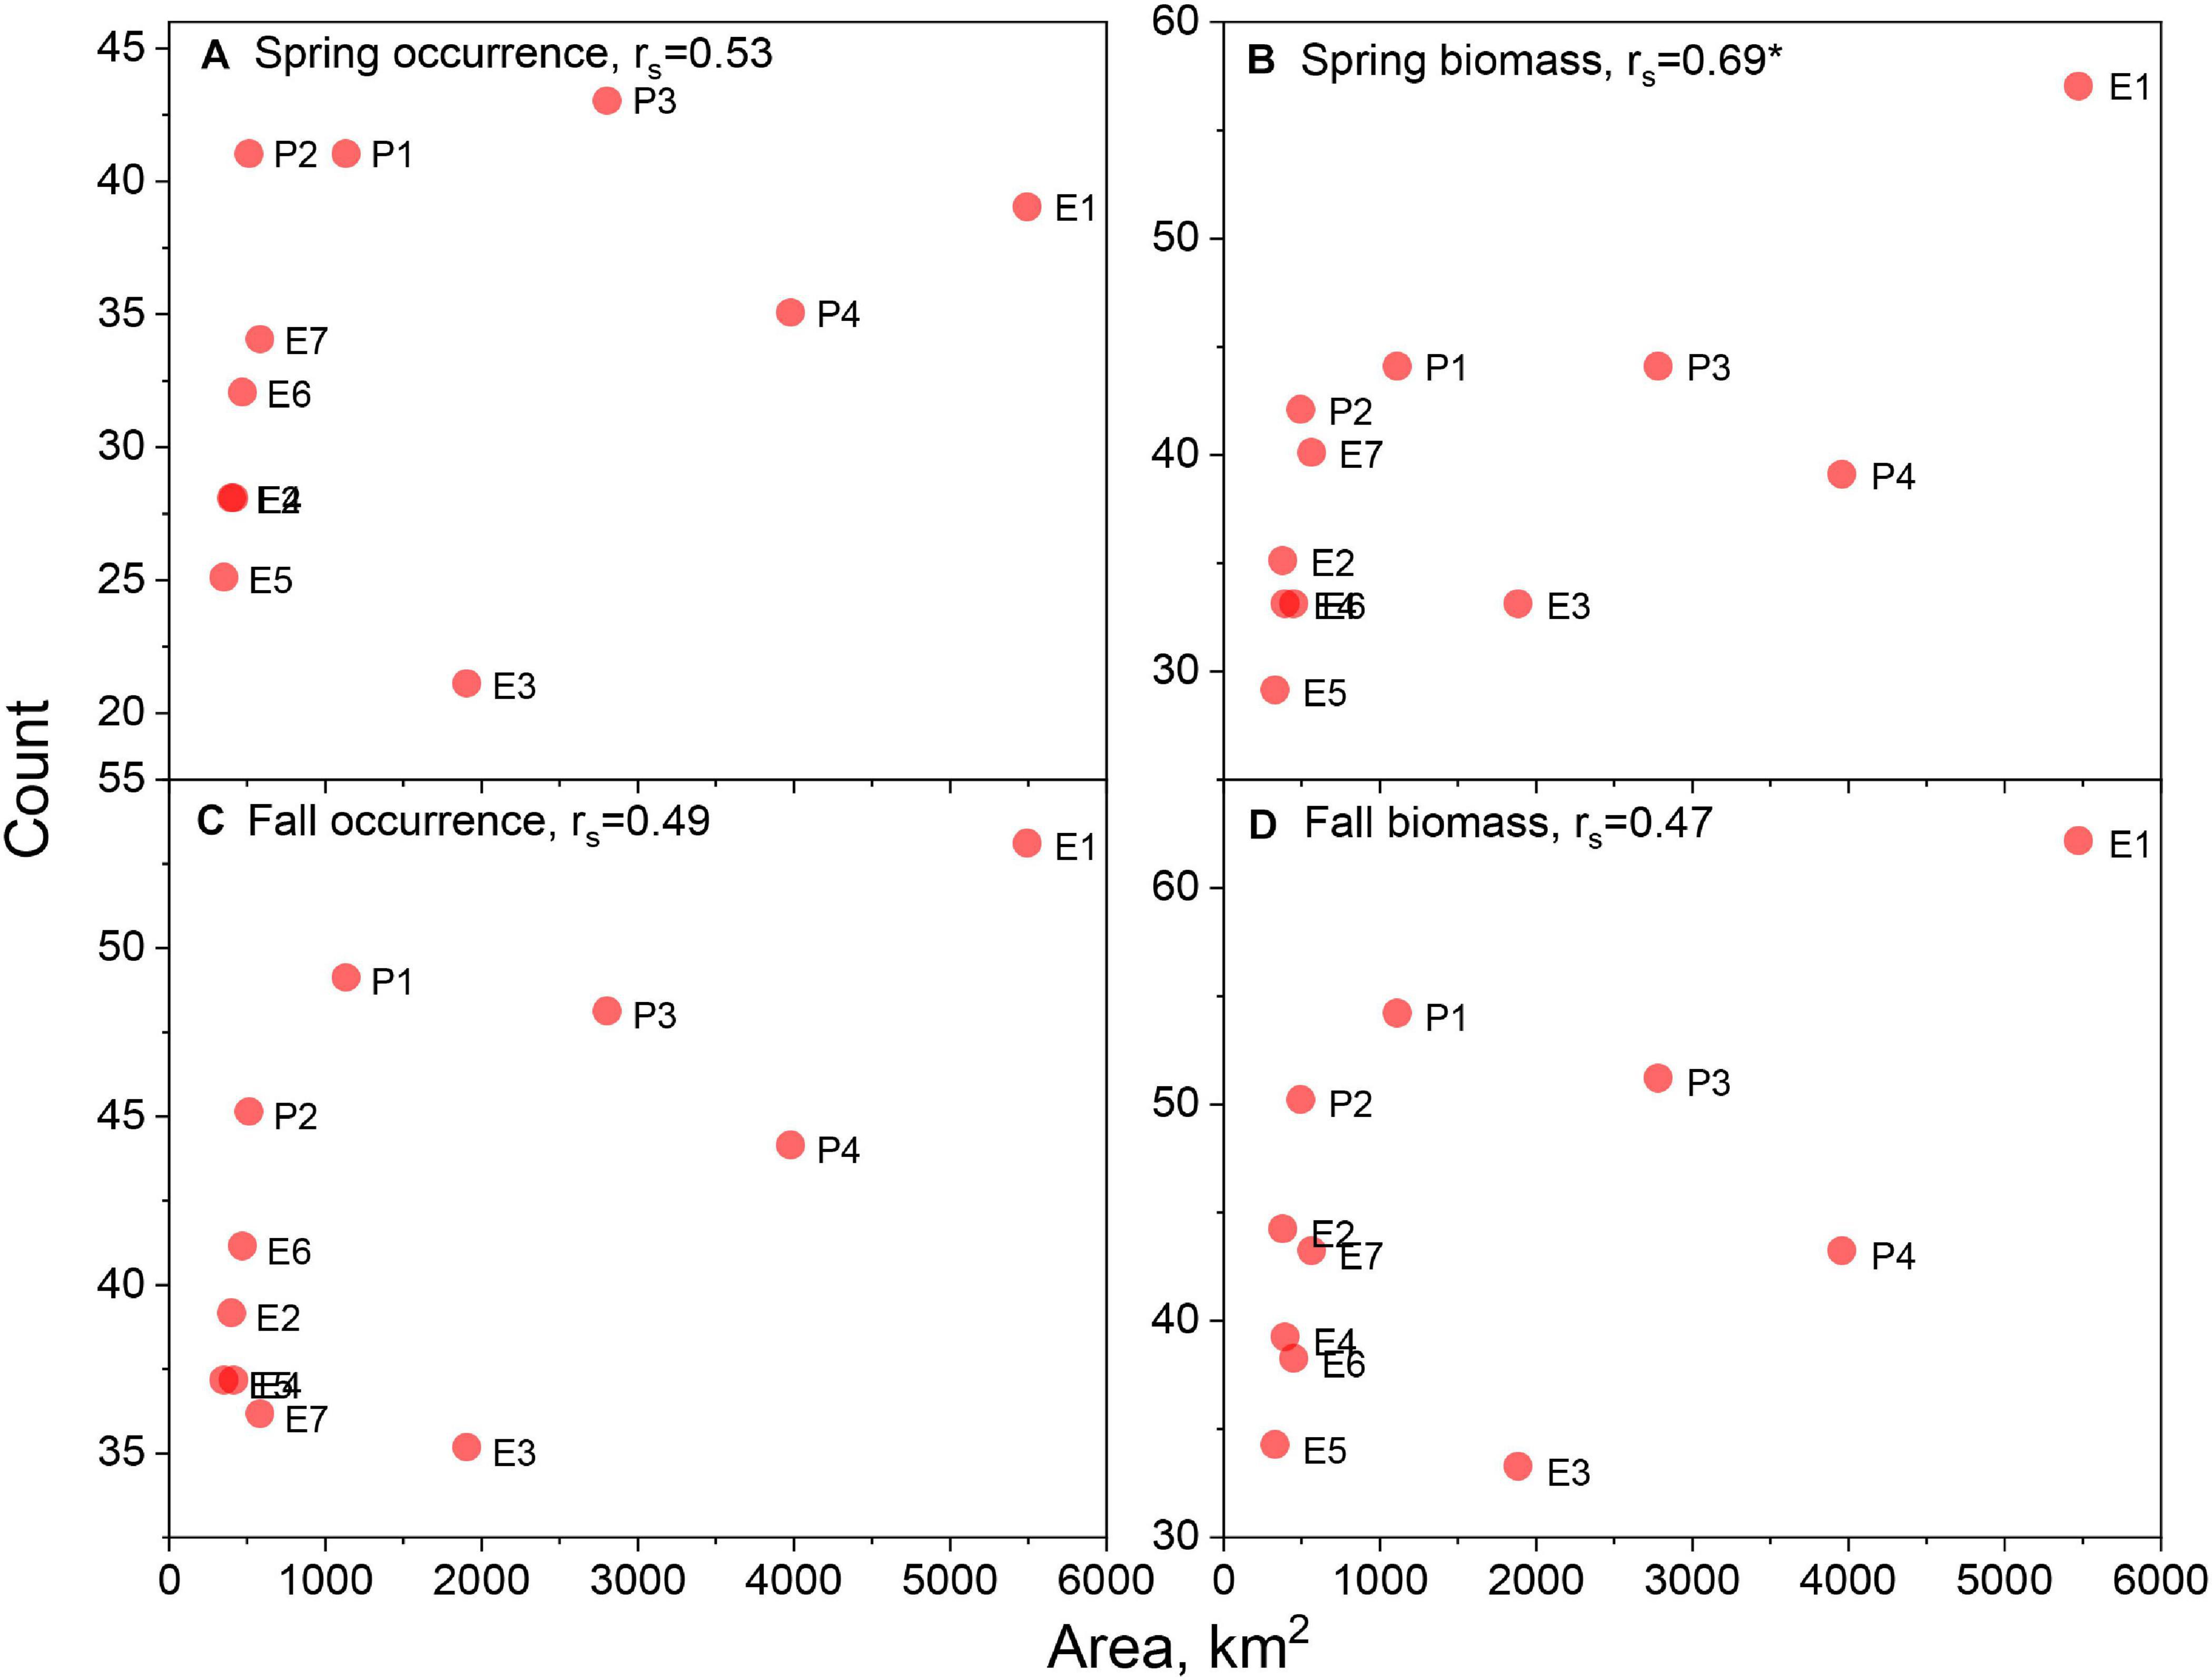
Figure 6. Species counts with lease area to ecosystem ratio of >0.7 versus area of the respective lease area for spring occurrence (A) and biomass (B) models and fall occurrence (C) and biomass (D) models. Spearman rank order correlations, rs, noted in panel titles with significant correlations marked with asterisk. See Figure 1 for area abbreviations.
Most taxa classified as high reliance species with respect to lease area utilization were also increasingly dependent on the lease area habitats. For presence/absence model output, 80 and 89% of species had medians of significant habitat time series trends that were positive for spring and fall models, respectively (Figures 7A,B). Notably, among the species with the greatest increases in occurrence probability in the spring were Urophycis regia, Leucoraja ocellata, Paralichthys dentatus, and Squalus acanthias; in fall, Citharichthys arctifrons, Raja eglanteria, U. regia, and Centropristis striata were among the species with the greatest increases in occurrence probability. In both spring and fall, Glyptocephalus cynoglossus and Limanda ferruginea had negative trends in occurrence probability. For biomass model output, 65 and 60% of species in spring and fall, respectively, had increasing trends in biomass habitat index scores (Figures 8A,B). In spring, there were exceptional increases in biomass habitat for Leucoraja erinacea and S. acanthias; however, many species had moderate increases in biomass habitat scores in fall, including L. erinacea, P. carolinus, S. acanthias, R. eglanteria, P. dentatus, Placopecten magellanicus, and U. regia.
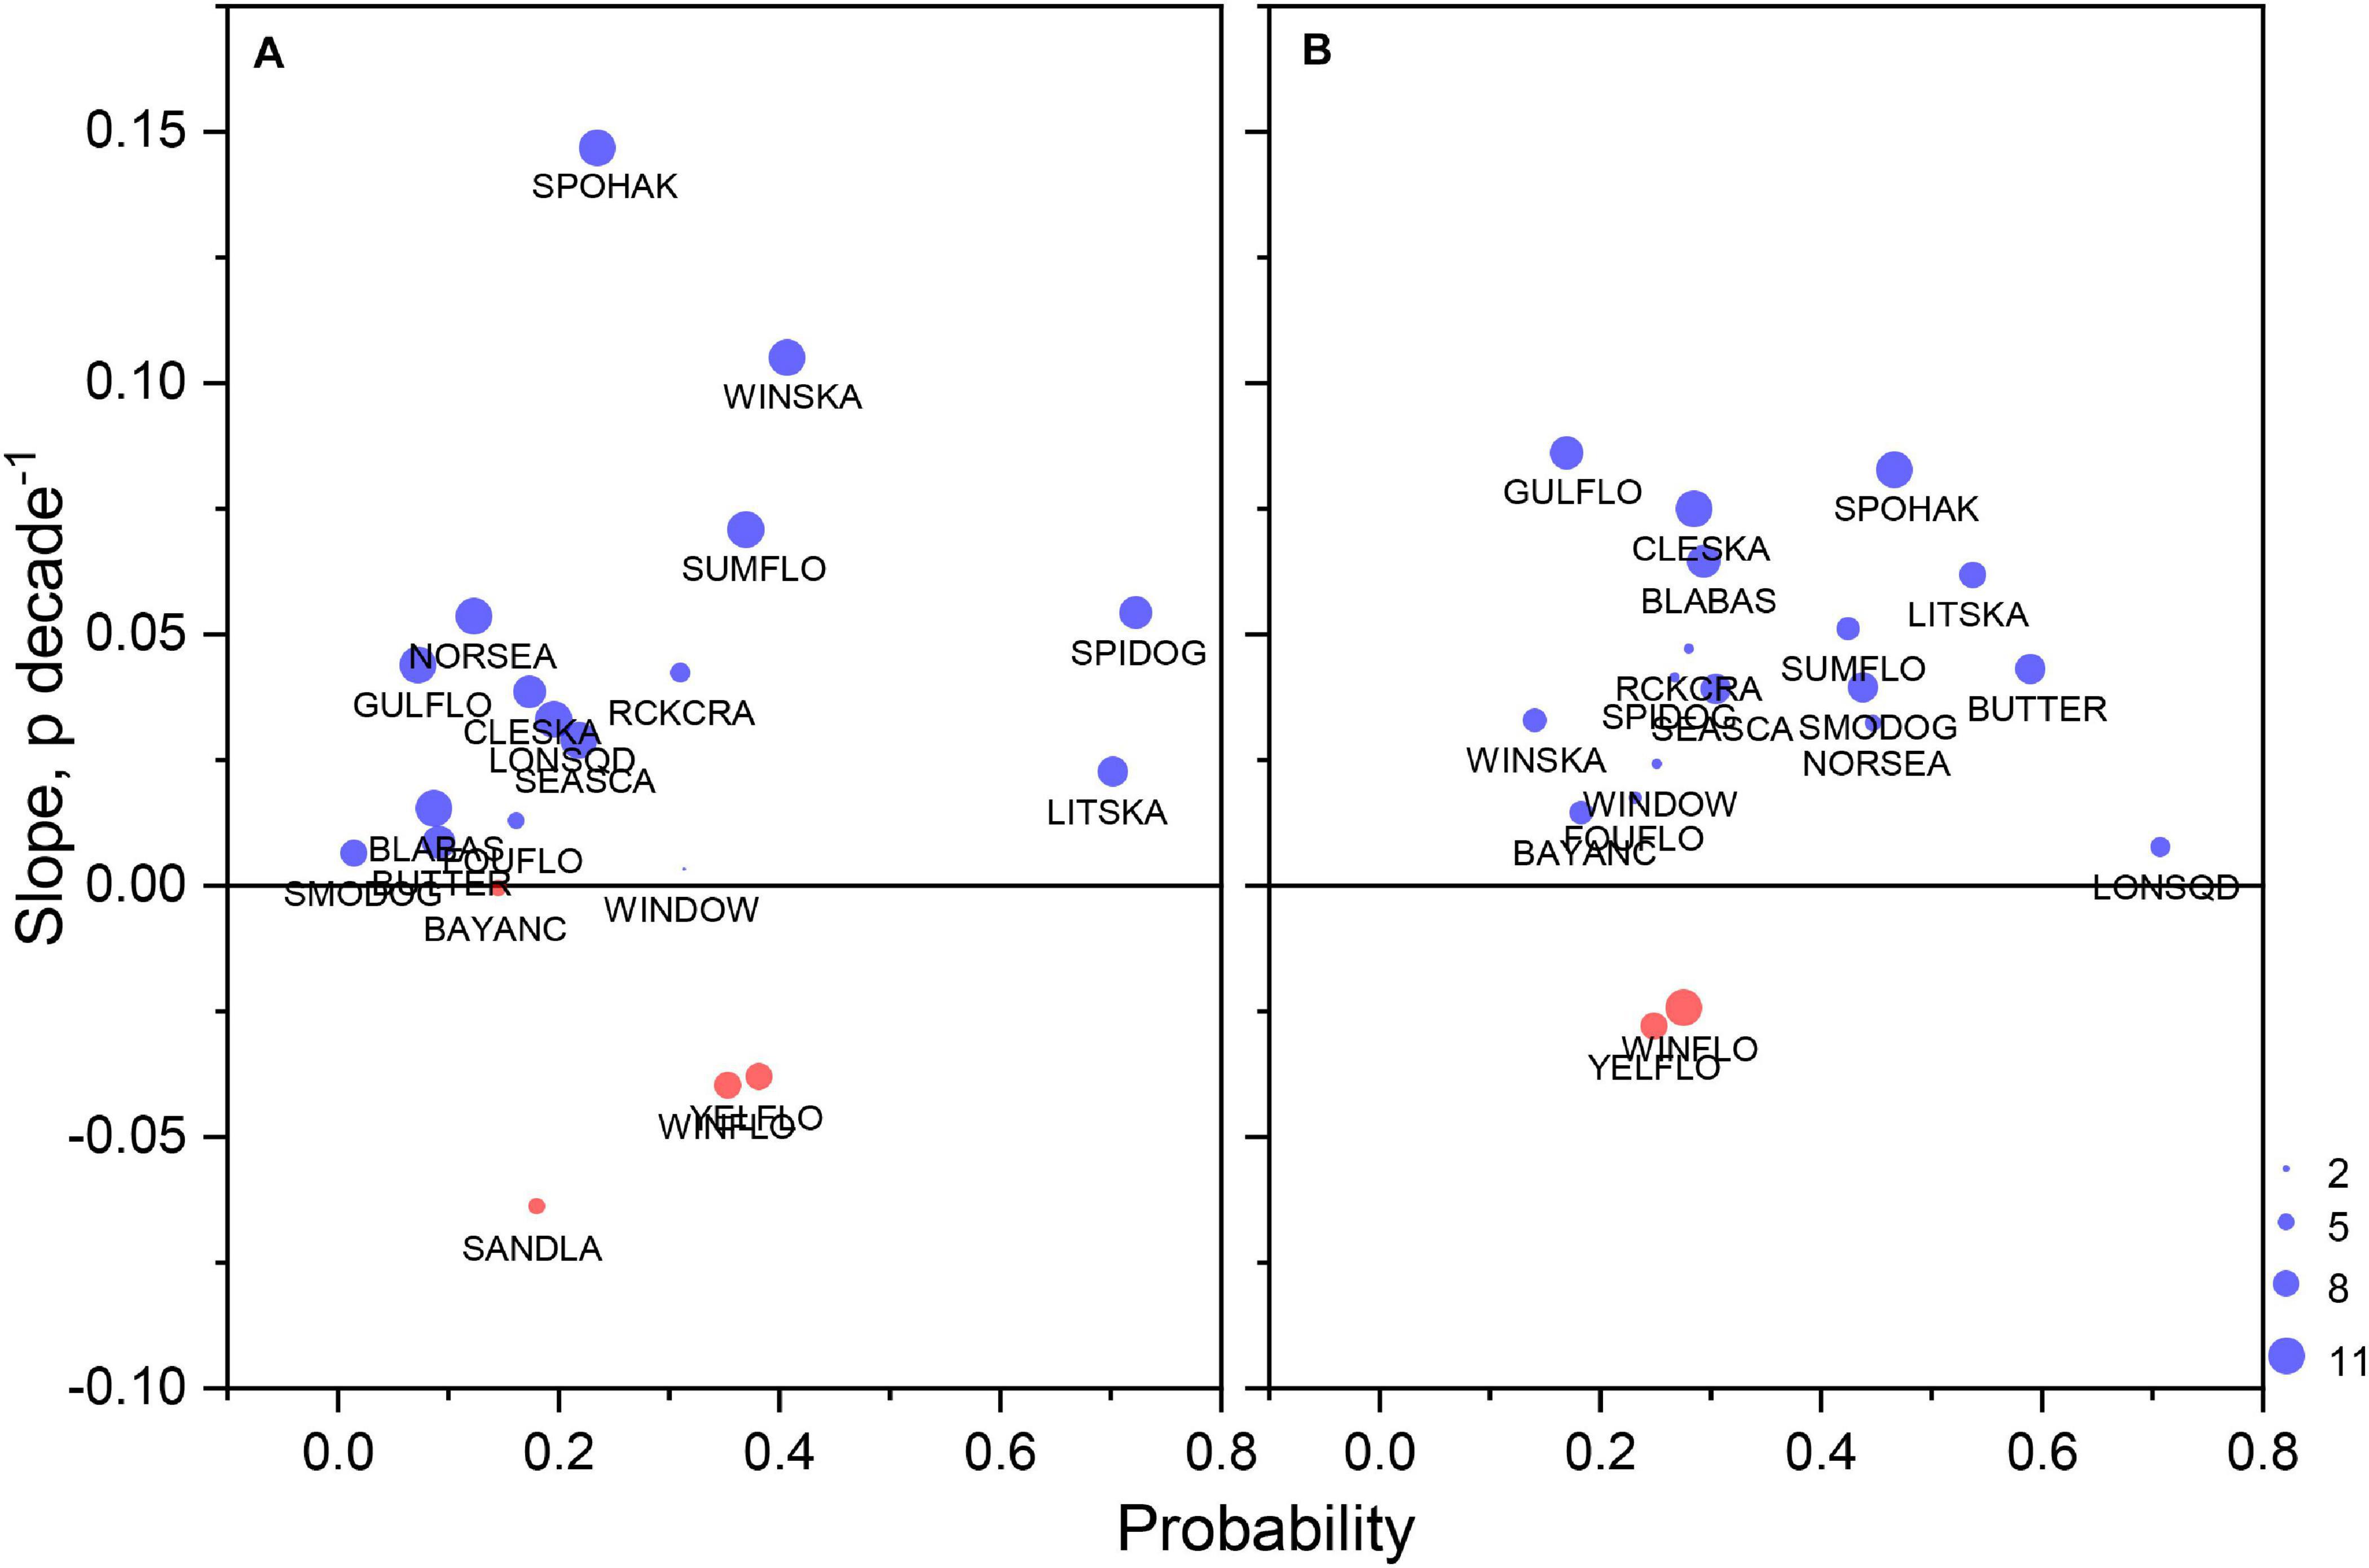
Figure 7. Median occurrence probability of species during the study period versus change in probability as Theil–Sen slope for essential species in existing and proposed lease areas during spring (A) and fall (B). Only data associated with significant slopes were used in the calculations; sample size expressed with the size of plotting symbol with maximum of 11 reflecting total number of lease areas in the study. See Table 4 for species abbreviations.
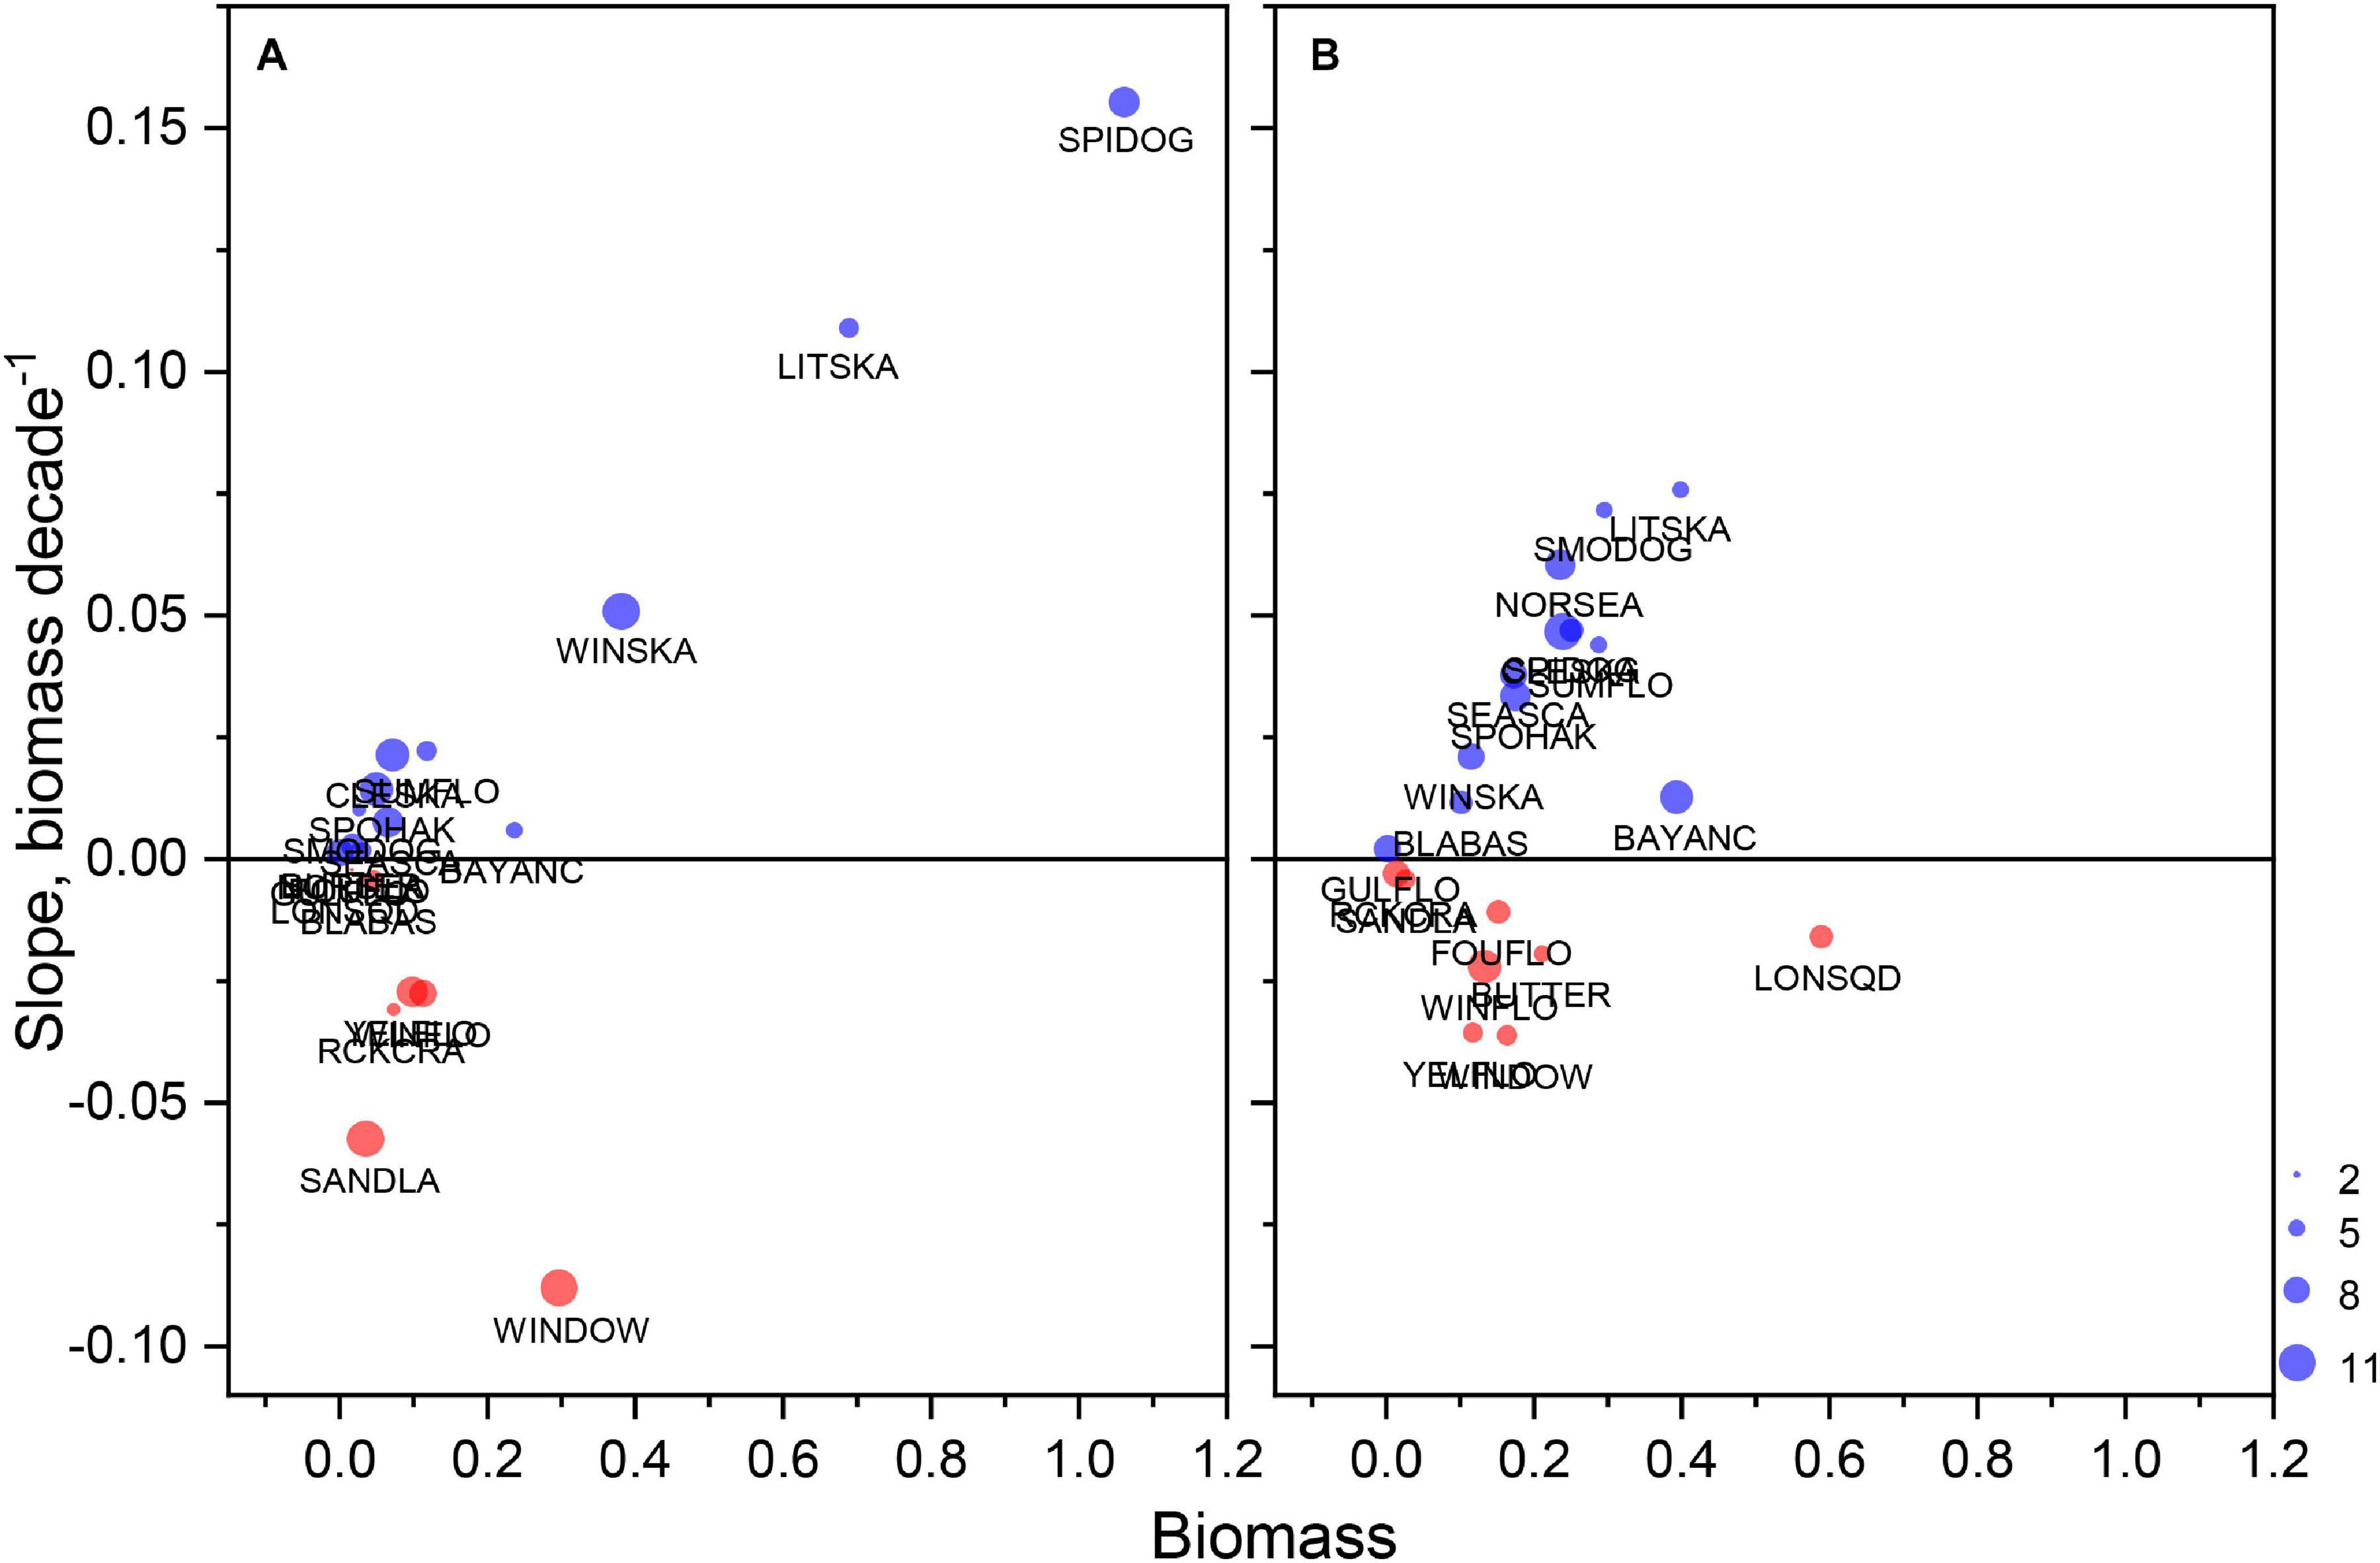
Figure 8. Median biomass index during the study period versus change in biomass index as Theil–Sen slope for essential species in existing and proposed lease areas during spring (A) and fall (B). Only data associated with significant slopes were used in the calculations; sample size expressed with the size of plotting symbol with maximum of 11 reflecting total number of lease areas in the study. See Table 4 for species abbreviations.
The different variable classes contributed to presence/absence models in a hierarchical fashion when considering the times a root, mean minimum depth, Gini decreases, and accuracy decrease variable performance measures. Physical and biological variables had a larger influence on the model fits than benthic terrain variables. Variable classes with a higher times a root and lower mean minimum depth score (upper left quadrant, Figure 9A) are indicative of variables of greater importance. Likewise, variable classes with large Gini decrease and accuracy decrease values (upper right quadrant, Figure 9B), are indicative of variables that are more important in explaining species’ variation in occupancy. The spring models suggest physical, primary production, and secondary production variable classes were more important than the benthic terrain habitat variables. For the fall models, however, primary and secondary production variables were of greater significance than the physical variables since they occur more frequently in the key quadrants (Figures 9C,D). For both sets of seasonal models, the terrain variables made the lowest contribution.
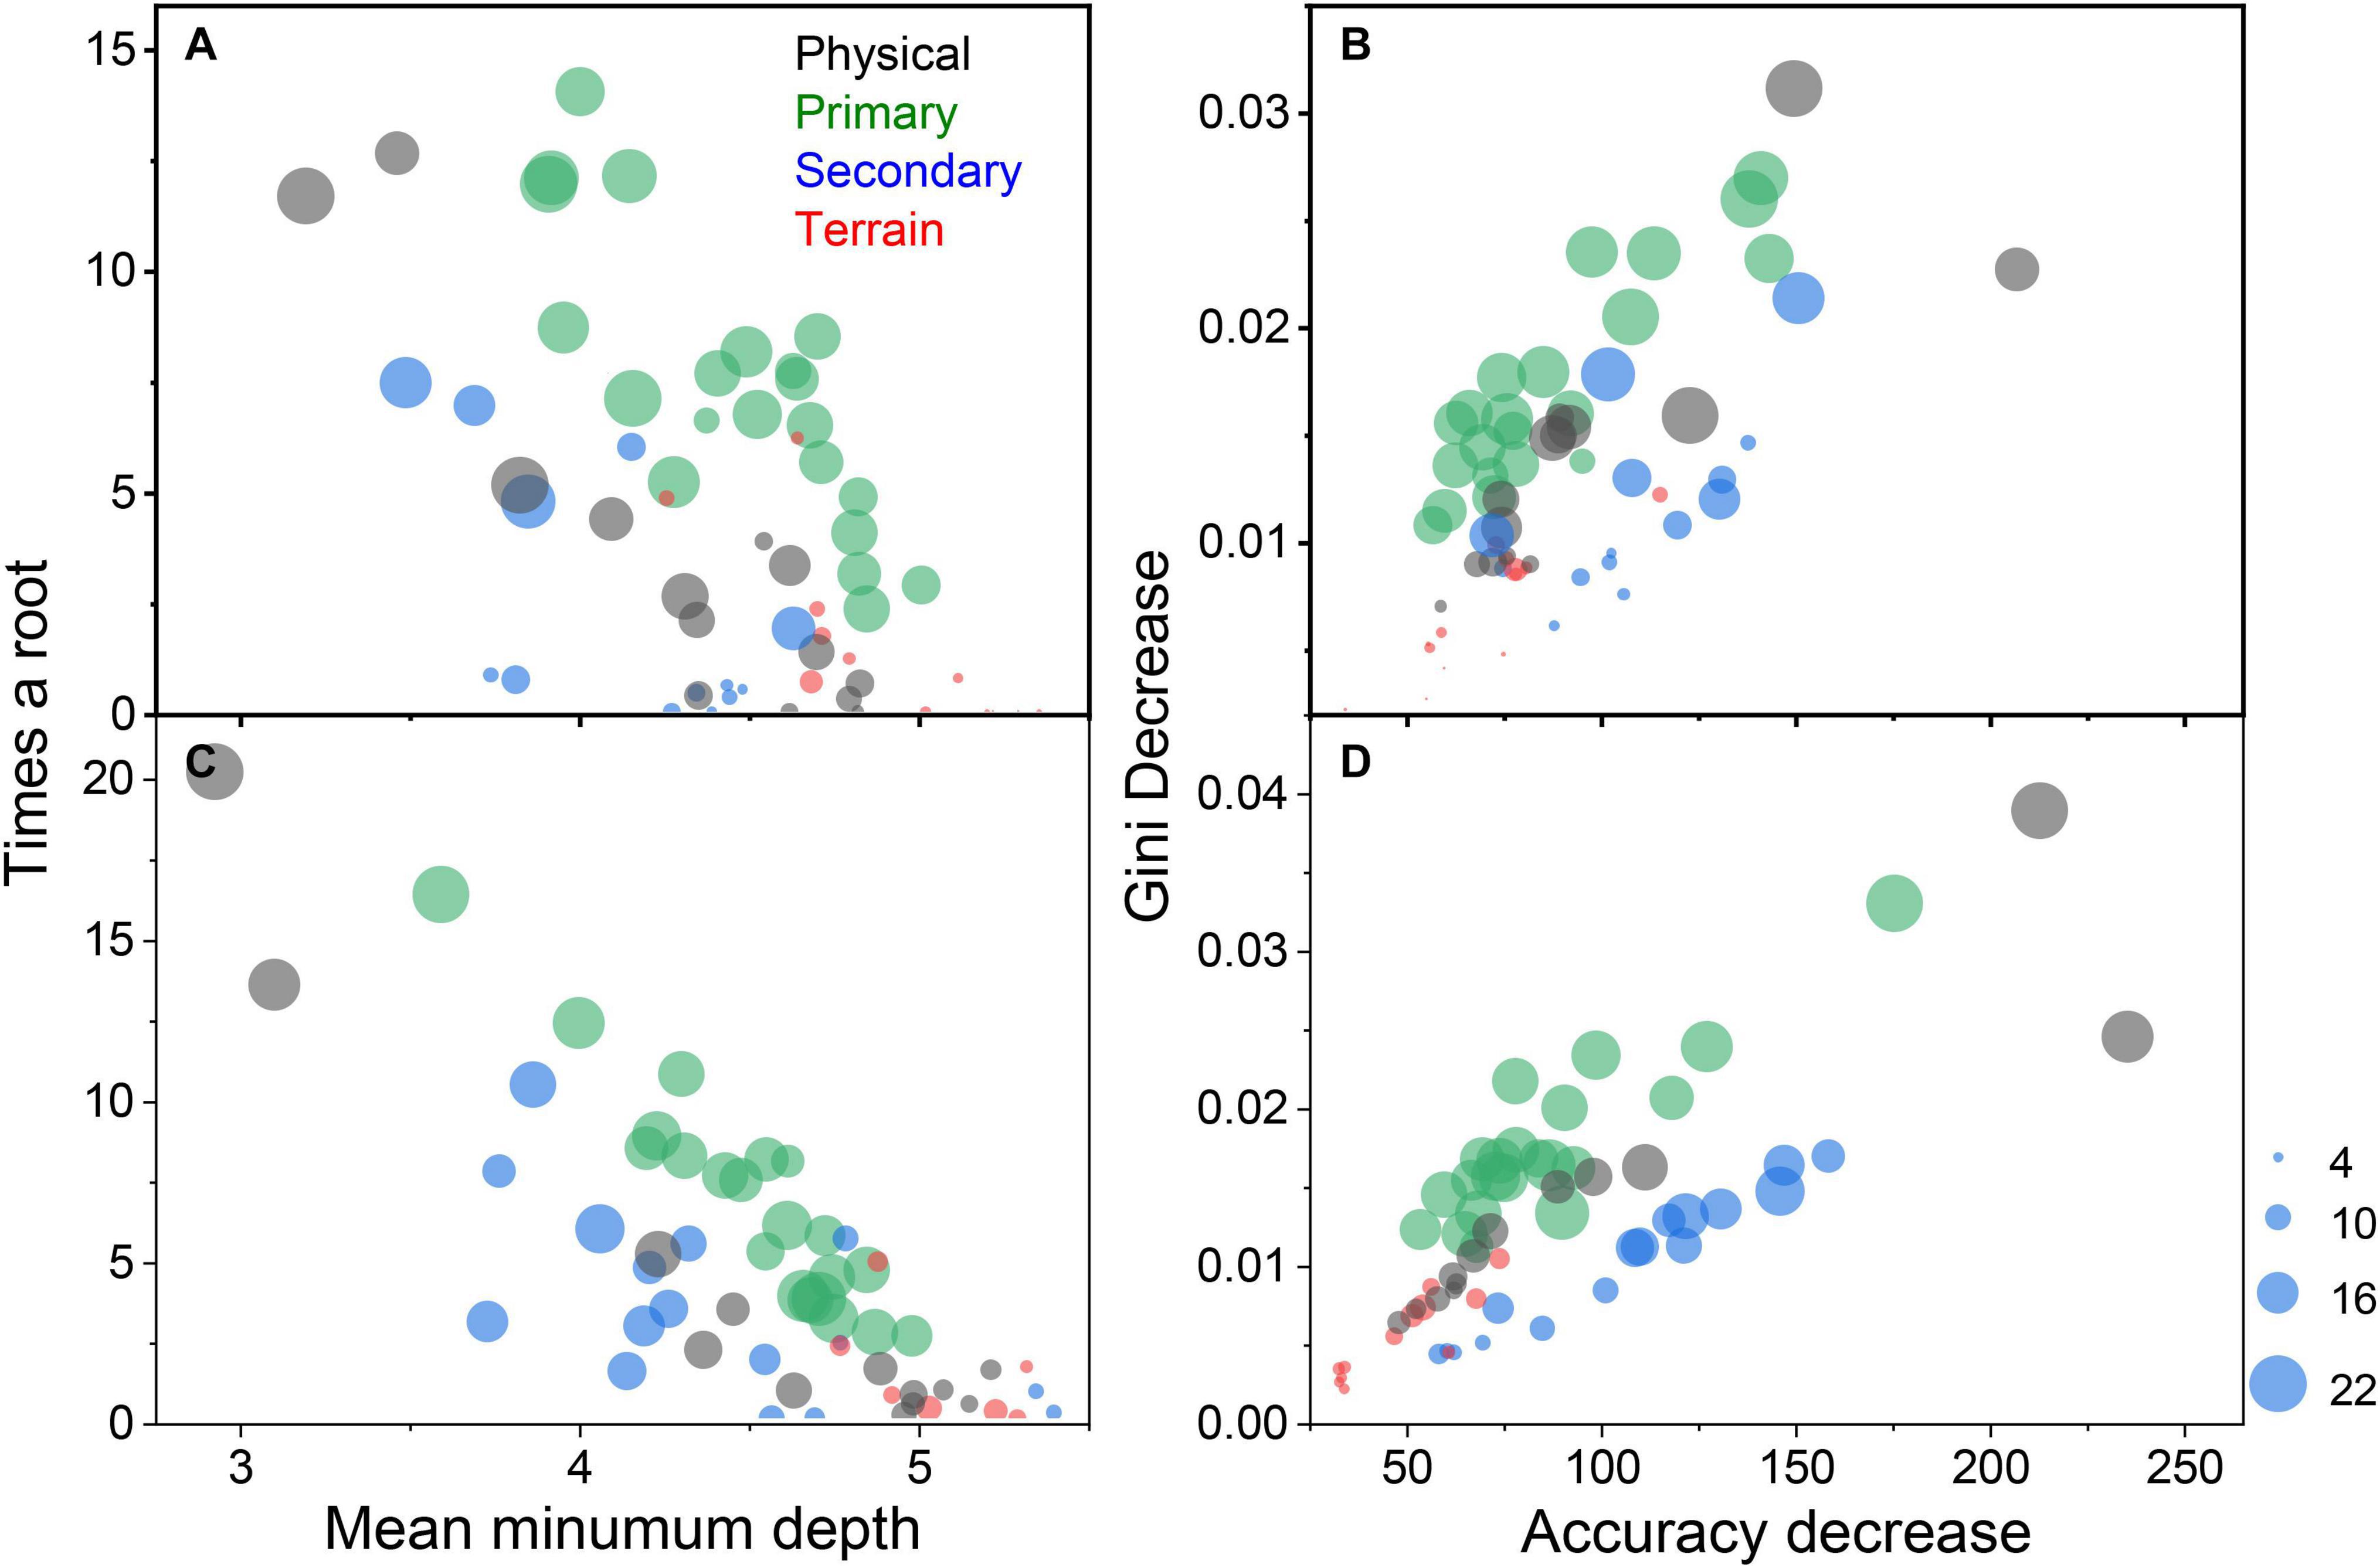
Figure 9. The mean number of times a variable was the root node variable versus the mean minimum depth of a variable in a tree for spring (A) and fall (C) models; and, the mean decrease in the Gini index of node impurity versus the mean accuracy decrease if a variable were to be removed for spring (B) and fall (D) models. Variables are color coded by their class: physical (black), primary production (green), secondary production (blue), and benthic terrain complexity (red). Symbol size is scaled by the number of species models the variable was selected.
The PC analysis supported the role of temperature and depth in defining fish and macroinvertebrate habitat, but also suggested primary and secondary production variables were critical. The first dimension of the spring and fall PCAs explained 76.9 and 83.2% of the variance in variable importance indices, respectively. For both models, the second dimension explained <15% of the variance, and was not considered in further analyses. For spring models, the highest PC scores were found with bottom temperature and depth; however, among the top twenty variables were 15 primary and secondary production variables (Figure 10A). Only one terrain variable was among the top variables. For fall models, depth and bottom temperature were the top variables, with 17 primary and secondary production variables among the top 20 variables (Figure 10B). No terrain variables were among the top 20 variables from the fall models.
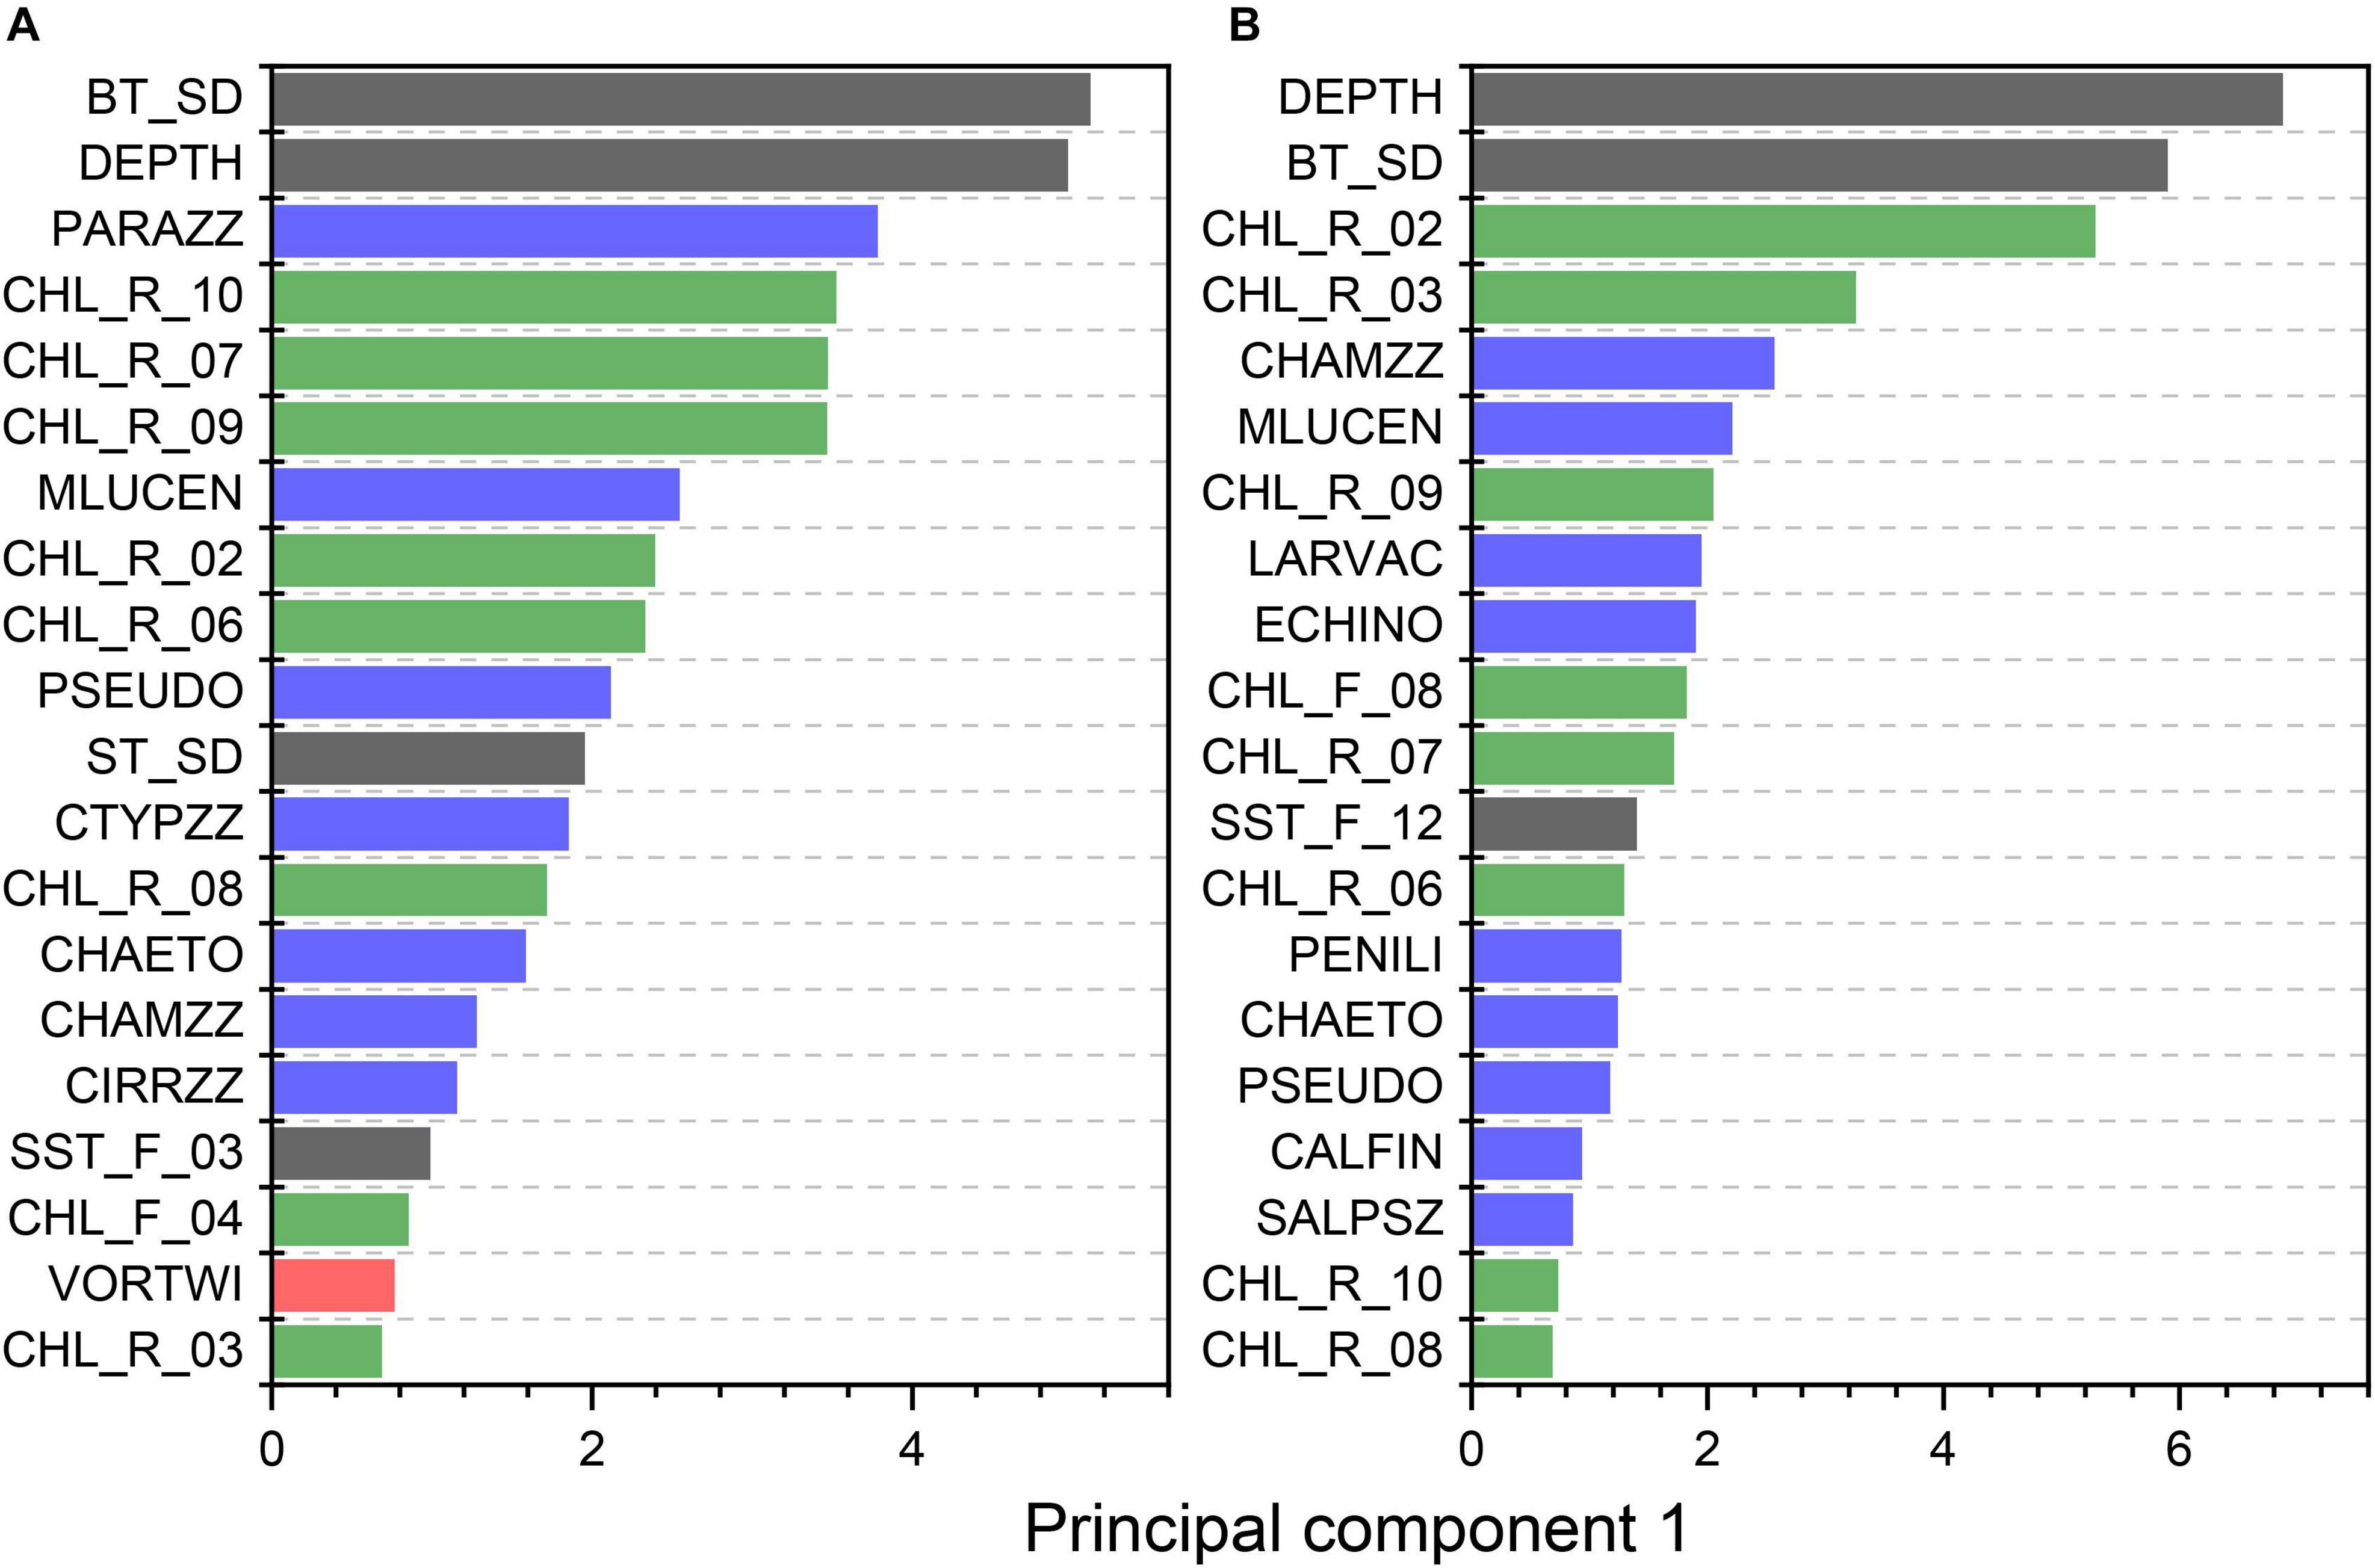
Figure 10. The top twenty variables across all spring (A) and fall (B) models of high reliance species based on principal component 1 variable scores as an index of importance. Physical, primary production, secondary production, and terrain variables are represented in black, green, blue, and red, respectively. See Tables 1–3 for variable abbreviations.
The characterization of occupancy and biomass habitat of fish and macroinvertebrate species allowed the identification of taxa with high dependency on habitats that overlap the wind lease areas in the NES ecosystem. This raises the potential for impact of offshore wind development on these candidate taxa, where impact is broadly defined as the potential direct effects for some species on their habitat and subsequently their growth and reproduction (Stenberg et al., 2015; Raoux et al., 2017). However, it may also represent indirect effects in that wind farms may change use patterns in the lease areas, such as limiting fishery access and thus reducing fishing mortality for select species (Ashley et al., 2014; Coates et al., 2016). Among the species with the highest fisheries landings in the Middle Atlantic Bight (MAB) in the most recent decade were Atlantic menhaden (B. tyrannus), sea scallops (P. magellanicus), squids (Doryteuthis pealeii, Illex illecebrosus), Atlantic croaker (Micropogonias undulatus), scup (Stenotomus chrysops), spiny dogfish (S. acanthias), summer flounder (P. dentatus), and striped bass (Morone saxatilis), which were all species with a high to moderate reliance on the lease area habitats. This information can aid ongoing efforts to characterize cumulative risk to fishery species by a range of environmental factors and human activities, including non-fisheries uses (Hobday et al., 2011; Holsman et al., 2017). In particular, summer flounder, scup, and spiny dogfish are among federally managed species evaluated annually in an ecosystem-level risk assessment, and summer flounder fisheries have been found to face multiple other risks (Gaichas et al., 2018).
Despite the importance of multiple species to specific fisheries in the MAB, some were not reliant on the lease areas. For example, three taxa with high landings in the MAB, blue crab (Callinectes sapidus), surf clam (Spisula solidissima), and ocean quahogs (Arctica islandica), occur in the lease areas, but do not appear in either the high or moderate reliance use groups. This is likely because the clam species are infauna and not effectively sampled in bottom trawl surveys, and blue crab provide high regional landings, but are mostly an inshore estuarine taxon. Despite low habitat use across most of the lease areas, some taxa play pivotal roles in the NES ecosystem. For example, Atlantic cod (Gadus morhua), which only meets the criteria of low reliance, has been an ecologically pivotal species supporting regional groundfish fisheries and has declined in recent years due to overfishing and changing climate conditions (Pershing et al., 2015). Hence, even if cod interactions were limited to a small segment of the overall lease area, it would seem prudent to monitor and study the effects of habitat change on cod biology.
Ongoing monitoring is comprehensive in the lease areas for specific fisheries species and ecosystem aspects; however, other components are characterized less well, such as benthic infauna, birds, bats, marine mammals, or highly migratory megafauna. Results here for finfish could potentially be expanded using data from other dedicated surveys. Advances in acoustic and satellite tracking can now identify important foraging and migration habitats for highly migratory tunas, billfishes, and sharks (Wilson et al., 2005; Curtis et al., 2018) and multiple species of seabirds (Montevecchi et al., 2012), and bats, which have been detected up to 21 km offshore (Sjollema et al., 2014). Expanding analyses could be particularly valuable for cetaceans, which were found to occur in higher than expected numbers in lease areas off southern New England (Stone et al., 2017). Habitat models provide critical baselines for assessing potential overlap of many species with wind lease areas (Roberts et al., 2016); in particular, understanding habitat use by endangered North Atlantic right whales in proximity to lease areas (Davis et al., 2017). In the absence of standardized fishery-independent survey data, fishery-dependent catch data may be a useful alternative for developing distribution models for species not well-represented in this study (Hazen et al., 2018).
Climate-driven changes in species distribution may play an important role in changing dependency of species on lease area habitats over time. Center of gravity distribution for most species on the NES have shifted to higher latitudes, which in a practical sense, represents an along-shelf movement from the southwest to the northeast (Nye et al., 2009; Kleisner et al., 2016). Concomitant with shifting distributions, habitat use for most taxa have expanded over recent decades (Friedland et al., 2020), suggesting changing climate conditions have expanded the range of useful, or at least tolerable, habitat for many species. Occupancy habitat, reflected by the change in occurrence probability, has increased for most high reliance species within the lease areas. The increasing importance of these habitats is likely the result of ranging dynamic environmental variables like SST and secondary productivity that likely represent currently optimal climate refugia (Poloczanska et al., 2013; Ban et al., 2016). Moreover, these changes could shift more southerly species into these communities (Lurgi et al., 2012; Barceló et al., 2016). Secondary production variables reflect climatological production zones, with some taxa displaying similar distribution shifts as fish. Specifically, many copepod species have experienced a shift in their center of gravity to the northeast, which would reinforce the putative effects of temperature in increased habitat values on a latitudinal basis (Friedland et al., 2019). Finally, factors further complicating our understanding of climate impacts are changes to the habitat and the related ecosystem components within the lease blocks due to energy development itself that will have species-specific outcomes (Langhamer, 2012).
Current marine spatial planning for offshore wind considers the wind resource, the seabed type for installation, the location of designated areas and other key marine users, such as navigation and military uses. Fisheries grounds and vessel transit routes are considered to varying degrees. However, the relative importance of those locations to the actual fisheries species (as demonstrated here) and life history association (Barbut et al., 2020) is generally lacking. As more offshore wind locations are chosen and the extent of the lease areas increases, there will be a need to also understand the temporal use of the areas by the fisheries species and the life stage that may be dependent on the areas (Birchenough and Degraer, 2020). The migratory connections between life history stage habitats (Buscher et al., 2016) and the availability of alternative habitat require consideration when assessing potentially significant impact on species, such as population or community change (Boehlert and Gill, 2010). Determining the changes that do occur will need to be considered over the appropriate time scale for cohort recruitment of species and spatially may be within the jurisdiction of other states, or countries. Larger developments will necessarily have more subsea cables, longer installation times and larger turbine structures, spaced further apart than currently sized turbines. Hence, the installation of the offshore wind infrastructure will need to be incorporated into the future analysis of habitat association and productivity of fisheries species in terms of spatial extent and the length of time that the fisheries may be affected.
With the advent of floating turbines, the future interactions between marine resources and energy development may change more toward offshore fisheries, particularly in the Gulf of Maine. With moving offshore, there will be gradients of potential habitat importance and perhaps differential impacts. With this in mind, the assessment of occurrence and productivity of fisheries species will remain a requirement to provide explanatory variables that determine the species association in these new offshore areas. Fish attraction (of different life stages) to the structures and connectivity linked to prevailing currents will likely need determination and occurrence of pelagic predators would be expected. Moving wind turbine structures offshore also increases the likelihood of cables intersecting with migratory species routes, including electromagnetically sensitive fauna such as elasmobranchs, sturgeons, and marine turtles (Hutchison et al., 2020).
Physical (temperature and depth) and biological (primary and secondary production) oceanographic variables were important for determining habitat occupancy for upper trophic level species in this study. Temperature and depth are well known to be strong determinants of fish distribution and abundance in marine ecosystems (Murawski and Finn, 1988). Primary and secondary production form the base of the marine food web and are associated with fisheries yields (Friedland et al., 2012; Stock et al., 2017). Both physical and biological oceanographic variables are likely to be affected by the operation of offshore wind farms (Floeter et al., 2017; Bakhoday-Paskyabi et al., 2018). However, few studies have directly demonstrated linkages between physical and biological oceanographic variables at these facilities. One of the first studies to empirically take on these questions reported increased vertical mixing, doming of the thermocline (i.e., rising of the thermocline to replace the surface mixed layer), and transport of nutrients to the surface mixed layer followed by uptake by phytoplankton in the photic zone (Floeter et al., 2017). Coupled with our findings, this would suggest that wind farm effects on phytoplankton and zooplankton might extend to upper trophic level impacts, potentially modifying the distribution and abundance of finfish and invertebrates. The spatial scale of these effects remains unknown but could range from localized within individual farms to broader spatial scales (Carpenter et al., 2016; Bakhoday-Paskyabi et al., 2018). The implications of these effects for fisheries production and commercial fisheries economics could be significant; hence, we suggest that the effect of wind farms on oceanographic variables be considered in environmental impact analyses.
A well-designed regional wind farm monitoring program is essential to understanding how offshore wind development affects marine ecosystems, and the design of strategic and meaningful assessments to properly contextualize impacts is required (Lindeboom et al., 2015). With respect to our case study, there is currently much discussion about how to conduct monitoring focusing on variables that are sensitive to change, that are sampled with current gear and technologies, and that are indicative of wind farm effects on the biological community and the ecosystem as a whole. To date, limited attention in the research community has been given to how changes in oceanographic variables due to offshore wind farm operation are linked to effects on biological processes. Given the importance of oceanographic variables in determining habitat occupancy of upper trophic levels revealed in our study, we recommend that comprehensive monitoring of these variables be conducted in conjunction with biological monitoring. Specifically, to be cognizant of the factors related to primary and secondary production and how they are linked to patterns of natural resource abundance and distribution.
In addition to regional monitoring, research programs are also under development in the Northeast US led by a new science entity, the Responsible Offshore Science Alliance, which seeks to address research questions through cross-sector collaboration and hypothesis-driven questions development (Dannheim et al., 2020). The findings of this study could inform the development of such research priorities and questions. For example, we can foresee questions related to feeding behavior and diet of species at various life stages and sizes and the associated impacts of wind farm structures. The results of this study show black sea bass (Centropristis striata) are highly dependent on habitat in wind areas in both the spring and fall. Because of its attraction to structural habitat and reef formations, black sea bass has previously garnered attention as a species that may benefit from the installation of turbine foundations. As phytoplankton and zooplankton are important drivers of habitat occupancy, species that are planktivorous such as Atlantic menhaden (Brevoortia tyrannus), may be sensitive to any changes in biological oceanography caused by wind farm operation. These findings could be used to develop ecosystem simulation models that couple changes in physical and biological oceanography to explore a range of bottom up forcing scenarios caused by wind farm operation and how they might affect upper trophic levels (Pezy et al., 2020). Knowing how the range of primary and secondary productivity values are linked to upper trophic levels would be extremely useful in parameterizing and testing such models.
Species’ occupancy and biomass spatial predictions provide a basis for quantifying baseline conditions for wind energy areas of the NES. However, our methodological framework could have broad applicability to other parts of the world with comparable data availability that are also experiencing similar growth in offshore energy development or other impacts. As part of developers’ construction plans, they are charged with understanding the environment they plan to utilize. Their pre-construction monitoring needs to take into account the variability in baseline estimates (Witt et al., 2012). The model predictions in our study provide a method for testing the tradeoffs of defining baseline year lengths for species of high exploitation and ecosystem significance. The results also highlight how the relationship between areas and species can change through time, as many of the high reliance species have increased dependency over time (Figure 7). Many of these taxa are experiencing regional shifts, often northeastward (Bell et al., 2015; Kleisner et al., 2017), suggesting that the historical significance of these areas for species should not be the sole metric used to understand prospective wind farm impacts. Using SDMs with forecasted environmental data and fit with the appropriate rigor (Briscoe et al., 2019), may provide increased insight into future interactions between offshore wind development and the fish community.
The study presented here utilized data from NOAA’s long-term bottom trawl survey and ecosystem monitoring programs. In the Northeast US, wind development areas overlap with these, and a number of scientific surveys representing more than 315 years of cumulative survey effort, which are executed by NOAA ships and aircraft. Information gathered from these surveys represents one of the most comprehensive data sets on marine ecosystems in the world (Desprespatanjo et al., 1988). In addition to making predictive modeling studies such as this one possible, these surveys support fisheries assessment and management process, protected species assessment and remediation, ecosystem-based fisheries management, and regional and national climate assessments, as well as a number of regional, national, and international science activities (Smith, 2008). Within offshore wind facility areas, survey operations will be curtailed or eliminated under current vessel and aircraft capacities, safety requirements, and monitoring protocols. For example, in the case of the bottom-trawl survey, a stratified-random sampling methodology will no longer be possible because wind energy areas will not be sampled with the current vessel and gear specifications. The same limitation will affect ecosystem survey work. The inability to conduct sampling inside of wind areas will lead to survey bias, a reduction in information, increased uncertainty in stock assessments, and poorly informed management decisions (Boenish et al., 2020). Maintaining the integrity of long-term scientific assessments through development and implementation of novel survey design and gear types is essential to ensure the compatibility of data collected inside and outside of wind farms and of historical data with future data sets.
The original contributions presented in the study are included in the article/Supplementary Material, further inquiries can be directed to the corresponding author/s.
KF led the analysis with primary drafting of the manuscript by KF, EM, AG, SG, and TC. EA, JM, DC, MM, and DB contributed to the drafting and editing of the manuscript. All authors contributed to the article and approved the submitted version.
The views expressed herein are those of the authors and do not necessarily reflect those of their agencies.
DC was employed by ECS Federal, and EM was employed by IBSS Corporation.
The remaining authors declare that the research was conducted in the absence of any commercial or financial relationships that could be construed as a potential conflict of interest.
The Supplementary Material for this article can be found online at: https://www.frontiersin.org/articles/10.3389/fmars.2021.629230/full#supplementary-material
Ashley, M. C., Mangi, S. C., and Rodwell, L. D. (2014). The potential of offshore windfarms to act as marine protected areas – A systematic review of current evidence. Mar. Policy 45, 301–309. doi: 10.1016/j.marpol.2013.09.002
Bakhoday-Paskyabi, M., Fer, I., and Reuder, J. (2018). Current and turbulence measurements at the FINO1 offshore wind energy site: analysis using 5-beam ADCPs. Ocean Dyn. 68, 109–130. doi: 10.1007/s10236-017-1109-5
Ban, S. S., Alidina, H. M., Okey, T. A., Gregg, R. M., and Ban, N. C. (2016). Identifying potential marine climate change refugia: a case study in Canada’s Pacific marine ecosystems. Glob. Ecol. Conserv. 8, 41–54. doi: 10.1016/j.gecco.2016.07.004
Barbut, L., Vastenhoud, B., Vigin, L., Degraer, S., Volckaert, F. A. M., and Lacroix, G. (2020). The proportion of flatfish recruitment in the North Sea potentially affected by offshore windfarms. ICES J. Mar. Sci. 77, 1227–1237. doi: 10.1093/icesjms/fsz050
Barceló, C., Ciannelli, L., Olsen, E. M., Johannessen, T., and Knutsen, H. (2016). Eight decades of sampling reveal a contemporary novel fish assemblage in coastal nursery habitats. Glob. Change Biol. 22, 1155–1167. doi: 10.1111/gcb.13047
Belkin, I. M., and O’Reilly, J. E. (2009). An algorithm for oceanic front detection in chlorophyll and SST satellite imagery. J. Mar. Syst. 78, 319–326. doi: 10.1016/j.jmarsys.2008.11.018
Bell, R. J., Richardson, D. E., Hare, J. A., Lynch, P. D., and Fratantoni, P. S. (2015). Disentangling the effects of climate, abundance, and size on the distribution of marine fish: an example based on four stocks from the Northeast US shelf. ICES J. Mar. Sci. 72, 1311–1322. doi: 10.1093/icesjms/fsu217
Birchenough, S. N. R., and Degraer, S. (2020). Science in support of ecologically sound decommissioning strategies for offshore man-made structures: taking stock of current knowledge and considering future challenges. ICES J. Mar. Sci. 77, 1075–1078. doi: 10.1093/icesjms/fsaa039
Boehlert, G., and Gill, A. (2010). Environmental and ecological effects of ocean renewable energy development – a current synthesis. Oceanog 23, 68–81. doi: 10.5670/oceanog.2010.46
Boenish, R., Willard, D., Kritzer, J. P., and Reardon, K. (2020). Fisheries monitoring: perspectives from the United States. Aquac. Fish. 5, 131–138. doi: 10.1016/j.aaf.2019.10.002
Brandt, M. J., Dragon, A.-C., Diederichs, A., Bellmann, M. A., Wahl, V., Piper, W., et al. (2018). Disturbance of harbour porpoises during construction of the first seven offshore wind farms in Germany. Mar. Ecol. Prog. Ser. 596, 213–232. doi: 10.3354/meps12560
Briscoe, N. J., Elith, J., Salguero−Gómez, R., Lahoz−Monfort, J. J., Camac, J. S., Giljohann, K. M., et al. (2019). Forecasting species range dynamics with process-explicit models: matching methods to applications. Ecol. Lett. 22, 1940–1956. doi: 10.1111/ele.13348
Buscher, E., Olson, A. M., Pascoe, E. S., Weil, J., and Juanes, F. (2016). David H. Secor: migration ecology of marine fishes. Rev. Fish. Biol. Fish. 26, 609–610. doi: 10.1007/s11160-016-9423-4
Carpenter, J. R., Merckelbach, L., Callies, U., Clark, S., Gaslikova, L., and Baschek, B. (2016). Potential impacts of offshore wind farms on North Sea Stratification. PLoS One 11:e0160830. doi: 10.1371/journal.pone.0160830
Carpenter, S. (2020). Offshore Wind Companies Are Racing To Develop America’s East Coast. First They Must Appease The Fishermen. Forbes. Available online at: https://www.forbes.com/sites/scottcarpenter/2020/06/16/offshore-wind-companies-are-racing-to-develop-americas-east-coast-first-they-must-appease-the-fishermen/(accessed July 7, 2020).
Causon, P. D., and Gill, A. B. (2018). Linking ecosystem services with epibenthic biodiversity change following installation of offshore wind farms. Environ. Sci. Policy 89, 340–347. doi: 10.1016/j.envsci.2018.08.013
Coates, D. A., Kapasakali, D.-A., Vincx, M., and Vanaverbeke, J. (2016). Short-term effects of fishery exclusion in offshore wind farms on macrofaunal communities in the Belgian part of the North Sea. Fish. Res. 179, 131–138. doi: 10.1016/j.fishres.2016.02.019
Costanza, R., de Groot, R., Sutton, P., van der Ploeg, S., Anderson, S. J., Kubiszewski, I., et al. (2014). Changes in the global value of ecosystem services. Glob. Environ. Change 26, 152–158. doi: 10.1016/j.gloenvcha.2014.04.002
Crear, D. P., Watkins, B. E., Saba, V. S., Graves, J. E., Jensen, D. R., Hobday, A. J., et al. (2020). Contemporary and future distributions of cobia, Rachycentron canadum. Divers. Distrib. 26, 1002–1015. doi: 10.1111/ddi.13079
Curtis, T. H., Metzger, G., Fischer, C., McBride, B., McCallister, M., Winn, L. J., et al. (2018). First insights into the movements of young-of-the-year white sharks (Carcharodon carcharias) in the western North Atlantic Ocean. Sci. Rep. 8:10794. doi: 10.1038/s41598-018-29180-5
Cutler, D. R., Edwards, T. C., Beard, K. H., Cutler, A., and Hess, K. T. (2007). Random forests for classification in ecology. Ecology 88, 2783–2792. doi: 10.1890/07-0539.1
Dannheim, J., Bergström, L., Birchenough, S. N. R., Brzana, R., Boon, A. R., Coolen, J. W. P., et al. (2020). Benthic effects of offshore renewables: identification of knowledge gaps and urgently needed research. ICES J. Mar. Sci. 77, 1092–1108. doi: 10.1093/icesjms/fsz018
Davis, G. E., Baumgartner, M. F., Bonnell, J. M., Bell, J., Berchok, C., Bort Thornton, J., et al. (2017). Long-term passive acoustic recordings track the changing distribution of North Atlantic right whales (Eubalaena glacialis) from 2004 to 2014. Sci. Rep. 7:13460. doi: 10.1038/s41598-017-13359-3
De Mesel, I., Kerckhof, F., Norro, A., Rumes, B., and Degraer, S. (2015). Succession and seasonal dynamics of the epifauna community on offshore wind farm foundations and their role as stepping stones for non-indigenous species. Hydrobiologia 756, 37–50. doi: 10.1007/s10750-014-2157-1
Desprespatanjo, L. I., Azarovitz, T. R., and Byrne, C. J. (1988). 25 years of fish surveys in the northwest atlantic - the NMFS northeast fisheries centers bottom trawl survey program. Mar. Fish. Rev. 50, 69–71.
Floeter, J., van Beusekom, J. E. E., Auch, D., Callies, U., Carpenter, J., Dudeck, T., et al. (2017). Pelagic effects of offshore wind farm foundations in the stratified North Sea. Prog. Oceanog. 156, 154–173. doi: 10.1016/j.pocean.2017.07.003
Friedland, K. D., Langan, J. A., Large, S. I., Selden, R. L., Link, J. S., Watson, R. A., et al. (2020). Changes in higher trophic level productivity, diversity and niche space in a rapidly warming continental shelf ecosystem. Sci. Total Environ. 704:135270. doi: 10.1016/j.scitotenv.2019.135270
Friedland, K. D., McManus, M. C., Morse, R. E., and Link, J. S. (2019). Event scale and persistent drivers of fish and macroinvertebrate distributions on the Northeast US Shelf. ICES J. Mar. Sci. 76, 1316–1334. doi: 10.1093/icesjms/fsy167
Friedland, K. D., Stock, C., Drinkwater, K. F., Link, J. S., Leaf, R. T., Shank, B. V., et al. (2012). Pathways between primary production and fisheries yields of large marine ecosystems. PLoS One 7:e0028945. doi: 10.1371/journal.pone.0028945
Friedman, A., Pizarro, O., Williams, S. B., and Johnson-Roberson, M. (2012). Multi-scale measures of rugosity, slope and aspect from benthic stereo image reconstructions. PLoS One 7:e0050440. doi: 10.1371/journal.pone.0050440
Gaichas, S. K., DePiper, G. S., Seagraves, R. J., Muffley, B. W., Sabo, M. G., Colburn, L. L., et al. (2018). Implementing ecosystem approaches to fishery management: risk assessment in the US Mid-Atlantic. Front. Mar. Sci. 5:442. doi: 10.3389/fmars.2018.00442
Hatch, L., Clark, C., Merrick, R., Van Parijs, S., Ponirakis, D., Schwehr, K., et al. (2008). Characterizing the relative contributions of large vessels to total ocean noise fields: a case study using the Gerry E. Studds Stellwagen Bank National Marine Sanctuary. Environ. Manag. 42, 735–752. doi: 10.1007/s00267-008-9169-4
Hazen, E. L., Scales, K. L., Maxwell, S. M., Briscoe, D. K., Welch, H., Bograd, S. J., et al. (2018). A dynamic ocean management tool to reduce bycatch and support sustainable fisheries. Sci. Adv. 4:eaar3001. doi: 10.1126/sciadv.aar3001
Hobday, A. J., Smith, A. D. M., Stobutzki, I. C., Bulman, C., Daley, R., Dambacher, J. M., et al. (2011). Ecological risk assessment for the effects of fishing. Fish. Res. 108, 372–384. doi: 10.1016/j.fishres.2011.01.013
Hobson, R. D. (1972). “Surface roughness in topography: quantitative approach,” in Spatial Analysis in Geomorphology, ed. R. J. Chorley (New York, NY: Harper and Row), 221–245. doi: 10.4324/9780429273346-8
Holsman, K., Samhouri, J., Cook, G., Hazen, E., Olsen, E., Dillard, M., et al. (2017). An ecosystem-based approach to marine risk assessment. Ecosyst. Health Sust. 3:e01256. doi: 10.1002/ehs2.1256
Hooper, T., Ashley, M., and Austen, M. (2015). Perceptions of fishers and developers on the co-location of offshore wind farms and decapod fisheries in the UK. Mar. Policy 61, 16–22. doi: 10.1016/j.marpol.2015.06.031
Hutchison, Z. L., Gill, A. B., Sigray, P., He, H., and King, J. W. (2020). Anthropogenic electromagnetic fields (EMF) influence the behaviour of bottom-dwelling marine species. Sci. Rep. 10:4219. doi: 10.1038/s41598-020-60793-x
Kane, J. (2007). Zooplankton abundance trends on Georges Bank, 1977-2004. ICES J. Mar. Sci. 64, 909–919. doi: 10.1093/icesjms/fsm066
Kinlan, B. P., Winship, A. J., White, T. P., and Christensen, J. (2016). Modeling At-Sea Occurrence and Abundance of Marine Birds to Support Atlantic Marine Renewable Energy Planning: Phase I Report. Washington, DC: U.S. Department of the Interior, xvii+113. OCS Study BOEM 2016-039.
Kleisner, K. M., Fogarty, M. J., McGee, S., Barnette, A., Fratantoni, P., Greene, J., et al. (2016). The effects of sub-regional climate velocity on the distribution and spatial extent of marine species assemblages. PLoS One 11:e0149220. doi: 10.1371/journal.pone.0149220
Kleisner, K. M., Fogarty, M. J., McGee, S., Hare, J. A., Moret, S., Perretti, C. T., et al. (2017). Marine species distribution shifts on the US northeast continental shelf under continued ocean warming. Prog. Oceanogr. 153, 24–36. doi: 10.1016/j.pocean.2017.04.001
Langhamer, O. (2012). Artificial reef effect in relation to offshore renewable energy conversion: state of the art. Sci. World J. 2012:e386713. doi: 10.1100/2012/386713
Lindeboom, H., Degraer, S., Dannheim, J., Gill, A. B., and Wilhelmsson, D. (2015). Offshore wind park monitoring programmes, lessons learned and recommendations for the future. Hydrobiologia 756, 169–180. doi: 10.1007/s10750-015-2267-4
Lundblad, E., Wright, D. J., Miller, J., Larkin, E. M., Rinehart, R., Anderson, S. M., et al. (2006). A Benthic Terrain Classification Scheme for American Samoa. Mar. Geod. 29, 89–111. doi: 10.1080/01490410600738021
Lurgi, M., López, B. C., and Montoya, J. M. (2012). Novel communities from climate change. Philos. Trans. R. Soci. B Biol. Sci. 367, 2913–2922. doi: 10.1098/rstb.2012.0238
Maritorena, S., d’Andon, O. H. F., Mangin, A., and Siegel, D. A. (2010). Merged satellite ocean color data products using a bio-optical model: characteristics, benefits and issues. Remote Sens. Environ. 114, 1791–1804. doi: 10.1016/j.rse.2010.04.002
Mavraki, N., De Mesel, I., Degraer, S., Moens, T., and Vanaverbeke, J. (2020). Resource niches of Co-occurring invertebrate species at an offshore wind turbine indicate a substantial degree of trophic plasticity. Front. Mar. Sci. 7:379. doi: 10.3389/fmars.2020.00379
Mazur, M. D., Friedland, K. D., McManus, M. C., and Goode, A. G. (2020). Dynamic changes in American lobster suitable habitat distribution on the Northeast U.S. Shelf linked to oceanographic conditions. Fish. Oceanogr. 29, 349–365. doi: 10.1111/fog.12476
Methratta, E. T. (2020). Monitoring fisheries resources at offshore wind farms: BACI vs. BAG designs. ICES J. Mar. Sci. 77, 890–900. doi: 10.1093/icesjms/fsaa026
Miller, T. J., Das, C., Politis, P. J., Miller, A. S., Lucey, S. M., Legault, C. M., et al. (2010). Estimation of Albatross IV to Henry B. Bigelow calibration factors. Northeast Fisheries Science Center Reference Document 10-05. Washington, DC: NOAA, 238.
Montevecchi, W. A., Hedd, A., McFarlane Tranquilla, L., Fifield, D. A., Burke, C. M., Regular, P. M., et al. (2012). Tracking seabirds to identify ecologically important and high risk marine areas in the western North Atlantic. Biol. Conserv. 156, 62–71. doi: 10.1016/j.biocon.2011.12.001
Moore, C., Drazen, J. C., Radford, B. T., Kelley, C., and Newman, S. J. (2016). Improving essential fish habitat designation to support sustainable ecosystem-based fisheries management. Mar. Policy 69, 32–41. doi: 10.1016/j.marpol.2016.03.021
Murawski, S. A., and Finn, J. T. (1988). Biological bases for mixed-species fisheries: species co-distribution in relation to environmental and biotic variables. Can. J. Fish. Aquat. Sci. 45, 1720–1735. doi: 10.1139/f88-204
Murphy, M. A., Evans, J. S., and Storfer, A. (2010). Quantifying Bufo boreas connectivity in Yellowstone National Park with landscape genetics. Ecology 91, 252–261. doi: 10.1890/08-0879.1
Nye, J. A., Link, J. S., Hare, J. A., and Overholtz, W. J. (2009). Changing spatial distribution of fish stocks in relation to climate and population size on the Northeast United States continental shelf. Mar. Ecol. Prog. Ser. 393, 111–129. doi: 10.3354/Meps08220
Pershing, A. J., Alexander, M. A., Hernandez, C. M., Kerr, L. A., Le Bris, A., Mills, K. E., et al. (2015). Slow adaptation in the face of rapid warming leads to collapse of the Gulf of Maine cod fishery. Science 350, 809–812. doi: 10.1126/science.aac9819
Pezy, J.-P., Raoux, A., and Dauvin, J.-C. (2020). An ecosystem approach for studying the impact of offshore wind farms: a French case study. ICES J. Mar. Sci. 77, 1238–1246. doi: 10.1093/icesjms/fsy125
Poloczanska, E. S., Brown, C. J., Sydeman, W. J., Kiessling, W., Schoeman, D. S., Moore, P. J., et al. (2013). Global imprint of climate change on marine life. Nat. Clim. Chang. 3, 919–925. doi: 10.1038/Nclimate1958
Popper, A. N., and Hawkins, A. D. (2019). An overview of fish bioacoustics and the impacts of anthropogenic sounds on fishes. J. Fish Biol. 94, 692–713. doi: 10.1111/jfb.13948
Raoux, A., Tecchio, S., Pezy, J.-P., Lassalle, G., Degraer, S., Wilhelmsson, D., et al. (2017). Benthic and fish aggregation inside an offshore wind farm: which effects on the trophic web functioning? Ecol. Ind. 72, 33–46. doi: 10.1016/j.ecolind.2016.07.037
Riley, S. J., DeGloria, S. D., and Elliot, R. (1999). A terrain ruggedness index that quantifies topographic heterogeneity. Int. J. Sci. 5, 23–27.
Roberts, J. J., Best, B. D., Mannocci, L., Fujioka, E., Halpin, P. N., Palka, D. L., et al. (2016). Habitat-based cetacean density models for the U.S. Atlantic and Gulf of Mexico. Sci. Rep. 6:22615. doi: 10.1038/srep22615
Sjollema, A. L., Gates, J. E., Hilderbrand, R. H., and Sherwell, J. (2014). Offshore activity of bats along the mid-atlantic coast. Northeast. Nat. 21, 154–163. doi: 10.1656/045.021.0201
Slavik, K., Lemmen, C., Zhang, W., Kerimoglu, O., Klingbeil, K., and Wirtz, K. W. (2019). The large-scale impact of offshore wind farm structures on pelagic primary productivity in the southern North Sea. Hydrobiologia 845, 35–53. doi: 10.1007/s10750-018-3653-5
Smith, T. D. (2008). “A History of fisheries and their science and management,” in Handbook of Fish Biology and Fisheries, eds P. J. B. Hart and J. D. Reynolds (Hoboken, NJ: John Wiley & Sons, Ltd), 61–83. doi: 10.1002/9780470693919.ch4
Smolinski, S., and Radtke, K. (2017). Spatial prediction of demersal fish diversity in the Baltic Sea: comparison of machine learning and regression-based techniques. ICES J. Mar. Sci. 74, 102–111. doi: 10.1093/icesjms/fsw136
Stenberg, C., Støttrup, J. G., van Deurs, M., Berg, C. W., Dinesen, G. E., Mosegaard, H., et al. (2015). Long-term effects of an offshore wind farm in the North Sea on fish communities. Mar. Ecol. Prog. Ser. 528, 257–265. doi: 10.3354/meps11261
Stock, C. A., John, J. G., Rykaczewski, R. R., Asch, R. G., Cheung, W. W. L., Dunne, J. P., et al. (2017). Reconciling fisheries catch and ocean productivity. Proc. Natl. Acad. Sci. U.S.A. 114, E1441–E1449. doi: 10.1073/pnas.1610238114
Stone, K. M., Leiter, S. M., Kenney, R. D., Wikgren, B. C., Thompson, J. L., Taylor, J. K. D., et al. (2017). Distribution and abundance of cetaceans in a wind energy development area offshore of Massachusetts and Rhode Island. J. Coas.t Conserv. 21, 527–543. doi: 10.1007/s11852-017-0526-4
UNEP (2019). Global Trends in Renewable Energy Investment 2019. Nairobi: UNEP-UN Environment Program.
Wahlberg, M., and Westerberg, H. (2005). Hearing in fish and their reactions to sounds from offshore wind farms. Mar. Ecol. Prog. Ser. 288, 295–309. doi: 10.3354/meps288295
Wang, T., Yu, W., Zou, X., Zhang, D., Li, B., Wang, J., et al. (2018). Zooplankton community responses and the relation to environmental factors from established offshore wind farms within the Rudong Coastal Area of China. J. Coast. Res. 34, 843–855. doi: 10.2112/JCOASTRES-D-17-00058.1
Weber, E. D., Chao, Y., and Chai, F. (2018). Performance of fish-habitat classifiers based on derived predictors from a coupled biophysical model. J. Mar. Syst. 186, 105–114. doi: 10.1016/j.jmarsys.2018.06.012
Wilding, T. A. (2014). Effects of man-made structures on sedimentary oxygenation: extent, seasonality and implications for offshore renewables. Mar. Environ. Res. 97, 39–47. doi: 10.1016/j.marenvres.2014.01.011
Wilhelmsson, D., Malm, T., and Öhman, M. C. (2006). The influence of offshore windpower on demersal fish. ICES J. Mar. Sci. 63, 775–784. doi: 10.1016/j.icesjms.2006.02.001
Wilson, S. G., Lutcavage, M. E., Brill, R. W., Genovese, M. P., Cooper, A. B., and Everly, A. W. (2005). Movements of bluefin tuna (Thunnus thynnus) in the northwestern Atlantic Ocean recorded by pop-up satellite archival tags. Mar. Biol. 146, 409–423. doi: 10.1007/s00227-004-1445-0
Winship, A. J., Kinlan, B. P., White, T. P., Leirness, J. B., and Christensen, J. (2018). Modeling At-Sea Density of Marine Birds to Support Atlantic Marine Renewable Energy Planning: Final Report. Washington, DC: U.S. Department of the Interior, x+67. OCS Study BOEM 2018-010.
Witt, M. J., Sheehan, E. V., Bearhop, S., Broderick, A. C., Conley, D. C., Cotterell, S. P., et al. (2012). Assessing wave energy effects on biodiversity: the Wave Hub experience. Philos. Trans. R. So. A Math. Phys. Eng. Sci. 370, 502–529. doi: 10.1098/rsta.2011.0265
Keywords: wind energy, fisheries, habitat, monitoring, temperature, zooplankton
Citation: Friedland KD, Methratta ET, Gill AB, Gaichas SK, Curtis TH, Adams EM, Morano JL, Crear DP, McManus MC and Brady DC (2021) Resource Occurrence and Productivity in Existing and Proposed Wind Energy Lease Areas on the Northeast US Shelf. Front. Mar. Sci. 8:629230. doi: 10.3389/fmars.2021.629230
Received: 13 November 2020; Accepted: 16 March 2021;
Published: 21 April 2021.
Edited by:
Mary C. Fabrizio, College of William & Mary, United StatesReviewed by:
Ana B. Bugnot, The University of Sydney, AustraliaCopyright © 2021 Friedland, Methratta, Gill, Gaichas, Curtis, Adams, Morano, Crear, McManus and Brady. This is an open-access article distributed under the terms of the Creative Commons Attribution License (CC BY). The use, distribution or reproduction in other forums is permitted, provided the original author(s) and the copyright owner(s) are credited and that the original publication in this journal is cited, in accordance with accepted academic practice. No use, distribution or reproduction is permitted which does not comply with these terms.
*Correspondence: Kevin D. Friedland, a2V2aW4uZnJpZWRsYW5kQG5vYWEuZ292
Disclaimer: All claims expressed in this article are solely those of the authors and do not necessarily represent those of their affiliated organizations, or those of the publisher, the editors and the reviewers. Any product that may be evaluated in this article or claim that may be made by its manufacturer is not guaranteed or endorsed by the publisher.
Research integrity at Frontiers
Learn more about the work of our research integrity team to safeguard the quality of each article we publish.