 Leiping Ye
 Andrew J. Manning2,3,4
 James Holyoke
 Tian-Jian Hsu
95% of researchers rate our articles as excellent or good
Learn more about the work of our research integrity team to safeguard the quality of each article we publish.
Find out more
ORIGINAL RESEARCH article
Front. Mar. Sci. , 09 March 2021
Sec. Marine Pollution
Volume 8 - 2021 | https://doi.org/10.3389/fmars.2021.628827
This article is part of the Research Topic Predicting Hydrocarbon Fate in the Ocean: Processes, Parameterizations, and Coupled Modeling View all 12 articles
Biophysical cohesive particles in aquatic systems, such as extracellular polymeric substances (EPS) and clay minerals, play an important role in determining the transport of spilled oil contamination and its eventual fate, particularly given that suspended sediment and microbial activities are often prevalent and diverse in natural environments. A series of stirring jar tests have been conducted to understand the multiple structures characteristics of the oil-mineral aggregates (OMAs) and EPS-oil-mineral aggregates (EPS-OMAs). OMAs and EPS-OMAs have been successfully generated in the laboratory within artificial seawater using: Texas crude oil (Dynamic viscosity: 7.27 × 10⁻³ Pa⋅s at 20°C), two natural clay minerals (Bentonite and Kaolin clay), and Xanthan gum powder (a proxy of natural EPS). A magnetic stirrer produced a homogeneous turbulent flow with a high turbulence level similar to that under natural breaking waves. High-resolution microscopy results show that EPS, kaolinite, and bentonite lead to distinguished oil floc structures because of the different stickiness character of EPS and mineral clay particles. With relatively low stickiness, kaolinite particles tend to attach to an oil droplets surface (droplet OMAs) and become dominant in small-sized flocs in the mixture sample. In contrast, the more cohesive bentonite particles stickiness could adsorb with oil droplets and are thus dominated by larger sized flocs. Biological EPS, with the highest stickiness, demonstrated that it could bond multiple small oil droplets and form a web structure trapping oil and minerals. Generally, adding EPS leads to flake/solid OMAs formation, and individual oil droplets are rarely observed. The inclusion of ESP within the matrix, also reduced the dependence of settling velocity on floc size and mineral type.
With increasing human activities and industrial development within the marine environment, water resource quality, and subsequent recovery, from contamination by industrial dumping and oil spillages have been a major challenge (Doshi et al., 2018); especially in estuarine and coastal regions where they have high sensitivity to the ecosystem and public health (Barbier et al., 2011). In recent decades, oil spill contamination has tended to occur more commonly in coastal water systems (Peterson et al., 2003; Radoviæ et al., 2012). In particular, the largest oil spill event in human history (at the time of publication) occurred in 2010, and was the Deepwater Horizon (DWH) oil spill. DWH released approximately 4.9 million barrels (or 779 million L) of crude oil into the Gulf of Mexico (Crone and Tolstoy, 2010; Atlas and Hazen, 2011). It was estimated that almost 1,773 km of the shoreline habitat was directly affected by the DWH spill (Michel et al., 2013). Besides the huge negative ecological impact in the nearby regions of the spill site and the shoreline, there was an unexpected sedimentation of oil-associated marine snow throughout the water column and down to the seafloor; this was an additional long-term impact on the benthic zones (Daly et al., 2016; Passow and Ziervogel, 2016; Romero et al., 2017).
Due to their lower relative density, most of the leaked oil contaminants were expected to float on seawater as the weathering processes proceeded. However, it was found that a considerable amount of oil droplets aggregated with the various suspended materials (Passow et al., 2012; Passow and Ziervogel, 2016), including: sediments, detritus, phytoplankton, and fecal pellets, and significantly facilitated by biologically secreted substances (Passow and Alldredge, 1995; Malpezzi et al., 2013), namely the Transparent Exopolymer Particles (TEP) or more generally the Extracellular Polymeric Substance (EPS). These oil-containing aggregates, called Marine Oil Snows (MOS) would finally settle to the seafloor as they were transported in the seawater (Daly et al., 2016; Passow et al., 2019).
After oil spills occur, chemical dispersants are often initially used to treat the visible surface contaminants (Kujawinski et al., 2011; Lubchenco et al., 2012; McNutt et al., 2012). However, after the oil slick is dispersed into smaller oil droplets, there could be a higher probability that the oil droplets aggregate with other cohesive suspended materials in the water column to enhance MOS flocculation and settling (Fu et al., 2014; Kleindienst et al., 2015). Since cohesive sediment flocculation is extremely common in estuarine and coastal water systems with energetic flows (Manning and Dyer, 2007; Manning and Schoellhamer, 2013), oil droplets can readily flocculate with clay minerals, and also EPS from phytoplankton exudation, thus forming oil-particle aggregates (OPAs) (e.g., Zhao et al., 2014). These OPAs may significantly influence the entire subaquatic ecosystem (Teal and Howarth, 1984; Kingston, 2002; Fisher et al., 2016). Therefore, interactions between oil, cohesive minerals, and EPS play a notable role in the fate of oil spills in a natural ecosystem, and it becomes highly desirable to understand the formation, properties, and settling velocity of OPAs.
Various approaches have been reported to clean up oil-contaminated waters and these can be classified as: physical, chemical, and biological methods (Hoang et al., 2018). Physical methods are mainly using floating devices (e.g., booms) to gather an oil slick together to facilitate more effective removal or burning of a large amount of oil collected on the water surface. To accelerate the natural weathering processes, chemical dispersants are widely used to disperse the oil slick down to smaller oil droplets. These two types of methods may not be always effective and may even lead to secondary contamination. Therefore biological methods, such as adding microbes to enhance the oil bio-degradation, could be the most environmental-friendly approach. However, bio-degradation by the microbes and their bacteria function, can be time-consuming and their overall effectiveness may be highly dependent upon other environmental factors such as: nutrient levels, salinity, temperature, and the types of bacteria present (Atlas and Bartha, 1992, Atlas, 1995); hence more fundamental research is needed.
In recent years, many biologically related oil aggregates studies have been predominantly focused on MOS though both field observations (e.g., Passow et al., 2012; Daly et al., 2016) and laboratory experiments (e.g., Passow et al., 2017). These investigations provide clear evidence that high concentration oil-associated marine oil snows (MOS) exist in the vicinity of surface oil and the sub-surface oil plumes. Moreover, riverine suspended mineral particles and soot (a by-product of burned oil) are also very likely to interact with oil to form sinking oil-mineral aggregations (OMAs) in addition to MOS (Daly et al., 2016). With the combination of OMAs and EPS (or more generally called OPAs), flocculation and settling processes become ever more complex.
Clay mineral particles, such as kaolinite and bentonite, have been proven to aggregate with oil, and form OMAs (Khelifa et al., 2002; Muschenheim and Lee, 2002; Stoffyn-Egli and Lee, 2002). The settling velocity of these OMAs can be up to several mm/s, and their characteristics are highly dependent upon the base mineral stickiness (Ye et al., 2020). As aggregation is a complex process involving encounter, contact, and sticking (Hill and Nowell, 1990) controlled by flow turbulence, by directly controlling turbulence level, the biological EPS functions on OMAs flocculation may be better understood in the controlled laboratory experiments. Parsons et al. (2016) has demonstrated that only a very small amount of EPS (<0.1%) can dramatically stabilize sedimentary beds, because EPS has an extremely high stickiness/stickiness. Therefore, the appreciable role of EPS in controlling the flocculation process requires improved quantification.
Many field studies measuring TEP concentration in the coastal/estuarine zone show TEP concentration as Xanthan gum equivalent concentration (e.g., Passow, 2012; Malpezzi et al., 2013). Although the Xanthan gum equivalent concentration is based on colorimetric determination, and hence it does not directly provide quantitative information on stickiness. A limited number of studies, such as Engel (2000), exhibit a positive correlation between TEP concentration and stickiness. In many laboratory sediment transport studies, pure Xanthan gum has been used extensively to model the benthic biota secreted EPS (e.g., Malarkey et al., 2015; Parsons et al., 2016), which is an important factor influencing the cohesive sediment dynamics (Tolhurst et al., 2002). Therefore, Xanthan gum has been used to simulate biological EPS in the present study.
EPS has the potential to become a practical and viable substance for stabilizing oil droplets in the aquatic environment, when accompanied by natural clay minerals. Scientifically, as natural EPS and sediments are ubiquitous in the marine environment, understanding the role of EPS in controlling the flocculation of sediment and stabilize oil droplets is a critical element to the understanding of the fate of spilled oil.
The primary goal of this study is to deduce the influence EPS has on oil-mineral flocculation. As a first step, the experiments are designed without considering the chemical dispersant, in order to better quantify the effect of EPS on oil-mineral flocs by making a direct comparison with earlier work on oil-mineral flocs without EPS (Ye et al., 2020). Relatively higher concentrations (∼500 mg/l) of suspended minerals and EPS are applied artificially in controlled laboratory experiments in order to obtain discernable differences for inter-comparison. Data obtained from controlled laboratory experiments of six cases are analyzed with three main objectives: (1) To understand the EPS-OMAs structures formed with two different types of common clay minerals, using high-resolution digital microscopy; (2) to measure physical characteristics of EPS-OMAs, such as their sizes and settling velocities using a high magnification floc video camera; and most importantly, (3) synthesize measured and statistically analyzed data to gain insights into how EPS participation influences oil containment within flocs, floc structure, and settling dynamics. The EPS-OMA parameters derived from this laboratory research can be applied to the predictive modeling framework for oil spills; a preliminary endeavors can be found in Cui et al. (2021) in this issue.
Laboratory jar test experiments were undertaken at the Center for Applied Coastal Research, University of Delaware utilizing a magnetic stirring system, with a self-designed turbulence monitoring frame attached (see Ye et al., 2020). The resultant OMAs were measured with a LabSFLOC-2 (the 2nd version of Laboratory Spectral Flocculation Characteristics instrument, Manning et al., 2010) aside of the jar test apparatus. Each experimental run adopted a uniform stirring speed of 490 rpm (equivalent to turbulence dissipation rate at ε = 0.02 m2/s3, and shear rate parameter G = , Ye et al., 2020). As discussed in Ye et al. (2020), this was a relatively high shear rate parameter and similar to the highly turbulence conditions experienced under breaking waves. To prepare each sample, 1 Liter of artificial seawater was used for each run and the salinity was set (using laboratory grade sodium chloride) nominally to 35 ppt. White Kaolin clay (92.3 ± 2.5% Kaolinite), Wyoming sodium Bentonite clay (85.2 ± 2.3% Montmorillonite), Xanthan gum, and raw Texas crude oil (Dynamic viscosity: 7.27 × 10⁻³ Pa⋅s at 20°C) were each added to the artificial seawater solution using a mini pipette.
To generate the flocs, the oil-to-sediment (or EPS) ratio was 2:1, and a sediment (or EPS) concentration of 500 mg/l was used. This oil-to-sediment ratio was utilized, in order to maximize the oil trapping efficiency in the mineral particles/flocs present. Pe-test assessments were initially conducted to deduce the optimal duration required for flocs to reach the equilibrium phase in the stirring jar tests (>2 hrs). Six OMA samples were selected and studied here (see Table 1, C01–06). Cases C04, C05, C06 are the primary focus of this study, which is to investigate the effect of EPS on OMAs. Cases C01, C02, and C03 are the corresponding baseline OMA samples, and part of these OMA results (already reported in Ye et al., 2020) are also presented in order to demonstrate the contrasting effects of EPS.

Table 1. A summary on proportions of mineral clay, Xanthan gum and oil in each experimental run.
Each experimental jar test run had a nominal 2 h duration before they were collected for analysis using the LabSFLOC-2 system (Manning et al., 2007, 2017). As demonstrated by Ye et al. (2020), for the given turbulence level, the flocculation process reaches equilibrium within the 2 hrs experimental run time. The total floc population characteristics were observed using the LabSFLOCS-2 system which comprised a high-resolution (one pixel∼5 μm) video camera that observes and records individual flocs whilst settling in a dedicated settling column. The analyzed digital floc data provided by LabSFLOCS-2 includes complete population mass-balanced: floc numbers, floc size, floc effective density (floc bulk density minus the fluid density), settling velocity, and fractal dimensions. Each floc data size spectrum was segregated into 12 size bands (SB) from <20 microns in SB1 to >640 microns in SB12.
In order to also examine the detailed structures of the OMAs and EPS-OMAs and the capability of these flocs to contain oil droplets, representative equilibrium floc samples were collected at the completion of each run and subsequently analyzed using a digital microscope (AmScope Inc.). Analysis of the microscopy images from the equilibrium stage (C01-06, Table 1), enabled the number of free oil droplets, total flocs, and OMAs to be measured and statistically assessed. These values were counted from a snapshot digital image obtained from the microscope for a given sample. For each sample, nominally 30 images were analyzed and various statistics, including mean () and median values of all identical flocs, and the lower and higher 25% values from the mean were all obtained. See Ye et al. (2018, 2020) for further information on the control experiments for OMA cases without EPS.
Multiple types of equilibrium EPS-OMAs structures were examined using high-resolution microscopy, and compared with the well-known droplet OMAs and flake/solid OMAs (Stoffyn-Egli and Lee, 2002) formed by oil droplets and mineral. A key finding reported by Ye et al. (2020) regarding the existence of droplet OMA and flake/solid OMA, is their dependence on the mineral stickiness. Under the applied high turbulence level, the averaged droplet size was calculated to be about 57 μm (see Figure 1A). The less sticky individual kaolinite particles and micro-flocs, were seen to directly attach to the oil droplets forming droplet OMAs (see Figure 1B). In contrast, oil tended to be directly adsorbed into the high stickiness bentonite aggregate structures forming flake/solid OMAs (see Figure 1C), and the individual droplets were no longer observed. In the equally mixed kaolinite-bentonite sample, both types of OMAs were observed (see Figure 1D), but the overall settling velocity statistics are closer to the sticker bentonite-oil characteristics.
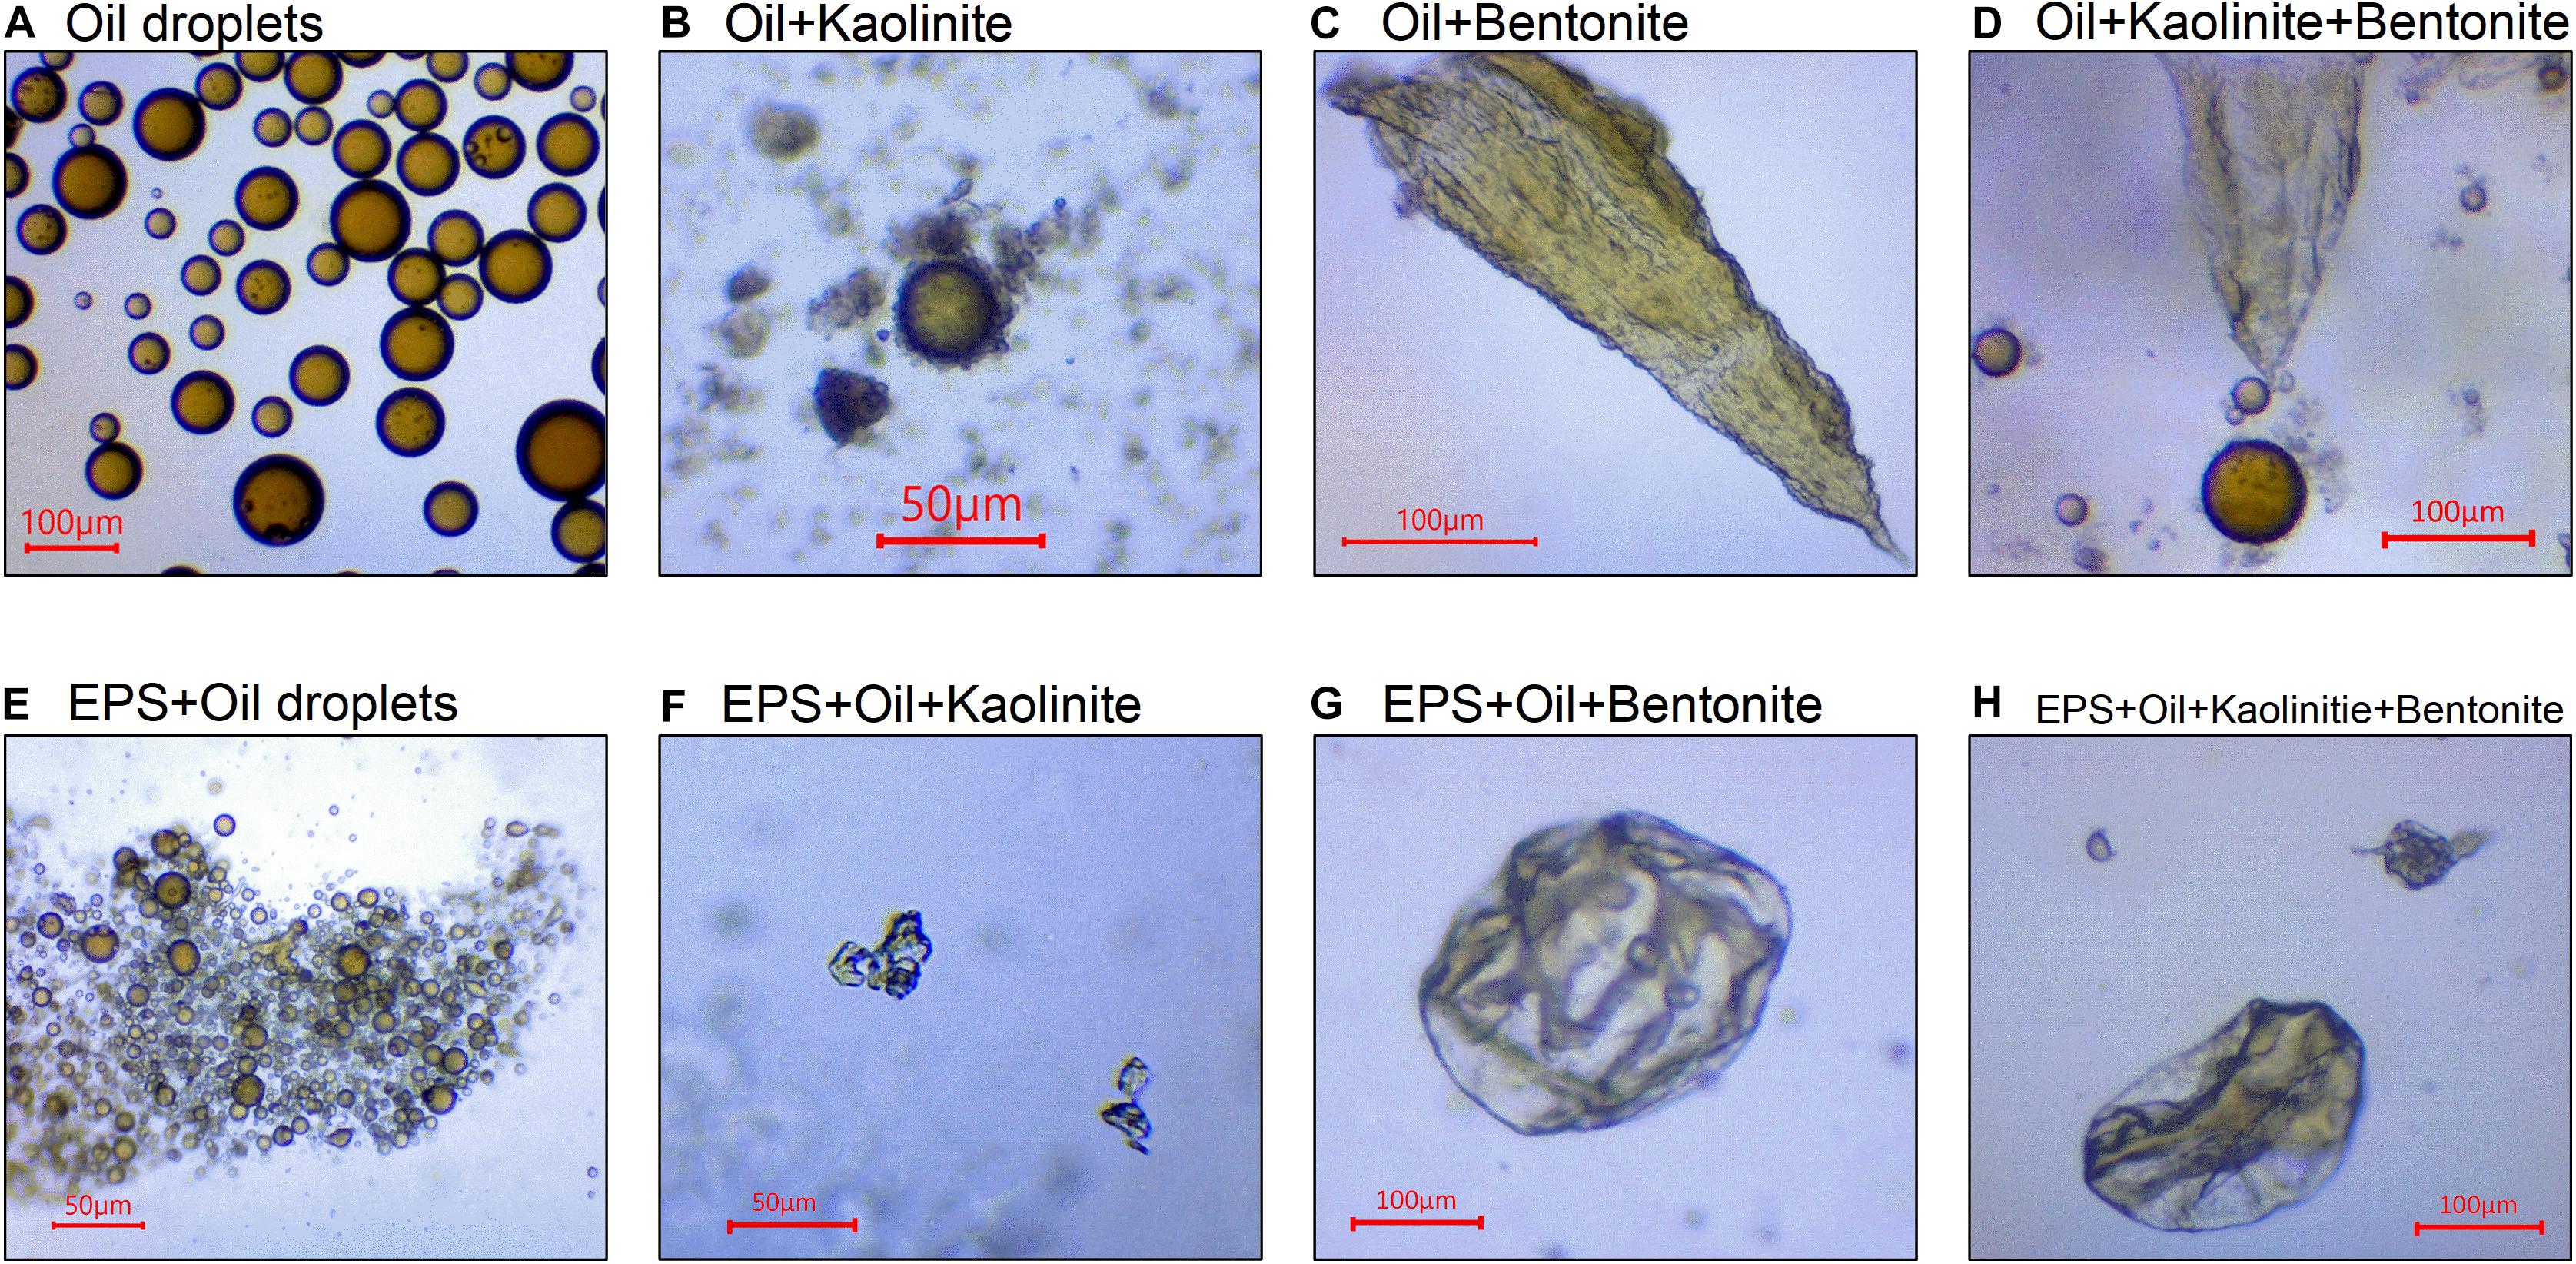
Figure 1. Microscopy images for pure oil droplets (A), oil-Kaolinite floc/droplet OMA (B), oil-Bentonite floc/flake OMA (C), mixed oil-Kaolinite-Bentonite floc (D), structure of EPS bonding large number of small oil droplets (E), EPS-oil-Kaolinite floc (F), EPS-oil-Bentonite floc (G), and mixed EPS-oil-Kaolinite-Bentonite floc (H). (A–C and D are adopted from Ye et al., 2020).
For the EPS and oil mixture (Figure 1E), a large number of oil droplets flocculated to form large-sized (several hundred micrometers) structures. Interestingly, those droplets absorbed into the EPS structure did not exceed 10∼20 μm in size, which is 3–4 times smaller than the size of pure oil droplets (Figure 1A) generated under the same turbulent dissipation rate. This reduced oil droplet size with EPS is comparable to the size-scale of the smallest microflocs (i.e., smallest disaggregated floc size fractions typically observed in a very high turbulent flow; Keyvani and Strom, 2014). In other words, the structure of oil droplets in EPS, even though they can still be discerned, have reduced nearly two orders of magnitudes in volume.
Through the scrutiny of a plethora of microscopy images from the EPS-oil-Kaolinite floc sample (e.g., Figure 1F), the flocs show the presence of oil, EPS and minerals all closely aggregated together forming a structure similar to solid/flake OMAs, and no individual droplet OMA were observed. This highlights the key difference in the flocs resulting from the addition of the extremely sticky EPS to the suspension matrix. The results suggest that EPS significantly reduces the droplet size (see Figure 1E) down to a size-scale similar to those of diminutive microflocs, and hence prevents the prospect of mineral floc bonding. Moreover, we can speculate that the high stickiness of EPS, may encourage the oil to be absorbed into the aggregate structure in a similar way to the effect of high stickiness depicted by bentonite. Following this concept, it is unsurprising and logical to observe numerous sizeable EPS-oil-Bentonite flocs formed in Figure 1G; these are similar to the compact dense oil-Bentonite OMA (Figure 1C), but encompassing supplemental EPS. The EPS-oil-kaolinite-bentonite flocs (see Figure 1H) also shows a consistent solid/flake structure in which no droplet OMA were observed, in contrast to their no-EPS counterpart (Figure 1D).
Motivated by the distinctive floc structures exhibited in Figure 1 (due to different mineral clays and the addition of EPS), it is anticipated that these flocs may also contain a dissimilar amount of oil droplets. The oil trapping efficiency for different samples is quantified by counting the number of oil droplets present in each sample (Khelifa et al., 2002) on attaining quasi-equilibrium (see Figure 2). The case of oil and kaolinite (C01) has the highest number of free oil droplets remaining after 2 h of agitation (mean value 95), whilst the bentonite case (C02) shows almost half the number of oil droplets (47). This result indicates that bentonite is approximately twice as effective in containing oil droplets in OMAs.
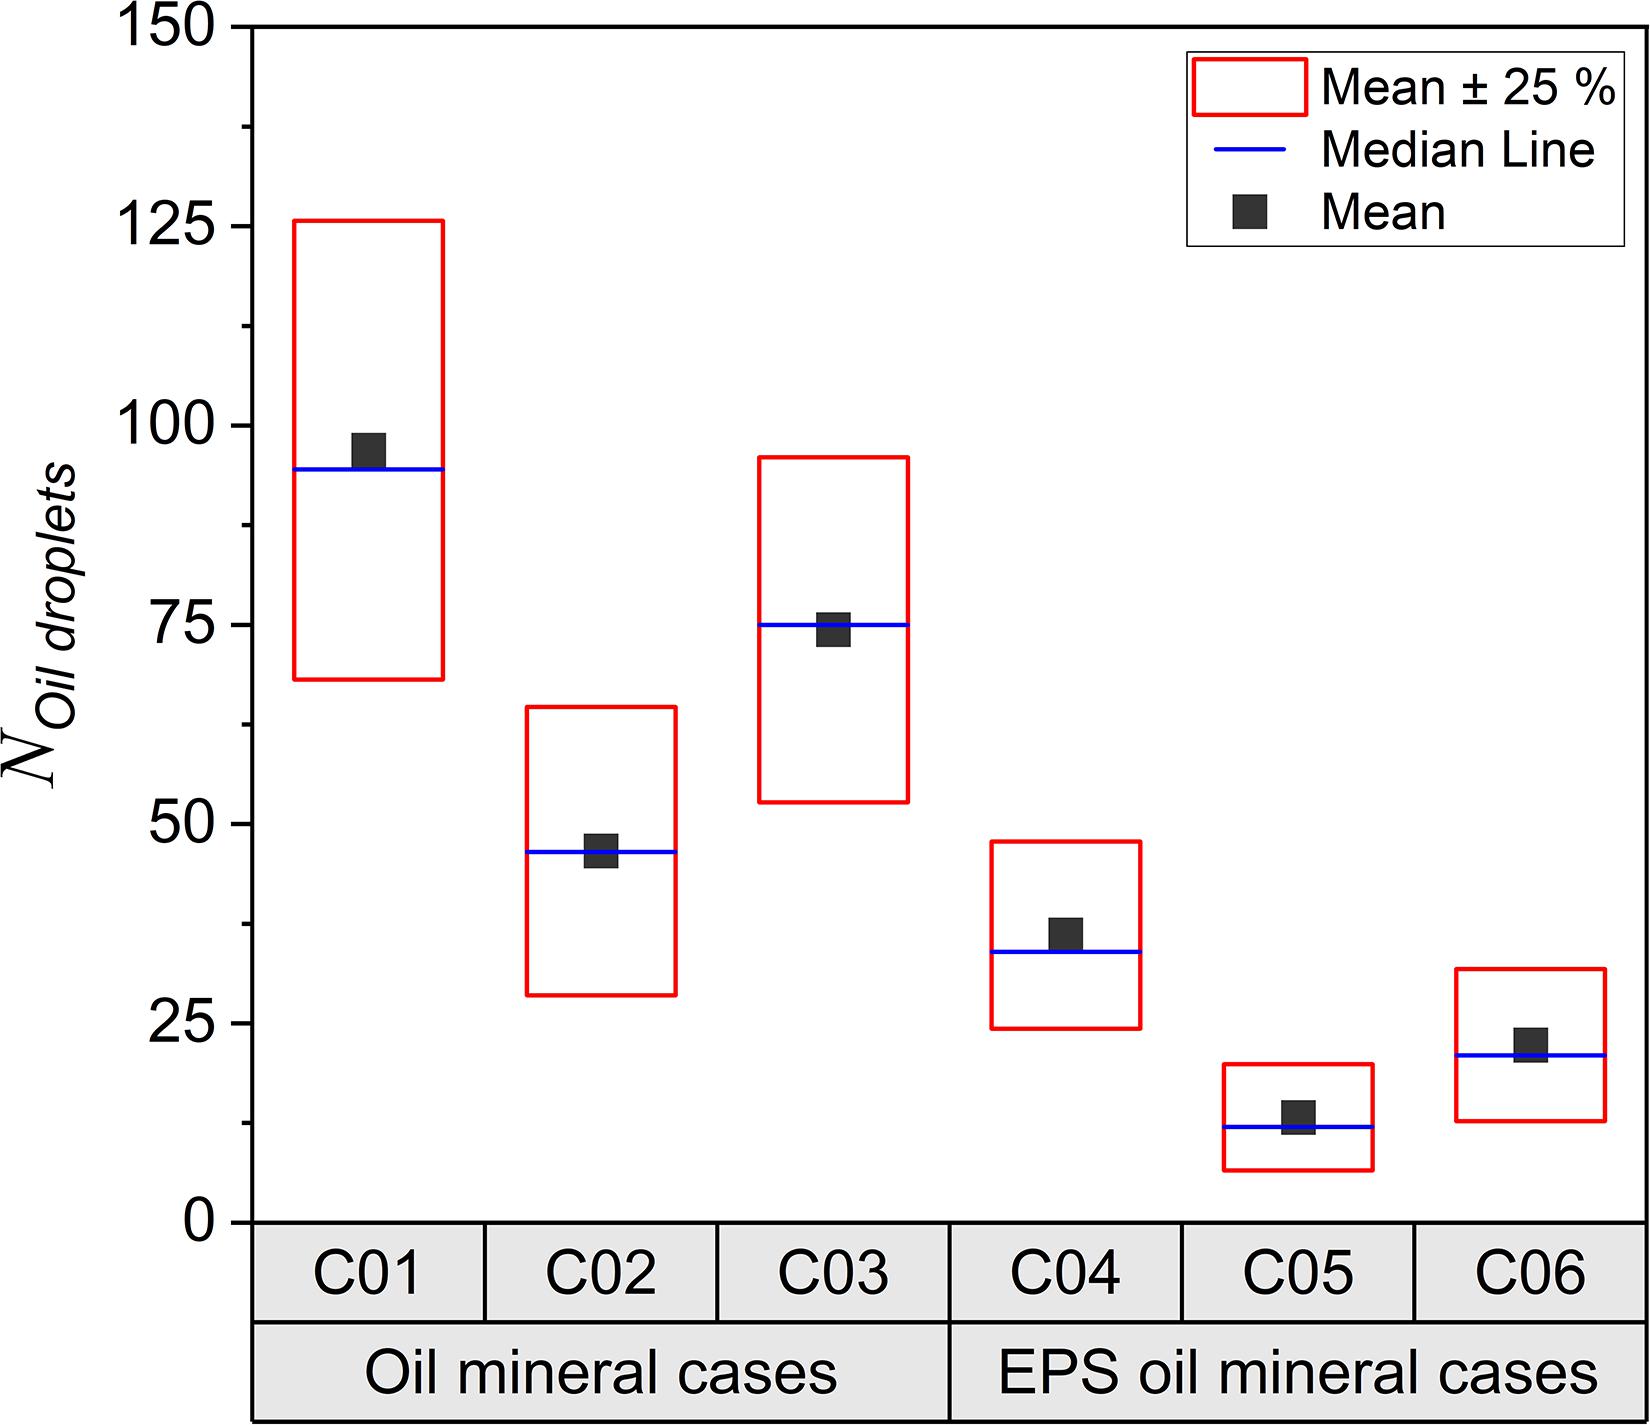
Figure 2. Box charts of oil droplets numbers, analyzed by microscopy images collected from the bulk sediment mixture samples at the equilibrium. Each dot represents number obtain from an image and each sample was analyzed by 30 images randomly taken under microscope covering thousands of individual flocs statistically.
With the addition of EPS to the kaolinite and bentonite samples (C04 and C05), both cases show significant (nearly a factor 3–5) reductions in the number of free oil droplets (32 and 10 for C04 and C05, respectively) compared to those without EPS (C01 and C02). In particular, the EPS-oil-bentonite sample (C05 in Figure 2) has the highest capability to contain oil droplets, with the fewest free oil droplet still present in the sample on completing a 2 h flocculation jar-test. Both of the samples with kaolinite-bentonite mixtures, revealed the remnant number of oil droplets ( 72 for C03 and 20 for C06) were lower than kaolinite related samples (C01 and C04, respectively), but greater than bentonite related samples (C02 and C05, respectively); while adding EPS reduced the free oil droplets almost by a factor of 3 (i.e., comparing C03 and C06). More analyses confirming these finding will be discussed in the section “How the Aggregate Structures Determine the Oil Trapping Efficiency?”
Key floc population characteristics (including floc size, settling rate, and density) were provided by the LabsFLOCS-2 system. To illustrate the effects of EPS on the resultant flocculation, the samples have been grouped into three for inter-comparison: Group #1) oil-Kaolinite floc (C01, OMAK) and EPS-oil-Kaolinite (C04, EPS-OMAK) samples; Group #2) oil-Bentonite (C02, OMAB) and EPS-oil-Bentonite (C05, EPS-OMAB) samples; and Group #3) oil-Kaolinite-Bentonite (C03, OMAK–B) and EPS-oil-Kaolinite-Bentonite (C06, EPS-OMAK–B) samples.
The oil-Kaolinite flocs (OMAK) have a size range from 20 to 350 microns (more than 85% were smaller than 160 micron—the nominal microfloc:macrofloc size division boundary) and settling velocity range from 0.04 to 4 mm/s (Figure 4A floc data measured using the LabSFLOC-2 instrumentation). Adding EPS (EPS-OMAK) expands the floc size range from 18 to 500 microns in size (with more than 80% smaller than 160 microns) and 0.02 to 8 mm/s in settling velocity (Figure 4B). Generally, adding EPS widen the range of observed floc sizes and settling velocities.
The distribution of the number of floc in the kaolinite cases reveal that the OMAK and EPS-OMAK have the most flocs present in SBs2–3 (∼990 flocs). In fact, the most notable effect of adding EPS is the new existence of the largest flocs in SB8 (∼40 flocs) and SB9 (∼6 flocs), indicating observed floc sizes in the range of 320 microns to 480 microns. The effective density trend generally decreases from small-sized flocs down to larger-sized flocs for both oil-kaolinite and EPS-oil-kaolinite cases. Moreover, adding EPS increased the effective density of small flocs (see EPS-OMAK in SB2–4), but the effective density of the macroflocs in SB5–7 (160–320 μm) still predominantly reduced (Figure 4D). The newly formed large macroflocs in SB8–9 (320–480 μm) by adding EPS exhibited very low effective densities ranging between 10 and 20 kg/m3; this indicates that these macroflocs are both fragile and highly porous.
Both cases show similar increase in trends of settling velocities from SB1 to SB4. The OMAK case has a peak settling velocity in SB6 of 2.7 mm/s, then slows down through SB7–SB8 to a velocity of under 0.5 mm/s. While the EPS-OMAK case shows a more stable settling velocity in SB5–7 at 1.2–1.3 mm/s, then slightly reduces in SB8–9 to around 1 mm/s (Figure 4E). By adding EPS, the newly formed large macroflocs in SB8–9 reveals the settling velocity of just 1 mm/s is primarily a product of their low floc effective density. Consistent with the feature observed in effective density, adding EPS slightly increase settling velocity of smaller flocs in SB2–4. Overall, adding EPS reduces the variability of settling velocity as a function of floc size, which is a trend that will be examined more later. The fractal dimensions of both OMAK and EPS-OMAK cases show a slight peak in SB3 at 2.4 and 2.5, respectively, then due to low-density flocs in the large size bands, the fractal dimension gradually decreases to about 2.0 for SBs 4–9.
The sizes of oil-Bentonite OMAB range from 32 to 600 μm and their settling velocities range from 0.03 to 10 mm/s (Figure 3A) while the EPS-OMAB sample shows OMA sizes range from 50 to 900 microns and the settling velocity is between 0.04 and 20 mm/s (Figure 3B). Clearly, both floc size and settling velocity shift toward respective larger values on adding EPS.
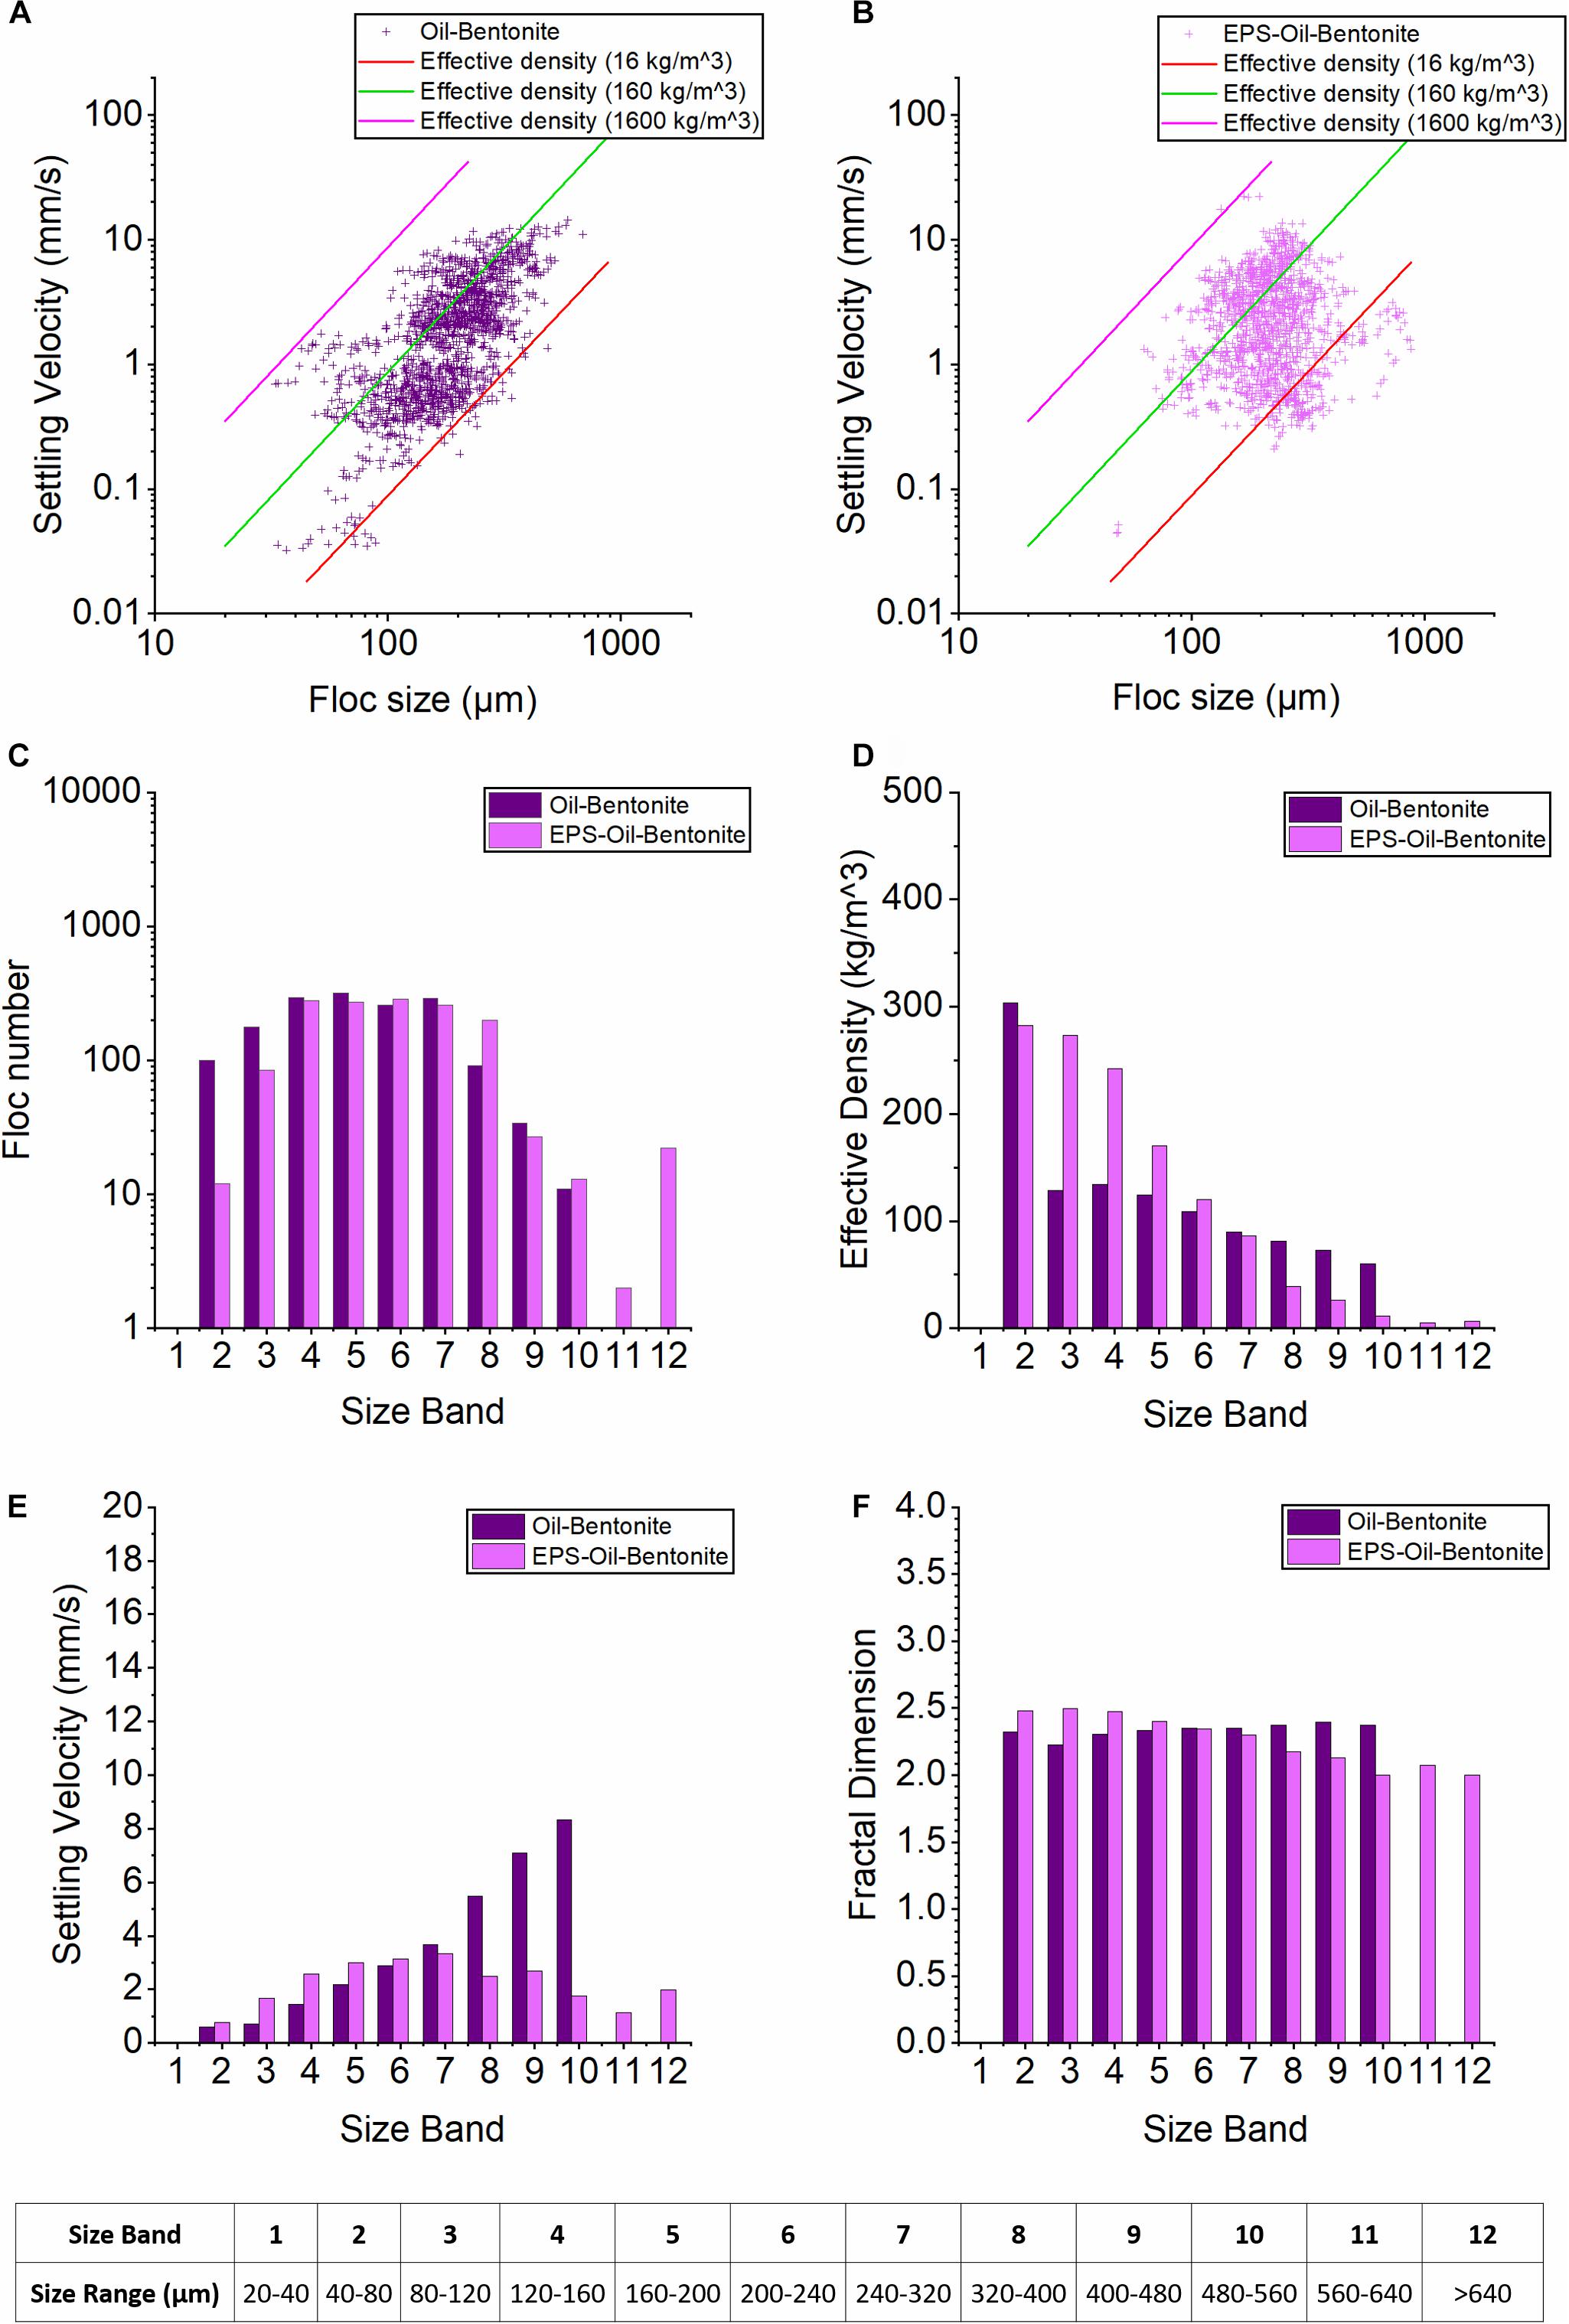
Figure 3. Floc characteristics from the LabSFLOC-2 analysis of Bentonite cases. (A,B) show the plots of floc sizes vs. settling velocities of oil-Bentonite and EPS-oil-Bentonite, respectively. The three diagonal lines each represent contours of a constant effective density (calculated using Stokes Law) 1,600 kg/m3 (pink line, equivalent to a quartz particle), 160 kg/m3 (green) and 16 kg/m3 (red line). (C–F) show the 12 Size Bands (SB) trends of floc number, settling velocity, floc density and fractal dimensions for oil-Bentonite (dark purple) and EPS-oil-Bentonite (light purple) samples.
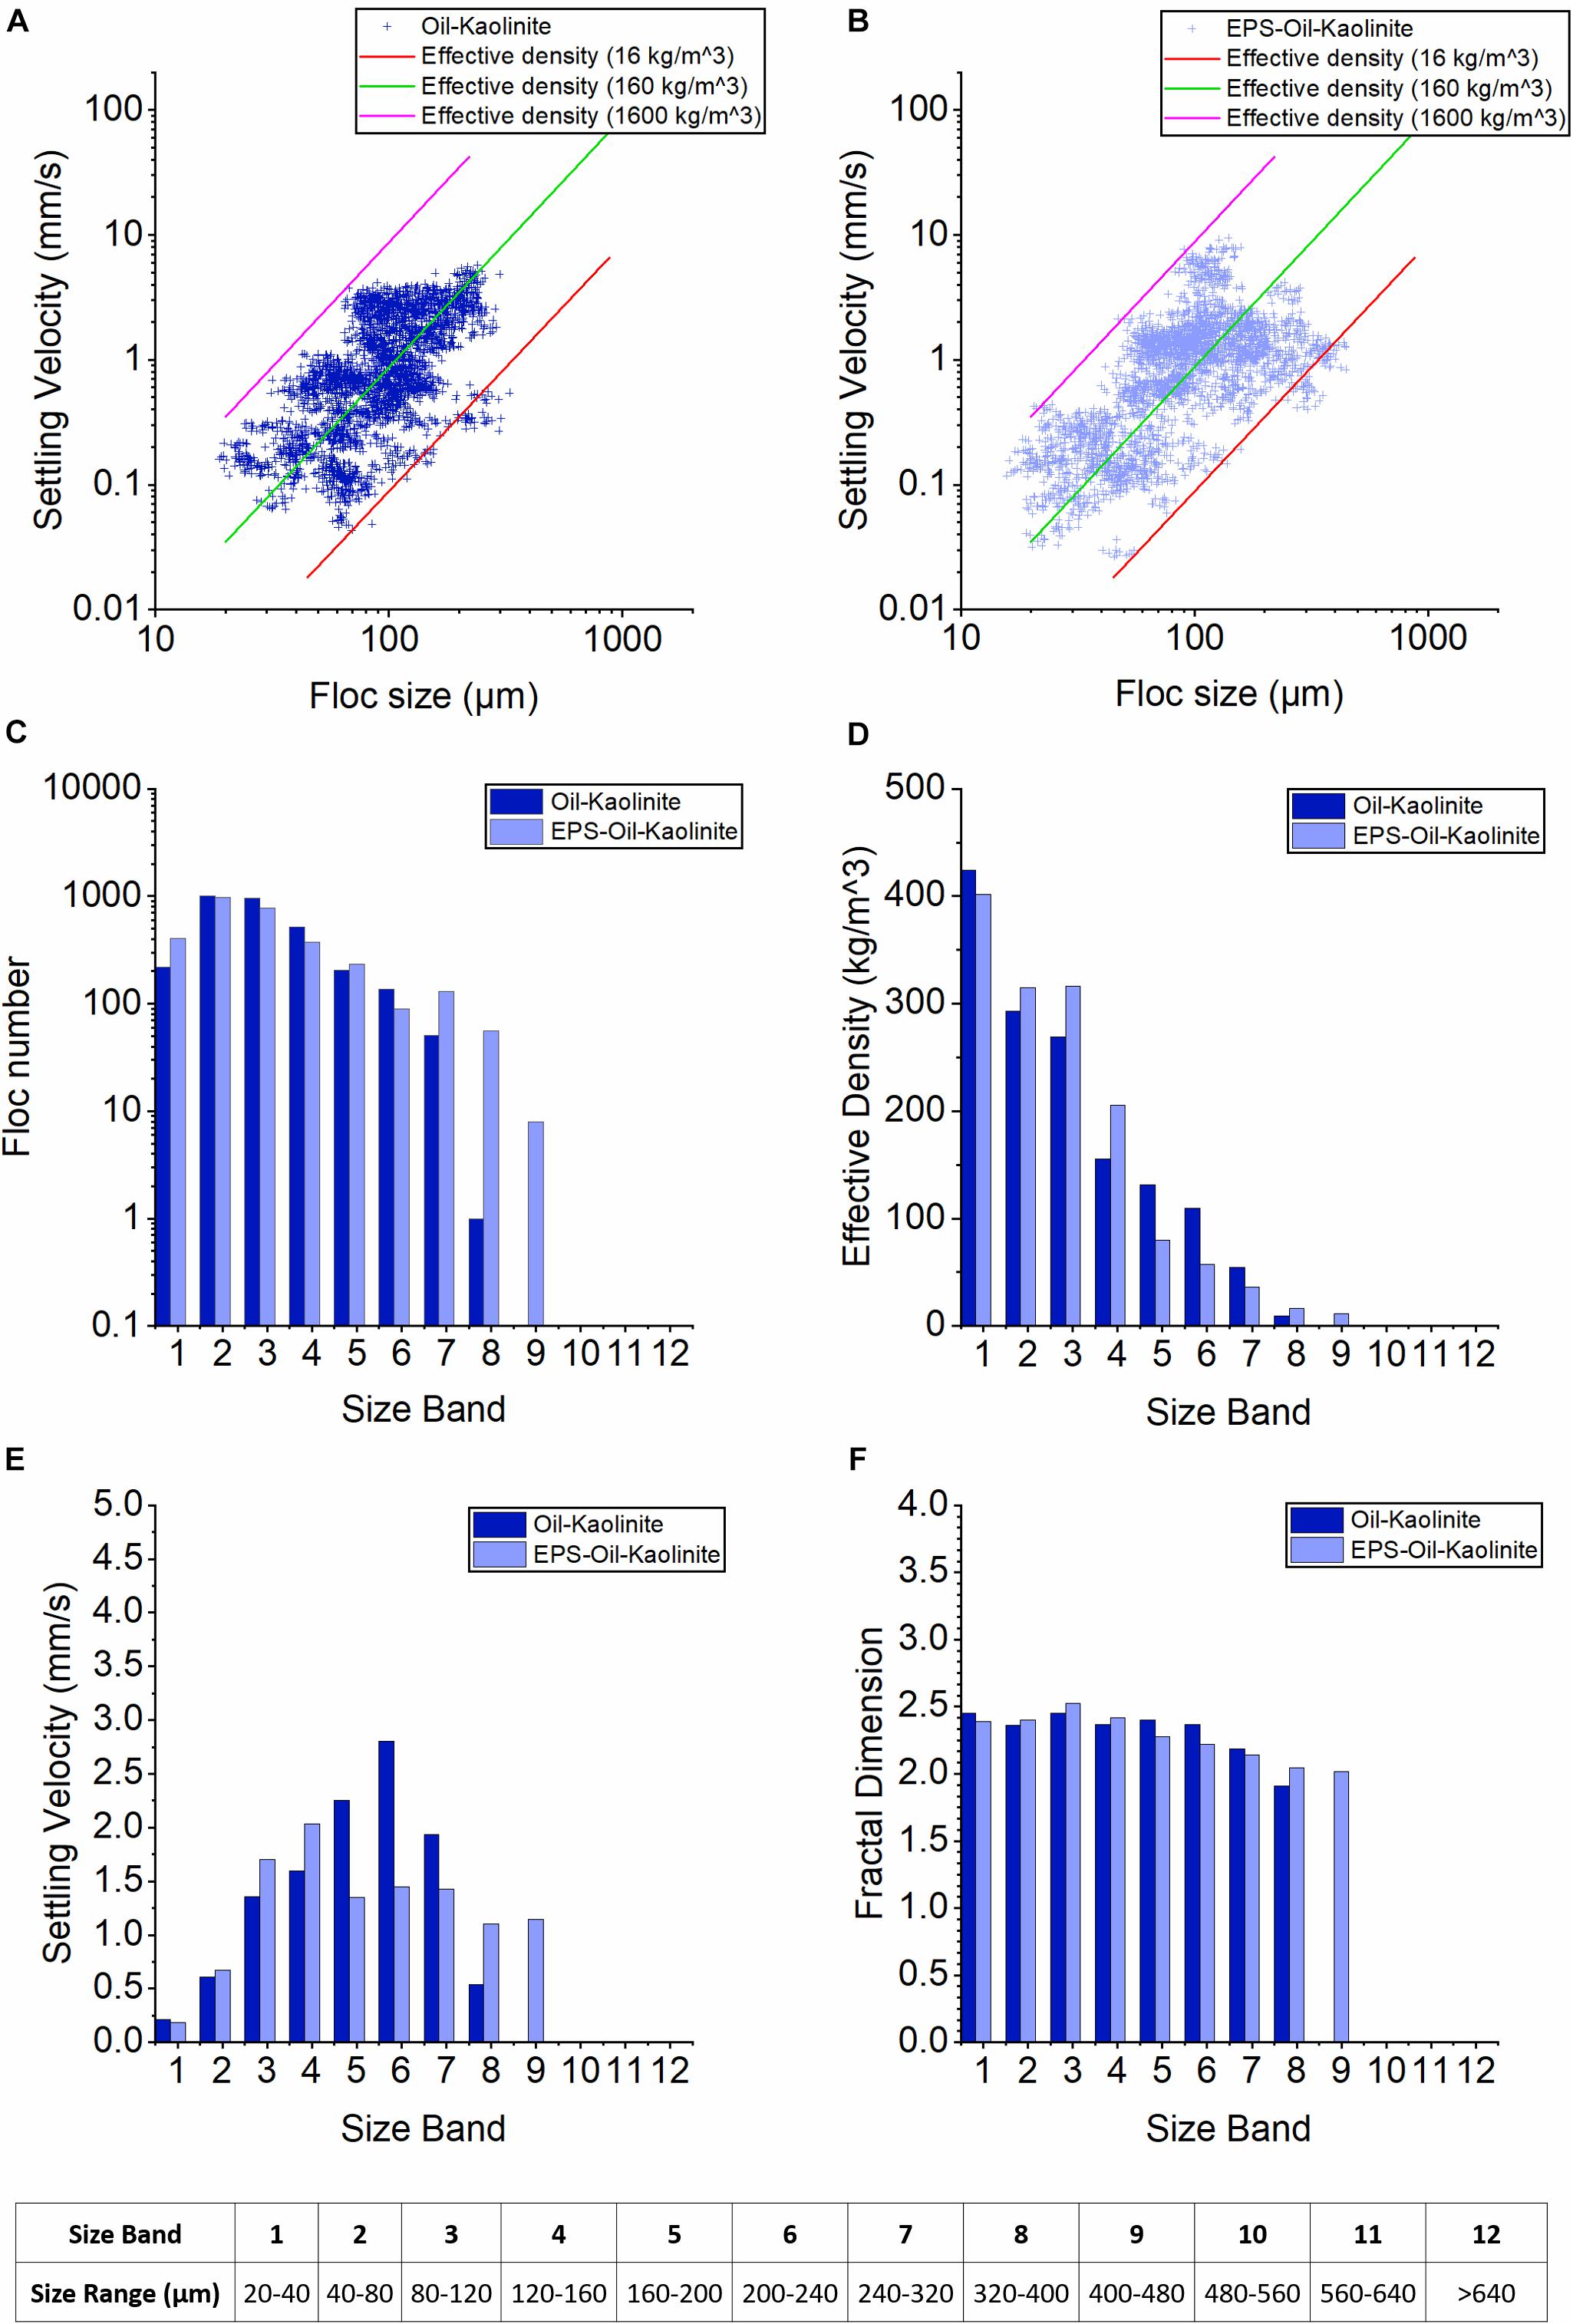
Figure 4. Floc characteristics from the LabSFLOC-2 analysis of Kaolinite cases. (A,B) show the plots of floc sizes vs. settling velocities of oil-Kaolinite and EPS-oil-Kaolinite, respectively. The three diagonal lines each represent contours of a constant effective density (calculated using Stokes Law) 1,600 kg/m3 (pink line, equivalent to a quartz particle), 160 kg/m3 (green) and 16 kg/m3 (red line). (C–F) show the 12 Size Bands (SB) trends of floc number, settling velocity, floc density and fractal dimensions for oil-Kaolinite (blue), EPS-oil-Kaolinite (light blue) samples.
The floc numbers for OMAB and EPS-OMAB are similar in SB4–7 (250∼300 in each SB). However, adding EPS clearly reduces the floc numbers in the two smallest size bands (SB2 and SB3), whilst generating even larger marcoflocs (now exceeding 560 microns) that extend into SBs11–12. The effective density generally decreases as floc size increases for both OMAB and EPS-OMAB cases (Figure 3D). Noticeably, the effective density of OMAB rapidly decreases by more than 50% as the floc population transits from SB2 to SB3, and then continues to gradually decrease through SB4 to SB10 (Figure 3D). For the small to medium-sized flocs in SB3–6, adding EPS notably increases the effective density, but in the larger-sized macrofloc of SBs8–10, the effective densities are significantly reduced compared with those of OMAB (Figure 3D). The introduction of EPS was intrinsic in the formation of the very large macroflocs present in SBs11–12 and thus the EPS also contributed to their very low floc effective densities; this will be examined further in the Discussion.
The settling velocity of OMAB shows a monotonically increasing trend from small to larger-sized SBs (Figure 3E), especially in SB8–10 where the settling velocities reach 5∼9 mm/s. This is because the decrease in effective density of OMAB is very mild in SB3–10, and hence these floc settling velocities were primarily controlled by floc size. However, due to the effect of EPS, the effective density of EPS-OMAB shows a more abrupt decrease with respect to increasing floc size. As a result, the settling velocities of the large macroflocs (SB7–11) of EPS-OMAB display a reduction in fall rate, and also indicate a relatively weak dependence on floc size (Figure 3E).
Generally, adding EPS tends to increase the settling velocity of smaller microflocs, and the variability of settling velocity as a function of floc size is much smaller in EPS-OMAB; these features are consistent with those observed in the kaolinite cases (C01 and C03). The fractal dimension of OMAB is around 2.2–2.3 (Figure 3F). In contrast, adding EPS increased the fractal dimension up to 2.5 in small-sized microflocs in SB1–2, but the value dropped to just below 2.0 in larger macroflocs in SB8–12. This trend is slightly more pronounced, but generally consistent with the kaolinite cases shown in Figure 4.
The floc sizes and settling velocities of the mixed oil-Kaolinite-Bentonite sample (OMAK–B, C03) ranges from 15 to 400 microns and 0.03 to 15 mm/s, respectively (Figure 5A). The stickier EPS-OMAK–B saw flocs sizes of 16–800 microns (C06) and settling velocities between 0.08 and 12 mm/s (Figure 5B). For Group #3 flocs, adding EPS slightly narrows the settling velocity range, presumably because EPS has the effect of rescinding the existence of droplet OMAs.
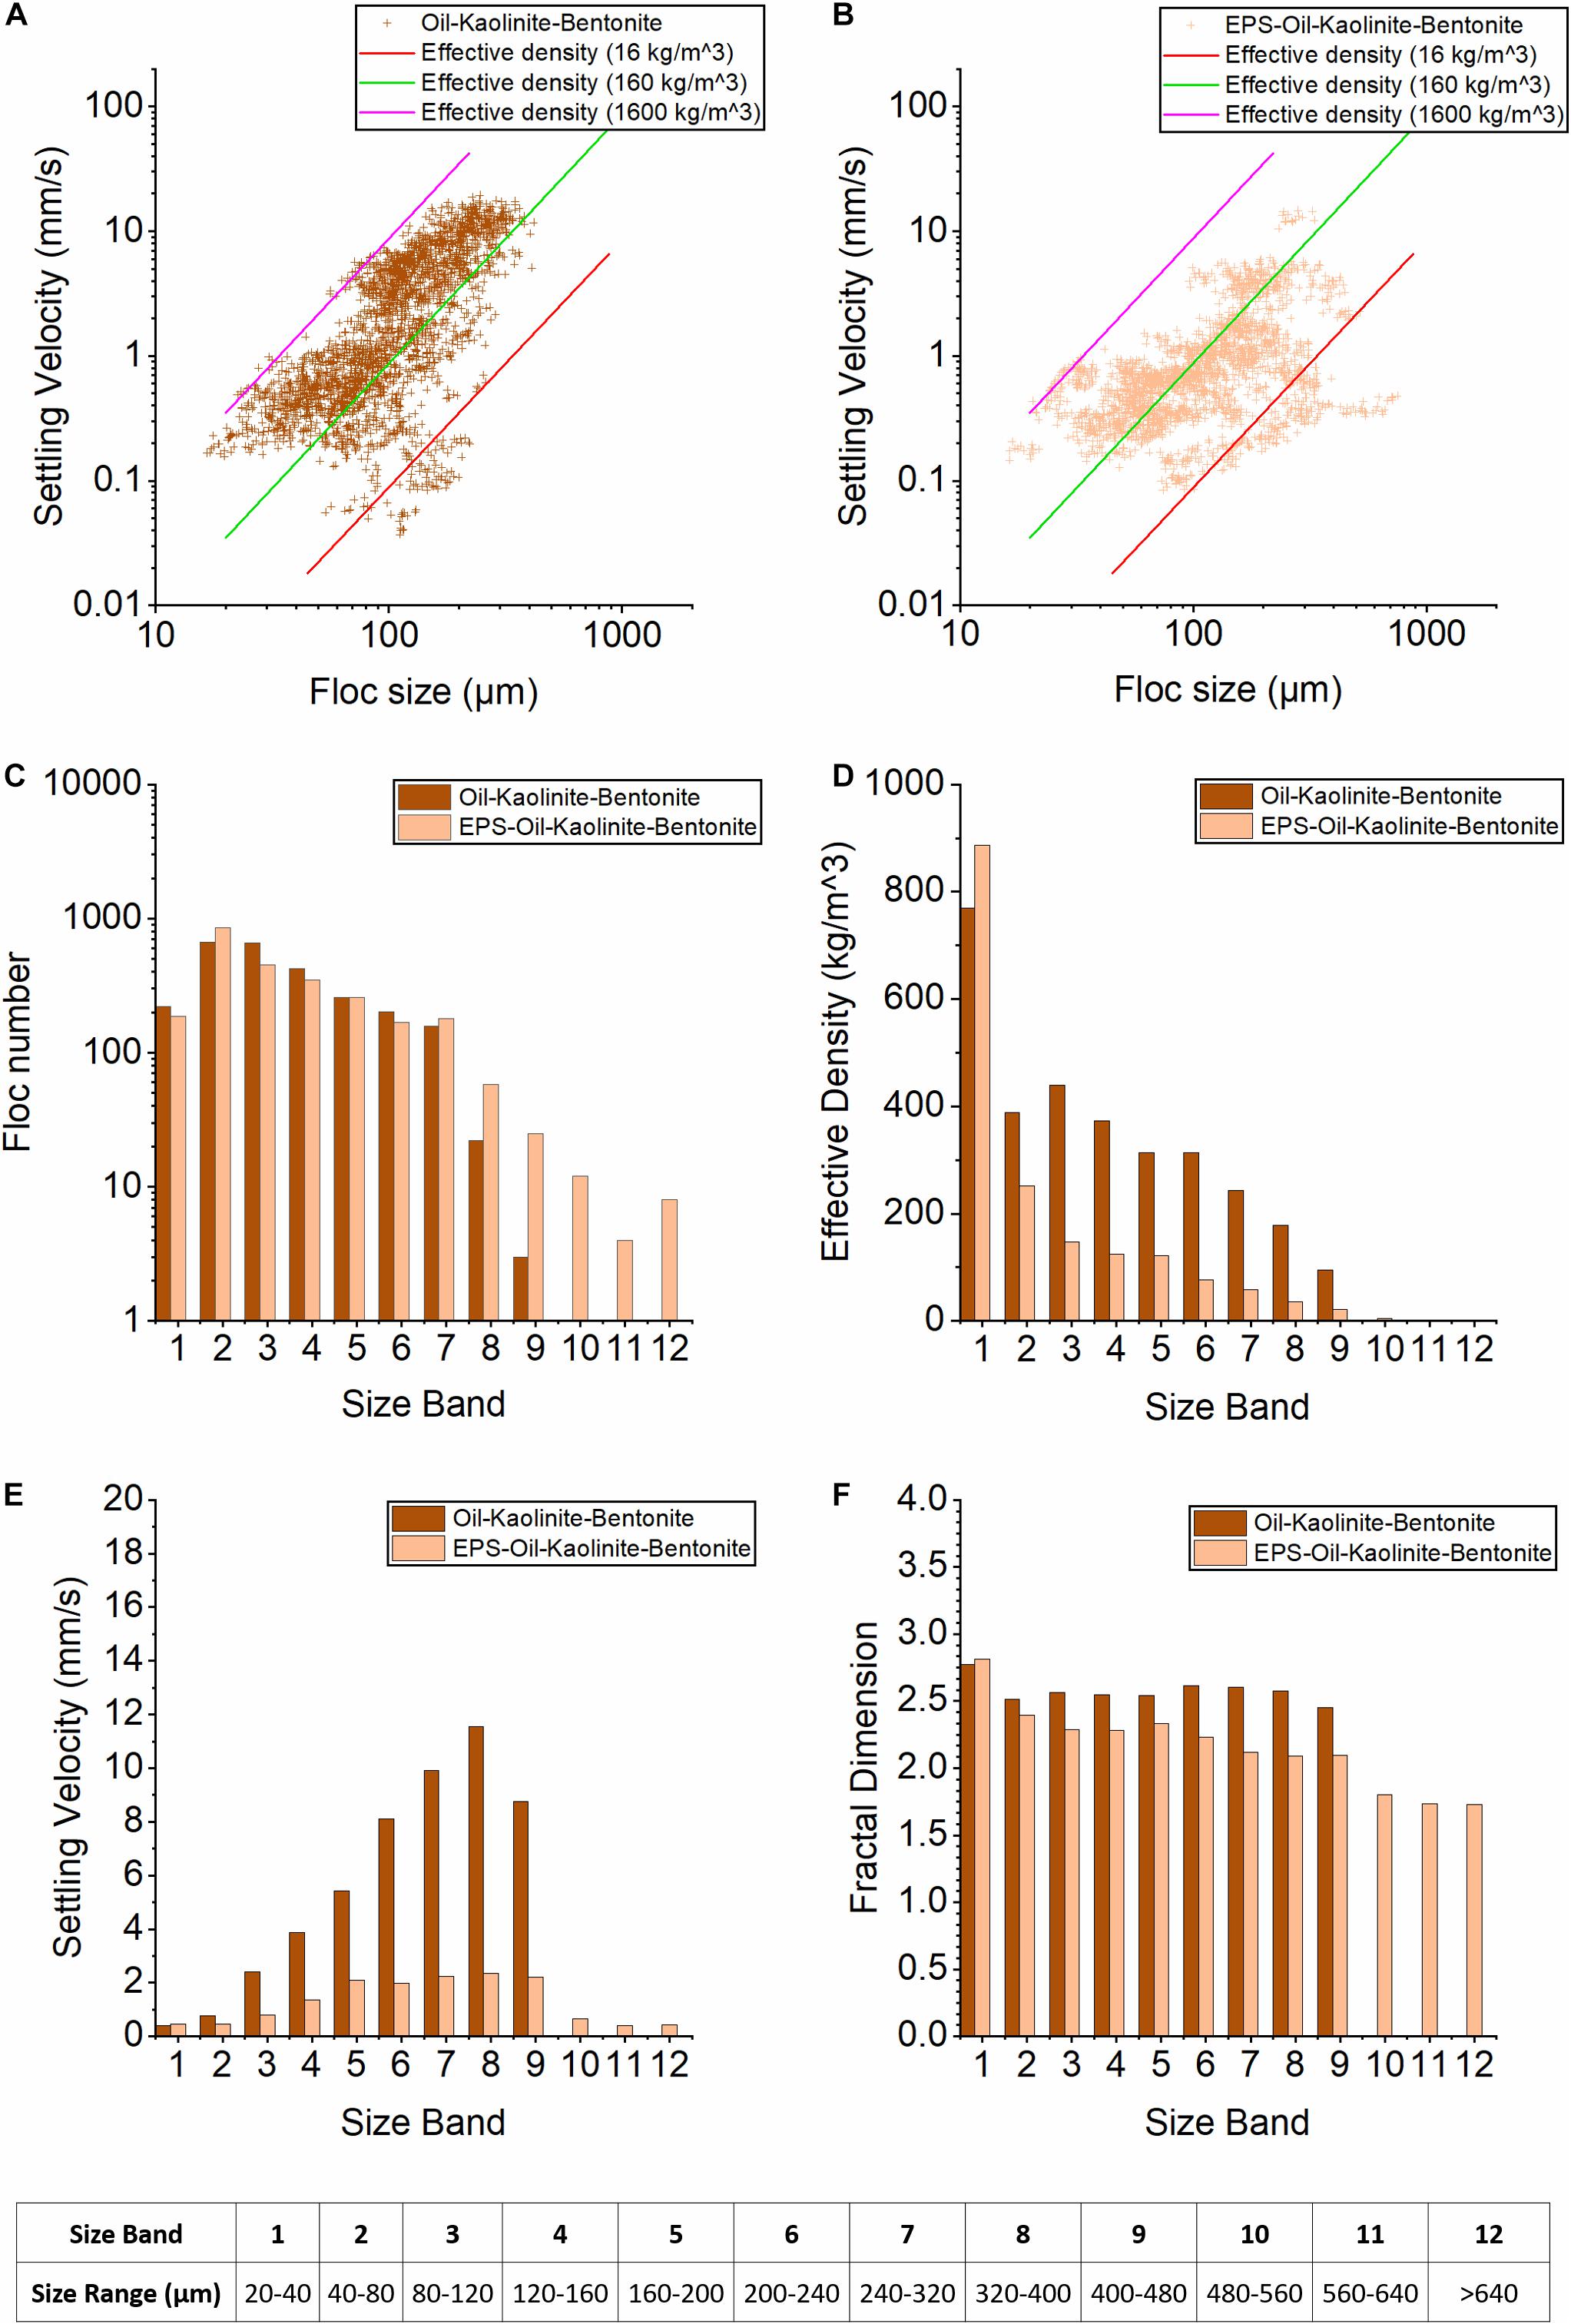
Figure 5. Floc characteristics from the LabSFLOC-2 analysis of mixed Kaolinite and Bentonite cases. (A,B) show the plots of floc sizes vs. settling velocities of oil-Kaolinite-Bentonite and EPS-oil-Kaolinite-Bentonite, respectively. The three diagonal lines each represent contours of a constant effective density (calculated using Stokes Law) of 1,600 kg/m3 (pink line, equivalent to a quartz particle), 160 kg/m3 (green), and 16 kg/m3 (red line). (C–F) show the 12 Size Bands (SB) trends of floc number, settling velocity, floc density, and fractal dimensions for oil-Kaolinite-Bentonite (dark orange) and EPS-oil-Kaolinite-Bentonite (orange) samples.
The floc numbers in both samples show peaks in SB2 (650 and 850 flocs, respectively) and then they both decrease with growing floc size (Figure 5C). However, it is evident that adding EPS to the suspension matrix produces more large-sized EPS-OMAK–B macroflocs in SB7∼9 (240–480 μm). The newly observed macroflocs in the upper size bands (SB10–12, > 480 μm), were consistent with the EPS-OMAK and EPS- OMAB reported earlier for Groups #1 and #2. The OMAK–B and EPS-OMAK–B samples both exhibit very high effective densities within SB1, when compared with the remainder of the SBs (Figure 5D). However, this particular feature was already present in the kaolinite-bentonite sample (without oil and EPS) reported by Ye et al. (2020), and it is ostensively an idiosyncratic feature associated with clay mineral mixtures. Consistent with other EPS cases (C04, C05), the addition of EPS to the suspension matrix appears to affect the interparticle bonding at that SB1size-scale and promote an increase in the floc effective density.
Although both cases show a gradual decrease in floc effective density as the population progresses from SB1 to SB12, the OMAK–B sample demonstrates an effective density 2–3 times higher than that present in the EPS-OMAK–B sample (Figure 5D). In particular, the flocs in SBs10–12 from the EPS-OMAK–B sample had extremely low effective densities of 4.6, 1.9, 1.6 kg/m3, respectively. Compared to OMAK–B sample, EPS-OMAK–B shows a much more gradual increase in settling velocities as the population grows from SB1 to SB8. Therefore, the OMAK–B shows a 3-fold faster settling velocity than the EPS- OMAK–B sample (Figure 5E). The overall range of EPS- OMAK–B settling velocity was predominantly between 1 and 2 mm/s. Again, by adding EPS to the suspension, this had the resultant effect of significantly reducing the variability of the settling velocity.
A peak fractal dimension of 2.75 was observed in SB1 for both cases. This is presumably due to the presence of numerous high effective density small flocs formed with the bentonite-kaolinite clay mixture. Beyond SB1, the OMAK–B sample depicts a relatively uniform fractal dimension around 2.5; while the EPS- OMAK–B sample shows a notably lower fractal dimension, which gradually reduces from 2.4 in SB2 to below 1.8 in SB12 (Figure 5F). Adding EPS produces many large but very low effective density macroflocs with fractal dimensions < 2.
The results presented suggest that the capability of flocs to contain oil droplets strongly depends on the stickiness of the constituents forming the floc. As shown in Ye et al. (2020), bentonite clay is more cohesive than kaolinite clay. This explains why bentonite flocs of sample C02, have two-times less free oil droplets remaining compared to kaolinite-based flocs. However, the high stickiness of EPS seems to play an even more significant role in increasing the potential for flocs to contain oil droplets, as adding EPS (see C04, C05, C06) reduced the number of free oil droplets by about a factor 2–3, when compared to a non-EPS counterpart (C01, C02, C03).
In addition to oil droplet numbers shown in Figure 2, microscopy image analysis also provides statistical trend information for both the OMAs and pure mineral flocs, and thus the total number of flocs can be obtained (Figures 6A–C) for each of the six samples. Clearly, droplets OMA can readily identified from the characteristic shape of oil droplets attached in OMAs. The solid and flake OMAs can be identified by their oily color (brown) in the OMA with dense structures that are different from those of pure mineral floc (Figure 1). Interestingly, all the samples show similar numbers of OMAs with variability within 15%, except for the EPS-oil-kaolinite sample (C04), which has about 50% higher number of OMAs than other samples (Figure 6A).
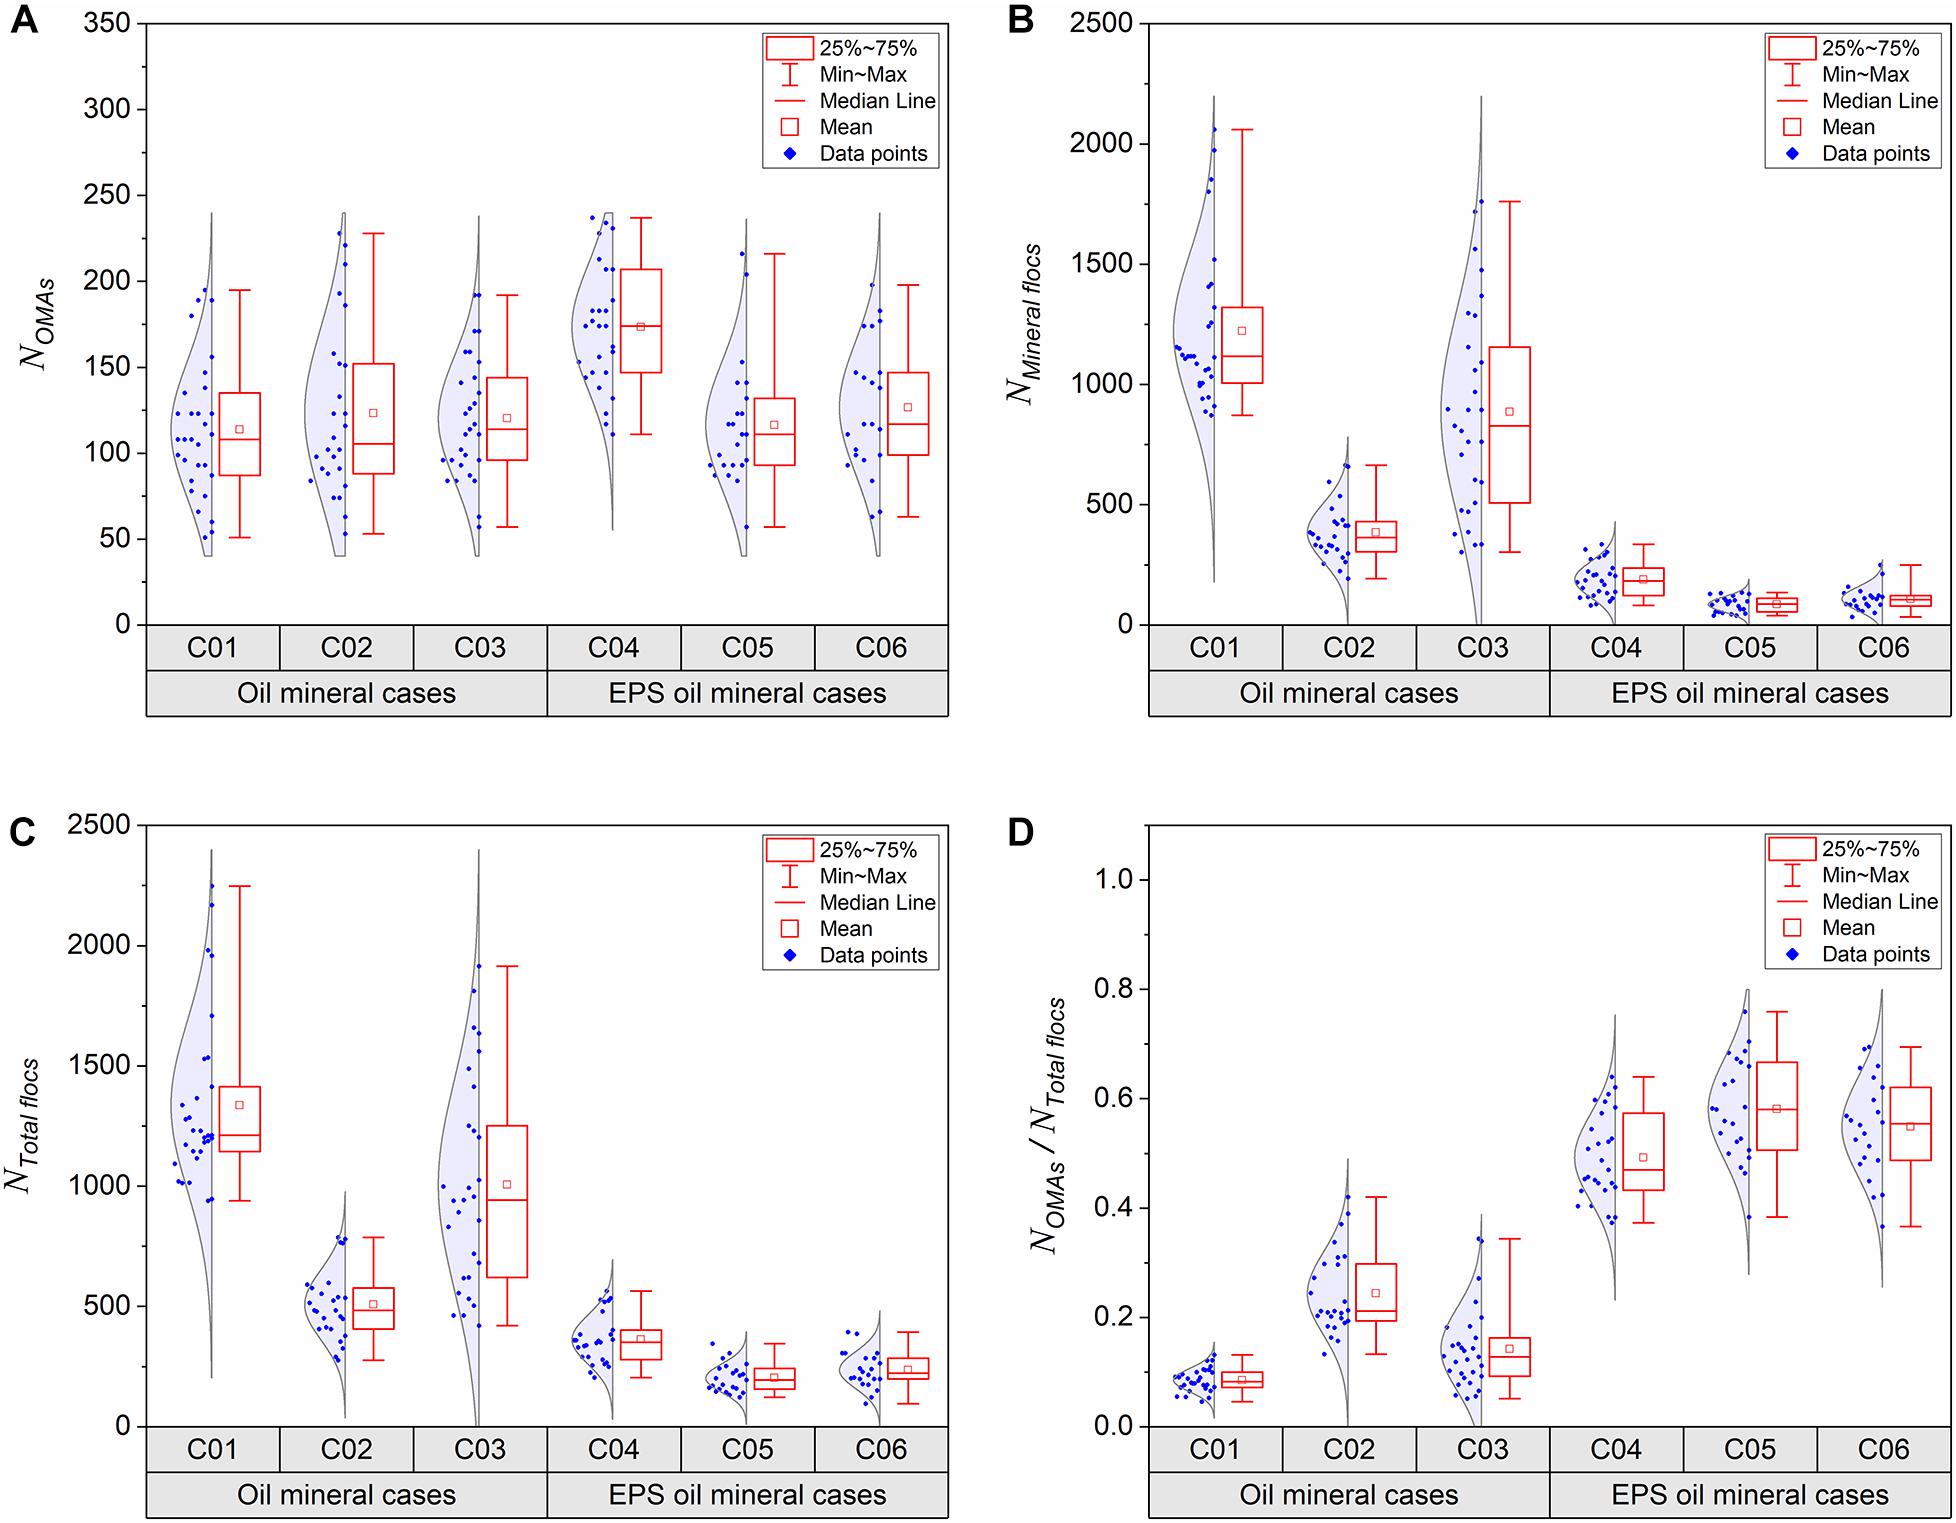
Figure 6. Box charts of oil-mineral aggregate numbers (A), pure mineral floc numbers (B), Total floc numbers (C), and ratios OMA to total floc numbers (D) in each experimental sample (C01–06, Table 1), analyzed by microscopy images collected from the bulk sediment mixture samples at the equilibrium. Each dot represents number obtain from an image and each sample was analyzed by 30 images randomly taken under microscope covering thousands of individual flocs statistically.
It is important to point out that for kaolinite sample C01, there is a significant number of mineral flocs, which is about 3 times more than that in the bentonite sample (C02, Figure 6B). As already discussed in Ye et al. (2020), a much smaller number of flocs present in the bentonite sample is due to bentonite clay’s high stickiness encouraging potential flocculation. Similarly, adding EPS to the suspension matrix in samples C04, C05 and C06 also crucially reduces the number of mineral flocs by a factor 4 for kaolinite (comparing C01 and C04), a factor 2 for Bentonite (comparing C02 and C05), and a 3-fold reduction for mixed kaolinite-bentonite samples (comparing C03 and C06). This also suggests that EPS encourages flocculation by notably increasing the stickiness of the floc structure, and thus the increase is particularly pronounced for the less cohesive kaolinite clay samples.
By summing the OMAs and pure mineral flocs present in each respective population (Figures 6A,B), we can calculate the total number flocs for each of the six cases (see Figure 6C). To evaluate the oil trapping efficiency, the ratio of OMAs numbers to total floc numbers for each of the six cases are shown in Figure 6D. All the EPS-oil-mineral samples (C04–06) have a much higher ratio of OMA (around 0.5–0.6) than those of oil-mineral samples (C01–03) without the EPS addition (around 0.1∼0.2); this advocates the superior capability of EPS in trapping oil droplets. Amongst all the six samples, the OMAK sample (C01) shows that OMAs only consist of less than 10% of the flocs present. This rises by 15% with OMAs accounting for one quarter of OMAB sample (C02). The inclusion of EPS (EPS-OMAB sample) further stimulated the development of OMAs to nominally 60% of the total flocs (see Figure 6D).
Since it is known that bentonite is more cohesive than kaolinite, while adding EPS also increases the floc stickiness considerably, it becomes evident that the stickiness of flocs and the number of OMAs are positively correlated. By adopting the assumption that we can utilse the ratio of OMA number to total floc number to quantitatively represent oil trapping efficiency. By adding sticky EPS to the oil-kaolinite sample (C04) significantly increase the number of OMAs to contribute about 45% of the total flocs, which is 5-fold increase in oil trapping efficiency. The addition of EPS to the oil-bentonite sample (C05), the OMA accounts for half of the total flocs, and when compared to that of C02, the oil trapping efficiency is only increased by a factor 2. A 4-fold oil trapping efficiency from adding EPS to a mixed kaolinite-bentonite matrix was observed when comparing samples C03 and C06.
Overall, the capability of flocs to contain oil droplets is highly dependent on stickiness. Bentonite clay is appreciably more cohesive than kaolinite clay minerals, and by adding EPS to the suspension matrix, it further magnifies flocculation potential and stickiness. It is also important to note that whilst pure kaolinite clay exhibits low stickiness, the addition of EPS can significantly enhance the stickiness. In summary, EPS plays a key role in increasing the stickiness of flocs, and its effect appears to overcome the natural stickiness of clay minerals. The importance of biological flocculation in OMAs has been recognized by an earlier review paper of Muschenheim and Lee (2002), and the results now presented provide quantitative evidence that EPS increases oil trapping efficiency.
Oil has been observed to exist in turbulent waters in the form of oil droplets, OMAs, and EPS-OMAs in our laboratory experiments (Figure 1). The results presented herein show the dramatic effects that biological cohesive EPS and physical mineral cohesive particles have on the flocculation with oil droplets in the seawater. The two types of natural common clay minerals, kaolinite and bentonite, each with different characteristic levels of particle stickiness (controls flocculation rate, Ye et al., 2020) have been seen to flocculate with oil droplets and thus easily form OMA with unique structures and characteristics.
The addition of EPS in oil-minerals mixture leads to the formation of very large-sized macroflocs which were absent in the samples lacking EPS. In addition, EPS also increases the effective density and settling velocity in small-sized microflocs, but demonstrated the opposite effect in larger-sized macroflocs (Figures 4D,E, 3D,E). The combination of oil and EPS increasing aggregate density when compared to oil-free samples, has also recently been reported by Passow et al. (2019). In the mixed kaolinite and bentonite cases, a reduction of both effective density and settling velocity is observed for almost all the size bands when adding EPS into the oil-mineral suspension mixture (Figures 5D,E). While the stickiness of mineral particles in isolation has significant effects on determining the unique structure and settling velocity of OMAs, the inclusion of EPS within the flocculation matrix not only further enhances the stickiness character of suspended materials, but also directly determines the final form of an aggregate. The unique role of biological stickiness in dominating the flocculation of suspended minerals and oil droplets in seawater requires further quantitative investigations. These important floc characteristics are directly related to the OMA structures, and this finding is discussed in more detail next.
When comparing kaolinite and bentonite clays, notably more oil participates in bentonite OMA flocculation (i.e., much less free oil droplets left, see Figure 2), and the number of OMA occupies a larger percentage of the total flocs observed in bentonite samples (Figure 6D). With the greater stickiness and flocculation potential of bentonite mineral particles (Ye et al., 2020), pure bentonite flocs generally have much larger sizes and higher porosities than their kaolinite floc equivalents. With adequate stirring time in seawater, the more porous bentonite flocs can absorb more oil within the aggregate structure; meanwhile the original fluffy mineral flocs, after absorbing oil, become more compact and form the flake/solid OMAs (Ye et al., 2020, see also Figure 1C). Compared with kaolinite particles, which simply attach to the oil droplets surface to form droplet OMAs (see Figure 1B), the same amount of bentonite shows a much higher capability to absorb oil into OMA than kaolinite. This explains why more oil droplets are contained in OMAs, and thus less free oil droplets remain in the bentonite sample cases (Figure 2). With the same turbulent flow energy, more oil droplets are potentially more likely to collide and be captured by larger bentonite macroflocs, than those smaller flocs in kaolinite cases.
In the previous study of Ye et al. (2020), the significant differences in floc density and settling velocity between kaolinite OMAs and bentonite OMAs were attributed to clay stickiness and floc structure. Particularly, the less naturally cohesive kaolinite and oil tend to form droplet OMAs which produce many low-density flocs in the larger size bands, whilst the more cohesive bentonite produces relatively dense (relative to pure bentonite flocs) flake/solid OMAs. Here, we observed that EPS also has a substantial effect in controlling the floc structure. Particularly, the droplet OMAs are no longer observed in kaolinite flocs when EPS is added. Therefore, the main difference due to clay-type observed in Ye et al. (2020) is not obvious once EPS is participating in the flocculation process. The overall floc characteristics seem to be dictated by EPS, and the settling velocity is in the vicinity of 1 mm/s for EPS-OMAK and 2 mm/s for EPS-OMAB (Figures 4, 3).
The function of biological EPS in flocculation is unique and different from that of mineral particles. Unlike the London-van der Waals forces and inter-particle electrostatic bonding between pure mineral particle flocculation, or the surface attaching and the porous absorbing between mineral flocs and oil droplets, the fixative form of EPS in an aquatic suspension can effectively trap oil droplets, OMAs, and mineral particles/flocs all into mixed EPS-OMA. It is expected that the collisional efficiency and flocculation potential improve with increased EPS during high turbulent flow episodes. This is confirmed by the observation of a dramatic reduction of the oil droplets numbers and the amount remaining in the samples of EPS-OMAs (such as C04–06) after the turbulent stirring duration (Figure 2). Although EPS-OMA could be broken-up at some point with the high flow turbulence, their secondary flocculating capability through further collisions during agitation can be much higher than those samples void of EPS, because of the highly sticky EPS still present in each fractured floc unit.
The capability of mineral particles or EPS in aggregating oil into flocs, and the quantification of their effective density and settling velocity, are all vitally important when predicting the fate of spilled oil (e.g., Daly et al., 2016; Dukhovskoy et al., this issue). From the microscopy observations, EPS tends to bind around oil or mineral units via a sticky web-like structure which largely enhances the total stickiness between the particles or floc units. As long as the EPS attaches within OMAs, the flocs can be hard to break up and became more stable when compare with non-EPS flocs. Therefore the involvement of EPS, means fewer oil droplets can be left isolated and larger OMAs are obtained than those for equivalent non-EPS cases (Figure 5A). Interestingly, although more oil droplets may participate in EPS-OMA flocculation, the numbers of OMAs may not increase (Figure 5B) because the higher stickiness level significantly enhance the size of EPS-OMA (∼800 microns) rather than the EPS-OMA numbers. This feature is particularly pronounced in bentonite cases, as they already demonstrate a naturally high mineral stickiness. Ye et al. (2020) quantified several key differences in the OMAs formed by pure bentonite clay and pure kaolinite clay due to mineral stickiness. A key finding from the present study further suggests that the sticky web structure provided by EPS dominates the stickiness already provided by the clay mineral, and hence when EPS is present, the variability of OMA physical properties may be less pronounced. A direct result of the EPS domination in the flocculation processes relevant to the sinking of oil, as reveal by the present study (see Figures 4E, 3E, 5E), is that it tends to produce a more homogeneous floc settling velocity variability across the entire floc size spectrum.
With the addition of EPS to the suspension matrix, the oil droplets may be dispersed (i.e., the droplet size becomes smaller; compare Figures 1A,E) and persist within EPS structures as stabilized droplets. This is consistent with the recent findings that EPS may reduce surface tension, and hence function in a similar way as chemical dispersants (e.g., Schwehr et al., 2018; Xu et al., 2019). We like to point out that the artificial EPS and oil droplets investigated here are both carbon rich and nutrient depleted, and adding further nutrients may be effective in enhancing microbial degradation on oil following EPS-OMAs flocculation (Quigg et al., 2016). With its low cost and non-toxic characteristics, EPS may become a more efficient alternative way of dealing with the oil spills, and with none of the detrimental secondary environmental contamination of current chemical approaches to oil spills. It is also important to incorporate the effect of EPS in the understanding of the fate of spilt oil and spill management.
In this study, we utilized a high-resolution microscope and a LabSFLOC-2 system to investigate the structures and characteristics of EPS-OMA, and the unique effect of biological stickiness on the OMA formation. This study quantitatively reveals that the inclusion of EPS in the suspension matrix (not generally considered in previous OMA studies), leads to flake/solid OMAs formation and this has a dramatic effect on both the trapping and stabilization of oil droplets in OMAs. Both EPS-oil-kaolinite aggregates and EPS- oil-bentonite aggregates show a similar mixed flaky structure in lieu of droplets OMAs. However, the bentonite cases show larger sized EPS-OMAs (∼900 microns) than those of equivalent kaolinite cases (∼400 microns). The EPS-OMA density and settling velocity, show an increase in smaller sized microflocs and a corresponding reduction in larger sized flocs for all the pure mineral samples.
Overall, the addition of EPS reduces the variability of settling velocity as a function of floc size and clay mineral type. Since EPS is ubiquitous in natural marine environments, and it is one of the most important biologically cohesive materials in the aquatic system, it’s role in adsorbing oil, attaching minerals, forming EPS-OMAs and influencing the fate of oil, all needs to be incorporated in future spill modeling approaches. To expand the study for oil spill mitigation, the effect of chemical dispersants would require further investigated. More scenarios representative of combinations of lower levels of cohesive sediment concentrations, less EPS, and lower turbulent energy, should all be also studied in order to improve oil spill modeling predictions within those natural aquatic zones.
The datasets presented in this study can be found in online repositories. The names of the repository/repositories and accession number(s) can be found below: https://data.gulfresearchinitiative.org (doi: 10.7266/n7-0nav-gs95).
T-JH, AM, and LY organized the research and experiments. JH, JP-G, and LY conducted the laboratory work. AM helped the LabSFLOC-2 data analysis. LY wrote up and revised the manuscript draft. T-JH and AM helped to comment and revise the manuscript. All authors contributed to the article and approved the submitted version.
AM was employed by HR Wallingford Ltd., United Kingdom.
The remaining authors declare that the research was conducted in the absence of any commercial or financial relationships that could be construed as a potential conflict of interest.
This research was made possible by a grant from the Gulf of Mexico Research Initiative to support CSOMIO (Consortium for Simulation of Oil-Microbial Interactions in the Ocean) (Grant no. SA18-10), and in part by the National Science Foundation OCE-1924532. AM’s contribution toward this research was also partly supported by the National Science Foundation grant OCE-1736668, and HR Wallingford company research FineScale project (Grant no. ACK3013_62). HR Wallingford. HR Wallingford was not involved in the study design, collection, analysis, interpretation of data, the writing of this article or the decision to submit it for publication. LY’s contribution was also partly supported by Southern Marine Science and Engineering Guangdong Laboratory (Zhuhai) (No. 311020003).
Atlas, R. M. (1995). Petroleum biodegradation and oil spill bioremediation. Mar. Pollut. Bull. 31, 178–182. doi: 10.1016/0025-326x(95)00113-2
Atlas, R. M., and Bartha, R. (1992). “Hydrocarbon biodegradation and oil spill bioremediation,” in Advances in Microbial Ecology, ed. K. C. Marshall (Boston, MA: Springer), 287–338. doi: 10.1007/978-1-4684-7609-5_6
Atlas, R. M., and Hazen, T. C. (2011). Oil biodegradation and bioremediation: a tale of the two worst spills in us history. Environ. Sci. Technol. 45, 6709–6715. doi: 10.1021/es2013227
Barbier, E. B., Hacker, S. D., Kennedy, C., Koch, E. W., Stier, A. C., and Silliman, B. R. (2011). The value of estuarine and coastal ecosystem services. Ecol. Monogr. 81, 169–193.
Crone, T. J., and Tolstoy, M. (2010). Magnitude of the 2010 gulf of Mexico oil leak. Science 330, 634–634. doi: 10.1126/science.1195840
Cui, L., Harris, C. K., and Tarpley, D. R. N. (2021). Formation of Oil – Particle-Aggregates (OPAs): Numerical Model Formulation and Calibration. Frontiers in Marine Science. In revision.
Daly, K. L., Passow, U., Chanton, J., and Hollander, D. (2016). Assessing the impacts of oil associated marine snow formation and sedimentation during and after the deep water horizon oil spill. Anthropocene 13, 18–33. doi: 10.1016/j.ancene.2016.01.006
Doshi, B., Sillanpää, M., and Kalliola, S. (2018). A review of bio-based materials for oil spill treatment. Water Res. 135, 262–277. doi: 10.1016/j.watres.2018.02.034
Engel, A. (2000). The role of transparent exopolymer particles (TEP) in the increase in apparent particle stickiness (α) during the decline of a diatom bloom. J. Plankton Res. 22, 485–497. doi: 10.1093/plankt/22.3.485
Fisher, C. R., Montagna, P. A., and Sutton, T. T. (2016). How did the Deepwater Horizon oil spill impact deep-sea ecosystems? Oceanography 29, 182–195. doi: 10.5670/oceanog.2016.82
Fu, J., Gong, Y., Zhao, X., O’reilly, S. E., and Zhao, D. (2014). Effects of oil and dispersant on formation of marine oil snow and transport of oil hydrocarbons. Environ. Sci. Technol. 48, 14392–14399. doi: 10.1021/es5042157
Hill, P. S., and Nowell, A. R. M. (1990). The potential role of large, fast-sinking particles in clearing nepheloid layers. Philos. Trans. R. Soc. Lond. Ser. A Math. Phys. Sci. 331, 103–117. doi: 10.1098/rsta.1990.0059
Hoang, A. T., Pham, V. V., and Nguyen, D. N. (2018). A report of oil spill recovery technologies. Int. J. Appl. Eng. Res. 13, 4915–4928.
Keyvani, A., and Strom, K. (2014). Influence of cycles of high and low turbulent shear on the growth rate and equilibrium size of mud flocs. Mar. Geol. 354, 1–14. doi: 10.1016/j.margeo.2014.04.010
Khelifa, A., Stoffyn-Egli, P., Hill, P. S., and Lee, K. (2002). Characteristics of oil droplets stabilized by mineral particles: effects of oil type and temperature. Spill Sci. Technol. Bull. 8, 19–30. doi: 10.1016/s1353-2561(02)00117-2
Kingston, P. F. (2002). Long-term environmental impact of oil spills. Spill Sci. Technol. Bull. 7, 53–61. doi: 10.1016/s1353-2561(02)00051-8
Kleindienst, S., Paul, J. H., and Joye, S. B. (2015). Using dispersants after oil spills: impacts on the composition and activity of microbial communities. Nat. Rev. Microbiol. 13, 388–396. doi: 10.1038/nrmicro3452
Kujawinski, E. B., Kido Soule, M. C., Valentine, D. L., Boysen, A. K., Longnecker, K., and Redmond, M. C. (2011). Fate of dispersants associated with the Deepwater Horizon oil spill. Environ. Sci. Technol. 45, 1298–1306.
Lubchenco, J., McNutt, M. K., Dreyfus, G., Murawski, S. A., Kennedy, D. M., Anastas, P. T., et al. (2012). Science in support of the Deepwater Horizon response. Proc. Natl. Acad. Sci. U.S.A. 109, 20212–20221.
Malarkey, J., Baas, J. H., Hope, J. A., Aspden, R. J., Parsons, D. R., Peakall, J., et al. (2015). The pervasive role of biological cohesion in bedform development. Nat. Commun. 6, 1–6.
Malpezzi, M. A., Sanford, L. P., and Crump, B. C. (2013). Abundance and distribution of transparent exopolymer particles in the estuarine turbidity maximum of Chesapeake Bay. Mar. Ecol. Prog. Ser. 486, 23–35. doi: 10.3354/meps10362
Manning, A., and Schoellhamer, D. (2013). Factors controlling floc settling velocity along a longitudinal estuarine transect. Mar. Geol. 345, 266–280. doi: 10.1016/j.margeo.2013.06.018
Manning, A. J., and Dyer, K. R. (2007). Mass settling flux of fine sediments in Northern European estuaries: measurements and predictions. Mar. Geol. 245, 107–122. doi: 10.1016/j.margeo.2007.07.005
Manning, A. J., Friend, P. L., Prowse, N., and Amos, C. L. (2007). Preliminary findings from a study of Medway Estuary (UK) natural mud floc properties using a laboratory mini-flume and the LabSFLOC system. Continent. Shelf Res. 27, 1080–1095. doi: 10.1016/j.csr.2006.04.011
Manning, A. J., Langston, W. J., and Jonas, P. J. C. (2010). A review of sediment dynamics in the Severn Estuary: influence of flocculation. Mar. Pollut. Bull. 61, 37–51. doi: 10.1016/j.marpolbul.2009.12.012
Manning, A. J., Whitehouse, R. J. S., and Uncles, R. J. (2017). “Suspended particulate matter: the measurements of flocs,” in ECSA Practical Handbooks on Survey and Analysis Methods: Estuarine and Coastal Hydrography and Sedimentology, Chapter 8, eds R. J. Uncles and S. Mitchell (Cambridge: Cambridge University Press), 211–260. doi: 10.1017/9781139644426
McNutt, M. K., Camilli, R., Crone, T. J., Guthrie, G. D., Hsieh, P. A., Ryerson, T. B., et al. (2012). Review of flow rate estimates of the Deepwater Horizon oil spill. Proc. Natl. Acad. Sci. U.S.A. 109, 20260–20267.
Michel, J., Owens, E. H., Zengel, S., Graham, A., Nixon, Z., Allard, T., et al. (2013). Extent and degree of shoreline oiling: Deepwater Horizon oil spill, Gulf of Mexico, USA. PLoS One 8:e65087. doi: 10.1371/journal.pone.0065087
Muschenheim, D. K., and Lee, K. (2002). Removal of oil from the sea surface through particulate interactions: review and prospectus. Spill Sci. Technol. Bull. 8, 9–18. doi: 10.1016/s1353-2561(02)00129-9
Parsons, D. R., Schindler, R. J., Hope, J. A., Malarkey, J., Baas, J. H., Peakall, J., et al. (2016). The role of biophysical cohesion on subaqueous bed form size. Geophys. Res. Lett. 43, 1566–1573. doi: 10.1002/2016gl067667
Passow, U. (2012). The abiotic formation of TEP under different ocean acidification scenarios. Mar. Chem. 128, 72–80. doi: 10.1016/j.marchem.2011.10.004
Passow, U., and Alldredge, A. L. (1995). A dye−binding assay for the spectrophotometric measurement of transparent exopolymer particles (TEP). Limnol. Oceanogr. 40, 1326–1335. doi: 10.4319/lo.1995.40.7.1326
Passow, U., Sweet, J., Francis, S., Xu, C., Dissanayake, A. L., Lin, Y.-Y., et al. (2019). Incorporation of oil into diatom aggregates. Mar. Ecol. Prog. Ser. 612, 65–86. doi: 10.3354/meps12881
Passow, U., Sweet, J., and Quigg, A. (2017). How the dispersant Corexit impacts the formation of sinking marine oil snow. Mar. Pollut. Bull. 125, 139–145. doi: 10.1016/j.marpolbul.2017.08.015
Passow, U., and Ziervogel, K. (2016). Marine snow sedimented oil released during the Deepwater Horizon spill. Oceanography 29, 118–125. doi: 10.5670/oceanog.2016.76
Passow, U., Ziervogel, K., Asper, V., and Diercks, A. (2012). Marine snow formation in the aftermath of the Deepwater Horizon oil spill in the Gulf of Mexico. Environ. Res. Lett. 7:035301. doi: 10.1088/1748-9326/7/3/035301
Peterson, C. H., Rice, S. D., Short, J. W., Esler, D., Bodkin, J. L., Ballachey, B. E., et al. (2003). Long-term ecosystem response to the exxon valdez oil spill. Science 302, 2082–2086. doi: 10.1126/science.1084282
Quigg, A., Passow, U., Chin, W. C., Xu, C., Doyle, S., Bretherton, L., et al. (2016). The role of microbial exopolymers in determining the fate of oil and chemical dispersants in the ocean. Limnol. Oceanogr. Lett. 1, 3–26. doi: 10.1002/lol2.10030
Radoviæ, J. R., Domínguez, C., Laffont, K., Díez, S., Readman, J. W., Albaigés, J., et al. (2012). Compositional properties characterizing commonly transported oils and controlling their fate in the marine environment. J. Environ. Monit. 14, 3220–3229. doi: 10.1039/c2em30385j
Romero, I. C., Toro-Farmer, G., Diercks, A.-R., Schwing, P., Muller-Karger, F., Murawski, S., et al. (2017). Large-scale deposition of weathered oil in the gulf of Mexico following a deep-water oil spill. Environ. Pollut. 228, 179–189. doi: 10.1016/j.envpol.2017.05.019
Schwehr, K. A., Xu, C., Chiu, M.-H., Zhang, S., Sun, L., Lin, P., et al. (2018). Protein/polysaccharide ratio in exopolymeric substances controlling the surface tension of seawater in the presence or absence of surrogate Macondo Oil with and without Corexit. Mar. Chem. 206, 84–92. doi: 10.1016/j.marchem.2018.09.003
Stoffyn-Egli, P., and Lee, K. (2002). Formation and characterization of oil mineral aggregates. Spill Sci. Technol. Bull. 8, 31–44. doi: 10.1016/s1353-2561(02)00128-7
Teal, J. M., and Howarth, R. W. (1984). Oil spill studies: a review of ecological effects. Environ. Manag. 8, 27–43. doi: 10.1007/b/bf01867871
Tolhurst, T. J., Gust, G., and Paterson, D. M. (2002). The influence of an extracellular polymeric substance (EPS) on cohesive sediment stability. Proc. Mar. Sci. 5, 409–425. doi: 10.1016/s1568-2692(02)80030-4
Xu, C., Chin, W. C., Lin, P., Chen, H. M., Lin, P., Chiu, M. C., et al. (2019). Marine Gels, Extracellular Polymeric Substances (EPS) and Transparent Exopolymeric Particles (TEP) in natural seawater and seawater contaminated with a water accommodated fraction of Macondo oil surrogate. Mar. Chem. 215, 1010–1016.
Ye, L., Manning, A. J., and Hsu, T. J. (2020). Oil-mineral flocculation and settling velocity in saline water. Water Res. 173, 115569. doi: 10.1016/j.watres.2020.115569
Ye, L., Manning, A. J., Hsu, T.-J., Morey, S., Chassignet, E. P., and Ippolito, T. A. (2018). Novel application of laboratory instrumentation characterizes mass settling dynamics of oil-mineral aggregates (OMAs) and oil-mineral-microbial interactions. Mar. Technol. Soc. J. 52, 87–90. doi: 10.4031/MTSJ.52.6.14
Keywords: biophysical stickiness, extracellular polymeric substance (EPS), oil-mineral aggregates (OMAs), flocculation, settling velocity
Citation: Ye L, Manning AJ, Holyoke J, Penaloza-Giraldo JA and Hsu T-J (2021) The Role of Biophysical Stickiness on Oil-Mineral Flocculation and Settling in Seawater. Front. Mar. Sci. 8:628827. doi: 10.3389/fmars.2021.628827
Received: 13 November 2020; Accepted: 17 February 2021;
Published: 09 March 2021.
Edited by:
Xiaoshan Zhu, Tsinghua University, ChinaReviewed by:
Jia-Jang Hung, National Sun Yat-sen University, TaiwanCopyright © 2021 Ye, Manning, Holyoke, Penaloza-Giraldo and Hsu. This is an open-access article distributed under the terms of the Creative Commons Attribution License (CC BY). The use, distribution or reproduction in other forums is permitted, provided the original author(s) and the copyright owner(s) are credited and that the original publication in this journal is cited, in accordance with accepted academic practice. No use, distribution or reproduction is permitted which does not comply with these terms.
*Correspondence: Leiping Ye, eWVsZWlwaW5nQG1haWwuc3lzdS5lZHUuY24=
Disclaimer: All claims expressed in this article are solely those of the authors and do not necessarily represent those of their affiliated organizations, or those of the publisher, the editors and the reviewers. Any product that may be evaluated in this article or claim that may be made by its manufacturer is not guaranteed or endorsed by the publisher.
Research integrity at Frontiers
Learn more about the work of our research integrity team to safeguard the quality of each article we publish.