
95% of researchers rate our articles as excellent or good
Learn more about the work of our research integrity team to safeguard the quality of each article we publish.
Find out more
ORIGINAL RESEARCH article
Front. Mar. Sci. , 18 February 2021
Sec. Coastal Ocean Processes
Volume 8 - 2021 | https://doi.org/10.3389/fmars.2021.624392
This article is part of the Research Topic Island Dynamical Systems: Atmosphere, Ocean and Biogeochemical Processes View all 13 articles
The present study assesses the thermal variability of the regional ocean around Madeira Island, in intraseasonal and interdecadal time scales, using a 35-year (1983–2017), 3-km horizontal resolution ocean simulation forced by a co-located atmospheric simulation, with SODA and ERA5 boundary and initial conditions, respectively. Atmosphere–ocean interactions in this region are found to be driven by the variability of two quasi-permanent tip-jets, located at the island west and east tips, especially during the summer months. The ocean response is found to be larger in the regions of higher jets speed variability, but its thermal response is highly asymmetrical. On the interdecadal time scale, a significant intensification of both jets during the analyzed period is more prominent in the east tip, but the thermal signature is mostly associated with a much reduced sea surface temperature trend near the west tip.
Isolated islands with steep orography and bathymetry constitute major obstacles to the flow, significantly modifying the regional atmospheric and ocean circulations, with an impact that may extend downstream for hundreds or even thousands of kilometers (Xie et al., 2001). For good reason, the structure and dynamics of these island wakes have been the topic of research, focused on its atmospheric (Etling, 1989; Smith et al., 1997, Grubišic et al., 2015) or ocean components (Caldeira and Tomé, 2013; Caldeira et al., 2014, Cardoso et al., 2020), with clear indications of a modified environment in the vicinity of the islands, leading to the establishment of special ecosystems (Narciso et al., 2019). Interactions between the landforms and both the atmosphere and ocean flows, and between the atmosphere and ocean, modify surface fluxes of energy and momentum, conditioning the boundary layers of both media and leading to feedbacks that may reinforce the wakes.
Alves et al. (2020) looked at the regional atmosphere and ocean circulations around Madeira Island during the 2017 summer, using a high-resolution (1 km) fully coupled atmosphere–ocean simulation with the Coupled Ocean-Atmosphere-Wave–Sediment Transport (COAWST) model (Warner et al., 2010), validated against remote sensing sea surface temperature (SST) and wind observations, besides in situ observations in coastal weather stations and in an oceanographic field experiment. That study showed a remarkably steady summer flow during that year, with northeasterly trade winds impinging on the island and leading to the establishment of two low-level jets in the wake, emerging from the east and west tips of the island. Alves et al. (2020) argued that those tip-jets are similar to those simulated by Ólafsson and Bougeault (1997) and observed in Greenland (Doyle and Shapiro, 1999), with a much stronger constancy of the flow compensating for its reduced wind speed and that the variability of those jets is a dominant factor in the dynamics of the Madeira wake.
Motivated by Alves et al. (2020) and taking into account their conclusion that the ocean to atmosphere feedback has little impact in the regional atmospheric circulation, Miranda et al. (2021) analyzed results from an extended 40-year atmosphere-only simulation with Weather-Research and Forecasting (WRF), forced by ERA5 reanalysis (1979–2018). That analysis, entirely focused in the summer (JJA) fields, identified the presence of a strong intraseasonal oscillation at the multiweek timescale in the intensity of the tip-jets, correlated with a corresponding oscillation in the atmospheric planetary boundary layer (PBL) height. Furthermore, Miranda et al. (2021) found that both the tip-jet intensity and the regional atmospheric boundary layer height presented significant decadal variability, with recent trends towards a lower PBL height and a faster jet, confirmed by local wind observations at Madeira Airport.
The present study is a follow-up of Miranda et al. (2021), using its low level atmospheric fields to force an ocean simulation with the Regional Oceanic Modeling System (ROMS) model at 3 km resolution, aiming to characterize the ocean temperature and circulation and to assess the decadal variability of the upper ocean. The paper is organized as follows: the setup of numerical simulations and its observational validation are assessed in Experimental Setup. Main tip-jets impact on ocean results are present in Results. Discussion and Conclusions includes a discussion of the ocean asymmetries results and some conclusions.
The present study is based on the analysis of two numerical simulations: an atmospheric simulation performed by the WRF model forced by ERA5 reanalysis (Hersbach et al., 2020), and an ocean simulation, one-way forced by low level WRF fields, with the ROMS model. The 40-year WRF simulation is described in Miranda et al. (2021), although here the analysis is limited to the 35-year period (1983–2017) due to the time window of the available ocean reanalysis, later described, and the need for an extended spin-up of the ocean model. The one-way coupling from WRF to ROMS is performed by providing the ocean model with three-hourly low-level fields from WRF for wind, relative humidity, air temperature, net shortwave and longwave radiation, pressure, and precipitation, the surface fluxes being computed by ROMS bulk formula. Both simulations (WRF and ROMS) used colocated nested grids, with an inner grid at 3 km and an outer grid at 9 km resolutions, with two-way interaction. The inner domain encloses Madeira and two nearby small islands located to the NW and SW of the main island, Porto Santo and Desertas, respectively. The limits of both computational grids are depicted in Figure 1A.
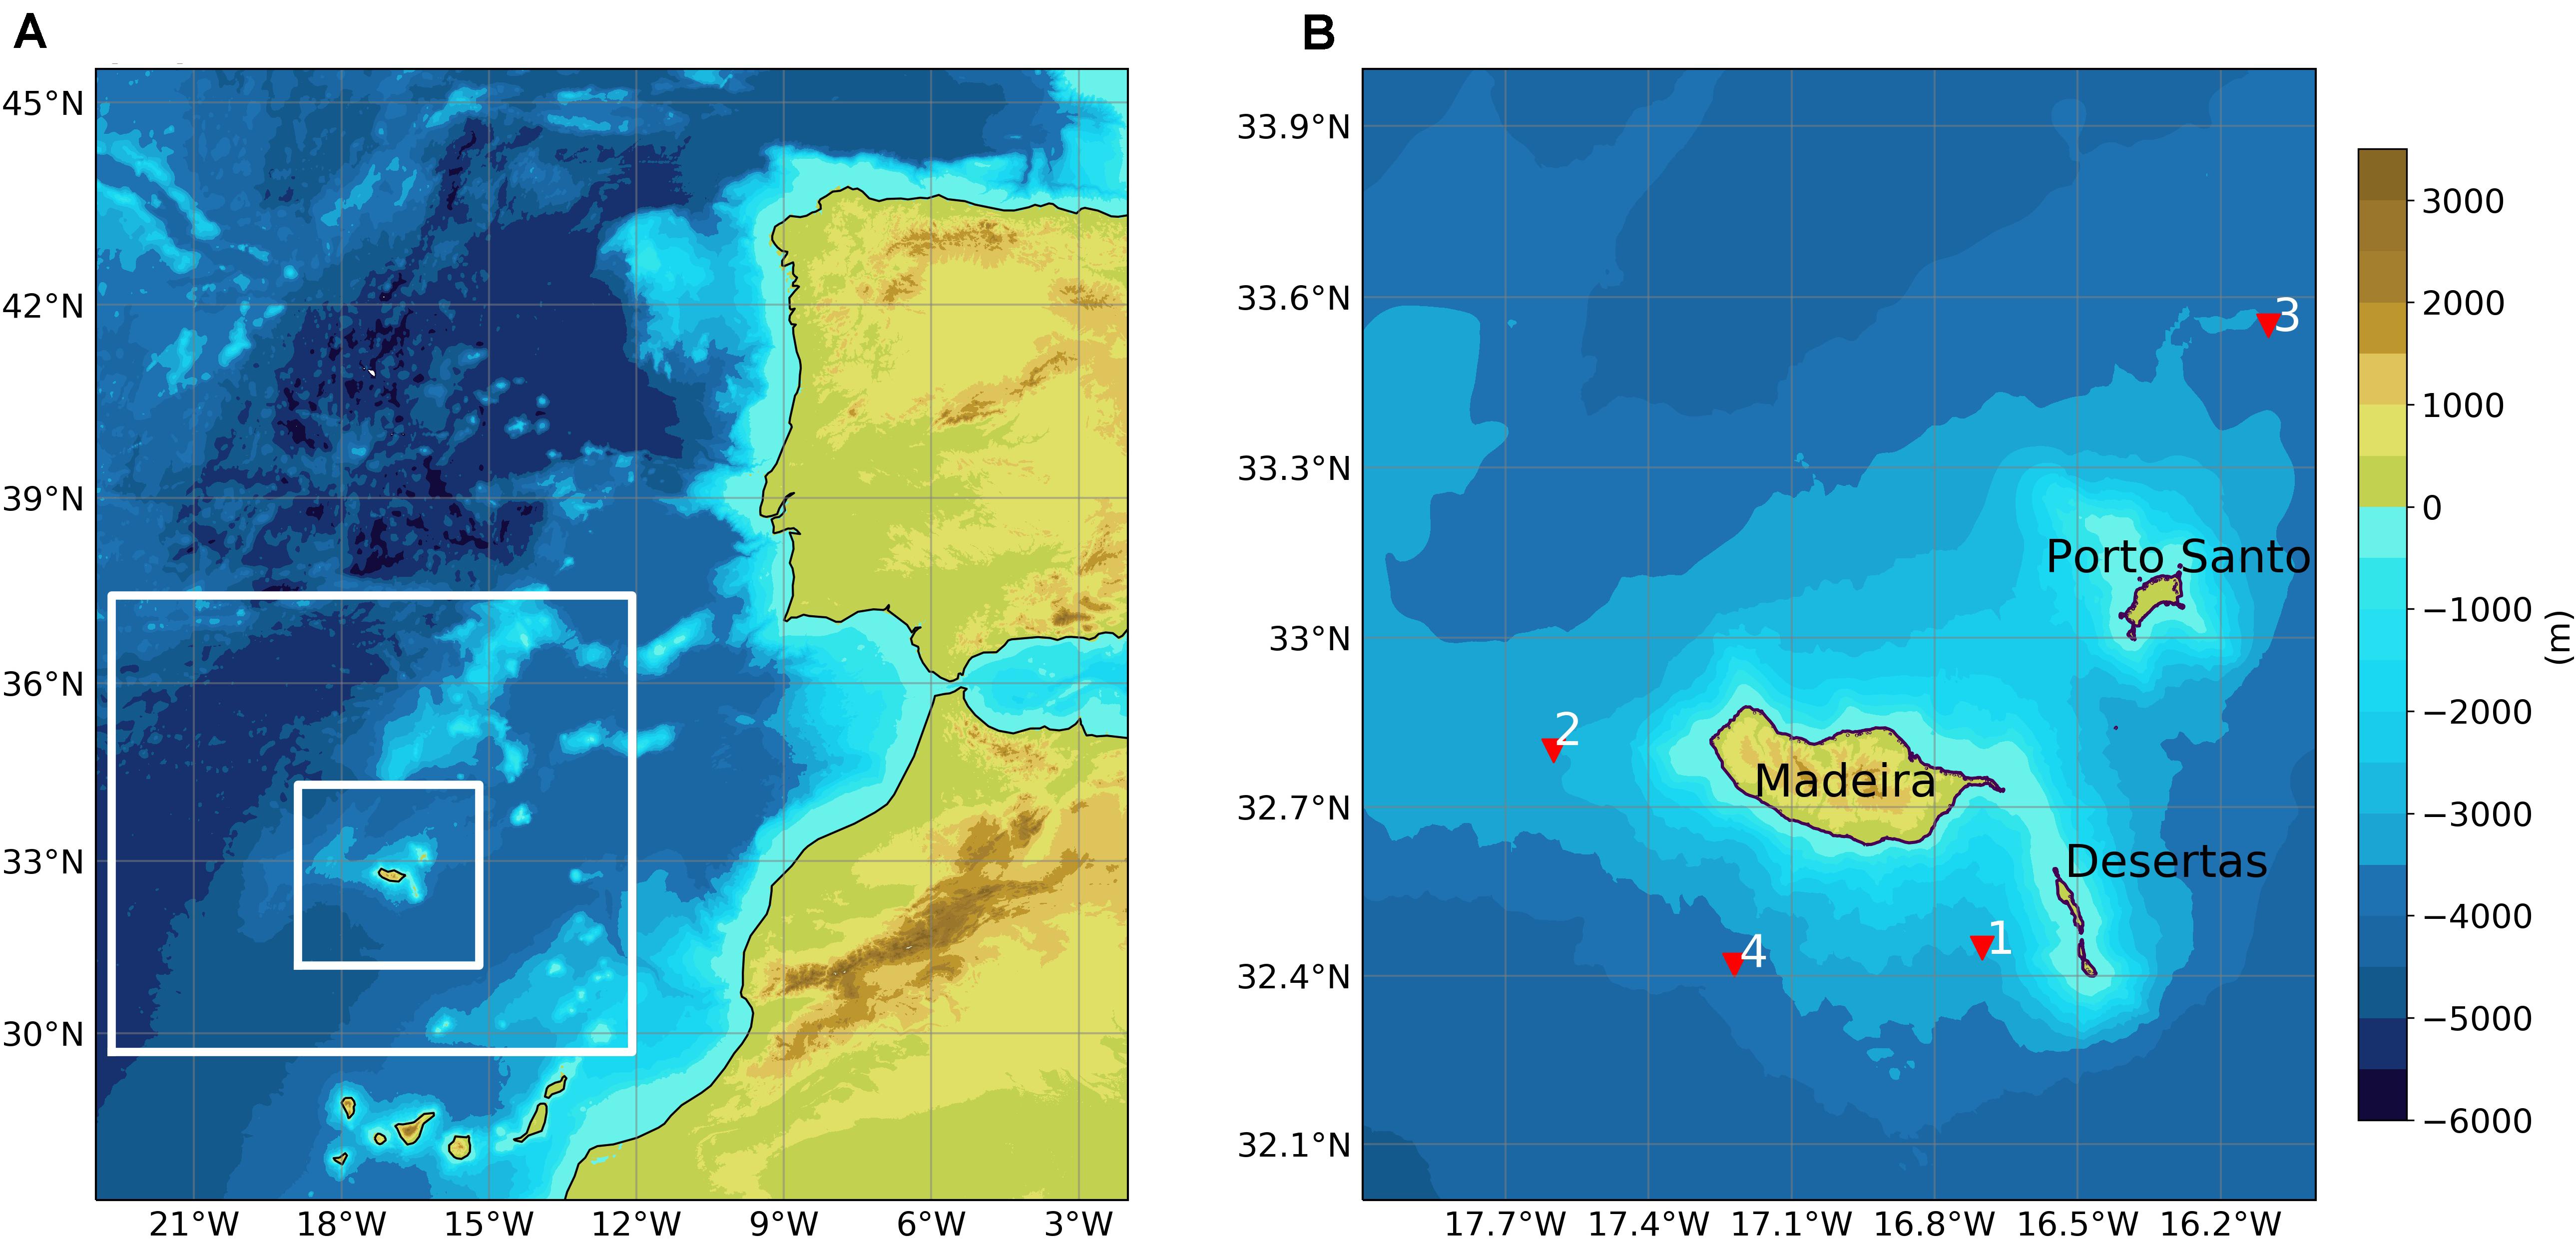
Figure 1. Topography retrieved from Shuttle Radar Topography Mission (SRTM) and sea floor bathymetry near Madeira Island retrieved from General Bathymetric Chart of the Oceans (GEBCO). In panel (A), white rectangles indicate geographical limits of the two domains used in Weather-Research and Forecasting (WRF) and Regional Oceanic Modeling System (ROMS): 9 km (outer) and 3 km resolution (inner), and in panel (B), red triangles indicate locations where some analysis is done.
The initial and boundary conditions of the ROMS ocean model were obtained from the Simple Ocean Data Assimilation (SODA v3.4.2) (Carton and Giese, 2008), a global reanalysis with a 0.25° spatial resolution (approximately 24 km, near Madeira), with data every 5 days. That reanalysis assimilated observed data from the World Ocean Database (WOD) and the International Comprehensive Ocean–Atmosphere Dataset (ICOADS). It is forced by the atmospheric ERA-Interim reanalysis (Dee et al., 2011), using the Coupled Ocean–Atmosphere Response Experiment (COARE4) bulk formula. It was recently shown that SODA-v3.4.2. is an accurate reanalysis, particularly near Madeira (Carton et al., 2019), and while an improved product is not available with the new higher-resolution ERA5 dataset, it constitutes the best compromise for the present study.
At the outer ROMS computational grid boundaries, radiation and nudging conditions were imposed for tracers (temperature and salinity) and the baroclinic current (Marchesiello et al., 2001), a Shecheptikin condition for the barotropic current (Mason et al., 2010), and a Chapman condition for free-surface height (Chapman, 1985). Vertical turbulent mixing was parameterized with the Generic Length Scale (GLS) scheme (Umlauf and Burchard, 2003), with a k–ε closure, where k is the turbulent kinetic energy and ε is the dissipation. ROMS used 40 sigma levels, with an increasing vertical resolution near the ocean surface. The sea floor bathymetric grid is based in a 30 arc-second grid spacing data, from the General Bathymetric Chart of the Oceans (GEBCO; Becker et al., 2009). Several passes of a smoothing filter guaranteed a bathymetry r-factor (r = ∇h/h) below 0.2 (Haidvogel and Beckmann, 1999) to avoid pressure gradient errors associated with sigma coordinate calculations. A thorough description of the ROMS model is presented in Shchepetkin and McWilliams (2005, 2009).
The accuracy of 10-m wind can be assessed from reprocessed Advanced SCATterometer (ASCAT) data, available at a 12.5-km swath grid (Verhoef et al., 2012). Here, we used data from the ascending passage (descending passage gives similar results); that in Madeira occurs between 21 and 23 h UTC and WRF data at 21 h UTC, for the longest available period coincident with the numerical simulation, from 2007 until 2017. After remapping the simulated variables to the satellite grid, the remote-detected values were used to compute the following statistical parameters: bias, time correlation, and normalized standard deviation. The statistical parameters show the high accuracy of the simulated surface wind (Table 1), at four locations near Madeira: points 1 and 2 are located near the maximum tip-jets mean wind speed, point 3 in an upstream region not affected by the island influence on surface wind, and point 4 in the wake (see Figure 1B for exact position of points). The computed biases vary between −0.19 and −0.90, indicating a very slight underestimation of wind by the model. The time-correlation values are high, varying between 0.90 and 0.76, with the worst value in the wake. The simulated wind speed variability is close to observations.

Table 1. Wind speed statistical parameters, in four points shown in Figure 1B, for the 2007–2017 period: bias, Pearson correlation coefficient (r), normalized standard deviation (NSD).
The simulated SST was compared with the dataset created by the European Space Agency (ESA) Climate Change Initiative/Copernicus Climate Change Service (CCI/C3S), with a 0.05° resolution, combining SST retrievals from the Advanced Very High-Resolution Radiometer (AVHRR) and the Along Track Scanning Radiometer (ATSR) series of satellite sensors. For a full description of the dataset, the reader is referred to Merchant et al. (2019). As for surface wind, the statistical parameters show the robustness of the simulated values (Table 2), with an absolute bias lower than 0.23 °C in the four points, a very high synchronization between model and satellite data revealed by time correlations between 0.96 and 0.97, and a realistic simulated variability noted by a ratio of standard deviations of 1.04 or 1.05. The robustness of the simulated SST is also revealed by the mean spatial SST bias and root mean square error (Figure 2) with values always lower than 0.3 and 0.8 °C around Madeira, respectively. In both parameters, the highest values are located near the west flank, coinciding with high SST variability and gradients (shown latter) that are not accurately captured by daily 0.05° resolution satellite SST.

Table 2. As in Table 1 for sea surface temperature (SST) and for the 1983–2017 period.
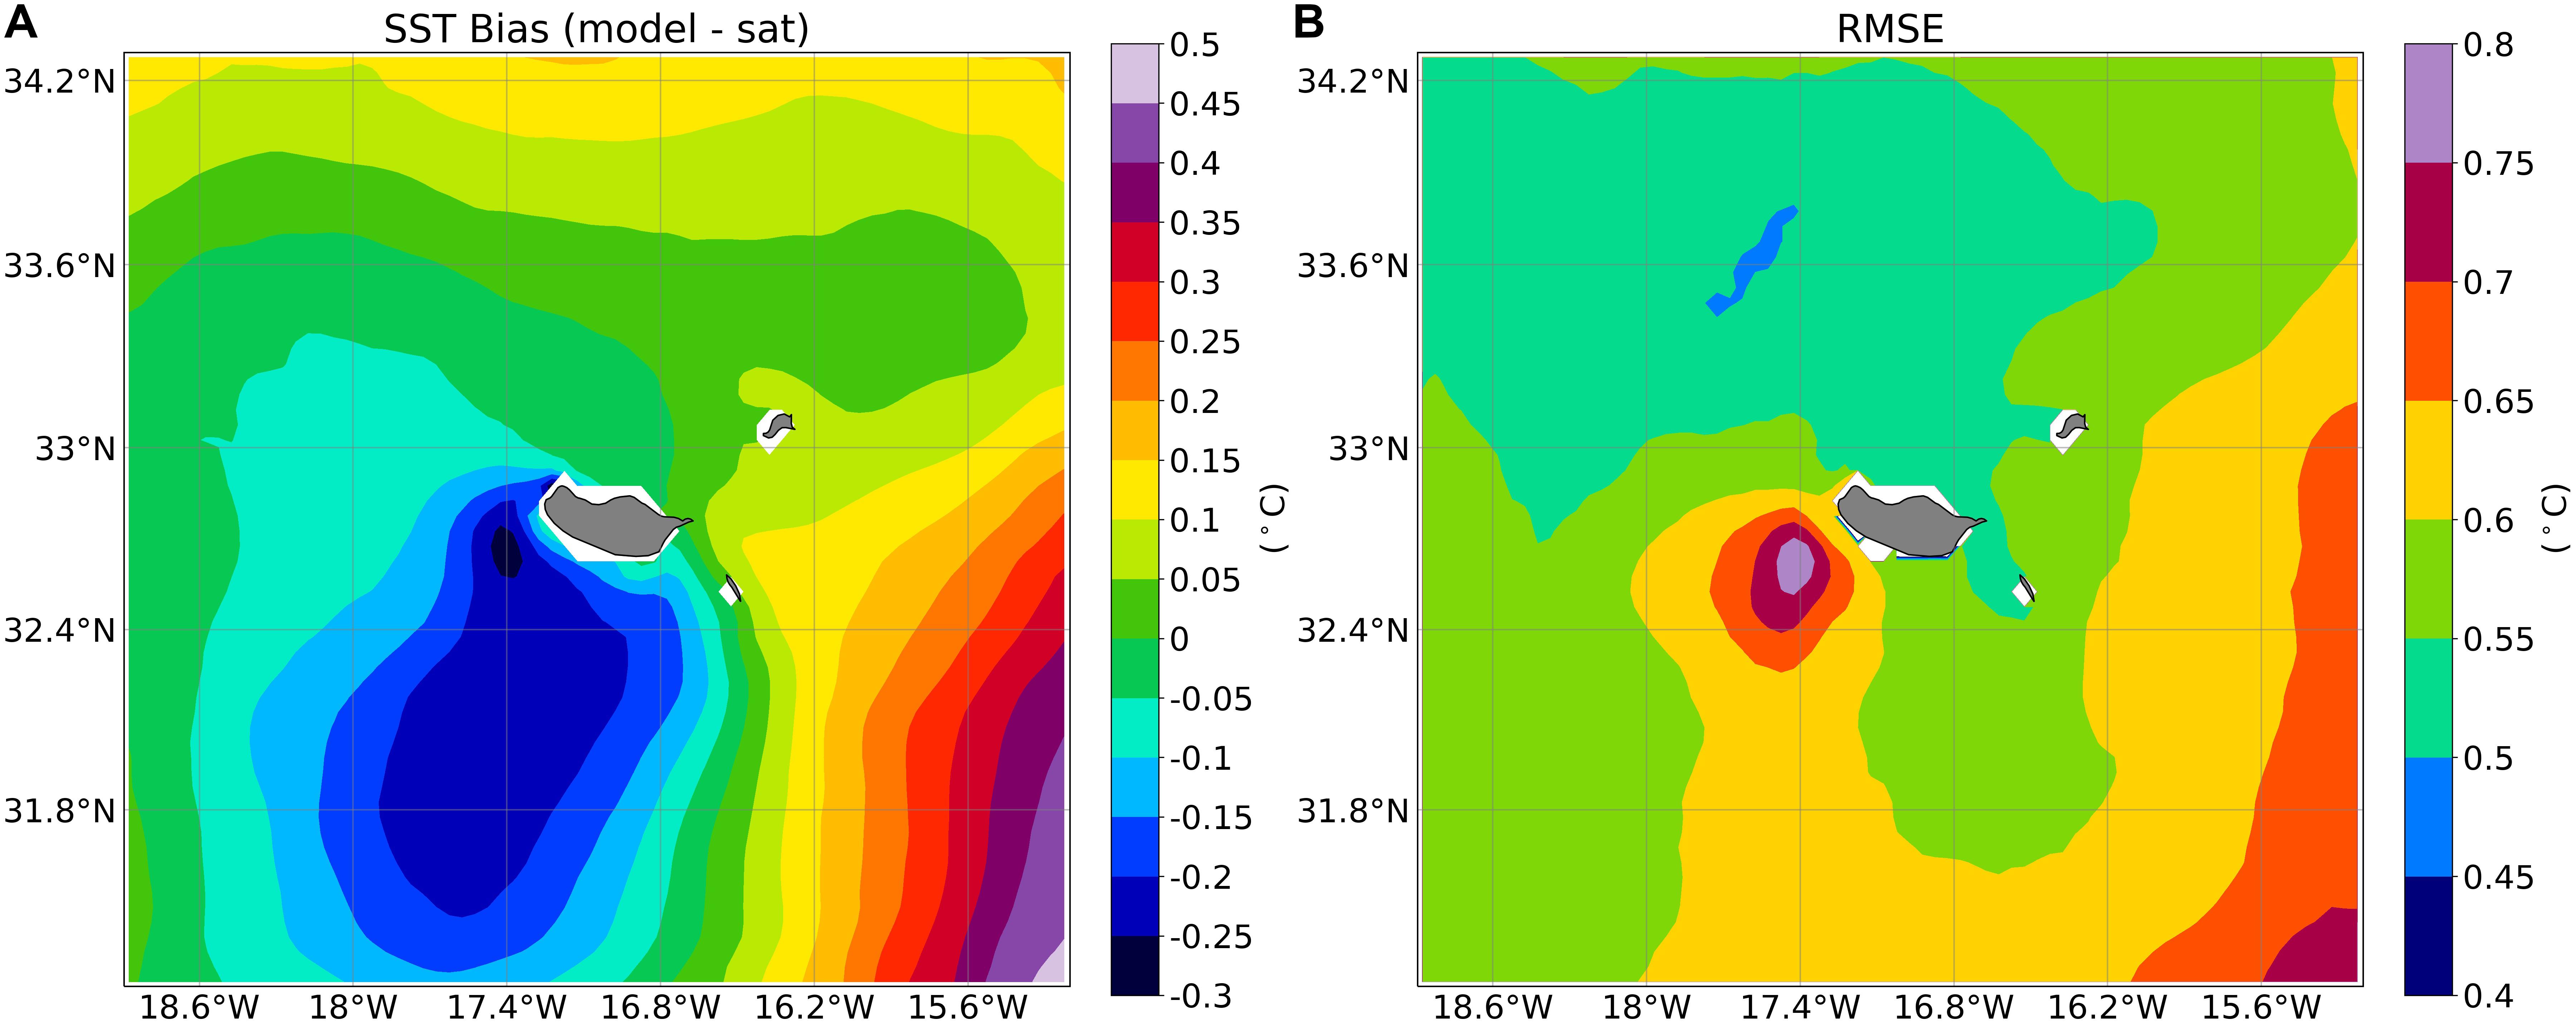
Figure 2. Mean (1983–2017) (A) sea surface temperature (SST) bias (model—satellite) and (B) root mean square error (RMSE).
The presence of Madeira Island is especially clear in the perturbation it imposes to the wind. The seasonal mean wind around Madeira (Figure 3) displays a rather constant pattern, with northeasterly flow impinging the island throughout the year, leading to the establishment of two localized wind speed maxima near the east and west island tips. The upstream mean wind speed is stronger in winter (DJF) and weaker in summer (JJA). However, the tip-jets are most prominent in summer.
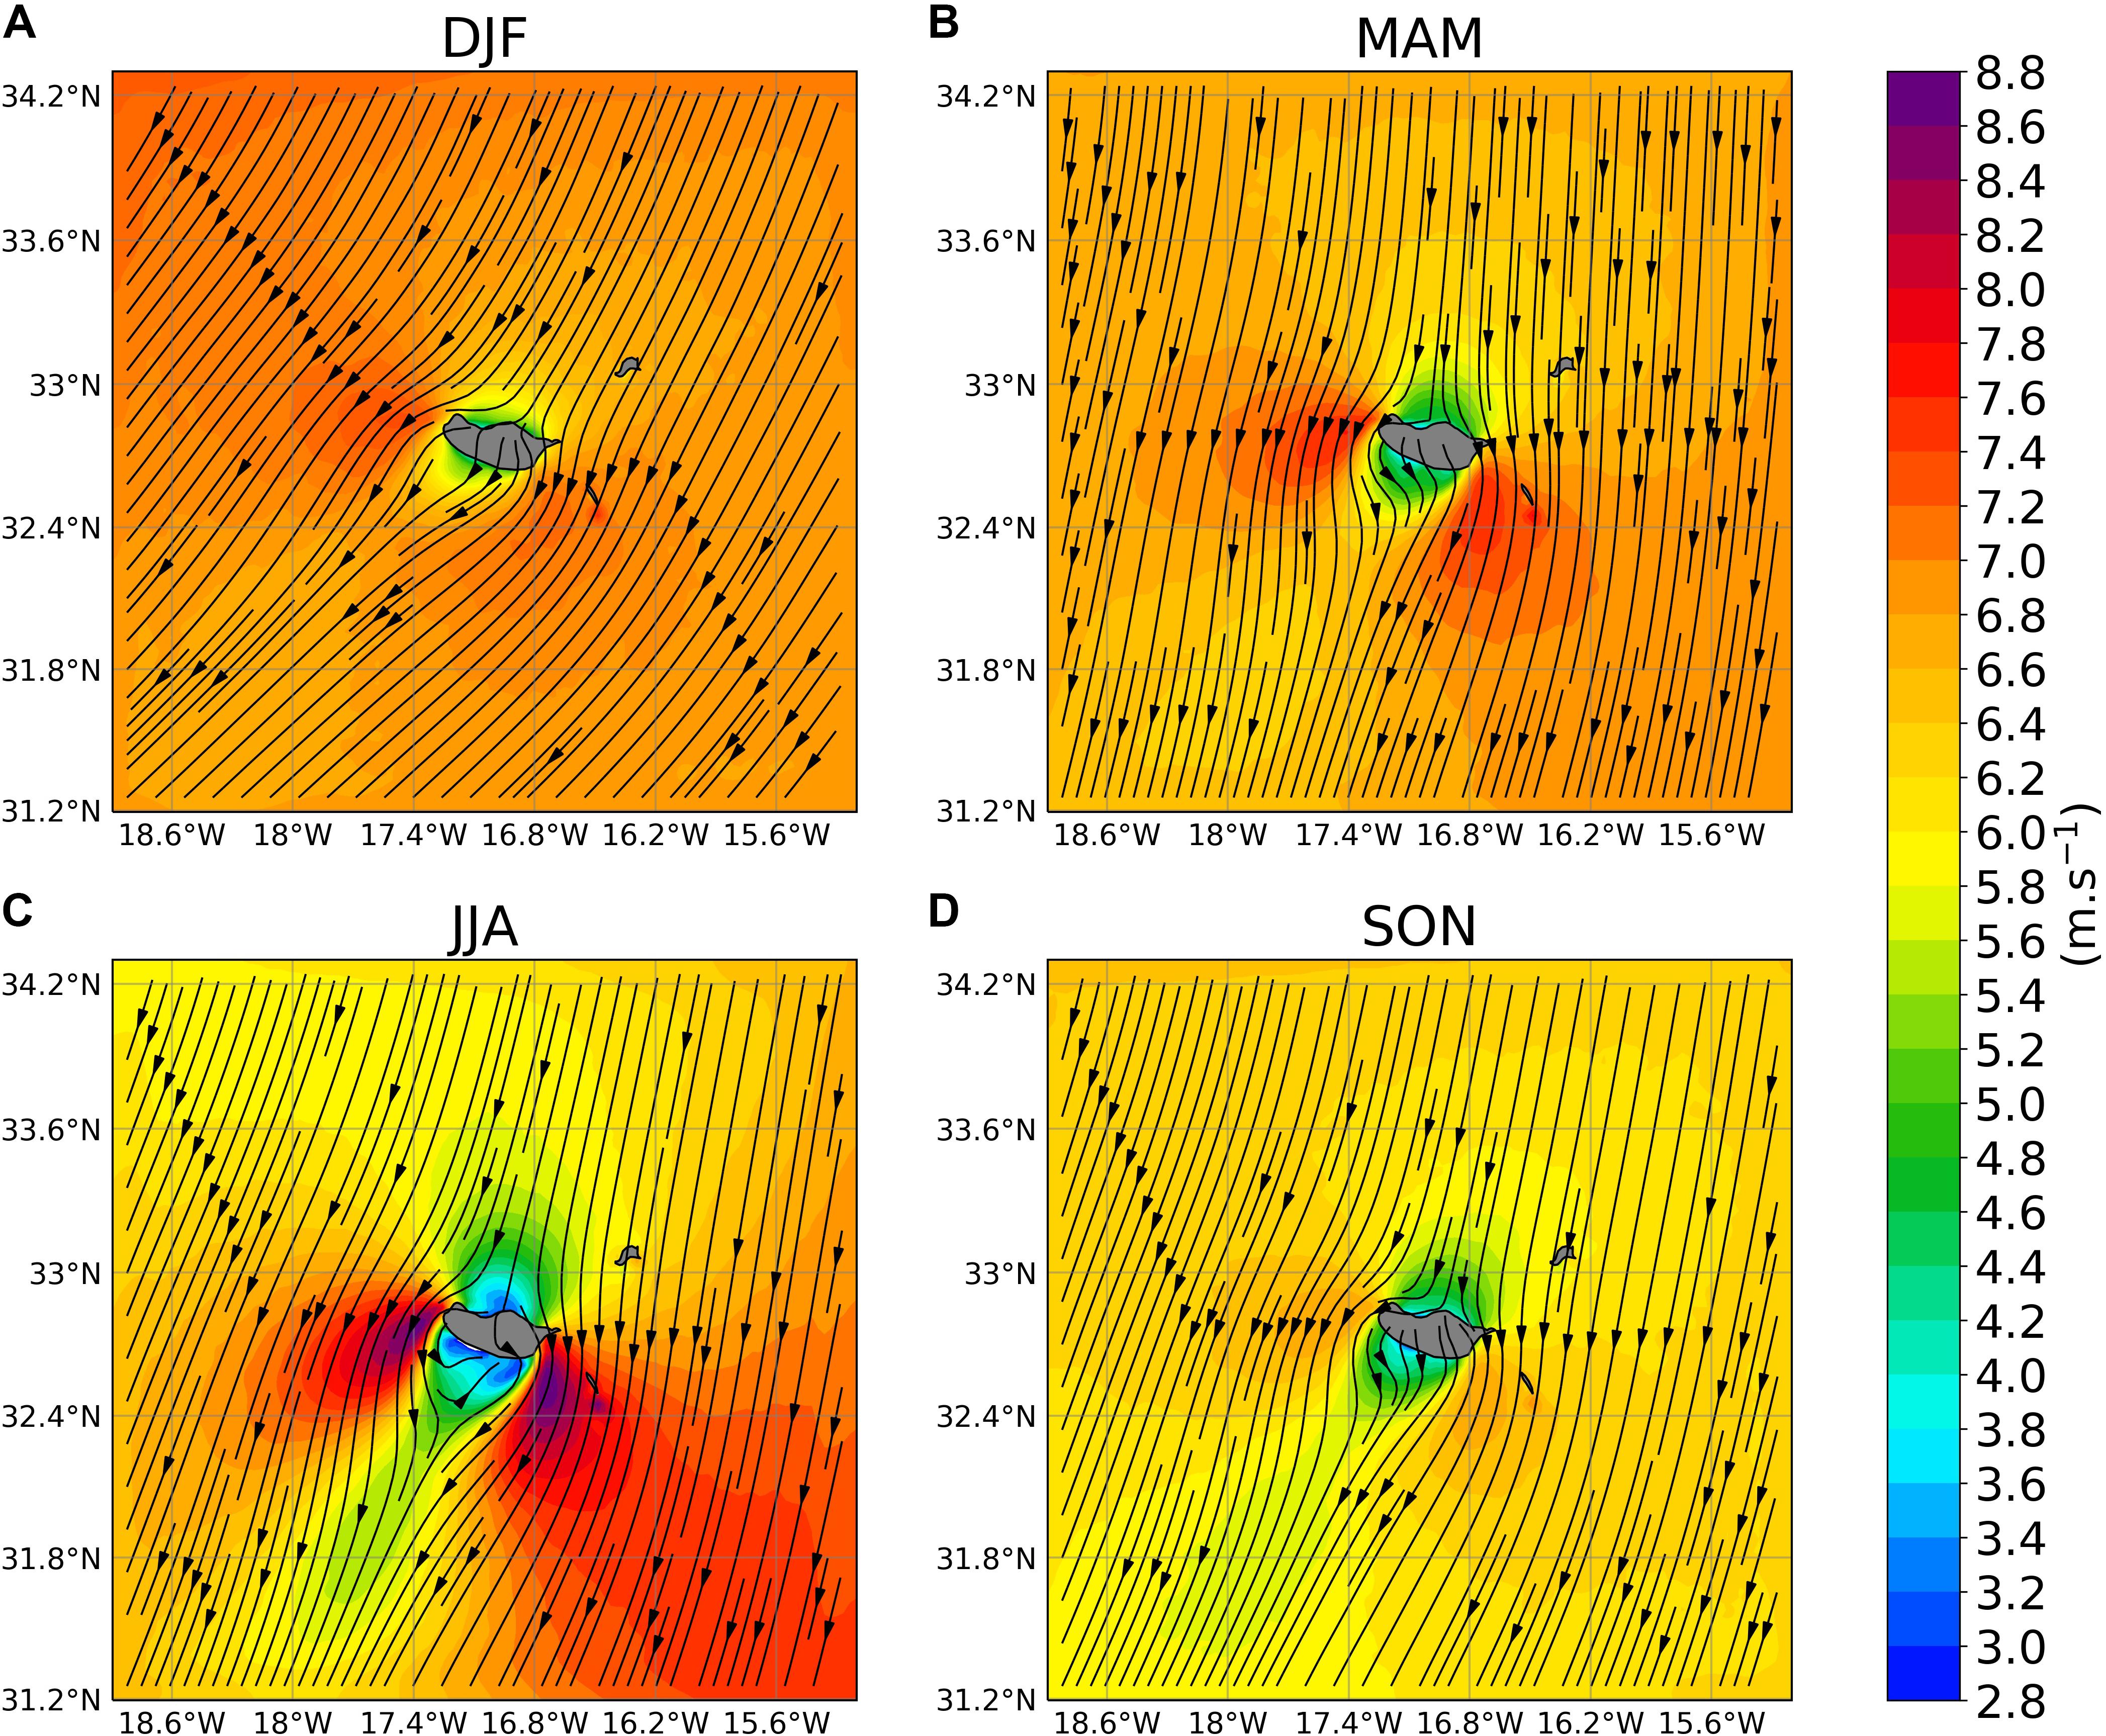
Figure 3. Mean (1983–2017) seasonal [(A) DJF, (B) MAM, (C) JJA, and (D) SON] simulated surface (10 m) wind speed and associated streamlines computed with data every 3 h and every four grid cells (12 km), in the 3-km inner domain.
The establishment of the summer tip-jets was discussed in some detail by Miranda et al. (2021), and both its intraseasonal and decadal variability were found to be controlled by the regional PBL height, defined as the height of maximum stability in the low troposphere. Figure 4 shows the seasonal mean potential temperature gradient in the north upstream sampling point (Figure 1B), indicating a much more stable and lower height PBL in summer, lowering from about 1,700 m in winter (DJF) to about 1,000 m in summer (JJA). The lower summer value is below the height of the main island plateau, implying the need for flow deflection around the island with streamline squeezing near the island tips, a simple Bernoulli mechanism to accelerate the flow in the jets.
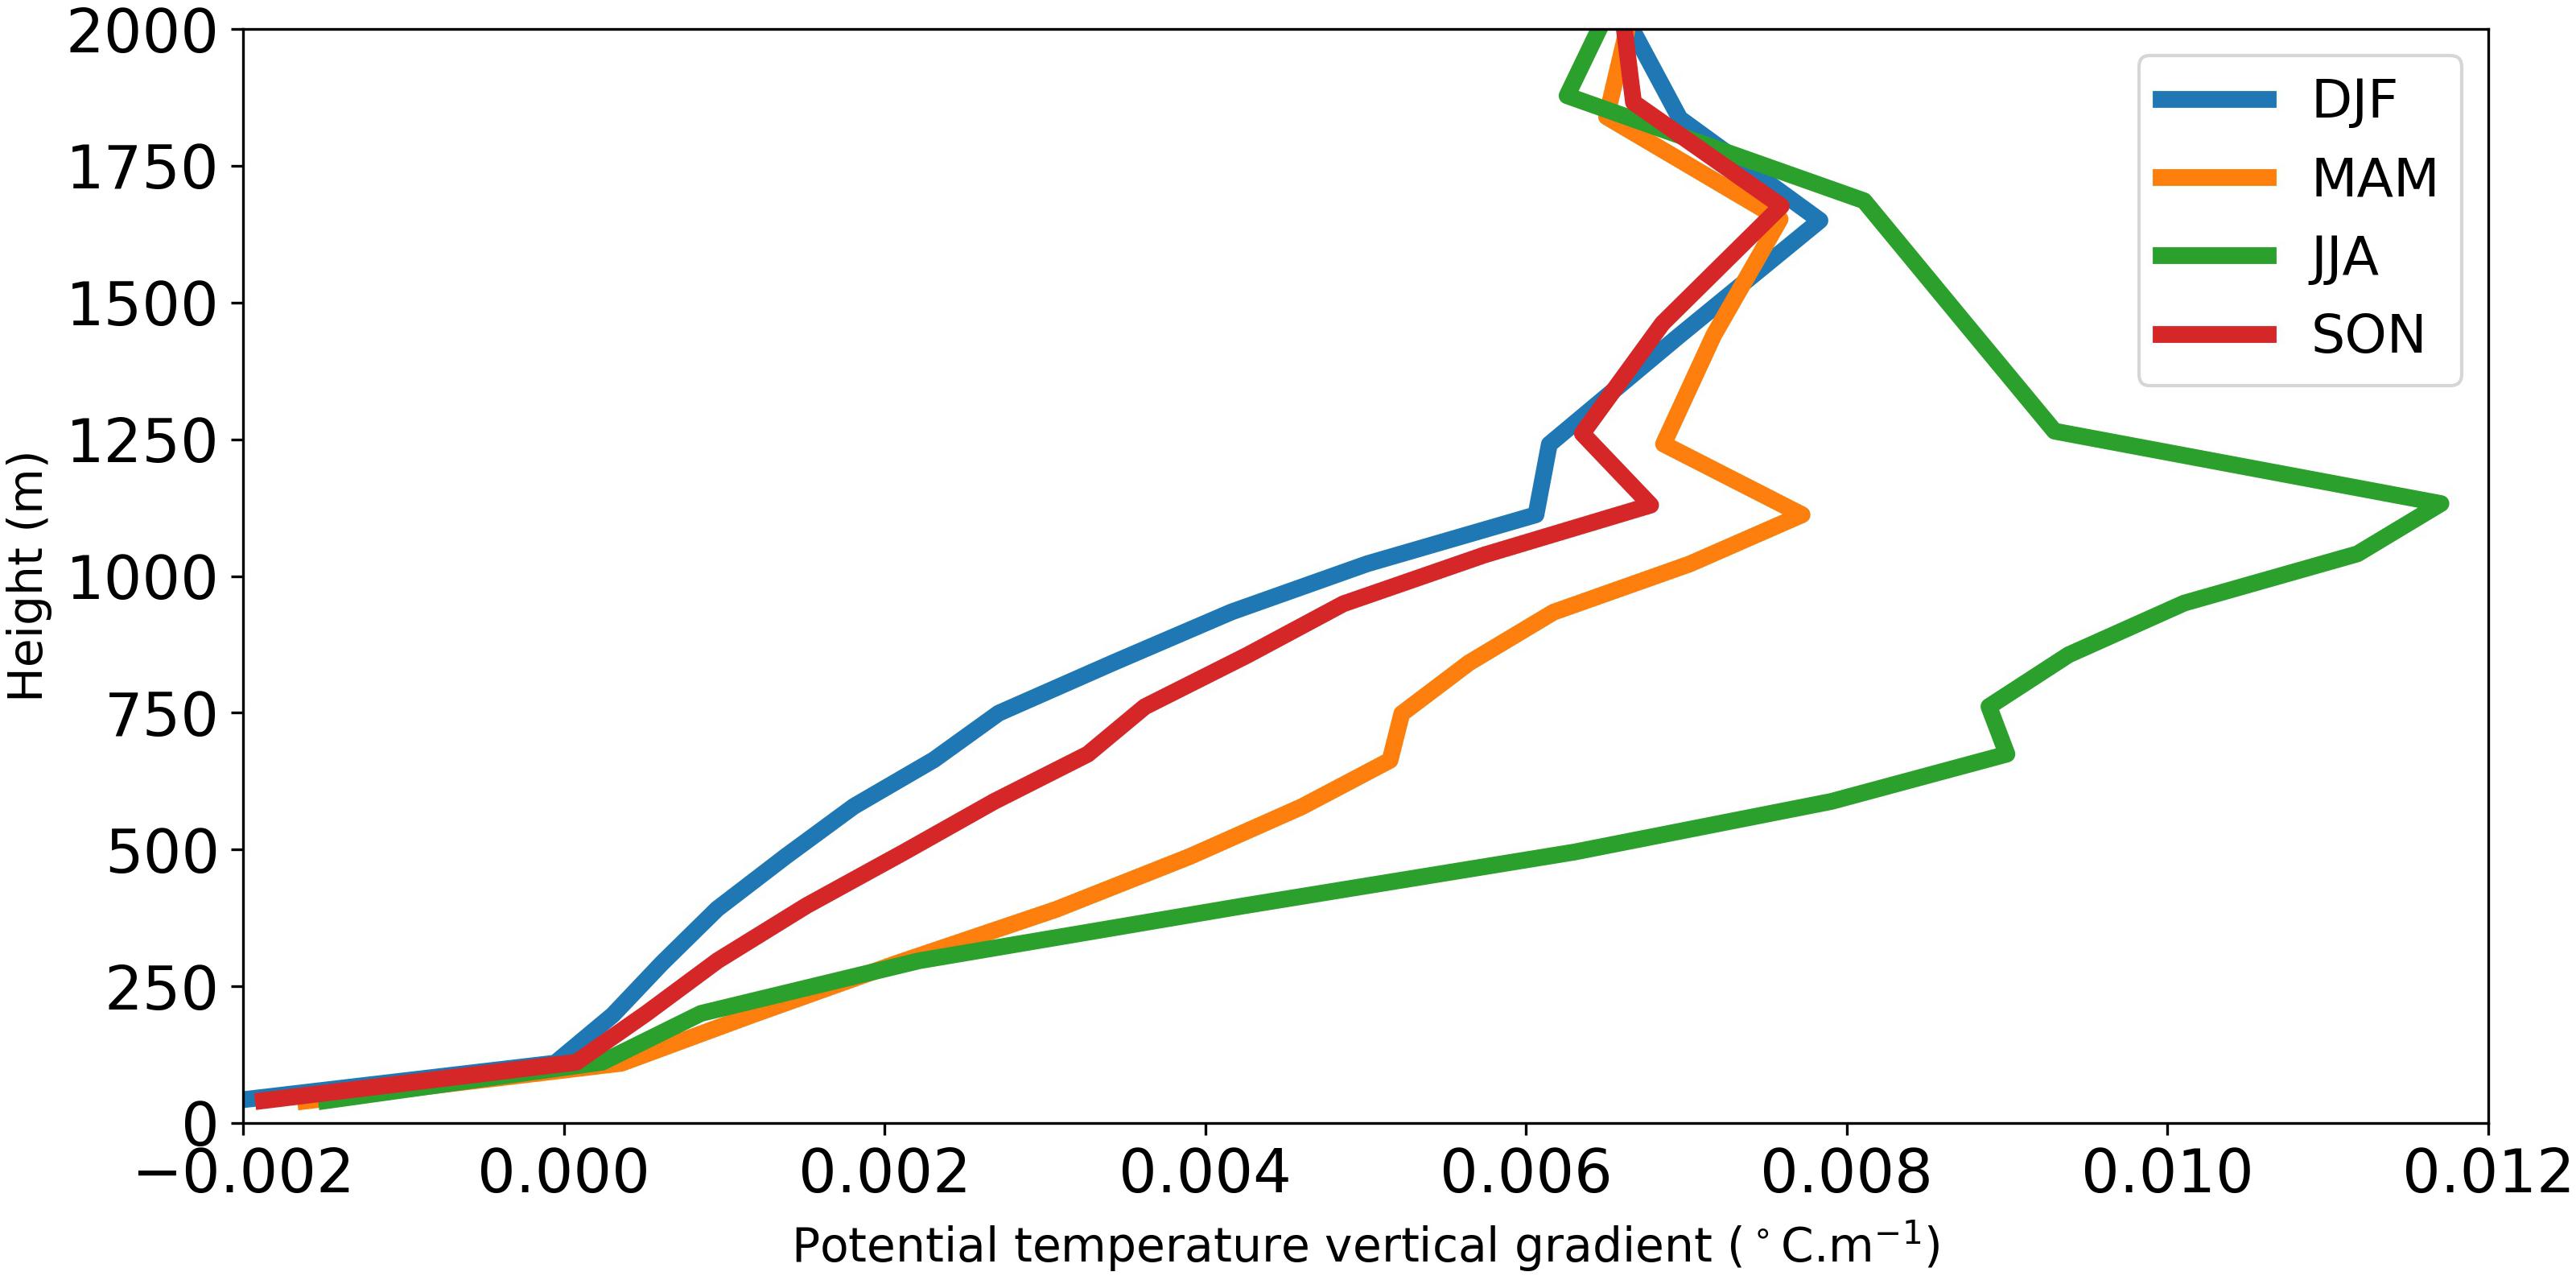
Figure 4. Mean (1983–2017) seasonal potential temperature vertical gradient at point 3 (Figure 1B).
On the other hand, the seasonal mean wind directional constancy (Bromwich, 1989), computed as the ratio of the magnitude of mean wind vector to the mean wind speed:
represented in Figure 5, also shows a strong seasonality, with a much stronger constancy in summer (JJA) contributing to more frequent northeasterly flow and favoring the establishment of the tip-jets in their preferred locations.
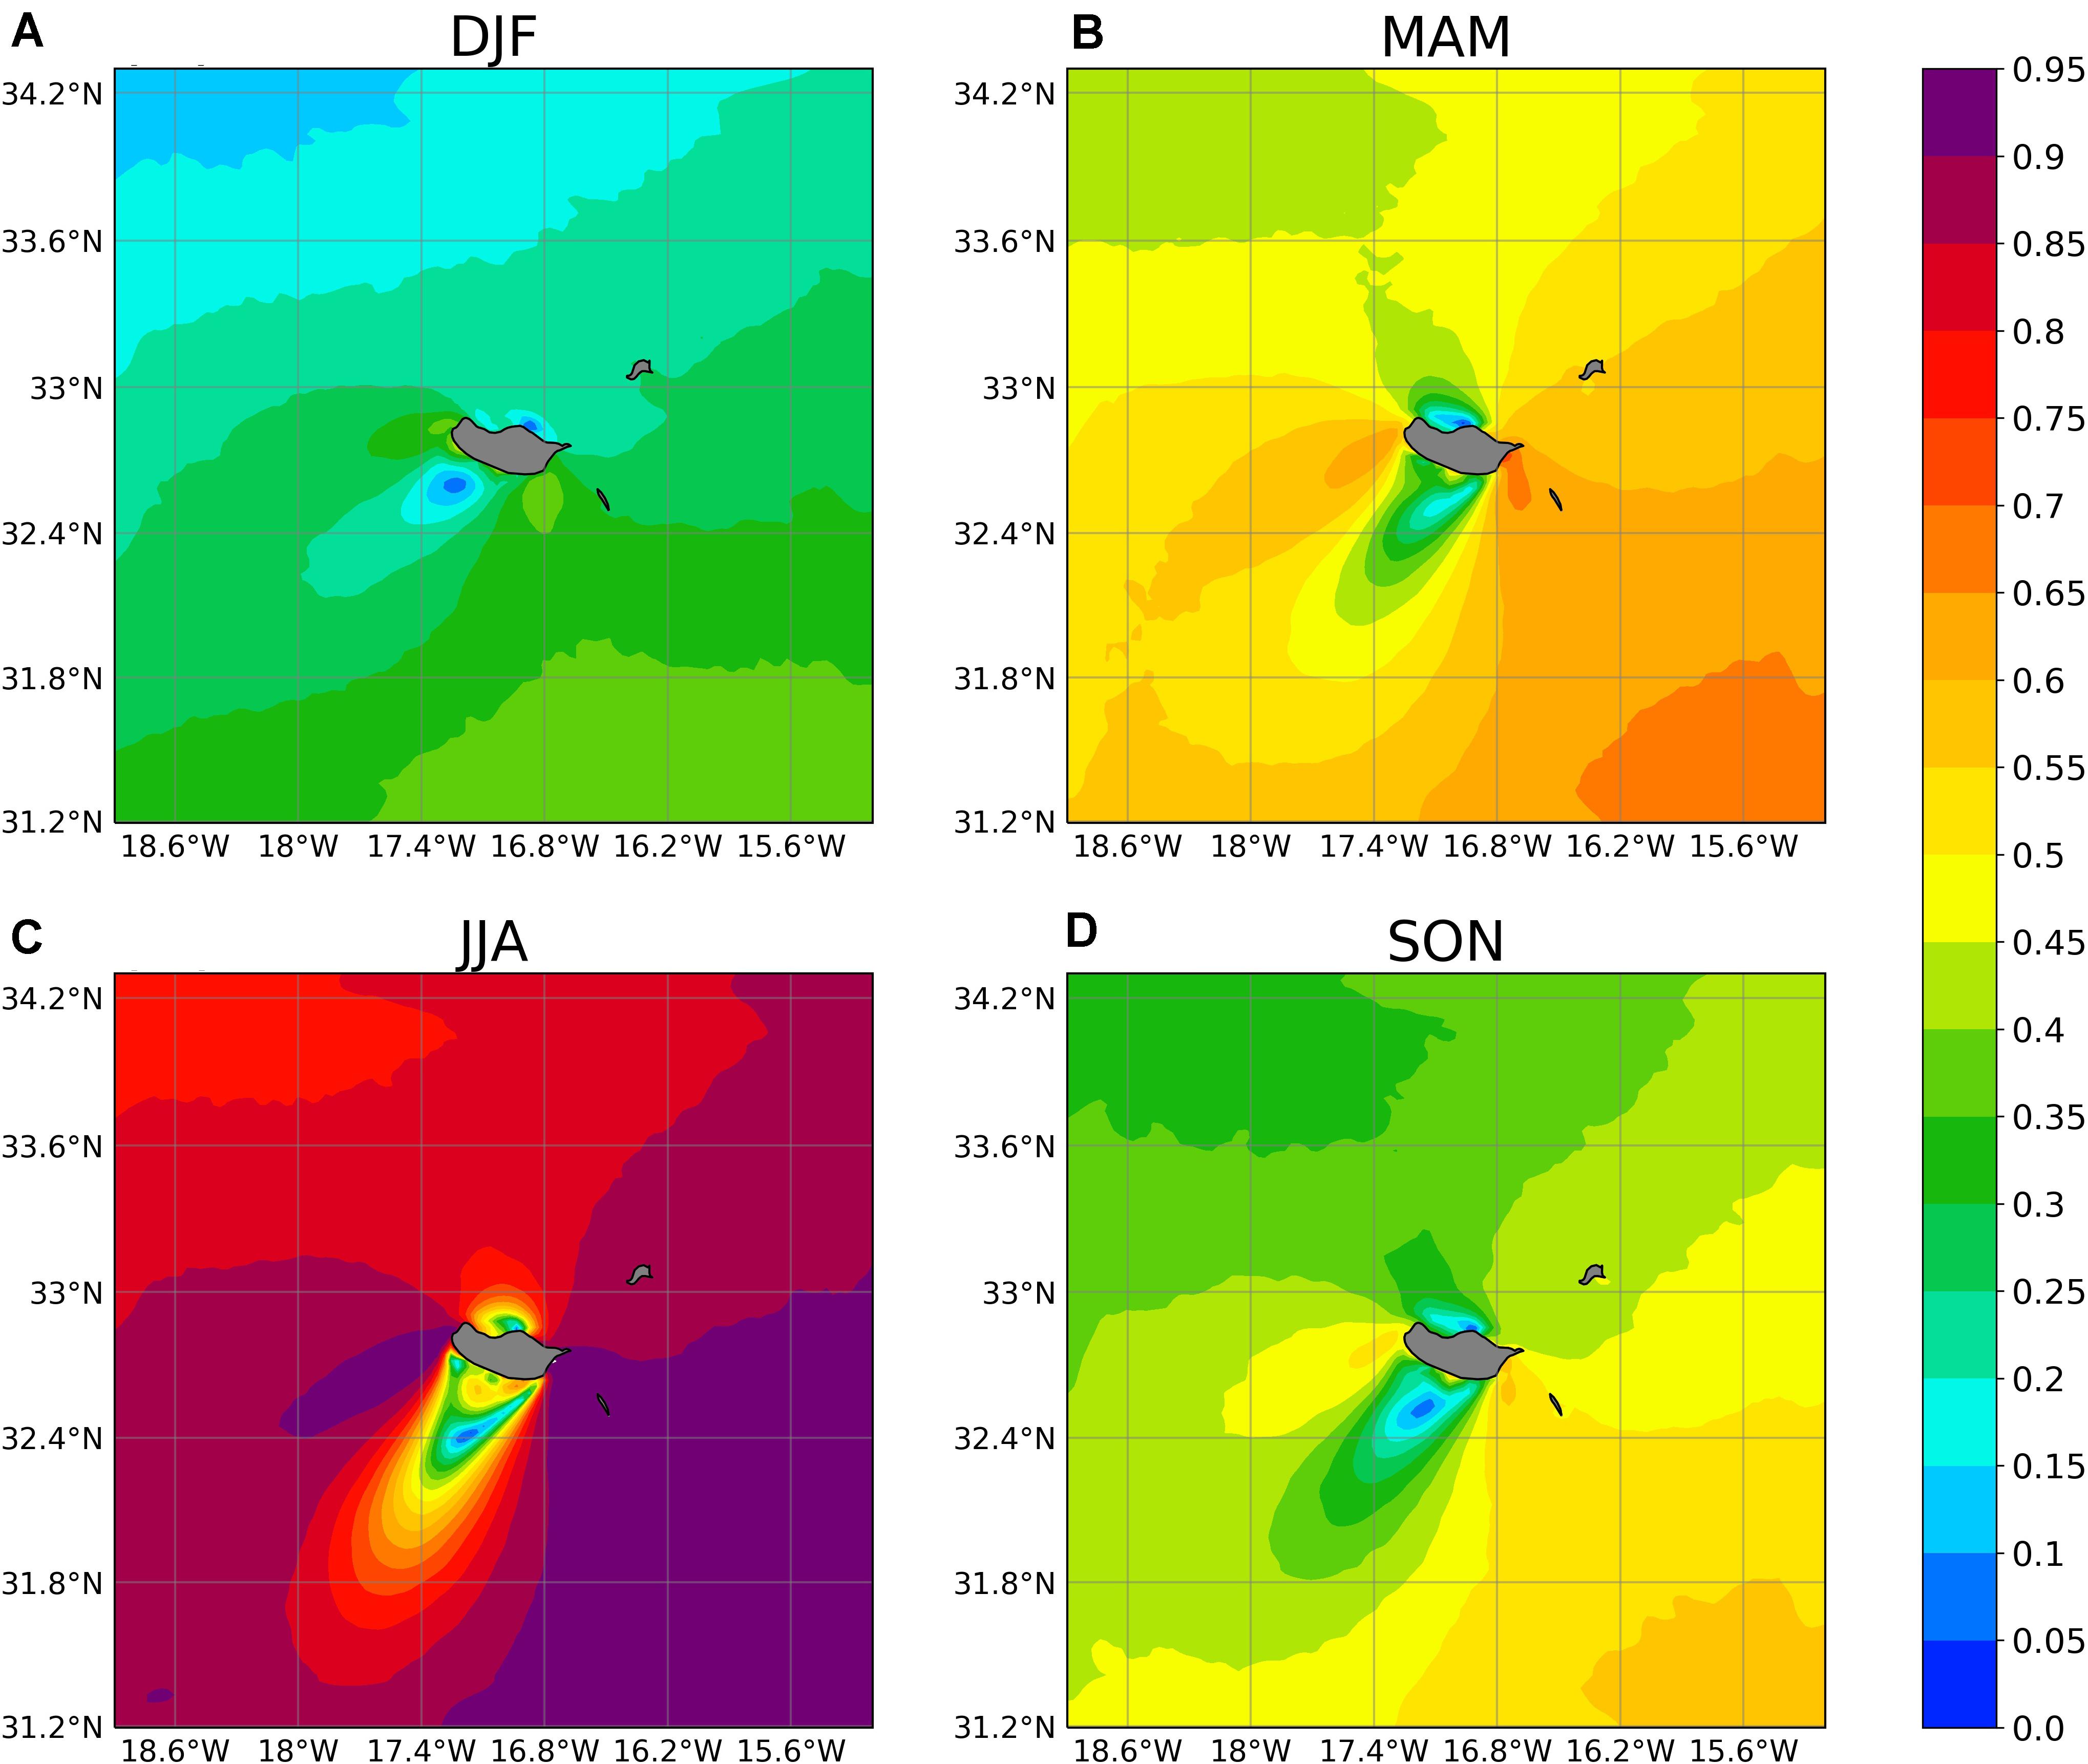
Figure 5. Mean (1983–2017) [(A) DJF, (B) MAM, (C) JJA, (D) SON] seasonal wind speed directional constancy (computed following Eq. 1).
Summer is also the season with the stronger wind speed variability in the jets, associated with a multiweek oscillation of the jet intensity, driven by a corresponding oscillation in the regional PBL height (Miranda et al., 2021). The seasonal mean intraseasonal variability is shown in Figure 6, with the standard deviation of wind speed exceeding 3.5 m/s in the east jet, slightly smaller values in the west jet, and much smaller values in the upstream flow. In the following section, we will concentrate on summer results.
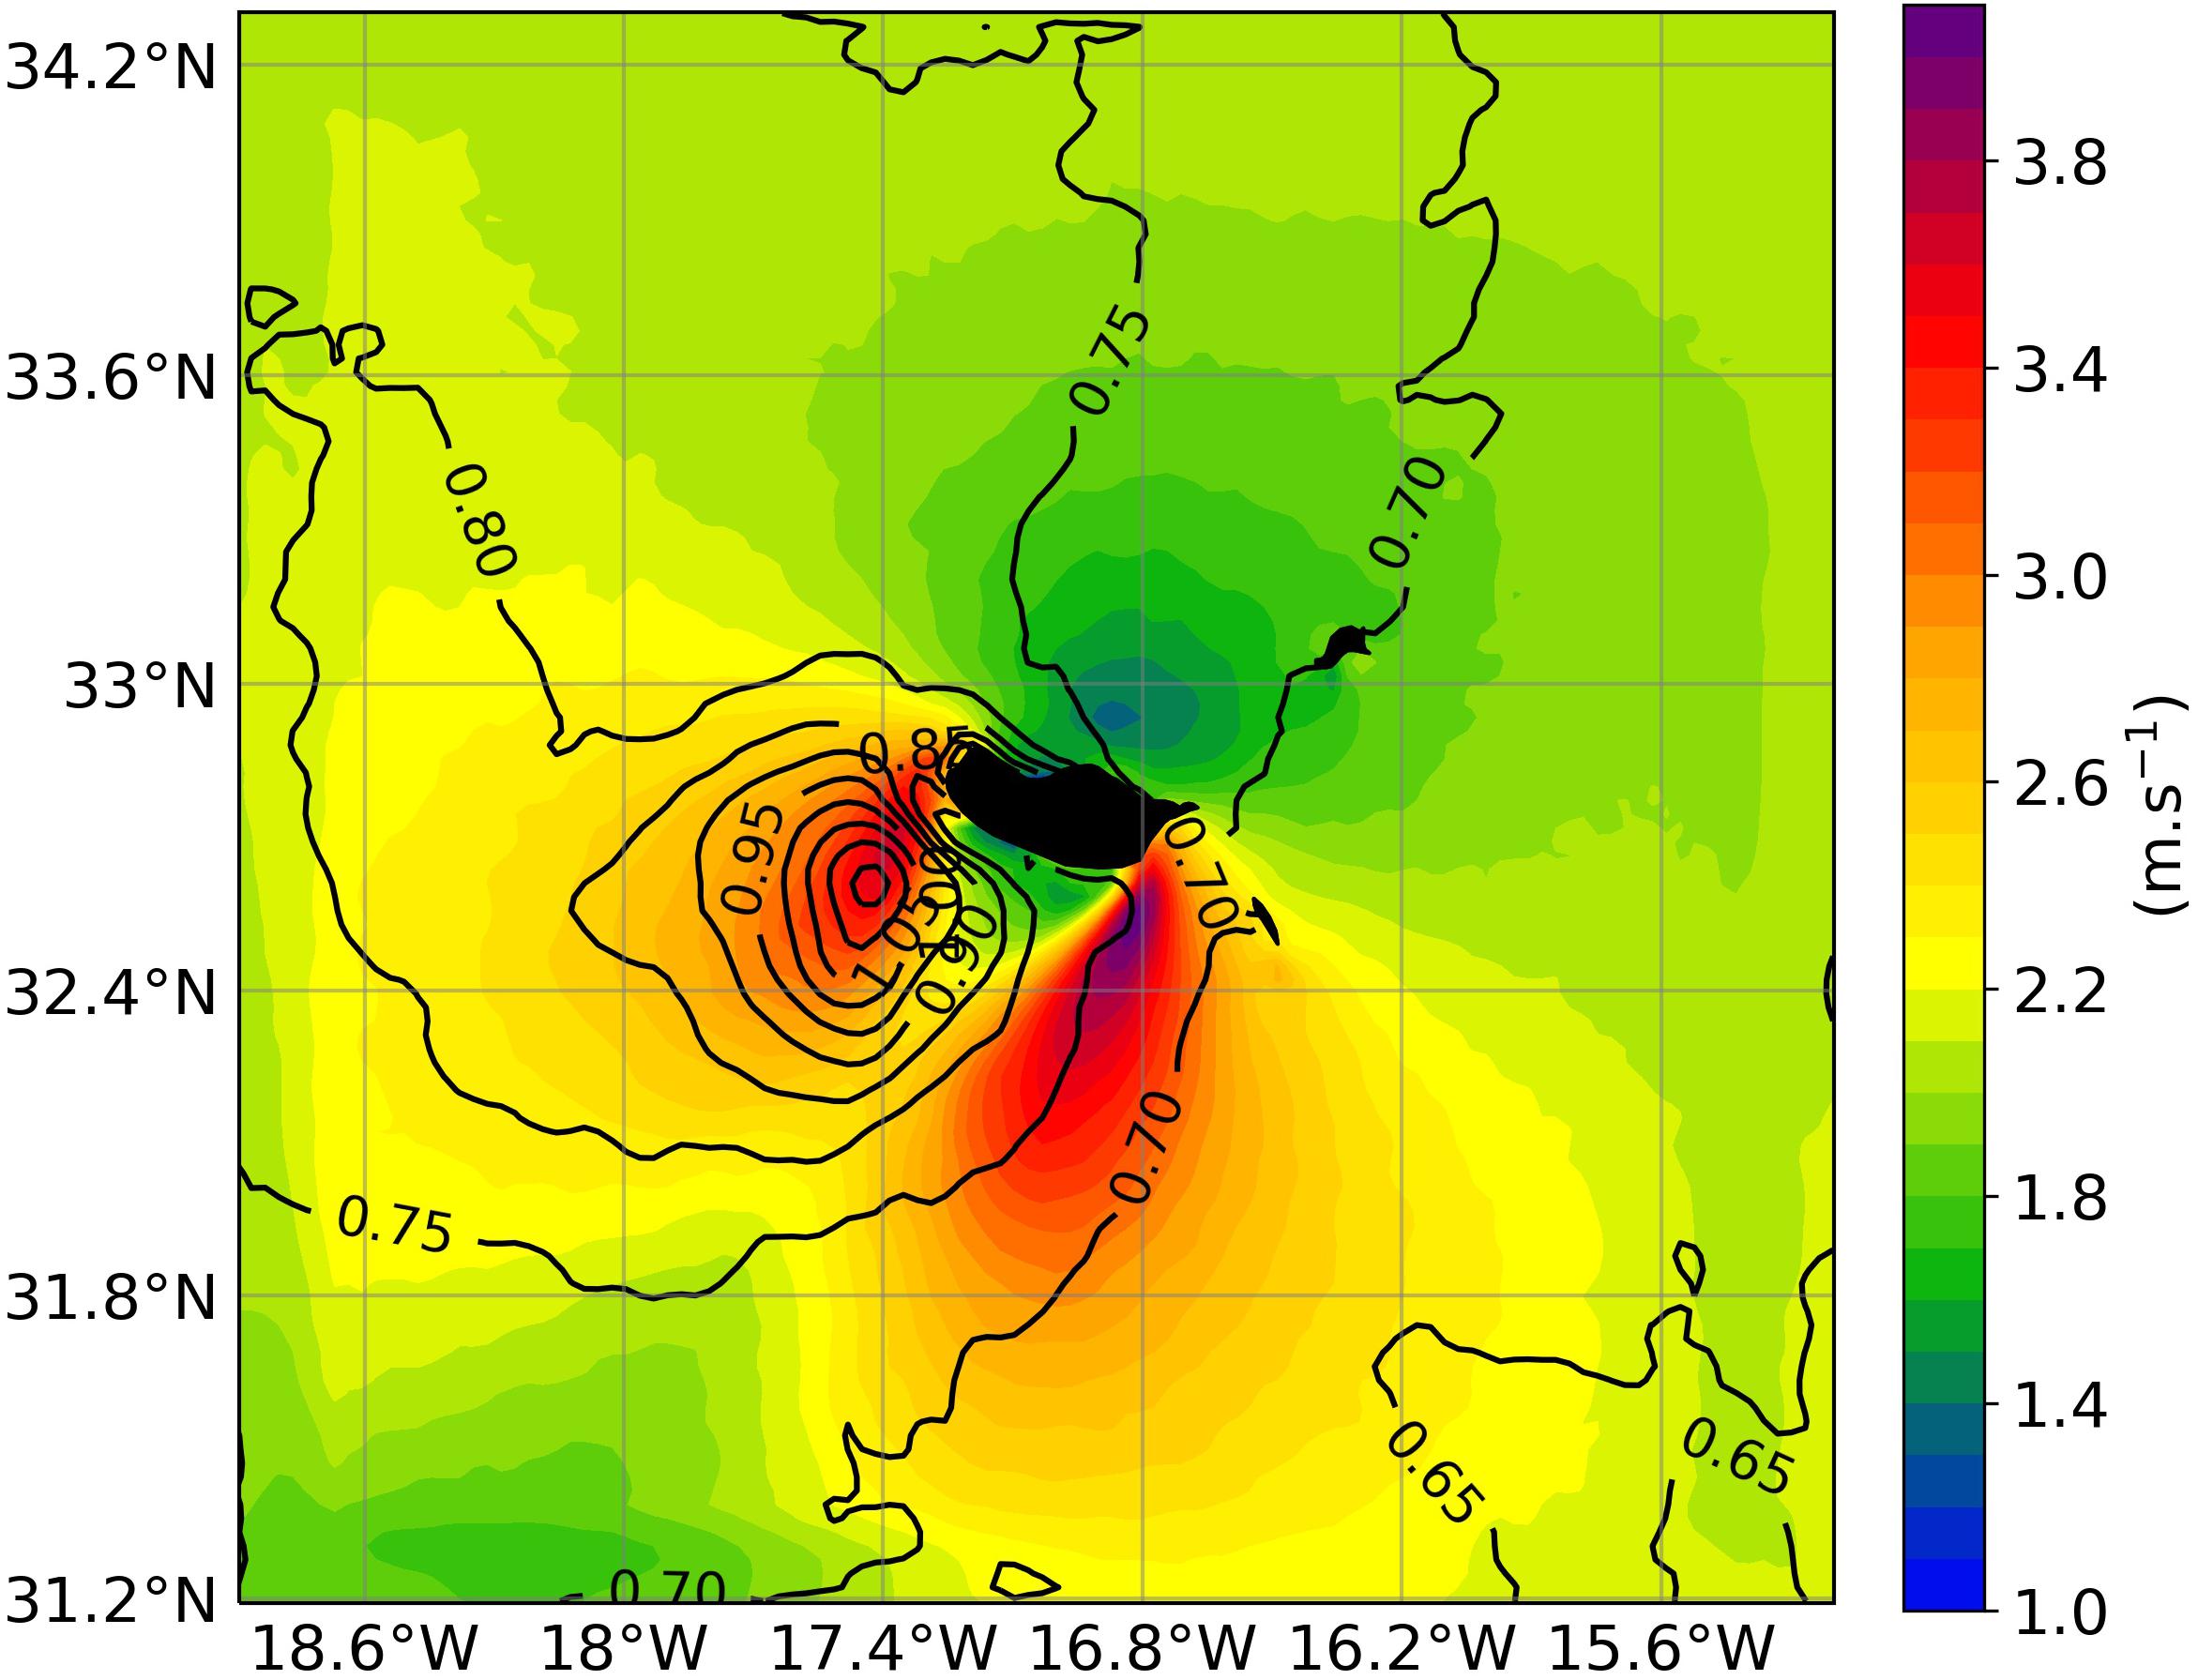
Figure 6. Interannual mean (1983–2017) of the summer (JJA) standard deviations of: wind (shading), and sea surface temperature (SST) (contour lines, °C).
Figure 6 also displays the intraseasonal summer variability of SST. While SST variability is driven by wind, there is a clear mismatch between wind variability, with two maxima in the two jets, and SST variability, with a single maximum under the west jet. This asymmetry between atmospheric forcing and the ocean response is explained by the asymmetry in the upper ocean circulation, later discussed, implying a stronger thermal response to wind variability near the west tip-jet.
The perturbed surface wind in the vicinity of Madeira imposes a very heterogeneous forcing on the upper ocean layers, through energy and momentum fluxes, which is reflected in the ocean surface temperature and 3D currents, particularly during summer, with higher wind speed in the tip-jets and lower wind speed in the wake. This wind environment favors the onset of cyclonic current anomalies near the west flank and anticyclonic anomalies near the east flank (Figure 7), which are the source of the frequent shedding of ocean eddies usually observed in the lee of Madeira (Caldeira et al., 2014). As also shown in Figure 7, this positive (negative) vorticity anomalies imply colocated upward (downward) currents near the west (east) flank. It is interesting to note that the small nearby islands produce qualitatively similar dipolar anomalies of vorticity, of a much smaller horizontal scale, as previously suggested by Caldeira and Sangrà (2012) (numerical) study.
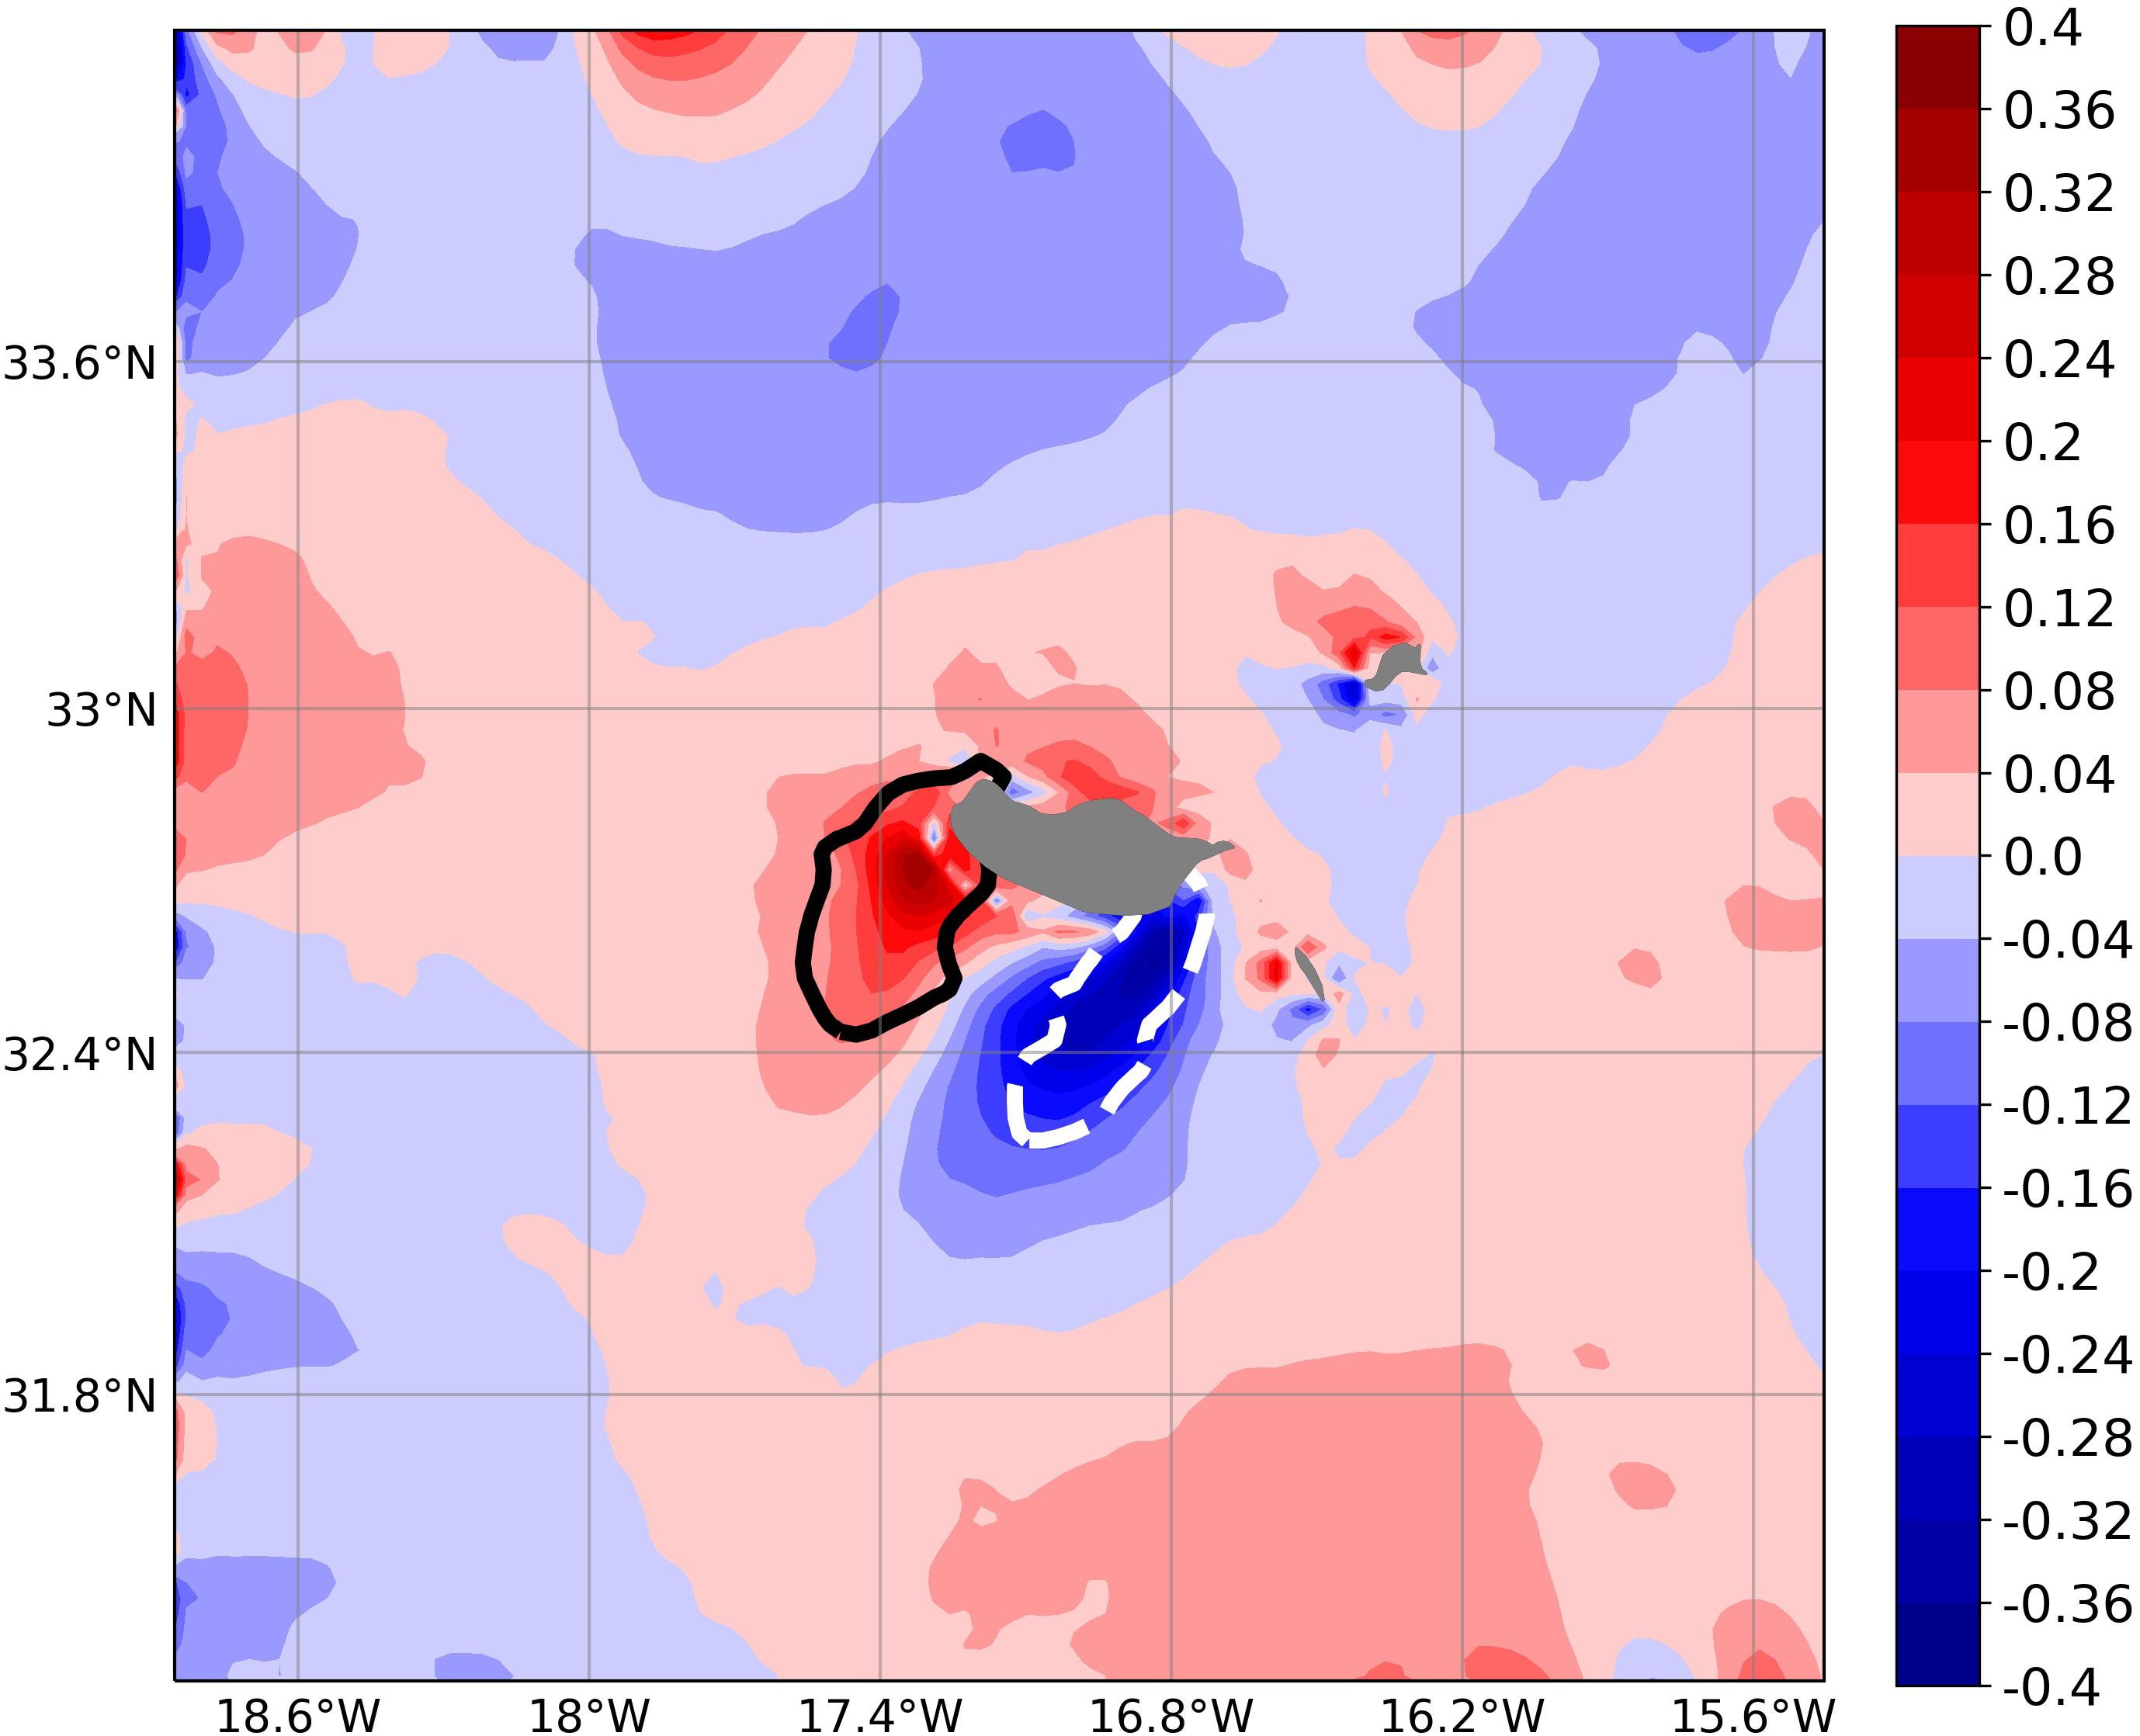
Figure 7. Summer mean (1983–2017) relative vorticity of the surface currents divided by planetary vorticity (f) (shading). Thick lines indicate the 20-m depth vertical velocity of +3 m/day (thick solid black line) and −3 m/day (dashed white line).
The asymmetry in the vertical current is also observed in the chlorophyll concentration, assessed by remote sensing data, particularly in the 2016 summer (a summer with intense tip-jets) characterized by high concentration anomaly near the west flank (Figure 8). We hypothesize that this may be due to the local upwelling intensification observed in the simulation (not shown).
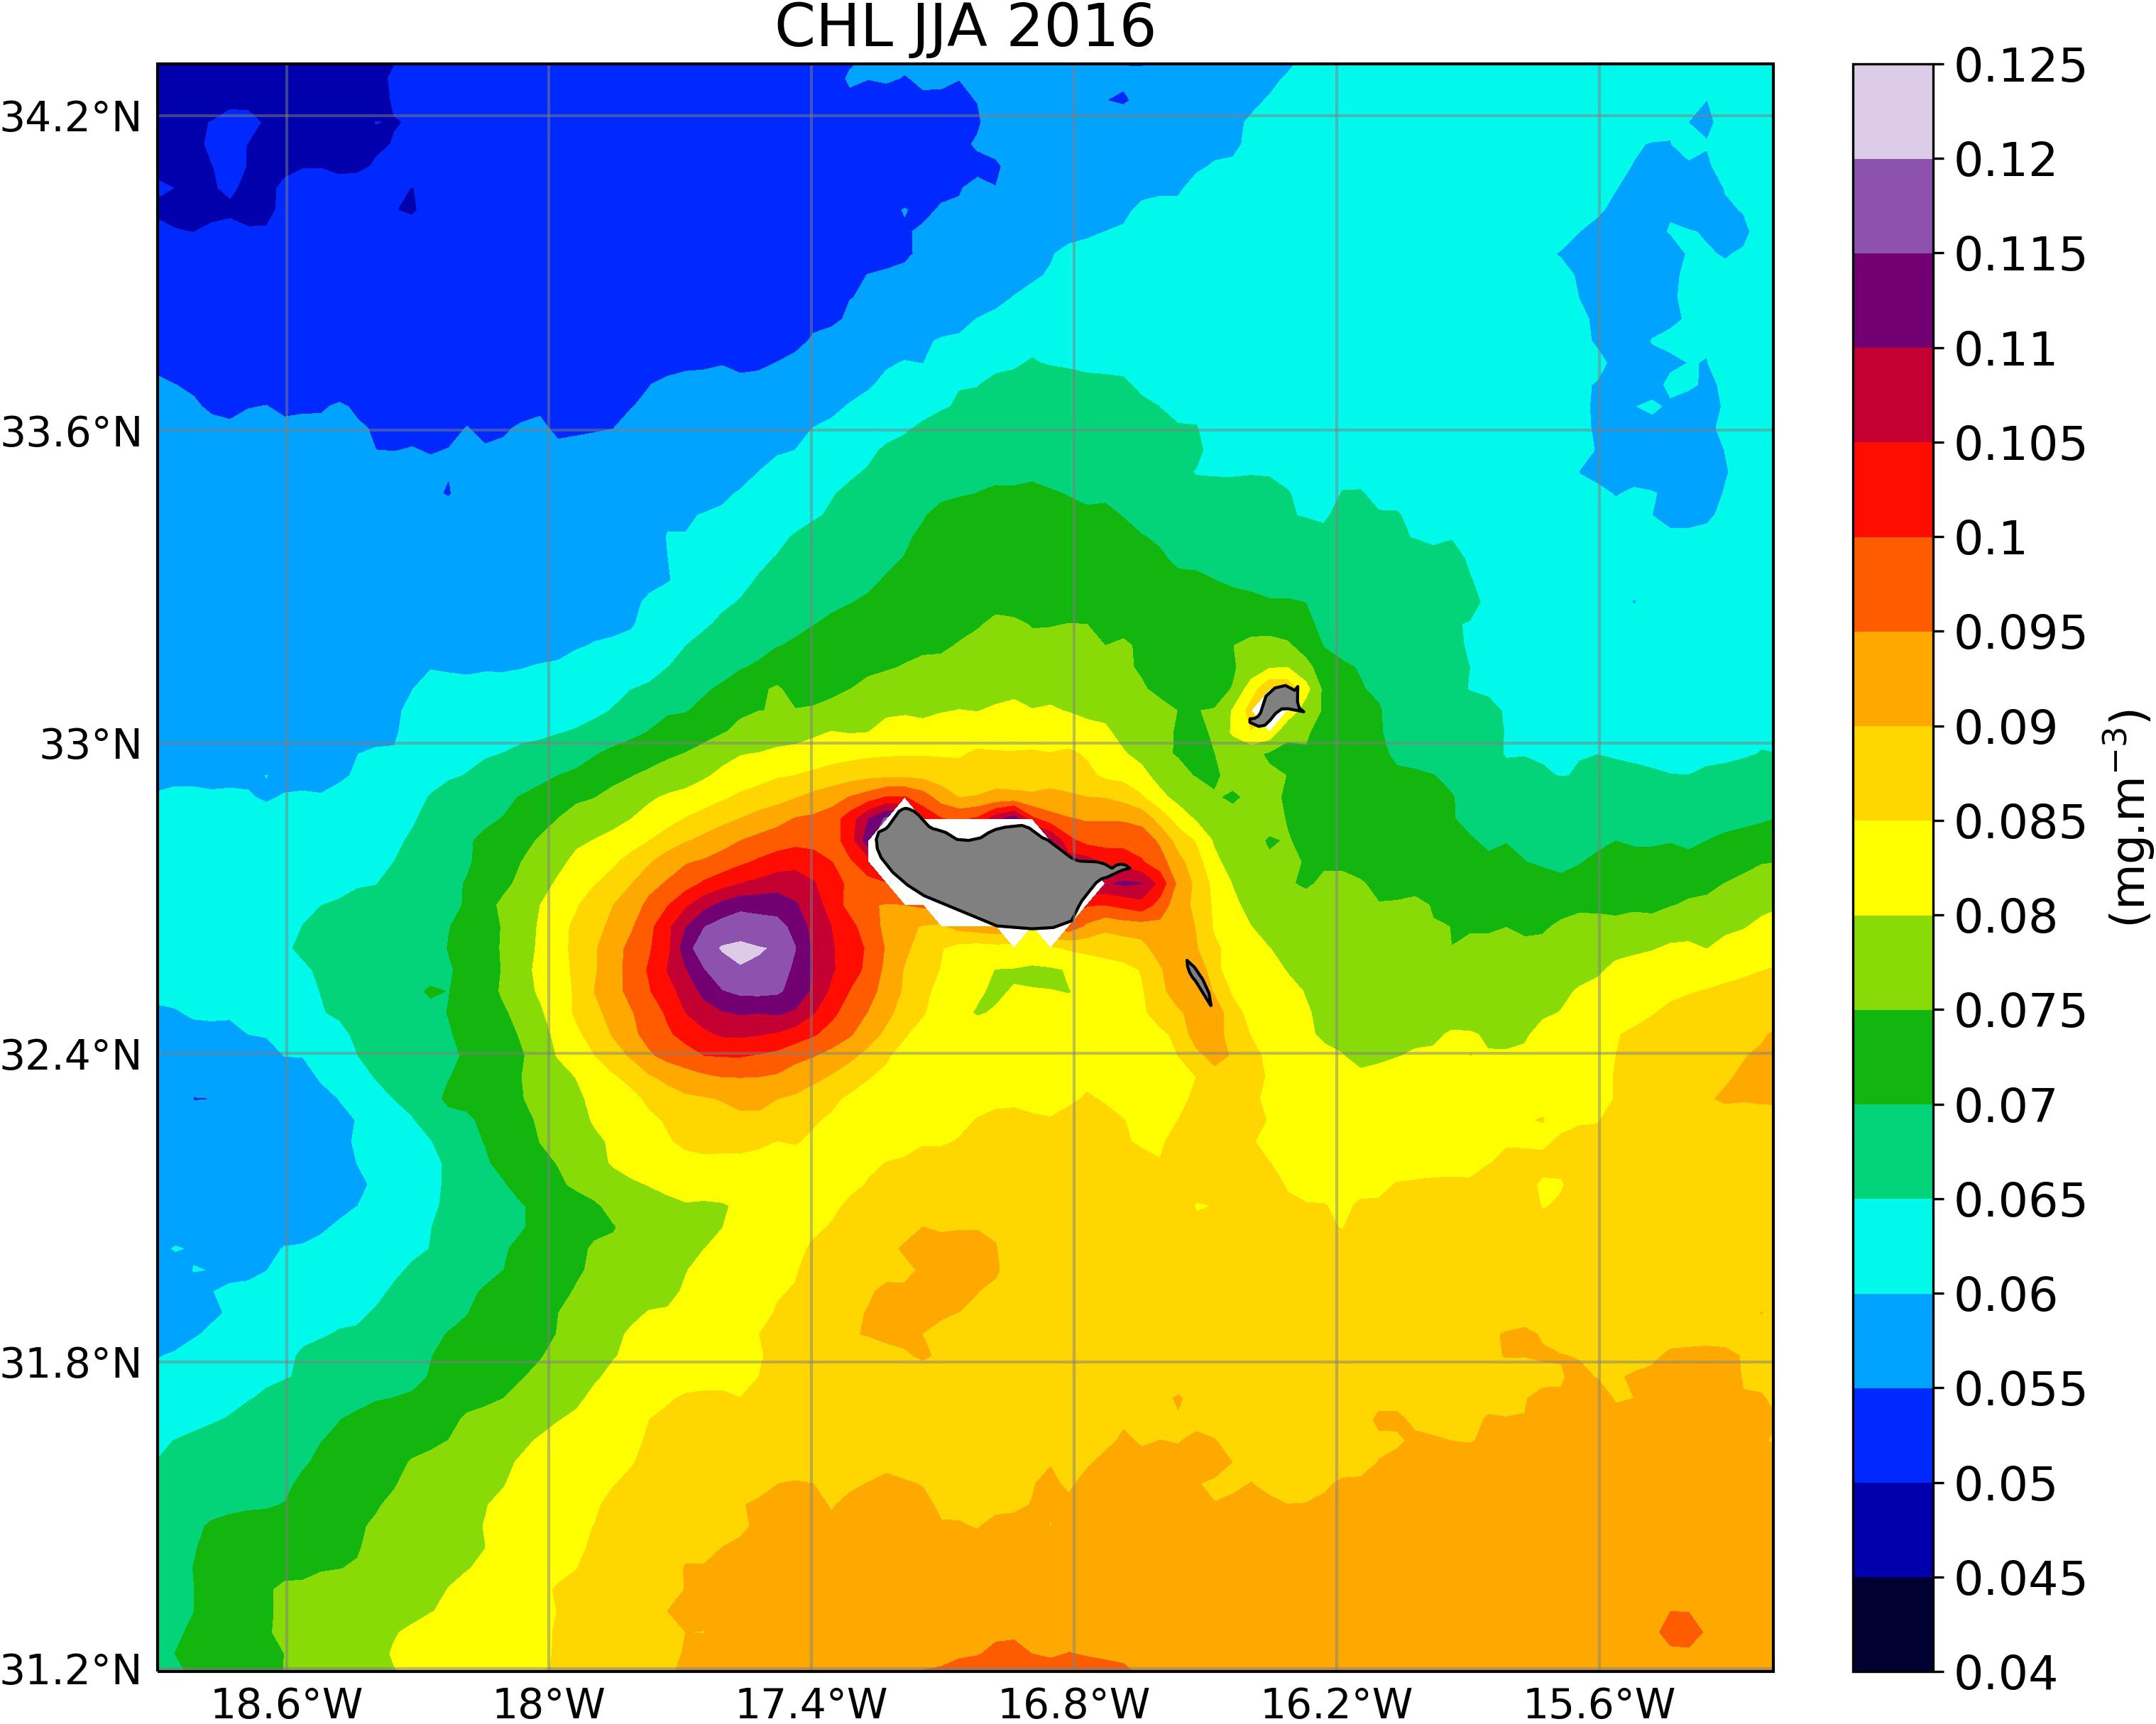
Figure 8. Mean 2016 summer (JJA) remote detected chlorophyll concentration, nearby Madeira, with 4 km resolution, based on the merging of the sensors SeaWiFS, MODIS, MERIS, VIIRS-SNPP&JPSS1, and OLCI-S3A&S3B.
The effect of the tip-jets is clearly visible in the summer mean SST and mixed layer depth (MLD). The latter was computed considering a threshold of | Δρ| < ± 0.3 kg/m3 in the upper density vertical profiles (chosen considering the high stratified upper ocean layers near Madeira, during summer). In Figure 9A, the ocean surface is locally cooler at both jets, as one would expect from enhanced evaporative cooling, but cooling is much stronger near the west jet because extra cooling is provided there by local upwelling (in a stably stratified ocean), as shown in Figure 7, whereas the local downwelling (associated with the east anticyclonic eddies) produces no relevant signature. An asymmetric pattern is also observed in the MLD (Figure 9B) with shallower mixed layer in the west upwelling region and a deeper one in the east downwelling sector.
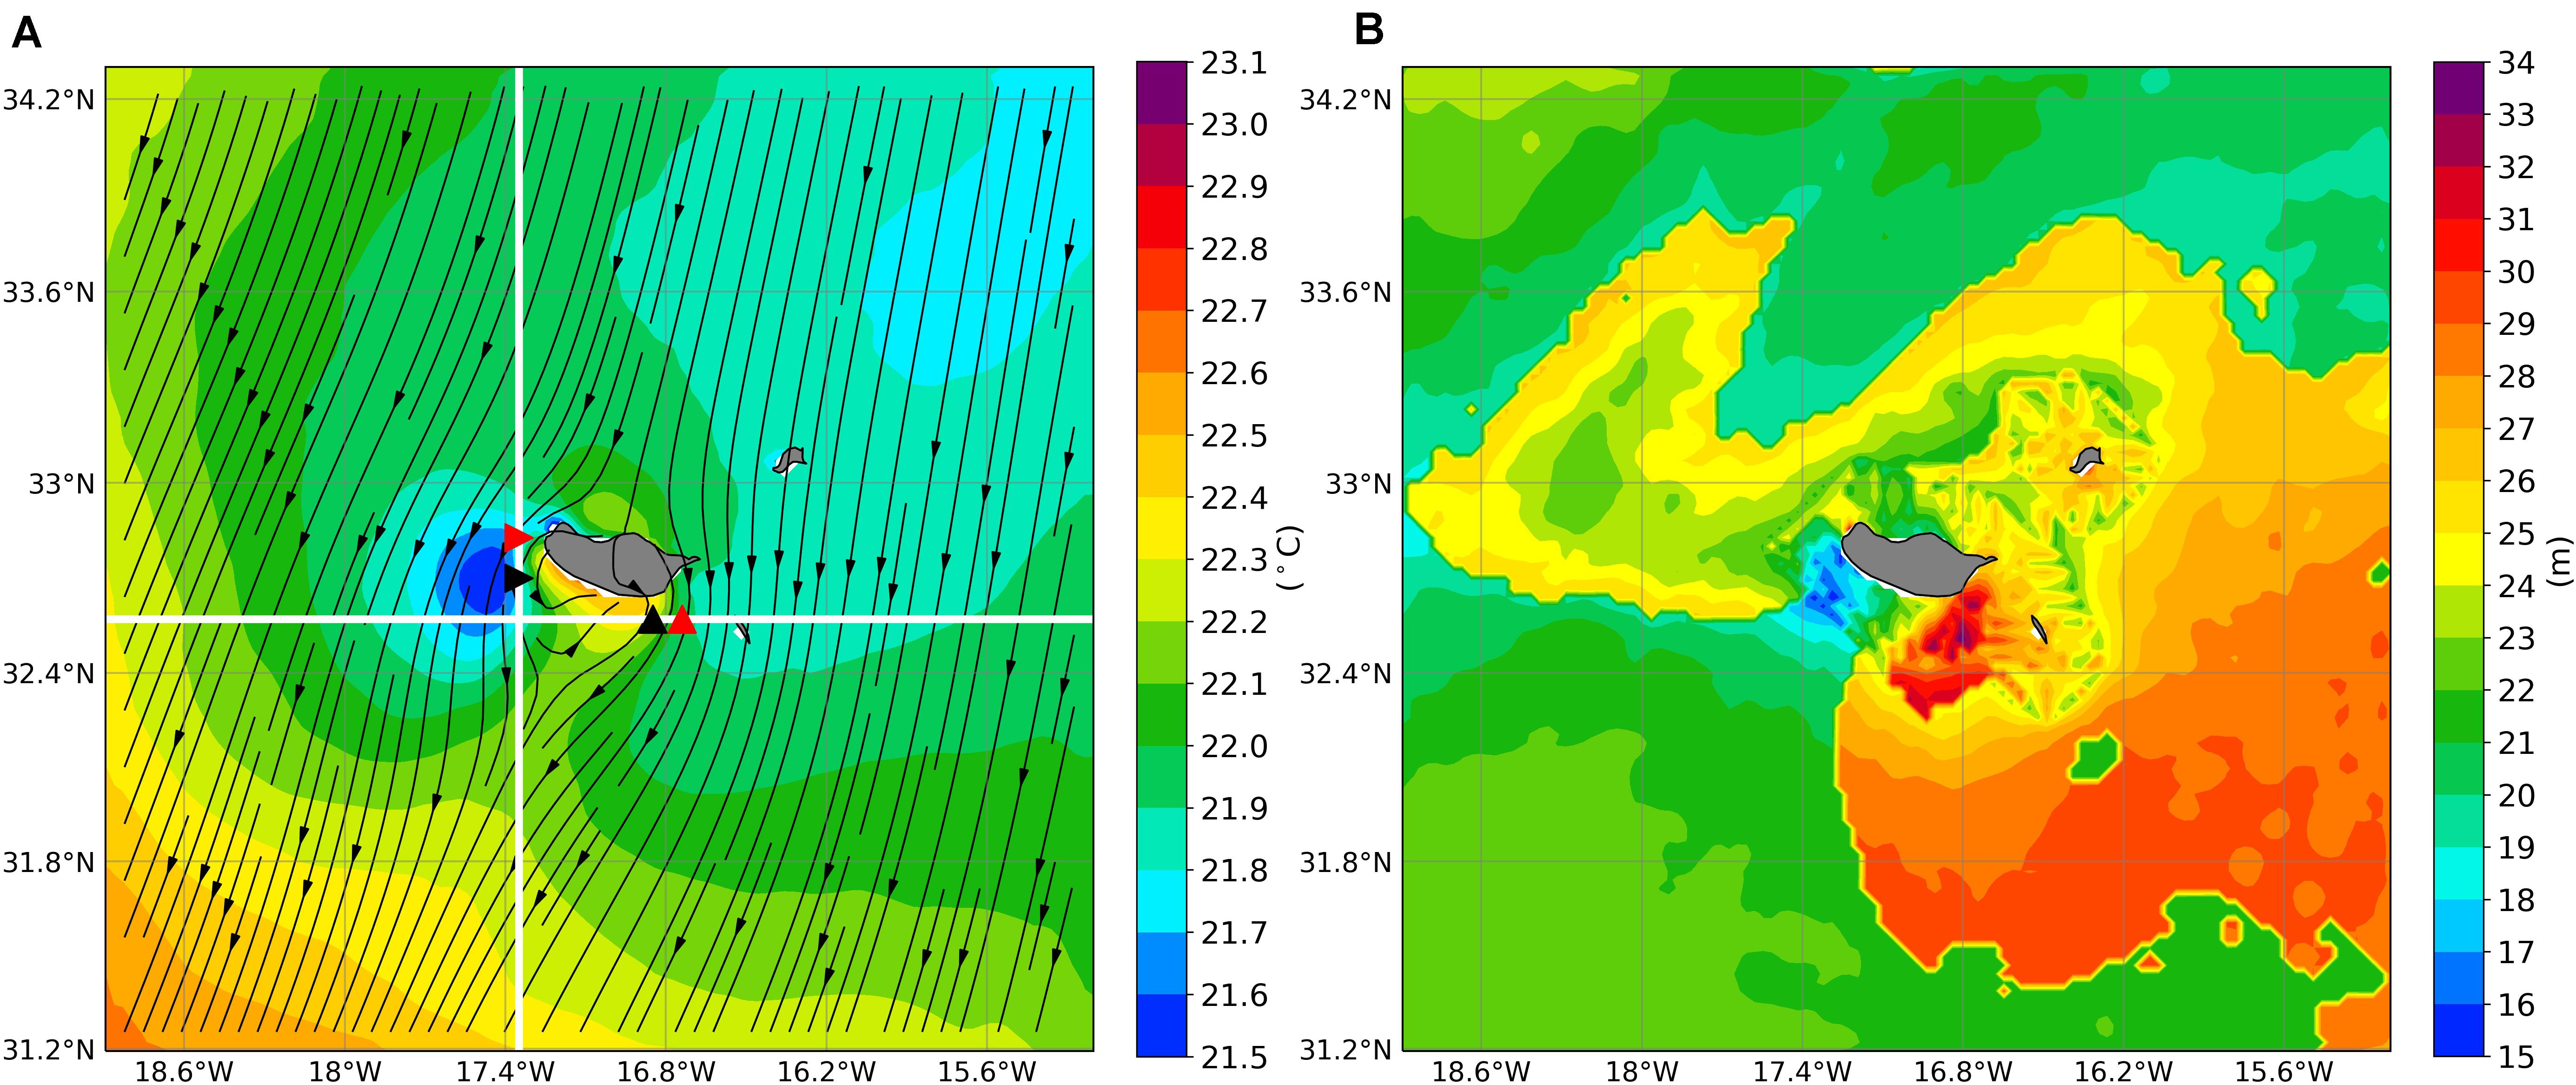
Figure 9. Mean (1983–2017) summer (JJA): (A) sea surface temperature (SST) and (B) Mixed Layer Depth (MLD). White lines in panel (A) indicate Figure 10 cross-sections, black triangles zone of the maximum perturbed ocean in depth and red triangles maximum wind speed, along each section.
As shown in the MLD spatial distribution and ocean vertical currents, the tip-jets effect on the ocean goes well beyond the ocean surface. To analyze the undersurface effect in the upper ocean stability, Figure 10 shows vertical cross-sections of ocean static stability, given by squared Brunt–Väisälä frequency in the zonal and meridional directions, following the lines shown in Figure 9A. During summer, near the east jet (Figure 10A), a locally decreased vertical stability is shown by a deepening of the pycnocline. The opposite is observed near the west jet (Figure 10B). At both locations, the perturbations in the top 30 m are compensated by opposite perturbations below, with respect to surrounding water. Below 120 m, the stability field is almost flat (not shown). A detailed look shows that the maximum impact in the upper ocean (black triangles) is located near the maximum wind speed variability and not in the maximum mean wind (red triangles) (cf. Figure 9A), since the maximum wind variability coincides with maxima in ocean vorticity and vertical current, showing the importance of the tip-jets and wake for the upper ocean imposed perturbations. This is in line with the Couvelard et al. (2012) study, which suggested that there was a transfer of momentum (wind stress curl) from the atmosphere to the ocean, which contributed to the generation of the oceanic eddies at the island flanks. A rather different pattern is shown in the corresponding winter cross-sections (Figures 10C,D) with a much better mixed upper ocean and lower pycnocline (dashed line), probably due to the lower incident radiation during winter and the better ocean capacity to transport the heat to its interior. As a consequence, during this season, the tip-jets impact in the upper ocean is attenuated.
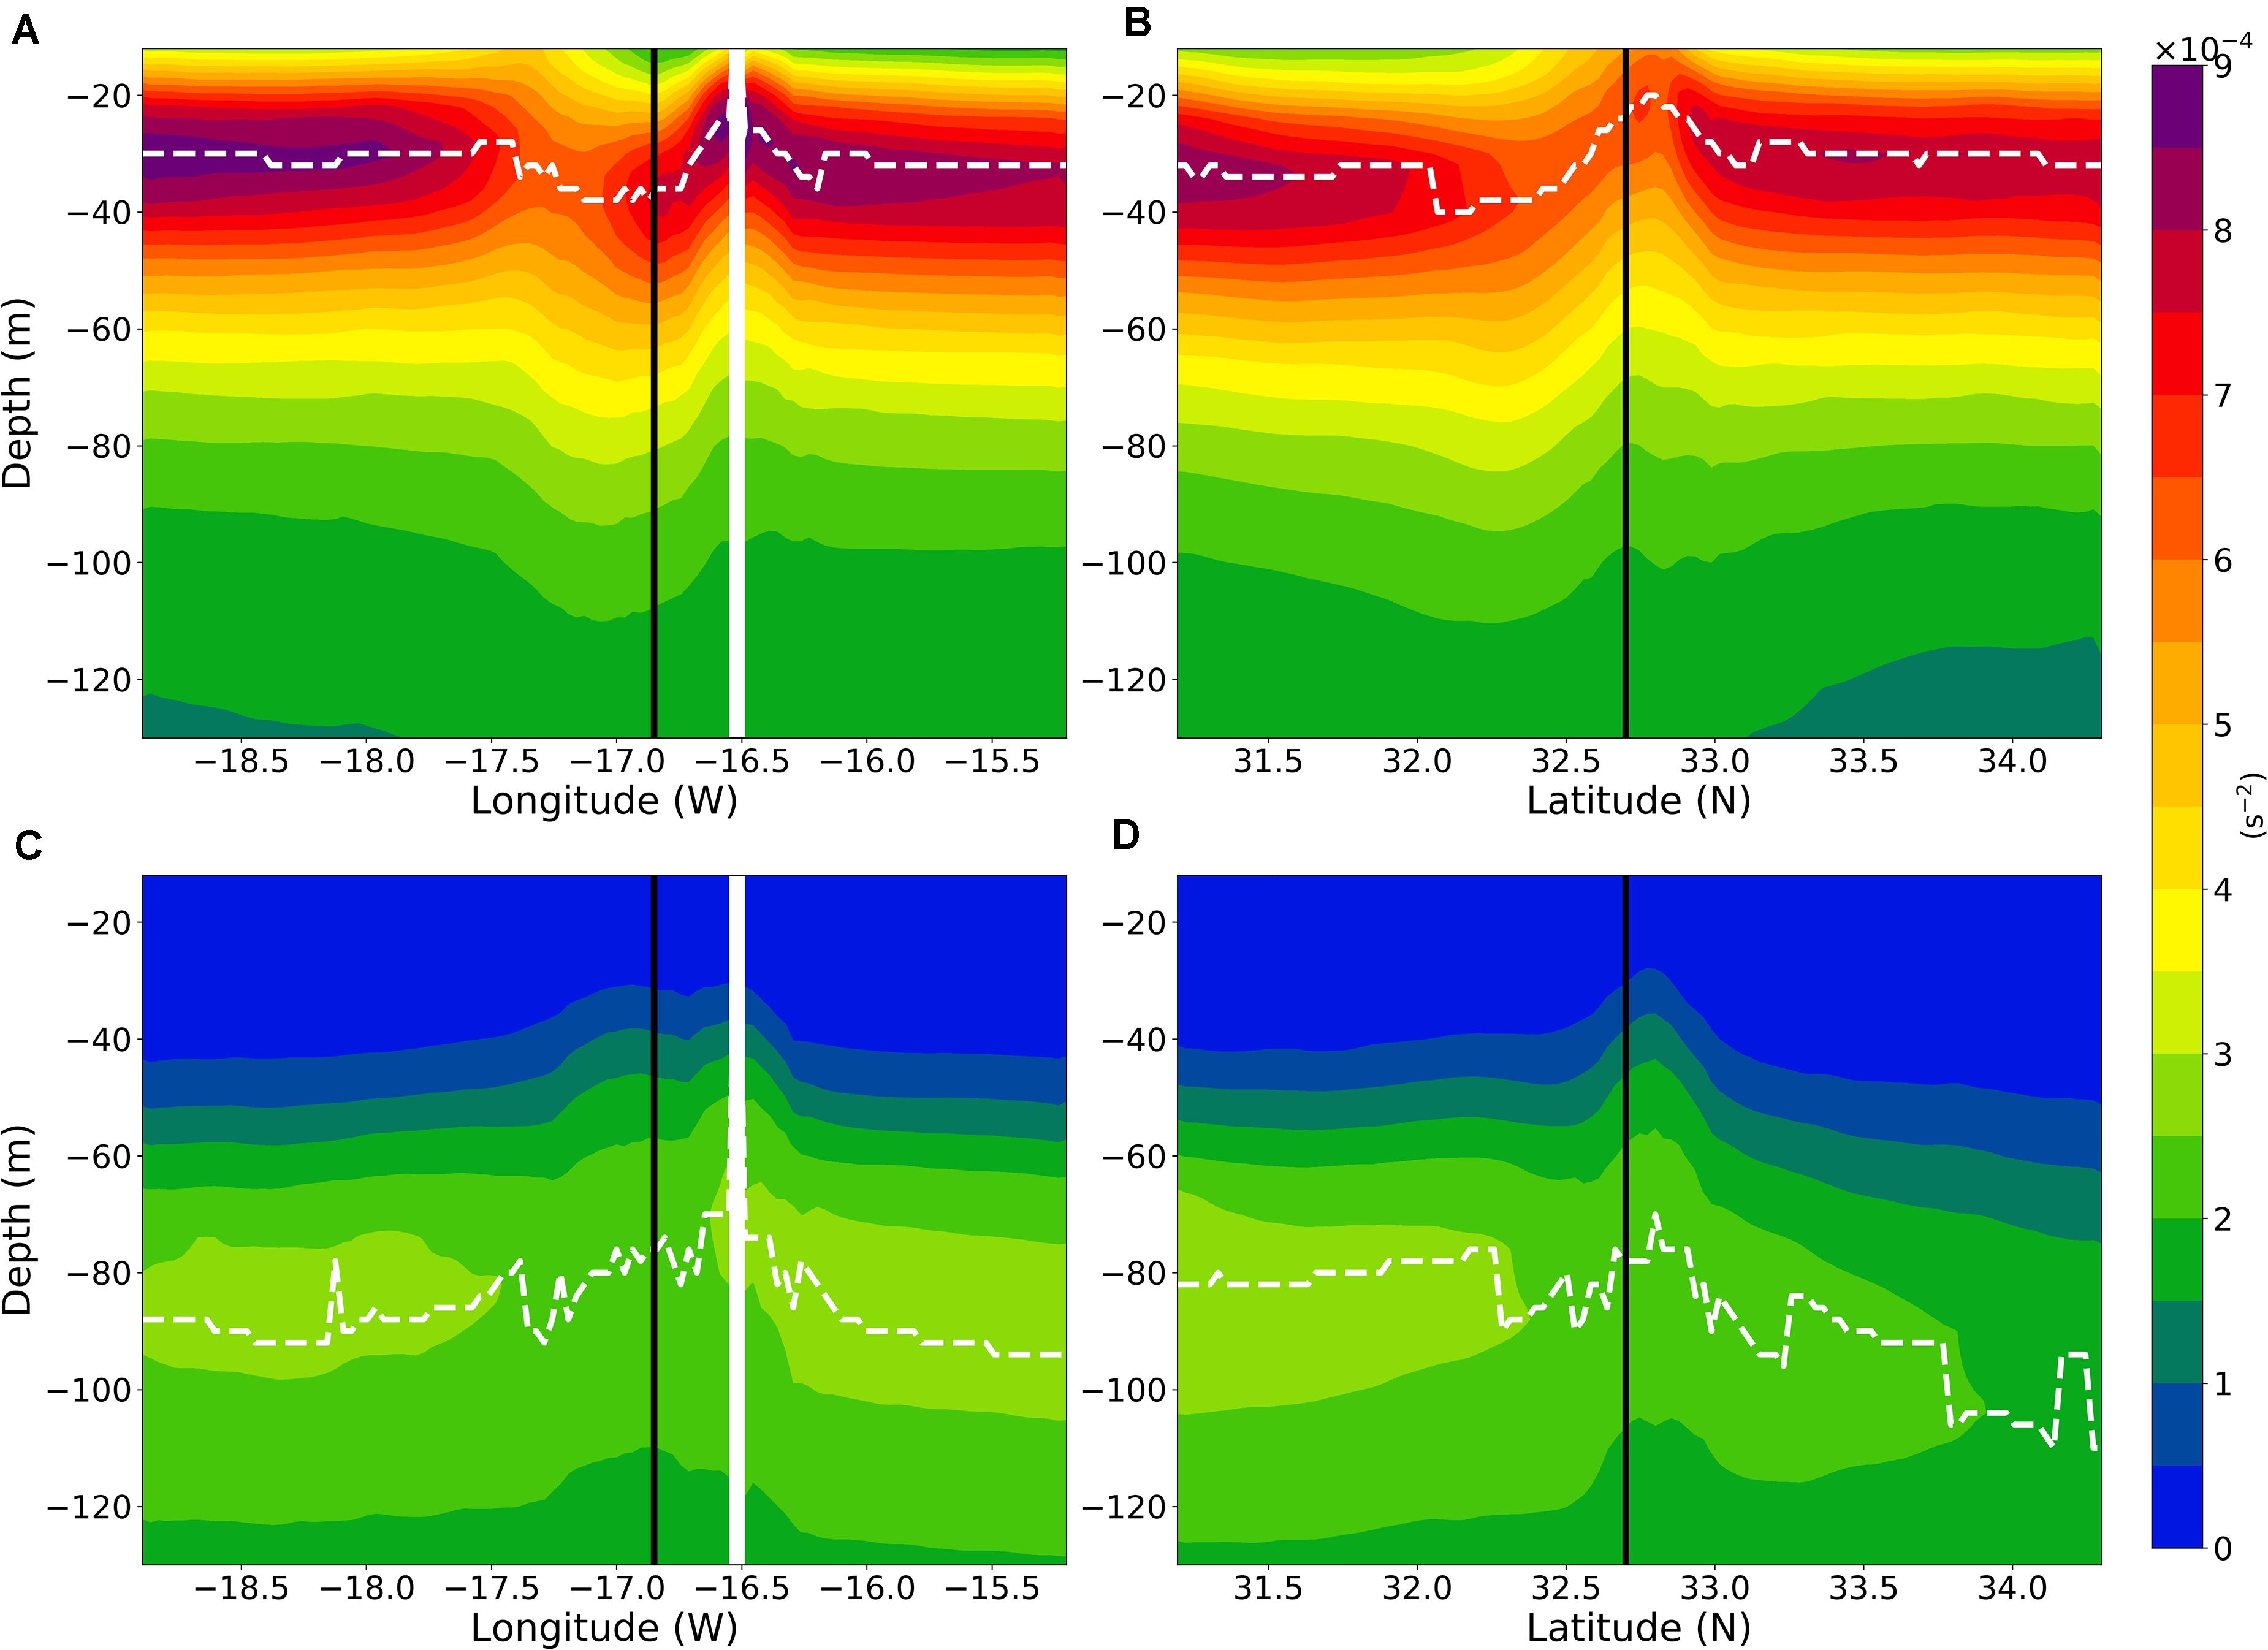
Figure 10. Mean (1983–2017) ocean summer (JJA) cross-sections of squared Brunt–Väissälä frequency (s-2): (A) zonal section at 32.6N; (B) meridional section at 16.85W. Vertical black lines indicate location of maximum perturbed upper ocean. White bar in Figure 10A) is due to Desertas island. White dashed line shows depth of maximum N2. (C,D) similar to (A,B), respectively, but for winter (DJF).
The shallow MLD observed in summer means a lower ocean heat capacity and consequently a higher SST sensitivity to atmospheric warming. However, there are, at least, two mechanisms that may lead to an attenuation of the ocean surface warming. One is an increased evaporative cooling that would be produced by tip-jet intensification (Miranda et al., 2021); the other is the intensification of the upwelling current associated to cyclonic vorticity near the west tip-jet (not shown), which may lead to a further attenuation of SST warming or even to local cooling. Both processes are controlled by the interdecadal variability of the tip-jets.
Figure 11 shows trends of summer 10-m wind, computed by the nonparametric Theil–Sen estimator (Sen, 1968, Theil, 1992), after filtering time series at each grid point by removing the mean annual cycle. This technique computes a central estimate of the trend and upper and lower estimates at the (chosen) 95% confidence level. In Figure 11, the central estimate is only shown when upper and lower estimates have the same sign. That is the case in both jets, which are found to have been intensifying slightly more than 0.7 m/s in 35 years.
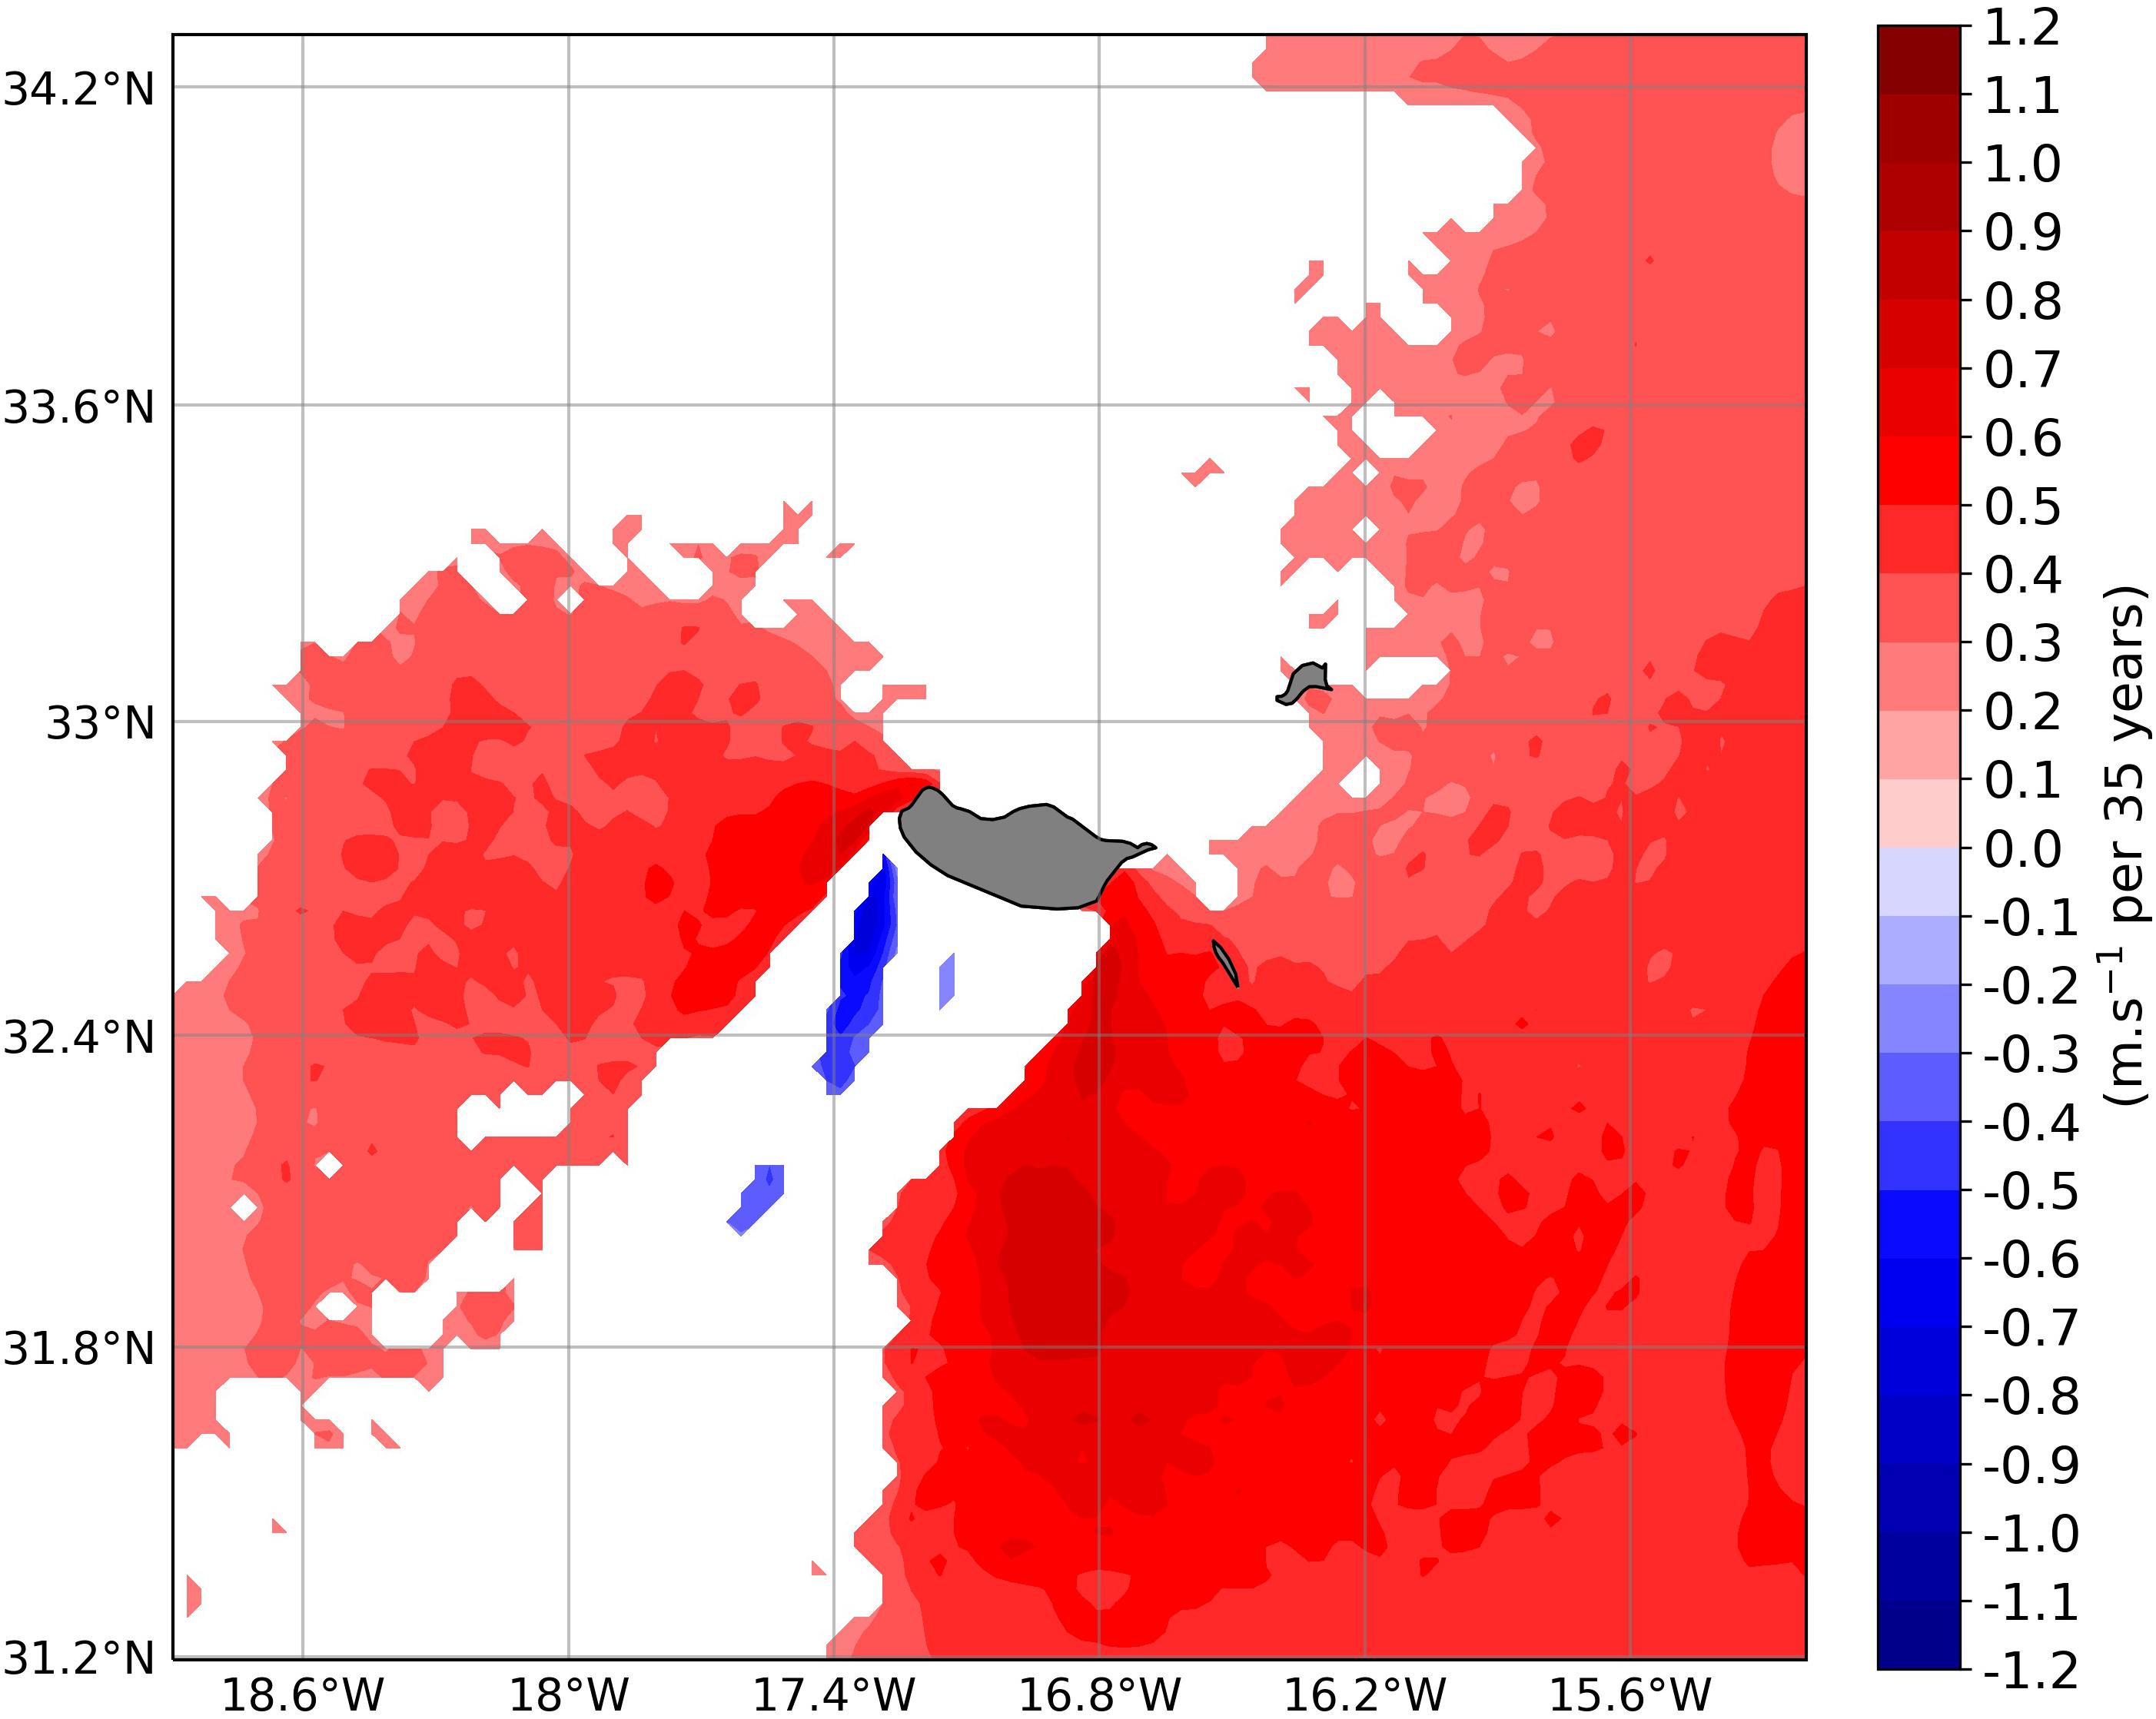
Figure 11. Summer (JJA) (1983–2017) wind speed trend, computed with the Theil–Sen method. Only zones with the same sign in the 95% upper and lower bounds are shown.
Results using the same method (Theil–Sen) applied to summer SST are shown in Figure 12. In this case, all estimates are presented, as the underlying positive trend would mostly avoid negative estimates even from the lower estimate. The mean warming trend is found to be around +0.5°C/35 years but with a lot of spatial heterogeneity. Trends in the west jet are, however, much smaller with a minimum approaching zero, indicating that enhanced upwelling at those locations has been able to compensate most of global warming.
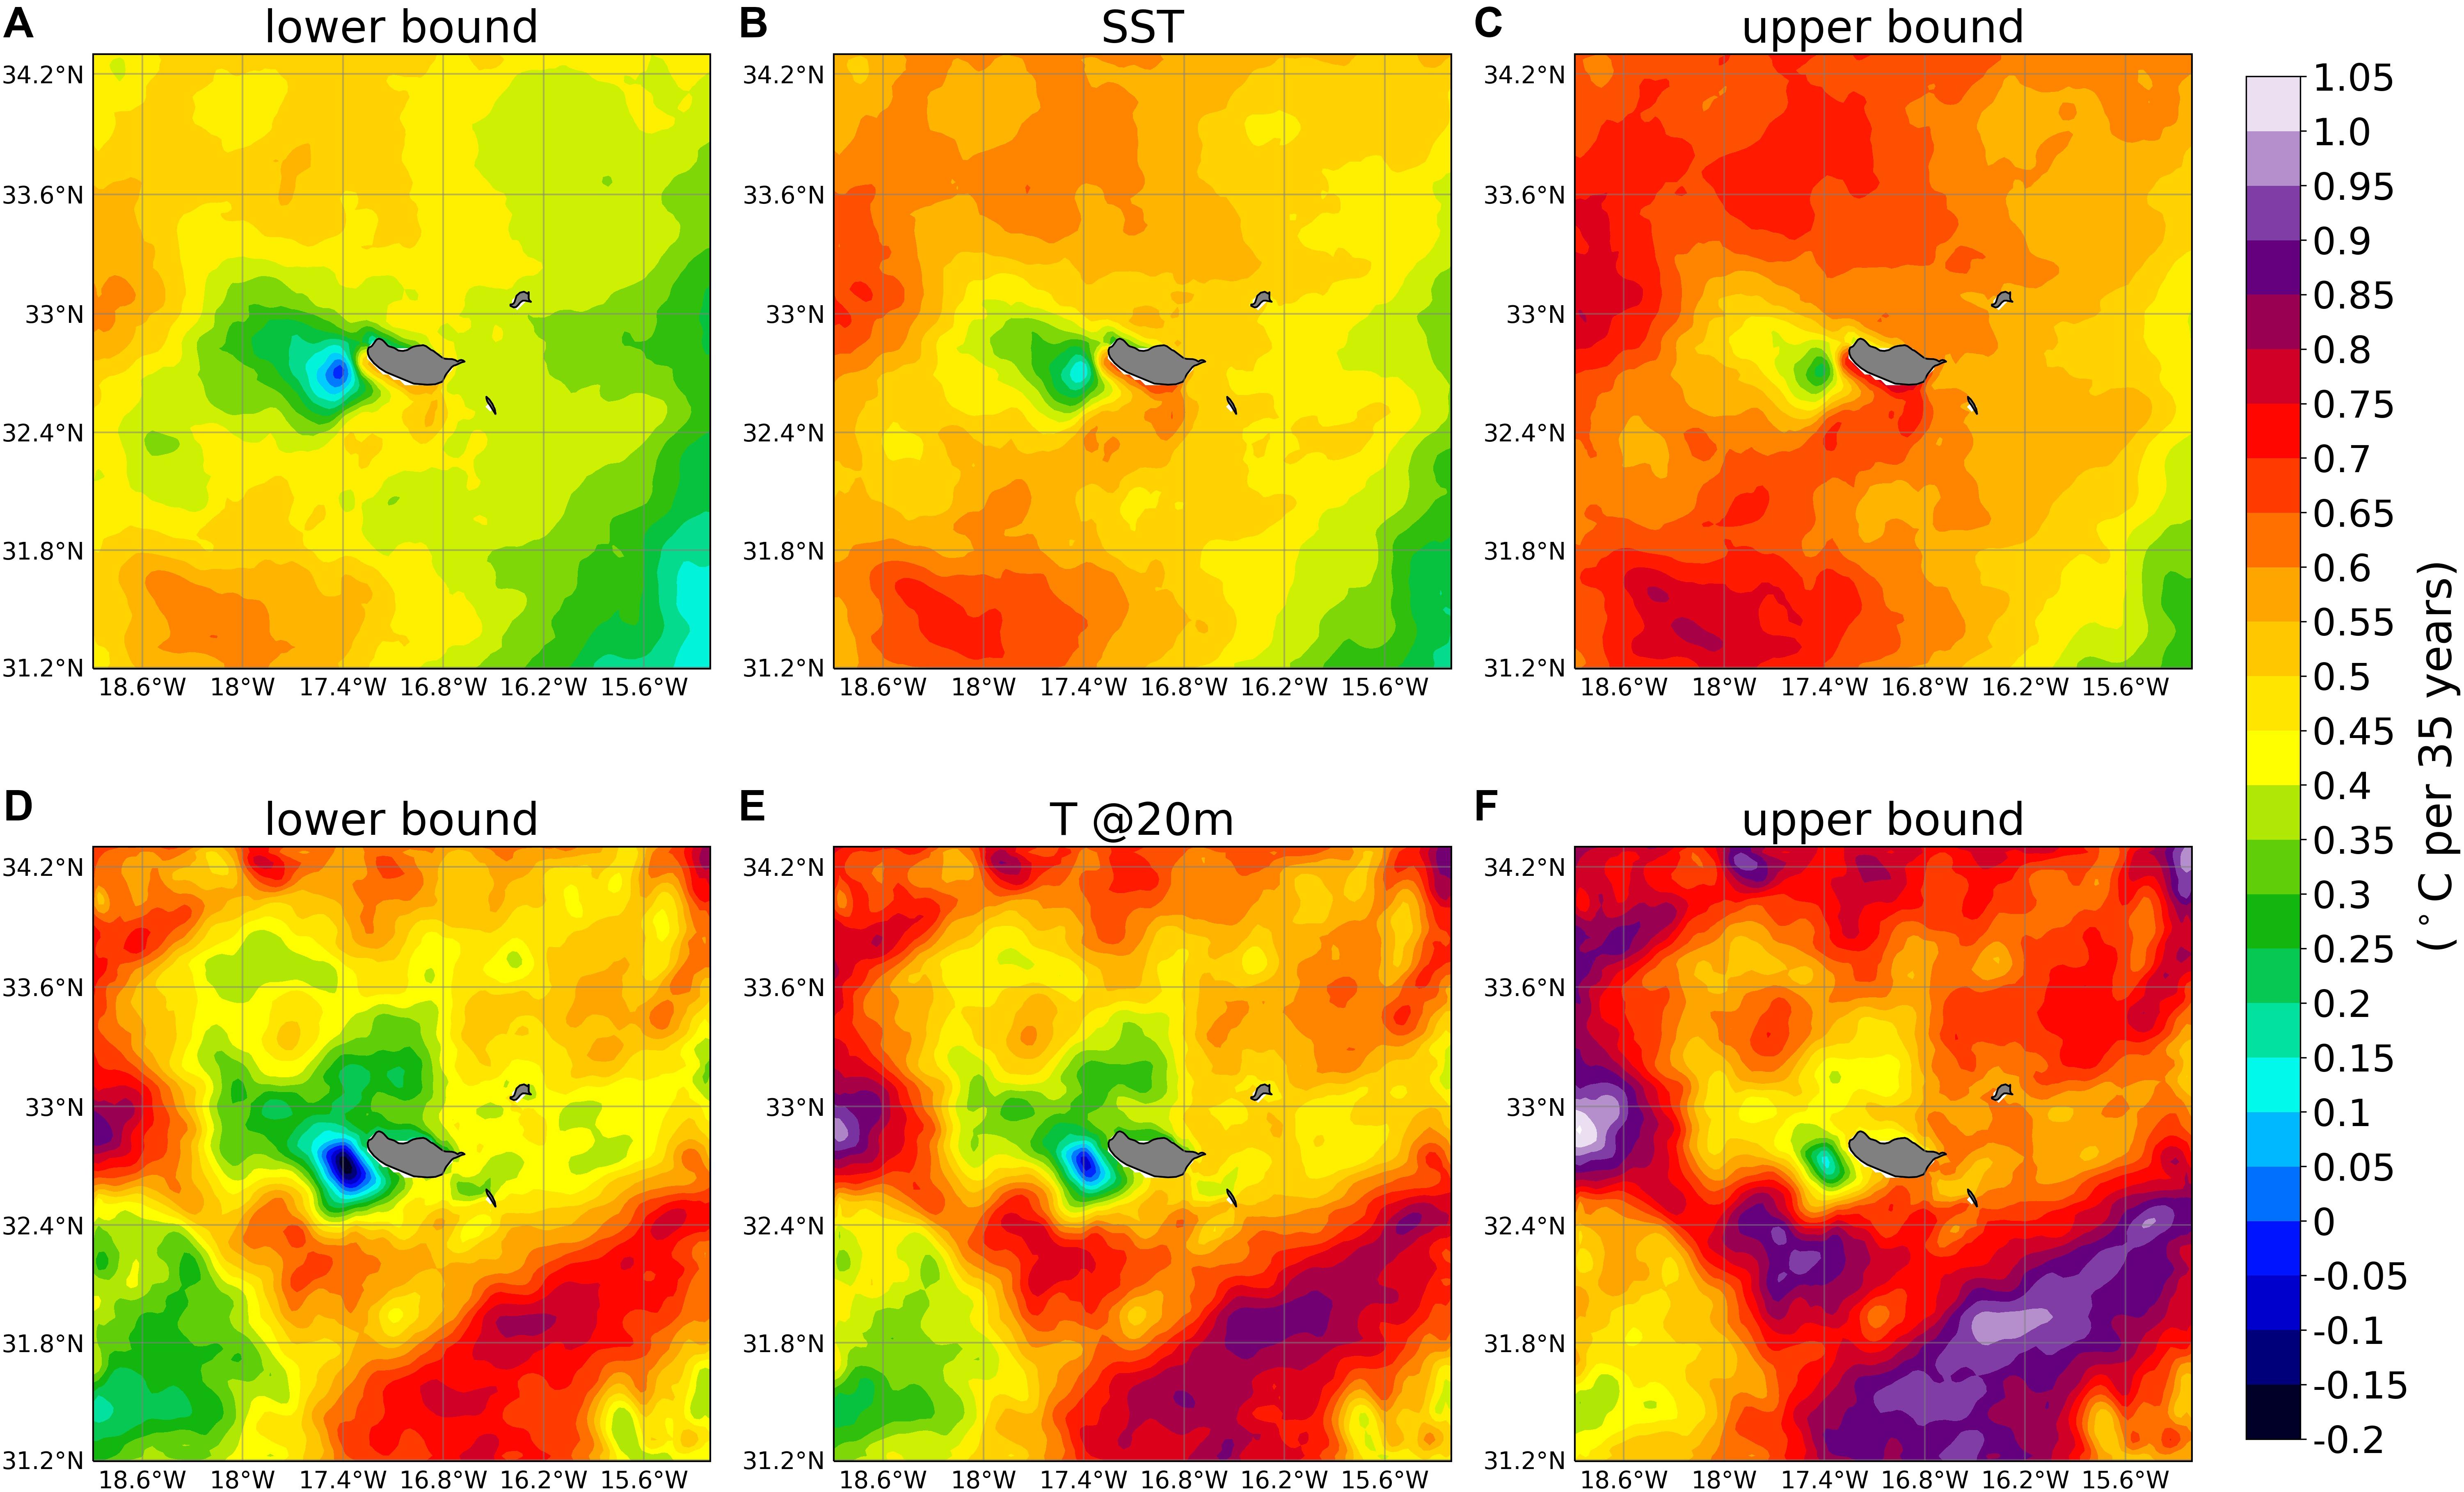
Figure 12. Theil–Sen estimates of the summer (JJA) ocean temperature trend (1983–2017): surface (A) Lower bound, (B) central estimate, and (C) upper bound; 20 m depth (D) Lower bound, (E) central estimate, and (F) upper bound. Upper and lower bounds were estimated at the 95% confidence level.
The ocean temperature trend at 20 m also shows high spatial heterogeneity, with zones where the warming is more intense than at surface and zones where the inverse is observed, particularly near the west flank upwelling zone. Interestingly, the mean ocean temperature warming trend at 20 m (Figure 12E) is slightly higher (about +0.06°C per 35 years) than on the surface, suggesting a decoupling between the surface processes expose to daily wind and thermal variations and the interior oceanic mixed layer, as suggested by Azevedo et al. (2021)
The complex atmospheric and ocean circulations around Madeira Island, and off many other islands and archipelagos, may interact in unexpected ways with the large-scale circulation. The Madeira location in the NE Atlantic subtropics gives it a rather steady wind regime, under a predominant northeasterly flow, often corresponding to the NE Atlantic trade wind. That flow gives rise to local acceleration near the island tips, especially in summer, where two tip-jets are almost always present, and the flow shows very low values of directional variability but very high values of wind speed variability.
Miranda et al. (2021) have recently shown that the tips-jets are driven by flow acceleration under low PBL height and that such process has intensified significantly in the ERA5 period (1979–2018), due to a progressive lowering of the PBL height. The present study showed that variability in the tip-jets from the intraseasonal to the interdecadal time scale leads to ocean variability with an asymmetric response in the island flanks: while both jets evidence interdecadal intensification, this leads to a much stronger response in the west jet with decreased warming of surface waters driven by enhanced upwelling in a region where cyclonic eddies are often produced. The opposite sign of vorticity produced at the two jets leads to a dipolar response of the summer mixed layer depth: shallower under the west jet; deeper under the east jet. These changes in the ocean environment around Madeira may be relevant for the local marine ecosystem. For instance, the simulated enhanced warming at depth may be important, as mentioned in a modeling study off the west coast of Australia (Ryan et al., 2021), showing that ocean warming events at depth have caused mass die-offs of marine organisms, with coral bleaching, and relevant impact in the fisheries that depend on them. Previous numerical simulations also suggested that submesoscale eddies (1–100 km) can achieve important vertical transports in the upper ocean, contributing to efficient exchanges with the permanent thermocline (Callies et al., 2015), taking heat and atmospheric gases down into the deep ocean and bringing nutrients up into the surface layer and increasing primary production, essential for the maintenance of the Madeira ecosystem (Narciso et al., 2019; Ribeiro and Neves, 2020).
While some of the results presented here were broadly validated against available remote sensing observations, and benefit from the obvious quality of ERA5 forcing fields, it is clear that specific ocean observations would be required to confirm these results, especially in what concerns the subsurface impacts. An extension of the methodology used here for a more extended spatial domain, encompassing the Canary current system, and for climate change scenarios appears justified, as it could help in the discussion of a still open question: the response of the North African upwelling system to climate change (Bakun, 1990; Alves and Miranda, 2013, Barton et al., 2013; Miranda et al., 2013, Sydeman et al., 2014).
The raw data supporting the conclusions of this article will be made available by the authors, without undue reservation.
JA and RT carried out the numerical simulations. JA and PM analyzed the data and wrote the manuscript in close collaboration with RC. All authors participated in the review process and approved the final version.
This work was supported by the Oceanic Observatory of Madeira Project (M1420-01-0145-FEDER-000001-Observatório Oceânico da Madeira-OOM). We also acknowledge the FCT financial support through project UIDB/50019/2020 (IDL).
The authors declare that the research was conducted in the absence of any commercial or financial relationships that could be construed as a potential conflict of interest.
We acknowledge our data providers, listed in Experimental Setup. Finally, we acknowledge IDL for providing the computational resources to perform the numerical simulations.
Alves, J. M. R., Caldeira, R. M. A., and Miranda, P. M. A. (2020). Dynamics and oceanic response of the Madeira tip-jets. Q. J. R. Meteorol. Soc. 146, 3048–3063. doi: 10.1002/qj.3825
Alves, J. M. R., and Miranda, P. M. A. (2013). Variability of Iberian upwelling implied by ERA-40 and ERA-Interim reanalyses. Tellus A 65:19245. doi: 10.3402/tellusa.v65i0.19245
Azevedo, C., Camargo, C., Alves, J., and Caldeira, R. M. A. (2021). Convection and heat transfer in island (warm) wakes. J. Phys. Oceanogr. doi: 10.1175/JPO-D-20-0103.1
Bakun, A. (1990). Global climate change and intensification of coastal ocean upwelling. Science 247, 198–201. doi: 10.1126/science.247.4939.198
Barton, E. D., Field, D. B., and Roy, C. (2013). Canary current upwelling: more or less? Prog. Oceanogr. 116, 167–178. doi: 10.1016/j.pocean.2013.07.007
Becker, J. J., Sandwell, D. T., Smith, W. H. F., Braud, J., Binder, B., Depner, J., et al. (2009). Global bathymetry and elevation data at 30 arc seconds resolution: SRTM30_PLUS. Mar. Geod. 32, 355–371. doi: 10.1080/01490410903297766
Bromwich, D. H. (1989). An extraordinary katabatic wind regime at Terra-Nova Bay, Antarctica. Mon. Weather Rev. 117, 688–695. doi: 10.1175/1520-04931989117<0688:AEKWRA<2.0.CO;2
Caldeira, R. M. A., and Sangrà, P. (2012). Complex geophysical wake flows. Ocean Dyn. 62, 683–700. doi: 10.1007/s10236-012-0528-6
Caldeira, R. M. A., Stegner, A., Couvelard, X., Araújo, I. B., Testor, P., and Lorenzo, A. (2014). Evolution of an oceanic anticyclone in the lee of Madeira Island: in situ and remote sensing survey. J. Geophys. Res. Oceans. 119, 1195–1216. doi: 10.1002/2013JC009493
Caldeira, R. M. A., and Tomé, R. (2013). Wake response to an ocean-feedback mechanism: Madeira Island case study. Boundary Layer Meteorol. 148, 419–436. doi: 10.1007/s10546-013-9817-y
Callies, J., Ferrari, R., Klymak, J., and Gula, J. (2015). Seasonality in submesoscale turbulence. Nat. Commun. 6:6862. doi: 10.1038/ncomms7862
Cardoso, C., Caldeira, R. M. A., Relvas, P., and Stegner, A. (2020). Islands as eddy transformation and generation hotspots: Cabo Verde case study. Prog. Oceanogr. 184:102271. doi: 10.1016/j.pocean.2020.102271
Carton, J. A., and Giese, B. S. (2008). A reanalysis of ocean climate using simple ocean data assimilation (SODA). Mon. Weather Rev. 136, 2999–3017. doi: 10.1175/2007MWR1978.1
Carton, J. A., Penny, S. G., and Kalnay, E. (2019). Temperature and salinity variability in the SODA3, ECCO4r3, and ORAS5 ocean reanalyses 1993–2015. J. Clim. 32, 2277–2293. doi: 10.1175/JCLI-D-18-0605.1
Chapman, D. C. (1985). Numerical treatment of cross-shelf open boundaries in a barotropic coastal ocean model. J. Phys. Oceanogr. 15, 1060–1075. doi: 10.1175/1520-04851985015<1060:NTOCSO<2.0.CO;2
Couvelard, X., Caldeira, R. M. A., Araújo, I. B., and Tomé, R. (2012). Wind mediated vorticity-generation and eddy-confinement, leeward of the Madeira Island: 2008 numerical case study. Dyn. Atmos. Oceans. 58, 128–149. doi: 10.1016/j.dynatmoce.2012.09.005
Dee, D. P., Uppala, S. M., Simmons, A. J., Berrisford, P., Poli, P., Kobayashi, S., et al. (2011). The ERA-Interim reanalysis: configuration and performance of the data assimilation system. Q. J. R. Meteorol. Soc. 137, 553–597. doi: 10.1002/qj.828
Doyle, J. D., and Shapiro, M. A. (1999). Flow response to large-scale topography: the Greenland tip jet. Tellus A 51, 728–748. doi: 10.1034/j.1600-0870.1996.00014.x
Etling, D. (1989). On atmospheric vortex streets in the wake of large islands. Meteorol. Atmos. Phys. 41, 157–164. doi: 10.1007/BF01043134
Grubišic, V., Sachsperger, J., and Caldeira, R. M. (2015). Atmospheric wake of Madeira: first aerial observations and numerical simulations. J. Atmos. Sci. 72, 4755–4776. doi: 10.1175/JAS-D-14-0251.1
Haidvogel, D. B., and Beckmann, A. (1999). Numerical Ocean Circulation Modelling. London: Imperial College Press, 344.
Hersbach, H., Bell, B., Berrisford, P., Hirahara, S., Horanyi, A., Munoz-Sabater, J., et al. (2020). The ERA5 Global Reanalysis. Q. J. R. Meteorol. Soc. 146, 1999–2049. doi: 10.1002/qj.3803
Marchesiello, P., McWilliams, J. C., and Shchepetkin, A. (2001). Open boundary conditions for long-term integration of regional oceanic models. Ocean Model. 3, 1–20. doi: 10.1016/S1463-5003(00)00013-5
Mason, E., Molemaker, M. J., Shchepetkin, A., Colas, F., McWilliams, J. C., and Sangra, P. (2010). Procedures for offline grid nesting in regional ocean models. Ocean Model. 35, 1–15. doi: 10.1016/j.ocemod.2010.05.007
Merchant, C. J., Embury, O., Bulgin, C. E., Block, T., Corlett, G. K., Fiedler, E., et al. (2019). Satellite-based time-series of sea-surface temperature since 1981 for climate applications. Sci. Data 6:223. doi: 10.1038/s41597-019-0236-x
Miranda, P. M. A., Alves, J. M. R., and Serra, N. (2013). Climate change and upwelling: response of Iberian upwelling to atmospheric forcing in a regional climate scenario. Clim. Dyn. 40, 2813–2824. doi: 10.1007/s00382-012-1442-9
Miranda, P. M. A., Tomé, R., Frois, L., Nogueira, M., Alves, J. M. R., Prior, V., et al. (2021). Speed-up of the Madeira tip jets in the ERA5 climate highlights the decadal variability of the Atlantic subtropics. Q. J. R. Meteorol. Soc. 147, 679–690. doi: 10.1002/qj.3940
Narciso, A., Caldeira, R., Reis, J., Hoppenrath, M., Cachão, M., and Kaufmann, M. (2019). The effect of a transient frontal zone on the spatial distribution of extant coccolithophores around the Madeira archipelago (Northeast Atlantic). Estuar. Coast. Shelf Sci. 223, 25–38. doi: 10.1016/j.ecss.2019.04.014
Ólafsson, H., and Bougeault, P. (1997). The effect of rotation and surface friction on orographic drag. J. Atmos. Sci. 54, 193–210.
Ribeiro, C., and Neves, P. (2020). Habitat mapping of Cabo Girão Marine Park (Madeira island): a tool for conservation and management. J. Coast. Conserv. 24:22. doi: 10.1007/s11852-019-00724-9
Ryan, S., Ummenhofer, C. C., Gawarkiewicz, G., Wagner, P., Scheinert, M., Biastoch, A., et al. (2021). Depth structure of Ningaloo Niño/Niña events and associated drivers. J. Climate. 34, 1767–1788. doi: 10.1175/JCLI-D-19-1020.1
Sen, P. K. (1968). Estimates of the regression coefficient based on Kendall’s Tau. J. Am. Stat. Assoc. 63, 1379–1389. doi: 10.1080/01621459.1968.10480934
Shchepetkin, A. F., and McWilliams, J. C. (2005). The regional oceanic modeling system (ROMS): a split-explicit, free-surface, topography-following-coordinate oceanic model. Ocean Model. 9, 347–404.
Shchepetkin, A. F., and McWilliams, J. C. (2009). “Computational kernel algorithms for fine-scale, multiprocess, longtime oceanic simulations,” in Handbook of Numerical Analysis, Vol. 14, eds R. M. Temam and J. J. Tribbia (New York, NY: Elsevier), 121–183. doi: 10.1016/S1570-8659(08)01202-0
Smith, R. B., Gleason, A. C., Gluhosky, P. A., and Grubišic, V. (1997). The wake of St. Vincent. J. Atmos. Sci. 54, 606–623.
Sydeman, W. J., García-Reyes, M., Schoeman, D. S., Rykaczewski, R. R., Thompson, S. A., Black, B. A., et al. (2014). Climate change and wind intensification in coastal upwelling ecosystems. Science 345, 77–80. doi: 10.1126/science.1251635
Theil, H. (1992). “A rank-invariant method of linear and polynomial regression analysis,” in Henri Theil’s Contributions to Economics and Econometrics. Advanced Studies in Theoretical and Applied Econometrics, Vol. 23, eds B. Raj and J. Koerts (Dordrecht: Springer). doi: 10.1007/978-94-011-2546-8_20
Umlauf, L., and Burchard, H. (2003). A generic length-scale equation for geophysical turbulence models. J. Mar. Res. 61, 235–265. doi: 10.1357/002224003322005087
Verhoef, A., Portabella, M., and Stoffelen, A. (2012). High-resolution ASCAT scatterometer winds near the coast. IEEE Trans. Geosci. Remote Sens. 50, 2481–2487. doi: 10.1109/TGRS.2011.2175001
Warner, J. C., Armstrong, B., He, R. Y., and Zambon, J. B. (2010). Development of a coupled ocean–atmosphere–wave–sediment transport (COAWST) modeling system. Ocean Model. 35, 230–244. doi: 10.1016/j.ocemod.2010.07.010
Keywords: tip-jets, vorticity, vertical current, mixed layer depth (MLD), numerical modeling
Citation: Alves JMR, Tomé R, Caldeira RMA and Miranda PMA (2021) Asymmetric Ocean Response to Atmospheric Forcing in an Island Wake: A 35-Year High-Resolution Study. Front. Mar. Sci. 8:624392. doi: 10.3389/fmars.2021.624392
Received: 31 October 2020; Accepted: 13 January 2021;
Published: 18 February 2021.
Edited by:
Juan Jose Munoz-Perez, University of Cádiz, SpainReviewed by:
Alejandro Orfila, Consejo Superior de Investigaciones Científicas (CSIC), SpainCopyright © 2021 Alves, Tomé, Caldeira and Miranda. This is an open-access article distributed under the terms of the Creative Commons Attribution License (CC BY). The use, distribution or reproduction in other forums is permitted, provided the original author(s) and the copyright owner(s) are credited and that the original publication in this journal is cited, in accordance with accepted academic practice. No use, distribution or reproduction is permitted which does not comply with these terms.
*Correspondence: José M. R. Alves, am9zZS5hbHZlc0Bvb20uYXJkaXRpLnB0
Disclaimer: All claims expressed in this article are solely those of the authors and do not necessarily represent those of their affiliated organizations, or those of the publisher, the editors and the reviewers. Any product that may be evaluated in this article or claim that may be made by its manufacturer is not guaranteed or endorsed by the publisher.
Research integrity at Frontiers

Learn more about the work of our research integrity team to safeguard the quality of each article we publish.