 Wei-Jen Huang
 Wei-Jun Cai
 Xinping Hu
94% of researchers rate our articles as excellent or good
Learn more about the work of our research integrity team to safeguard the quality of each article we publish.
Find out more
ORIGINAL RESEARCH article
Front. Mar. Sci. , 26 March 2021
Sec. Marine Biogeochemistry
Volume 8 - 2021 | https://doi.org/10.3389/fmars.2021.621243
This article is part of the Research Topic Acidification and Hypoxia in Marginal Seas View all 36 articles
Large rivers export a large amount of dissolved inorganic carbon (DIC) and nutrients to continental shelves; and subsequent river-to-sea mixing, eutrophication, and seasonal hypoxia (dissolved oxygen < 2 mg⋅L–1) can further modify DIC and nutrient distributions and fluxes. However, quantitative studies of seasonal carbonate variations on shelves are still insufficient. We collected total alkalinity (TA), DIC, and NO3– data from nine cruises conducted between 2006 and 2010 on the northern Gulf of Mexico continental shelf, an area strongly influenced by the Mississippi and Atchafalaya Rivers. We applied a three-end-member model (based on salinity and potential alkalinity) to our data to remove the contribution of physical mixing to DIC and nitrate distribution patterns and to derive the net in situ removal of DIC and nitrate (ΔDIC and ΔNO3–, respectively). Systematic analyses demonstrated that the seasonal net DIC removal in the near-surface water was strong during summer and weak in winter. The peak in net DIC production in the near-bottom, subsurface waters of the inner and middle sections of the shelf occurred between July and September; it was coupled, but with a time lag, to the peak in the net DIC removal that occurred in the near-surface waters in June. A similar 2-month delay (i.e., January vs. November) could also be observed between their minima. A detailed examination of the relationship between ΔDIC and ΔNO3– demonstrates that net biological activity was the dominant factor of DIC removal and addition. Other effects, such as air–sea CO2 gas exchange, wetland exports, CaCO3 precipitation, and a regional variation of the Redfield ratio, were relatively minor. We suggest that the delayed coupling between eutrophic surface and hypoxic bottom waters reported here may also be seen in the carbon and nutrient cycles of other nutrient-rich, river-dominated ocean margins worldwide.
- Net CO2 removal was strong in summer and weak in winter in the near-surface waters.
- Net CO2 accumulation was strong from July to September and weak in January in the near-bottom, subsurface waters.
- Wetland exports and air–sea gas exchanges are minor factors in dissolved inorganic carbon (DIC) changes.
- A 100 μmol⋅kg–1 increase of net DIC removal led to a 1Ω increase in a shelf-wide scale.
- Annually, the peak of net CO2 removal was about 2 months before the peak of net accumulation.
Continental shelves receive large and highly variable amounts of freshwater, dissolved inorganic carbon (DIC), and nutrients. As such, they may experience seasonal coastal enhanced primary productivity and bottom-water hypoxic [dissolved oxygen (DO) less than 2 mg⋅L–1] events (Borges and Gypens, 2010; Rabalais et al., 2010; Bauer et al., 2013; Breitburg et al., 2018; Oschlies et al., 2018). Seasonal variations in the riverine carbonate system can alter the composition of the river end-member, while subsequent mixing with seawater and the effect this has on the carbonate system equilibrium constants can lead to the formation of a minimum pH and low partial pressure of carbon dioxide (pCO2) zone (Hu and Cai, 2013; Huang et al., 2018; Laurent et al., 2018). Excessive amounts of riverine nutrients can induce eutrophication, which fuels primary production, removing DIC from the water, increasing the flux of organic matter, and subsequently leading to hypoxic events whereby DIC is released back to the water. Notwithstanding the recent improvements in our conceptual understanding of biogeochemical processes in river-dominated continental shelf systems (Bianchi et al., 2010; Cai et al., 2011; Hu et al., 2017; Legge et al., 2020), quantitative information about the seasonal net DIC removal in the near-surface waters and net DIC release/accumulation in the near-bottom, subsurface waters, respectively, is still insufficient.
Carbon fluxes between wetlands, estuaries, and shelves have been quantified in a global North American carbon budget in Najjar et al. (2018). One component of this budget that has since gained more attention is the contribution of wetlands toward organic carbon storage, especially due to the very high productivity of saltmarsh vegetation along the periphery of the Gulf of Mexico (Thorhaug et al., 2017, 2019). The cross-shelf transport from wetlands to shelves has generated considerable recent research interest (Fry et al., 2015; Anderson et al., 2020). Field studies conducted along the shelf of the northern Gulf of Mexico (nGOM) have reported DIC release rates and associated pH and DO variations in near-bottom, subsurface waters during the summer (Xue et al., 2015; Jiang et al., 2019). The development of hypoxia is also time-dependent, yet few investigations have addressed this issue over monthly to sub-monthly timescale (Turner et al., 2017; Matli et al., 2018). Laurent et al. (2018) used a three-dimensional model to simulate these processes in the nGOM. They found that significant shifts could occur as a result of changes in freshwater discharge and wind direction, particularly where the latter was persistent and favored upwelling.
The Mississippi and Atchafalaya River system is the largest in North America in terms of freshwater discharge (Milliman and Meade, 1983). It exports ∼17 Tg C⋅year–1 of DIC to the nGOM (Goolsby et al., 2000; Raymond et al., 2008; Lehrter et al., 2013) but also acts as a sink of atmospheric CO2 by stimulating primary productivity in the receiving coastal and shelf waters (Huang et al., 2015b). The riverine nitrogen export is about 1–1.5 Tg N⋅year–1 (T = 1012), with nitrate (NO3–) accounting for two-thirds of the total and nitrite plus ammonium for the remaining third. The marine end-member contributes 30% of the nitrogen inputs to the nGOM shelf (Lehrter et al., 2013), but it is the seasonal fluctuations in the river inputs that modulate the amount of primary production on the shelf (Turner and Rabalais, 2013; Chakraborty and Lohrenz, 2015). On an annual basis, biological productivity on the Louisiana shelf is controlled by the availability of N (Turner and Rabalais, 2013), although P and Si can also be co-limiting over small temporal and spatial scales (Ren et al., 2009; Turner and Rabalais, 2013). Seasonal variations in river inputs and changes in coastal physical and biological conditions should conceptually lead to seasonal variations in air–sea CO2 gas exchange. Previous studies conducted off the Louisiana Bight in the late 2000s and over a wider portion of the shelf in the 2010s have revealed that these study areas act as a strong CO2 sink in spring to early summer but switch to a weak source or near-neutral system in fall to winter (Green et al., 2006; Guo et al., 2012; Huang et al., 2015b; Xue et al., 2016). The approach used in these studies was to quantify air–sea CO2 flux and net DIC removal according to salinity intervals or depth intervals (topography). Comparable studies identifying specific regions of net DIC removal/uptake or release/accumulation down the water column on an annual scale are still rare. In particular, the chemical measurements needed to reveal the interconnections and relationships that drive the seasonal net DIC removal in a river-dominated continental shelf are still lacking.
In this study, we measured total alkalinity (TA) and DIC and calculated pH and calcium carbonate saturation state (ΩArag) from the river to the marine end-members based on an extensive dataset of nine cruises conducted over 5 years (2006–2010). We systematically removed the effect of river-to-sea mixing on DIC and NO3– concentrations using an end-member model and interpreted the residuals as net DIC removal/accumulation; the residuals showed systematic seasonal variations in specified ranges of depths and salinity in both near-surface and near-bottom waters. Based on these results, we discuss the combined effects of mixing and biological activity on the non-linear variations observed in pH and ΩArag. We then investigate the processes affecting the carbonate system by analyzing the covariation of net DIC removal/accumulation and NO3– across the studied area. Finally, we synthesize our improved understanding of these processes via a conceptual model for the whole region.
Seawater salinity, temperature, DIC, TA, and nutrient data were collected on nine cruises in the nGOM (Figure 1 and Table 1). Five cruises (2009 to 2010) were cross-shelf surveys (Figure 1). Four previous cruises (2006–2007) were focused on an area that has been covered for more than three decades for hypoxia mapping and investigation1.
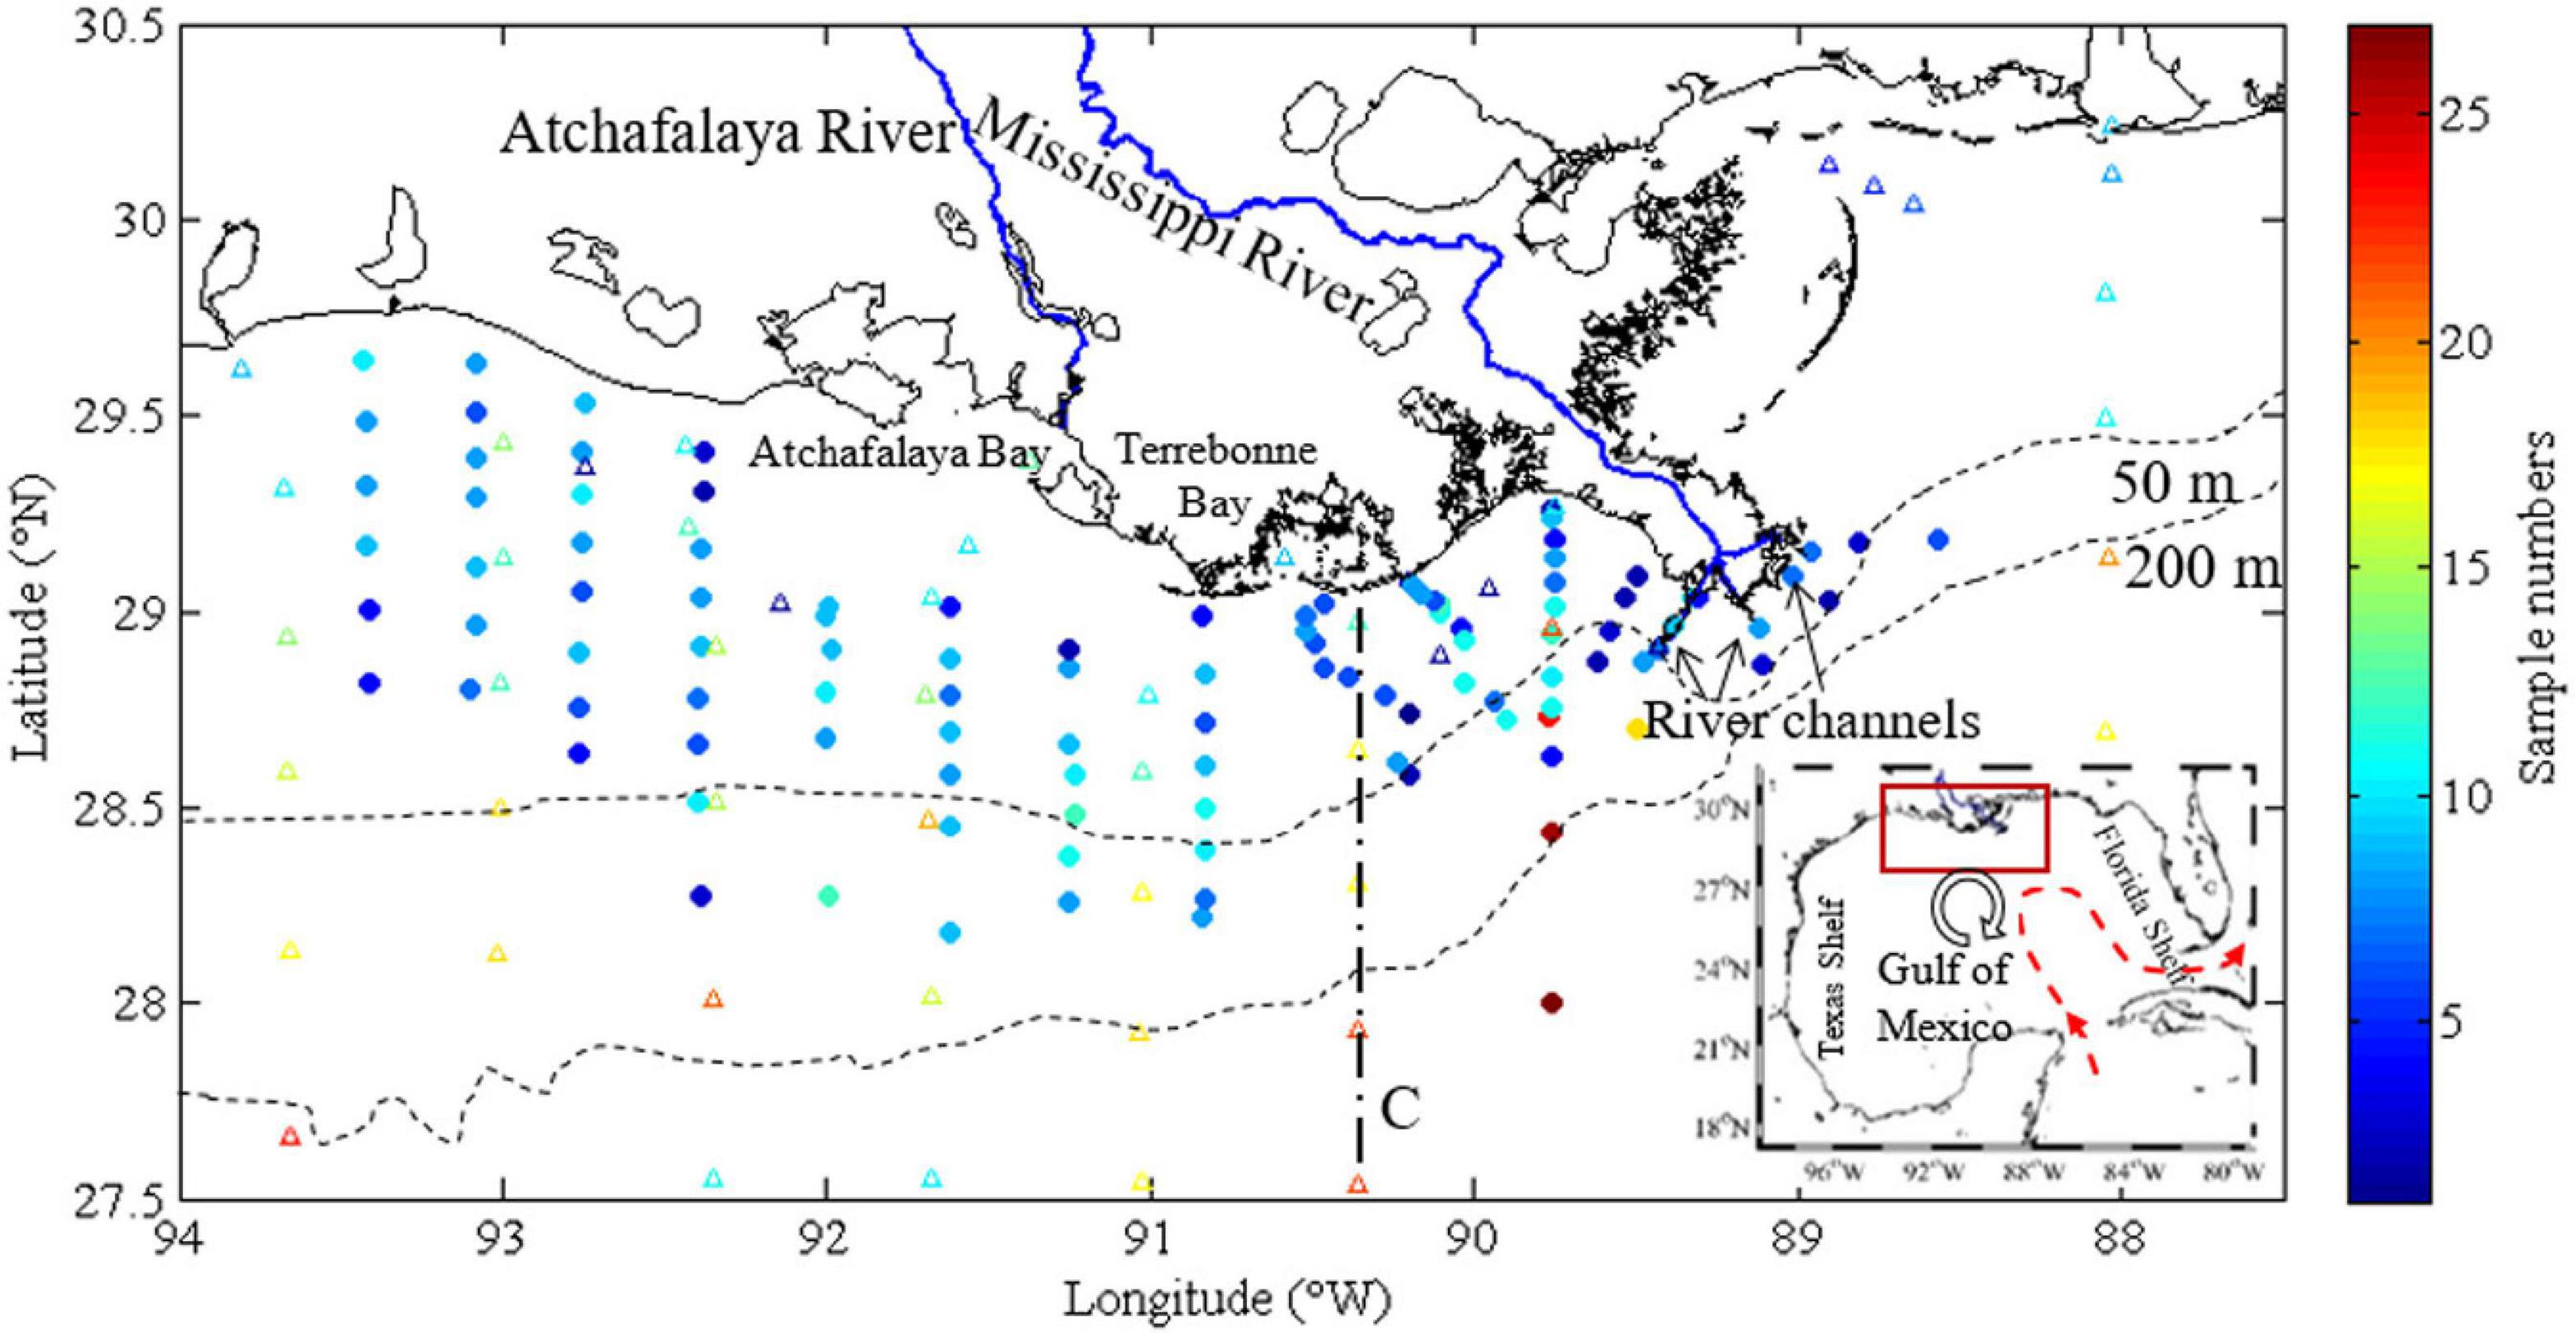
Figure 1. The study area and sampling frequency map. Nine cruises surveyed the nGOM (the red rectangle in the inset) near the Mississippi and Atchafalaya Rivers (blue lines) and several wetlands, lakes, and bays. The sampling stations covered the shelf and also parts of the open Gulf. Generally, most of the stations were visited four times, and the stations on Louisiana Bight were visited with a higher frequency. Transect C (dashed line) was labeled to show the cross-shelf variation in later sections. The red dashed line indicates Loop Current, and the circle with an arrow represents a loop current eddy and its direction, respectively, in the inset. nGOM, northern Gulf of Mexico.
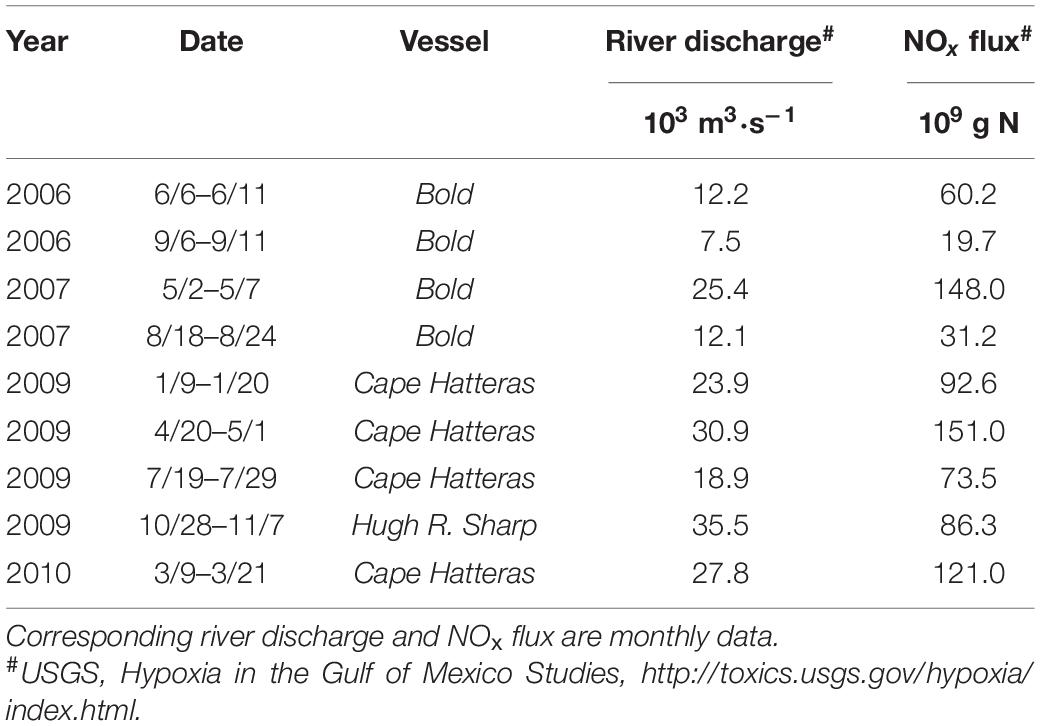
Table 1. Summary of survey cruises.
Water samples for TA and DIC were taken from Niskin bottles that were attached to a conductivity, temperature, and pressure package (CTD) following standard procedures. Water samples for TA and DIC were filtered through a purged cartridge filter (Whatman® 6724-6004) directly into borosilicate glass bottles and were poisoned with 100 μl of saturated HgCl2 solution immediately after sampling to arrest biological activity. Then the samples were kept at low temperatures (∼4°C) until analysis at the University of Georgia. DIC samples (0.75 ml) were acidified by adding 1 ml of 10% H3PO4, and the CO2 released was quantified by using a CO2 detector (LI-COR® 6262 or 7000) (AS-C3 Apollo SciTech). TA was analyzed on a temperature-controlled, semi-automated titrator (AS-ALK2 Apollo SciTech) following the open-cell Gran titration method. Both TA and DIC measurements were referenced against certified reference materials from A. G. Dickson at Scripps Institution of Oceanography. The precision of TA and DIC measurements was 0.1% (Cai and Wang, 1998; Huang et al., 2012a). The concentration of NO3– was measured according to wet chemistry methods (APHA, 1989) with a continuous flow analyzer (Astoria-Pacific International) during 2006–2007 cruises done by Lehrter et al. (2013) and during the 2008–2010 cruises done by Chakraborty and Lohrenz (2015). On each cruise, DO, chlorophyll a (Chl-a), and NO3– concentrations were measured by the same group. DO concentrations were measured with the CTD system with excellent stability (Murrell et al., 2013). Apparent oxygen utility (AOU) was calculated by the saturated DO concentration minus the measured DO concentration.
We used TA, DIC, and dissolution constants from Millero et al. (2006) to calculate pH and saturation state for aragonite (ΩArag) using the R software package seacarb (Gattuso et al., 2016). Since aragonite is more soluble (lower Ω values) than calcite, we selected ΩArag over ΩCal as the carbonate saturation state parameter for this study. ΩArag is defined as follows:
where [Ca2+] is the calcium ion concentration, [CO32–] is the carbonate ion concentration, and K’sp is the apparent solubility product of aragonite in seawater at a given salinity, temperature, and pressure (Mucci, 1983). Note that in seacarb, or indeed in other carbonate chemistry equilibrium calculation packages, riverine [Ca2+] is set to 0, and its concentration in seawater is inferred from salinity. Thus, we need to override these settings in order to calculate [Ca2+] in the river plume or estuarine waters. In this study, the riverine calcium concentrations were relatively high, with average concentrations of 1.0 ± 0.1 mmol⋅kg–1 in the Mississippi River end-member (Balle Chase, Louisiana station) and 0.9 ± 0.2 mmol⋅kg–1 in the Atchafalaya River end-member (Morgan City, USGS #07381600). As these two [Ca2+] end-members showed no significant difference, the Mississippi end-member value was used in our calculations. [Ca2+] of 10.28 mmol⋅kg–1 at a salinity of 35 was used as the ocean end-member, and the concentrations along the salinity gradient were then calculated using the following linear equation:
In situ salinity and temperature values were used to calculate Ksp in surface samples and were adjusted to ambient pressure where necessary with the equations provided by Millero (1995) and the corrected constants provided by Zeebe and Wolf-Gladrow (2001).
The effect of [Ca2+] variation can be canceled mainly by the change of Ksp’ when they are both a function of salinity without riverine [Ca2+] (Xue et al., 2017). The change of [Ca2+] with this new slope in Eq. (2) may still be proportional to the change of Ksp’ in high salinities but may not sufficiently covary in low salinities. As the low-salinity region (<18) covers a relatively small part of this shelf (<3%) (Huang et al., 2015b), we focus our discussion on ΩArag variations at higher salinities (>18).
We estimated the uncertainty for ΩArag and pH due to the measurement uncertainties in TA (±0.1%) and DIC (±0.1%) by the bootstrap method (Efron, 1992). We assumed each uncertainty occurred randomly in TA and DIC, and we used TA of 2,400 μmol⋅kg–1 and DIC of 2,050 μmol⋅kg–1 as an example to calculate their corresponding ΩArag with seacarb. The average value and its standard deviation of 500 iterations were 3.87 and 0.02 in ΩArag unit (±0.5%), respectively. Similarly, the impact of uncertainties of the same TA and DIC values on the calculated pH value was ± 0.0026 pH unit (±0.03%).
To assess the spatial pattern of net DIC removal or accumulation (ΔDIC) in both near-surface and near-bottom, subsurface waters, we need to remove the mixing effect on DIC and to quantify ΔDIC and net NO3– removal (ΔNO3–) over the shelf area. To this end, we applied a three-end-member mixing model, as the two rivers are often fairly different in their chemical properties. We used “f” as the fractional contribution of (1) freshwater from the Mississippi River (subscripted “M”), (2) freshwater from the Atchafalaya River (subscripted “A”), and (3) seawater (subscripted “S”). “Sal” is the observed salinity, and “S” is used to represent the salinity of each end-member. The results of this three-end-member method comprise the bulk of this report. Following Guo et al. (2012); Huang et al. (2012a), the model equations are as follows:
In a three-end-member model, we need another conservative tracer in addition to salinity. Here, we used a slightly modified alkalinity term. In the river plume, TA is affected by conservative mixing as well as biological NO3– drawdown (ΔNO3–). Thus, we have
This TA modification is linked to NO3– use or regeneration,
By combining Eq. (6) with Eq. (5), a conservative property called “potential alkalinity,” TA+NO3– (Brewer and Goldman, 1976; Peng et al., 1987; Bates et al., 1998) can be derived:
As both TA and NO3– are known, the fractional contribution of each end-member (fM, fA, and fS) can be solved by substituting in end-member values (Supplementary Tables 1, 2) and using Eqs. (3), (4), and (7) with a non-negative solver (NNLS in MATLAB).
Thereafter, any biological modification during the mixing can be expressed as the difference between the observation and a conservative value predicted by the mixing model. For example, ΔDIC can be calculated by subtracting measured DIC from the DIC value based on conservative mixing:
Positive ΔDIC values in the near-surface waters are defined as net DIC removal, and negative values in the near-bottom, subsurface waters are defined as net DIC accumulation. Similarly, the biological modification can be calculated via Eq. (6).
We allowed for the fact that the marine end-member may change depending on the season and plume trajectory (Table 1 and Supplementary Table 1). The shelf water has a residence time of about 1 month during winter and over 3 months during summer (Zhang and Hetland, 2012; Xue et al., 2013). We selected one marine end-member from high-salinity offshore waters in each cruise as the standard deviation of each monthly TA average in the offshore water (0 to 100 m, salinity > 36) was mostly less than 14 μmol⋅kg–1 (<0.5%) (Supplementary Table 3).
Finally, we gained insight into the controlling processes responsible for the ΔDIC and ΔNO3– variations by analyzing the observed ΔDIC vs. ΔNO3– relationship, as CaCO3 precipitation/dissolution affects the slope and air–sea gas exchange affects the intercept of the theoretical relationship.
In special cases, such as in areas near one river or when the chemical differences of the two river end-members are much smaller than biological modifications during mixing, the above three-end-member model may be simplified into a two-end-member model. An advantage of a two-end-member model is that only one conservative tracer (i.e., salinity) is enough for calculations. Another benefit is that one can readily show the biological modification as the deviations from a linear plot of property against the conservative tracer (i.e., a NO3– or DIC vs. salinity plot). Thus, we chose to apply a two-end-member model to examine non-linear biological modifications on our data in the near-surface water in this study area. Note that the majority of our results are still based on the three-end-member model in the section “Net Dissolved Inorganic Carbon Removal (ΔDIC) and Nitrate Removal (ΔNO3) Over the Water Column.”
We simplified the mixing case by using the combination of river end-members and the marine end-members to demonstrate the seasonal effects of mixing and biological activities on pH and ΩArag. During the combination of river end-members, the freshwater discharge was considered and used two thirds from the Mississippi River end-member and one third from the Atchafalaya River end-member (Supplementary Table 1). We considered that TA and DIC are conservative (TAmix2 and DICmix2, respectively) for mixing to calculate the conservative pH (pHmix2) and ΩArag (ΩArag_mix2) for each season with seacarb. The abbreviation of “mix2” represented “two-end-member mixing” to distinguish the difference from the three-end-member mixing model in the following section.
where subscribed “M1” and “S1” are end-member values for the mixed river and the marine end-members, respectively; fM1 and fS1 are fractions from the mixed river and the marine end-members. Using TAmix2 and DICmix2, we can calculate pHmix2 and ΩArag–mix2.
We considered the influence of net biological production to evaluate the effect of net DIC uptake on pH and ΩArag. We used the deficit of NO3– between measurements and the conservative mixing (ΔNO3–bio2) as biological uptake to simulate biological effects on TA (TAbio2) and DIC (DICbio2). The NO3– to salinity relationship was non-linear in each season and was discontinuous in a few salinity ranges. To fulfill these missing nitrate values in these salinity ranges, we extrapolated data to the few missing nitrate data points by using a non-linear nitrate-to-salinity relationship for each season (Supplementary Figure 1). We then used the deficit between the non-linear relationship and the linear conservative mixing line in each salinity bin to calculate ΔNO3–bio2. For each unit of biological uptake, ΔNO3–bio2 can increase one TA by one unit (Brewer and Goldman, 1976; Wolf-Gladrow et al., 2007) in addition to the conservative mixing (Eq. 11) and can induce a DIC change of 106/16 of ΔNO3–bio2 through the Redfield ratio (C/N = 106/16) (Eq. 12).
TAmix2+bio2 and DICmix2+bio2 were used to calculate the combined effect of mixing and biological-induced pH (pH_mix2+bio2) and ΩArag (ΩArag_mix2+bio2) values for each season (seacarb with the same K1 and K2 used again). Additional information about the DIC buffer factor is provided with Supplementary Information.
To sum up, this two-end-member model can quickly give us the effect of mixing and biological uptake on changes of pH and ΩArag in the mid-salinity surface water.
Freshwater discharge, TA (Table 2), and NOx (including nitrate and nitrite) fluxes varied seasonally and were generally high during the spring and low during the late summer and fall (Figure 2) (United States Geological Survey, Hypoxia in the Gulf of Mexico Studies)2.
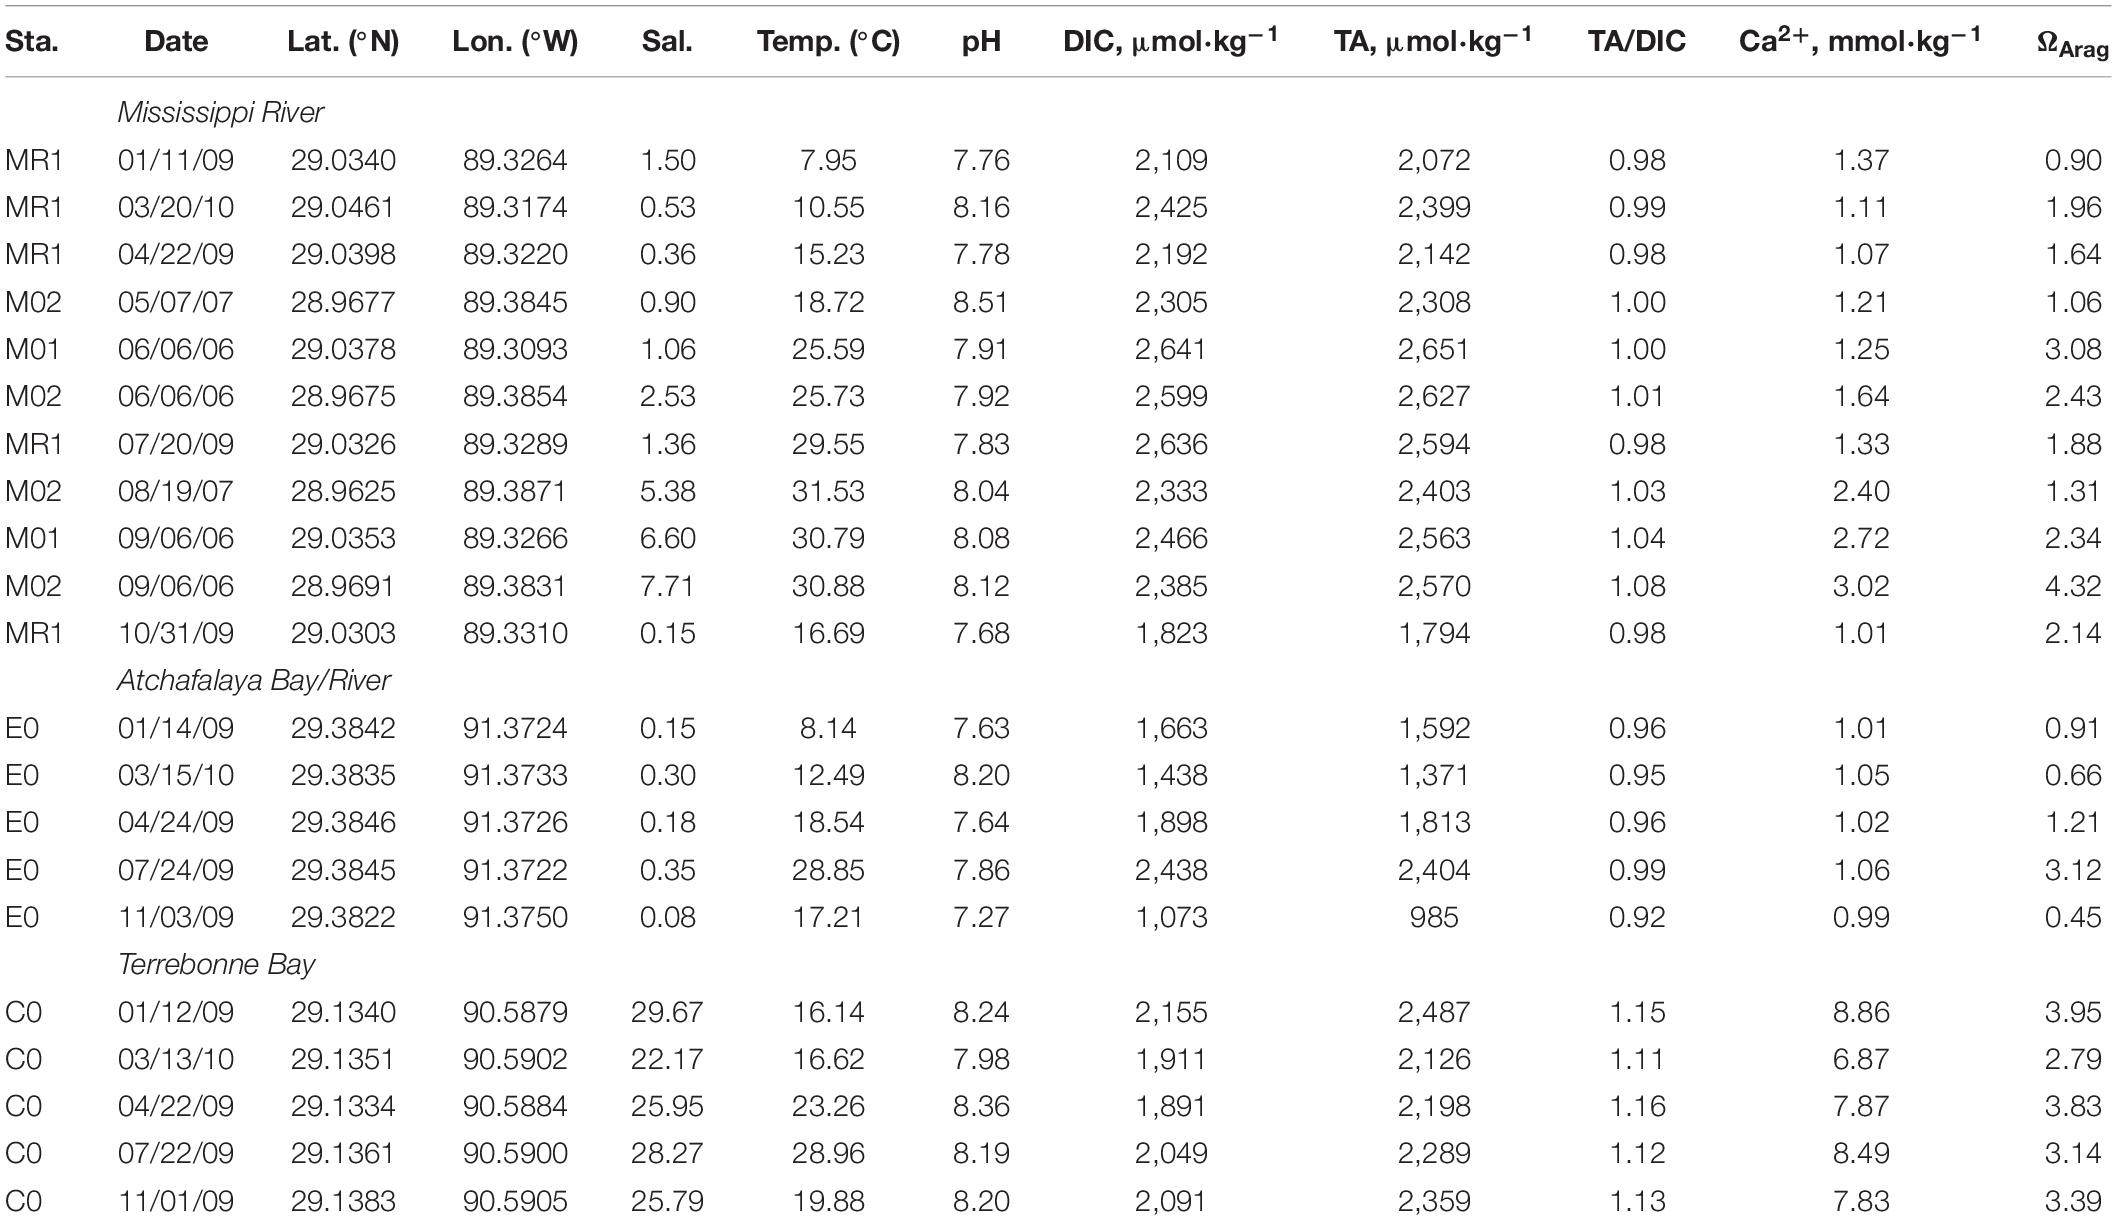
Table 2. Salinity, temperature, pH, DIC, TA, Ca2+, and ΩArag values at the Mississippi and Atchafalaya Rivers and Terrebonne Bay.
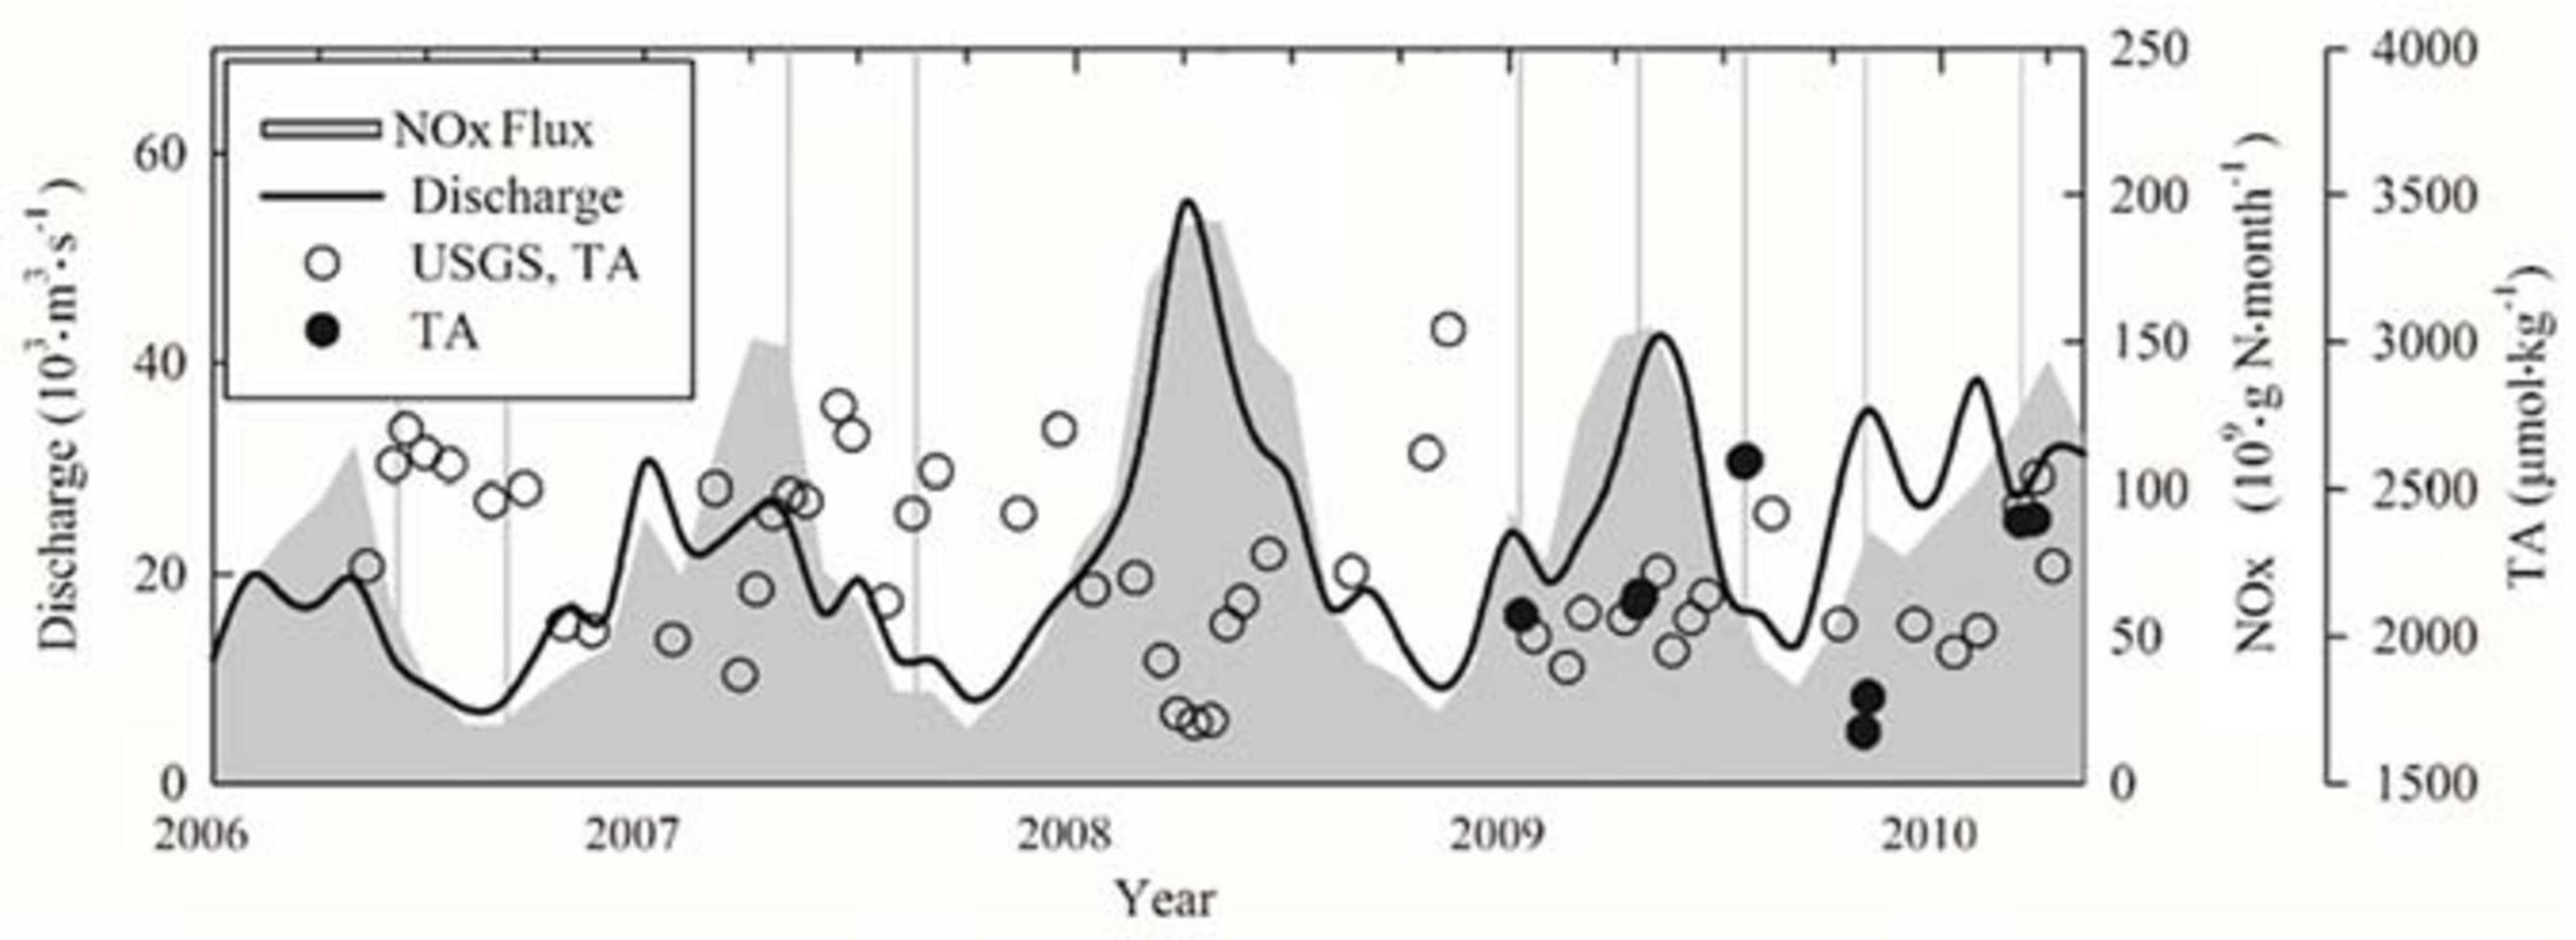
Figure 2. The temporal variations of river discharge, TA values, and nitrogen flux. Throughout the course of our sampling, freshwater discharge (black line) and the NOx flux (gray area) from the Mississippi and Atchafalaya Rivers [U.S. Geological Survey (USGS) data] varied seasonally. USGS TA values (open circles) were close to our measured TA (solid circles). Vertical gray lines indicate the beginning date of the sampling cruise in Table 1. TA, total alkalinity.
The effects of the freshwater discharge further characterized the seasonal variations in the TA and salinity relationships (Figures 3A–D). When considering the TA–salinity relationship, TA values were high in low-salinity waters during the summer due to the reduction of river discharge (for example, riverine TA was over 2,500 μmol⋅kg–1 in June) (Table 2). In contrast, TA values were low during the late fall, winter, and early spring when discharge was high (for example, riverine TA was ∼1,800 μmol⋅kg–1 in November 2009) (Figures 2, 3A–D). Overall, the TA data were generally in the range or close to the boundary composed of two rivers and one marine end-members, indicating possible three-end-member mixings (Figures 3A–D).
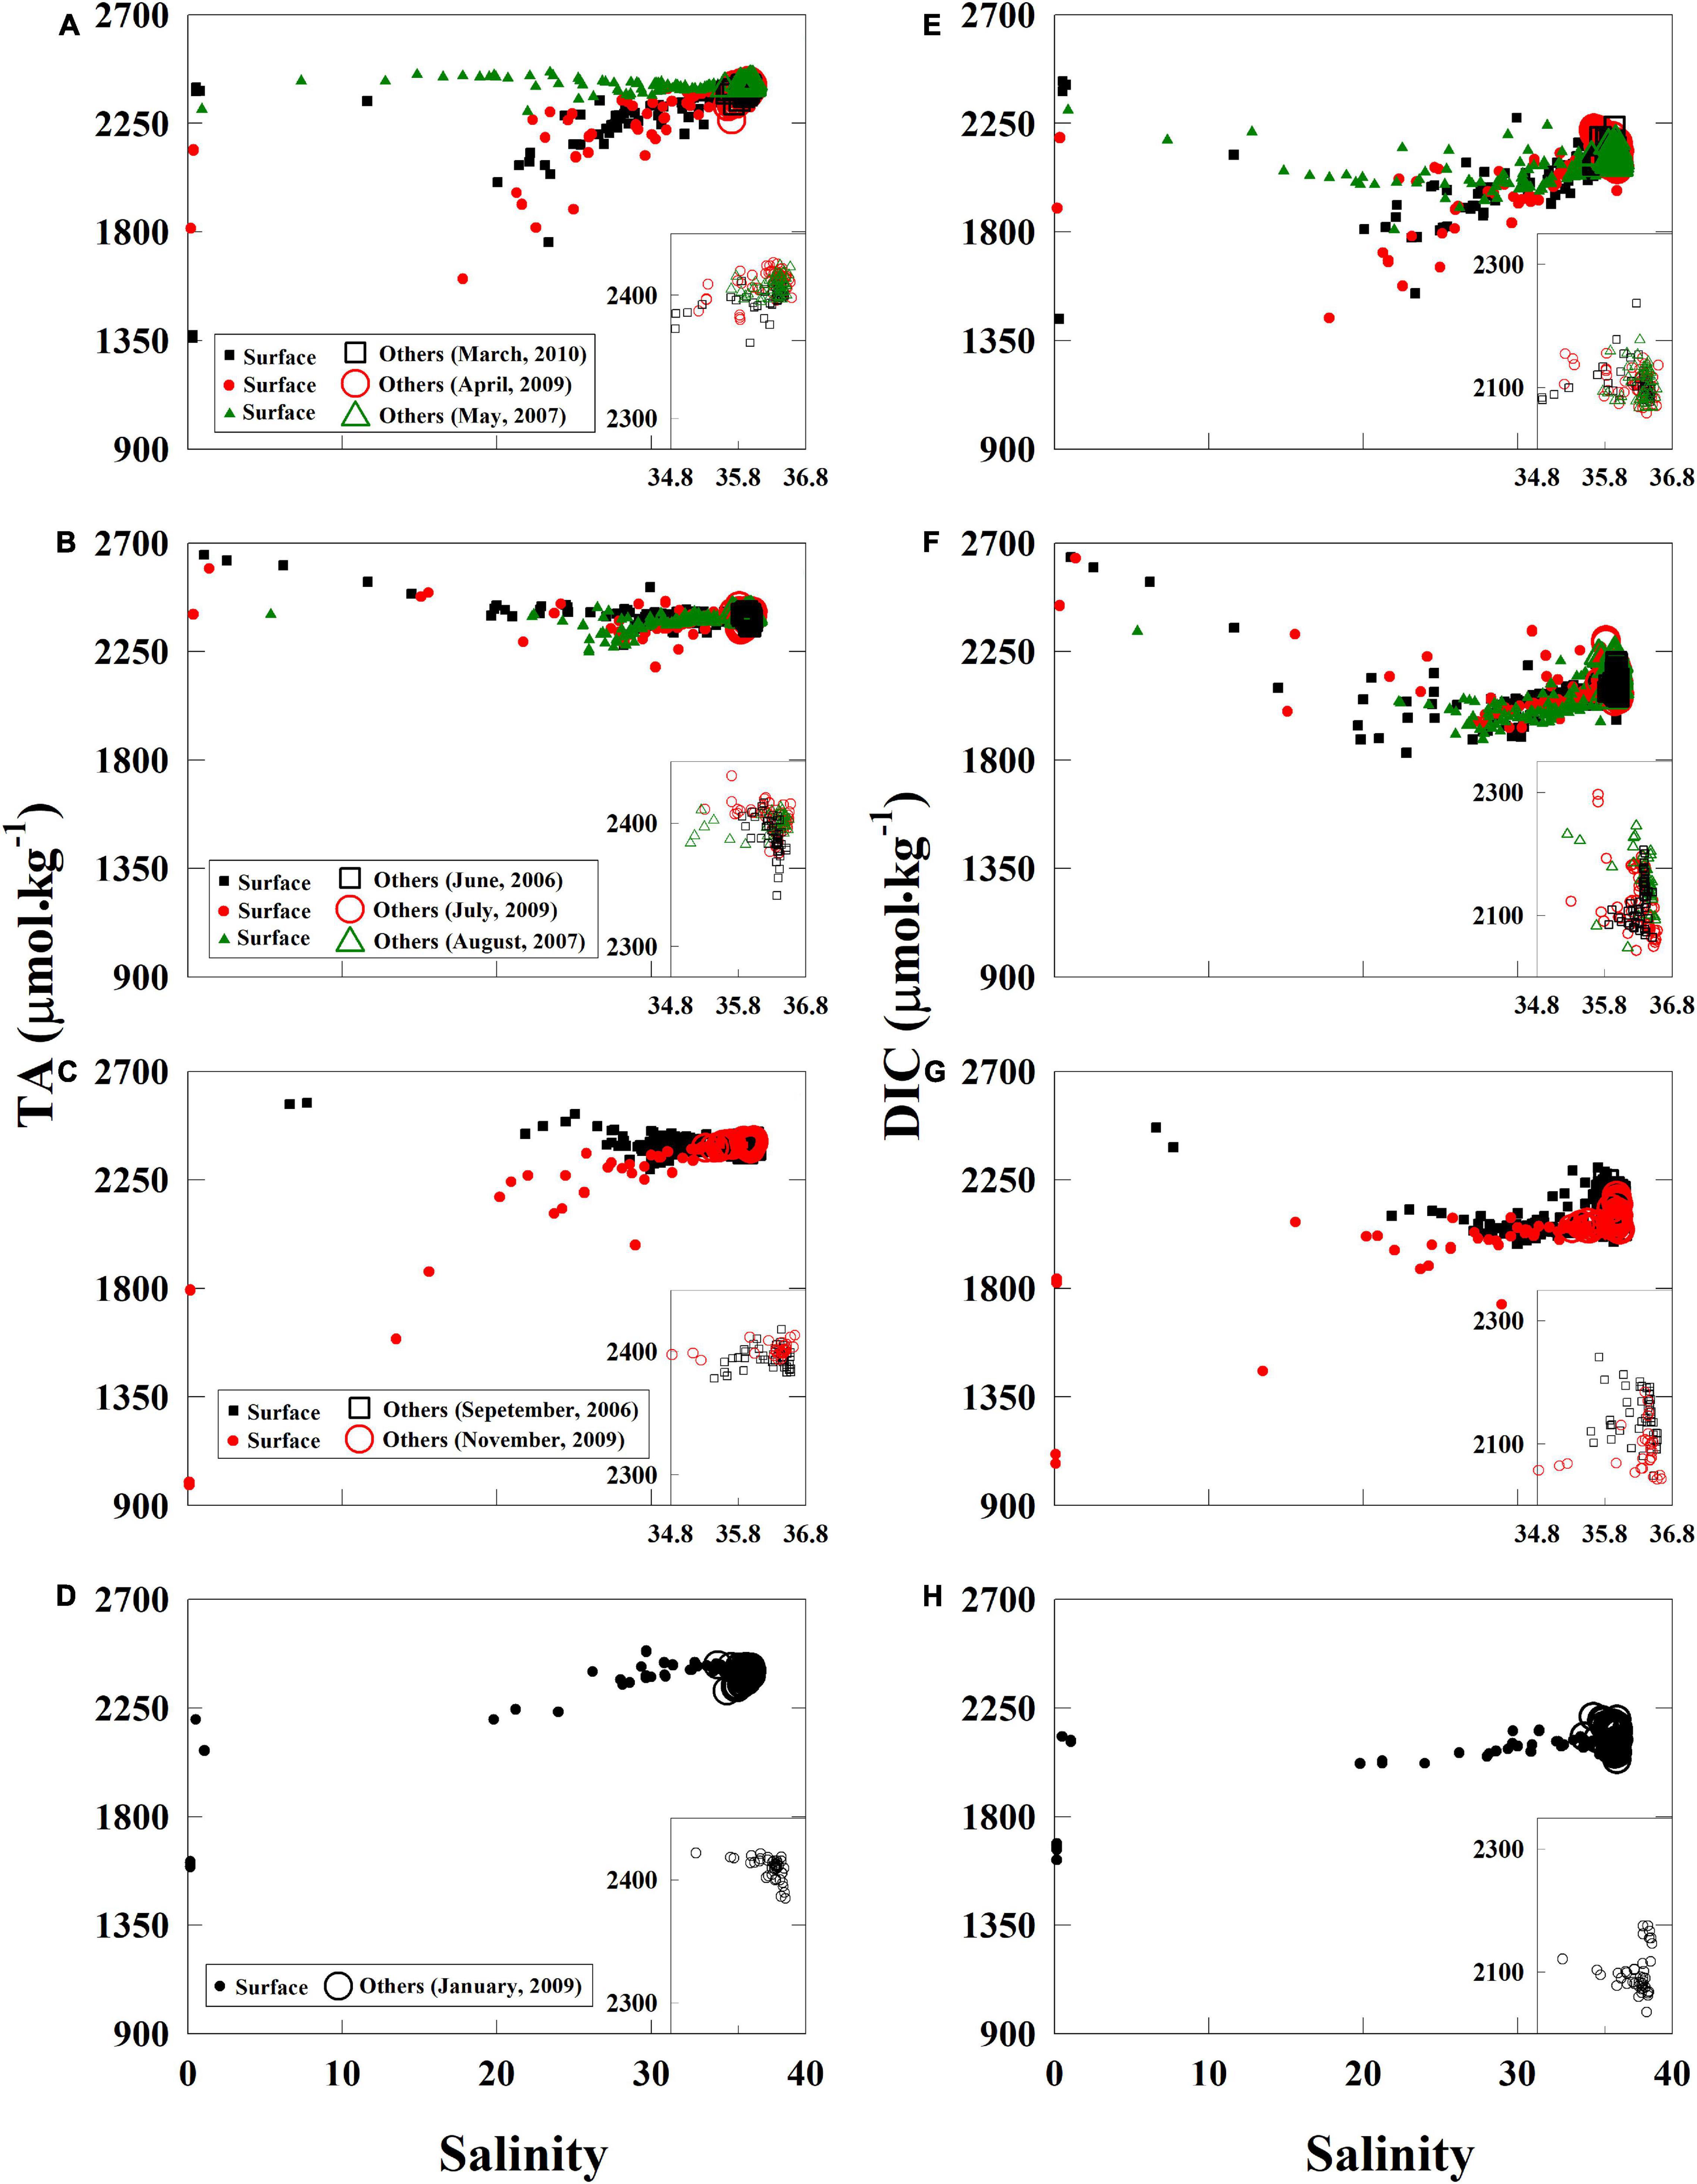
Figure 3. Total alkalinity and DIC-to-salinity relationships. Fluctuating TA and DIC river end-members dominated the seasonal variations in the near-surface water (A–H). In the near-surface water (solid marker) during the summer, DIC measurements were lower in middle salinities than those in high salinities and displayed clear DIC removals (F). In the near-bottom, subsurface, and deep waters (open marker), DIC extended a high concentration arm at high salinities at the marine end-members. We clarify the relationships between 20- and 100-m depth in the inset of each panel (A–H). TA, total alkalinity; DIC, dissolved inorganic carbon.
Relative to the near-linear TA and salinity relationship, DIC concentrations in middle salinities were much lower than those in high salinities on the DIC-to-salinity relationship (Figures 3E–H). Net DIC removal in middle salinities was clear during the summer. Chl-a-to-salinity relationships corresponds to the net DIC removal. High Chl-a concentrations (over 30 μg⋅L–1) were observed in salinities of 20 to 30 in the near-surface water during the spring and summer cruises, medium Chl-a concentrations (<20 μg⋅L–1) during the fall, and low Chl-a concentrations (∼<5 μg⋅L–1) in the winter (Supplementary Figure 6). Moreover, changing river DIC end-members (Table 2) and levels of deficits displayed the seasonal variations on the DIC-to-salinity relationships (Figures 3E–H). High DIC river end-members and large DIC deficits were present from May to September (Figures 3E,F), and low DIC river end-members and reduced DIC deficits were present from November to March (Figures 3G,H,E). When freshwater discharge quickly decreased from spring to summer, DIC river end-member can promptly increase and create non-linear mixing curves on the DIC-to-salinity relationship. We considered this issue, and we adopted a river end-member a few weeks earlier than the sampling cruise to perform the calculation in the section “Net Dissolved Inorganic Carbon Removal (dDIC) and Nitrate Removal (dNO3–) Over the Water Column.”
Values of measured pH and ΩArag displayed maximum values in middle salinities during each season (Figure 4), particularly during the summer (Figures 4B,F). Similarly, the highest ΩArag in middle salinities was over 6.0 during the spring, increased to over 7.0 in the summer, was below 7.0 in the fall, and reduced to below 5.0 in the winter (Figures 4E–H).
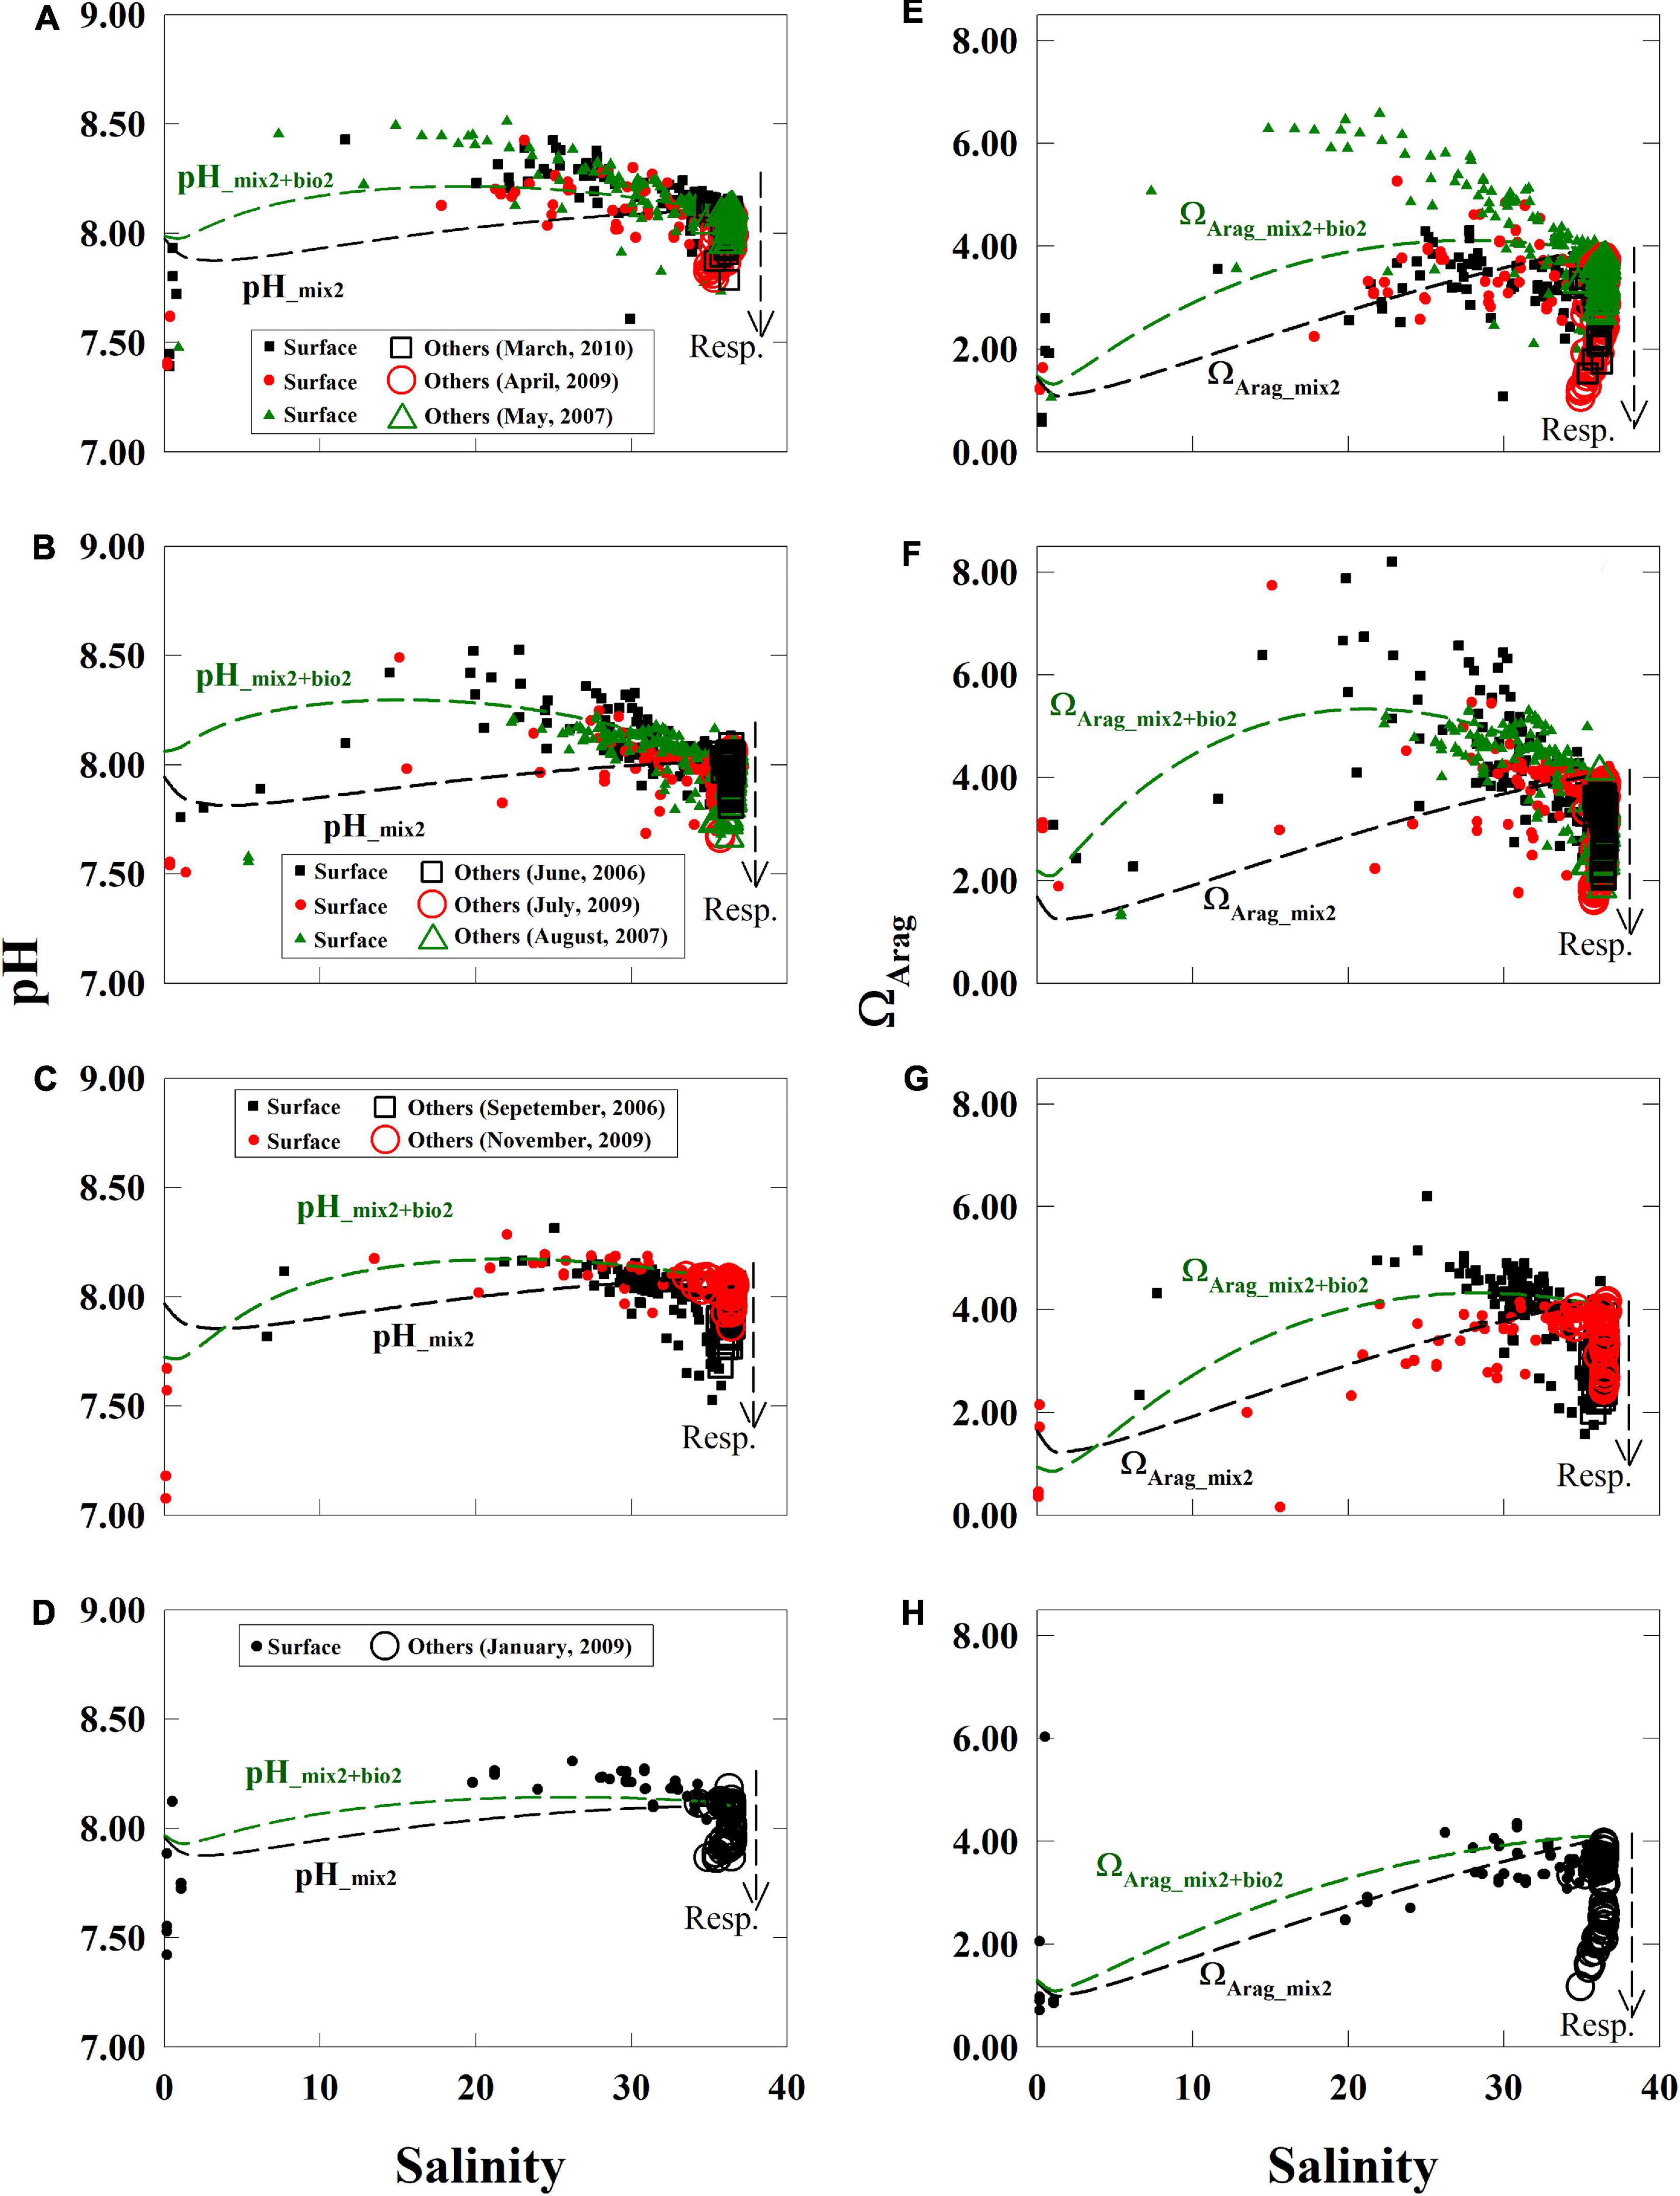
Figure 4. Relationships between pH and ΩArag to salinity. Values of pH and ΩArag displayed non-linear relationships with salinity in the near-surface waters (filled symbols, depth < 5 m) and displayed low values in near-bottom, subsurface, and deep waters (open symbols, depth > 5 m) (A–H). Values of pH and ΩArag values from November to January were close to their supporting conservative curves and (C,D,G,H) were close to the supporting curves with biological activity from May to August (A,B,E,F) in the near-surface waters. Respiration induced extensions arms of pH and ΩArag from the sea end-member can be observed in each panel (open markers). The supporting lines in this figure are based on the section “Supportive Lines of Mixing and Biological Activities for pH and ΩArag”. TA, total alkalinity; DIC, dissolved inorganic carbon.
We had drawn supporting lines by simplified simulations (section “Supportive Lines of Mixing and Biological Activities for pH and ΩArag”) to help us to display non-linear distribution patterns of mixing or biological activities in Figure 4. Conservative simulations for pH_mix2 and ΩArag_mix2 were curves due to the carbonate system (Figure 4) and varied seasonally in the near-surface water (Figure 4). Our NO3– fitting curves based on measured data were concaved upward in all seasons, showing a strong contrast to their respective ideal linear mixing lines (Figure 5 and Supplementary Figure 1). The NO3– deficit from the conservative mixing line to the fitting curve of measured data was large in spring, kept increasing in summer, and reduced from fall to winter (Figure 5). This deficit of NO3– was converted to net biological DIC uptake to simulate pH_mix+bio2 and ΩArag_ mix+bio2 (Figure 4, methods in the section “Supportive Lines of Mixing and Biological Activities for pH and ΩArag”). The differences between pH_mix2 and pH_mix2+bio2, and between ΩArag_mix2 and ΩArag_mix2+bio2, are effects on these properties by the net biological uptake (Figure 4). These effects of net biological uptake on each carbonate parameters varied seasonally in middle-to-high salinities, increasing from spring to summer and decreasing from fall to winter. Finally, those measured pH and ΩArag values were close to the conservative mixing curves during November and January (Figures 4C,D,G,H) and were close to the biological activity scenario, particularly during May and June (Figures 4A,B,E,F). Note that the result of supporting lines in the section “Supportive Lines of Mixing and Biological Activities for pH and ΩArag” was only presented in Figures 4, 5.
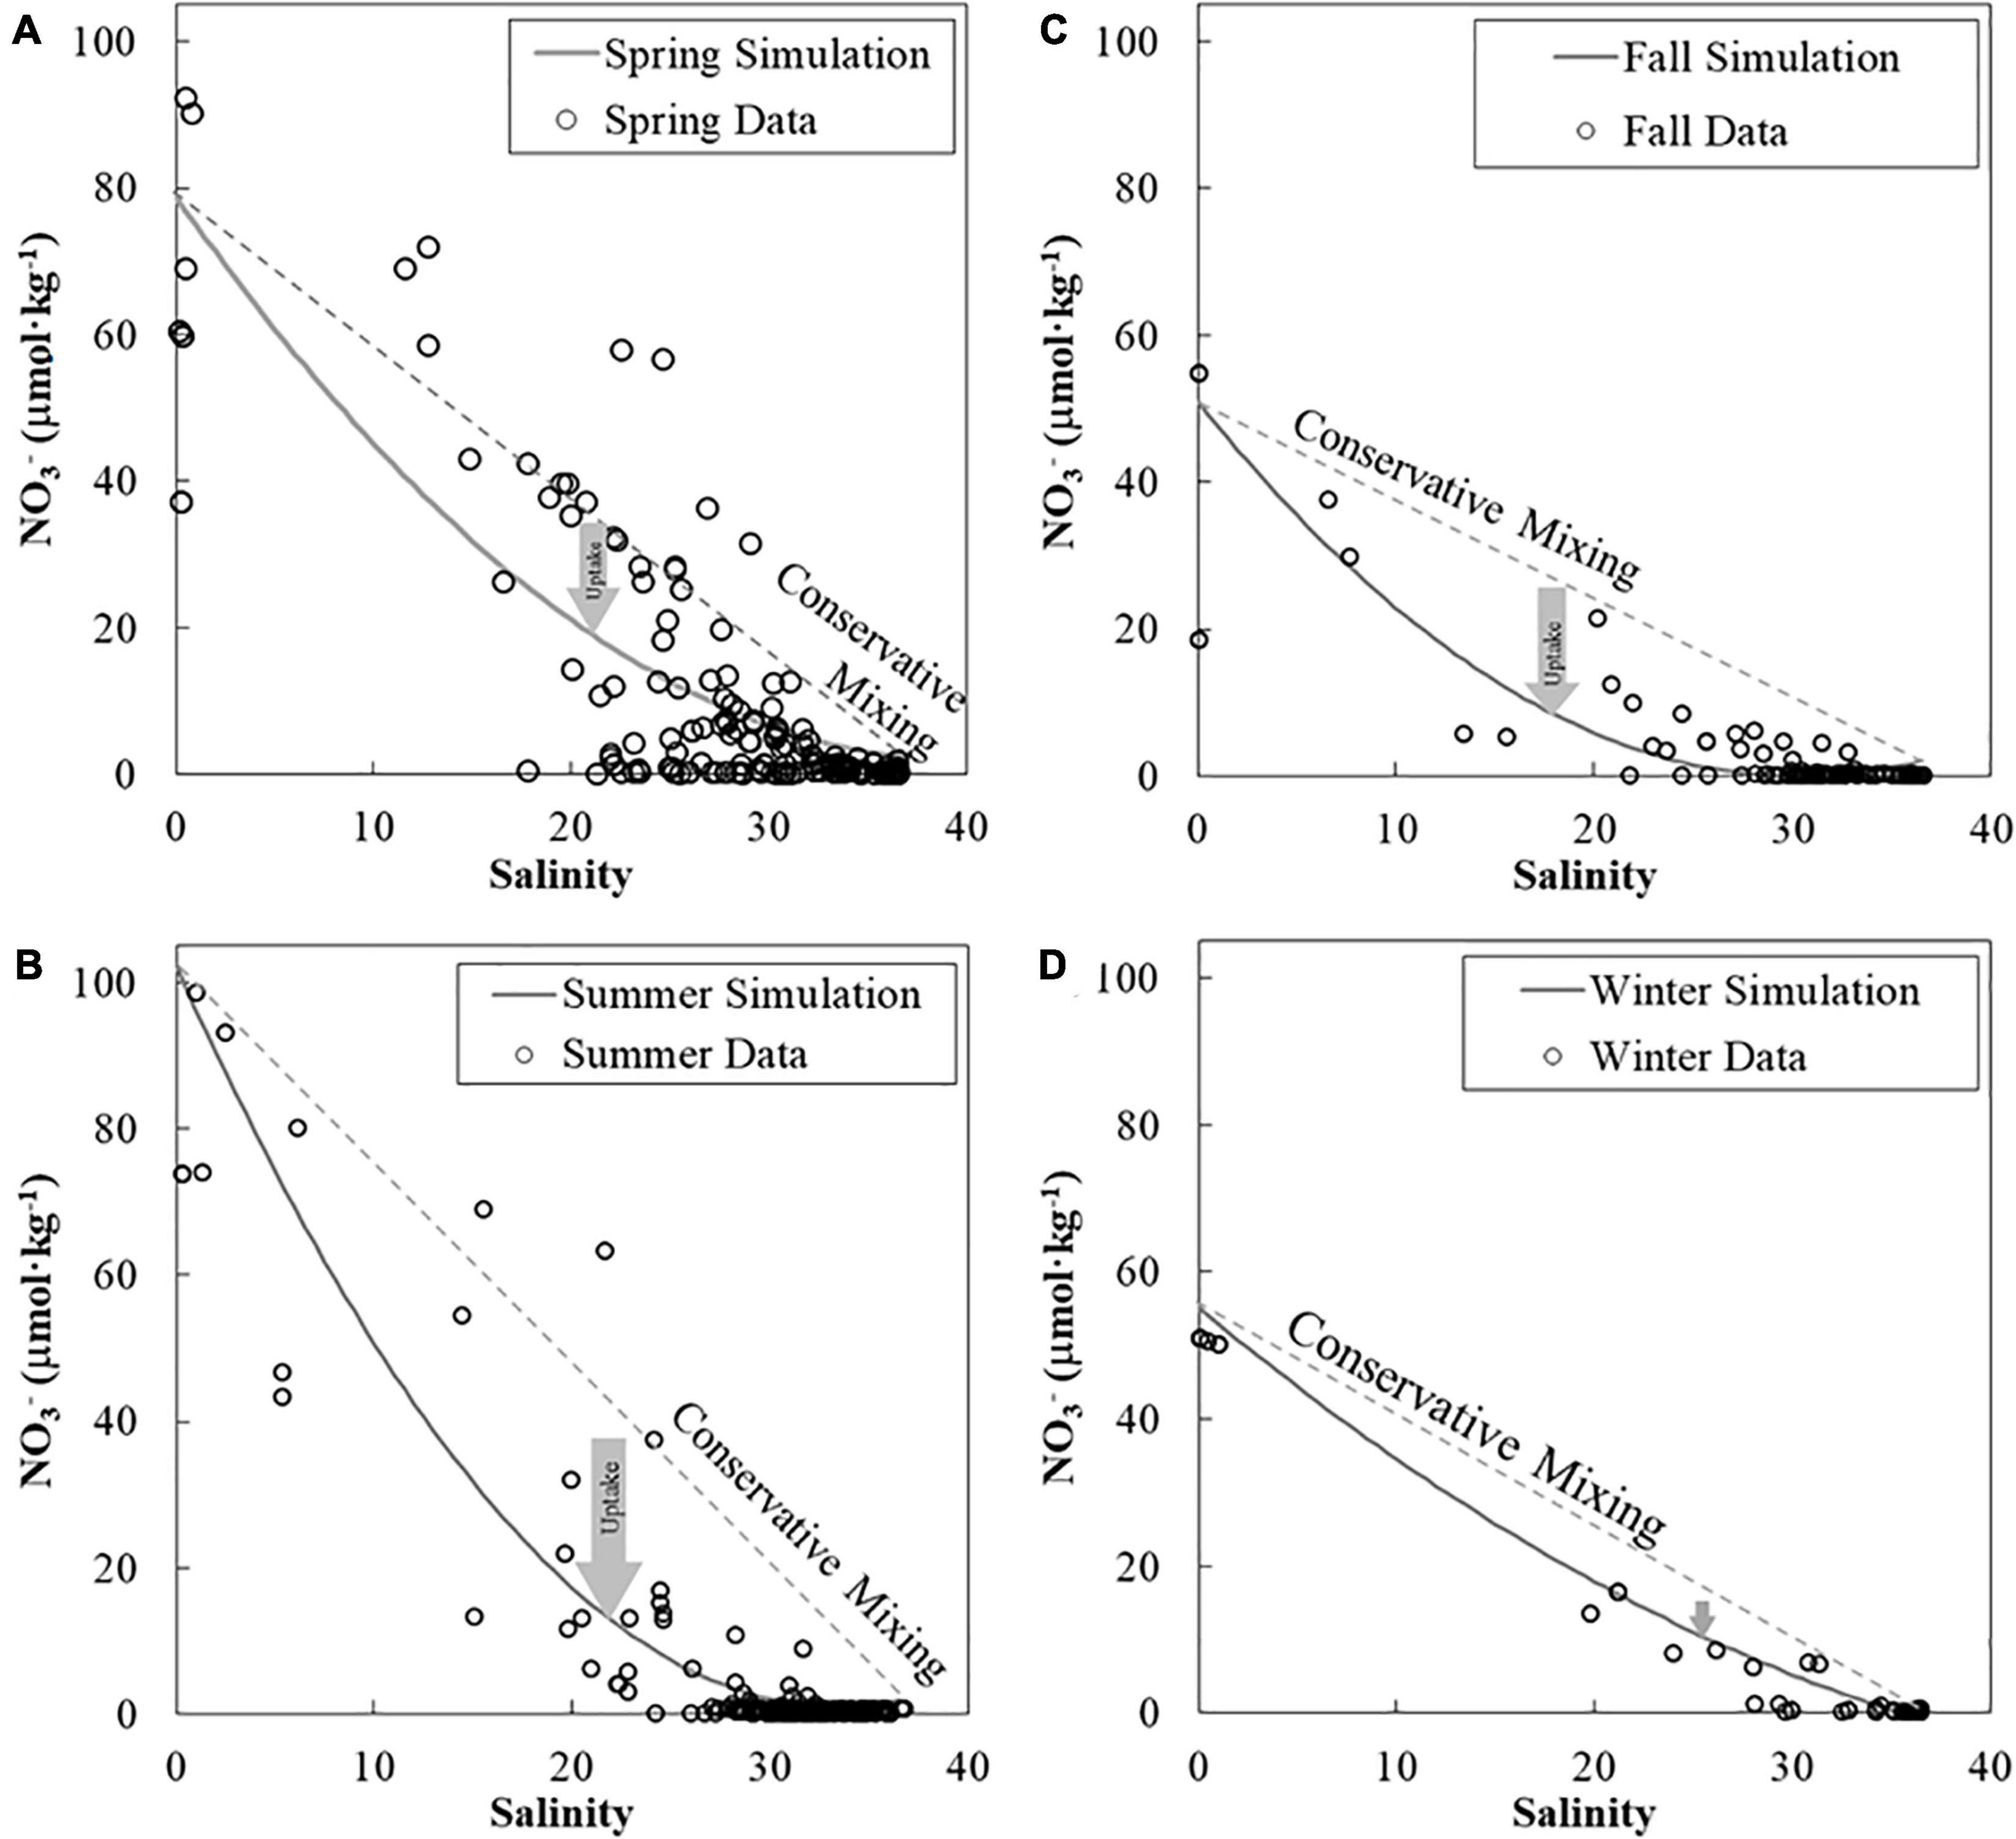
Figure 5. Nitrate-to-salinity relationships in the near-surface water in four seasons. The nitrate river end-member increased from the spring (A) to the summer (B) and decreased to the fall (C) and winter (D). We used nitrate measurements (symbols) in each season to fit a concave upward curve to fulfill the lack of data in a few salinity bins. The deficit of nitrate between the nitrate measurement (concave-upward curve) and the conservative mixing line (that is, net nitrate removal) was also high in the summer and low in the winter. The deficit of NO3– in this figure was only used in the section “Supportive Lines of Mixing and Biological Activities for pH and ΩArag” to convert to biological DIC uptake and to calculate the supporting lines of effects of mixing plus biological uptake in Figure 4. Note that results from the section “Supportive Lines of Mixing and Biological Activities for pH and ΩArag” are only used for Figure 4. DIC, dissolved inorganic carbon.
In high-salinity waters, an arm of high DIC (Figures 3E–H), pH (Figures 4A–D), and ΩArag (Figures 4E–H) extended from the marine end-member. Sources of these waters were near-bottom shelf waters or subsurface and deep (>200 m) waters, and these values deviated from simulations in the near-surface water, showing net DIC release. Additionally, extension arms of low values of DIC buffer factor in high salinities were in DIC buffer factor to salinity relationships (Supplementary Figures 7A-D).
To sum up, four distribution patterns characterized the carbonate parameters along the river-to-sea salinity gradient: (1) river TA and DIC end-members varied seasonally (Figure 3), (2) pH- and ΩArag-to-salinity relationships showed concave-downward curves in the near-surface waters (Figure 4), (3) the deficits between the observed pH and ΩArag data to the conservative mixing curves changed seasonally (Figure 4), and (4) an arm was extended from the marine end-members of pH and ΩArag (Figure 4).
The distribution of ΔDIC (calculated by the three-end-member model) generally demonstrated non-conservative effects during the dispersal process in the near-surface water compared with salinity (Figure 6). The salinity contour lines of 18 and 33 were parallel to the coastline and demonstrated the principle dispersal range between them (Figure 6A,B). High and positive ΔDIC values (strong net DIC removal) were at the Louisiana Bight, and ΔDIC was nearly zero at non-plume regions on a shelf-wide scale in most cases (Figure 6C,D), implying strong net DIC uptake just next to the river mouth and descending toward the far-field of this river plume. Note that the ΔDIC values hereafter were quantified by using the three-end-member model in the section “Net Dissolved Inorganic Carbon Removal (ΔDIC) and Nitrate Removal (ΔNO3) Over the Water Column.”
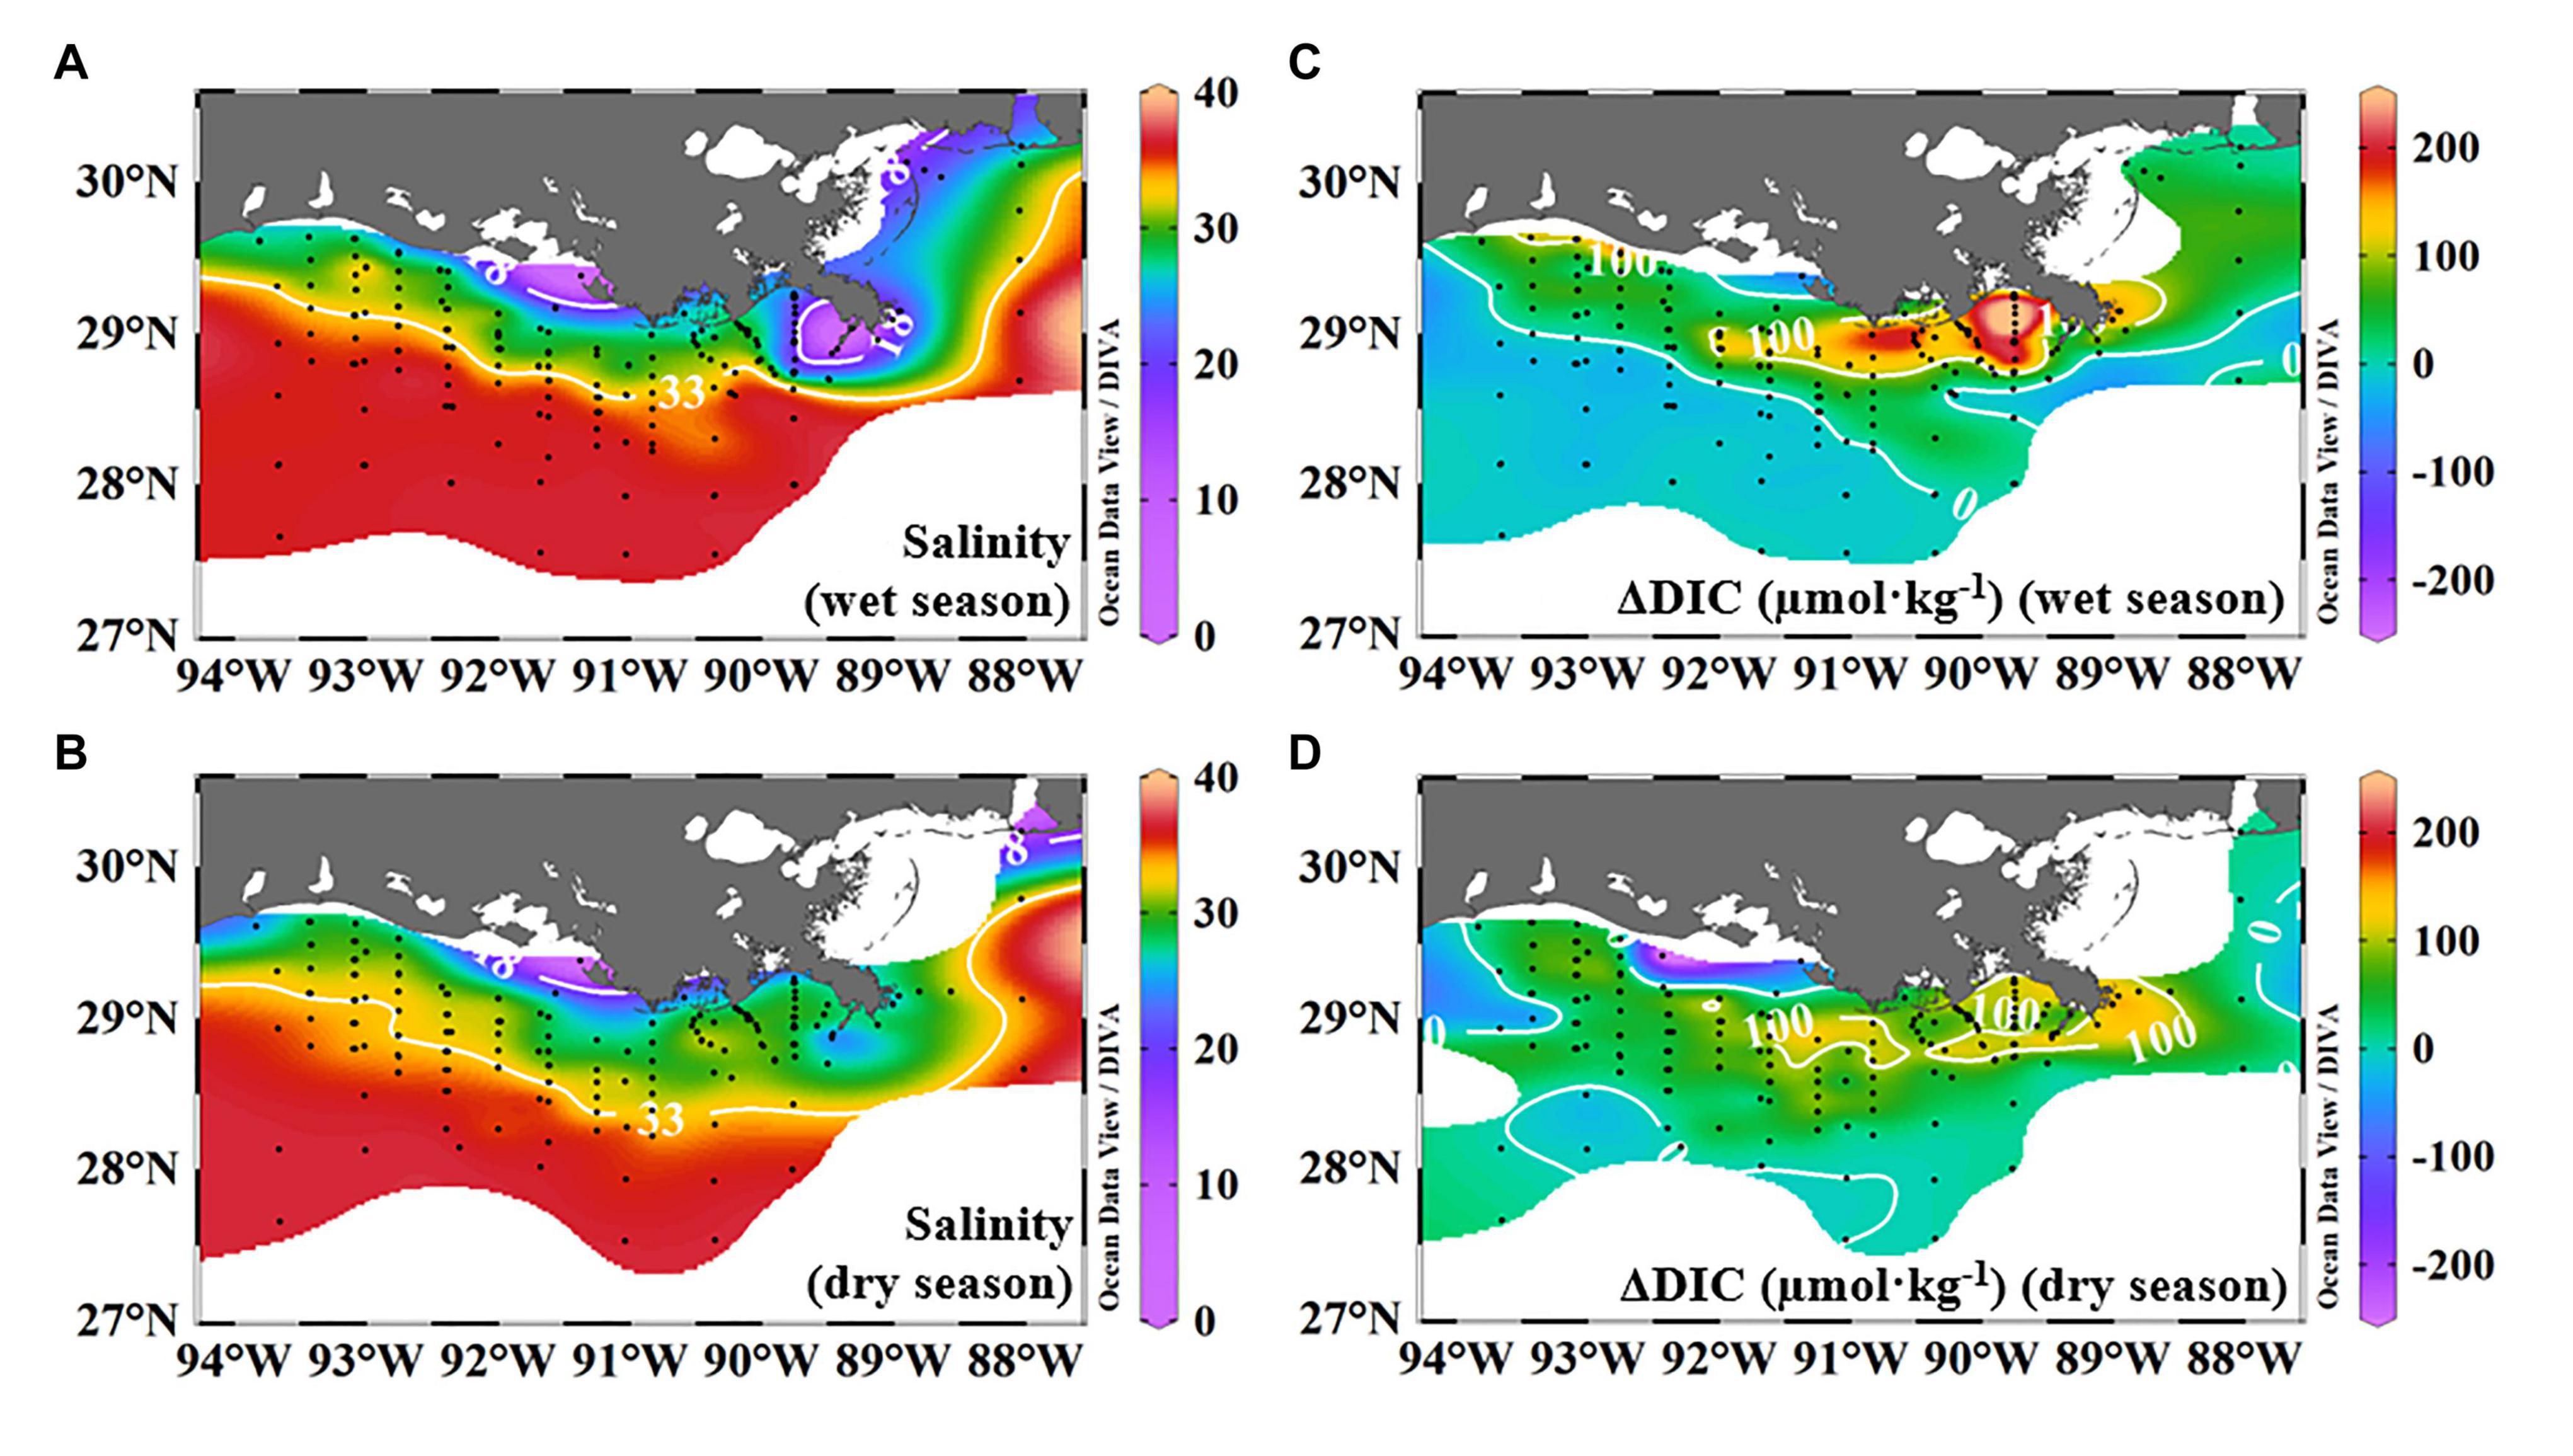
Figure 6. Distributions of multi-year average salinity and ΔDIC in the near-surface water during wet and dry seasons. Average salinity was from salinities of nine cruises to show the general trend of river plume trajectory. Salinities lower than 18 were along the inner shelf, and salinities between 18 and 33 were observed along the inner to middle shelves (A,B). The salinity contour line of 33 was to the north of 28.5°N in the wet season and to the south in the dry season (A,B). Net DIC removal/accumulation (ΔDIC) values calculated in section “Net Dissolved Inorganic Carbon Removal (ΔDIC) and Nitrate Removal (ΔNO3) Over the Water Column” by the three-end-member model were averaged to display the general trend of ΔDIC over the plume trajectory. High, positive ΔDIC values were observed next to the river channel in the middle field of this plume, displaying ∼200 μmol⋅kg–1 in the wet season and <150 μmol⋅kg–1 in the dry season (C,D). Negative or ΔDIC values close to zero were on the southwestern and outer shelves in both seasons (C,D). Note the positive ΔDIC value in the near-surface waters is defined as net DIC removal. DIC, dissolved inorganic carbon.
Distinct carbonate variations were between the near-surface water; and the near-bottom, subsurface waters, and their values and distributions varied seasonally. ΔDIC values were more positive while ΩArag values were high in the near-surface water close to the coast, and ΔDIC became negative while ΩArag values were low in the near-bottom, subsurface, and deep waters (Figure 7) on the cross-shelf transect C in the middle of this shelf (Figure 1). Note that ΔDIC in Figure 7 was from the result of three-end-member mixing in the section “Net Dissolved Inorganic Carbon Removal (ΔDIC) and Nitrate Removal (ΔNO3) Over the Water Column.” These cross-shelf changes in ΔDIC and ΩArag further displayed seasonal variations (Figure 7). In January, high DIC removal (ΔDIC ∼ 100 μmol⋅kg–1) and high ΩArag (>4) values were observed in the inner shelf (Figures 7a,f). From March to July, high ΔDIC and ΩArag were in the near-surface layer, while low values were in the near-bottom, subsurface waters (Figures 7a–e for ΔDIC, Figures 7f–j for ΩArag). During the late fall (November), low ΔDIC values were observed on the inner shelf, while high ΩArag values were recorded on the outer shelf (Figures 7e,j). Moreover, high ΔDIC and ΩArag values extended from the inner shelf to 100- to 150-km offshore in March 2010 (Figures 7b,g).
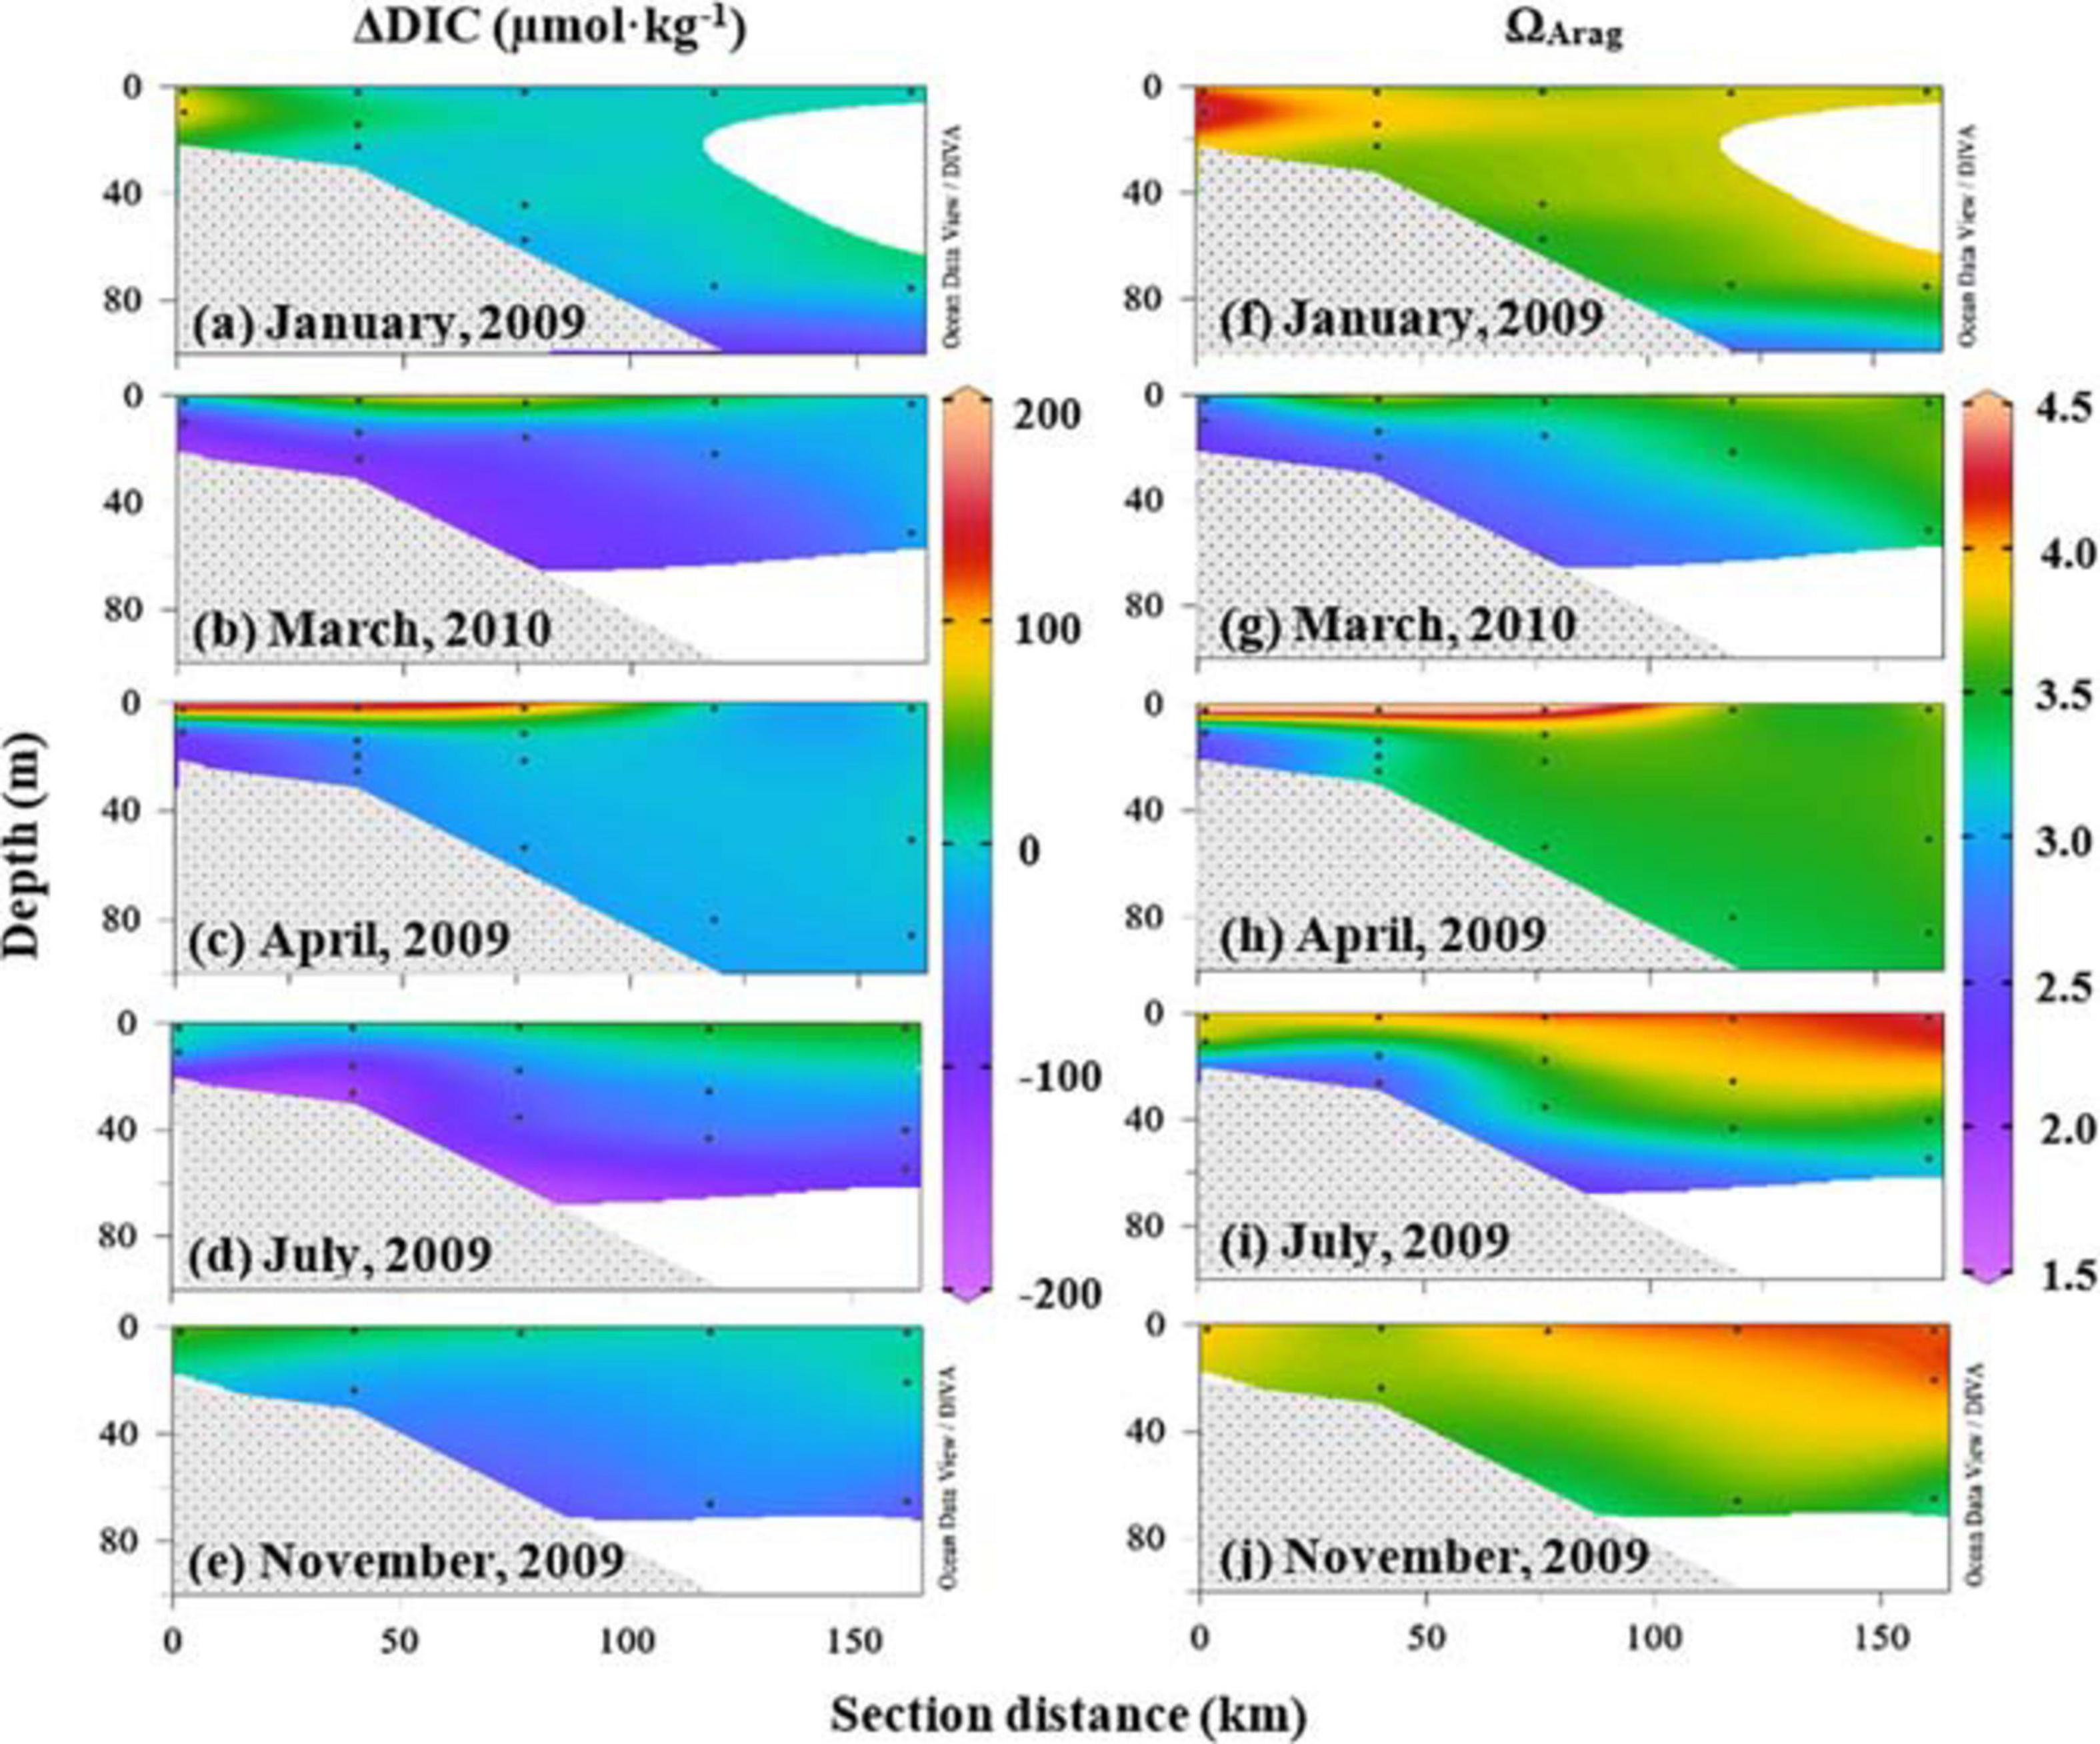
Figure 7. Cross-shelf distributions of ΔDIC and ΩArag. ΔDIC and ΩArag displayed cross-shelf variations and varied seasonally (a–j). In January, high ΔDIC (∼100 μmol⋅kg–1) and high ΩArag (>4.0) values were in the inner shelf. From March to July, high ΔDIC and ΩArag were on the near-surface layer, while low values were in the near-bottom, subsurface waters. During late fall (November), weak ΔDIC values were observed in the inner shelf, and high ΩArag values were on the outer shelf. DIC, dissolved inorganic carbon.
The ΩArag-to-depth profile demonstrated the difference in variations of ΩArag among the near-surface water, near-bottom, subsurface, and deep waters (Figure 8). ΩArag values varied greatly (1.0 < ΩArag < 6.0) in the surface layer (<5 m) and narrowed to a range between ∼2.0 and 5.0 in the subsurface and bottom waters on the middle shelf (20–100 m). ΩArag values were generally less than 2.0 and decreased toward 1.0 or lower in deeper waters (>200 m) (Figure 8).
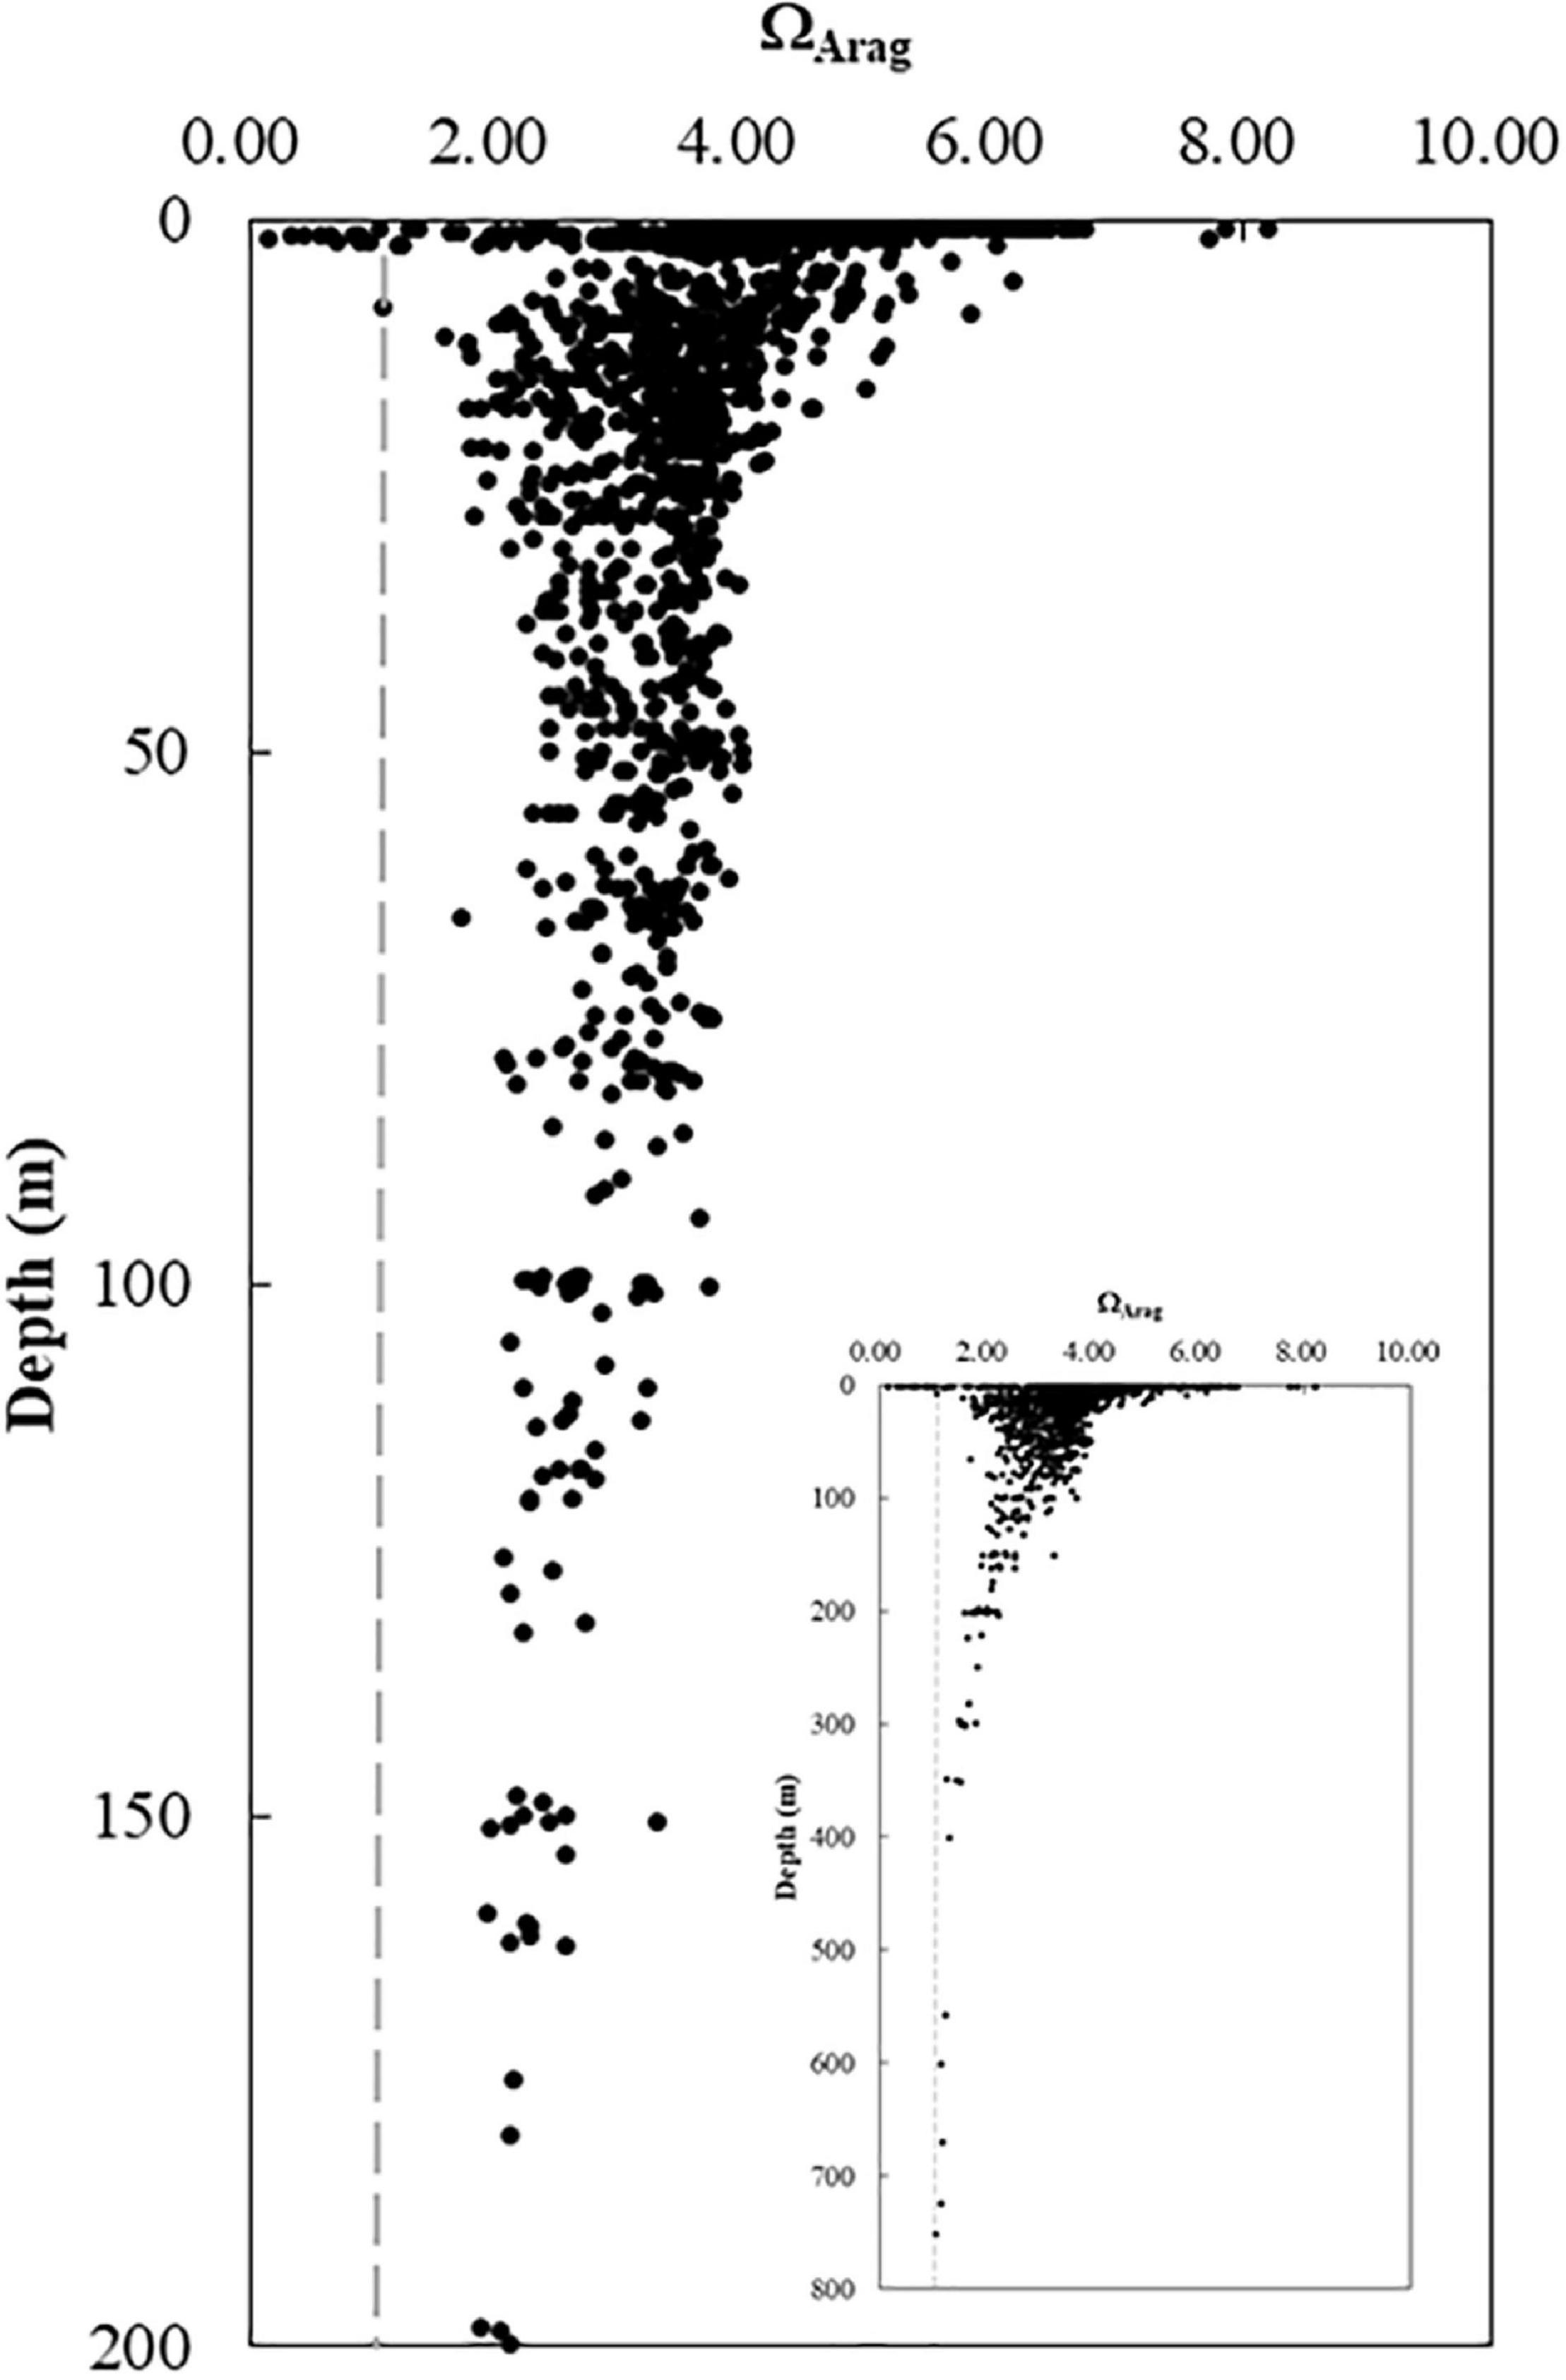
Figure 8. Vertical variations in ΩArag. ΩArag varied from 1.0 to 8.0 with large ΔDIC variations in the near-surface water and changed from 2.0 to 4.0 in the subsurface and bottom waters on the shelf. The ΩArag value gradually decreased from 2.0 at 200 m to close to 1.0 at 800 m (the inset). DIC, dissolved inorganic carbon.
Strong seasonal variations in ΔDIC and ΩArag were observed across the shelf, particularly on the inner-to-middle shelf (Figure 7). Therefore, we focus on this area to display their monthly variations in two specified regions.
We considered the horizontal dispersal (Figures 6, 7) and vertical stratification (Figure 7) and organized the monthly ΔDIC on specified conditions on the inner-to-middle shelf to quantify the spatial–temporal ΔDIC variations. (Note that ΔDIC was from the calculation in the section “Net Dissolved Inorganic Carbon Removal (ΔDIC) and Nitrate Removal (ΔNO3) Over the Water Column” by the three-end-member mixing.) In the near-surface water (specified at sample depth < 5 m, salinity < 35, to the north of 28.2°N), the average of ΔDIC values increased from 14.3 μmol⋅kg–1 in January to 126.6 μmol⋅kg–1 in June and subsequently decreased to nearly zero (–2.9 μmol⋅kg–1) in November (Figure 9A). Interestingly, the seasonal trend of ΔDIC in the specified the near-bottom, subsurface water (20–100 m, to the north of 28.2°N) displayed an opposite pattern; that is, it changed from –13.5 μmol⋅kg–1 in January to –102 μmol⋅kg–1 in July and –13 μmol⋅kg–1 in September and returned to –42.5 μmol⋅kg–1 in November (Figure 9A). Though data in March 2010 and July 2009 were affected by special weather events (will be discussed later), monthly average ΔDIC in the specified near-surface and near-bottom, subsurface waters still demonstrated clear seasonal trends (Figure 9A). In particular, we noticed that the ΔDIC peak time in the near-surface water (June) was 1-3 months (approximately 2 months hereafter) ahead of the one in the near-bottom, subsurface waters (July to September).
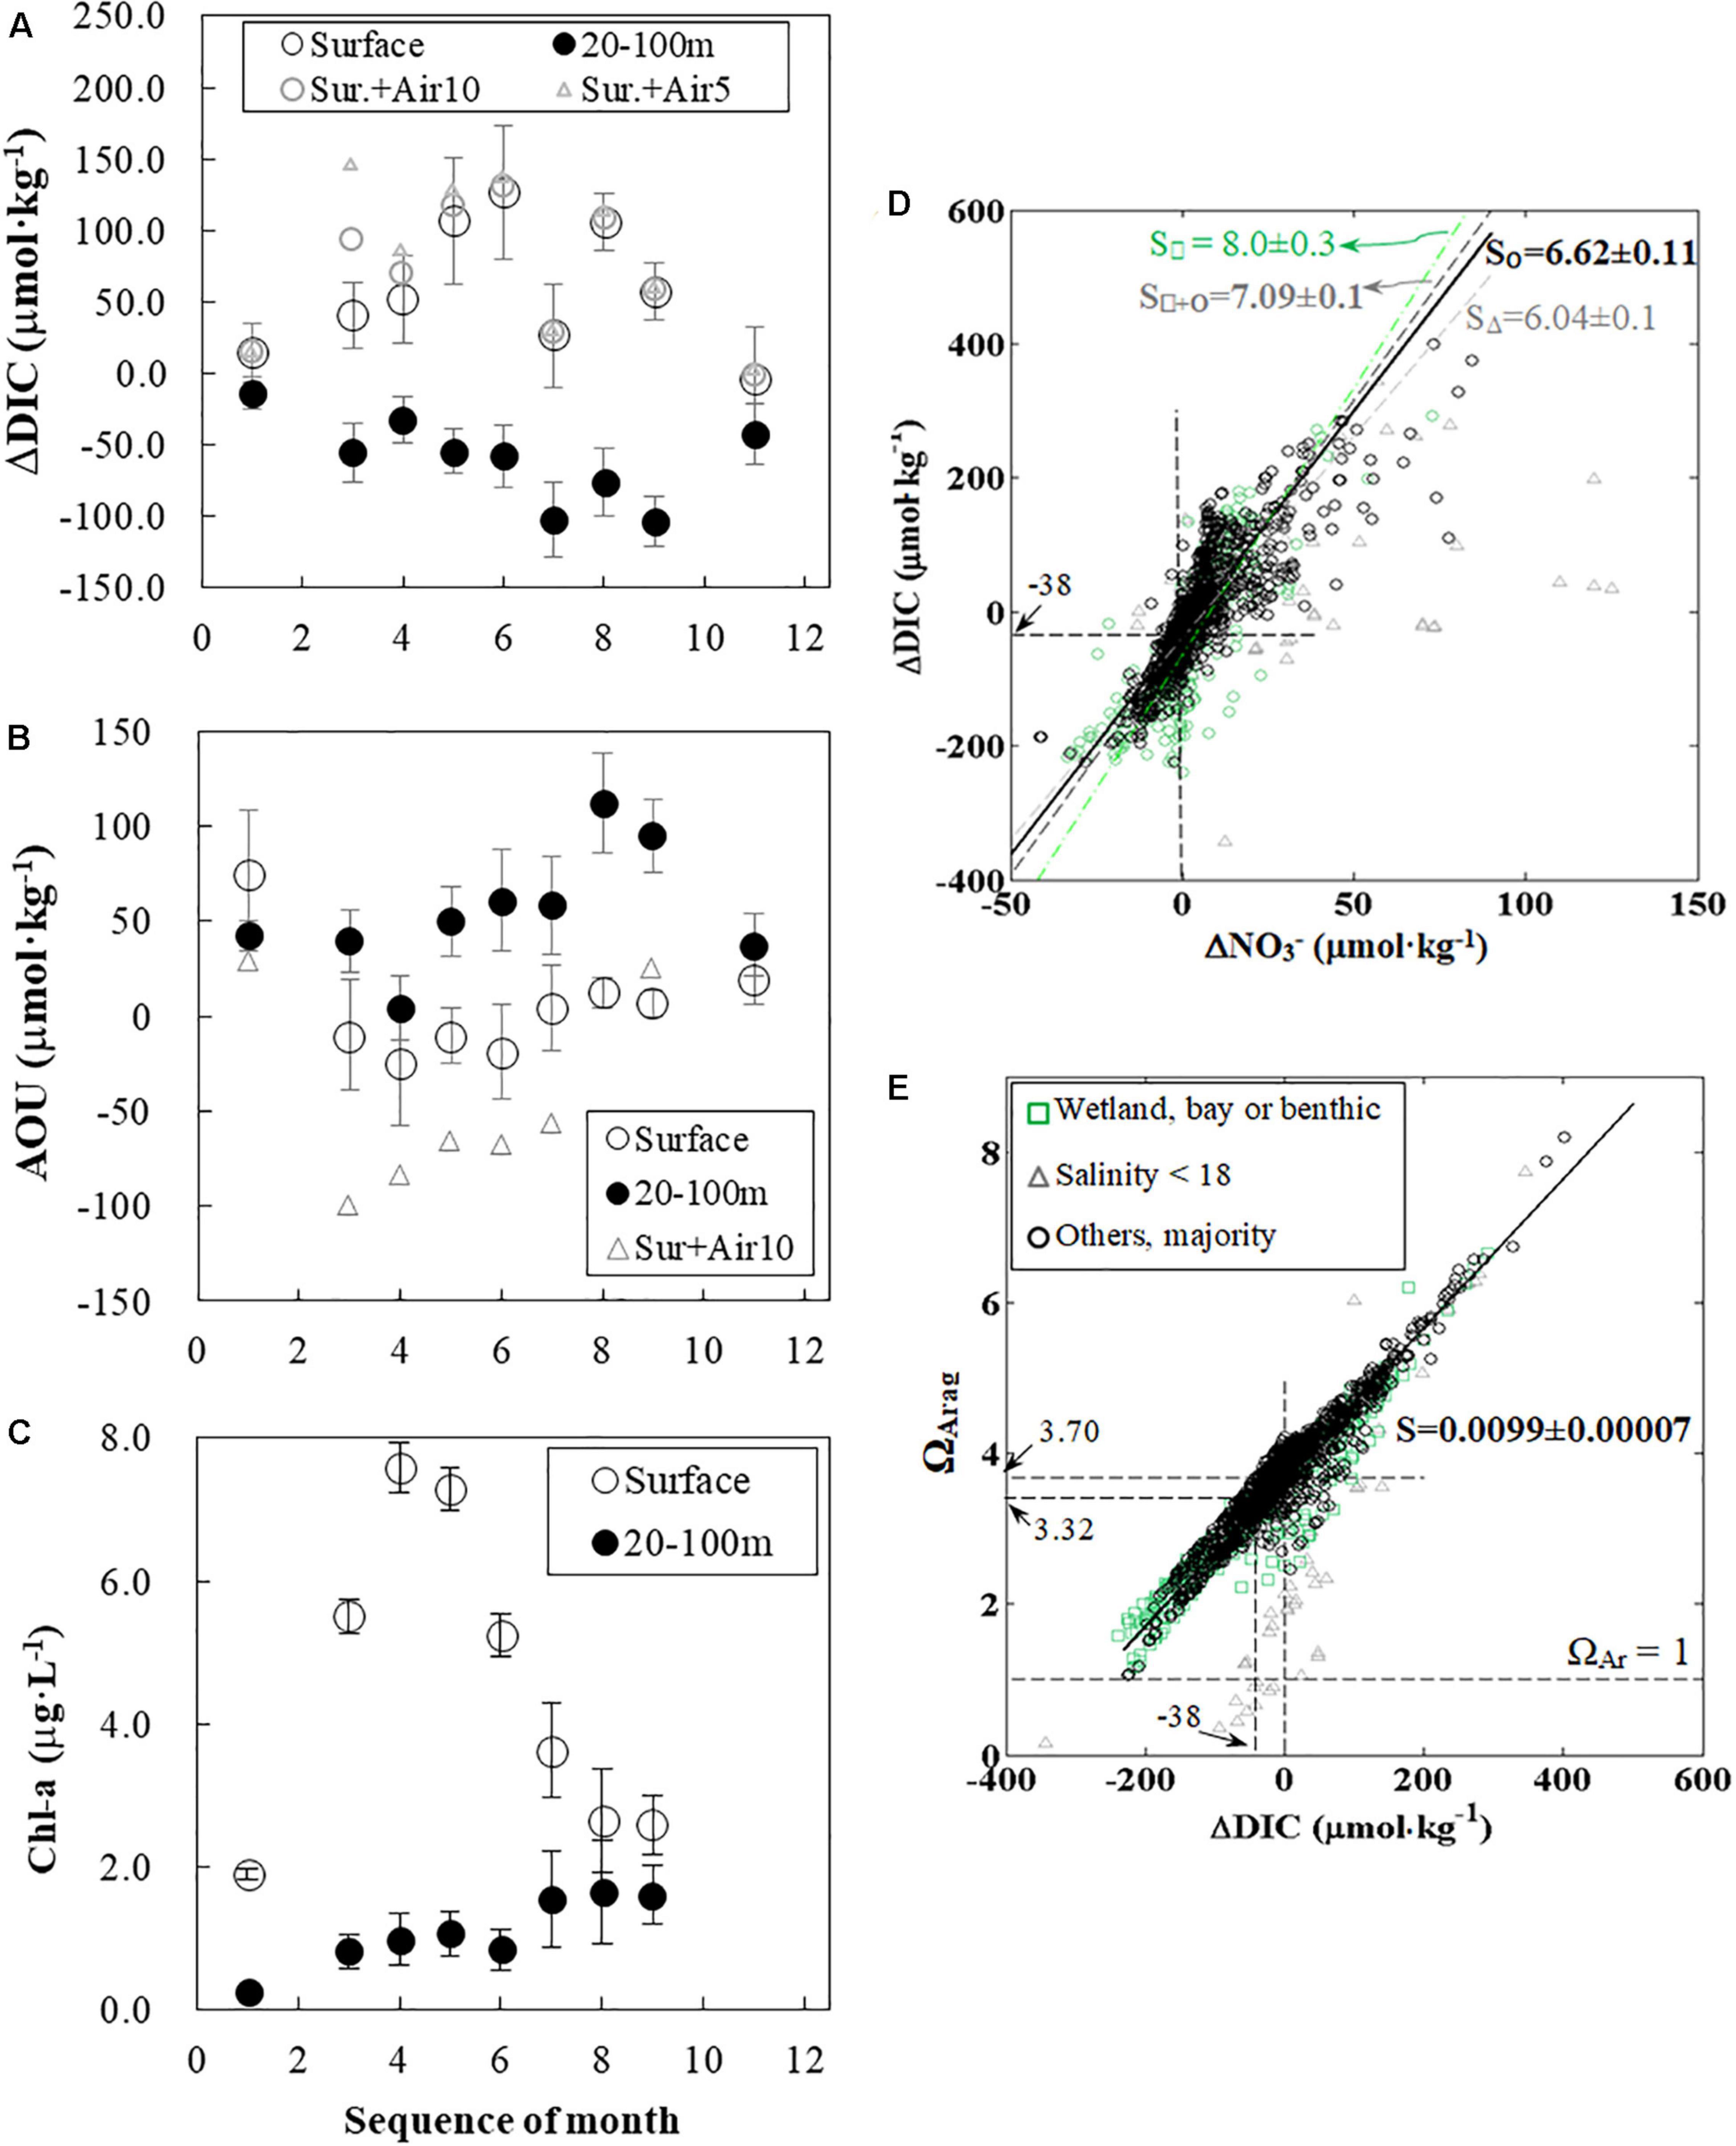
Figure 9. Seasonal variations in ΔDIC, AOU, Chl-a, and relationships between ΔDIC, ΔNO3–, and ΩArag. In the near-surface water, the average of ΔDIC values increased from January to June and subsequently decreased to nearly zero (–2.9 μmol⋅kg–1) in November. Interestingly, the seasonal trend of ΔDIC in the near-bottom, subsurface waters displayed an opposite pattern, decreasing from January to July and September and increasing until November. ΔDIC values in panel (A) were averaged from the specific water in each cruise by the result of three-end-member model (section “Net Dissolved Inorganic Carbon Removal (ΔDIC) and Nitrate Removal (ΔNO3) Over the Water Column”). The effect of air–sea CO2 gas exchanges from Huang et al. (2015b) on ΔDIC was usually less than 10% (assuming 5- and 10-m mixing layer depth for triangle markers and open gray circles, respectively) (A). AOU in the near-surface waters and near-bottom, subsurface waters displayed a time delay in their peak; that is, April to June vs. August (B). The effect of air–sea O2 gas exchange on AOU in the near-surface water was large, and peak time was still similar (assuming 10-m mixing layer depth, triangle markers). Air–sea CO2 and O2 fluxes were exceptionally large in March (A,B).Chl-a concentrations were low (<2 μg⋅L–1) in January, increased to >7 μg⋅L–1 in April, and decreased back to <3 μg⋅L–1 in August and September in the near-surface water (C). In the near-bottom, subsurface waters, Chl-a was < 3 μg⋅L–1 and increased from January to September (C). Bars in panels (A–C) represent ± 1 standard deviation of the average. Furthermore, ΔDIC values from each sample in all cruises were positively correlated to the corresponding ΔNO3 – values (d). The slope of the regression line of majority data (circles) was close to the Redfield ratio, and the intercept was –38 μmol⋅kg–1 (D). Besides, this slope could likely be affected by low salty water (triangle markers), wetland exports (square markers), CaCO3 precipitation, and the regional change of the Redfield ratio (D). Finally, ΩArag values from all samples were also positively correlated to the corresponding ΔDIC (E). The multi-year effect of being a CO2 sink (0 to –38 μmol⋅kg–1) can lead to a decrease of ΩArag from 3.70 to 3.32 (E). (B,C) share the same legend. Note that the positive ΔDIC value in surface waters is defined as net DIC removal. DIC, dissolved inorganic carbon; AOU, apparent oxygen utility; Chl-a, chlorophyll a.
Interestingly, monthly AOU and Chl-a both demonstrated similar seasonal trends (Figures 9B,C). The AOU seasonal variation in the near-surface water, correspondingly, decreased from 75 to –25 to –19 μmol⋅kg–1 from April to June and gradually increased to 20 μmol⋅kg–1 in November. In contrast, AOU in the near-bottom, subsurface waters displayed a maximum (112 μmol⋅kg–1) in August and a minimum (4 μmol⋅kg–1) in April. The AOU peak time in the near-surface water (April to June) was 2-3 months ahead of the one in the near-bottom, subsurface waters (August). Furthermore, monthly Chl-a in the near-surface water increased from the lowest of ∼2 μg⋅L–1 in January to the maximum value of 7.6 μg⋅L–1 in April and again decreased to 2.6 μg⋅L–1 in August (Figure 9C). Monthly Chl-a concentrations in the near-bottom, subsurface waters were lower than those in the near-surface waters, increasing from a minimum of 0.27 μg⋅L–1 in January to 1.7 μg⋅L–1 in August (Figure 9C). The peak time in the near-surface waters (April) was almost 4 months ahead of the one in the near-bottom, subsurface waters (August and September).
Seasonal changes in the carbonate system vary along the plume trajectory and dissipate offshore or away from the river mouths due to mixing and biological activities. For regions near the Mississippi River Delta, Green et al. (2006) have estimated the water residence time (less than 14.5 days) by examining satellite images. For the entire shelf, fluctuating river discharge can change water transit time in the nGOM, resulting in that freshwater volume on the shelf lags the discharge by 21-33 days (Zhang et al., 2012). We generally follow the above two estimations to choose the river end-members in advance of our sampling cruise (Supplementary Table 1). Anderson et al. (2020) have estimated the residence time to be short during July (4–68 days) and to be long (11–233 days) during September by using radium radioisotopes. This physical water residence time on the shelf is long enough to support the biogeochemical temporal scales of Chl-a and ΔDIC in the section “Monthly Variations in ΔDIC, Apparent Oxygen Utility, and Chlorophyll a on Specified Regions on the Inner-to-Middle Shelf.” Moreover, previous studies have demonstrated that mixing dominated regions with salinities lower than 18 in this study area (Green et al., 2006; Lohrenz et al., 2010; Huang et al., 2015b). Mixing can further affect the carbonate system, as pH and ΩArag are non-conservative, particularly at low-salinity estuaries where minimum buffering and pH zones often occur (Mook and Koene, 1975; Hu and Cai, 2013; Hu et al., 2017).
The net biological activity includes photosynthesis and respiration. Primary production can be affected by the availability of nutrients and environmental factors [such as water temperature, stratification, insolation duration, and light attenuation (kd)]. Previous studies have demonstrated variations in ΔDIC mostly in the near-surface water at particular seasons (as high as 400–500 μmol⋅kg–1 during spring and as low as < 200 μmol⋅kg–1 during fall) (Guo et al., 2012; Huang et al., 2012a; Fry et al., 2015). Murrell et al. (2013) have reported that gross primary production varied at different salinity ranges (0–18, 18–27, 27–32, and >32), and it can be over 250 mmol⋅m–2⋅day–1 in the second salinity range (18–27). Furthermore, they also have suggested that GPP and respiration both occurred throughout the water column, and the net ecosystem metabolism switched to net respiration when the water column was >20 m. In line with results of previous studies, ΔDIC was overall positive in the near-surface water and negative in the near-bottom, subsurface waters. Moreover, this study fulfills the seasonal variation in ΔDIC in both near-surface and near-bottom, subsurface waters.
Special weather events may alter the carbonate system by changing the plume dispersal direction or range. In the first case, the near-surface water acted as a weak sink of CO2 with an eastward river plume and an upwelling-favorable wind in July 2009 (Zhang et al., 2012; Fichot et al., 2014; Huang et al., 2015a), leading to the early development of hypoxia (Feng et al., 2014). At the northern South China Sea, seasonal upwelling in this large-river-dominated continental shelf can reduce acidification in the near-bottom waters (Huang et al., 2020). In the second case, Huang et al. (2013) have reported an extended surface plume over the middle and outer shelves in March 2010 due to an exceptionally widespread plume when winter storms dominated North America.
We interpret the major and minor effects of carbonate dynamics by examining the regression’s slope and intercept ΔDIC and ΔNO3–. We assume that ΔDIC is composed of net biological removals (ΔOC), ΔCaCO3, and the proportion of DIC affected by air–sea CO2 gas exchanges (ΔDICair–sea).
where positive ΔDICair–sea represents a CO2 source to the atmosphere and a negative value represents CO2 sink. We further assume that the CaCO3 precipitation/dissolution is proportional to ΔOC (ΔCaCO3 = β × ΔOC) (Chen et al., 1995, 2017).
Furthermore, ΔOC can be converted to ΔDIC through the Redfield ratio (α = C/N = 106/16). Eq. (14) can thus be converted to an equation including α and β, as follows:
We organize the relationship between ΔDIC and ΔNO3– in Eq. (15) (Figure 9D), which showed a slope and an intercept reflecting α(1 + β) and the air–sea CO2 flux, respectively. In the major response region, the slope reflecting C:N ratio in the relationship between ΔDIC and ΔNO3– is 6.62 ± 0.11 (n = 1,213) (Figure 9D) (by type II regression as both ΔDIC and ΔNO3– have uncertainties). This slope value over a shelf-wide area is consistent with previous studies with less temporal and spatial coverage (Huang et al., 2012a; Xue et al., 2015).
We quantitatively discuss the regional variation of the Redfield ratio (α in Eq. 15) and the CaCO3 formation (ΔCaCO3, β in Eq. 15). The effect of net community calcification (NCC) is usually lower than net community production (NCP) (that is, NCC:NCP<<1). For instance, the decrease of DIC can be mostly due to NCP instead of NCC during a coccolithophore bloom in the northwest European continental margin (Suykens et al., 2010). Martiny et al. (2013), which suggested that stoichiometry varies among phytoplankton species in addition to the traditional Redfield ratio (Redfield, 1958). On the same cruises from 2009 to 2010, Chakraborty and Lohrenz (2015) have observed that diatoms and cyanobacteria dominated the phytoplankton community in this study area. The C/N ratio of diatoms can be higher than the Redfield ratio (Geider and LaRoche, 2002), and the ratio of cyanobacteria can be lower than the Redfield ratio (Martiny et al., 2013). We focus on the data in the major response area (excluding two exceptional regions in Figure 9D) and adopt the proportion of NCC to NCP of 5% at the Atlantic Ocean (Tyrrell and Young, 2009) and 1–3% in the global scale (Balch, 2018) with traditional Redfield C/N ratios (α≅ 6.625, 6.125 < α < 6.64), resulting in a range of α(1 + β) between 6.186 and 6.972. This theoretical range of α(1 + β) was consistent with our observation of 6.62 ± 0.11. Thus, we suggest that the net removal of DIC and nitrate ratio can also be affected by the proportion between NCC and NCP in the aerobic water column. The benthic CO2 flux during hypoxia may provide an additional DIC source (Hu et al., 2017) and, together with N2 degassing through denitrification reported by Xue et al. (2015), and may lead to a potential higher C/N ratio in the water column respiration. Besides, though organic matters can affect alkalinity values during the titration process (Hernández-Ayon et al., 2007), this contribution has been suggested to be minor compared with our analytical precision (0.1%) (Yang et al., 215).
Two areas, one affected by salinities lower than 18 and the other affected by export from wetlands/bays, may also lead to changes in the slope between ΔDIC and ΔNO3– (Figure 9D). The area affected by low salinities is likely dominated by mixing, as mentioned in the sections “Seasonal Properties to Salinity Relationships and Mixing and Non-mixing Factors of ΔDIC.” For example, the changing DIC river end-member in the section “Seasonal Properties to Salinity Relationships” may also affect the ΔDIC result in low salinities. We focused on the result on the shelves where middle to high salinities were dominant. The other data that are affected by the wetlands/bays display a slope of 8.0 ± 0.3 (n = 245) (see Supplementary Information for details about these effects) on the ΔDIC and ΔNO3– diagram (Figure 9D). The slope of data from the above two areas (7.09 ± 0.1) is very close to the C/N ratio of 7.16 ± 0.15 from particulate organic matter (POM) in this study area in late July from 2006 to 2010 (n = 429) as reported by Fry et al. (2015). This is likely to be because particulate organic carbon (POC) and dissolved organic carbon (DOC) from Barataria Bay might be more labile (likely increase DIC) than the incubated plume water (“the bay water contributes higher potential lability of 35% than the plume water, which is 15%”) (Fry et al., 2015). Thus, organic matter from Barataria Bay may slightly affect α in this study. Moreover, a higher Si/N ratio in the northern Louisiana Bight may be related to the export from the wetland (Huang et al., 2012a). The water’s Si/N ratio may affect both the composition of phytoplankton and respiration (Turner et al., 1998). Berelson et al. (2019) have observed that fluxes of dissolved Si and DIC are significantly correlated on the hypoxia-influenced sediment on this study area, and they have suggested the importance of diagenesis of biogenic Si and organic carbon.
Recent observations demonstrated that DIC export through wetlands to the nGOM could be important (Anderson et al., 2020). Subsurface groundwater (SGD) can be a pathway and has been noticed in the past two decades (Bugna et al., 1996; McCoy et al., 2007; McCoy and Corbett, 2009; Befus et al., 2017; Coleman et al., 2017). DIC export through SGD can be low in snowmelt and wet seasons and high during the dry season in the Mississippi River basin (Cai et al., 2020). However, the role of SGD in the carbon budget of North America is still unclear (Najjar et al., 2018).
The intercept of this regression line (with a slope of 6.62 for the majority of this study area, Figure 9D) for ΔDIC and ΔNO3– can reflect the net effect of air–sea CO2 gas exchange on DIC when ΔNO3– = 0 and ΔDIC = ΔDICair–sea = –38 μmol⋅kg–1 as expressed in Eq. (15). The assumption of ΔNO3– equals to 0 in this regression line does not imply zero biological activity, but the net biological activity (net ecosystem photosynthesis minus respiration) is zero. The intercept is below zero, implying that this study area generally acts as a CO2 sink according to the net results of high biological DIC uptake and release on this highly dynamic shelf. Our interpretation is consistent with the direct measurements of pCO2 in this study region (Huang et al., 2015b). We count these direct measurements of air–sea CO2 gas exchange in each month and suggest that the effect of air–sea gas exchanges for each month was usually less than 10% to 20% of ΔDIC (Figure 9A and Supplementary Table 4). The effect of air–sea CO2 gas exchange on surface ΔDIC in March was exceptionally strong, as the plume coverage was exceptionally large due to the winter storm (Huang et al., 2013). Moreover, air–sea O2 gas exchange can also supply additional DO for AOU in the near-surface water (details in Supplementary Table 5). The AOU peak in the near-surface water was still in April when we exclude the exceptional case in March.
To sum up, the slope of the ΔDIC and ΔNO3– diagram shows that Redfield-type biological activities were dominant in this study area with several minor factors. Exports from the wetland into the inner shelf region are complex and can be studied in the future.
Dissolved inorganic carbon uptake can increase ΩArag values (Figure 9E), resulting in a near-linear relationship. The observed ΩArag to ΔDIC relationship has a slope of 0.0099 ± 0.00007 (nearly 0.01) and an intercept of 3.70 for those waters with an average salinity of 33.5 (±1.85). Note that the influence of two areas (wetland/bay or benthic process, and low salty region) has been excluded in this regression. Slope and intercept of this regression can reveal the effects of photosynthesis, respiration, and air–sea gas exchange on the ΩArag variation. Xiong et al. (2019) have suggested that high ΩArag values were insensitive to salinity changes than low ones. They also have considered the combined effect of salinity and ΔDIC changes on ΩArag variations. They suggest that the effect of a unit of salinity decrease on ΩArag decline can be counteracted by a DIC uptake of 9.43 μmol⋅kg–1, displaying that model simulations can reveal details in carbonate variations in a single event. In a global scale, ΩArag is expected to increase 1.06 or 0.91 unit for every 100 increase of [TA–DIC] at the in situ condition or a condition in 25°C and 3 dbar, respectively (Xue and Cai, 2020). The change of [TA–DIC] was highly related to changes of [CO32–] and [CO2∗], which proportion subjects to the pH level. Wang et al. (2017) have reported that ΩArag is expected to decrease by 1 for every 100 μmol⋅kg–1 increase of DIC in the western Gulf of Maine. A consistent value (that is, 100 ΔDIC μmol⋅kg–1 to 1 ΩArag) from the Gulf of Maine and this study area provides a shelf-wide result from various seasons on a regional scale. As the carbonate system and biological activities can vary regionally, we suggest that this slope between ΔDIC and ΩArag value may also change correspondingly. This slope of ∼0.01 in this study may represent the one at high productivity and high TA coastal regions and can help mimic marine in situ ΩArag variations.
The net effect of being a CO2 sink through DIC on ΩArag can be calculated by applying ΔDIC = ΔDICair–sea = –38 μmol⋅kg–1 to the ΩArag function of ΔDIC (ΩArag = 0.0099 × ΔDIC + 3.70), displaying a result of 3.32 (Figure 9E). As the atmospheric partial pressure of carbon dioxide (pCO2) has increased over our 5-year study period (Huang et al., 2015b), the effect of varying atmospheric pCO2 on the air–sea gas exchange would only lead to 2% of ΩArag change in the near-surface waters (Wanninkhof et al., 2015). This difference of 0.38 in the ΩArag changes (3.70–3.32 = 0.38) should mostly represent the effect of air–sea CO2 gas exchange through the water column DIC on ΩArag. Though the riverine nitrogen-induced biological activity can trigger a larger variation than the influence of air–sea CO2 gas exchange on ΩArag variations, we suggest that the former factor only controls the seasonal ΩArag variation and that the latter one controls the ΩArag value on a longer time scale (decadal). Low ΩArag values in low salinities (S < 18) in Figure 9E are consistent with results provided by Xiong et al. (2019), who have simulated the effect of salinity changes on ΔDIC and indicate that ΩArag decreases with a reduction in salinity at a given ΔDIC. Besides, a few ΩArag values lower than the regression line (Figure 9E) may signal the benthic processes affecting the inorganic carbon system (Murrell et al., 2013; Fry et al., 2015; Hu et al., 2017). A few outliers are from depths of 350 to 720 m, except one from 8 m at the river mouth, and all had temperature < 10°C. Here, deep waters (200 to 700 m) are from regions other than the Gulf of Mexico, such as the Caribbean (Rivas et al., 2005).
Finally, we suggest that the relative proportion of each carbonate-related biogeochemical process on a river-dominated continental shelf is as follows: mixing (roughly ∼<200 μmol⋅kg–1 in salinities > 18 waters, Figures 3E–H) and NCP (0 to 120 μmol⋅kg–1 in monthly average, Figure 9A) (>70%)≫ effect of air–sea CO2 gas exchange on DIC (38 μmol⋅kg–1 in average, Figure 9D) (∼<10–20%, depending on the pCO2 level induced by other factors) > CaCO3 precipitation and the variation of stoichiometry (<7% by evaluating α and β in the section “Effects of Minor Factors on the ΔDIC Variation”).
We use a seasonal conceptual model to integrate the spatial–temporal ΔDIC variations in this river-dominated continental shelf (Figure 10). Seasonal variations in river end-members, shelf circulation, shelf-water residence time, wind direction, cross-shelf transportation, bays and wetlands export (including SGD), and also biogeochemical processes (such as autotrophic or heterotrophic activities, benthic processes, carbonate precipitation or dissolution, and air–sea gas exchanges) all contribute to the carbonate system in this shelf. At the connecting regions, these biogeochemical parameters (such as DIC, pH, and ΩArag) are diluted by mixing with the pelagic ocean or varied by exports from bays or wetlands.
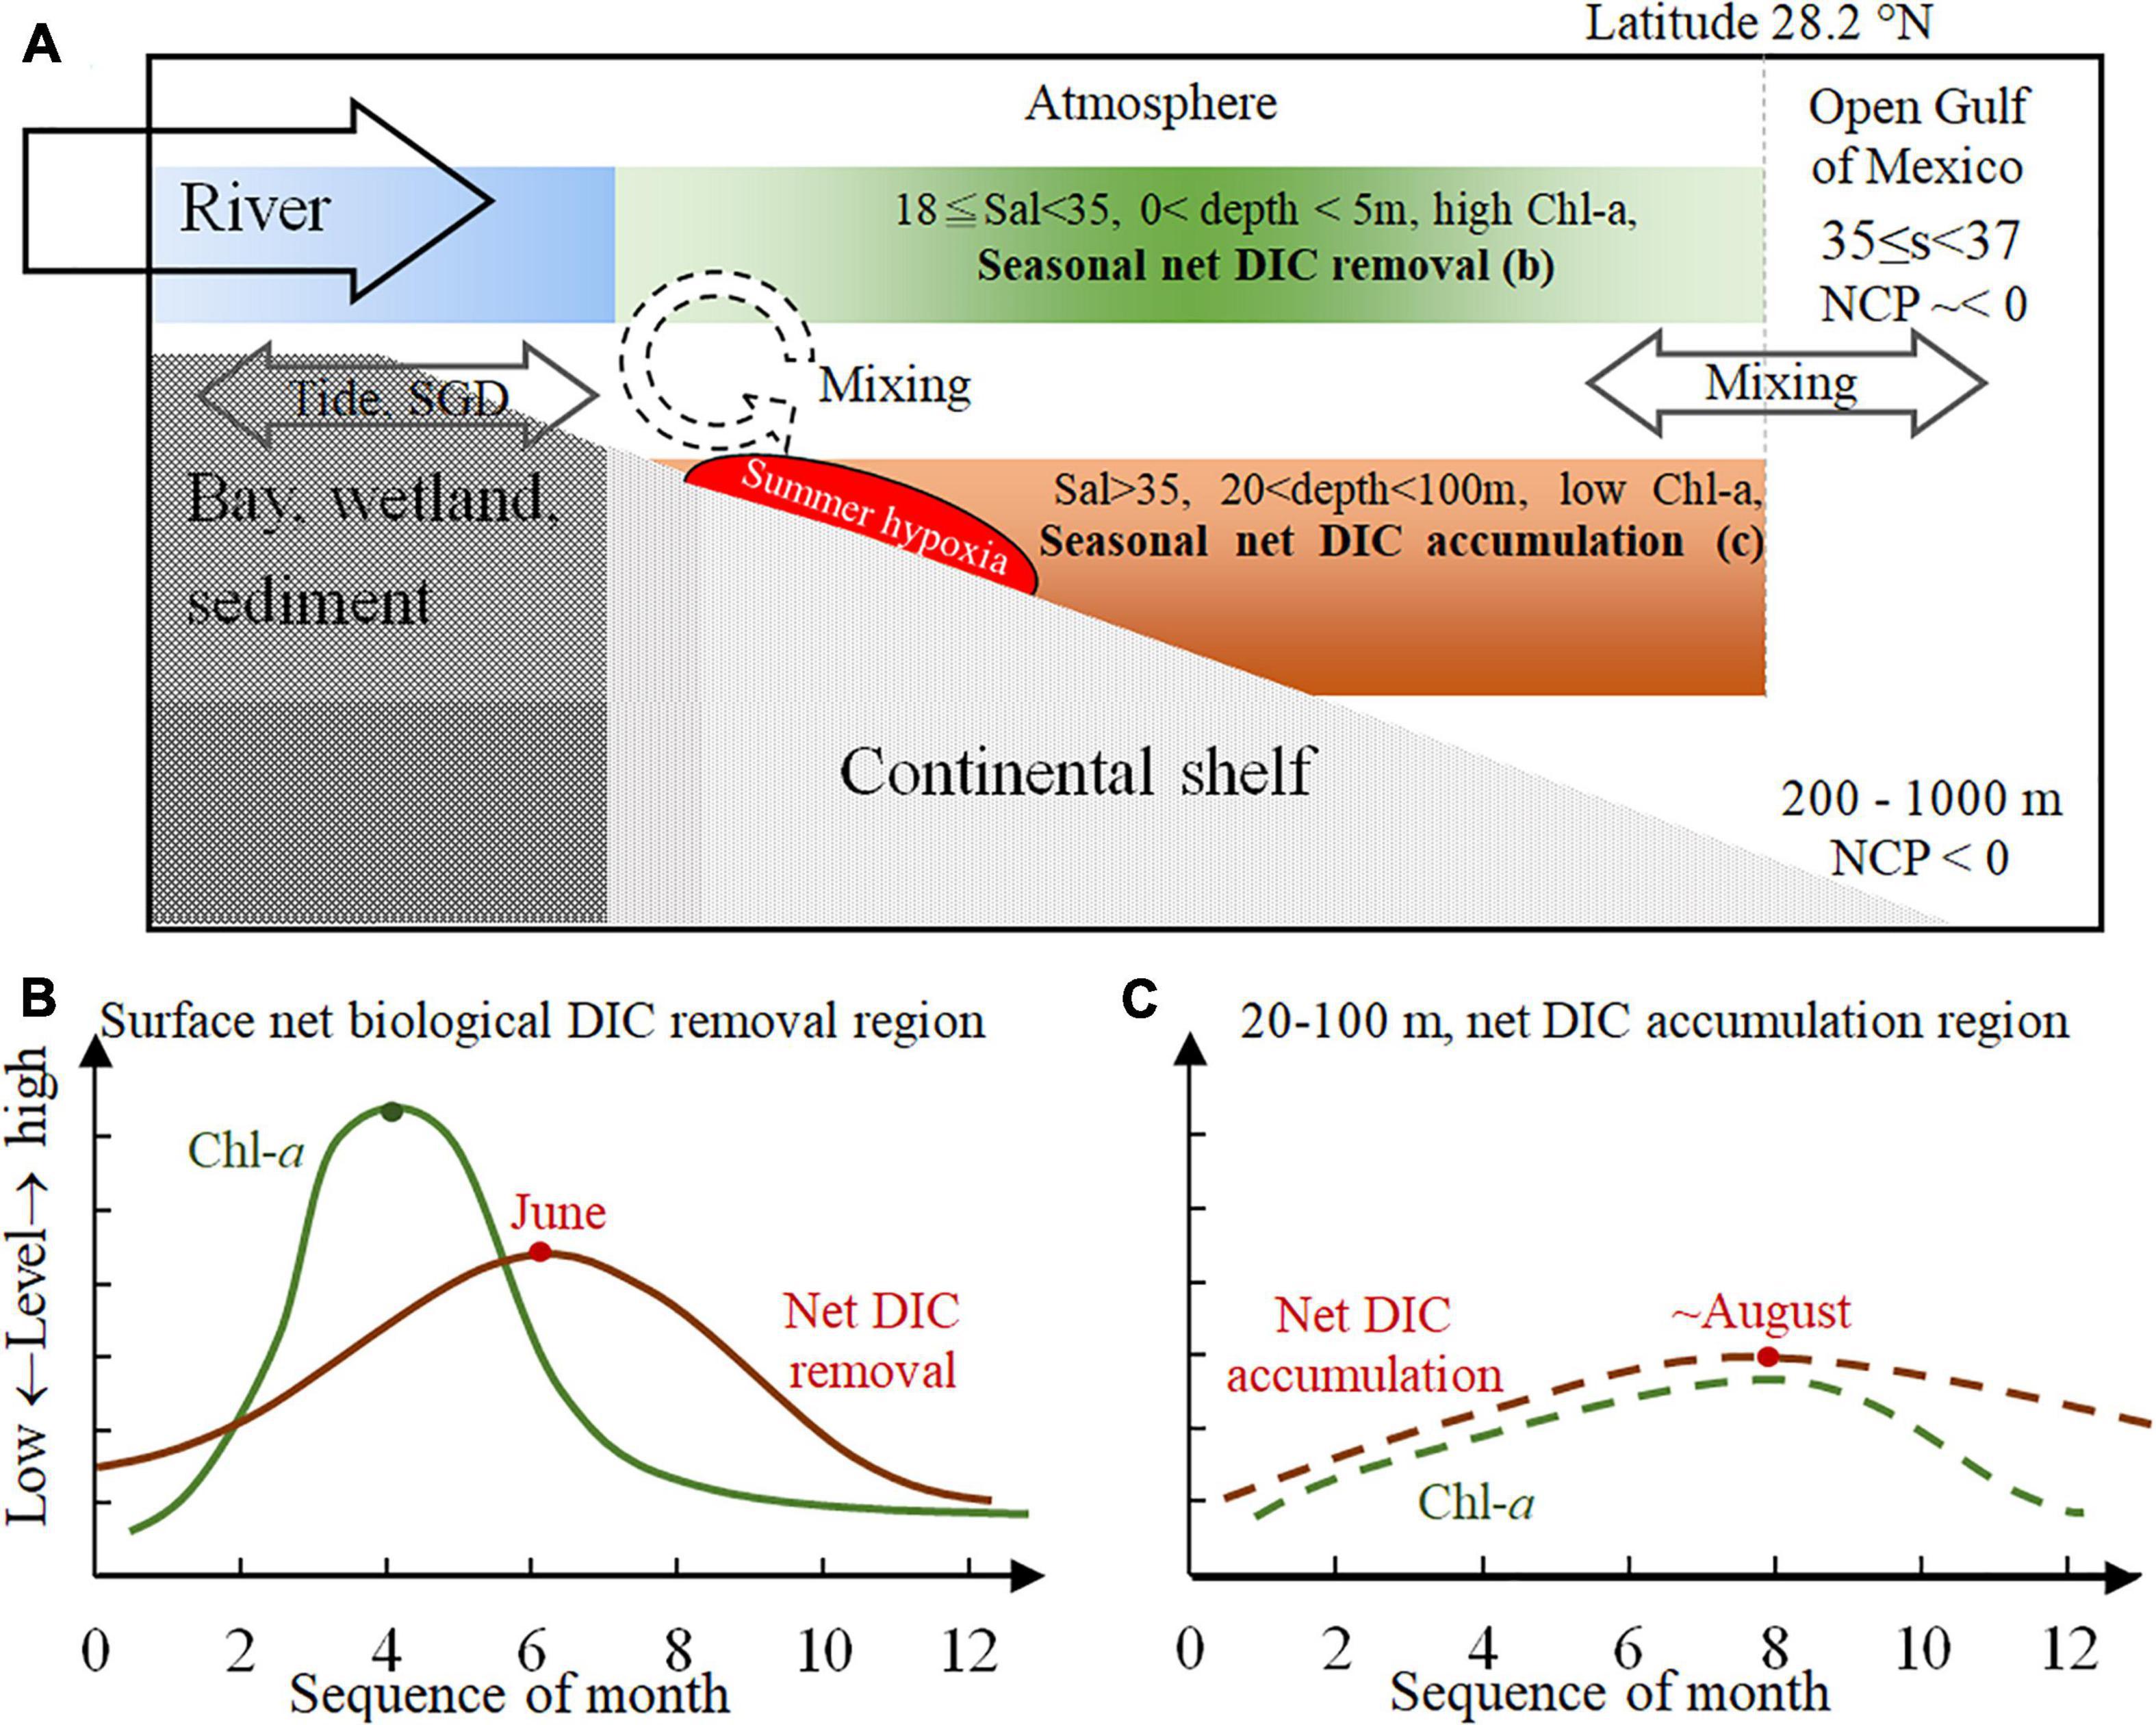
Figure 10. The seasonal conceptual model for the carbonate system on a large river-dominated continental shelf. Mixing dominated waters with low salinities (<18) in the river channel and tidal exchange can facilitate the water exchange (including subsurface groundwater) in the bay and wetland. The continental shelf is a high dynamics system where strong biological uptake and release occur simultaneously. This study is the first to propose quantified regions to distinguish the areas of net DIC removal and net DIC accumulation. The shallow water (<5 m) with salinity between 18 and 35 (A) displayed high Chl-a and seasonal net DIC removal (B), and the salty near-bottom, subsurface waters (salinity > 35, 20 < depth < 100 m) (A) showed low Chl-a and seasonal net DIC accumulation/release (C). The peak of net DIC accumulation was about 2 months after the peak of net DIC removal, displaying the seasonal relationship between these two biogeochemical hotspots along the water column on the continental shelf. DIC, dissolved inorganic carbon; Chl-a, chlorophyll a.
When we focused on the majority of this shelf, we successfully quantified two regions of this shelf with seasonal variations (Figure 10A). The near-surface waters (0–5 m, 18 ≤ salinity < 35, to the north of 28.2°N) displayed a peak of Chl-a and AOU in April and a peak of net DIC removal in June (Figure 10B). The 2-month delay between these two peaks implied a peak of heterotrophic activity, which should not be earlier than June. Furthermore, a Chl-a maximum was in August in the near-bottom, subsurface waters (20 m < depth < 100 m, S = 35, to the north of 28.2°N), but net DIC accumulation and the AOU peak were still observed around August in this region too (specified as section “Monthly Variations in ΔDIC, Apparent Oxygen Utility, and Chlorophyll a on Specified Regions on the Inner-to-Middle Shelf”) (Figure 10C). Finally, it is worth noting that the seasonal variation of AOU in the near-bottom, subsurface waters is about a 2- to 3-month delay to the near-surface one. Furthermore, the seasonal variation of ΔDIC in the near-bottom, subsurface waters is about a 2- to 2.5-month delay to the near-surface one. This difference in the delay time between AOU and ΔDIC is probably because the buffer capacity was lacking in DO and was strong in the carbonate system.
The fluctuating river end-members dominated the seasonal changes in river TA and DIC in the property-to-salinity relationship. The application of the three-end-member model on our dataset produced ΔDIC over nine cruises from 2006 to 2010. Non-linear variations in pH and ΩArag values were close to the conservative mixing curves during November and January (Figures 4C,D,G,H) and were close to the biological activity curves, particularly during May and June (Figures 4A,B,E,F).
We suggest that the relative proportion of each controlling factor on ΔDIC on a river-dominated continental shelf is mixing and NCP (>70%) ≫ effect of air–sea CO2 gas exchange on DIC (∼<10–20%) > CaCO3 precipitation and the variation of stoichiometry (<7%). As a result of these natural factors, we suggest a realistic, ecosystem-based relationship; that is, a nearly 100 μmol⋅kg–1 increase of net DIC removal can lead to a 1-unit increase of ΩArag for future studies. Furthermore, there is a 2-month delay in biogeochemical processes between net DIC removal in the near-surface water and net DIC accumulation in the near-bottom, subsurface waters. We argue that, for regions including eutrophic surface and hypoxic bottom waters, a similar seasonal delay in the carbonate system between these two waters may last on an annual basis and occur worldwide.
The original contributions presented in the study are included in the article/Supplementary Material, further inquiries can be directed to the corresponding author/s.
W-JH designed the study, conducted most field trips, analyzed most TA samples, wrote the manuscript, and organized all the data. W-JC supervised the fieldwork and experiments and edited the manuscript. XH participated in several cruises, analyzed some TA samples, and edited the manuscript. All authors contributed to the article and approved the submitted version.
The authors declare that the research was conducted in the absence of any commercial or financial relationships that could be construed as a potential conflict of interest.
The handling editor declared a past collaboration with one of the authors W-JC
Data presented in the manuscript were collected over several project periods when all authors were members of the Cai coastal ocean CO2 research group at the University of Georgia. Funded primarily by NSF grants OCE-1559279 and OCE-0752110 and NASA grant NNH13ZDA001N and NNX14AM37G for W-JC, MOST#104-2611-M-110-023-MY2 at Taiwan to W-JH, and GOMRI RFP II-020 for additional support to W-JC and XH.
This work was dedicated to Yongchen Wang, who provided critical efforts in experiments. We thank the captains and crews on R/V Cape Hatteras, RV Pelican, OSV Bold, and RV Hugh R. Sharp. We also thank Michael Murrel for inviting us to participate in the cruises in 2006 and 2007, Allan Shiller for the cruise in 2008, and Steven E. Lohrenz for leading the cruises in 2009 and 2010. Feizhou Chen, Chenhua Han, Liang Xue, and Baoshan Chen all helped with our fieldwork and sample analysis. We appreciate the help from Fei-Ling Yuan at the Department of Oceanography, National Sun Yat-sen University. Comments from two reviewers have improved this study.
The Supplementary Material for this article can be found online at: https://www.frontiersin.org/articles/10.3389/fmars.2021.621243/full#supplementary-material
Anderson, M. M., Maiti, K., Xue, Z. G., and Ou, Y. (2020). Dissolved inorganic carbon transport in the surface-mixed layer of the Louisiana Shelf in Northern Gulf of Mexico. J. Geophys. Res. Oceans 125:e2020JC016605. doi: 10.1029/2020JC016605
APHA (1989). Standard Methods for the Examination of Water and Wastewater, 17th Edn. Washington, DC: American Public Health Association.
Balch, W. M. (2018). The ecology, biogeochemistry, and optical properties of Coccolithophores. Ann. Rev. Mar. Sci. 10, 71–98. doi: 10.1146/annurev-marine-121916-063319
Bates, N. R., Hansell, D. A., Carlson, C. A., and Gordon, L. I. (1998). Distribution of CO2 species, estimates of net community production, and air-sea CO2 exchange in the Ross Sea polynya. J. Geophys. Res. 103, 2883–2896. doi: 10.1029/97jc02473
Bauer, J. E., Cai, W.-J., Raymond, P. A., Bianchi, T. S., Hopkinson, C. S., and Regnier, P. A. G. (2013). The changing carbon cycle of the coastal ocean. Nature 504, 61–70. doi: 10.1038/nature12857
Befus, K. M., Kroeger, K. D., Smith, C. G., and Swarzenski, P. W. (2017). The magnitude and origin of groundwater discharge to Eastern U.S. and Gulf of Mexico coastal waters. Geophys. Res. Lett. 44, 10396–10406. doi: 10.1002/2017GL075238
Berelson, W. M., McManus, J., Severmann, S., and Rollins, N. (2019). Benthic fluxes from hypoxia-influenced Gulf of Mexico sediments: impact on bottom water acidification. Mar. Chem. 209, 94–106. doi: 10.1016/j.marchem.2019.01.004
Bianchi, T. S., DiMarco, S. F., Cowan, J. H. Jr., Hetland, R. D., Chapman, P., Day, J. W., et al. (2010). The science of hypoxia in the Northern Gulf of Mexico: a review. Sci. Total Environ. 408, 1471–1484.
Borges, A. V., and Gypens, N. (2010). Carbonate chemistry in the coastal zone responds more strongly to eutrophication than to ocean acidification. Limnol. Oceanogr. 55, 346–353.
Breitburg, D., Levin, L. A., Oschlies, A., Grégoire, M., Chavez, F. P., Conley, D. J., et al. (2018). Declining oxygen in the global ocean and coastal waters. Science 359:6371. doi: 10.1126/science.aam7240
Brewer, P. G., and Goldman, J. C. (1976). Alkalinity changes generated by phytoplankton growth. Limnol. Oceanogr. 21, 108–117.
Bugna, G. C., Chanton, J. P., Cable, J. E., Burnett, W. C., and Cable, P. H. (1996). The importance of groundwater discharge to the methane budgets of nearshore and continental shelf waters of the northeastern Gulf of Mexico. Geochim. Cosmochim. Acta 60, 4735–4746. doi: 10.1016/S0016-7037(96)00290-6
Cai, W.-J., Hu, X., Huang, W.-J., Murrell, M. C., Lehrter, J. C., Lohrenz, S. E., et al. (2011). Acidification of subsurface coastal waters enhanced by eutrophication. Nat. Geosci. 4, 766–770. doi: 10.1038/ngeo1297
Cai, W.-J., and Wang, Y. (1998). The chemistry, fluxes, and sources of carbon dioxide in the estuarine waters of the Satilla and Altamaha Rivers. Georgia. Limnol. Oceanogr. 43, 657–668.
Cai, Y., You, C. F., Wu, S. F., Cai, W. J., and Guo, L. (2020). Seasonal variations in strontium and carbon isotope systematics in the Lower Mississippi River: implications for chemical weathering. Chem. Geol. 553:119810. doi: 10.1016/j.chemgeo.2020.119810
Chakraborty, S., and Lohrenz, S. E. (2015). Phytoplankton community structure in the river-influenced continental margin of the northern Gulf of Mexico. Mar. Ecol. Prog. Ser. 521, 31–47.
Chen, C.-T. A., Lui, H.-K., Hsieh, C.-H., Yanagi, T., Kosugi, N., Ishii, M., et al. (2017). Deep oceans may acidify faster than anticipated due to global warming. Nat. Clim. Chang. 7, 890–894. doi: 10.1038/s41558-017-0003-y
Chen, C.-T. A., Wang, S.-L., and Bychkov, A. S. (1995). Carbonate chemistry of the Sea of Japan. J. Geophys. Res. 100, 13737–13745. doi: 10.1029/95JC00939
Coleman, D. J., Kolker, A. S., and Johannesson, K. H. (2017). Submarine groundwater discharge and alkaline earth element dynamics in a deltaic coastal setting. Hydrol. Res. 48, 1169–1176. doi: 10.2166/nh.2016.285
Efron, B. (1992). “Bootstrap methods: another look at the jackknife,” in Breakthroughs in Statistics: Methodology and Distribution, eds S. Kotz and N. L. Johnson (New York, NY: Springer), 569–593. doi: 10.1007/978-1-4612-4380-9_41
Feng, Y., Fennel, K., Jackson, G. A., DiMarco, S. F., and Hetland, R. D. (2014). A model study of the response of hypoxia to upwelling-favorable wind on the northern Gulf of Mexico shelf. J. Mar. Syst. 131, 63–73. doi: 10.1016/j.jmarsys.2013.11.009
Fichot, C. G., Lohrenz, S. E., and Benner, R. (2014). Pulsed, cross-shelf export of terrigenous dissolved organic carbon to the Gulf of Mexico. J. Geophys. Res. Oceans 119, 1176–1194. doi: 10.1002/2013JC009424
Fry, B., Justić, D., Riekenberg, P., Swenson, E. M., Turner, R. E., Wang, L., et al. (2015). Carbon dynamics on the Louisiana Continental Shelf and cross-shelf feeding of hypoxia. Estuar. Coast. 38, 703–721. doi: 10.1007/s12237-014-9863-9
Gattuso, J.-P., Epitalon, J.-M., Lavigne, H., Orr, J., Gentili, B., Hofmann, A., et al. (2016). seacarb: Seawater Carbonate Chemistry R Package Version 3.0.
Geider, R. J., and LaRoche, J. (2002). Redfield revisited: variability of C:N:P in marine microalgae and its biochemical basis. Eur. J. Phycol. 37, 1–17. doi: 10.1017/s0967026201003456
Goolsby, D. A., Battaglin, W. A., Aulenbach, B. T., and Hooper, R. P. (2000). Nitrogen flux and sources in the Mississippi River Basin. Sci. Total Environ. 248, 75–86.
Green, R. E., Bianchi, T. S., Dagg, M. J., Walker, N. D., and Breed, G. A. (2006). An organic carbon budget for the Mississippi River turbidity plume and plume contributions to air-sea CO2 fluxes and bottom water hypoxia. Estuar. Coast. 29, 579–597. doi: 10.1007/BF02784284
Guo, X., Cai, W.-J., Huang, W.-J., Wang, Y., Chen, F., Murrell, M. C., et al. (2012). Carbon dynamics and community production in the Mississippi River plume. Limnol. Oceanogr. 57, 1–17. doi: 10.4319/lo.2012.57.1.0001
Hernández-Ayon, J. M., Zirino, A., Dickson, A. G., Camiro-Vargas, T., and Valenzuela, E. (2007). Estimating the contribution of organic bases from microalgae to the titration alkalinity in coastal seawaters. Limnol. Oceanogr. Meth. 5, 225–232. doi: 10.4319/lom.2007.5.225
Hu, X., and Cai, W. J. (2013). Estuarine acidification and minimum buffer zone - a conceptual study. Geophys. Res. Lett. 40, 5176–5181. doi: 10.1002/grl.51000
Hu, X., Li, Q., Huang, W. J., Chen, B., Cai, W. J., Rabalais, N. N., et al. (2017). Effects of eutrophication and benthic respiration on water column carbonate chemistry in a traditional hypoxic zone in the Northern Gulf of Mexico. Mar. Chem. 194, 33–42. doi: 10.1016/j.marchem.2017.04.004
Huang, W.-J., Cai, W.-J., Castelao, R. M., Wang, Y., and Lohrenz, S. E. (2013). Effects of a wind-driven cross-shelf large river plume on biological production and CO2 uptake on the Gulf of Mexico during spring. Limnol. Oceanogr. 58, 1727–1735. doi: 10.4319/lo.2013.58.5.1727
Huang, W.-J., Cai, W.-J., Powell, R. T., Lohrenz, S. E., Wang, Y., Jiang, L.-Q., et al. (2012a). The stoichiometry of inorganic carbon and nutrient removal in the Mississippi River plume and adjacent continental shelf. Biogeosciences 9, 2781–2792. doi: 10.5194/bg-9-2781-2012
Huang, W.-J., Kao, K.-J., Lin, Y.-S., Chen, C.-T., and Liu, J. T. (2020). Daily to weekly impacts of mixing and biological activity on carbonate dynamics in a large river-dominated shelf. Estuar. Coast. Shelf Sci. 245:106914. doi: 10.1016/j.ecss.2020.106914
Huang, W.-J., Wang, Y., and Cai, W.-J. (2012b). Assessment of sample storage techniques for total alkalinity and dissolved inorganic carbon in seawater. Limnol. Oceanogr. Meth. 10, 711–717. doi: 10.4319/lom.2012.10.711
Huang, W.-J., Cai, W.-J., Wang, Y., Hu, X., Chen, B., Lohrenz, S. E., et al. (2015a). The response of inorganic carbon distributions and dynamics to upwelling-favorable winds on the northern Gulf of Mexico during summer. Cont. Shelf Res. 111, 211–222. doi: 10.1016/j.csr.2015.08.020
Huang, W.-J., Cai, W.-J., Wang, Y., Lohrenz, S. E., and Murrell, M. C. (2015b). The carbon dioxide system on the Mississippi River-dominated continental shelf in the northern Gulf of Mexico: 1. Distribution and air-sea CO2 flux. J. Geophys. Res. Oceans 120, 1429–1445. doi: 10.1002/2014JC010498
Huang, W.-J., Kao, K.-J., Liu, L.-L., Liao, C.-W., and Han, Y.-L. (2018). An assessment of direct dissolved inorganic carbon injection to the coastal region: a model result. Sustainability 10:1174. doi: 10.3390/su10041174
Jiang, Z., Cai, W., Chen, B., Wang, K., Han, C., Roberts, B. J., et al. (2019). Physical and biogeochemical controls on pH dynamics in the northern Gulf of Mexico during summer hypoxia. J. Geophys. Res. Oceans 124, 5979–5998. doi: 10.1029/2019jc015140
Laurent, A., Fennel, K., Ko, D. S., and Lehrter, J. (2018). Climate change projected to exacerbate impacts of coastal eutrophication in the Northern Gulf of Mexico. J. Geophys. Res. Oceans 123, 3408–3426. doi: 10.1002/2017JC013583
Legge, O., Johnson, M., Hicks, N., Jickells, T., Diesing, M., Aldridge, J., et al. (2020). Carbon on the Northwest European shelf: contemporary budget and future influences. Front. Mar. Sci. 7:143. doi: 10.3389/fmars.2020.00143
Lehrter, J. C., Ko, D. S., Murrell, M. C., Hagy, J. D., Schaeffer, B. A., Greene, R. M., et al. (2013). Nutrient distributions, transports, and budgets on the inner margin of a river-dominated continental shelf. J. Geophys. Res. Oceans 118, 4822–4838. doi: 10.1002/jgrc.20362
Lohrenz, S. E., Cai, W.-J., Chen, F., Chen, X., and Tuel, M. (2010). Seasonal variability in air-sea fluxes of CO2 in a river-influenced coastal margin. J. Geophys. Res. Oceans 115:C10034. doi: 10.1029/2009jc005608
Martiny, A. C., Pham, C. T. A., Primeau, F. W., Vrugt, J. A., Moore, J. K., Levin, S. A., et al. (2013). Strong latitudinal patterns in the elemental ratios of marine plankton and organic matter. Nat. Geosci. 6, 279–283. doi: 10.1038/ngeo1757
Matli, V. R. R., Fang, S., Guinness, J., Rabalais, N. N., Craig, J. K., and Obenour, D. R. (2018). Space-time geostatistical assessment of hypoxia in the Northern Gulf of Mexico. Environ. Sci. Technol. 52, 12484–12493. doi: 10.1021/acs.est.8b03474
McCoy, C. A., and Corbett, D. R. (2009). Review of submarine groundwater discharge (SGD) in coastal zones of the Southeast and Gulf Coast regions of the United States with management implications. J. Environ. Manage. 90, 644–651. doi: 10.1016/j.jenvman.2008.03.002
McCoy, C. A., Corbett, D. R., McKee, B. A., and Top, Z. (2007). An evaluation of submarine groundwater discharge along the continental shelf of Louisiana using a multiple tracer approach. J. Geophys. Res. Oceans 112, 1–13. doi: 10.1029/2006JC003505
Millero, F. J. (1995). Thermodynamics of the carbon dioxide system in the oceans. Geochim. Cosmochim. Acta 59, 661–677. doi: 10.1016/0016-7037(94)00354-O
Millero, F. J., Graham, T. B., Huang, F., Bustos-Serrano, H., and Pierrot, D. (2006). Dissociation constants of carbonic acid in seawater as a function of salinity and temperature. Mar. Chem. 100, 80–94. doi: 10.1016/j.marchem.2005.12.001
Milliman, J. D., and Meade, R. H. (1983). World-wide delivery of river sediment to the Oceans. J. Geol. 91, 1–21.
Mook, W. G., and Koene, B. K. S. (1975). Chemistry of dissolved inorganic carbon in estuarine and coastal brackish waters. Estuar. Coast. Mar. Sci. 3, 325–336. doi: 10.1016/0302-3524(75)90032-8
Mucci, A. (1983). The solubility of calcite and aragonite in seawater at various salinities, temperatures, and one atmosphere total pressure. Am. J. Sci. 283, 780–799. doi: 10.2475/ajs.283.7.780
Murrell, M. C., Stanley, R. S., Lehrter, J. C., and Hagy, J. D. III (2013). Plankton community respiration, net ecosystem metabolism, and oxygen dynamics on the Louisiana continental shelf: implications for hypoxia. Cont. Shelf Res. 52, 27–38. doi: 10.1016/j.csr.2012.10.010
Najjar, R. G., Herrmann, M., Alexander, R., Boyer, E. W., Burdige, D. J., Butman, D., et al. (2018). Carbon budget of tidal wetlands, estuaries, and shelf waters of Eastern North America. Global Biogeochem. Cy. 32, 389–416. doi: 10.1002/2017GB005790
Oschlies, A., Brandt, P., Stramma, L., and Schmidtko, S. (2018). Drivers and mechanisms of ocean deoxygenation. Nat. Geosci. 11, 467–473. doi: 10.1038/s41561-018-0152-2
Peng, T.-H., Takahashi, T., Broecker, W. S., and Olafsson, J. (1987). Seasonal variability of carbon dioxide, nutrient and oxygen in the northern North Atlantic surface water: observation and a modeliability of carbon dioxide, nutrient and oxygen in the northern North Atlantic surface water: observation and a model. Tellus 39B, 439–458.
Rabalais, N. N., Diaz, R. J., Levin, L. A., Turner, R. E., Gilbert, D., and Zhang, J. (2010). Dynamics and distribution of natural and human-caused hypoxia. Biogeosciences 7, 585–619. doi: 10.5194/bg-7-585-2010
Raymond, P. A., Oh, N.-H., Turner, R. E., and Broussard, W. (2008). Anthropogenically enhanced fluxes of water and carbon from the Mississippi River. Nature 451, 449–452.
Redfield, A. C. (1958). The biological control of chemical factors in the environment. Am. Sci. 46, 205–221.
Ren, L., Rabalais, N., Turner, R., Morrison, W., and Mendenhall, W. (2009). Nutrient limitation on phytoplankton growth in the upper Barataria Basin, Louisiana: microcosm bioassays. Estuar. Coast. 32, 958–974. doi: 10.1007/s12237-009-9174-8
Rivas, D., Badan, A., and Ochoa, J. (2005). The ventilation of the deep Gulf of Mexico. J. Phys. Oceanogr. 35, 1763–1781. doi: 10.1175/JPO2786.1
Suykens, K., Delille, B., Chou, L., DeBodt, C., Harlay, J., and Borges, A. V. (2010). Dissolved inorganic carbon dynamics and air-sea carbon dioxide fluxes during coccolithophore blooms in the northwest European continental margin (northern Bay of Biscay). Global Biogeochem. Cy. 24, 1–14. doi: 10.1029/2009GB003730
Thorhaug, A., Poulos, H. M., López-Portillo, J., Ku, T. C. W., and Berlyn, G. P. (2017). Seagrass blue carbon dynamics in the Gulf of Mexico: stocks, losses from anthropogenic disturbance, and gains through seagrass restoration. Sci. Total Environ. 605–606, 626–636. doi: 10.1016/j.scitotenv.2017.06.189
Thorhaug, A., Poulos, H. M., López-Portillo, J., Barr, J., Lara-Domínguez, A. L., Ku, T. C., et al. (2019). Gulf of Mexico estuarine blue carbon stock, extent and flux: mangroves, marshes, and seagrasses: a North American hotspot. Sci. Total Environ. 653, 1253–1261. doi: 10.1016/j.scitotenv.2018.10.011
Turner, R., and Rabalais, N. (2013). Nitrogen and phosphorus phytoplankton growth limitation in the northern Gulf of Mexico. Aquat. Microb. Ecol. 68, 159–169. doi: 10.3354/ame01607
Turner, R. E., Qureshi, N., Rabalais, N. N., Dortch, Q., Justic, D., Shaw, R. F., et al. (1998). Fluctuating silicate:nitrate ratios and coastal plankton food webs. Proc. Natl. Acad. Sci. U.S.A. 95, 13048–13051.
Turner, R. E., Rabalais, N. N., and Justi, D. (2017). Trends in summer bottom-water temperatures on the northern Gulf of Mexico continental shelf from 1985 to 2015. PLoS One 12:e0184350. doi: 10.1371/journal.pone.0184350
Tyrrell, T., and Young, J. R. (2009). “Coccolithophores,” in Encyclopedia of Ocean Sciences, ed. J. H. Steele (Amsterdam: Elsevier), 606–614. doi: 10.1016/B978-012374473-9.00662-7
Wang, Z. A., Lawson, G. L., Pilskaln, C. H., and Maas, A. E. (2017). Seasonal controls of aragonite saturation states in the Gulf ofMaine. J. Geophys. Res. Oceans 122, 372–389. doi: 10.1002/2016JC011778
Wanninkhof, R., Barbero, L., Byrne, R., Cai, W.-J., Huang, W.-J., Zhang, J.-Z., et al. (2015). Ocean acidification along the Gulf Coast and East Coast of the USA. Cont. Shelf Res. 98, 54–71.
Wolf-Gladrow, D. A., Zeebe, R. E., Klaas, C., Körtzinger, A., and Dickson, A. G. (2007). Total alkalinity: the explicit conservative expression and its application to biogeochemical processes. Mar. Chem. 106, 287–300.
Xiong, T., Liu, P., Zhai, W., Bai, Y., Liu, D., Qi, D., et al. (2019). Export flux, biogeochemical effects, and the fate of a terrestrial carbonate system: from Changjiang (Yangtze River) estuary to the East China Sea. Earth Space Sci. 6, 2115–2141. doi: 10.1029/2019EA000679
Xue, J., Cai, W. J., Hu, X., Huang, W. J., Lohrenz, S. E., and Gundersen, K. (2015). Temporal variation and stoichiometric ratios of organic matter remineralization in bottom waters of the northern Gulf of Mexico during late spring and summer. J. Geophys. Res. Oceans 120, 8304–8326. doi: 10.1002/2015JC011453
Xue, L., and Cai, W. J. (2020). Total alkalinity minus dissolved inorganic carbon as a proxy for deciphering ocean acidification mechanisms. Mar. Chem. 222:103791. doi: 10.1016/j.marchem.2020.103791
Xue, L., Cai, W.-J., Sutton, A. J., and Sabine, C. (2017). Sea surface aragonite saturation state variations and control mechanisms at the Gray’s Reef time-series site off Georgia, USA (2006-2007). Mar. Chem. 195, 27–40. doi: 10.1016/j.marchem.2017.05.009
Xue, Z., He, R., Fennel, K., Cai, W. J., Lohrenz, S., and Hopkinson, C. (2013). Modeling ocean circulation and biogeochemical variability in the Gulf of Mexico. Biogeosciences 10, 7219–7234. doi: 10.5194/bg-10-7219-2013
Xue, Z., He, R., Fennel, K., Cai, W.-J., Lohrenz, S., Huang, W.-J., et al. (2016). Modeling pCO2 variability in the Gulf of Mexico. Biogeosciences 13, 4359–4377. doi: 10.5194/bg-13-4359-2016
Yang, B., Byrne, R. H., and Lindemuth, M. (2015). Contributions of organic alkalinity to total alkalinity in coastal waters: a spectrophotometric approach. Mar. Chem. 176, 199–207. doi: 10.1016/j.marchem.2015.09.008
Zeebe, R. E., and Wolf-Gladrow, D. A. (2001). CO2 in Seawater: Equilibrium, Kinetics, Isotopes. Elsevier Oceanography Book Series 65, Amsterdam: Elsevier, 346.
Zhang, X., Hetland, R. D., Marta-Almeida, M., and DiMarco, S. F. (2012). A numerical investigation of the Mississippi and Atchafalaya freshwater transport, filling and flushing times on the Texas-Louisiana Shelf. J. Geophys. Res. Oceans 117:C11009. doi: 10.1029/2012jc008108
Keywords: carbon cycle, dissolved inorganic carbon, carbonate saturation state, river plume, Mississippi River
Citation: Huang W-J, Cai W-J and Hu X (2021) Seasonal Mixing and Biological Controls of the Carbonate System in a River-Dominated Continental Shelf Subject to Eutrophication and Hypoxia in the Northern Gulf of Mexico. Front. Mar. Sci. 8:621243. doi: 10.3389/fmars.2021.621243
Received: 25 October 2020; Accepted: 16 February 2021;
Published: 26 March 2021.
Edited by:
Arnaud Laurent, Dalhousie University, CanadaReviewed by:
Wei-Dong Zhai, Shandong University, ChinaCopyright © 2021 Huang, Cai and Hu. This is an open-access article distributed under the terms of the Creative Commons Attribution License (CC BY). The use, distribution or reproduction in other forums is permitted, provided the original author(s) and the copyright owner(s) are credited and that the original publication in this journal is cited, in accordance with accepted academic practice. No use, distribution or reproduction is permitted which does not comply with these terms.
*Correspondence: Wei-Jen Huang, d2podWFuZzI5QG1haWwubnN5c3UuZWR1LnR3
Disclaimer: All claims expressed in this article are solely those of the authors and do not necessarily represent those of their affiliated organizations, or those of the publisher, the editors and the reviewers. Any product that may be evaluated in this article or claim that may be made by its manufacturer is not guaranteed or endorsed by the publisher.
Research integrity at Frontiers
Learn more about the work of our research integrity team to safeguard the quality of each article we publish.