 Do-Seong Byun
 Jin-Yong Jeong2
 Duk-jin Kim
 Sungmin Hong
 Kitack Lee
95% of researchers rate our articles as excellent or good
Learn more about the work of our research integrity team to safeguard the quality of each article we publish.
Find out more
REVIEW article
Front. Mar. Sci. , 05 July 2021
Sec. Ocean Observation
Volume 8 - 2021 | https://doi.org/10.3389/fmars.2021.618500
This article is part of the Research Topic Best Practices in Ocean Observing View all 85 articles
For open ocean environments, it is rare to find continuous, simultaneous air and sea observation records due to the challenges of instrument installation and maintenance. The Ieodo Ocean Research Station (Ieodo ORS), a remote ocean site located in the northern East China Sea with its harsh oceanic and atmospheric environment, provides a platform for the concurrent monitoring of air and sea environments. Since 2014, the Korea Hydrographic and Oceanographic Agency has run the “Ieodo ORS field trip program,” via which researchers are able to stay at the station for a week or more. This work reports technical lessons learned over 5 years from five Ieodo ORS research projects launched in 2016. Over the course of these projects, Ieodo ORS has monitored sea surface temperature, temperature and salinity in the water column, seawater pH, air pollutants, and solar radiation. The purpose of this paper is to facilitate the success of future research activities in similar environments by sharing our experiences and “best practices.”
Ieodo Ocean Research Station (Ieodo ORS) opened in June 2003, and was built to help advance the understanding of the dynamics of the ECS, including its influence on Korea’s marine, terrestrial, and atmospheric environments, via the continuous and simultaneous multidisciplinary observation of local air and sea environments (Ha et al., 2019). The East China Sea (ECS), including discharges from the Changjiang or Yangtze River (the world’s fifth largest river by discharge volume), affects the waters surrounding Korea such as the Korea Strait, Yellow Sea, and East Sea. This influence is primarily via the transport of heat, salt, and other materials by the Tsushima Warm Current (originating from the northward branch of the Kuroshio Current, Nitani, 1972; Lie and Cho, 1994) and/or by the Taiwan Warm Current (Beardsley et al., 1985; Fang et al., 1991; Kim et al., 2005). This sea also influences the weather and climate of the Korean Peninsula, via heat transport and other ECS air-sea interactions (Kim et al., 2019). Moreover, the majority of typhoons approach the Korean Peninsula during summer and early autumn via the ECS (Moon et al., 2010; Kim et al., 2014; Byun et al., 2018). In addition to these usual interactions, the properties of the ECS waters themselves are changing, with the input of anthropogenic nitrogen in the northern ECS rapidly increasing due to the growing nitrogen fertilizer and fossil fuel use in China (Kim et al., 2011).
Ieodo Ocean Research Station is located 149 km from Marado, at the southernmost tip of Jejudo (commonly referred to in scientific literature as Jeju Island or previously as Cheju Island), southwest of the Korean Peninsula. Its steel-jacket framed tower-type platform was built near the submarine rock named “Ieodo” by the Korea Institute of Ocean Science and Technology (KIOST) (Figure 1). Located in a harsh ocean and atmospheric environment (Figure 2), this research station was constructed with a 50-year design life on a sturdy rock base to standards able to withstand the strong winds (>50 m s–1 mean speed, with frequent extremes from passing typhoons), energetic waves (>23 m maximum and >5 m significant wave heights), and fast currents (2.34 m s–1) of the area. The Korea Hydrographic and Oceanographic Agency (KHOA) has operated this platform since January 1, 2007.
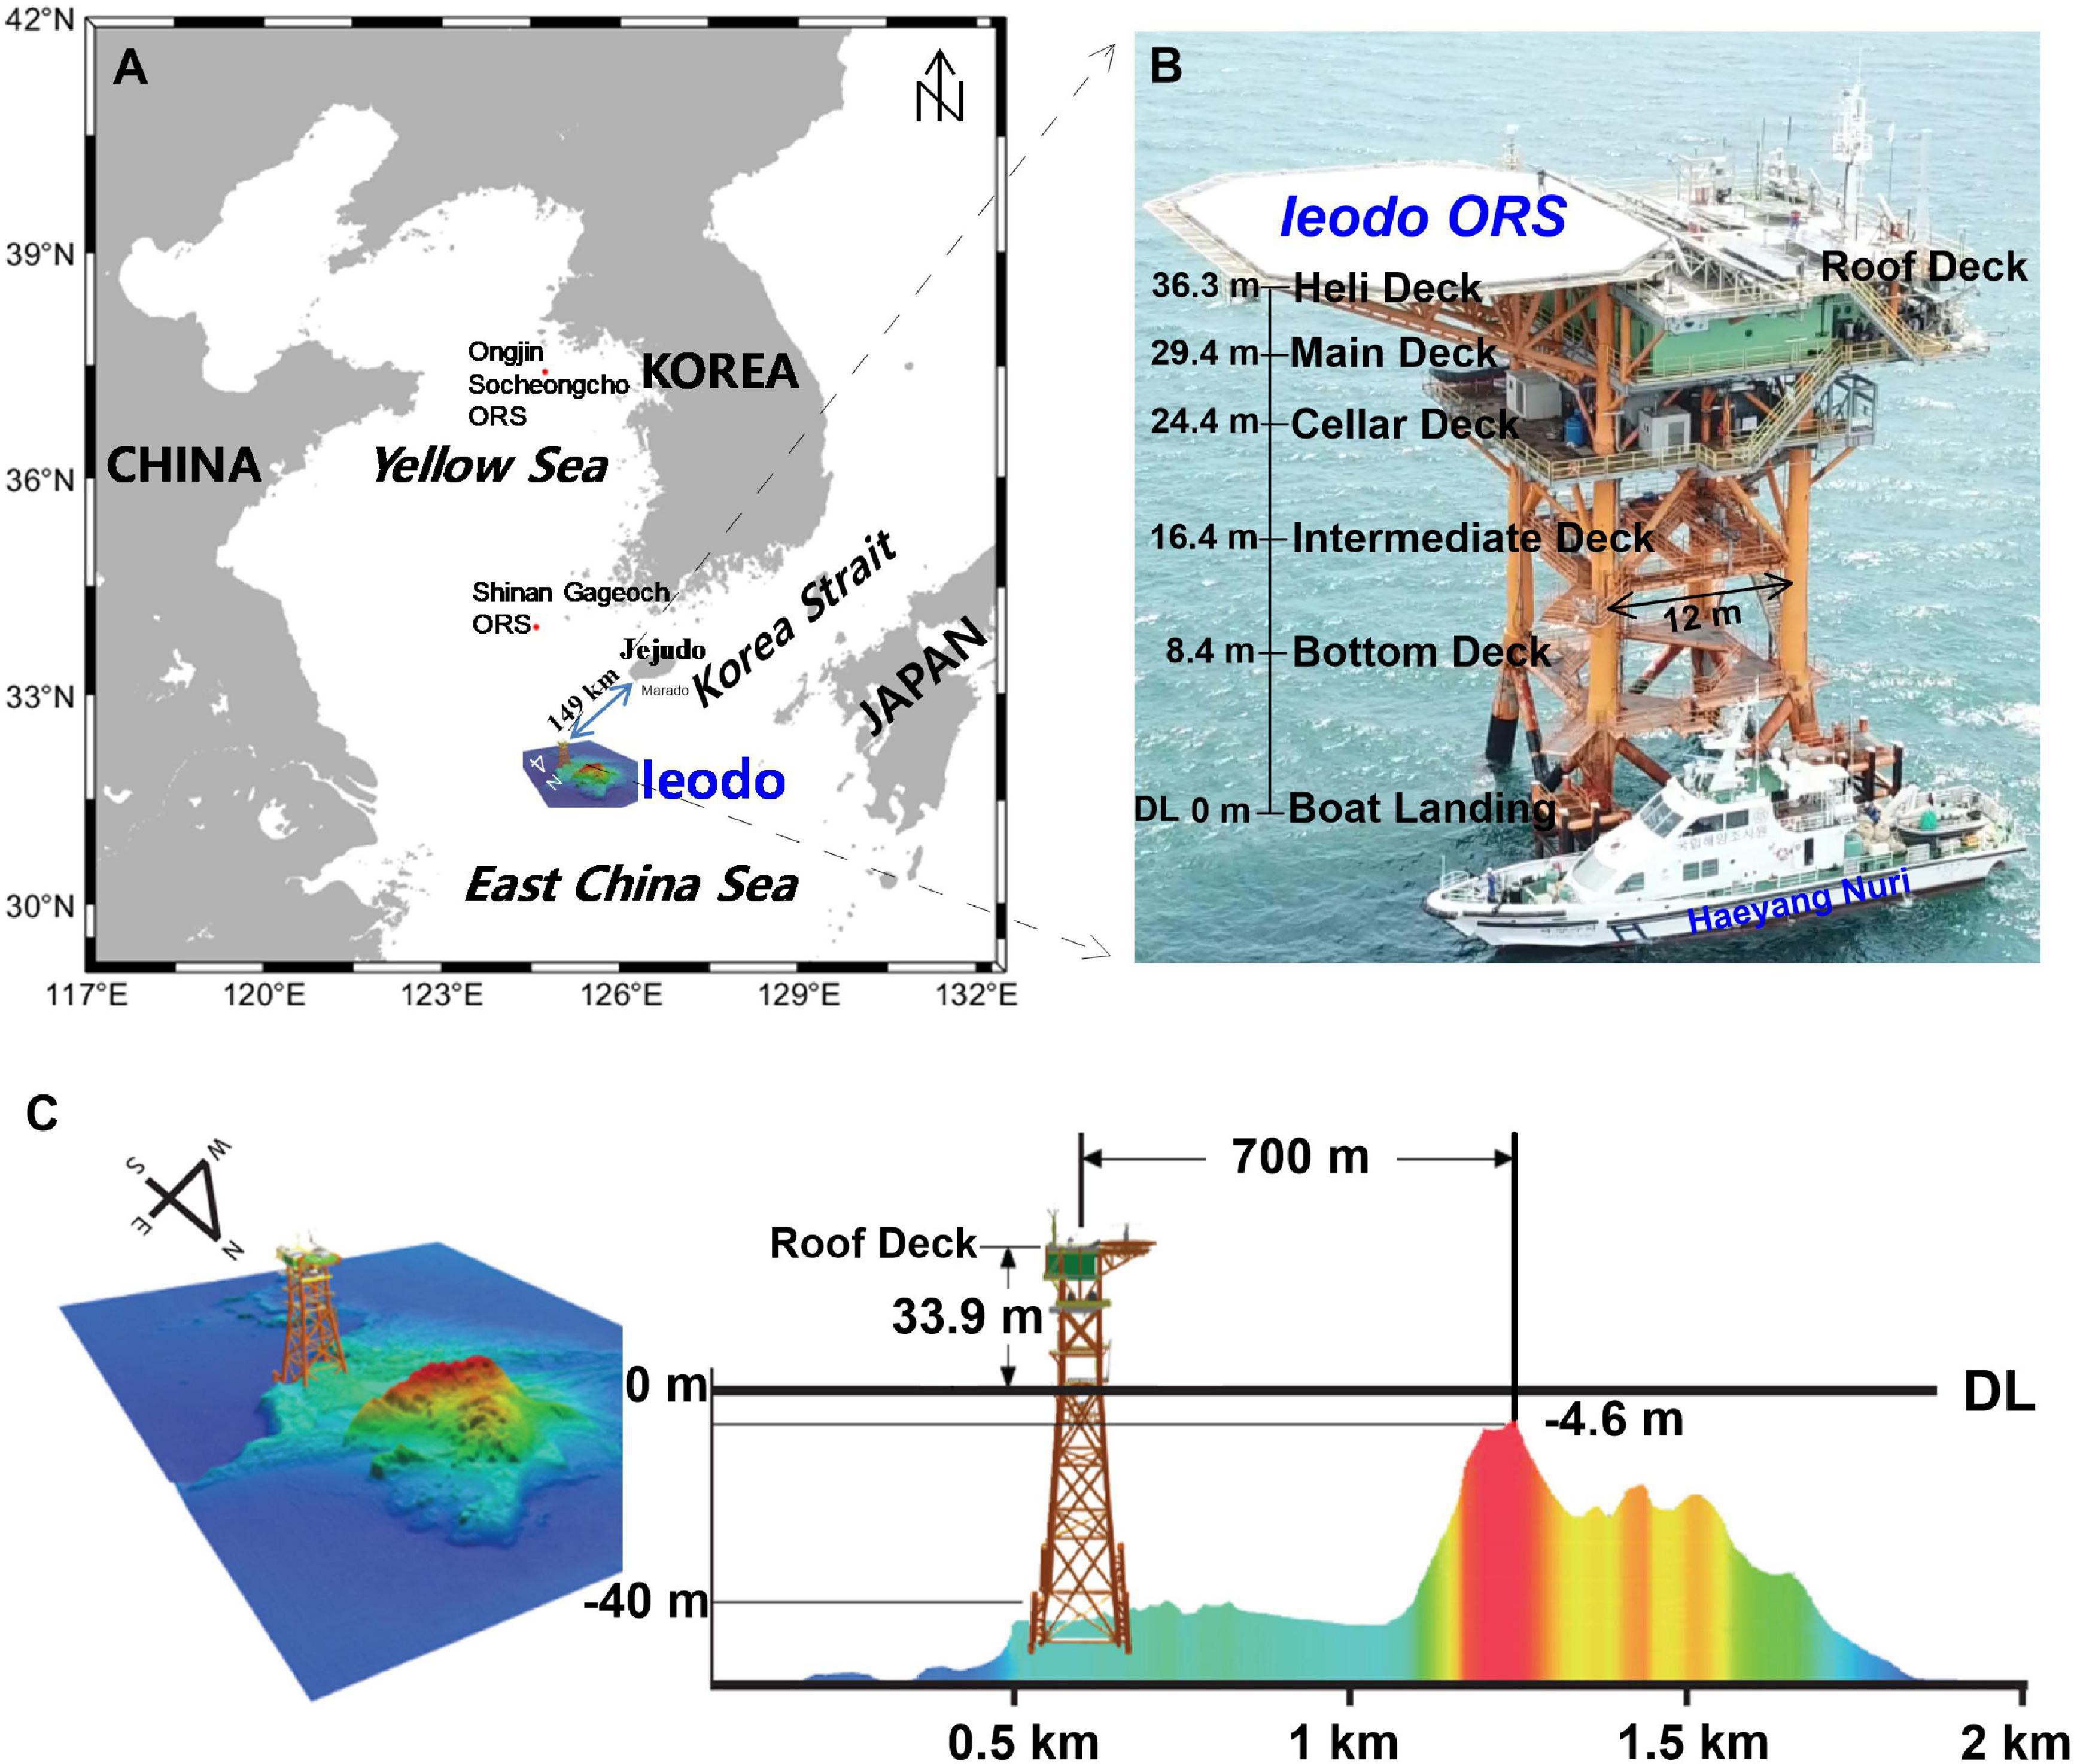
Figure 1. (A) Location map of Ieodo Ocean Research Station (Ieodo ORS); (B) bathymetry around Ieodo ORS; and (C) bathymetric cross section including Ieodo ORS and Ieodo (rock formation). DL stands for datum level, which is the Approximate Lowest Low Water (1.35 m below mean sea level).
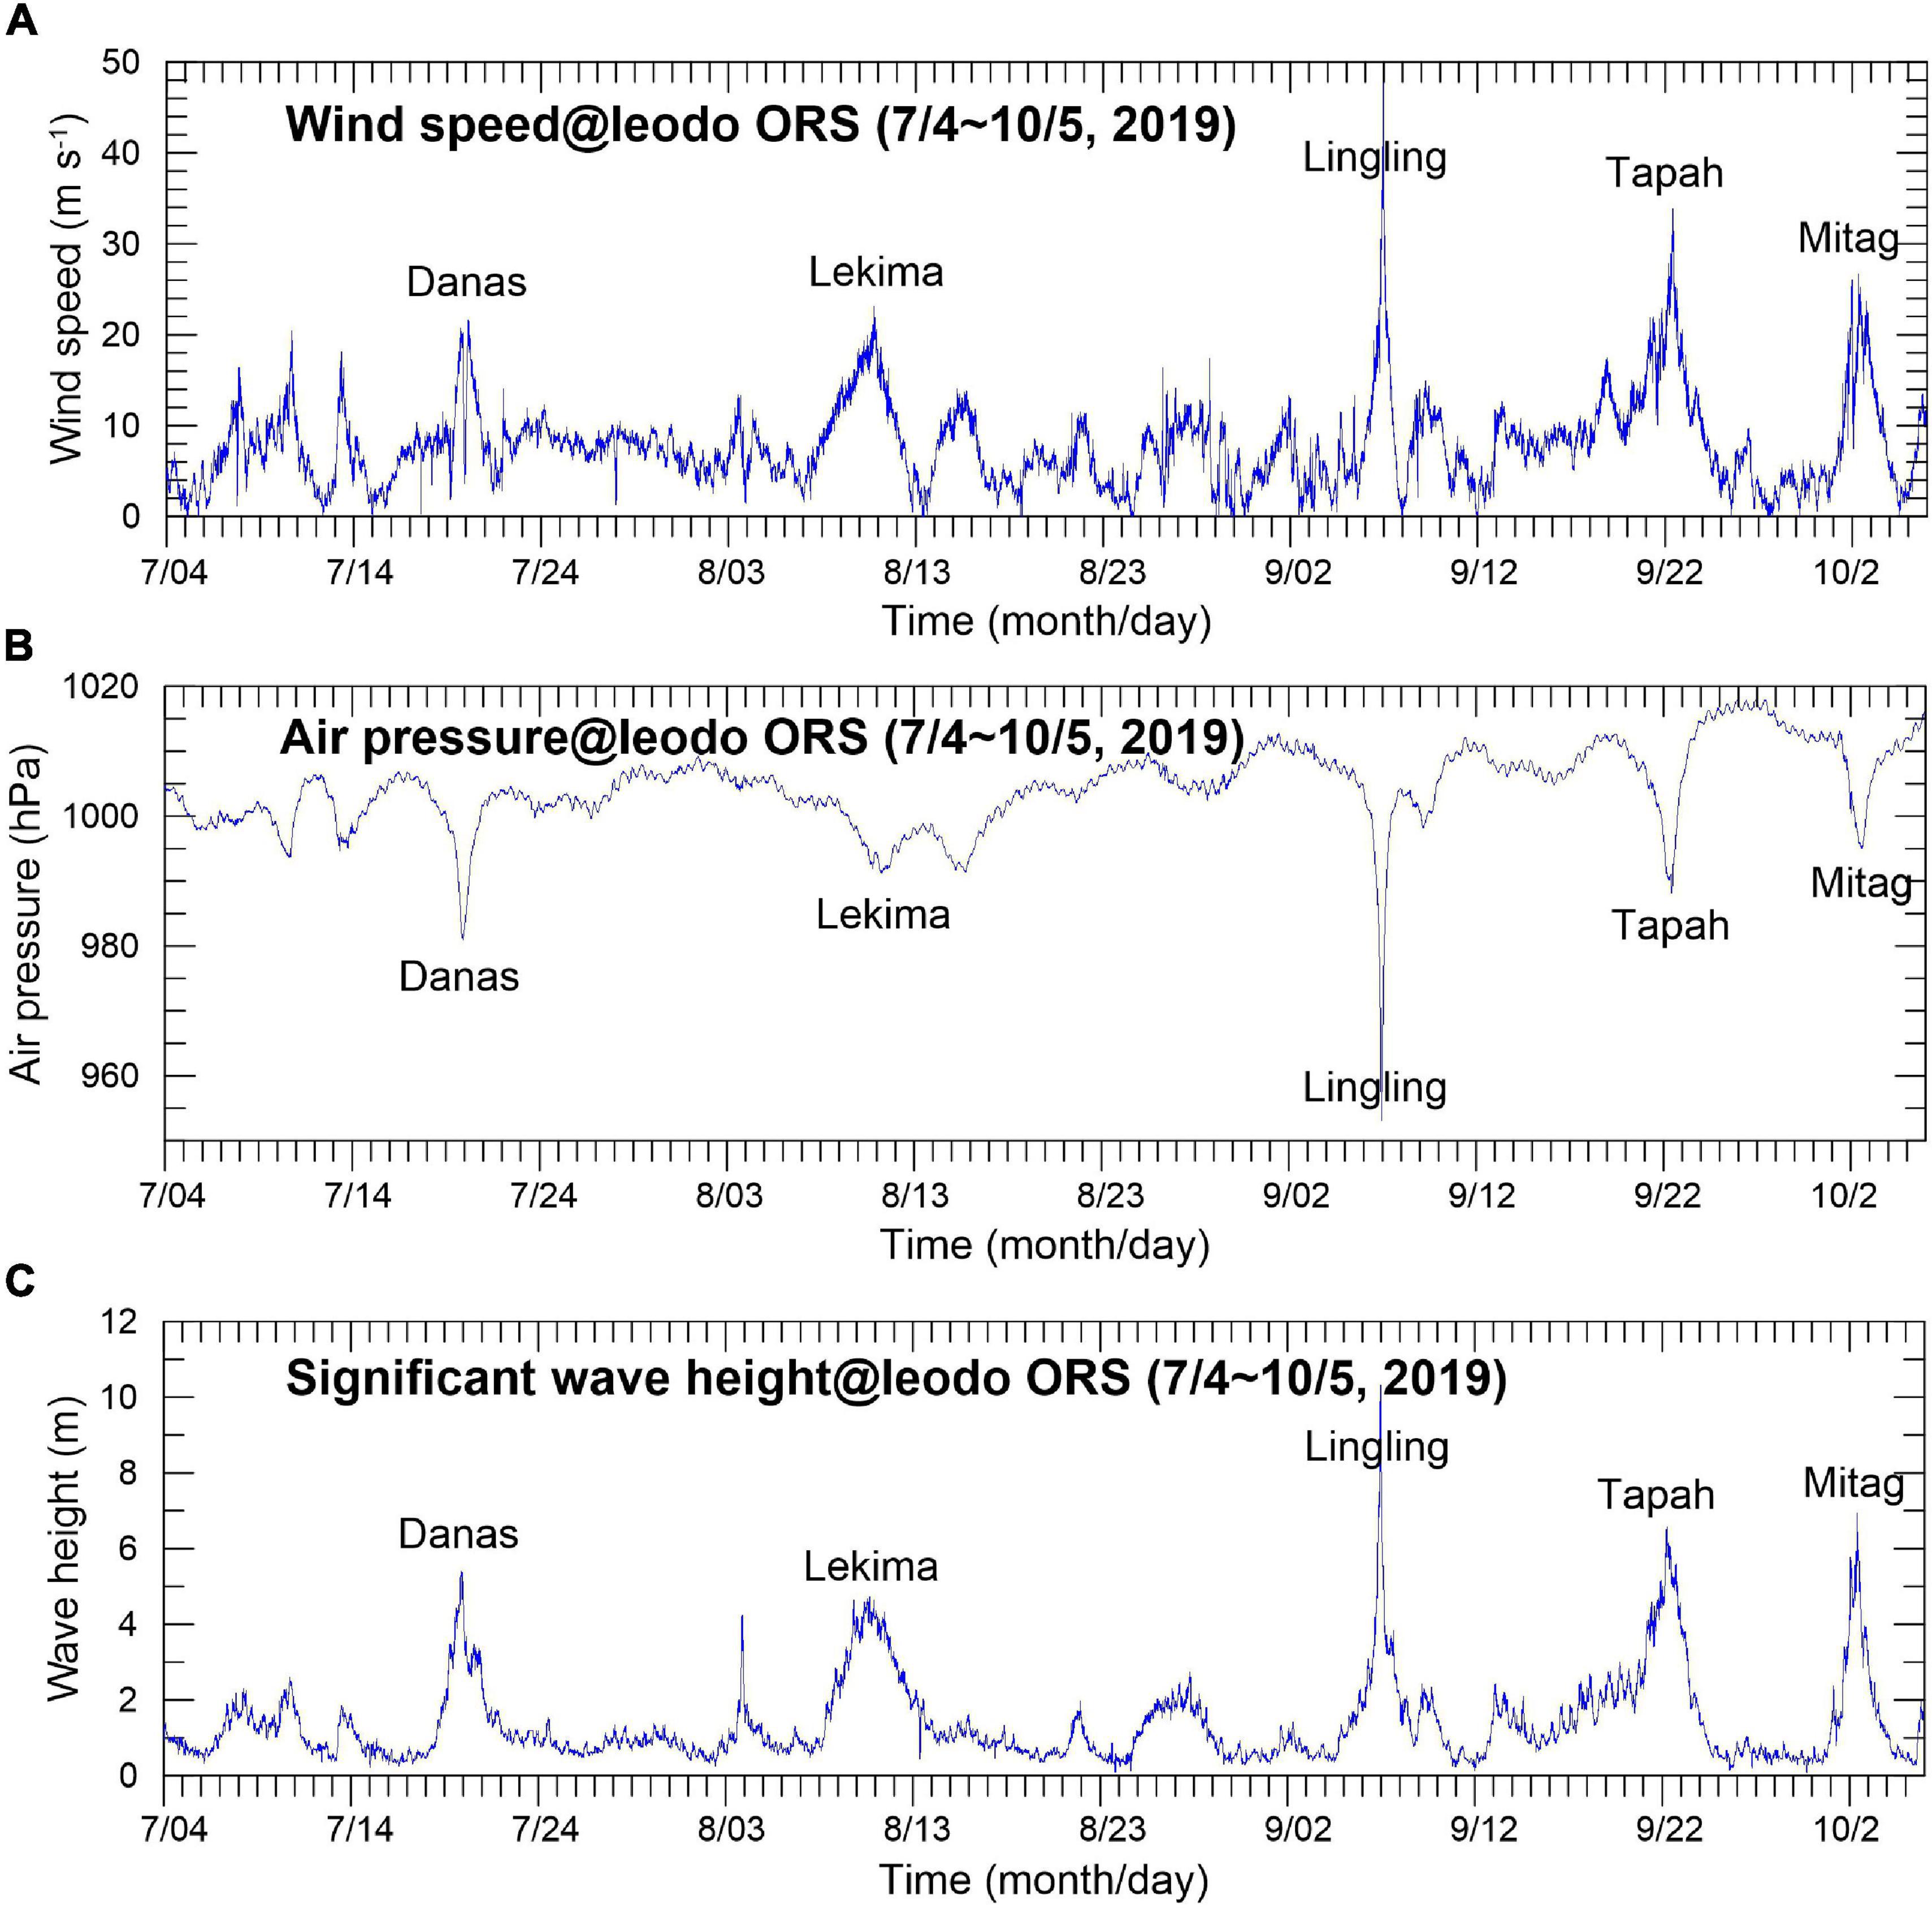
Figure 2. Time series of (A) wind speed (42.7 m above datum level); (B) air pressure (35.4 m above datum level); and (C) significant wave height, observed at Ieodo ORS from July 4 to October 5, 2019. In 2019, a maximum wind speed of 48 m s–1 and maximum significant wave height of 10.33 m were recorded during typhoon Lingling’s passing.
Ieodo Ocean Research Station stands 36.3 m in height above the datum level and consists of a boat landing plus six decks (Bottom Deck, Intermediate Deck, Cellar Deck, Main Deck, Roof Deck, and Heli Deck), as shown in Figure 1B. Most of its meteorological instruments and sensors are installed on the Roof Deck, including two anemometers, one barometer, two air temperature sensors, and two relative humidity sensors (Supplementary Figure 1). Residential facilities and the electrical control room are on the Main Deck, while a seawater desalination system and a diesel generator system are installed on the Cellar Deck.
Large residential capacity, remote offshore observation stations like Ieodo ORS that are able to simultaneously monitor both atmospheric and oceanic environments are very rare. Most marine observation towers are located relatively close to mainland or island environments and have small to no residential facilities. For example, the Acqua Alta Tower, standing 12.3 m above mean sea level, is located approximately 20 km from the city of Venice. Installed in 1970 by the Istituto Studio Dinamica Grandi Masse to assist with flood alerts and subsidence monitoring for the city, this facility can house up to five people for a few days at a time (Cavaleri, 2000). As another example of a shore proximal station, the non-residential Yangxing Air-Sea Flux Tower, operated since 2013, is located about 100 m offshore of Yongxing Island in the South China Sea, standing 20 m above mean sea level (Zhou et al., 2018). A third example, the non-residential Air-Sea Interaction Tower, was built in 2002 by the Woods Hole Oceanographic Institution 3 km south of Martha’s Vineyard, standing 23 m above mean sea level on the Massachusetts outer continental shelf (Kirinchich, 2020).
Ieodo Ocean Research Station is geographically well situated for obtaining valuable air-sea environment observation data and for monitoring atmospheric trace element pollution in the East Asia region (Lee et al., 2017a, 2019). To increase the accessibility of this platform while ensuring researcher safety, KHOA initiated the “Ieodo ORS fieldtrip program” in 2014. In addition, in 2016, KHOA launched several new, 5-year Ieodo ORS linked projects in conjunction with research teams from four universities. The funded projects are grouped into three categories:
(1) Understanding ocean and atmospheric environments in the ECS using monitoring and observing;
(2) Testing the performance of monitoring equipment in harsh conditions; and
(3) Applied research utilizing Ieodo ORS’ observation records.
Two monitoring based-projects have been conducted in the first category: (i) examining the role of the ECS as a climate change driven ocean carbon sink; and (ii) an assessment of air quality and sources of long-range transport air pollutants, using multiple stable isotopes (Lee et al., 2017a). Two projects have been conducted in the second category: (i) the establishment of a stable, thermal infrared, sea surface temperature remote observation system (Kang et al., 2017); and (ii) a project studying how to optimize a remote sea radiation observatory (Lee et al., 2017b). In addition to KHOA’s research efforts, and in conjunction with their Ieodo ORS field trip program, KIOST has conducted research evaluating the biofouling resistance of RBR and/or Aanderaa versus Seabird conductivity sensors. Two further projects have been conducted in the third category: (i) an investigation of spatio-temporal variability in multiple satellites’ measurements of oceanic variables in the seas surrounding Ieodo ORS (Choi et al., 2018; Woo et al., 2018); and (ii) research into the relationship between weather and climate variability over the Korean Peninsula and variability in sea surface temperature near Ieodo ORS (Kim et al., 2020).
Collectively, these studies represent a wealth of field experiences, including “trial and error” lessons, on how to successfully conduct research projects in the remote and harsh Ieodo ORS environment. The present study aims to organize this field experience information for the benefit of future projects at Ieodo and elsewhere. That is, this study contains our technical experiences and lessons learned through the Ieodo ORS field trip program and other Ieodo ORS studies. In section “Ieodo ORS Field Trip,” we introduce the KHOA-led Ieodo ORS fieldtrip program that currently facilitates research experiences. In section “Ocean Environment Monitoring,” we examine ocean environment monitoring issues that have arisen, and suggest solutions for measuring sea surface temperature, temperature and salinity in the water column, and ocean acidification (Figures 3A–C). In section “Atmospheric Environment Monitoring,” we examine atmospheric environment monitoring issues, and suggest solutions for measuring solar radiation and air pollutants (Figures 3D,E).
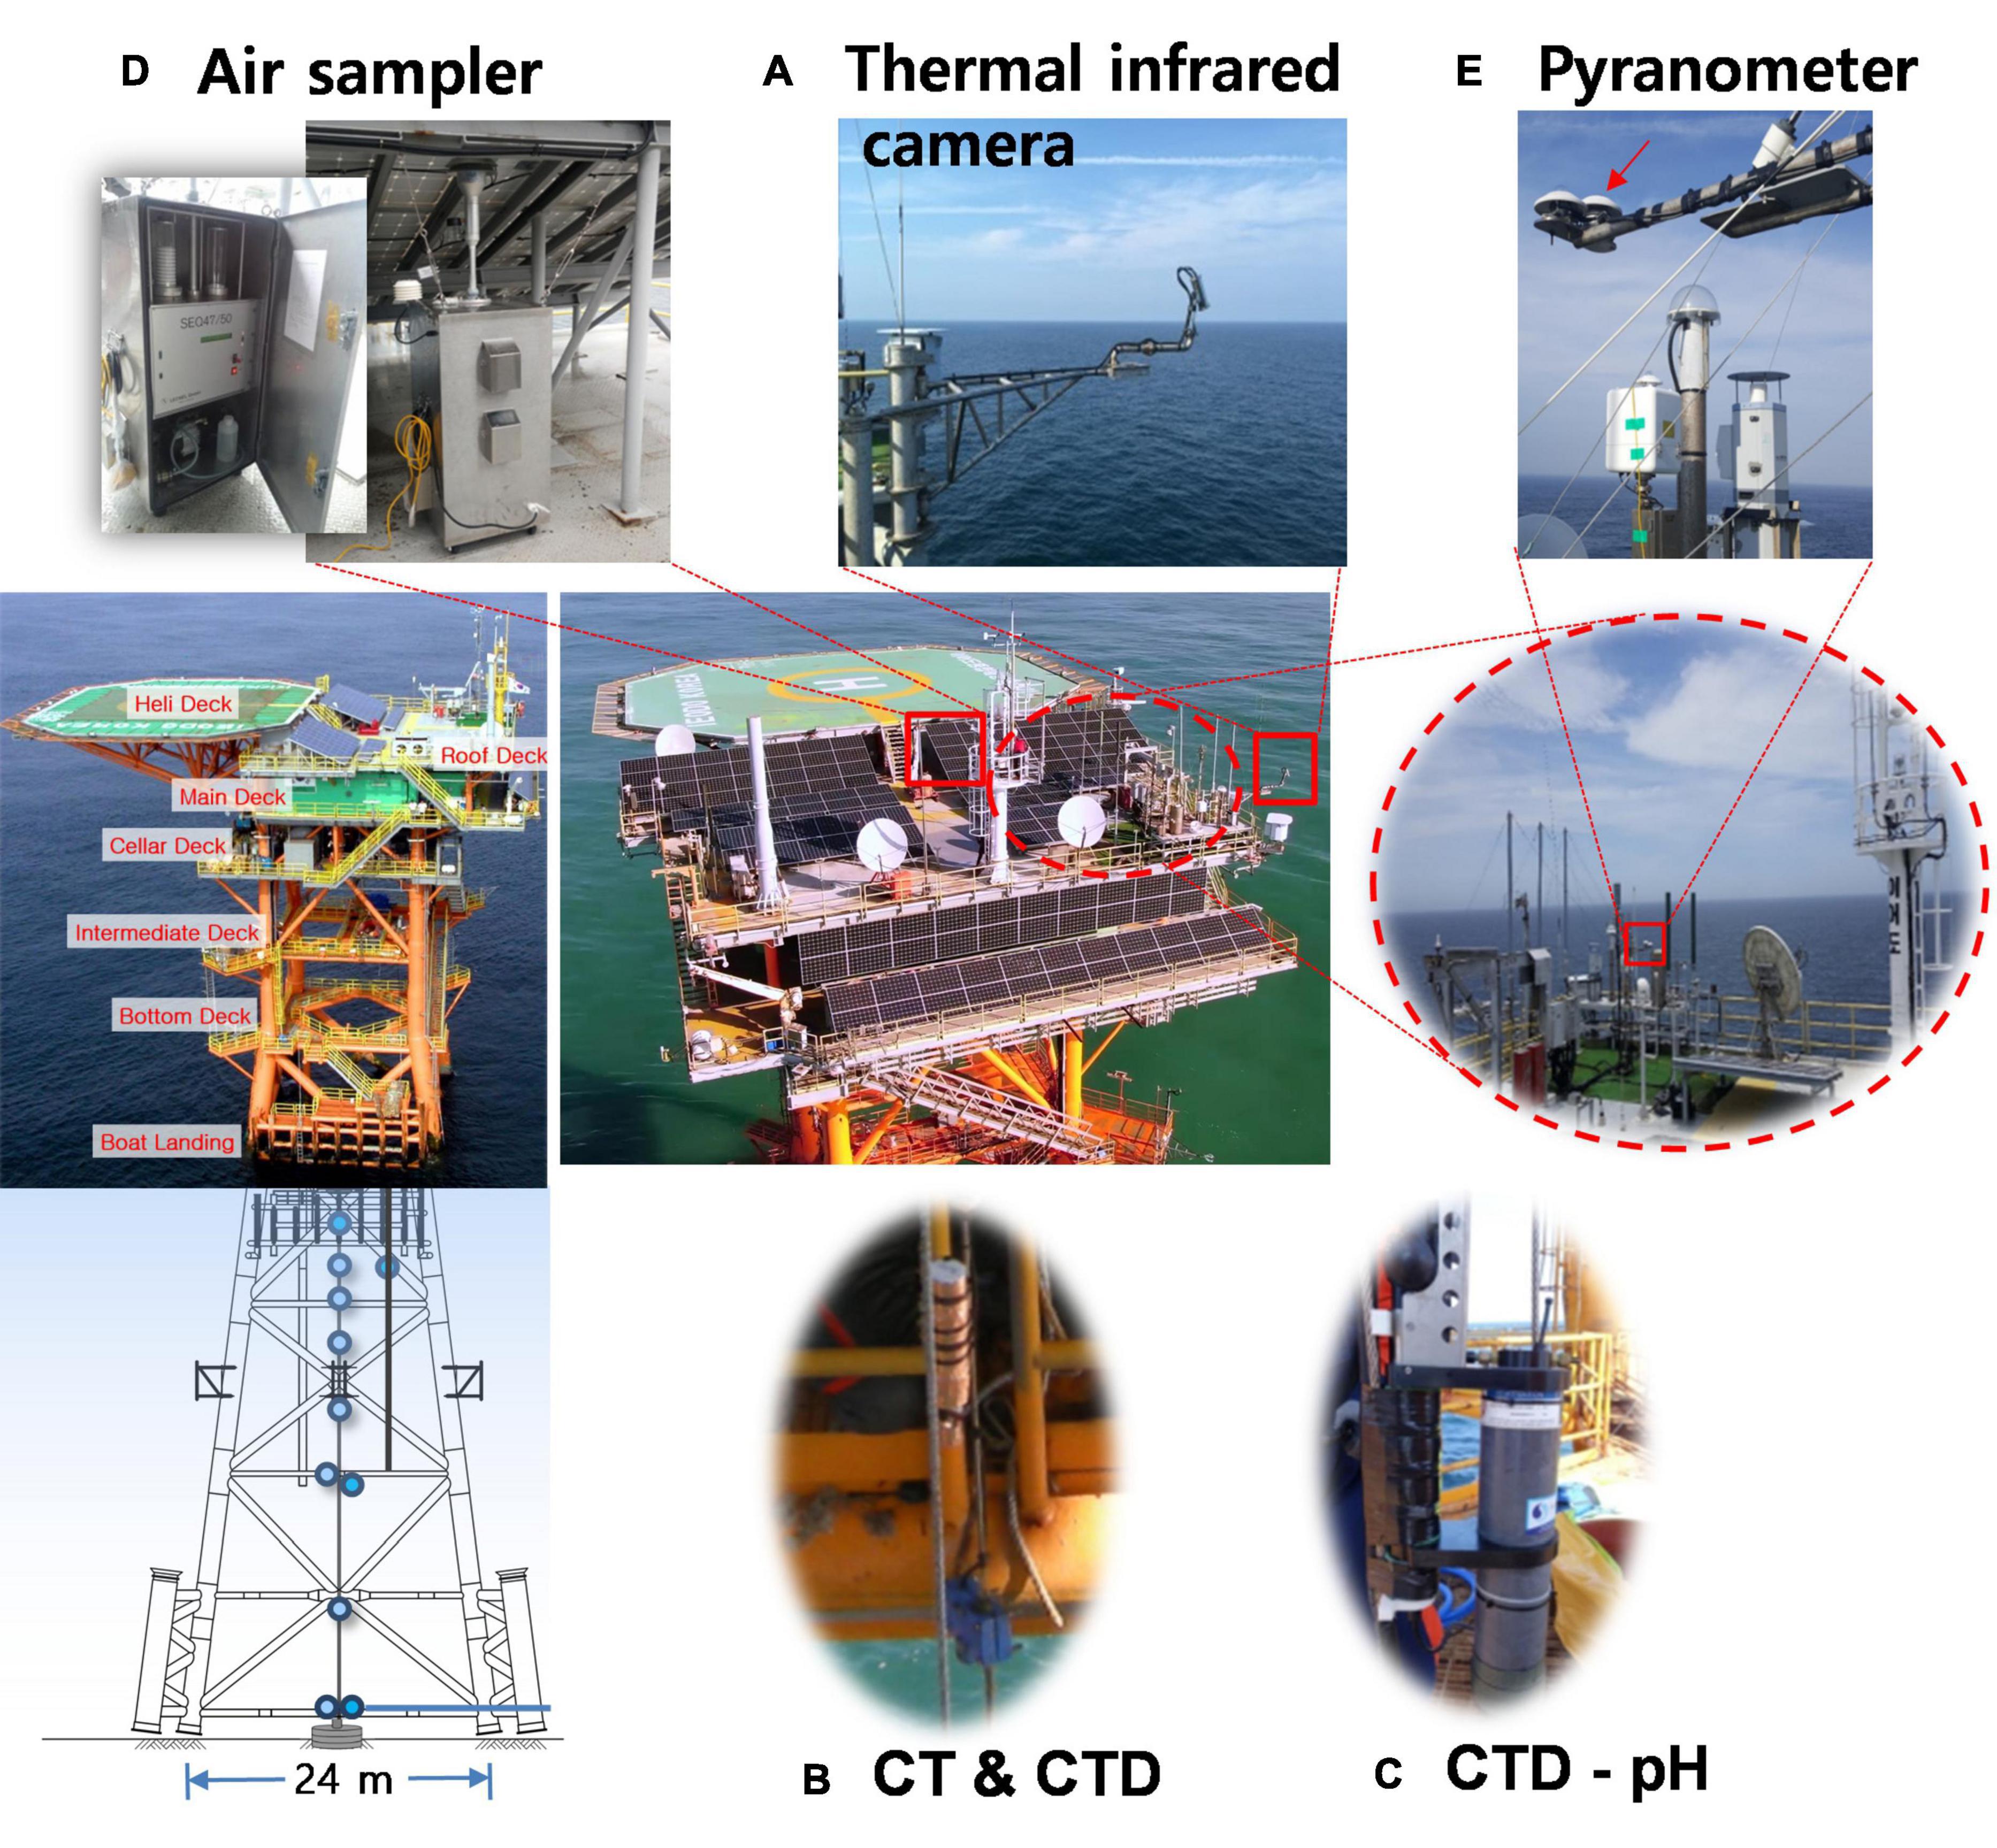
Figure 3. Instruments installed on Ieodo ORS for monitoring ocean and atmospheric environments: including a thermal infrared camera (A); conductivity-temperature (CT) and conductivity-temperature-depth (CTD) sensors (B); CTD-pH sensor (C); air sampler (D); and pyranometer (E).
Since there is no routine public transport from the mainland or Jeju Island to Ieodo ORS, the question arises as to how researchers access Ieodo ORS. Before 2014, Korean researchers chartered a fishing vessel to access Ieodo ORS. In October 2011, KHOA commissioned a dedicated vessel, the Haeyang Nuri, for Ieodo ORS maintenance. This aluminum vessel is 90 ton in weight, 33 m long, and 6.1 m wide, with a 35 knot maximum speed (Figure 1B). In 2013, KHOA launched a special “trial Ieodo researcher fieldtrip program” to promote research utilizing the Ieodo ORS facilities and data. As a first step, KHOA recruited researchers and groups interested in field studies during the month of January each year, providing the selected teams with a dedicated vessel service from Jeju Island for up to 18 passengers, and allowing researchers to use Ieodo ORS, including the residential facilities (bunkrooms, kitchen, dining, and seminar rooms), under KHOA supervision. In particular, the seawater desalination system is essential for researchers and maintenance personnel to be able to stay longer safely.
Five research teams, including staff from KHOA, KIOST, and the National Institute of Fisheries Science, participated in the trial fieldtrips, with the program receiving positive reviews from researchers. As a result, KHOA introduced the ongoing Ieodo ORS fieldtrip program in 2014. The two types of fieldtrip to the station under this latest program include a week-long stay and a short (2 h) visit for equipment maintenance and inspection tasks. In theory, the vessel departs with the researchers involved in both types of field trip from Aewol Port on Jeju Island in the early in the morning, arriving at Ieodo ORS around 5 h later. The vessel docks for 2 h before returning to Jeju Island in the late afternoon of the same day (Figure 4). Note that, in reality, departure dates and stay lengths at Ieodo ORS depend on sea conditions: when wave height predictions from the Korea Meteorological Administration exceed 0.5 m around the station site or when high wave heights are evident in the Ieodo ORS’ closed-circuit television (CCTV) camera images on the departure day, the Haeyang Nuri does not depart from Jeju Island due to station docking safety considerations. When researchers plan to stay more than one night at the station, KHOA requires them to undertake basic annual safety training, including first aid, fire training, and life raft practice.
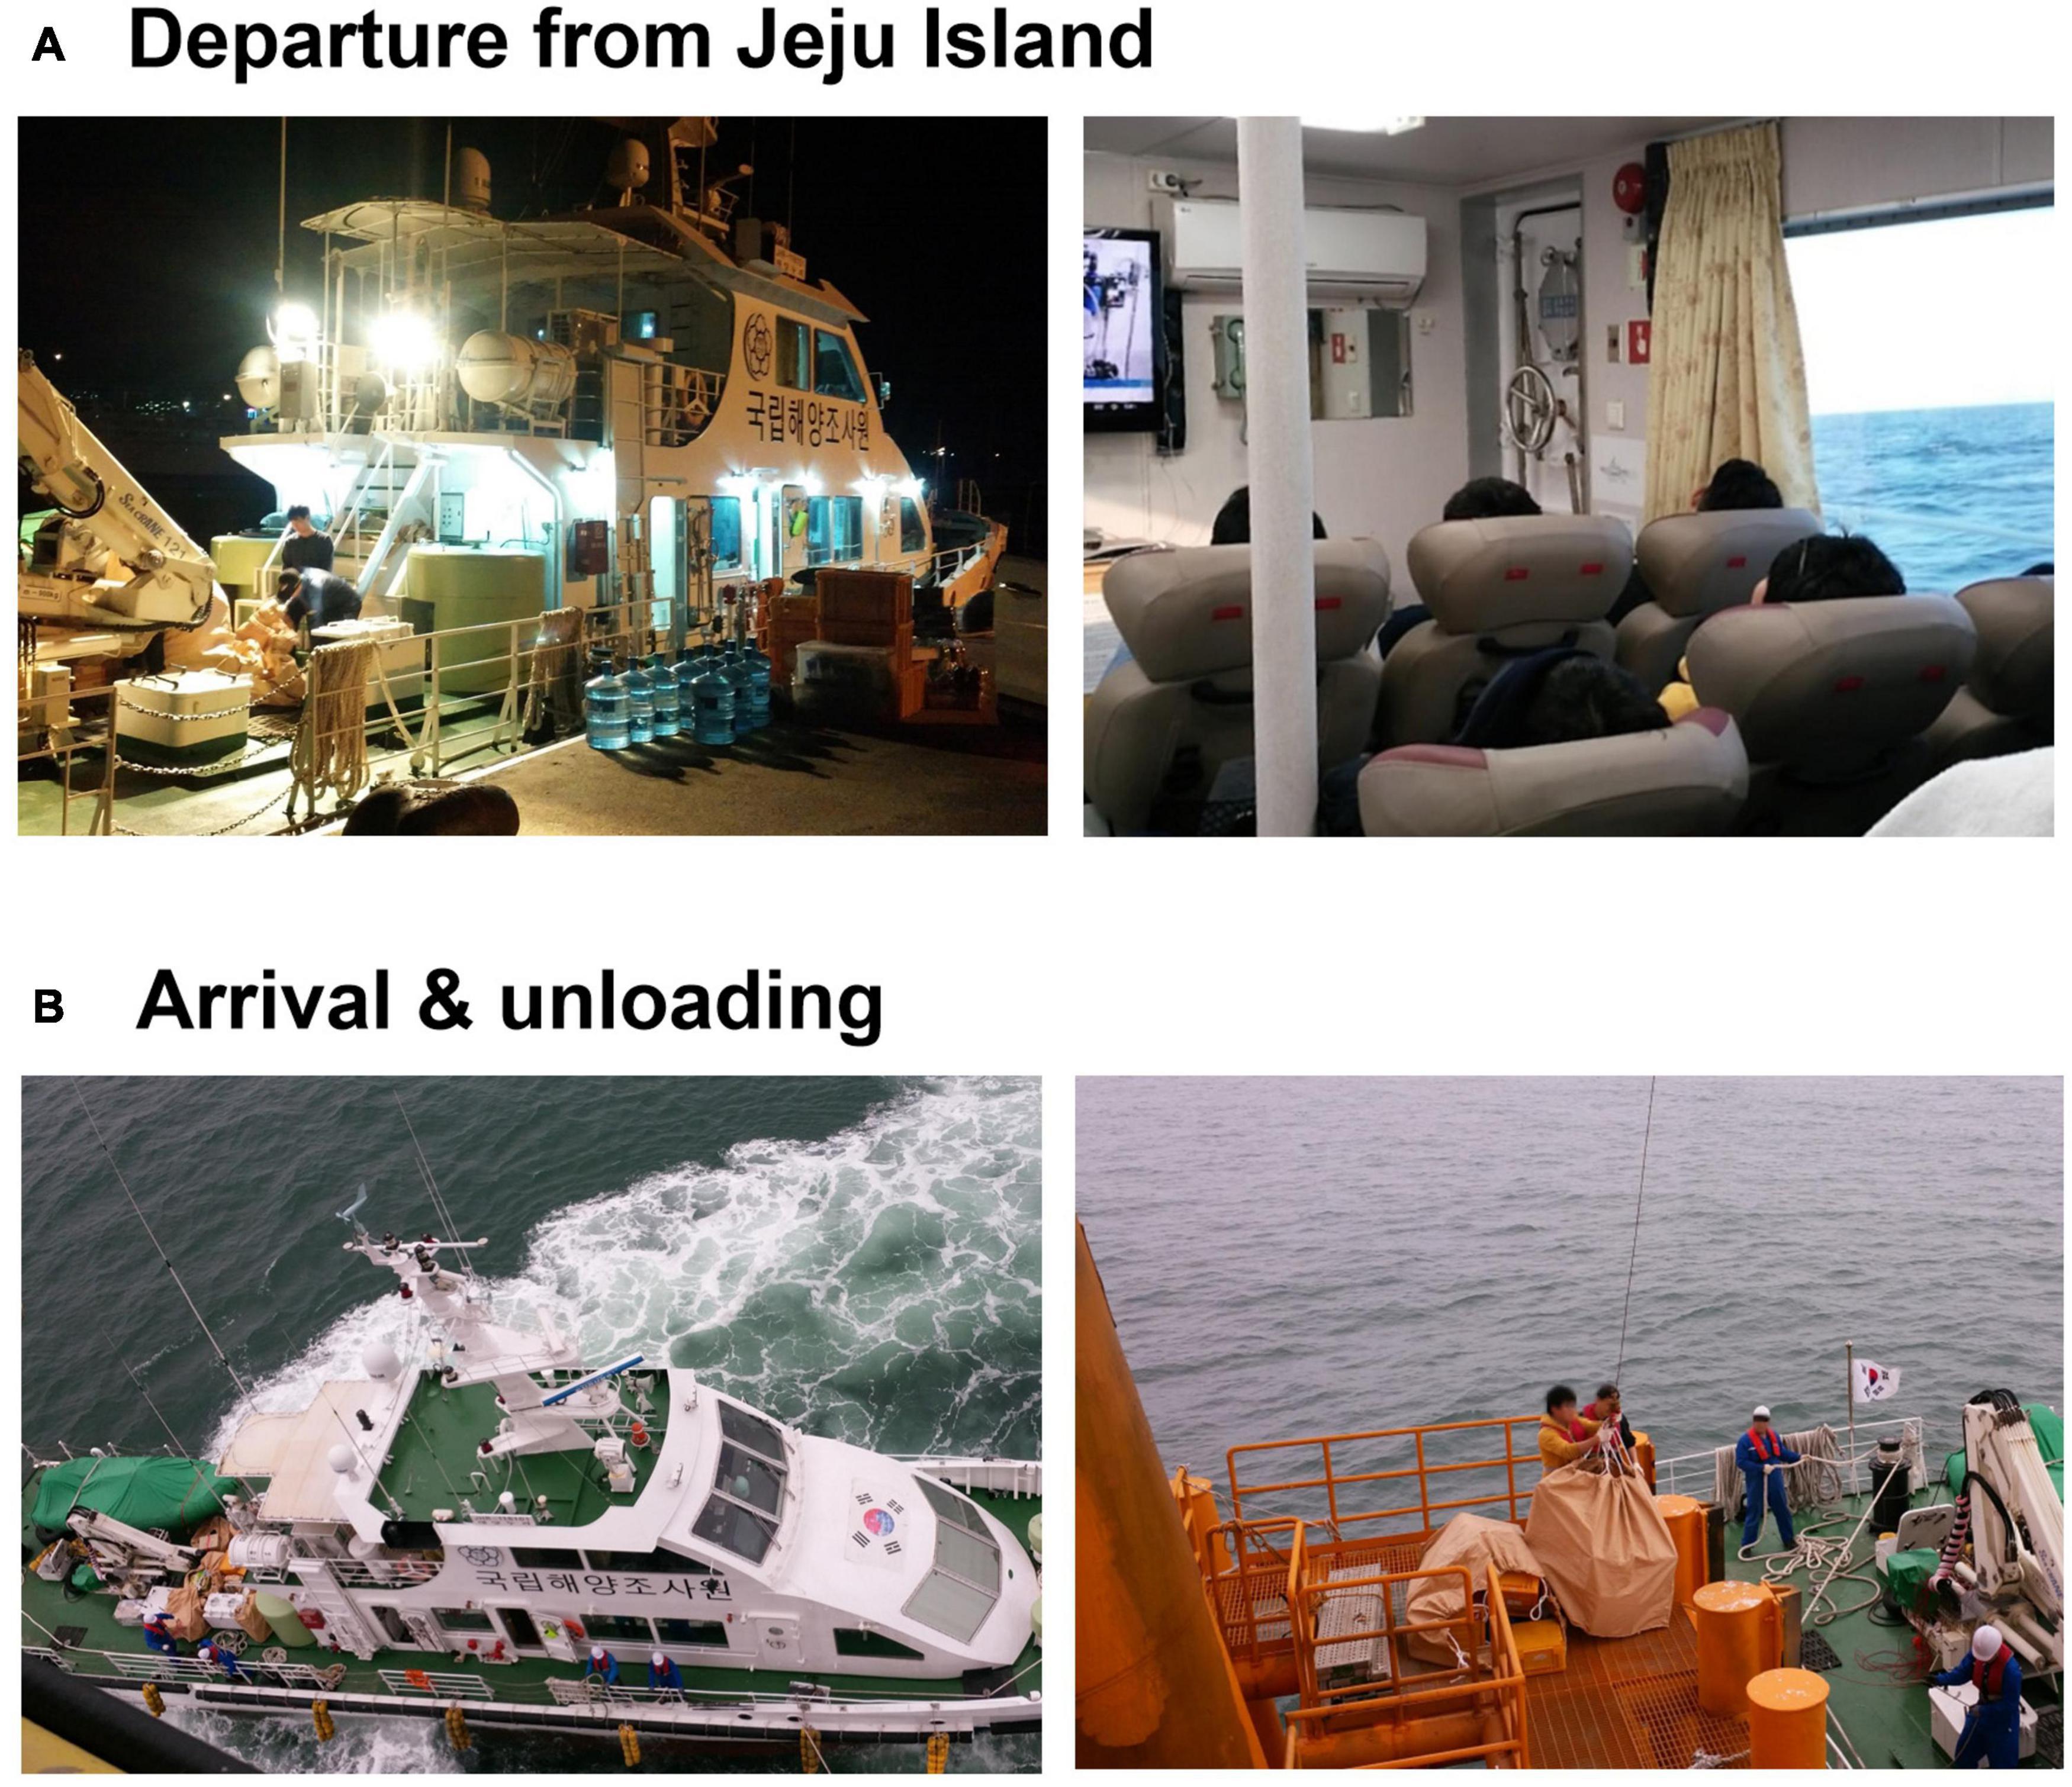
Figure 4. Images showing (A) departure from Jeju Island; the ship travel environment; and (B) arrival at Ieodo ORS, through the field trip program run by the Korea Hydrographic and Oceanographic Agency.
Thermal infrared (TIR) cameras are used to measure the sea surface temperature (SST), in particular when in situ observations are infeasible (Emery et al., 2001). Difficulties with in situ observations include strong wave action, in situ oceanic disasters, or where a site experiences very high tidal ranges that instruments installed at subtidal depths cannot always accurately measure the SST. TIR cameras can capture the SST from an elevated mounting that is above, and free of, these oceanic challenges. For example, the TIR camera (model: FLIR A310) installed on Ieodo ORS (Figure 3A) is connected to a personal computer (PC), which applies a transformation algorithm to the raw data in order to generate the SST (Figure 5). The algorithm employs observations of atmospheric radiation emitted downward versus that reflected off the sea surface, as well as wind speed and direction adjustment factors, to calculate the SST. It performs this atmospheric correction in real-time, via a user datagram protocol (UDP) with input data from the air temperature, relative humidity, and wind sensors installed at Ieodo ORS (Figure 5).
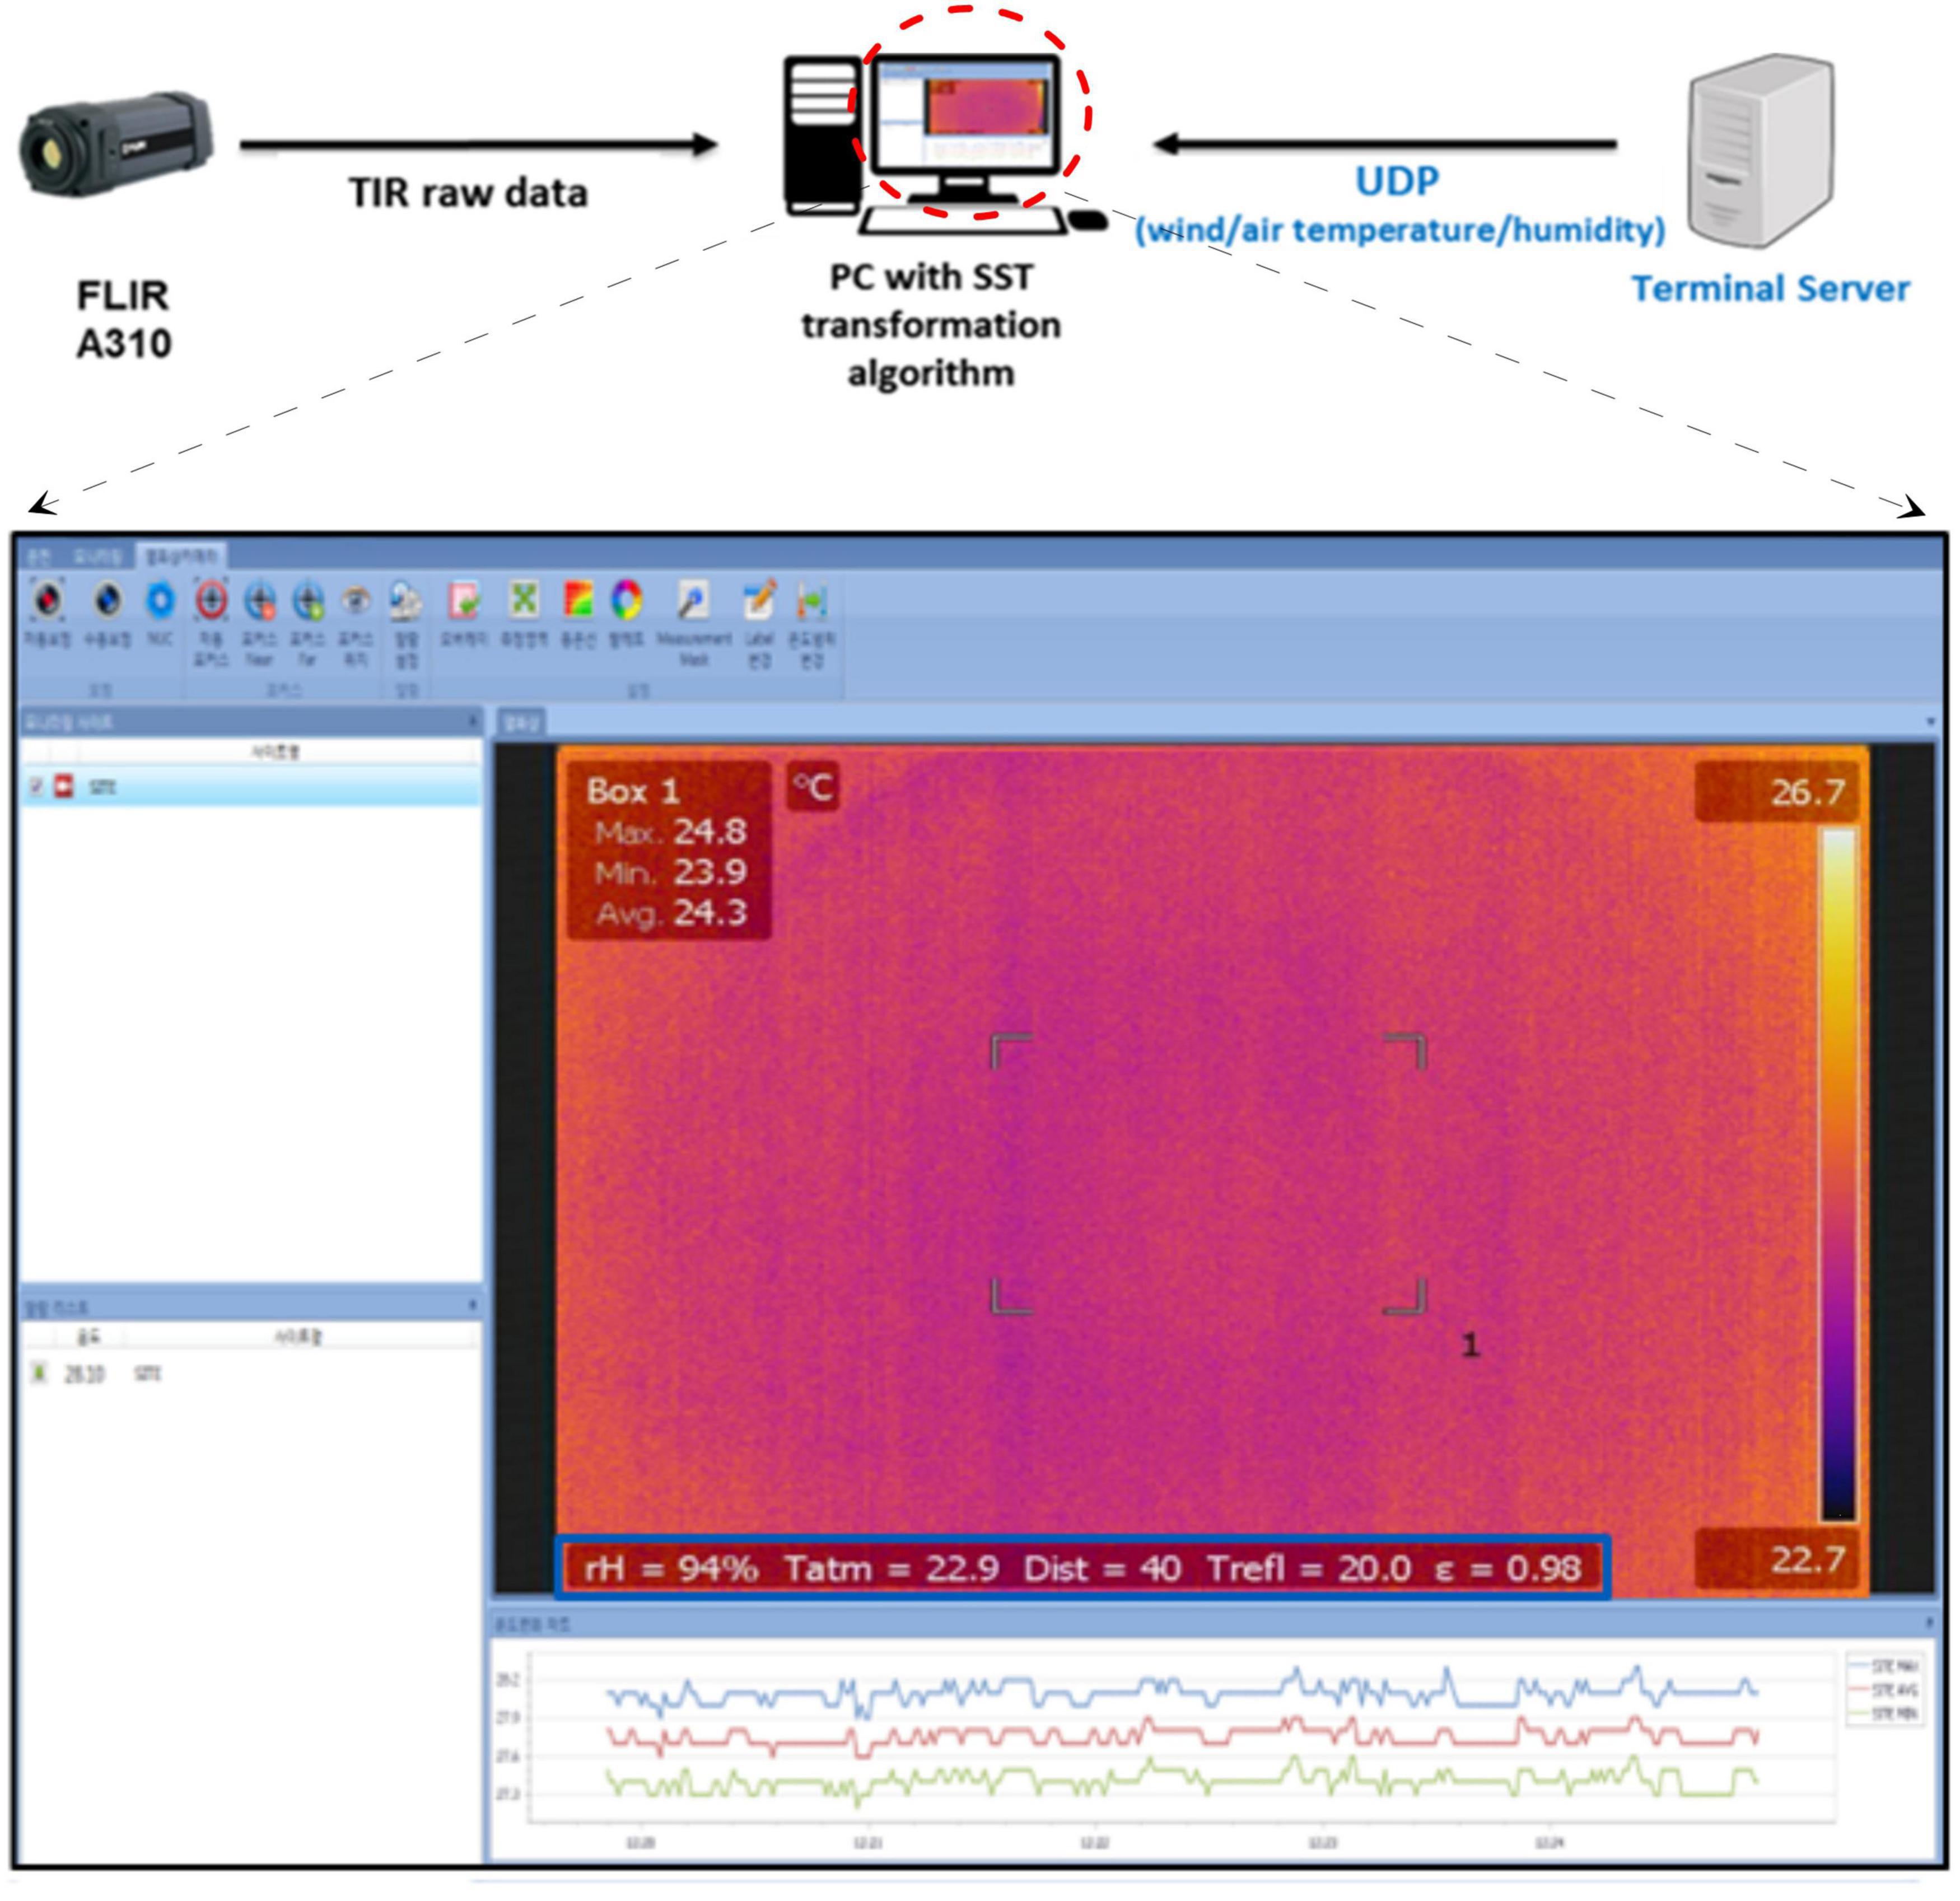
Figure 5. Thermal infrared (TIR) based sea surface temperature measurement system operated at Ieodo ORS by Korea Hydrographic and Oceanographic Agency. The TIR system’s image displays input values [relative humidity (rH, %); air temperature (Tatm, °C); distance to sea surface (Dist, m); reflected ambient temperature (Trefl, °C); and emissivity (ε) estimated by wind speed and direction] used for real-time atmospheric correction.
The TIR system was installed at Ieodo ORS in 2016, not at the nadir but at an incident angle of about 20° in order to minimize the potential impact of the structure, and has been in operation since. SST data derived from TIR sensor measurements are shown in Figure 6 (black line). For comparison, water temperatures measured by conductivity-temperature (CT) sensors deployed at depths of 3 m (blue), 20.5 m (green), and 38 m (red) are also displayed. Gaps in the TIR data as shown in Figure 6 mainly resulted from TIR camera power supply interruptions or unexpected malfunctions in the new electronic installation setting. Originally, after power supply resumed, it was necessary to perform a manual restart of the TIR senor since it did not have an automatic reboot function. In August 2020, this problem was solved by introducing an automatic reboot system using a “Wake on AC” function. An uninterruptible power supply system installed in Ieodo ORS also helped eliminate short-term power supply interruptions.
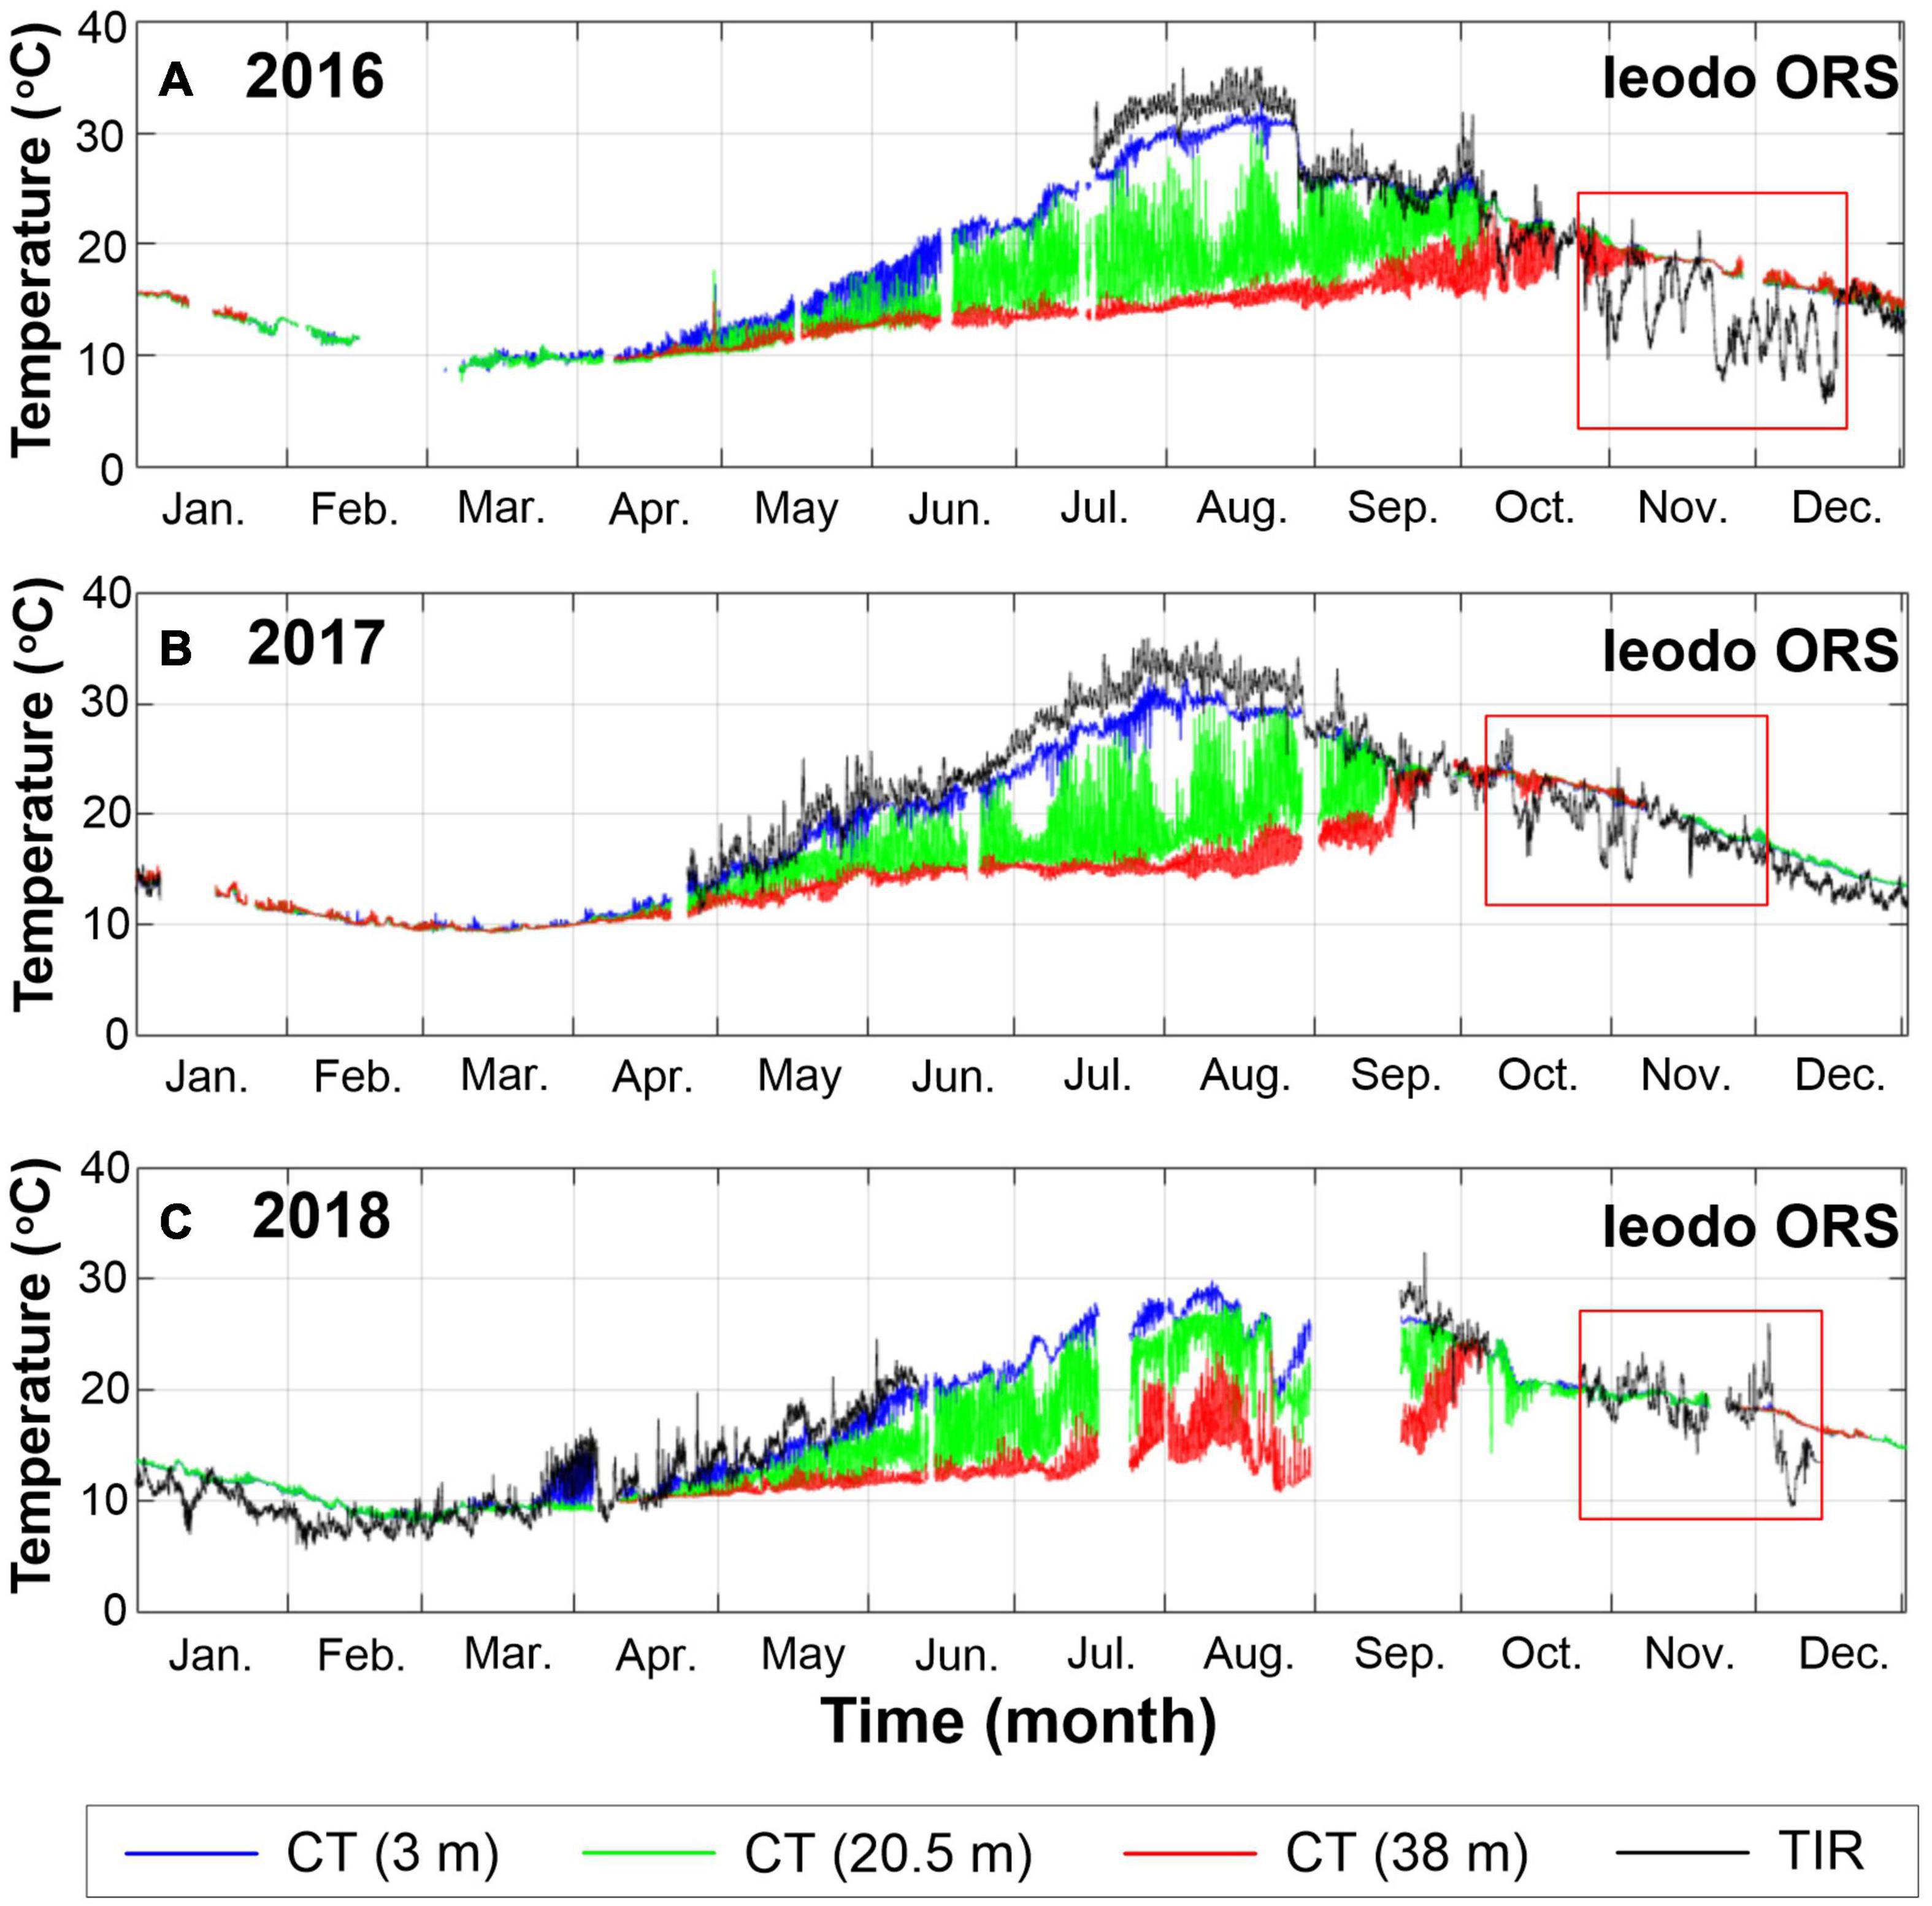
Figure 6. Quality controlled water temperatures measured from Ieodo ORS using conductivity temperature (CT) sensors deployed at depths of 3 m (blue line), 20.5 m (green line), and 38 m (red line), along with sea surface temperature (black line) measured using the TIR camera from 2016 to 2018 (A–C). Rectangular red boxes indicate abnormal SST values observed during the winter seasons.
During the 2016 winter season, the TIR-derived SST data showed abnormal variations compared to those of the temperature data measured at 5 m depth (see red box in Figure 6A). We initially thought that this difference in sensor results might have arisen due to an equipment error, arising from an excessively prolonged operation. In response, we modified the operating algorithm so that the TIR camera automatically rebooted every 12 h, and a non-uniformity correction (NUC) using the TIR sensor’s reference infrared (IR) radiation readings was conducted every 2 h to remove any distortion of the thermal representation and impaired parameters caused by long duration operation. In addition, values of air-temperature, relative humidity, and emissivity (estimated from wind speed and direction) were simultaneously recorded in the thermal images to check whether or not the observed data were correctly fed into the UDP in real-time (Figure 5).
However, a similar anomalous SST phenomenon was observed during the winters of 2017 and 2018 (red boxes in Figures 6B,C) even after the above operational adjustments. Upon inspection of the TIR images acquired during the anomalous periods, images such as the 2016 thermal image shown in Figure 7 were confirmed to be sound and the pattern was also found to change over time. Thus, we could conclude that the abnormal SST values recorded in the winter seasons resulted from a natural oceanic and/or atmospheric phenomenon, rather than equipment errors. Additional laboratory experiments using the TIR images of a water tank and humidifier were able to confirm that the SST abnormalities were produced by sea fog.
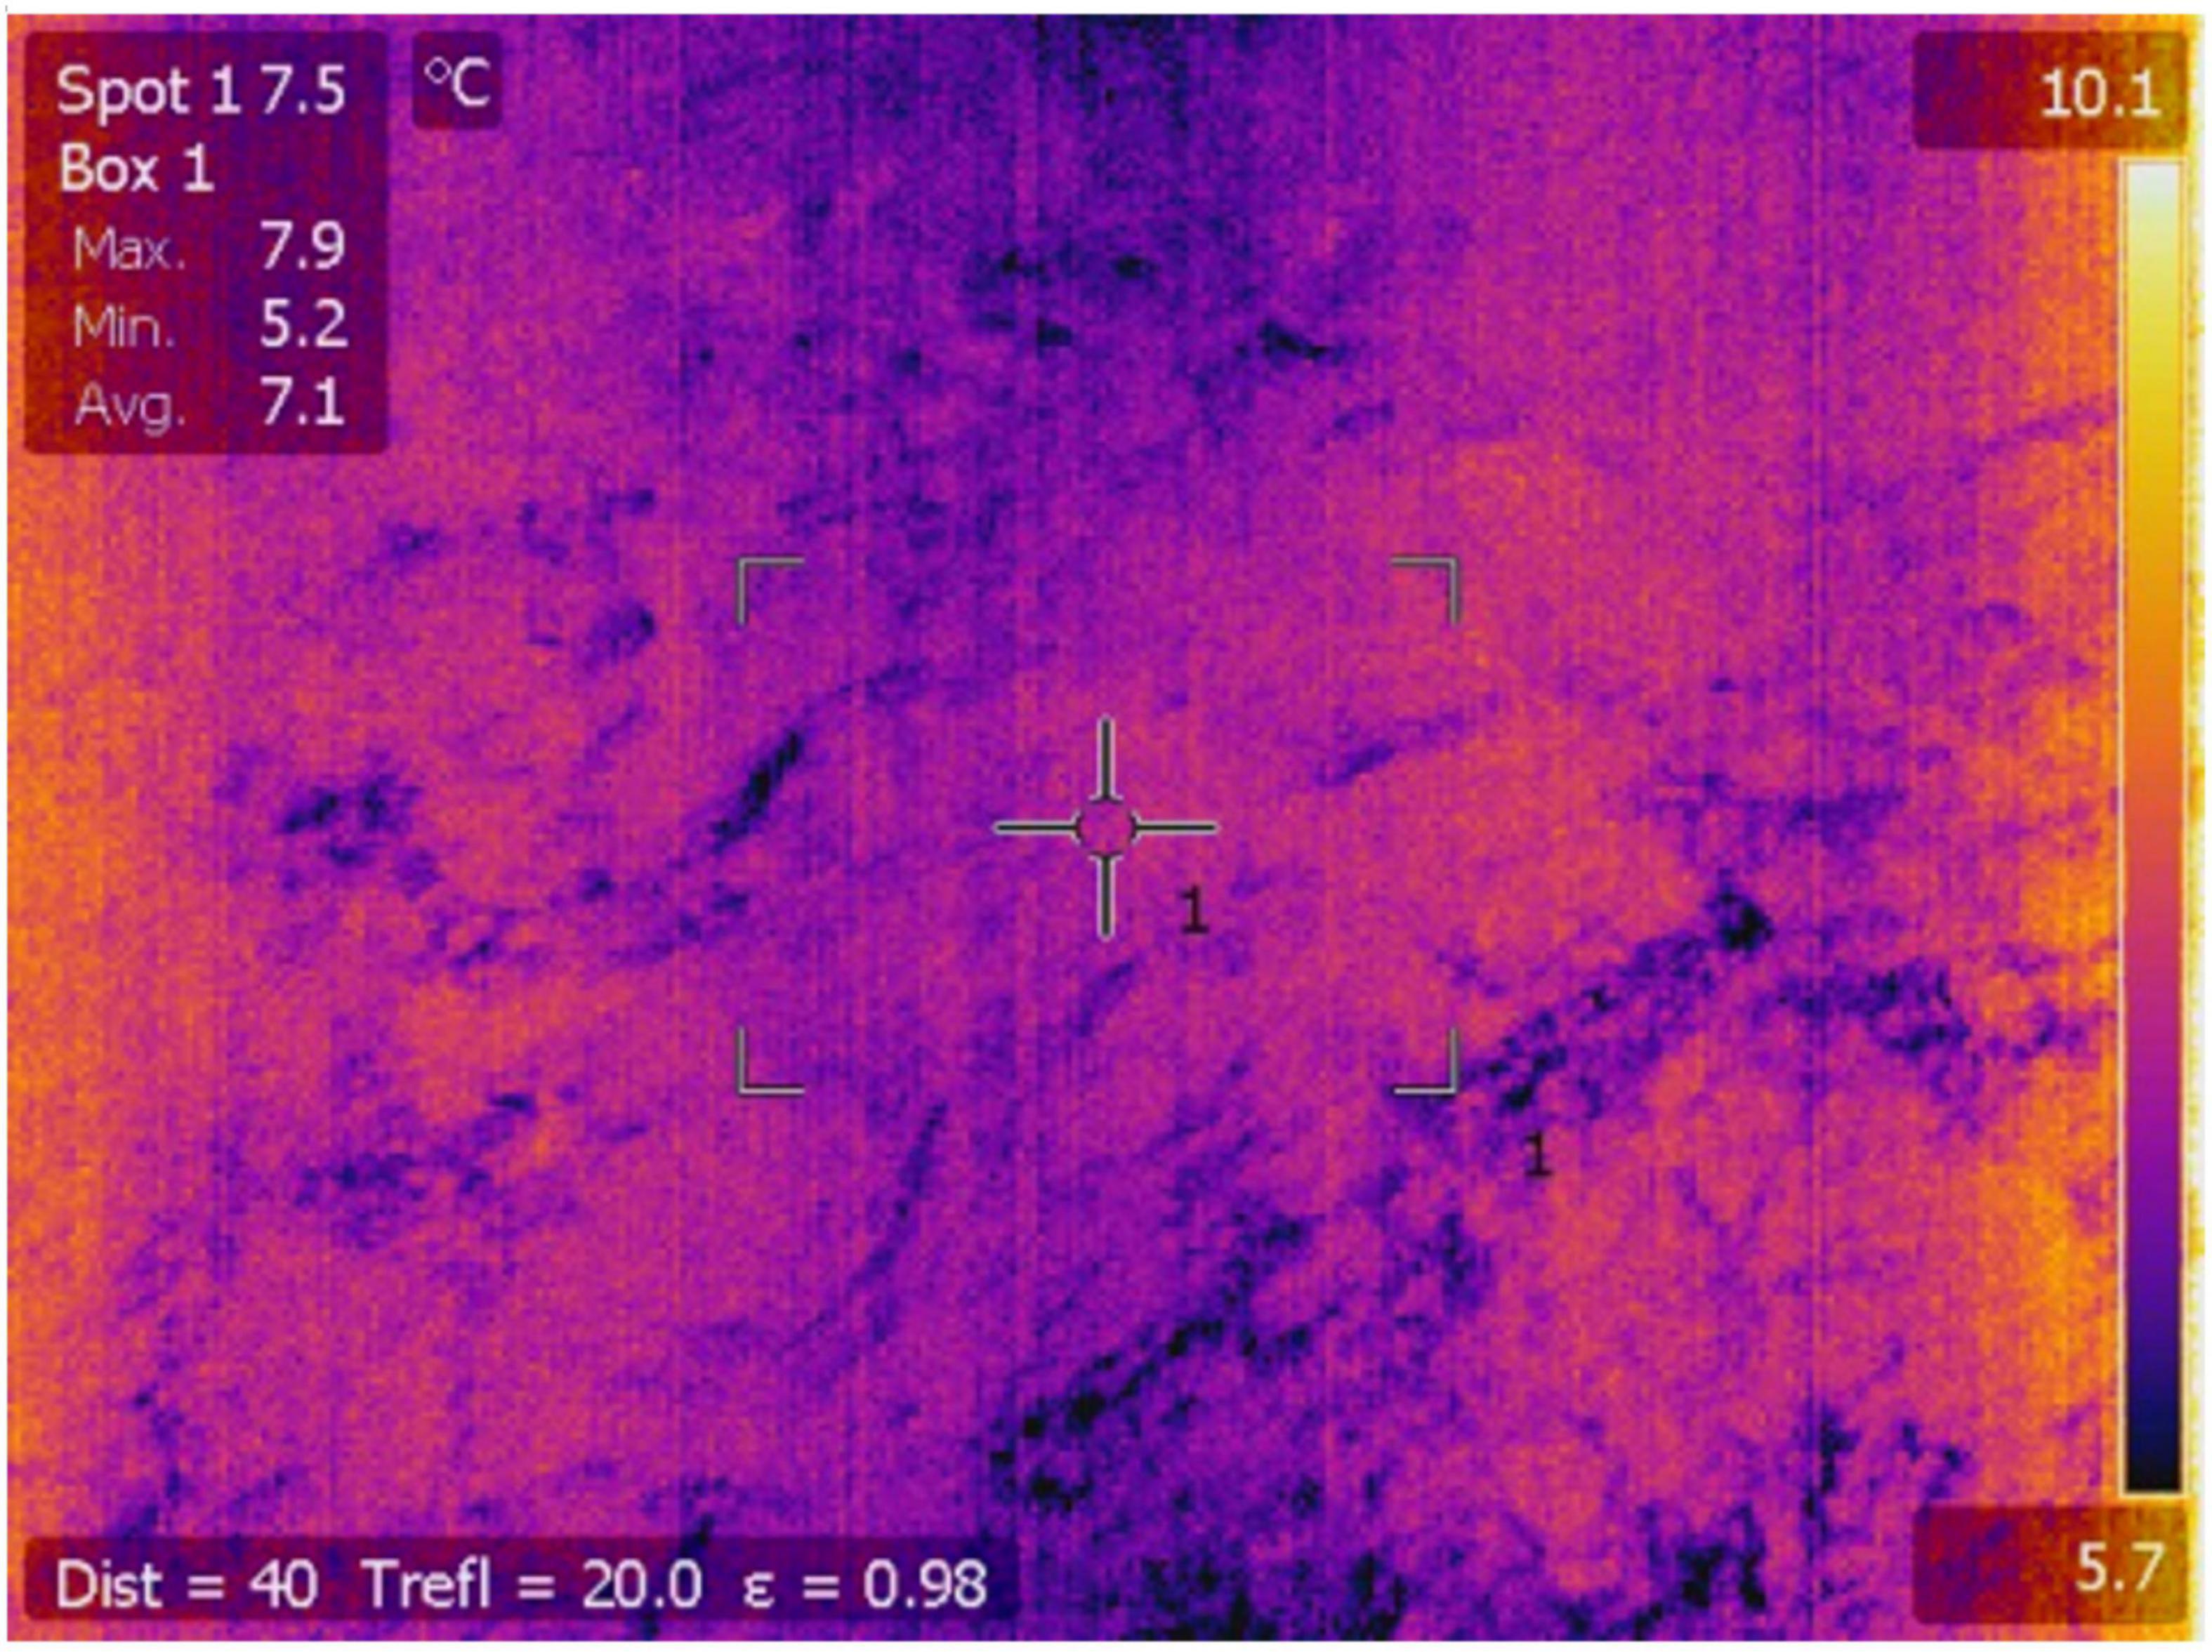
Figure 7. An example of an abnormal TIR image acquired on December 16, 2016 at 03:57 (corresponding to the winter period highlighted with a red rectangular box in Figure 6A).
Note that the root-mean-square error of SST measured between the life tube-mounted thermistor (HOBO, Water Temp Pro v2 Logger) and the TIR camera during the period of July 15–18, 2016 was 0.37°C (Kang et al., 2017). As shown in Figure 6, the remarkable semidiurnal fluctuation (>10°C) in temperature recorded at 20.5 m depth (green line), around the elevation of the summertime thermocline (June to September) (Supplementary Figure 2), was likely induced by oceanic internal tide waves (Cho et al., 2016; Nam et al., 2018).
Ocean temperature and salinity have been relatively consistently measured at Ieodo ORS since 2018. Two different types of a conductivity sensor (i.e., inductive and electrode) are used to measure these parameters at several water depths. As shown in Figure 8, Aanderaa inductive-type conductivity-temperature (CT) sensors (model 3919) are installed at depths of 3, 20.5, and 38 m throughout the entire year, operating at 10 min sampling intervals by KHOA. RBR concerto inductive-type conductivity-temperature-depth (CTD) sensors are installed at depths of 5, 7, 10, 15, 20, 30, and 38 m, operating at 1 min sampling intervals by KIOST, during the summertime—that is, the season of greatest ocean water stratification in this area (Ha et al., 2019). In May 2019, larger electrode-based CTD (Sea-Bird Scientific Company, SBE37-SI) sensors were installed at depths of 5, 7, 10, 15, and 20 m, operating at 1 min sampling intervals, for monitoring salinity and temperature during the late spring and summer. Additional salinity records used in this study were measured by an electrode-based CTD (SBE37-SMP) combined with a SeapHOxTM pH sensor, and installed at depths of 5 m, operating at 5 min sampling intervals. Note that compared to the electrode-based CTD sensors (SEB37-SMP and SEB37-SI), the inductive type CT (Aanderaa 3919) and RBR concerto CTD (RBR CTD) sensors are relatively small and easy to operate and maintain at the Ieodo ORS. These conductivity sensors produce high precision data at resolutions of 0.002 mS cm–1 for conductivity and 0.01∼0.002°C for temperature.
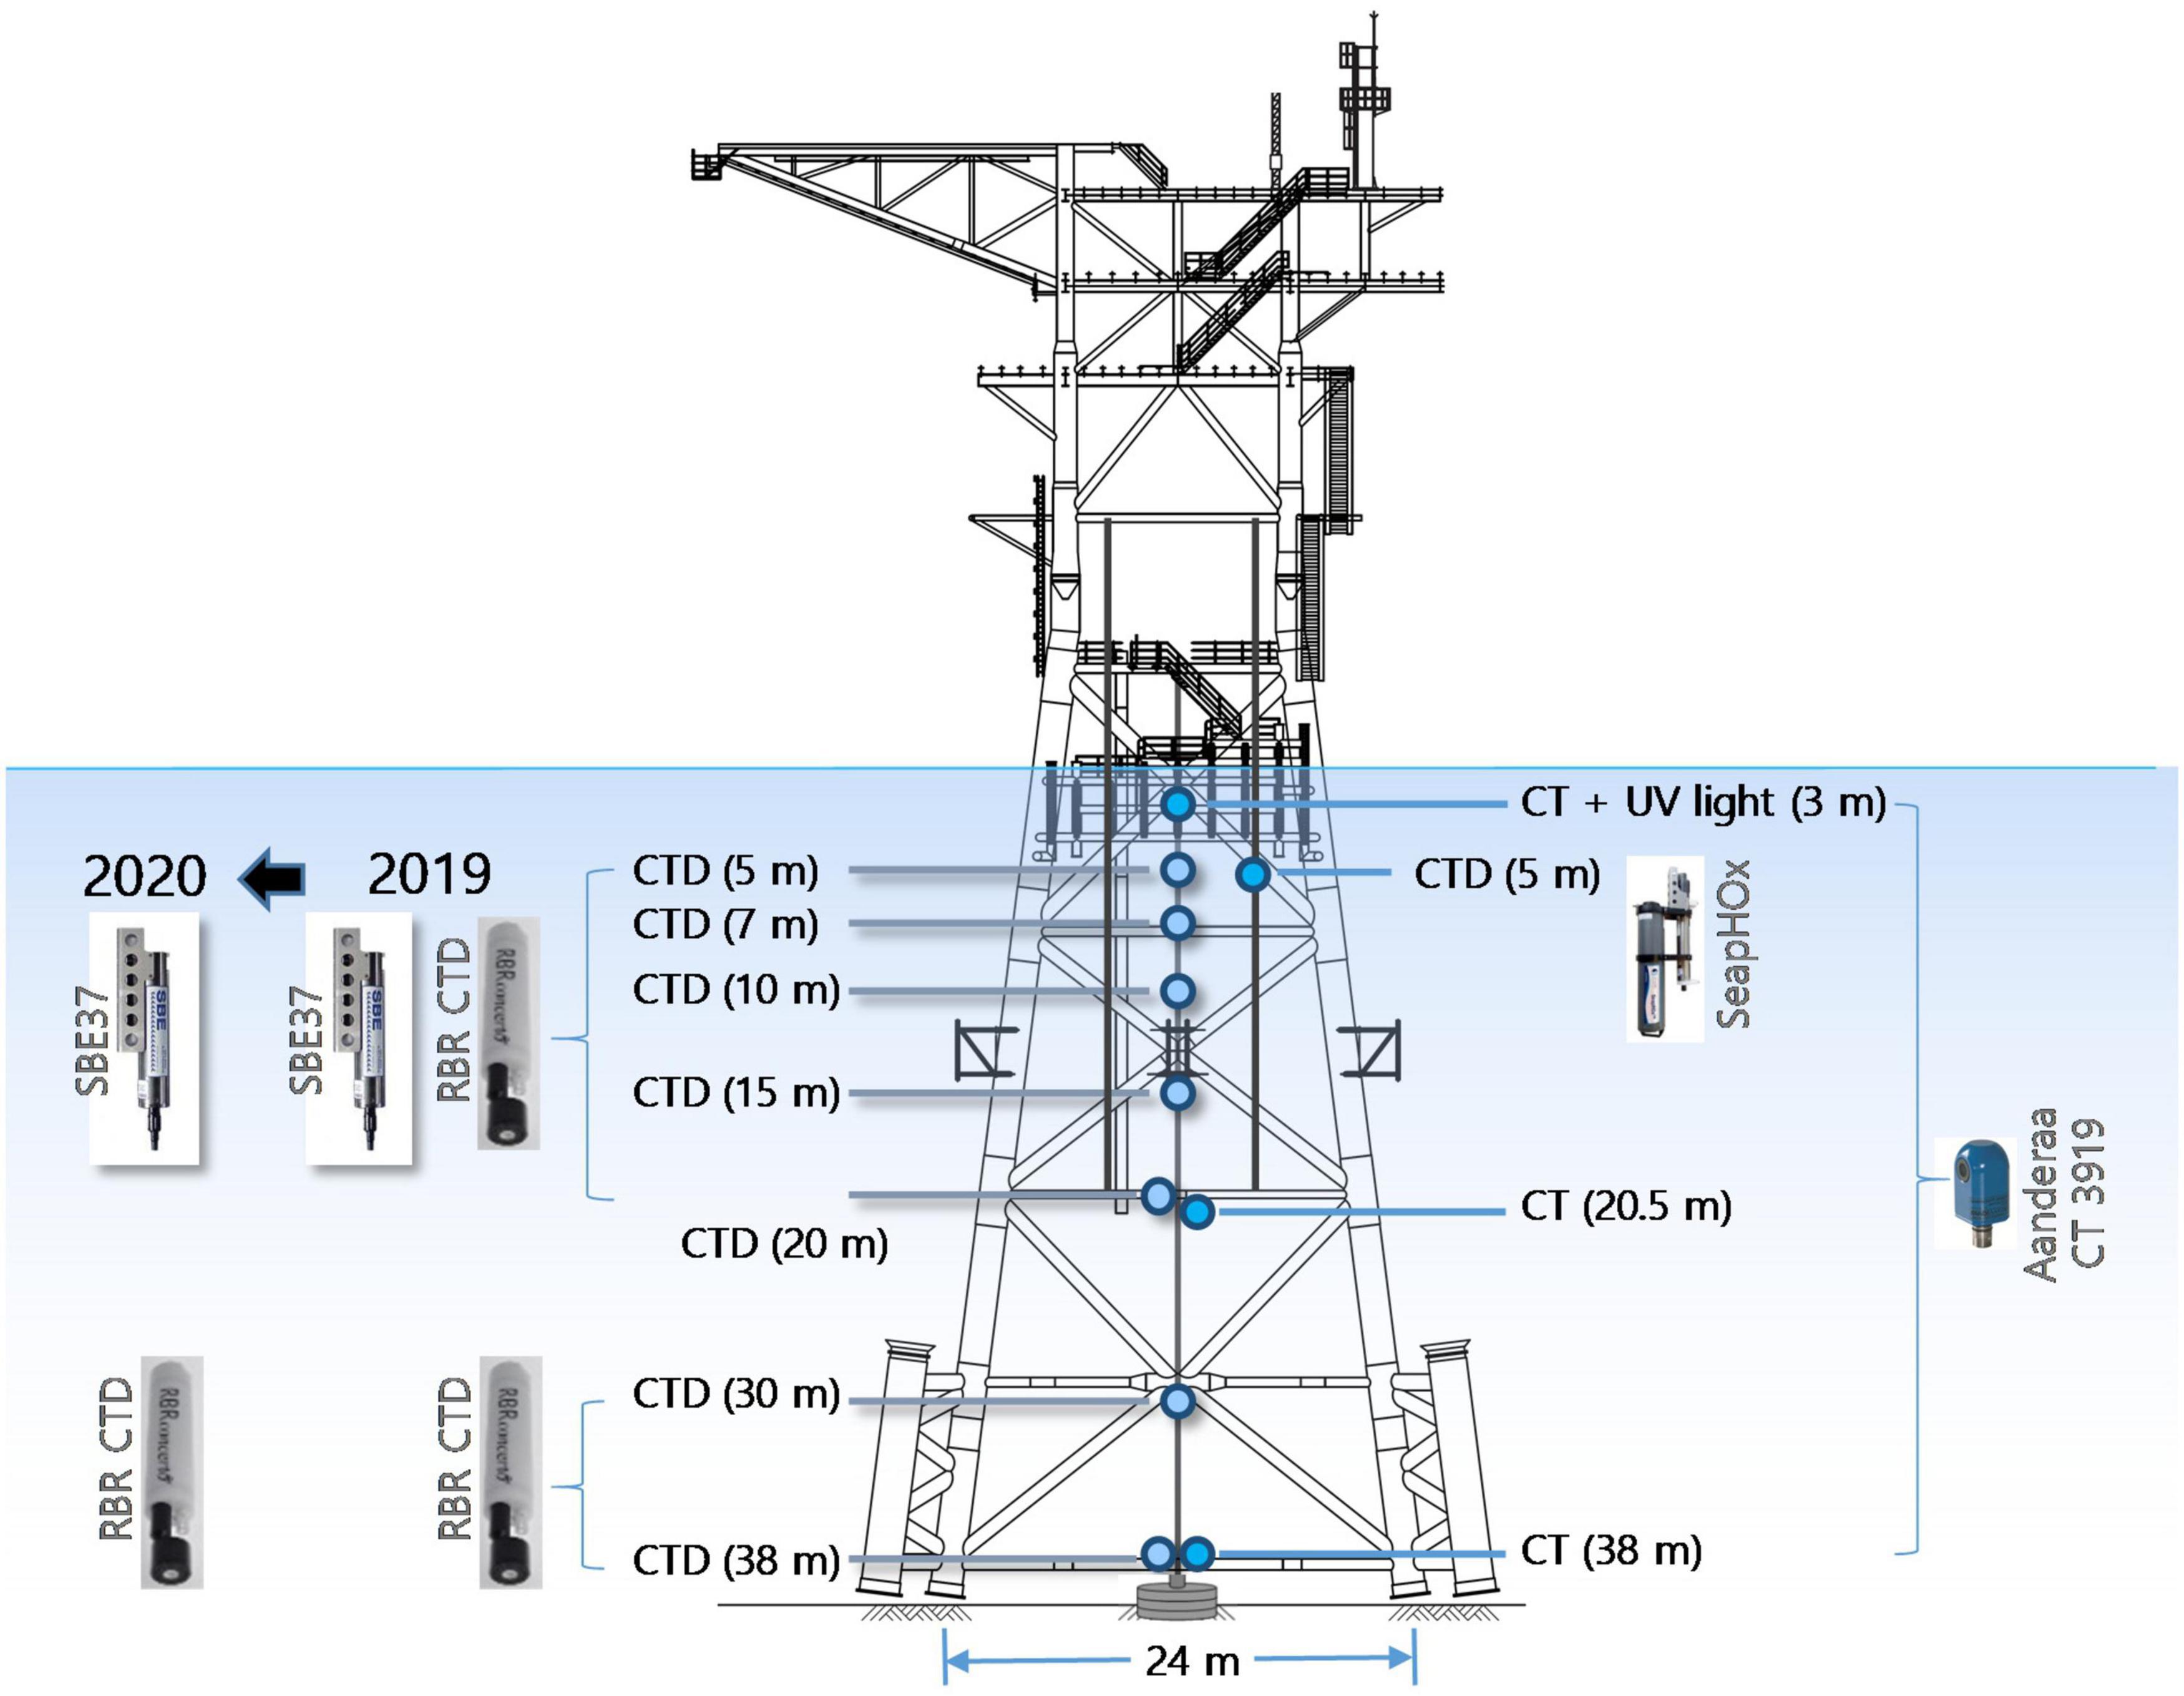
Figure 8. Schematic mounting location diagram of oceanic sensors installed at Ieodo ORS. RBR concerto CTDs, SEB37-SI CTDs, and a SeapHOx with SBE37-SMP CTD are moored during the stratification season from late May to October, whereas Aanderaa CTs are installed for the entire year. Note that the RBR CTDs concurrently operated with the SBE37-SI CTDs at depths ≤20 m were installed in 2019 and removed in May 2020.
Since Ieodo ORS is located along the main track of typhoons approaching Korea (Figure 2), these small sensors, which experience minimum damage in high wave energy conditions, are suitable for acquiring continuous ocean temperature and salinity records here. Another challenge arises from the high levels of spring to autumn biological productivity characteristic of the Ieodo ORS region. During this period, biofouling on the salinity sensor is a key problem, significantly reducing sensor performance as shown in Figure 9. To minimize data drift in the salinity observations, three technical solutions were applied and studied, including the use of (1) copper taping (Venkatesan et al., 2017), (2) UV light beams (Corin et al., 1996), and (3) electrode type salinity sensors (Kim et al., 2019). The use of copper taping around the RBR sensor (Figure 3B) initially hindered biofouling, but the effect lasted only a couple of weeks (not shown) and did not produce measurable effects over observational timescales in the ORS experiments. After a full month of mooring deployment, the sensors were fully encrusted with living organisms, reducing their performance. Furthermore, copper taping is likely to subtly affect the magnetic field of inductive RBR sensors, thus, it was deemed an unacceptable choice to reduce organism growth on such sensors.
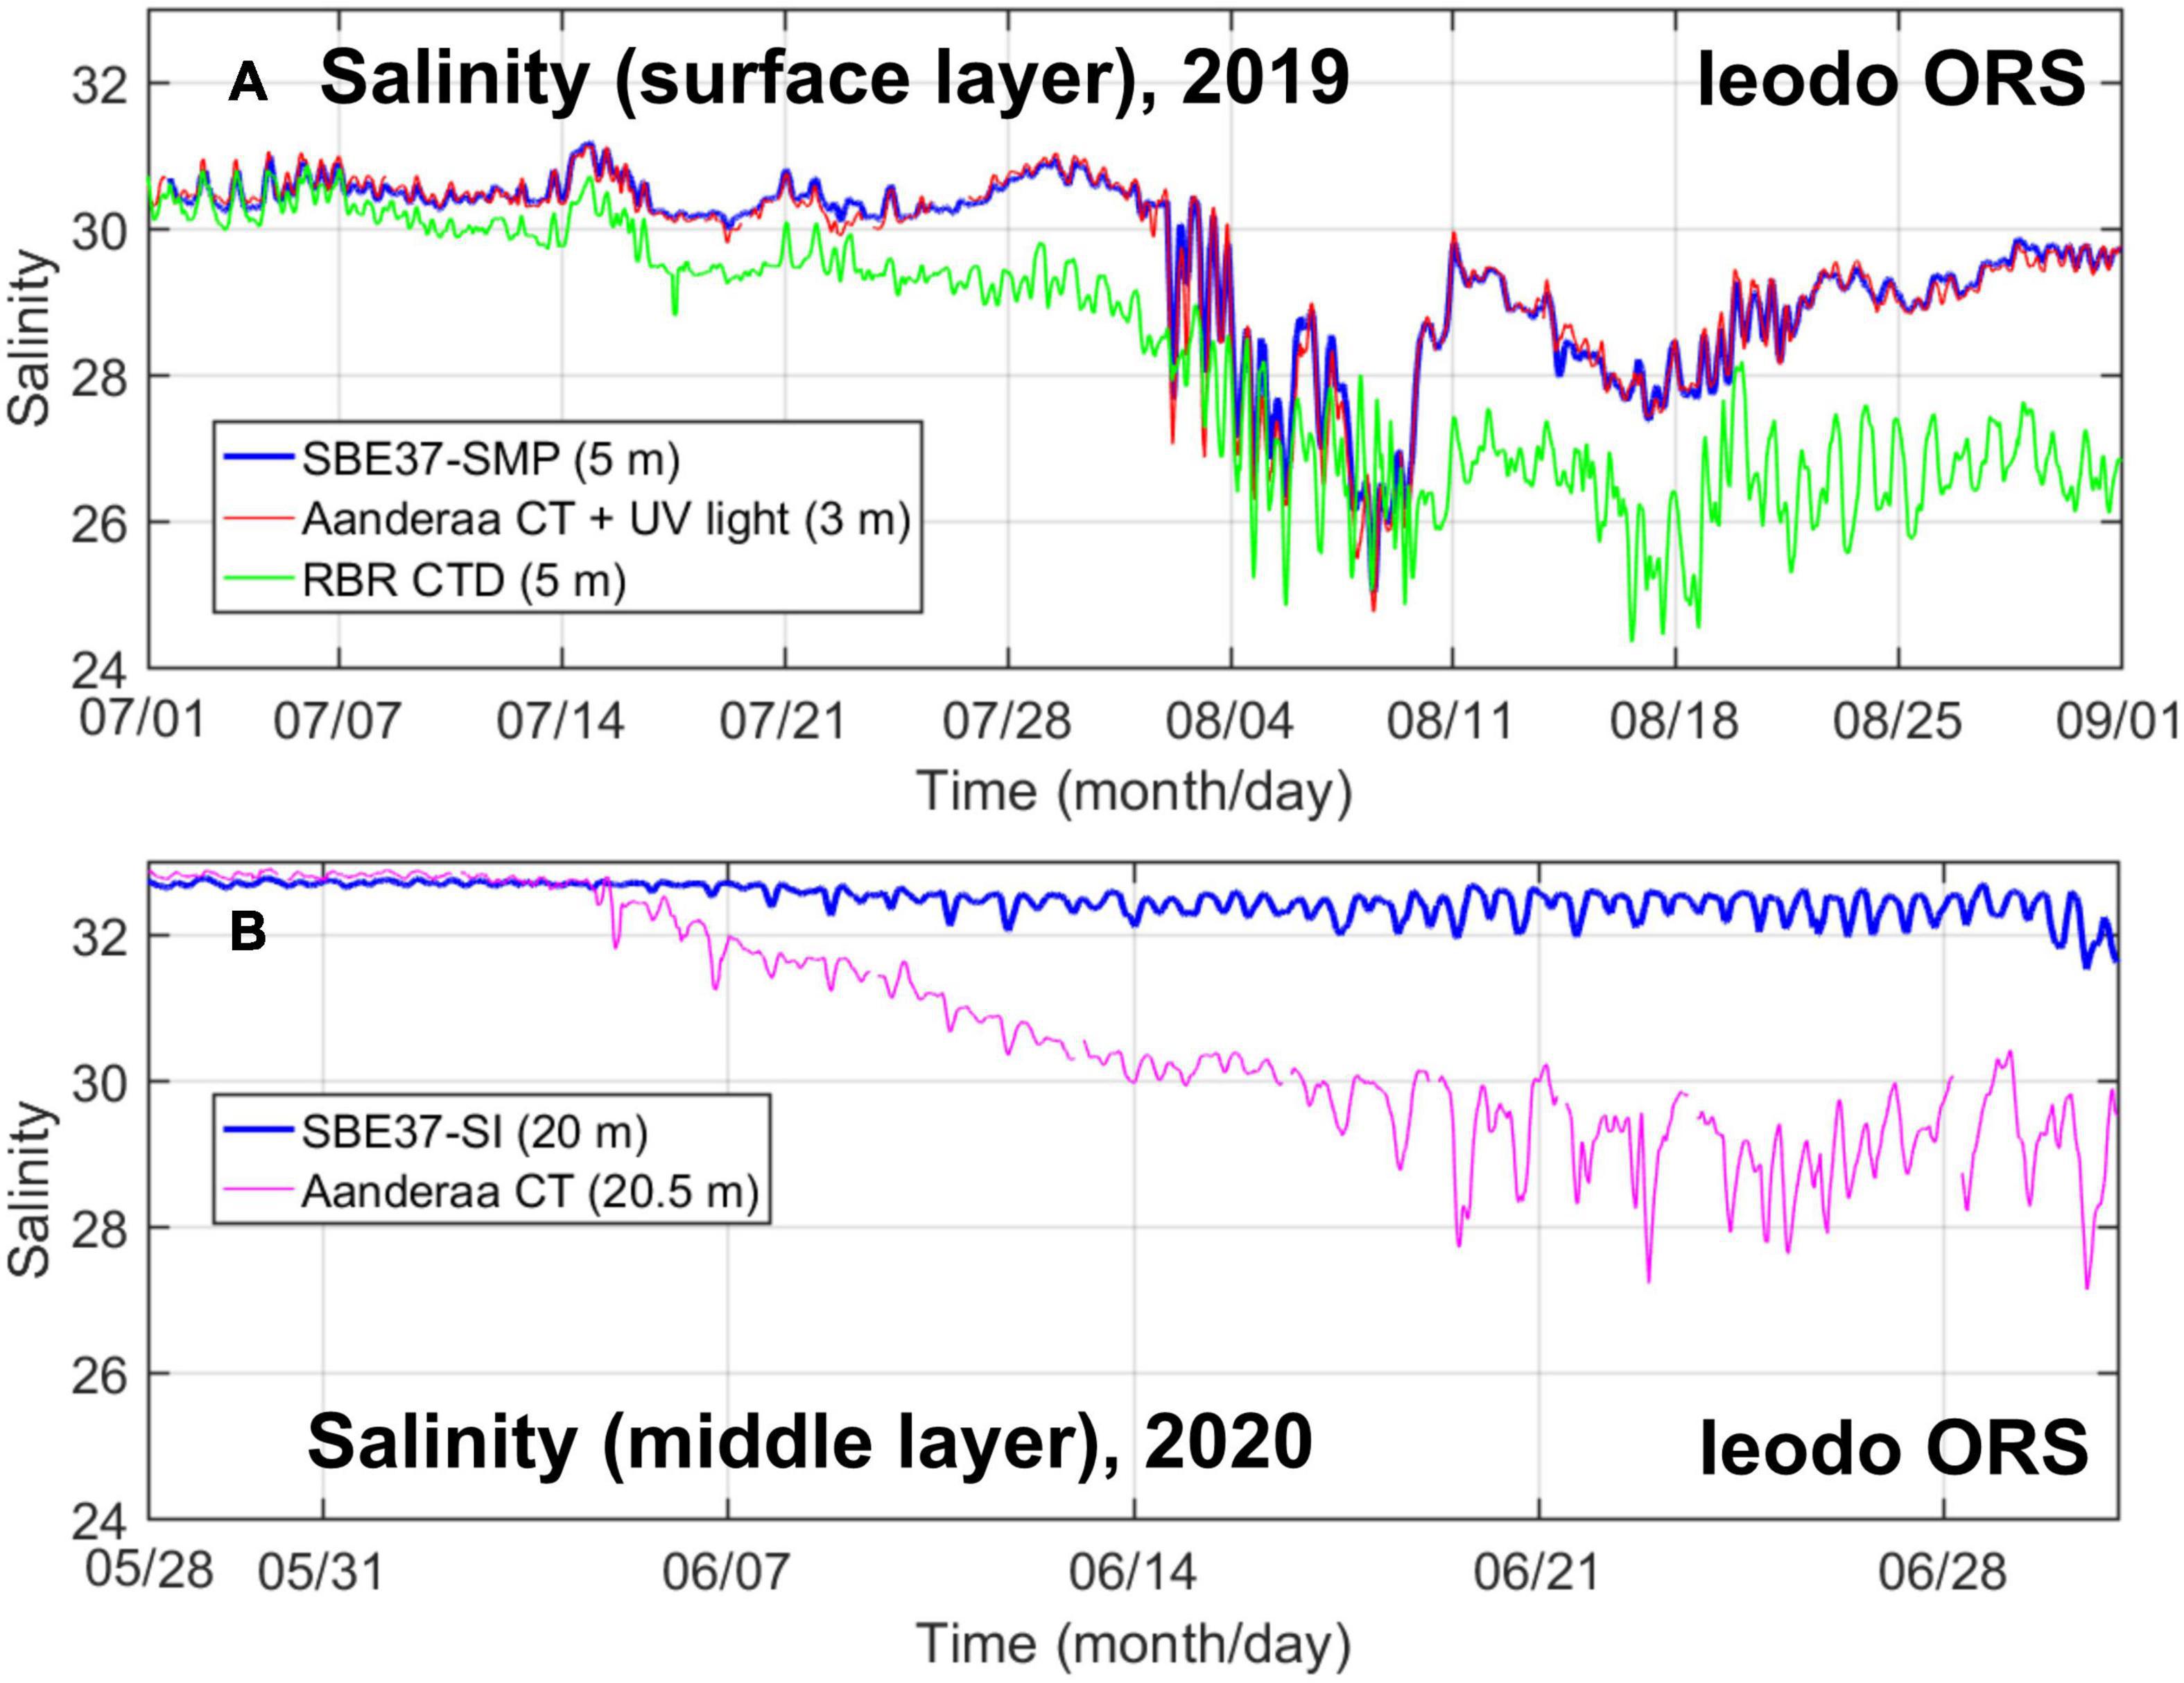
Figure 9. Comparison of Ieodo ORS salinity data time-series measured: (A) in surface layers by a SBE37-SMP (5 m), an Aanderaa CT with UV light sensor (3 m), and a RBR concerto CTD (5 m), from July to August, 2019; and (B) in the middle layers by a SBE37-SI (20 m) and Aanderaa CT (20.5 m), from May 28 to June 30, 2020. Note that the salinity drop during early August 2019 shown in panel (A) was due to the summertime inflow of Changjiang River Diluted Water.
Using data from the summer of 2019, salinity measurements from three conductivity sensors installed in near-surface waters were compared in order to evaluate the accuracy and stability of observations across different sensor types and with anti-biofouling UV light. These were: (i) a conductive and electrode-based CTD sensor (SBE37-SMP) at a depth of 5 m; (ii) an inductive-based CT sensor installed with a UV light generator (Aanderaa CT+UV light) at a depth of 3 m; and (iii) a RBR CTD installed at a depth of 5 m (Figure 8). As shown in Figure 9A, the SBE37-SMP and Aanderaa CT+UV light generator instruments recorded very similar salinity variations throughout the July to August observation period, whereas the RBR CTD recorded lower salinity values except during the initial measurement week. Results clearly reveal that the SBE37-SI and Aanderaa CT+UV light generator deployments were successful in managing biofouling so as to produce appropriate salinity monitoring records. This is consistent with the SBE CTD sensors being an internationally preferred option for long-term moorings, as indicated on the “Ocean Sustained Interdisciplinary Timeseries Environment observation System” (OceanSITES) website. Note that the SBE CTD sensors used EPA approved anti-fouling devices to prevent the growth of marine organisms inside the sensors. Based on this evaluation, the Ieodo ORS RBR CTDs installed at depths of 5, 7, 10, 15, and 20 m were all replaced with SBE37-SI CTDs in May 2020.
An additional salinity data quality experiment comparing SBE37-SI and Aanderaa CT sensor observations from mid-layer waters (i.e., at a depth of ∼20 m) was conducted in the summertime of 2020 in order to examine the effects of anti-biofouling UV light generators. Comparisons between SBE37-SI and Aanderaa CT results gathered with and without the use of UV light generators showed that salinity values recorded by the Aanderaa CT (without UV light protection) were significantly reduced due to biofouling from 9 days post sensor maintenance onward (Figure 9B). This result confirms the usefulness of UV light generators as an effective and necessary tool for preventing organism growth on sensors.
In summary, the relatively small Aanderaa and RBR CTD sensors are more durable and reliable in the high wave energy regime of Ieodo ORS compared to larger SBE CTD sensors. In spite of this and in terms of biofouling, SBE CTD sensors with anti-fouling devices perform better than Aanderaa CT or RBR CTD sensors, particularly during summertime. However, the Aanderaa CT and RBR CTD sensors’ vulnerability to biofouling can be overcome with the use of anti-biofouling UV light generators.
Note that, as with platform related wind distortion (Schlundt et al., 2020), large structures can distort ocean currents in their vicinity, leading to a measurement bias. This effect may, in turn, affect ocean properties locally (e.g., temperature and salinity) such that careful seasonal comparisons between Ieodo ORS and the ambient area are required to identify whether these observations are representative, without substantive distortion. The ocean properties measured at Ieodo ORS are likely to be strongly controlled by ambient physical processes, as shown in Figure 6 and Supplementary Figure 2. Thus, a crucial next step is needed to investigate how representative the measurements are in terms of spatial coverage.
The current rate of increase in ocean acidity worldwide is higher than any natural changes in the past records. Therefore, the scientific community and society at large are increasingly concerned about the effects of this acidification on marine ecosystems and their organisms (Feely et al., 2008; Cai et al., 2011; Kwiatkowski and Orr, 2018). However, the effects of atmospheric CO2 inputs on the acidification of the open ocean are not easily or directly translatable into coastal environment effects. In response to the growing concerns about ocean acidification, the KHOA together with Pohang University of Science and Technology (POSTECH) began the continuous measurements of seawater pH at Ieodo ORS in November 2018.
Taking into consideration the mean spring tide range (∼1.9 m) and wave action at Ieodo ORS, a SeapHOxTM pH sensor package has been deployed at a depth of 5 m (Figures 3C, 8). This package combines the Satlantic SeaFETTM pH sensor with the Sea-Bird Electronics SBE 37-SMP-ODO MicroCAT CTD+DO sensor (Figure 10A). Thus, the SeapHOxTM package allows for the integrated collection of pH data, along with the critical oceanographic and biological measurements of temperature, salinity, and oxygen. The integrated package also allows the SeaFET to take advantage of the SBE 37’s expendable anti-fouling devices, unique flow path, and pumping regime for bio-fouling protection, extending deployment durations in some cases. The pH sensor is an Ion Selective Field Effect Transistor (ISFET) type.
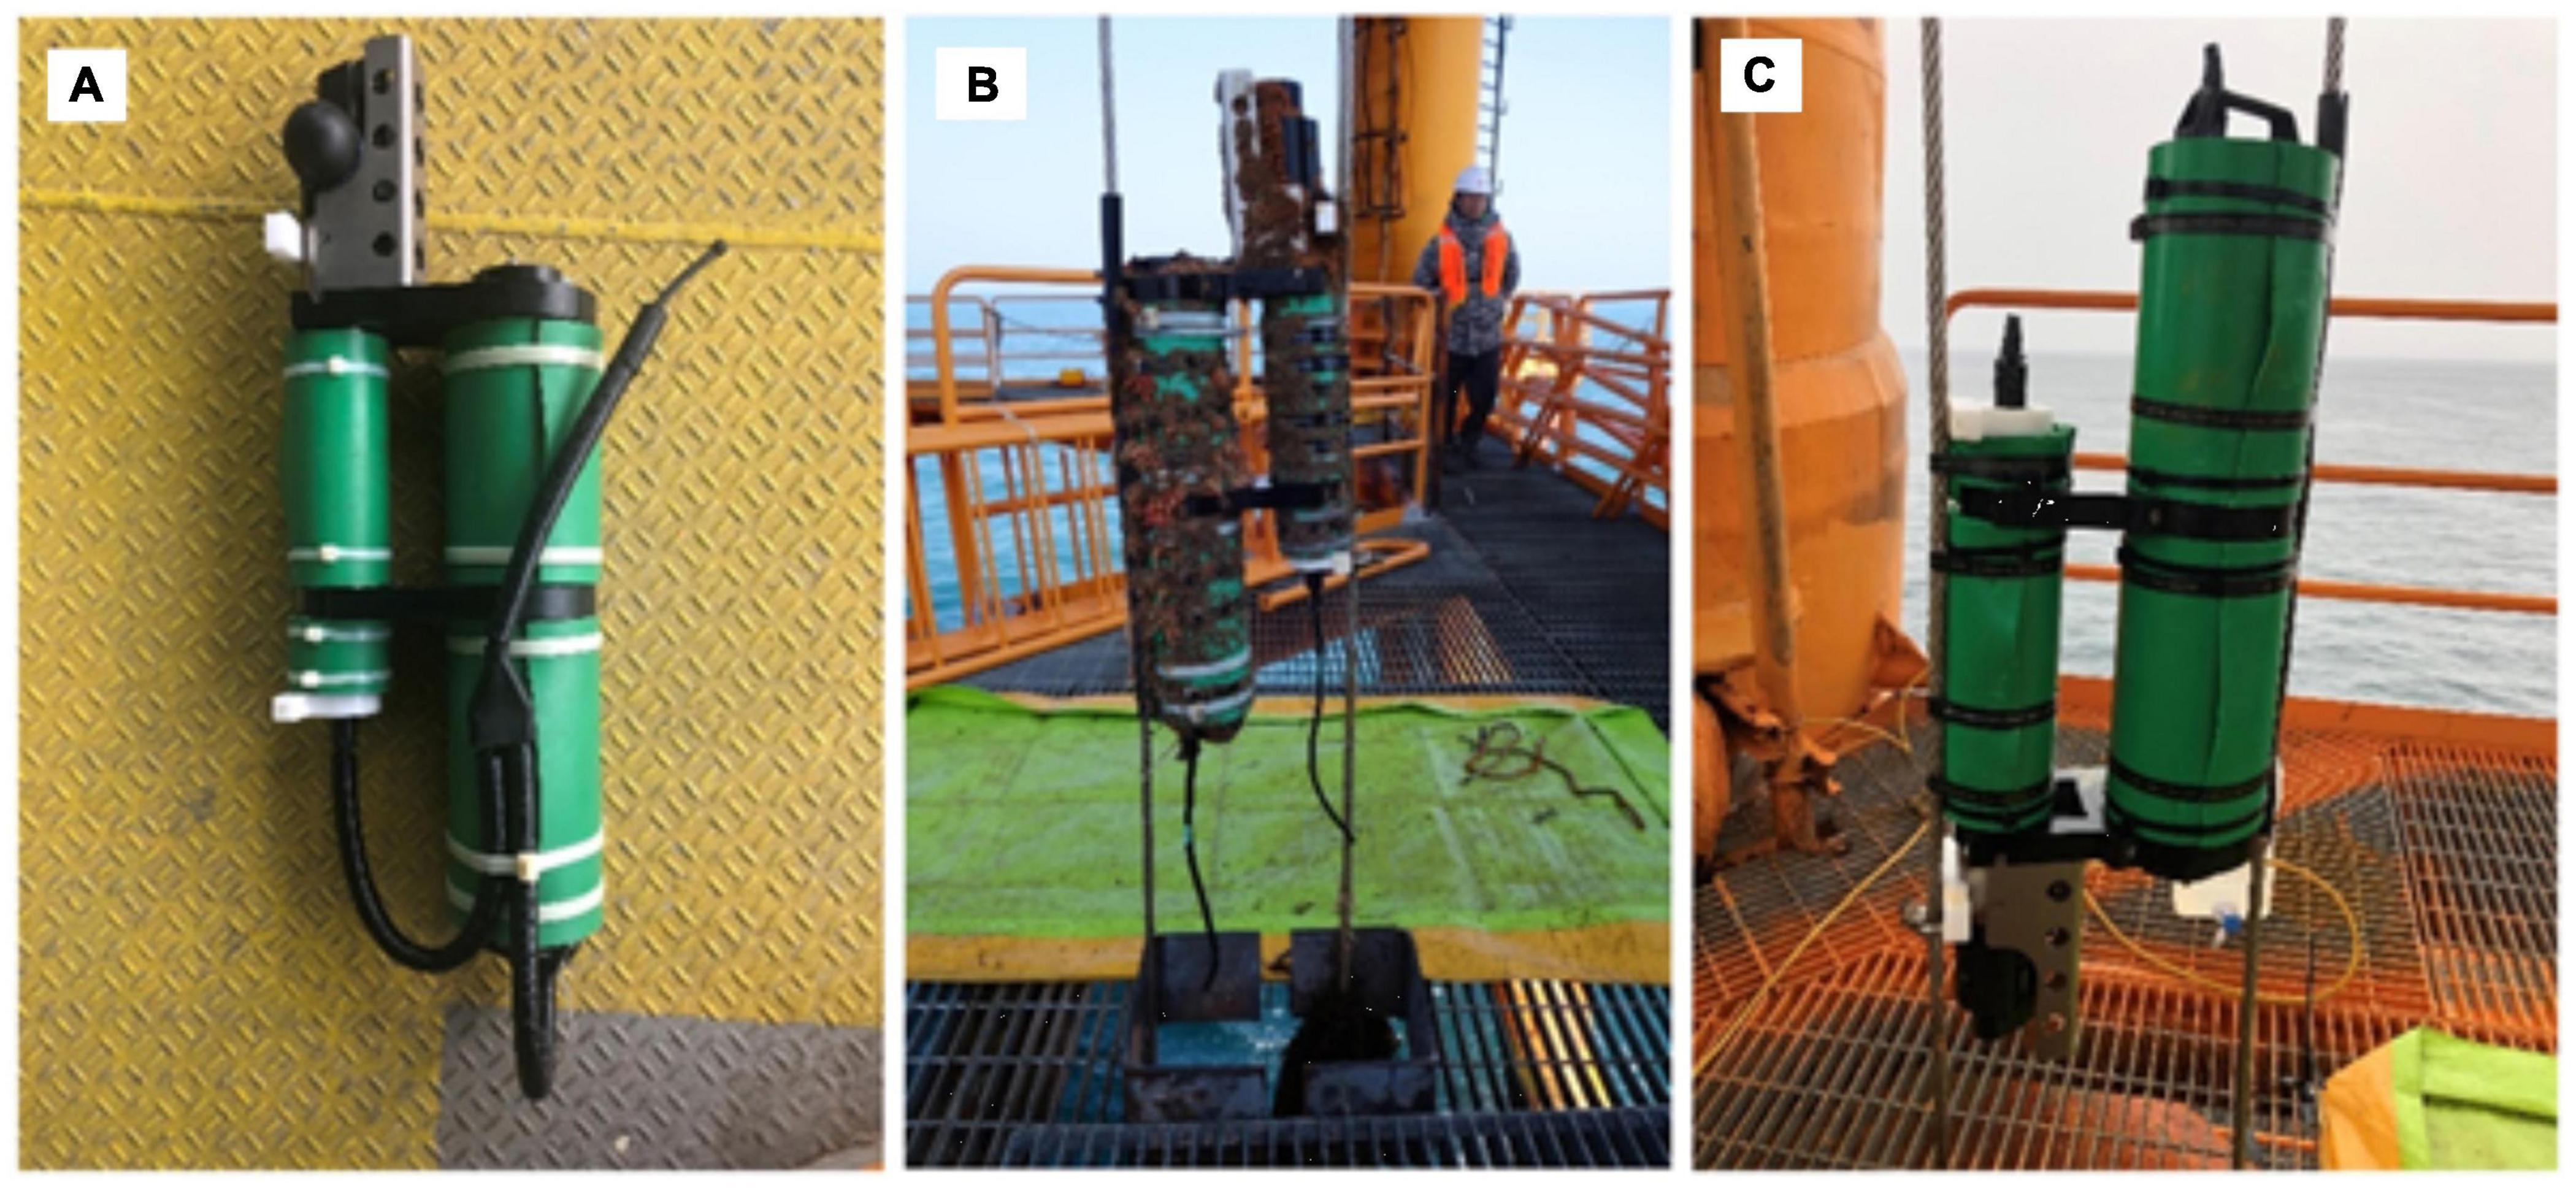
Figure 10. (A) The pre-deployment SeapHOxTM system, comprising two sensor units connected via a Y-cable; (B) the post-deployment SeapHOxTM system, with a broken Y-cable; (C) the disconnected SeapHOxTM system, without a Y-cable, ready for re-deployment.
In the remote and highly turbulent Ieodo ORS environment (Figure 2), the pH sensor package initially experienced several failures, experiences which provided valuable lessons for ensuring the future acquisition of accurate data over periods of more than several months. Seawater pH was initially monitored for 10 months, between November 2018 and September 2019. A major malfunction affected the instrument package over this entire deployment—a break in the Y-cable (Figure 10B) that enables communication between the two sensors, measuring seawater temperature and salinity, and measuring seawater pH. Under normal operation, the pH sensor receives seawater temperature and salinity data via this Y-cable and then transforms electrical signals into seawater pH using an algorithm that relates the electrical signal data to the salinity and temperature data. When this Y-cable broke in stormy conditions, pH data were subsequently not recoverable because of the loss of temperature and salinity measurements, which are critical for converting electrical signals to pH values.
To reduce the chances of data loss, for the second deployment, we intentionally disconnected the Y-cable (Figure 10C) in such a way that each sensor unit was programmed to save its own data, with the two datasets (data on pH signals and on temperature and salinity) subsequently merged following the recovery of the SeapHOxTM system. The pH data obtained using the SeapHOxTM are subject to errors caused by biofouling. Albeit a limited comparison, we evaluated the effect of bio-fouling on our pH data by comparing the sensor-based pH data (senor pH) with spectrophotometric pH values (measured pH) from seawater samples collected concurrently from the SeapHOxTM location. We found a <0.01 pH difference between the two pH measures, based on two sampling events (Figure 11A), and no significant difference was also found in the salinity and temperature for these same sampling events. Our study indicated that the SeapHOxTM system anti-fouling technology was effective for at least 2 months without cleaning during the highly productive summer months (April–September). For winter deployments, these anti-fouling devices were effective for 4–6 months.
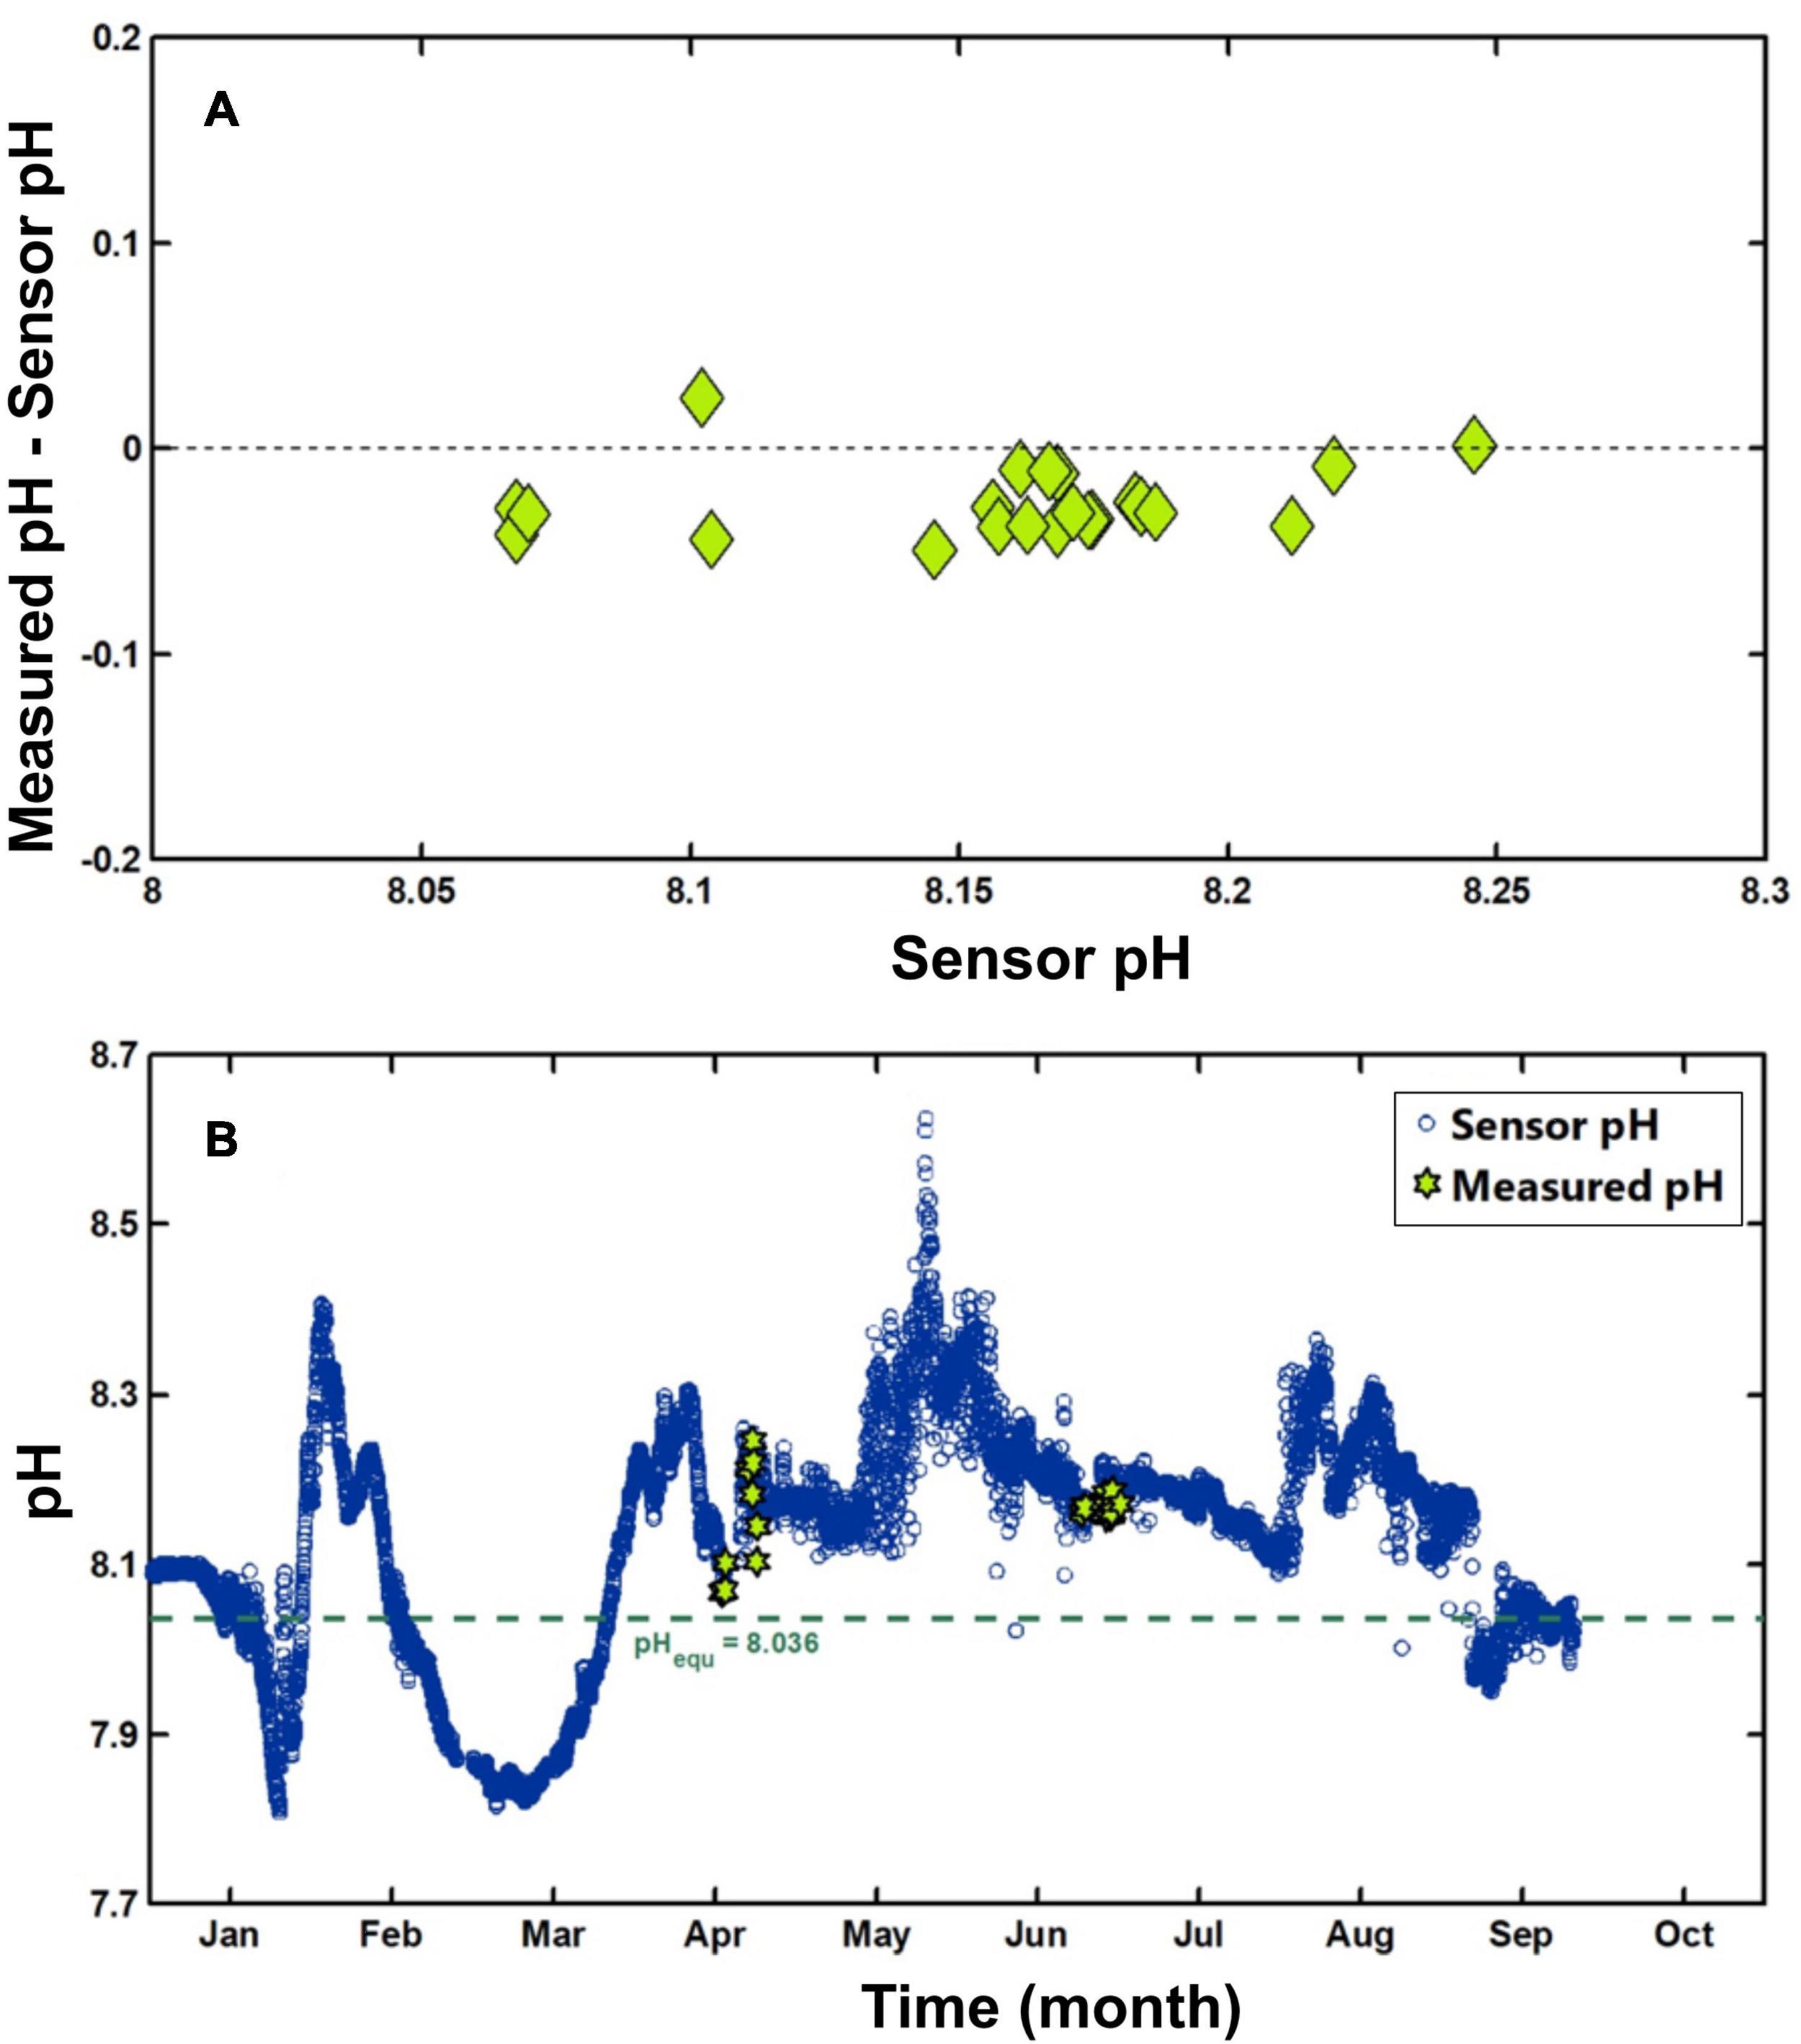
Figure 11. (A) Comparison between sensor-based pH measurements (senor pH) and spectrophotometric pH values (measured pH) on the same set of discrete samples. (B) Continuous pH measurements made at Ieodo ORS from January to September 2019. The green dashed line indicates a pH value in equilibrium with the concurrent global mean atmospheric pCO2 of 412 ppm. Green stars indicate discrete pH data based on spectrophotometry using m-cresol purple.
The continuous seawater pH records revealed several key features of the waters surrounding Ieodo ORS (Figure 11B). The most notable feature was an elevated surface pH from April to the end of September. During this period, surface pH remained higher than expected if levels were in equilibrium with the current global mean atmospheric CO2 concentrations (i.e., pH = 8.036 is in equilibrium with 412 ppm atmospheric CO2 concentrations). The elevated pH was largely explained by the sustained presence of high phytoplankton biomass during this period, that is, continuous nutrient inputs into the waters surrounding Ieodo ORS, via the Yangtze (Changjiang) River and regional atmospheric emissions, were a major driver of sustained phytoplankton biomass, which in turn increased seawater pH via the removal of inorganic carbon from the seawater. By contrast, from autumn to early spring, surface pH dropped to levels lower than would be expected if in equilibrium with the global mean atmospheric carbon concentrations (i.e., pH = 8.036), with this drop due to an increased turbulence bringing low-pH, deep waters to the surface. Our observations show that continuous pH measurements are needed to more fully understand the dynamics of ocean water acidification in response to human influences.
Ieodo ORS is situated a reasonable distance away from atmospheric emission sources in China, Korea, and Japan (Figure 1A). This location is also influenced by the East Asianwinter and summer monsoons, experiencing a distinct seasonal contrast in the prevailing wind (i.e., winter north-westerlies and summer south-easterlies). Notwithstanding its ideal geographic location for measuring the background levels of air pollutants, the remoteness and difficulty in accessing Ieodo ORS hinders the frequent replacement of air filters beyond the typical duration of a research visit.
To overcome this practical problem, several solutions were considered. Firstly, an aerosol sampler with an automatic filter changing system can be used for longer-term sample collection experiments (Figure 12). In this context, we used a low volume air sampler (SEQ47/50, Leckel GmbH, Germany) that automatically replaces filters (up to 17 times) at programmed time intervals (Lee et al., 2017a). This air sampler operates at a flow rate of 1.002 m3 hr–1 with a 10 μm cut-point impactor-type inlet. Because of its low flow rate, it is recommended that this instrument continuously traps aerosols over a 3–7-day period per sample. Samples were collected on acid-cleaned 47 mm, 2 μm pore size Teflon filters, designed to trap particles ranging in size from 10 to 2.5 μm (PM2.5 Membrane, TISCH). For our monitoring procedure, the sampling duration was set at 96 hr per sample for the period from mid-April to late November, and at 168 hr per sample for the period from late November to mid-April. The longer sampling duration (168 h) during late November to mid-April was employed since Ieodo ORS does not allow personnel transport during this time, due to unfavorable weather conditions, making filter replacement impossible for this duration. The sampler system is programmed to collect week-long samples, interspersed by 3-day sampling breaks, enabling a consistent sampling program for the duration based on the instrument’s 17 available filters.
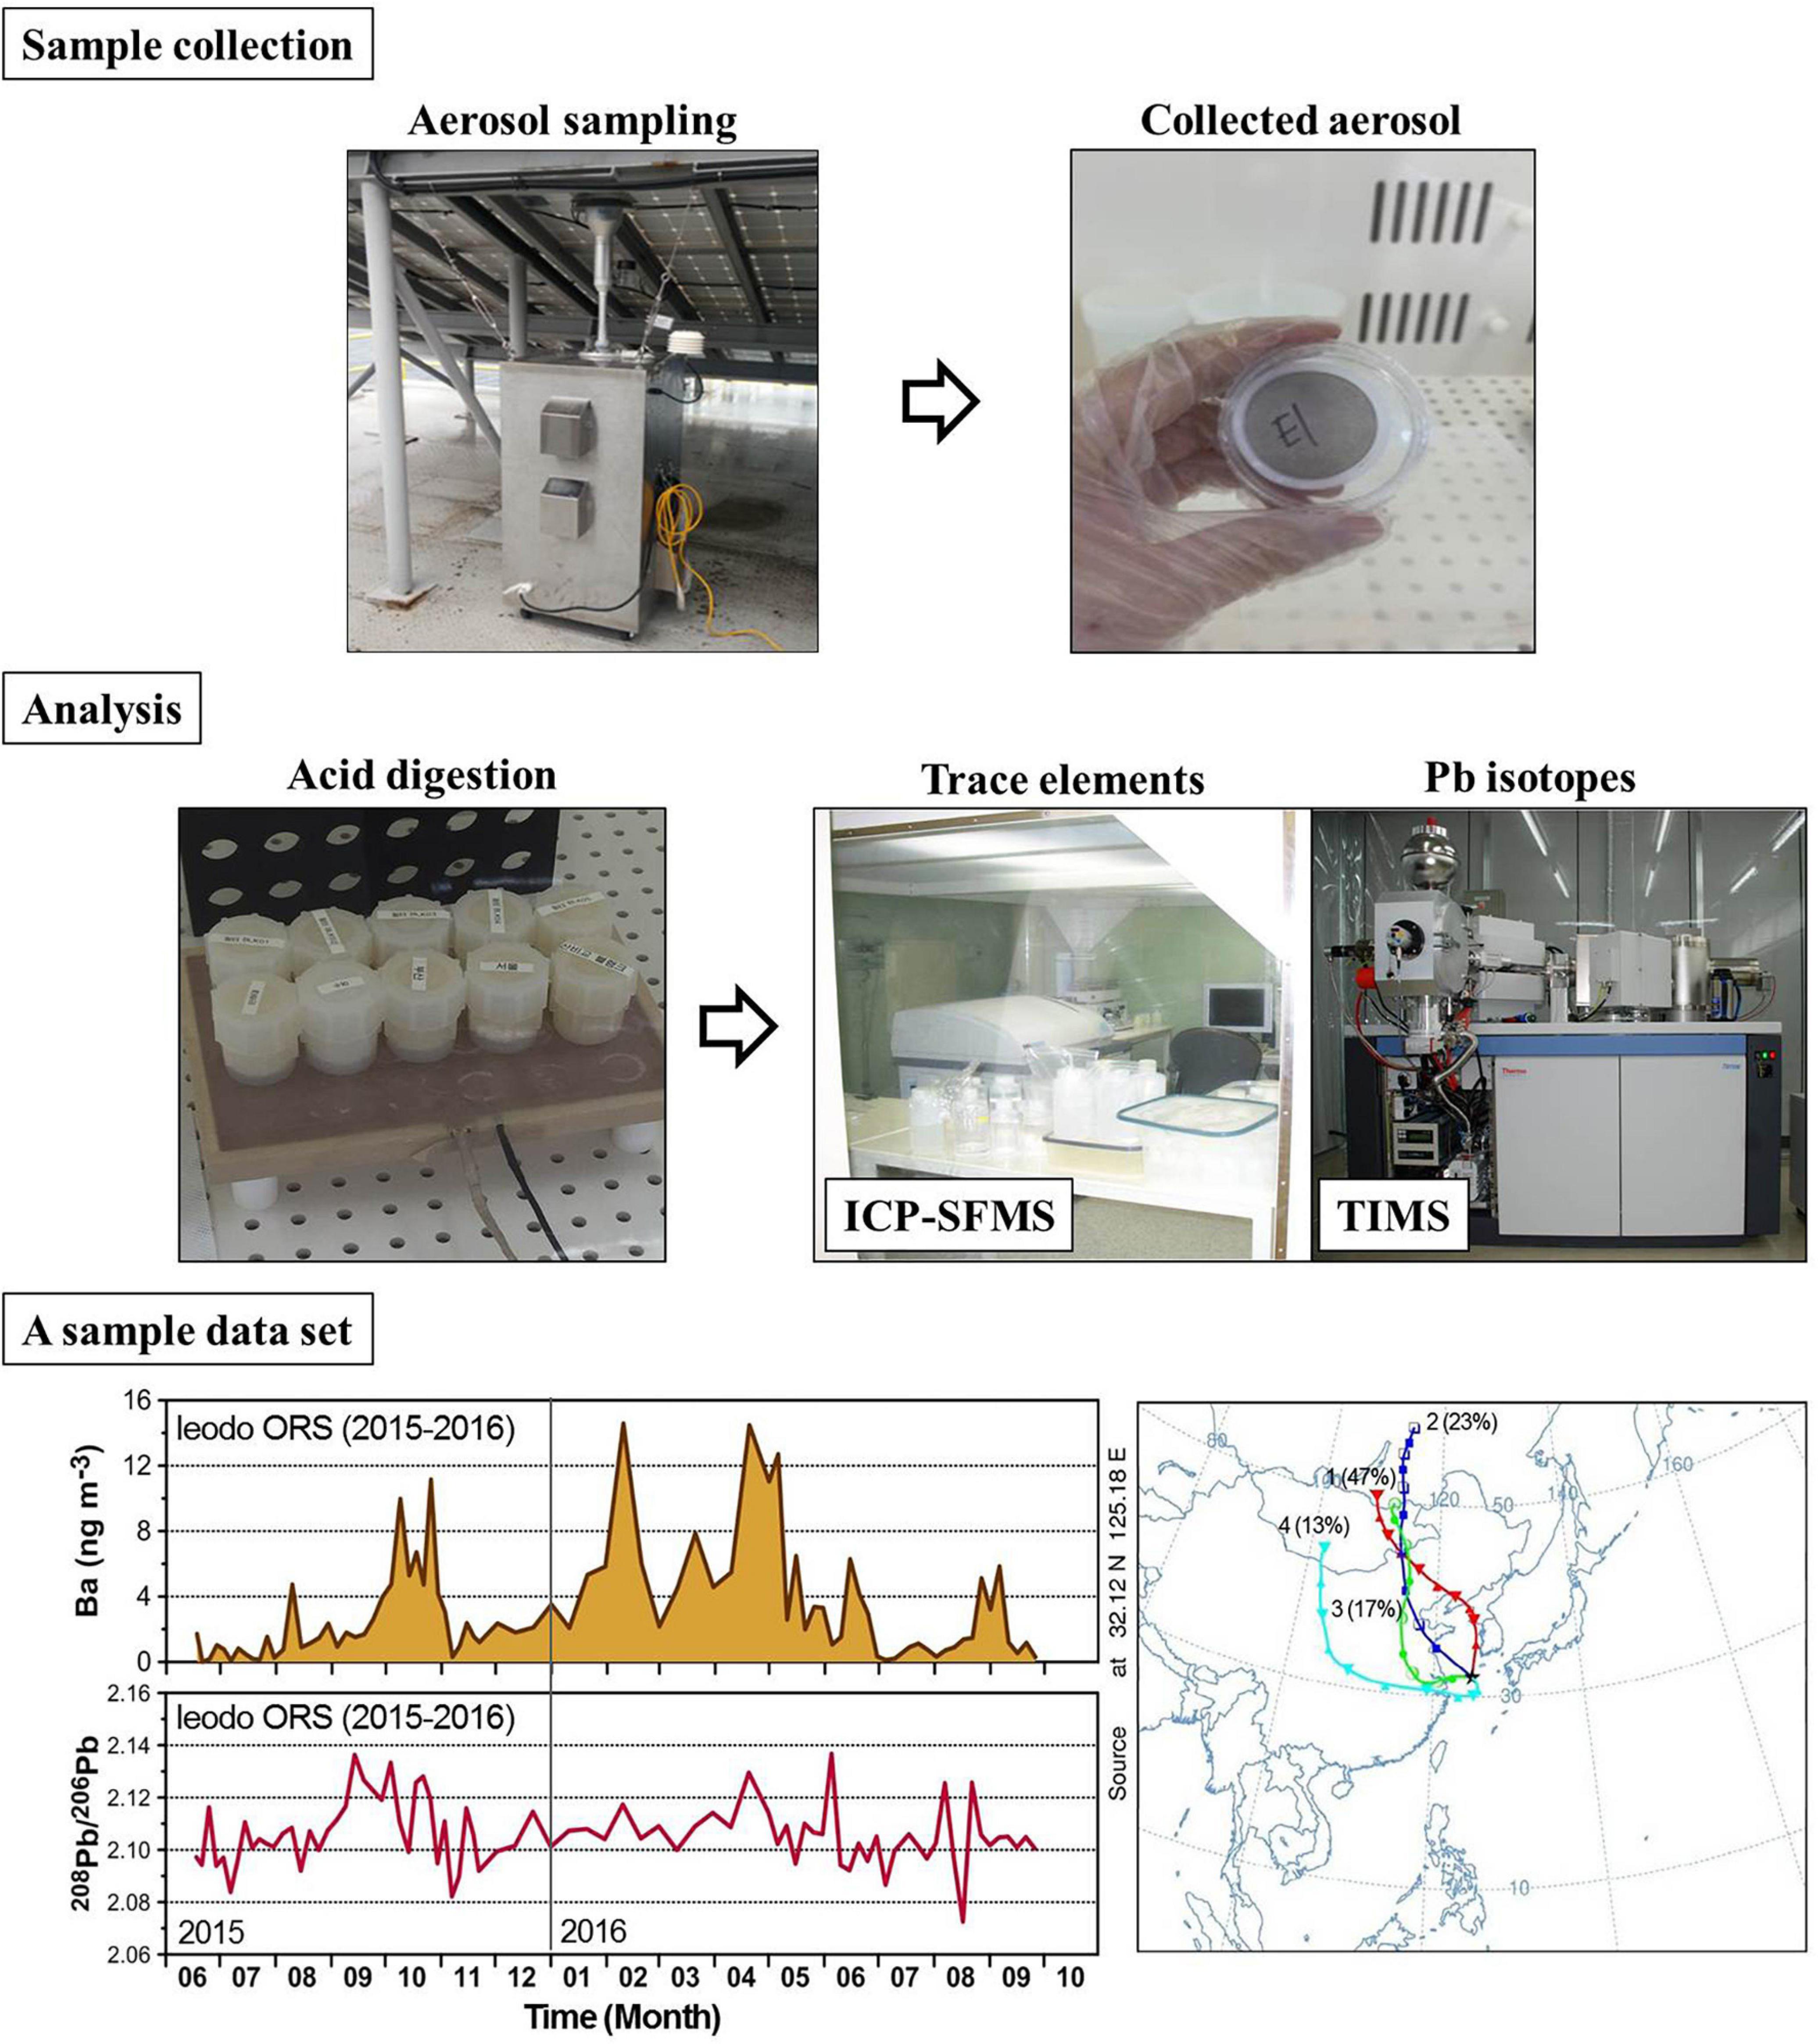
Figure 12. A schematic showing aerosol collection, analysis of the samples, and an example data set (Ba concentration and 208Pb/206Pb ratios) from samples collected between June 18, 2015 and October 1, 2016 and potential source regions estimated by the Hybrid Single Particle Lagrangian Integrated Trajectory (HYSPLIT) cluster analysis of 5-day back trajectories arriving at Ieodo ORS from December 2015 to February 2016.
At Ieodo ORS, ambient trace element concentrations are very low compared to those at land-based monitoring sites, requiring strict quality control for sample handling and analysis. All of the filters were thoroughly acid-cleaned prior to use to minimize and control contamination problems under class 10 conditions, inside a cleanroom laboratory (class 1,000). Detailed analytical procedures are provided in Han et al. (2015).
Although Ieodo ORS is considered to be an ideal site for measuring the background levels of atmospheric trace element pollution in East Asia, the operational and maintenance challenges posed by its remote location for continuous monitoring systems remain a problem. As indicated above, a primary difficulty is that bad weather conditions between late autumn and early spring render access to the ORS impossible—at a time when the prevailing northwesterly wind system results in advective transport of air pollutants from China. The “week on, 3 days off” sampling solution described earlier only partially solves the problem since it reduces sampling frequency and resolution. Additional challenges to the ORS’s use as a continuous, long-term air quality monitoring platform are posed by its location in an area of the northern East China Sea that is frequently affected by typhoons developed in the northwestern Pacific and tracking toward East China, South Korea, and Japan. These typhoons’ high wind speeds are destructive and can cause damage to instruments and samplers installed outdoors. In September 2019, for example, Typhoons “Lingling” and “Tapah” (>30 m s–1 wind speeds, see Figure 2A) passed near Ieodo ORS, damaging the aerosol sampler and halting the sequential sampling operation. Furthermore, the ambient air over Ieodo ORS accelerates the corrosion of sampling equipment due to its high sea salt content, shortening the replacement cycle for instrument components. Since it can take a long time to repair and/or replace damaged instruments, dual sampling devices are strongly recommended for continuous sampling strategies and comprehensive time-series studies.
Finally, the availability of a stable electricity supply is an important controlling parameter for a long-term sequential aerosol sampling at Ieodo ORS. Solar power provides the main ORS electricity supply, with a diesel generator as a backup in case of electricity shortages. The diesel generator also operates for a couple of hours per week in order to power the reverse osmosis seawater desalination system to produce a minimum amount of freshwater for residents during their stay. When generator fuel supply difficulties arise unexpectedly, the backup power supply to equipment could be disrupted, causing intermittent equipment instability and failure. In order to ensure a stable platform for collecting aerosol samples, it is necessary to guarantee a stable power supply that meets the demands of a continuous sampler operation.
Its open ocean location means that Ieodo ORS can serve as an ideal East China Sea radiation observation site. However, the harsh environment poses several equipment and maintenance challenges. Pyranometers, which observe radiation, are necessarily mounted outdoors, with their sensors protected by a hemispherical cover of precision-ground optical glass. In the Ieodo ORS environment, sea salt and aerosol particles can attach to the equipment, distorting the observation data. Another risk is posed by the high waves and winds of typhoons, which can affect equipment equilibria, inducing observation data errors. In addition, the real-time satellite transmission of observation data from Ieodo ORS to the mainland can experience data loss problems due to communication errors. Within the water column, tower shading effects on in-water irradiance and radiance measurements of clear-sky conditions have been studied as a function of the deployment distance (Zibordi et al., 1999). Note that bird roosting has not been reported on Ieodo ORS since its construction in 2003, but occasional seagull droppings have been found around the Heli Deck and on the Roof Deck solar panels.
In order to maintain a robust automated radiation observation system at Ieodo ORS, the following steps are necessary. Firstly, pyranometers must be ventilated since this is a requirement for data inclusion in the Baseline Surface Radiation Network (BSRN). Also, it is necessary to check equipment equilibrium and desiccant state during periodic visits to Ieodo ORS. To respond to data losses or other errors that can arise despite these efforts, periodic management of the automated observation data is needed. Table 1 summarizes these radiation observations challenges and the solutions applied.
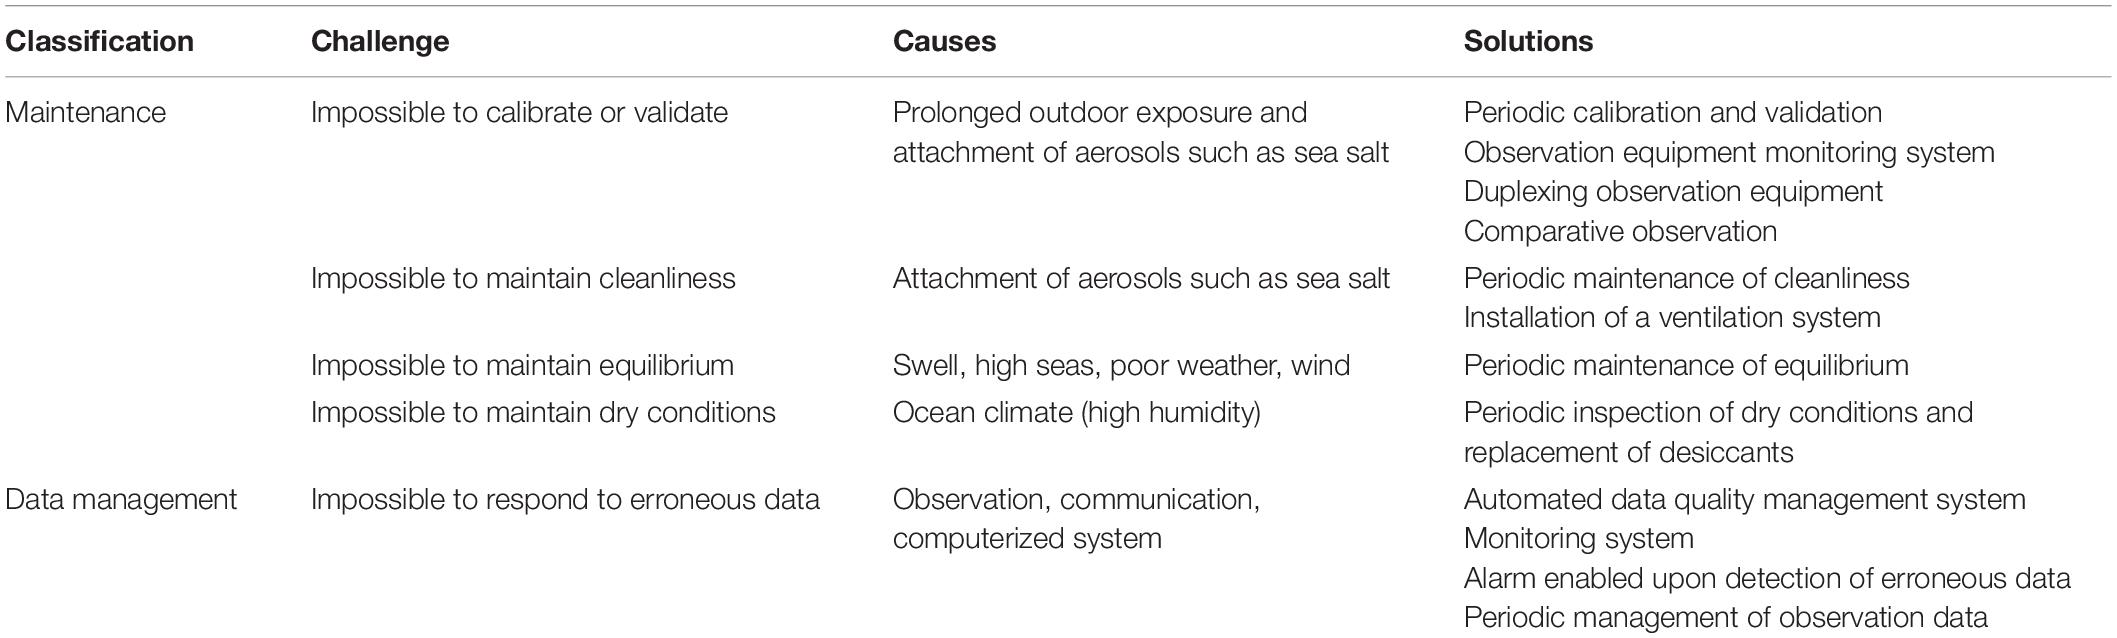
Table 1. Evaluation of challenges in automated radiation observation at Ieodo Ocean Research Station (Ieodo ORS).
In terms of maintenance, problems can occur since the equipment cannot be directly inspected due to the remote geographical location. It is possible to reduce such problems by checking the status of the equipment via a CCTV camera. Furthermore, in terms of data management, real-time monitoring and quality control are necessary to manage received data in an efficient manner.
Various structures, including electric cables and other observation devices installed around the radiation observation station, can obstruct the pyranometer’s field of view. In order to assess and select an optimal sensor site on Ieodo ORS, a radiation observation environmental analysis of existing and two potential pyranometer deployment sites was conducted on October 28, 2019 (Jee et al., 2019a, b). The shade analysis (Figure 13A) was completed as follows: (1) a 3D view camera (Zision, ZS-AC26) was used to take a 360° view photograph immediately next to an existing or potential pyranometer sites (Figure 13B), (2) the photo was converted into an RGB color image (Figure 13C), and (3) data was extracted from the RGB image to plot the altitudes of surrounding devices (i.e., those obstructing the 360° view) (Figure 14).
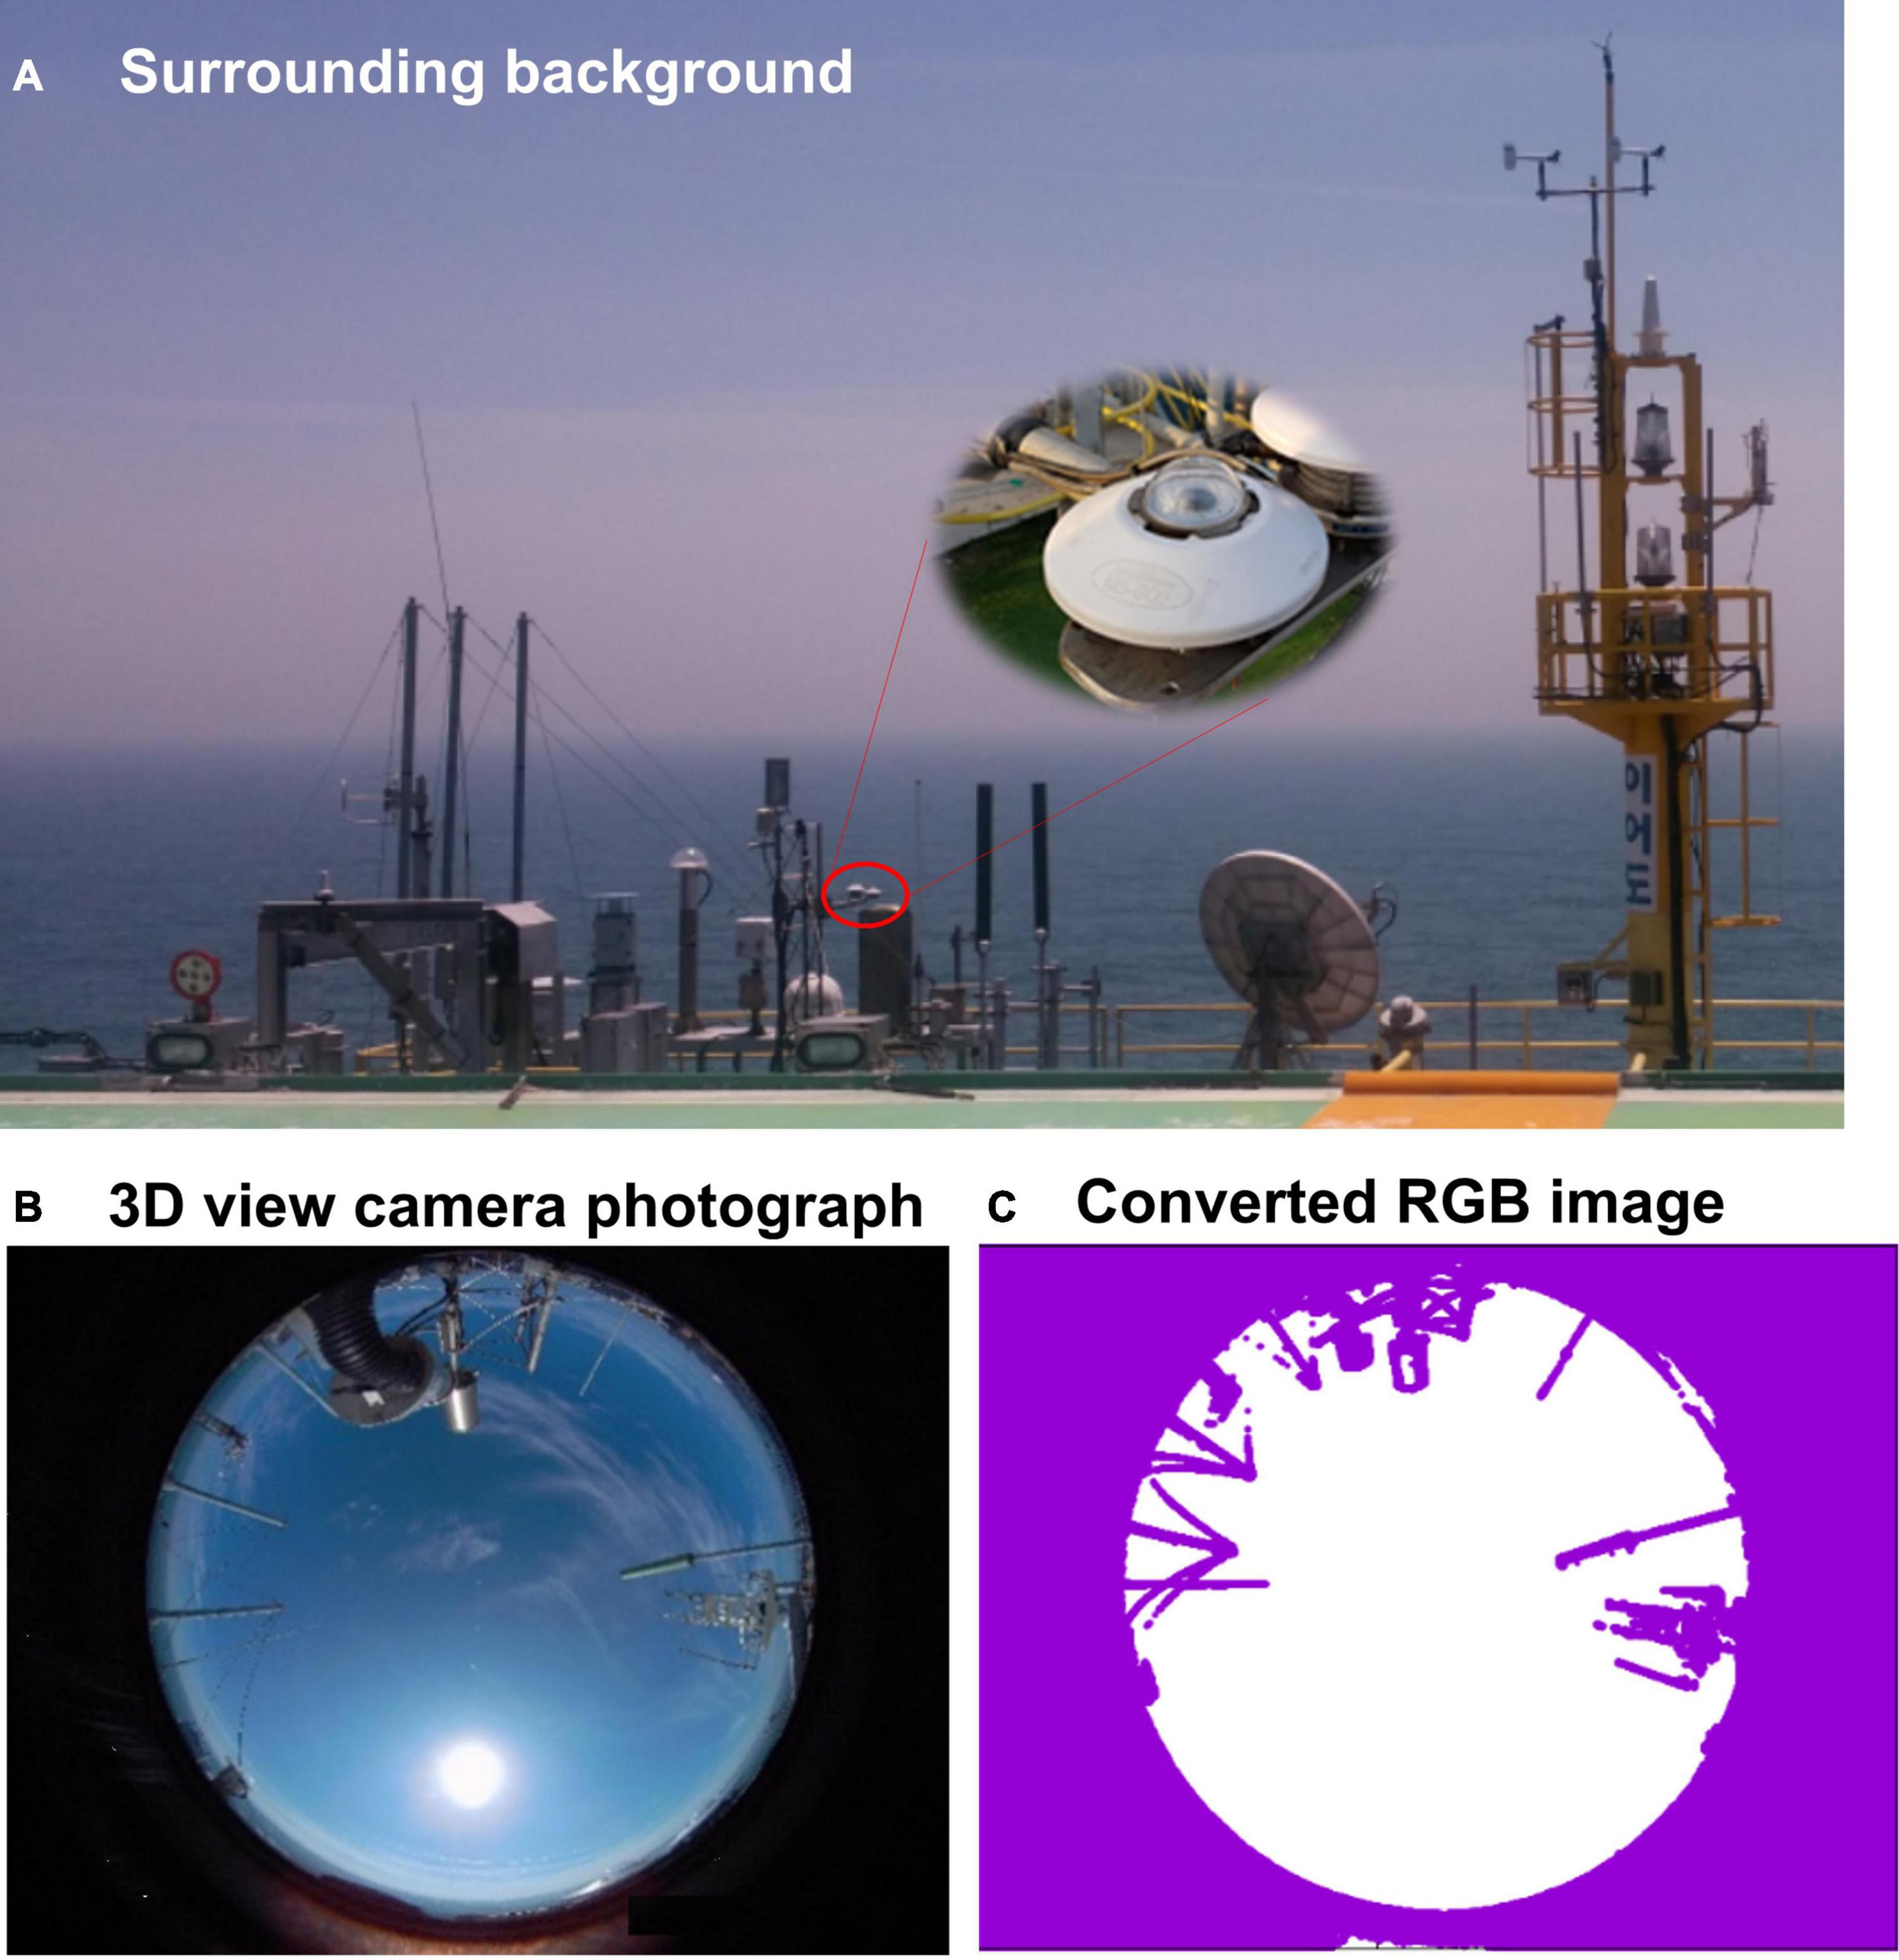
Figure 13. (A) Background view around the radiation observation site and the process of shade analysis using the Ieodo ORS’s 360° view cameras; (B) 360° view camera photograph; and (C) the converted RGB image produced from (B).
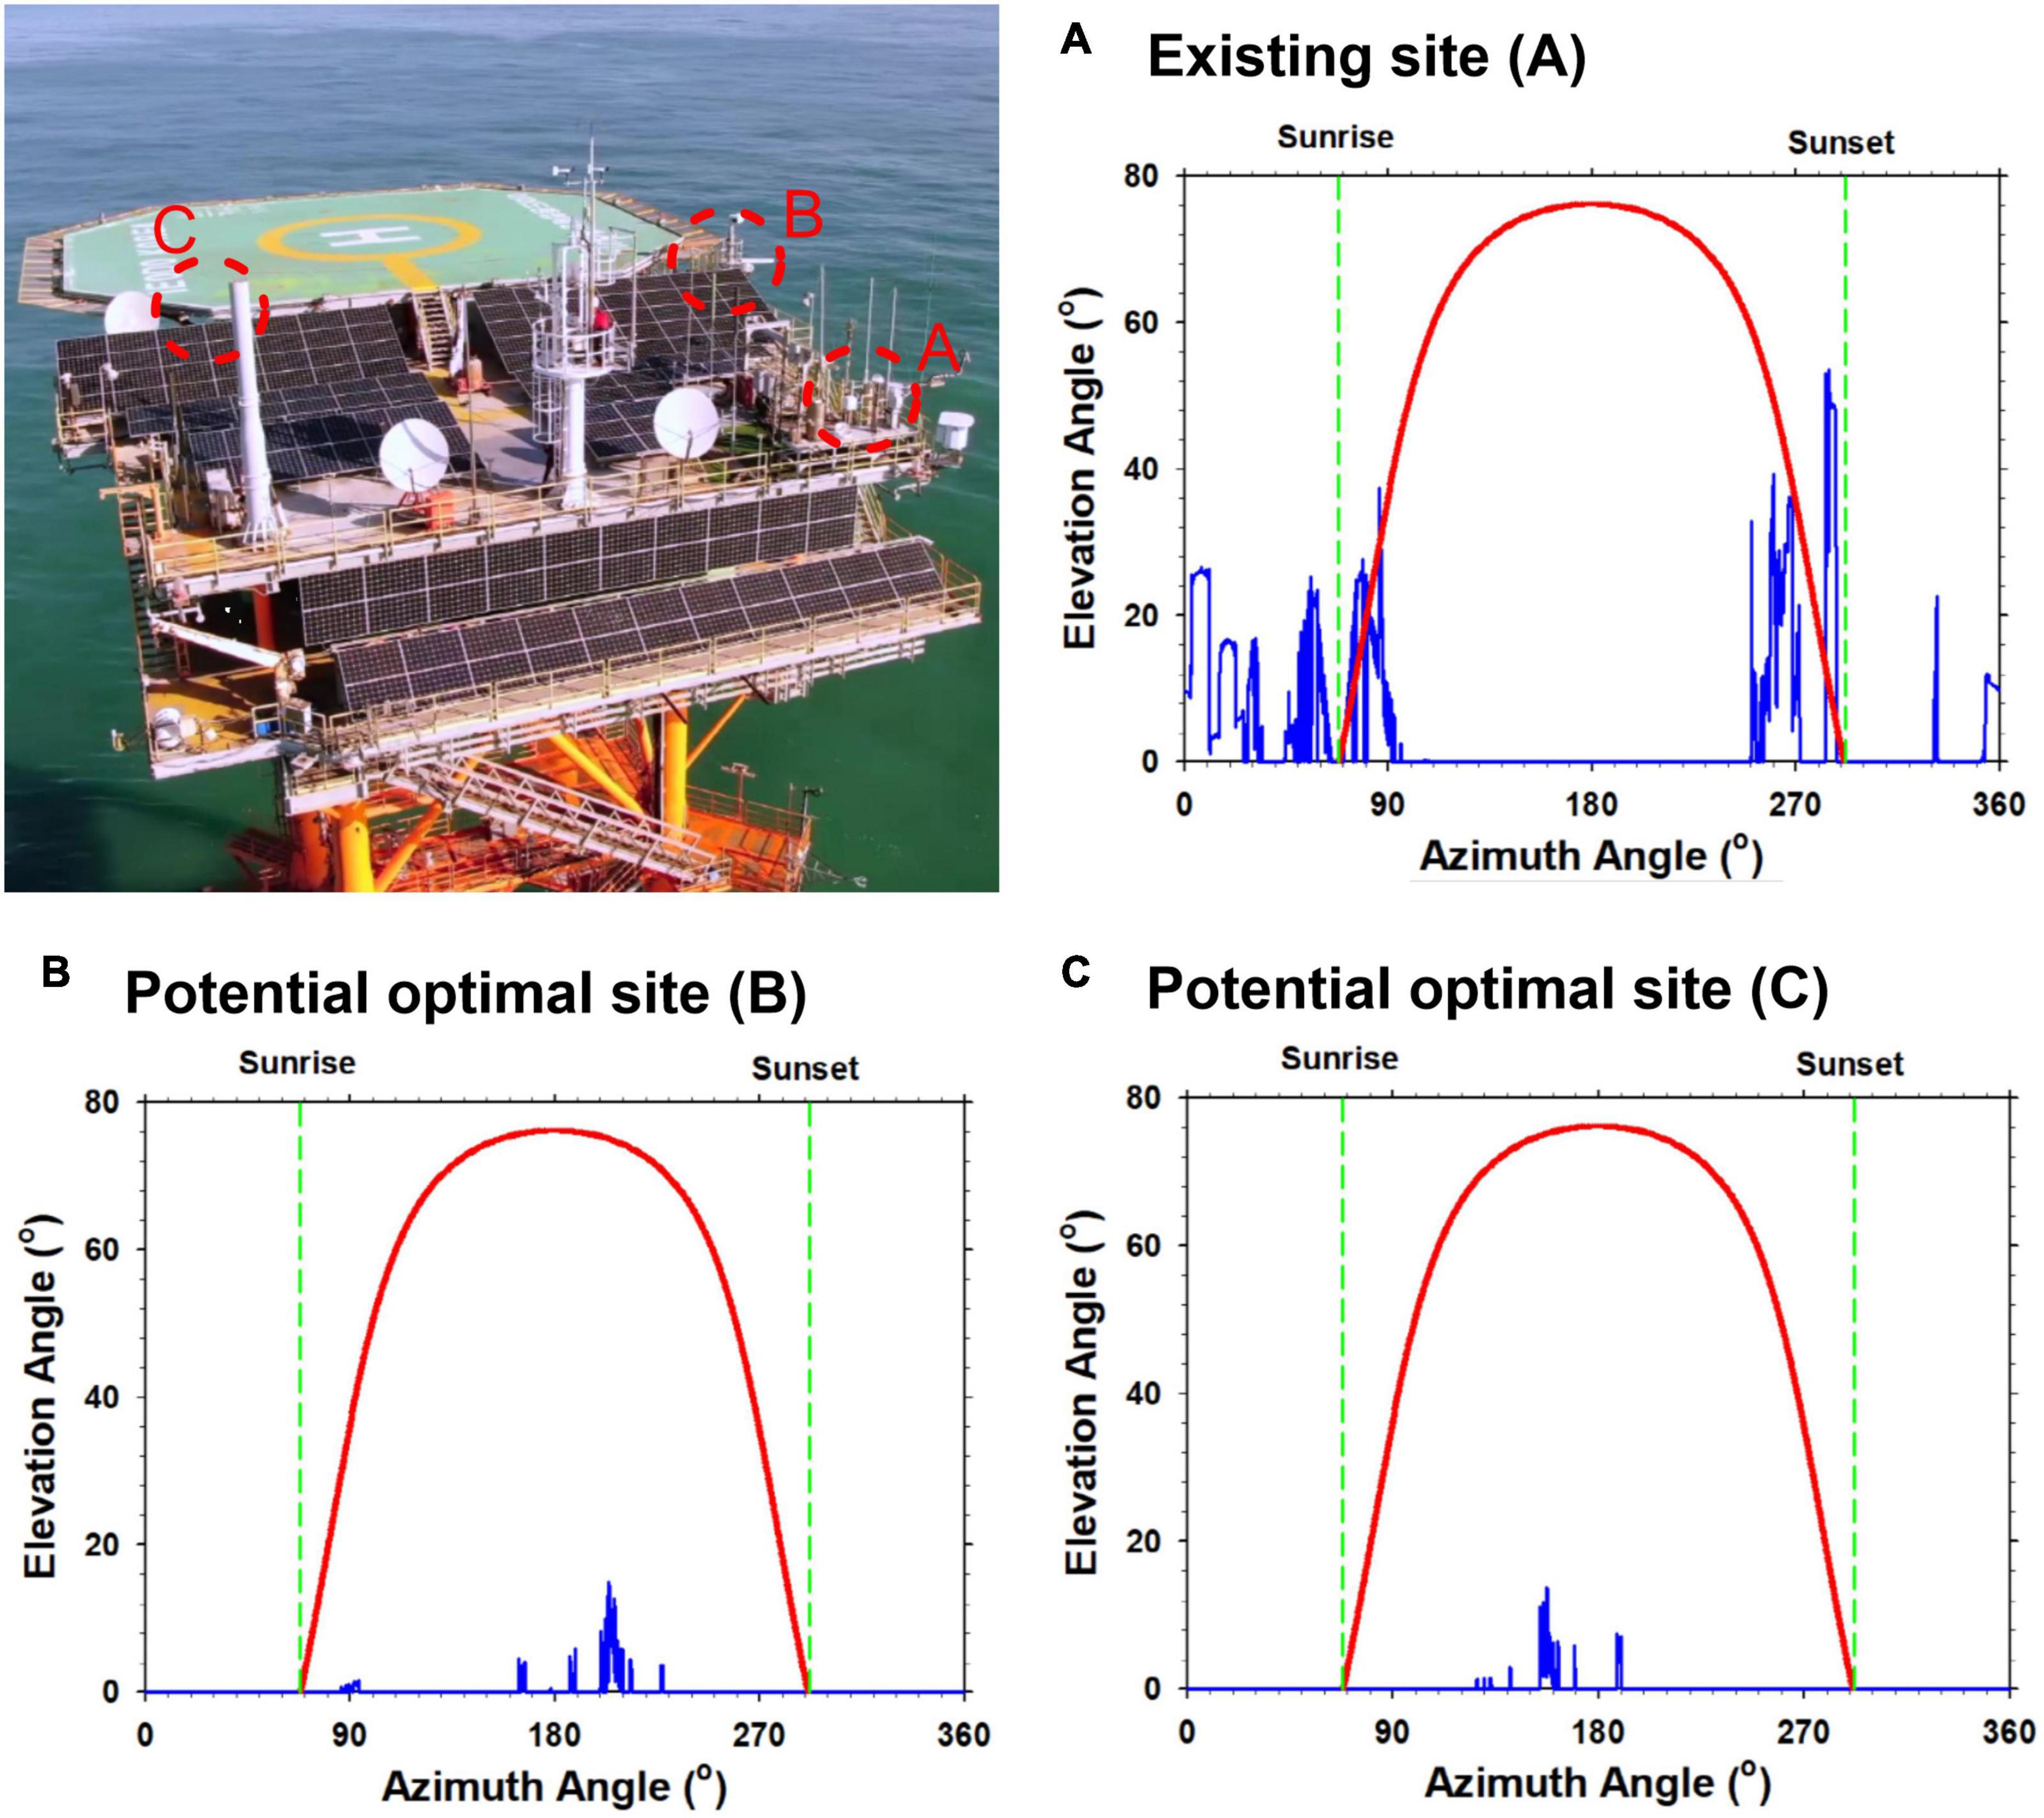
Figure 14. The results of shade analyses for (A) the existing radiation observation site (A) and (B,C) potential optimal sites (B,C) at Ieodo ORS. Blue and red lines in each panel denote the altitudes of surrounding devices’ direct sunlight obstruction effects and of the Sun, respectively, as measured on October 28, 2019. Green dashed lines denote azimuth angels at sunrise and sunset on October 28, 2019.
As shown in Figure 14A, the existing radiation observation sensor on Ieodo ORS was found to be in a suboptimal position (site A) due to surrounding devices obstructing direct solar radiation at times of sunrise (i.e., an azimuth angle of around 80°) and sunset (i.e., azimuth angle of around 280°). When direct solar radiation inputs into a pyranometer are obstructed, this results in large observation value errors. Two new sites (sites B and C) were investigated as possible replacement sites. Shade analysis comparisons (Figure 14) of all three sites revealed that sites B and C experience very little sunlight shading such that direct solar radiation is unlikely to be obstructed around at sunrise or sunset. In conclusion, transferring the existing radiation observation sensor to either site B or site C would produce higher quality observation data. Also, to conform with the BSRN rules (Long and Dutton, 2002), it is necessary to augment the existing pyranometer installation with a pyrheliometer and an infrared radiometer.
This technical work elucidates the various challenges and valuable experiences associated with atmospheric and ocean monitoring in the remote and harsh environment of Ieodo ORS, including how key challenges have been or could overcome through trial and error analyses, and what challenges remain. This paper has evaluated and proposed solutions to the various problems encountered in atmospheric and ocean parameter observation at this open ocean site, so that others may solve such problems in the future and elsewhere with less trial and error.
In relation to making suitable facilities for residential fieldtrips on remote ORS, lessons arise from the Ieodo experience regarding four key infrastructure and data areas: boat landing, electronic power, seawater desalination, and structure evaluation. First, constructing at least a couple of boat landings is recommended for an improved ORS accessibility and safety, since this would permit more flexible responses to current and wave conditions present at vessel arrival and departure times. Second, a stable and sufficient electronic power system should be established, considering both clean energy values and likely future demand with increases in facilities and equipment. Any installations of offshore wind turbines on roof decks as a generation option should be approached with extreme caution since such structures can distort the local wind field, cause excess vibration and noise and, if installed in typhoon prone areas, be easily damaged. Third, to facilitate longer duration stays and frequent researcher visits, a seawater desalination system should be installed so that freshwater can be produced safely in-station. Furthermore, right from the initial design stage of an ORS structure, optimal sensor sites and facilities that meet the observational needs should be at the forefront of considerations. Forth and post-construction, the effects of the ORS structure on oceanic and atmospheric conditions must be measured to evaluate the reliability, representativeness, and quality of the ORS data. This evaluation step can limit platform derived errors leading to measurement bias, something that is of particular concern when seeking to produce long-term regionally representative monitoring records (Schlundt et al., 2020).
Meanwhile, in a global open ocean context, Ieodo ORS represents a rare observation resource and opportunity, since both atmospheric and ocean environment variables are simultaneously and continuously monitored here at a remote distance from land. Atmospheric and ocean data records from Ieodo ORS are shared and distributed through international observation networks. In August 2018, for example, Ieodo ORS was included, along with Shinan Gageocho and Ongjin Socheongcho ORSs (collectively called the Korea Ocean Research Stations or KORS) as a member site in the OceanSITES program. The inclusion of Ieodo ORS recognized this station’s use as a pilot site for exploring both the logistical and scientific connections between open ocean observations and important regional sea and coastal processes.
Key quality controlled, post-processed observation data (temperature, salinity, air temperature, air pressure, wind speed, wind direction and significant wave height, sea level) are publicly available from the KHOA’s website upon user sign up: http://www.khoa.go.kr/oceangrid/gis/category/reference/distribution.do. In addition, real-time observation data are also publicly available: http://www.khoa.go.kr/oceangrid/khoa/koofs.do.
Note that these websites are in Korean. To fit with the OceanSITES data policy, quality controlled 2018 data (i.e., air temperature, air pressure, relative humidity, and CTD) from Ieodo ORS have been uploaded. Also, other Ieodo ORS hydrographic (temperature and salinity) and carbon (pH, total dissolved inorganic carbon, total alkalinity, aragonite saturation state, and pCO2) data were linked to the Global Ocean Acidification Observation Network (GOA-ON) in 2020. These data sharing resources will be continually updated each year.
Ongoing long-term observations of heat flux, wind, SST, pH, and chlorophyll-a at Ieodo ORS will contribute to our understanding of climate and weather changes in East Asia, and help with improving heat flux parameterizations in ocean and atmospheric models. To overcome the access difficulties posed by Ieodo ORS’s remote location, and to continuously produce high quality, useful observation data, new techniques must continue to evolve and be introduced, such as the IoT (the Internet of Things), enabling a better instrument and facility operation and maintenance into the future.
Our mid-term (2021–2025) research aims associated with the KORS projects are to produce the continuous, high quality, observation data needed by researchers studying ocean and atmospheric topics, including climate change and extreme events in the ECS. We also aim to focus on heat flux, including improving its measurement and parameterization in ocean and atmospheric numerical models. Ieodo ORS is expected to provide an observation base for international, interdisciplinary studies of the ocean and atmospheric processes operating in northeast Asia’s marginal seas.
All authors jointly conceived this paper, including the manuscript structure. D-SB led and wrote Sections “Introduction,” “Ieodo ORS Field Trip,” and “Conclusion,” with KL editing these. D-JK, J-YJ, KL, SH, and K-TL wrote individual subsections in Sections “Ocean Environment Monitoring” and “Atmospheric Environment Monitoring,” respectively, with D-SB and KL editing these. All authors read and approved the final manuscript.
This work was supported by the Ieodo ORS field trip program and research grants, both offered by the Korea Hydrographic and Oceanographic Agency (KHOA). J-YJ was also supported by the project titled “Establishment of the Ocean Research Stations in the Jurisdiction Zone and Convergence Research” from the Ministry of Oceans and Fisheries (MOF), South Korea.
The authors declare that the research was conducted in the absence of any commercial or financial relationships that could be construed as a potential conflict of interest.
We are grateful to the KHOA staff members in charge of Korea’s ocean research stations for supporting their research activity and D. Hart at the University of Canterbury for his helpful comments. We also thank two reviewers for their useful and constructive comments that helped us to improve the manuscript.
The Supplementary Material for this article can be found online at: https://www.frontiersin.org/articles/10.3389/fmars.2021.618500/full#supplementary-material
Supplementary Figure 1 | (A) Plan view of Roof Deck of Ieodo ORS, where meteorological instruments and sensors are installed, and (B) photos of the instruments and sensors installed in Light pole, meteorological broken tower, and around them.
Supplementary Figure 2 | Comparison of vertical temperature structures between RBR installed in Ieodo ORS (Figure 8) and cruise conducted CTD within a radius of 8 km from Ieodo ORS at (A) IE11 (03:21 August 30), (B) IE14 (06:31 August 30), and (C) IE20 (11:07 August 30) in 2018.
Beardsley, R., Limeburner, R., Yu, H., and Cannon, G. (1985). Discharge of the changjiang (Yangtze river) into the East China sea. Cont. Shelf. Res. 4, 57–76.
Byun, D.-S., Kim, Y. W., Lee, J. Y., Lee, E. I., Park, K.-A., and Woo, H.-J. (2018). Converting Ieodo Ocean Research Station wind speed observations to reference height data for real-time operational use. J. Korean Soc. Oceanogr. 23, 153–178.
Cai, W. J., Hu, X., Huang, W. J., Murrell, M. C., Lehrter, J. C., Lohrenz, S. E., et al. (2011). Acidification of subsurface coastal waters enhanced by eutrophication. Nat. Geosci. 4, 766–770. doi: 10.1038/ngeo1297
Cavaleri, L. (2000). The oceanographic tower Acqua Alta – activity and prediction of sea states at Venice. Coastal Eng. 39, 29–70.
Cho, C., Nam, S. H., and Song, H. (2016). Seasonal variation of speed and width from kinematic parameters of mode-1 nonlinear internal waves in the northeastern East China Sea. J. Geophys. Res. 121, 5942–5958.
Choi, D.-Y., Woo, H.-J., Park, K.-A., Byun, D.-S., and Lee, E. I. (2018). Validation of sea surface wind speeds from satellite altimeters and relation to sea state bias – focus on wind measurements at ieodo, marado, oeyeondo stations. J. Korean Earth Sci. Soc. 39, 139–153. doi: 10.5467/JKESS.2018.39.2.139
Corin, N., Backhand, P., and Kulovaara, M. (1996). Degradation products formed during UV-irradiation of humic waters. Chemosphere 33, 245–255. doi: 10.1016/0045-6535(96)00167-1
Emery, W. J., Castro, S., Wick, G. A., Schluessel, P., and Donlon, C. (2001). Estimating sea surface temperature from infrared satellite and in situ temperature data. Bull. Am. Meteorol. Soc. 82, 2773–2786.
Fang, G., Zhao, B., and Zhu, Y. (1991). Water volume transport through the Taiwan Strait and the continental skelf of the East China Sea measured with current meters. Elsevier Oceanogr. Series 54, 345–358.
Feely, R. A., Sabine, C. L., Hernandez-Ayon, J. M., Ianson, D., and Hales, B. (2008). Evidence for upwelling of corrosive “Acidified” water onto the continental shelf. Science 320, 1490–1492. doi: 10.1126/science.1155676
Ha, K.-J., Nam, S. H., Jeong, J.-Y., Moon, I.-J., Lee, M. H., Jun, J. H., et al. (2019). Observations utilizing Korea Ocean Research Stations and their applications for process studies. Bull. Am. Meteorol. Soc. 100, 2061–2075. doi: 10.1175/BAMS-D-18-0305.1
Han, C., Burn-Nunes, L. J., Lee, K., Chang, C., Kang, J. H., Han, Y., et al. (2015). Determination of lead isotopes in a new Greenland deep ice core at the sub-picogram per gram level by thermal ionization mass spectrometry using an improved decontamination method. Talanta 140, 20–28.
Jee, J. B., Zo, I. S., Kim, B. Y., and Lee, K. T. (2019b). An analysis of observational environments for solar radiation station of Korea Meteorological Administration using the digital elevation model and solar radiation model. J. Korean Earth Sci. Soci. 40, 119–134.
Jee, J. B., Zo, I. S., Kim, B. Y., Lee, K. T., and Jang, J. P. (2019a). Analysis of observation environment with skyview factor using digital elevation model (DEM), 3-dimensional camera image and radiative transfer model at radiation site, Gangneung-Wonju national university. Atmosphere 29, 61–74.
Kang, K.-M., Kim, D.-J., Hwang, J.-H., Choi, C. H., Nam, S. H., and Kim, S. J. (2017). Establishment of thermal infrared observation system on Ieodo Ocean Research Station for time-series sea surface temperature extraction. J. Korean Soc. Oceanogr. 22, 57–68. doi: 10.7850/jkso.2017.22.3.057
Kim, C. S., Lim, H.-S., Jeong, J. Y., Shim, J.-S., Moon, I.-J., Oh, Y. J., et al. (2014). Responses of coastal waters in the yellow sea to typhoon bolaven. J. Coastal Res. Special Issue 66, 1–6. doi: 10.2112/S170-047.1
Kim, G.-I., Kug, J.-S., Byun, D.-S., and Lee, J. Y. (2020). Impacts of SST pattern represented by ocean temperature near Ieodo Ocean Research Station on winter climate variation over the Korean Peninsula. Asia Pacific J. Atmosph. Sci. 56, 429–438. doi: 10.1007/s13143-019-00146-5
Kim, K.-R., Cho, Y.-K., Kang, D.-J., and Ki, J.-H. (2005). The origin of the Tsushima Current based on oxygen isotope measurement. Geophys. Res. Lett. 32:L03602. doi: 10.1029/2004GL021211
Kim, T.-W., Lee, K., Najjar, R. G., Jeong, H.-D., and Jeong, H. J. (2011). Increasing N abundance in the Northwestern Pacific Ocean due to atmospheric nitrogen deposition. Science 334, 505–509. doi: 10.1126/science.1206583
Kim, Y. S., Jang, C. J., Noh, J. H., Kim, K., Kwon, J., Min, Y., et al. (2019). A Yellow Sea monitoring platform and its scientific applications. Front. Mar. Sci. 6:601. doi: 10.3389/fmars.2019.00601
Kirinchich, A. (2020). A metocean reference station for offshore wind energy research in the U.S. J. Phys. Conf. Ser. 1452:012028. doi: 10.1088/1742-6596/1452/012028
Kwiatkowski, L., and Orr, J. C. (2018). Diverging seasonal extremes for ocean acidification during the twenty-first century. Nat. Clim. Change 8, 141–145. doi: 10.1038/s41558-017-0054-0
Lee, S. H., Han, C. H., Shin, D. C., Hur, S. D., Jun, S. J., Kim, Y.-T., et al. (2017a). Characteristics of elemental and Pb isotopic compositions in aerosols (PM10-2.5) at the Ieodo Ocean Research Station in the East China Sea. Environ. Poll. 231, 154–164. doi: 10.1016/j.envpol.2017.08.007
Lee, S. H., Shin, D. S., Han, C. H., Cho, K.-S., Hur, S. D., Lee, J. Y., et al. (2019). Characteristic concentrations and isotopic composition of airborne lead at urban, rural and remote sites in western Korea. Environ. Poll. 254, 1–11. doi: 10.1016/j.envpol.2019.113050
Lee, S.-H., Zo, I.-S., Lee, K.-T., Kim, B.-Y., Jung, H.-S., Rim, S.-H., et al. (2017b). A strategy for environmental improvement and internationalization of the IEODO Ocean Research Station’s radiation observatory. J. Korean Soc. Oceanogr. 22, 118–134. doi: 10.7850/jkso.2017.22.3.118
Lie, H. J., and Cho, C. H. (1994). On the origin of the Tsushima warm current. J. Geophys. Res. Oceans 99(C12), 25081–25091.
Long, C. N., and Dutton, E. G. (2002). BSRN Global Network Recommended QC Tests, V2.0, BSRN Technical Report. Bremerhaven: PANGAEA, 3.
Moon, I. J., Shim, J.-S., Lee, D. Y., Lee, J. H., Min, I. K., and Lim, K. C. (2010). Typhoon researches using the Ieodo Ocean Research Station: part I. importance and present status of typhoon observation. Atmos 20, 247–260.
Nam, S. H., Kim, D. J., Lee, S.-W., Kim, B. G., Kang, K.-M., and Cho, Y.-K. (2018). Nonlinear internal wave spirals in the northern East China Sea. Sci. Rep. 8:3473. doi: 10.1038/s41598-018-21461-3
Nitani, H. (1972). Beginning of the Kuroshio, Kuroshio: Its Physical Aspects, eds H. Stommel and K. Yoshida (Tokyo: University Tokyo Press), 129–163.
Schlundt, M., Farrar, J. T., Bigorre, S. P., Plueddemann, A. J., and Weller, R. A. (2020). Accuracy of wind observations from open-ocean buoys: correction for flow distortion. J. Atmos. Oceanic Technol. 37, 687–703. doi: 10.1175/JTECH-D-19-0132.1
Venkatesan, R., Kadiyam, J., SenthilKumar, P., Lavanya, R., and Vedaprakash, L. (2017). Marine biofouling on moored buoys and sensors in the Northern Indian Ocean. Mar. Technol. Soc. J. 51, 22–30. doi: 10.4031/MTSJ.51.2.11
Woo, H.-J., Park, K.-A., Byun, D.-S., Lee, J. J., and Lee, E. I. (2018). Characteristics of the differences between significant wave height at Ieodo ocean research station and satellite altimeter-measured data over a decade (2004˜2016). J. Korean Soc. Oceanogr. 23, 001–019. doi: 10.7850/jkso.2018.23.1.001
Zhou, F., Zhang, R., Shi, R., Chen, J., He, Y., Wang, D., et al. (2018). Evaluation of OAFlux datasets based on in situ air-sea flux tower observations over Yongxing Island in 2016. Atmos. Meas. Tech. 11, 6091–6106. doi: 10.5194/amt-11-6091-2018
Keywords: spring to autumn biofouling, sea surface temperature, ocean acidification, thermal infrared cameras, salinity drift, atmospheric environment monitoring
Citation: Byun D-S, Jeong J-Y, Kim D-J, Hong S, Lee K-T and Lee K (2021) Ocean and Atmospheric Observations at the Remote Ieodo Ocean Research Station in the Northern East China Sea. Front. Mar. Sci. 8:618500. doi: 10.3389/fmars.2021.618500
Received: 17 October 2020; Accepted: 20 May 2021;
Published: 05 July 2021.
Edited by:
Sabrina Speich, École Normale Supérieure, FranceReviewed by:
Liping Zhou, Peking University, ChinaCopyright © 2021 Byun, Jeong, Kim, Hong, Lee and Lee. This is an open-access article distributed under the terms of the Creative Commons Attribution License (CC BY). The use, distribution or reproduction in other forums is permitted, provided the original author(s) and the copyright owner(s) are credited and that the original publication in this journal is cited, in accordance with accepted academic practice. No use, distribution or reproduction is permitted which does not comply with these terms.
*Correspondence: Do-Seong Byun, ZHNieXVuQGtvcmVhLmty
Disclaimer: All claims expressed in this article are solely those of the authors and do not necessarily represent those of their affiliated organizations, or those of the publisher, the editors and the reviewers. Any product that may be evaluated in this article or claim that may be made by its manufacturer is not guaranteed or endorsed by the publisher.
Research integrity at Frontiers
Learn more about the work of our research integrity team to safeguard the quality of each article we publish.