
94% of researchers rate our articles as excellent or good
Learn more about the work of our research integrity team to safeguard the quality of each article we publish.
Find out more
ORIGINAL RESEARCH article
Front. Mar. Sci. , 04 March 2021
Sec. Deep-Sea Environments and Ecology
Volume 8 - 2021 | https://doi.org/10.3389/fmars.2021.617820
 Dongsheng Zhang1,2,3
 Yadong Zhou1
 Jichao Yang4
 Thomas Linley5
 Ruiyan Zhang1,2
 Bo Lu1
 Peng Xu1
 Chengcheng Shen1
 Shiquan Lin1
 Yueyun Wang1
 Dong Sun1Xiaogu Wang1
 Chunsheng Wang1,2,3,6*
Hadal trenches remain one of the unexplored ocean ecosystems due to the challenges of sampling at great depths. It is still unclear how a faunal community changes from the abyssal to the hadal zone, and which environmental variables are the key impacting factors. In this study, nine dives of the Human Occupied Vehicle (HOV) “JIAOLONG” were conducted from abyssal to hadal depths (4,435–6,796 m) in the Yap Trench on the southeastern boundary of the Philippine Sea Plate in the western Pacific, divided into 48,200 m video transects, to describe the megafaunal communities and reveal their relationship with environmental factors. A total of 1,171 megafauna organisms was recorded, 80 morphospecies (msps) from 8 phyla were identified based on the video data, most of which were reported for the first time in the Yap Trench. Arthropoda was the most abundant phylum and Echinodermata was the most diverse phylum of the megafaunal community. The faunal abundance increased with depth, whereas the Shannon diversity index decreased with depth. Cluster analysis suggested seven assemblages, with five abyssal groups, one mixed group, and one hadal dominant group. Although megafaunal communities changed gradually from abyssal zone to hadal zone, both PERMANOVA and PERMDISP analyses revealed that the communities are significantly different between abyssal zone and hadal zone, indicating 6,000 m as the boundary between the two depth zones. Depth, substrate, slope, and latitude were identified as four important environmental factors with significant influence on megafaunal community structure. This study proposed a transition pattern from the abyssal to hadal zone in the Yap Trench, highlighted the importance of habitat heterogeneity in structuring megafaunal community in a hadal trench.
The deepest areas of the oceans (6,000–11,000 m) are restricted to the hadal trenches and referred to as the hadal zone (Wolff, 1960). Hadal trenches represent 1–2% of the global benthic area of the ocean, but constitute the deepest 45% of the vertical depth, and remain one of the least understood habitats on earth (Jamieson et al., 2010; Jamieson, 2011). Compared with the abyssal environment, hadal trenches are characterized by extremely high pressure, slightly increased bottom temperatures, accumulated organic matter due to the physical topography and stronger tectonic activities (Itou et al., 2000; Danovaro et al., 2003; Jamieson, 2011; Oguri et al., 2013; Bao et al., 2018; Kioka et al., 2019), which makes the hadal trenches a unique deep-sea environment.
The investigations of hadal trench fauna started in the early 1950s (Bruun, 1951, 1953; Wolff, 1953). According to two major data sets generated from the Danish Galathea and Russian Vitjaz global expeditions, hadal trenches host a variety of species with an apparently high degree of endemism (Wolff, 1960, 1970; Belyaev, 1989). The hadal fauna is distinguished from that in the neighboring abyssal zone in several respects, including: (a) the dominance of amphipods, polychaetes, bivalves, isopods, actinians, gastropods, echiurids, and holothurians; (b) lower representation of non-holothuroids and sipunculids; (c) the insignificance of cnidarians, bryozoans, cumaceans, fishes, and lack of decapods; (d) mass occurrence of holothuroids at medium and maximum hadal depths; (e) a very uniform relative frequency at different levels in the hadal zone of different animal groups; (f) a great similarity in frequency and composition of the fauna among trenches (Belyaev, 1966; Wolff, 1970).
Since the early 2000s, multiple projects such as the UK–Japan HADEEP, US-UK-NZ HADES (Jamieson et al., 2009b) and German-Russian expedition KuramBio II (Brandt et al., 2018) have been carried out to fill this knowledge gap, particularly from a biological perspective. Hadal landers provide a time/cost effective way of exploring the deep-sea biological community, such as the first report of decapods in the hadal zone (Jamieson et al., 2009a), a large aggregation of hadal fish (Fujii et al., 2010; Linley et al., 2016), a better understanding of the amphipod community (Jamieson, 2015; Lacey et al., 2016, 2018), and the first reliable report of a hadal cephalopod (Jamieson and Vecchione, 2020). However, baited landers only record mobile fauna which respond to bait (Jamieson et al., 2013). Video transects provide information on fauna not recorded by baited landers and faunal density is more readily calculated.
Although various studies have described the hadal zone as a unique environment with a high degree of endemism of benthic fauna, the term “hadal,” referring to areas deeper than 6,000 m, still seems like a convenient nomenclature that does not reflect the complexity of habitats and community (Stewart and Jamieson, 2018). Wolff (1970) and Belyaev (1989) suggested a gradual transition zone between the abyssal and hadal zones between 6,000 and 7,000 m. A study on bait-attending amphipods indicated that the assemblage composition changes gradually with increase in depth at abyssal depths, and changes abruptly once the depth exceeds 6,000 m (Jamieson et al., 2011). Some other studies also identified a relatively wide gradual change of communities between the abyssal and hadal zones, often called the Abyssal Hadal Transition Zone (Fujii et al., 2013; Kitahashi et al., 2013; Linley et al., 2017). Recently, with more sampling sites added, Lacey et al. (2016) provided more convincing evidence that a separation of abyssal and hadal dominated communities may occur in a wide depth range for different trenches.
The community structure and species composition of hadal fauna are affected by multiple environmental factors. Hydrostatic pressure and particulate organic carbon (POC) flux are considered to be the two major environmental factors shaping the community structure and species richness in the hadal zone (Wolff, 1970), as well as in bathyal and abyssal environments (Danovaro et al., 2010; Duffy et al., 2012). With less than 15% increase in pressure across the transitional zone (6,000–7,000 m) (Belyaev, 1989), it is difficult to envisage how the pressure can be largely responsible for the variation of assemblage composition (Jamieson et al., 2011). On the other hand, POC flux possibly plays a more significant role in shaping the community on a large geographical scale (Watling et al., 2013; Lacey et al., 2016), rather than within one single trench. As more sampling is undertaken, there is a growing realization that habitat heterogeneity may be one of the most important factors controlling ecological patterns and processes (Stewart and Jamieson, 2018).
However, characterizing the habitat of associated benthic communities and its role in shaping the assemblage distribution pattern remains challenging, due to limited access to extreme deep ecosystems and the paucity of sample points obtained within the hadal zone. Approximately 4,000 images of the hadal seafloor taken between 6,758 and 8,930 m within three trenches provided the first glimpse at habitat heterogeneity in the hadal zone (Lemche et al., 1976; Belyaev, 1989). Similar publishing ceased until very recently. Stewart and Jamieson (2018) defined eight categories of seabed substrate from hadal trenches and described the habitat heterogeneity at hadal depths with images taken by cameras mounted on hadal landers. A study based on images and videos obtained by the DEEPSEA CHALLENGER submersible suggested that habitat heterogeneity likely influenced the community patterns (Gallo et al., 2015). These results highlighted the necessity of a multidisciplinary data analysis with seafloor video and biological sampling.
The Yap Trench is one of the least studied hadal trenches, and the records of megabenthic organisms are so scarce (Lemche et al., 1976; Belyaev, 1989; Zhang et al., 2017; Wang et al., 2018; Shen et al., 2019) that our knowledge of the species and community is nearly negligible. The deep manned submersible “JIAOLONG” can reach a depth of 7,000 m (Cui, 2013), which provides an opportunity to access the hadal ecosystems. Nine “JIAOLONG” Dives, covering a wide depth range from the abyssal to hadal zone, were carried out during two cruises of the China Ocean Mineral Resources R and D Association (COMRA), videos, images and environmental parameters were simultaneously obtained. In the present study we use these data to: (1) describe the community of megafauna in the Yap Trench, (2) examine the distribution pattern of megafauna from the abyssal to the hadal zone, (3) explain contributions of multi-environmental factors in structuring the megafauna community and their distribution patterns in the Yap Trench.
The Yap Trench lies on the southeastern boundary of the Philippine Sea Plate in the western Pacific and is part of a continuous system of arcuate trenches. It is approximately 700 km in length, with the maximum depth 8,946 m, and contains several different types of topographical structures on the trench slopes, such as horst and graben structures, slope breaks, and steep escarpments (Fujiwara et al., 2000). There are several deep basins isolated by rises on the trench slope, one of which is located at 9°00′N, and with the morphological boundary at 8°26′N (Fujiwara et al., 2000), divided our study area into two relatively isolated parts. Therefore, the high habitat heterogeneity in the Yap Trench may potentially support highly diverse megabenthic assemblages.
Biogeographically, the Yap Trench, together with the Volcano, Mariana, and Palau trenches, is assigned to the Hadal Province 3 (HD3) (Watling et al., 2013). The HD3 province is located in the oligotrophic tropical northwest Pacific, where the POC flux sinking to the deep-sea floor is extremely low (Lutz et al., 2007). Published data indicates that abundance of megafauna in the Yap Trench is obviously lower than in other hadal trenches (Belyaev, 1989), and is probably limited by the low food availability compared to other trenches.
During 2016 and 2017, two cruises (DY37 and DY38) organized by the COMRA were conducted to survey the Yap Trench using the RV Xiangyanghong09. Nine “JIAOLONG” dives were conducted forming two sections at the north and south parts of the Yap Trench, containing five and four dives, respectively (Figure 1). One dive took place at the sea-ward slope at the hadal zone (we used 6,000 m as the boundary between the abyssal and hadal zones) and the others were located at the arc-ward slope from the abyssal to the hadal zone. The HOV was equipped with a 1,080-pixel and 10-fold optical zoom high-definition camera to collect video data; an ultra-short baseline (USBL) system which provided detailed position information along the transects; a Seabird SBE16 CTD to measure temperature; and a depth sensor. In each dive, the HOV sailed up-slope across the isobath. All data gathered by the HOV were simultaneously combined using the time line. In total, 24.5 h of video data covering a 10.1 km distance was created from the nine dives, at depths ranging from 4,435 to 6,797 m. Detailed information of the nine dives is shown in Table 1.
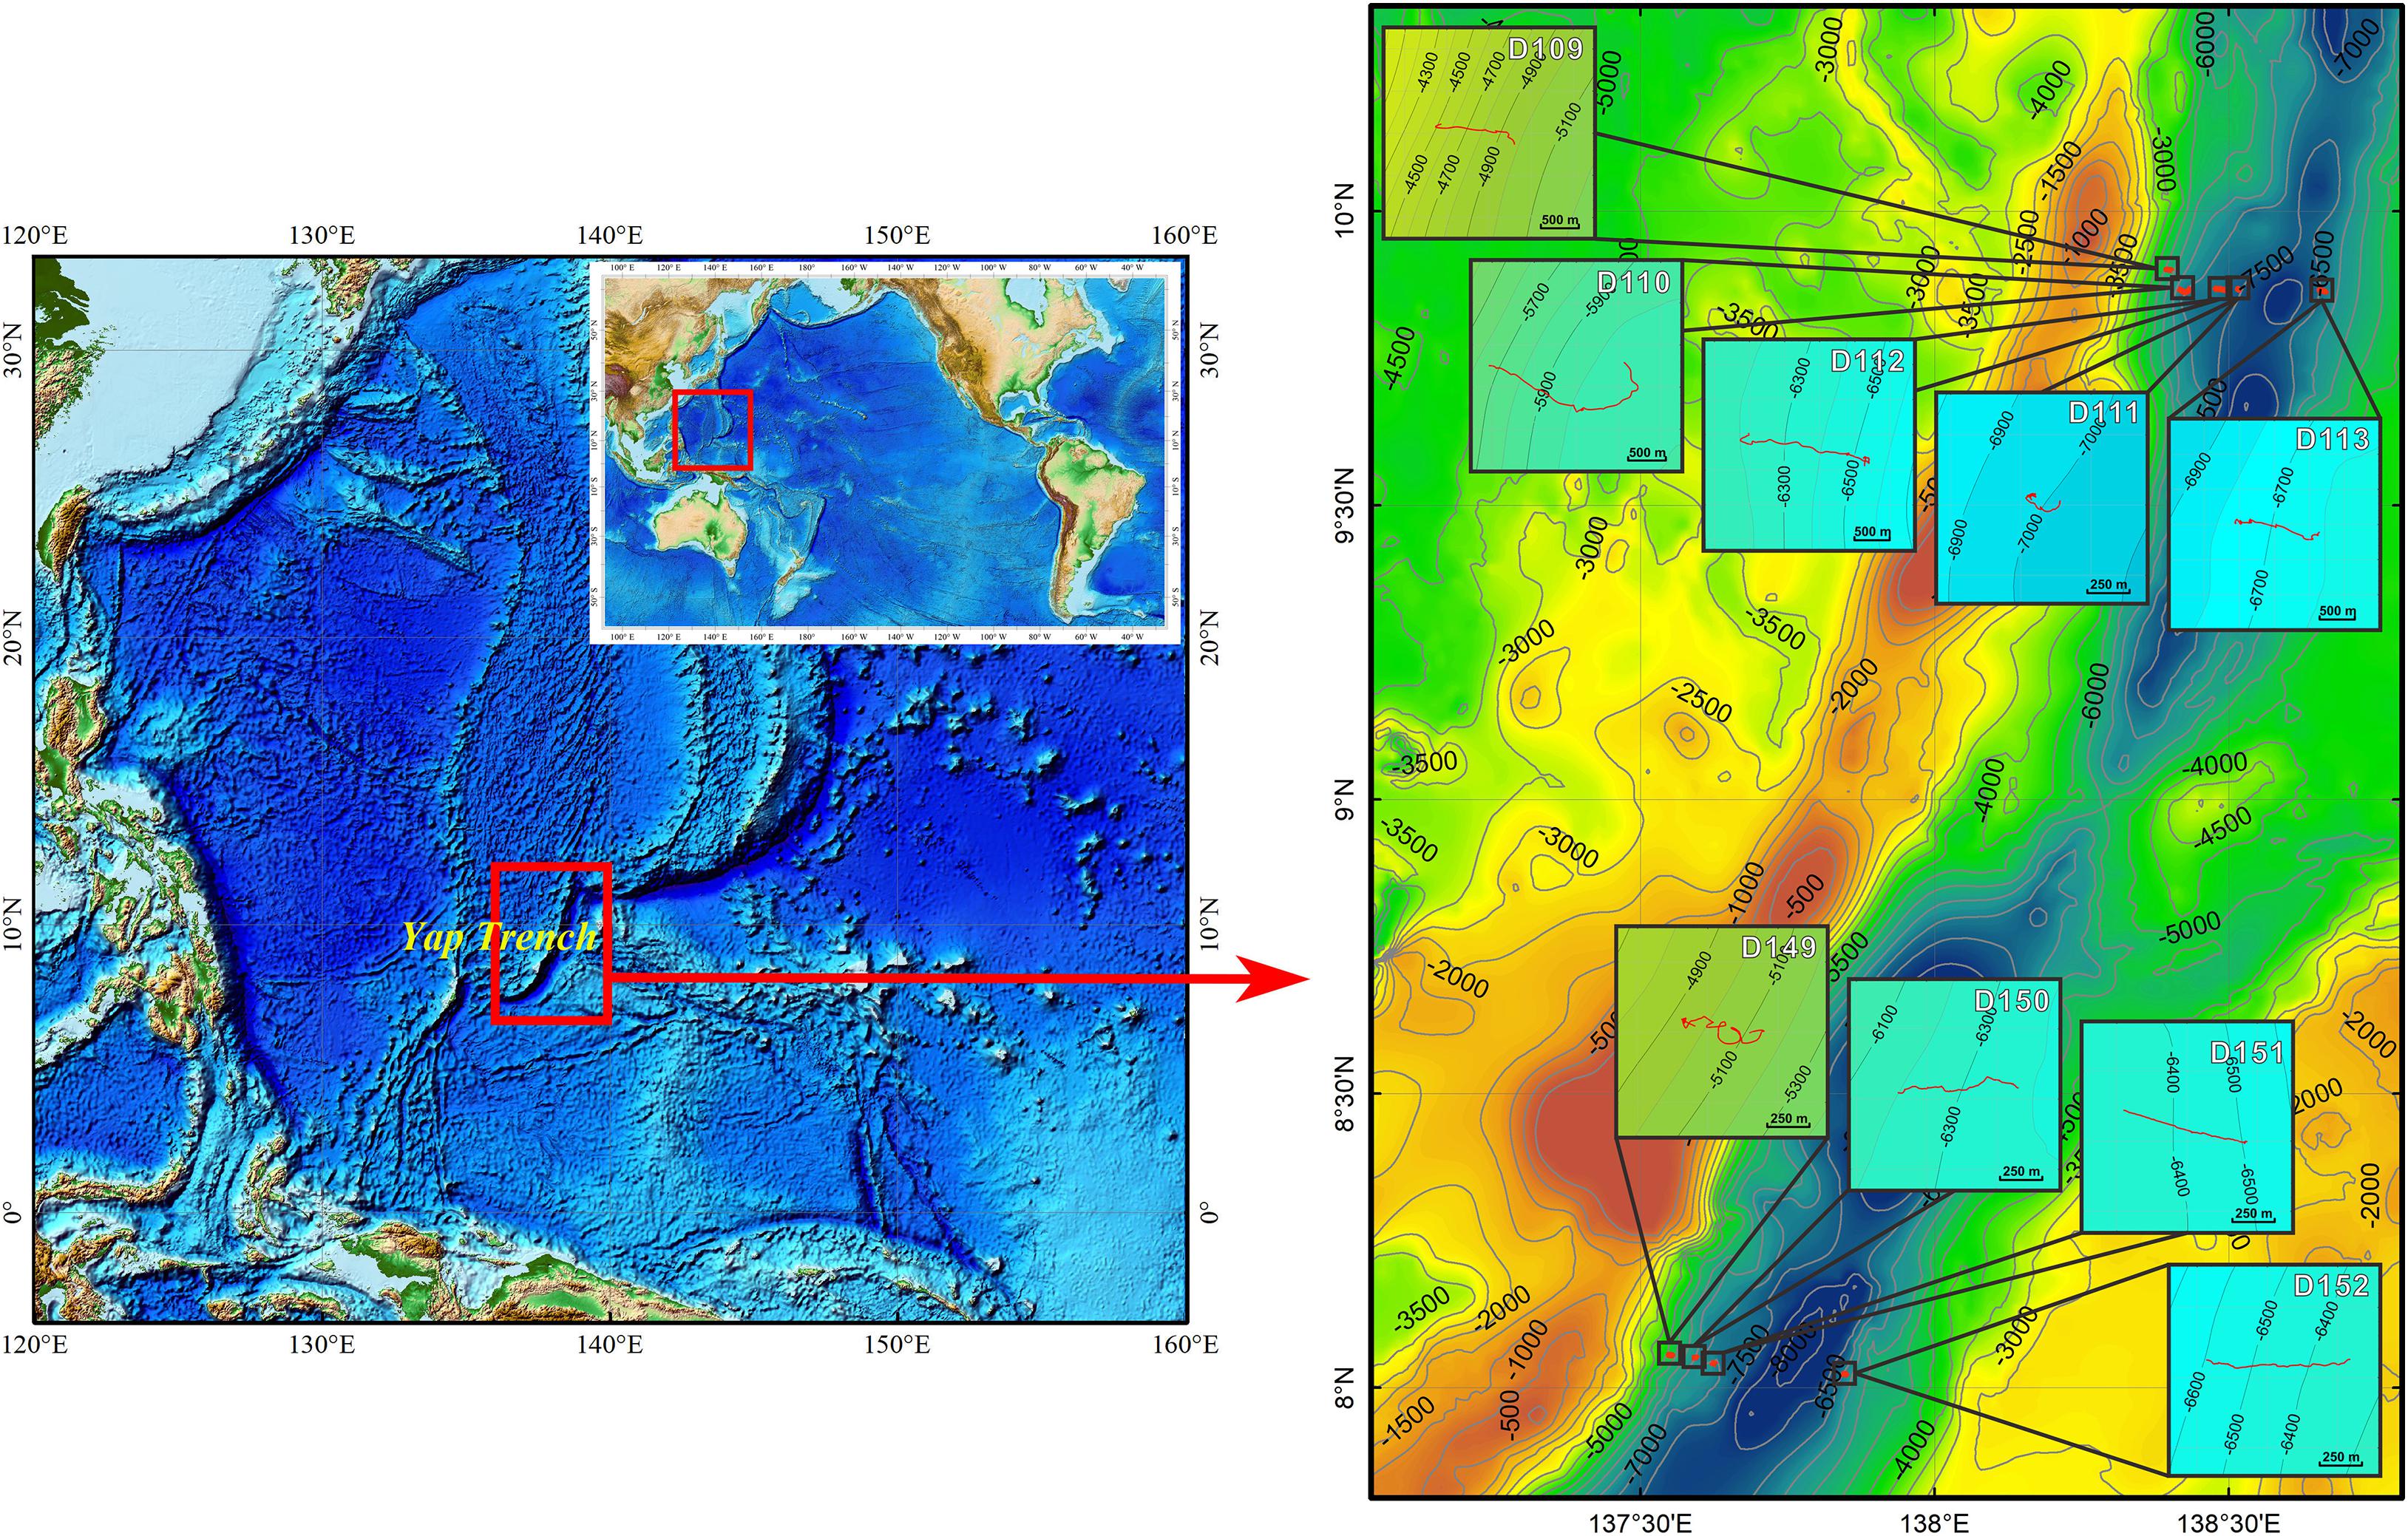
Figure 1. Study area and “JIAOLONG” diving sites in the Yap Trench.
Table 1. Information of nine “JIAOLONG” dives conducted during the two COMRA cruises.
All video data available were examined, and animals that could be clearly seen by the naked eye were recorded. The voucher specimens collected by the HOV from the Yap Trench during the same cruises, deposited at the Repository of Second Institute of Oceanography, were used as an important key for those closely related groups. Previous published video analysis from the hadal trenches (Heezen and Hollister, 1971; Lemche et al., 1976; Hessler et al., 1978; Belyaev, 1989; Jamieson et al., 2009c, 2011; Fujii et al., 2010; Gallo et al., 2015; Jamieson, 2015; Linley et al., 2016, 2017) were also used as references for identification of the megafauna records from video data. There are limitations to identification of organisms from video so we applied the most conservative standard for taxonomic identification, assisted by consultation with many deep-sea taxonomy experts. All animals from the video record were counted and identified to the lowest taxonomic level possible given the limitations. The nomenclature adopted for the taxon list is that reported in the relevant update check-list: World Register of Marine Species (WoRMS). WoRMS is available online at http://www.marinespecies.org/.
The nine HOV dives were not exclusively video surveys; they were interrupted by sample collecting operations from time to time. To eliminate the bias caused by pauses in the video survey, animals recorded during the sampling were removed before quantitative analysis. The length of video sampling units (SUs) was suggested from 80 to 200 m in other deep-sea environments (Perez et al., 2018; Victorero et al., 2018; Pierdomenico et al., 2019), In this study, 200 m was used to provide more statistically robust information, due to a very low abundance of the megabenthic organisms in the study area. Each diving line was divided into successive segments of 200 m long, which were hereafter designated as sampling units (SUs). Normally, the diving lines cannot be exactly divided into 200 m segments, so those smaller fragments with a distance less than 200 m were excluded from the statistical analysis. But all taxon data was recorded for megafauna description. In D111, the whole diving line at the sea floor was only 181 m in length and treated as one SU for statistical analysis. A total of 48 SUs was generated from the 9 dives, composing a primary dataset.
The abundance (ind./200 m) of each SU was calculated using number of individuals divided by distances (200 m). The Shannon index H′(ln) was chosen as a measure of biodiversity. The linear regression analysis was conducted through Graphpad v7 to test the relationship of depth and abundance, depth and Shannon index H′. Species accumulation curves were calculated using the statistical software R and the vegan package with default parameters. To compare the species richness between the depths and locations, four sub-datasets of the abyssal and hadal zones, and the north and south sections were generated from the primary dataset. Each of them was analyzed for species accumulation curve separately.
The environment was described by substrate, depth, slope, temperature, latitude, and longitude. The substrate was manually classified from the video data according to Stewart and Jamieson’s classification system (Stewart and Jamieson, 2018), with minor modifications. We used the sediment coverage, which could be considered as a surrogate for the recovery of a physical sediment sample, to define the substrate. Eight categories of substrate in this study are as follows: (1) bedrock, (2) bedrock and gravel, (3) bedrock and sediment, (4) slightly clayey gravel, (5) clayey gravel, (6) gravelly sediment, (7) slightly gravelly sediment, and (8) sediment. Gravel (cobbles and pebbles) substrate from Stewart and Jamieson (2018) was not recorded in the Yap Trench. Muddy gravel was divided into slightly clayey gravel and clayey gravel based on their coverage of sediment. The composition of bedrock, gravel and sediment, and the values of different substrate types, are shown in Supplementary Table S1. Due to the frequent and random variation of the substrate types along the survey lines, usually more than one type of substrate was observed in each segment. Thus, the substrate value of each segment was calculated as follows:
where Ssub is the substrate value of one segment, Si is the mid value of the type i substrate, and Di is distance covered by the type i substrate. When only one type of substrate was observed in a segment, Ssub = Si. The higher the Ssub, the higher percentage of the segment covered by sediment.
The slope gradient of each SU was calculated according to the law of Sines, with the depth range as the opposite side and the length as the beveled side.
where Sslo is the slope angle of each SU, Dend is water depth at the end of the SU, and Dbegin is water depth at the beginning of the SU.
The mid-value of depth range was used to represent the depth of each SU. The average temperature within each SU was used to represent T. Latitude and longitude at the start point of the diving lines were used for statistical analysis. The environmental dataset including the six variables of depth, temperature, slope, substrate, latitude, and longitude was generated for further statistical analysis.
Prior to the quantitative analysis, all msps with only one record were excluded because they were not deemed to be representative of the community (Victorero et al., 2018). As a result, seven SUs without records or with only one morph-species (msp) were also excluded. Finally, an abundance dataset composed of 41 SUs, including a total of 50 msps, was generated for statistical analysis.
Community structure and its distribution patterns were analyzed using the multivariate statistical software PRIMER 7 (Anderson et al., 2008). The CLUSTER analysis was performed using a Bray–Curtis resemblance matrix generated from the square root transformed abundance data, and applying a similarity profile analysis (SIMPROF) to the resemblance matrix to identify significantly different assemblages. Non-metric multidimensional scaling plots (nMDS) were generated using the Bray–Curtis similarity matrix to represent the relative dissimilarities between SUs. The similarity percentage (SIMPER) was used to evaluate similarities or dissimilarities within and among the identified assemblages, and to identify the characterizing taxa (up to 90% cumulative within-group similarity). Shade plots were generated using a square root transformed dataset (Clark et al., 2013), with species clustered and re-ordered based on their distribution patterns of abundance across the sampling units.
To test the depth zonation of megafauna, 6,000 m was used as the boundary to partition the sampling units into two groups as the abyssal zone group (AZ) and the hadal zone group (HZ). The HZ was further divided into two groups as upper hadal zone (UHZ, 6,000–6,500 m) and lower hadal zone (LHZ > 6,500 m). Based on their localities, sampling units were assigned into six groups (ANW: Abyssal– North section–West slope; HNW: Hadal–North section–West slope; HNE: Hadal–North section–East slope; ASW: Abyssal–South section–West slope; HSW: Hadal–South section–West slope; HNE: Hadal–South section–East slope) to test the spatial differences of megafauna composition. The substrate was classified into three groups, based on the value of Ssub, including hard substrate (Ssub < 0.4), mixed substrate (0.4 ≤ Ssub≤ 0.6) and soft substrate (Ssub > 0.6). One-way PERMANOVA was used to assess the significance of differences in megafauna composition among depth zones (AZ/HZ), substrates, and localities. A PERMDISP was also carried out to assess the homogeneity of multivariate dispersion among assemblages associated with the same variables in PERMANOVA. Pairwise PERMDISP analysis was also conducted for further divided depth groups (AZ/UHZ/LHZ).
Distance-based linear models (DistLM) was performed to explore the influence of environmental factors on the megabenthic community structure. Prior to DistLM analysis, correlation matrices were produced to identify correlating factors (Supplementary Table S2), and one of the paired strongly covarying (p > 0.95) factors was removed from the dataset. Longitude and temperature were removed due to their strong relationship with latitude and depth, respectively. Included environmental factors were normalized through Euclidean distance before DistLM analysis. A step-wise procedure was performed with Akaike Information Criterion (AIC) selection criteria. Distance-based redundancy analysis (dbRDA) was applied to visualize the influence of the predicting factors identified as significant by DistLM.
To further assess the contributions of spatial and environmental factors in explaining the community structure, the spatial analysis was conducted in R v4.0.2. Because the SUs were distributed as almost paralleled and straight tracks, the spatial structure herein was mainly manifested as the linear gradient. Based on the data of spatial distances along sequential SUs and Hellinger-transformed abundance matrix, the RDA was implemented by using the rda function to examine how the spatially linear gradient affects community distribution. If it was tested to be significant, the Variation partitioning was conducted by the varpart function to examine the impacts of significant environmental variables and linear gradient (Borcard et al., 1992; Legendre and Legendre, 2012).
Temperatures near the sea floor showed a typical trench-specific variation, increasing with depth (4,435–6,796 m) from 1.450 to 1.739°C due to adiabatic heating. The average increasing rate was 0.126°C per 1,000 m. The slope gradient ranged from 0.3° to 41.3°, generally decreasing with water depth. The highest value was observed in the shallowest dive (D109) with an average slope of 29.2°, whereas D113 had the lowest average slope of 3.5°. There was also a long platform, more than 1 km, with less than 1° slope in D110. Both temperature and slope showed a significant correlation with depth (p < 0.001, n = 48; p < 0.01, n = 48).
In total, more than 70% of the observed sea floor is covered by three types of soft substrate, 20% covered by three types of hard substrate and the two types of mixed substrate contributed less than 10% of the sea floor area (Table 2). However, the substrate composition showed a wide variation among the nine dives. The three abyssal dives were found with higher percentage of hard and mixed substrates, but lower percentage of soft substrate than the six hadal dives. In D109, slightly clayed gravel dominated the substrate and covered 48.32% of the seabed; bedrock, and bedrock and gravel together, covered more than 50%, whereas no soft substrate was observed. In D110 and D149, though soft substrate dominated the seabed, percentages of hard substrate were higher than most of hadal dives. In the six hadal dives, soft substrates accounted for 78–100% of the seabed. Among the hadal dives, D112 was found with higher coverage of hard substrate (>20%) than the other five. Analyses based on SUs showed a significant positive correlation between substrate and depth (p < 0.001, n = 48), and a significant negative correlation between substrate and slope (p < 0.001, n = 48).
Table 2. Seabed substrate classification and coverage percentage of the nine dives in the Yap Trench.
A total of 1,171 megabenthic organisms were recorded, 80 msps were identified from 8 phyla including Porifera (8 msps), Cnidaria (8 msps), Ctenophora (1 msp), Annelida (5 msps), Arthropoda (6 msps), Echinodermata (22 msps of Holothuroidea, 8 msps of Asteroidea, 4 msps of Ophiuroidea, 1 msp of Crinoidea), Hemichordata (1 msp), Chordata (11 msps), and 5 unknown msps (Figure 2, Supplementary Figure S1, and Supplementary Table S3). Among the 80 msps, 51 and 44 were identified from abyssal zone and hadal zone, respectively, with only 15 shared msps, indicating a significant dissimilarity between them.
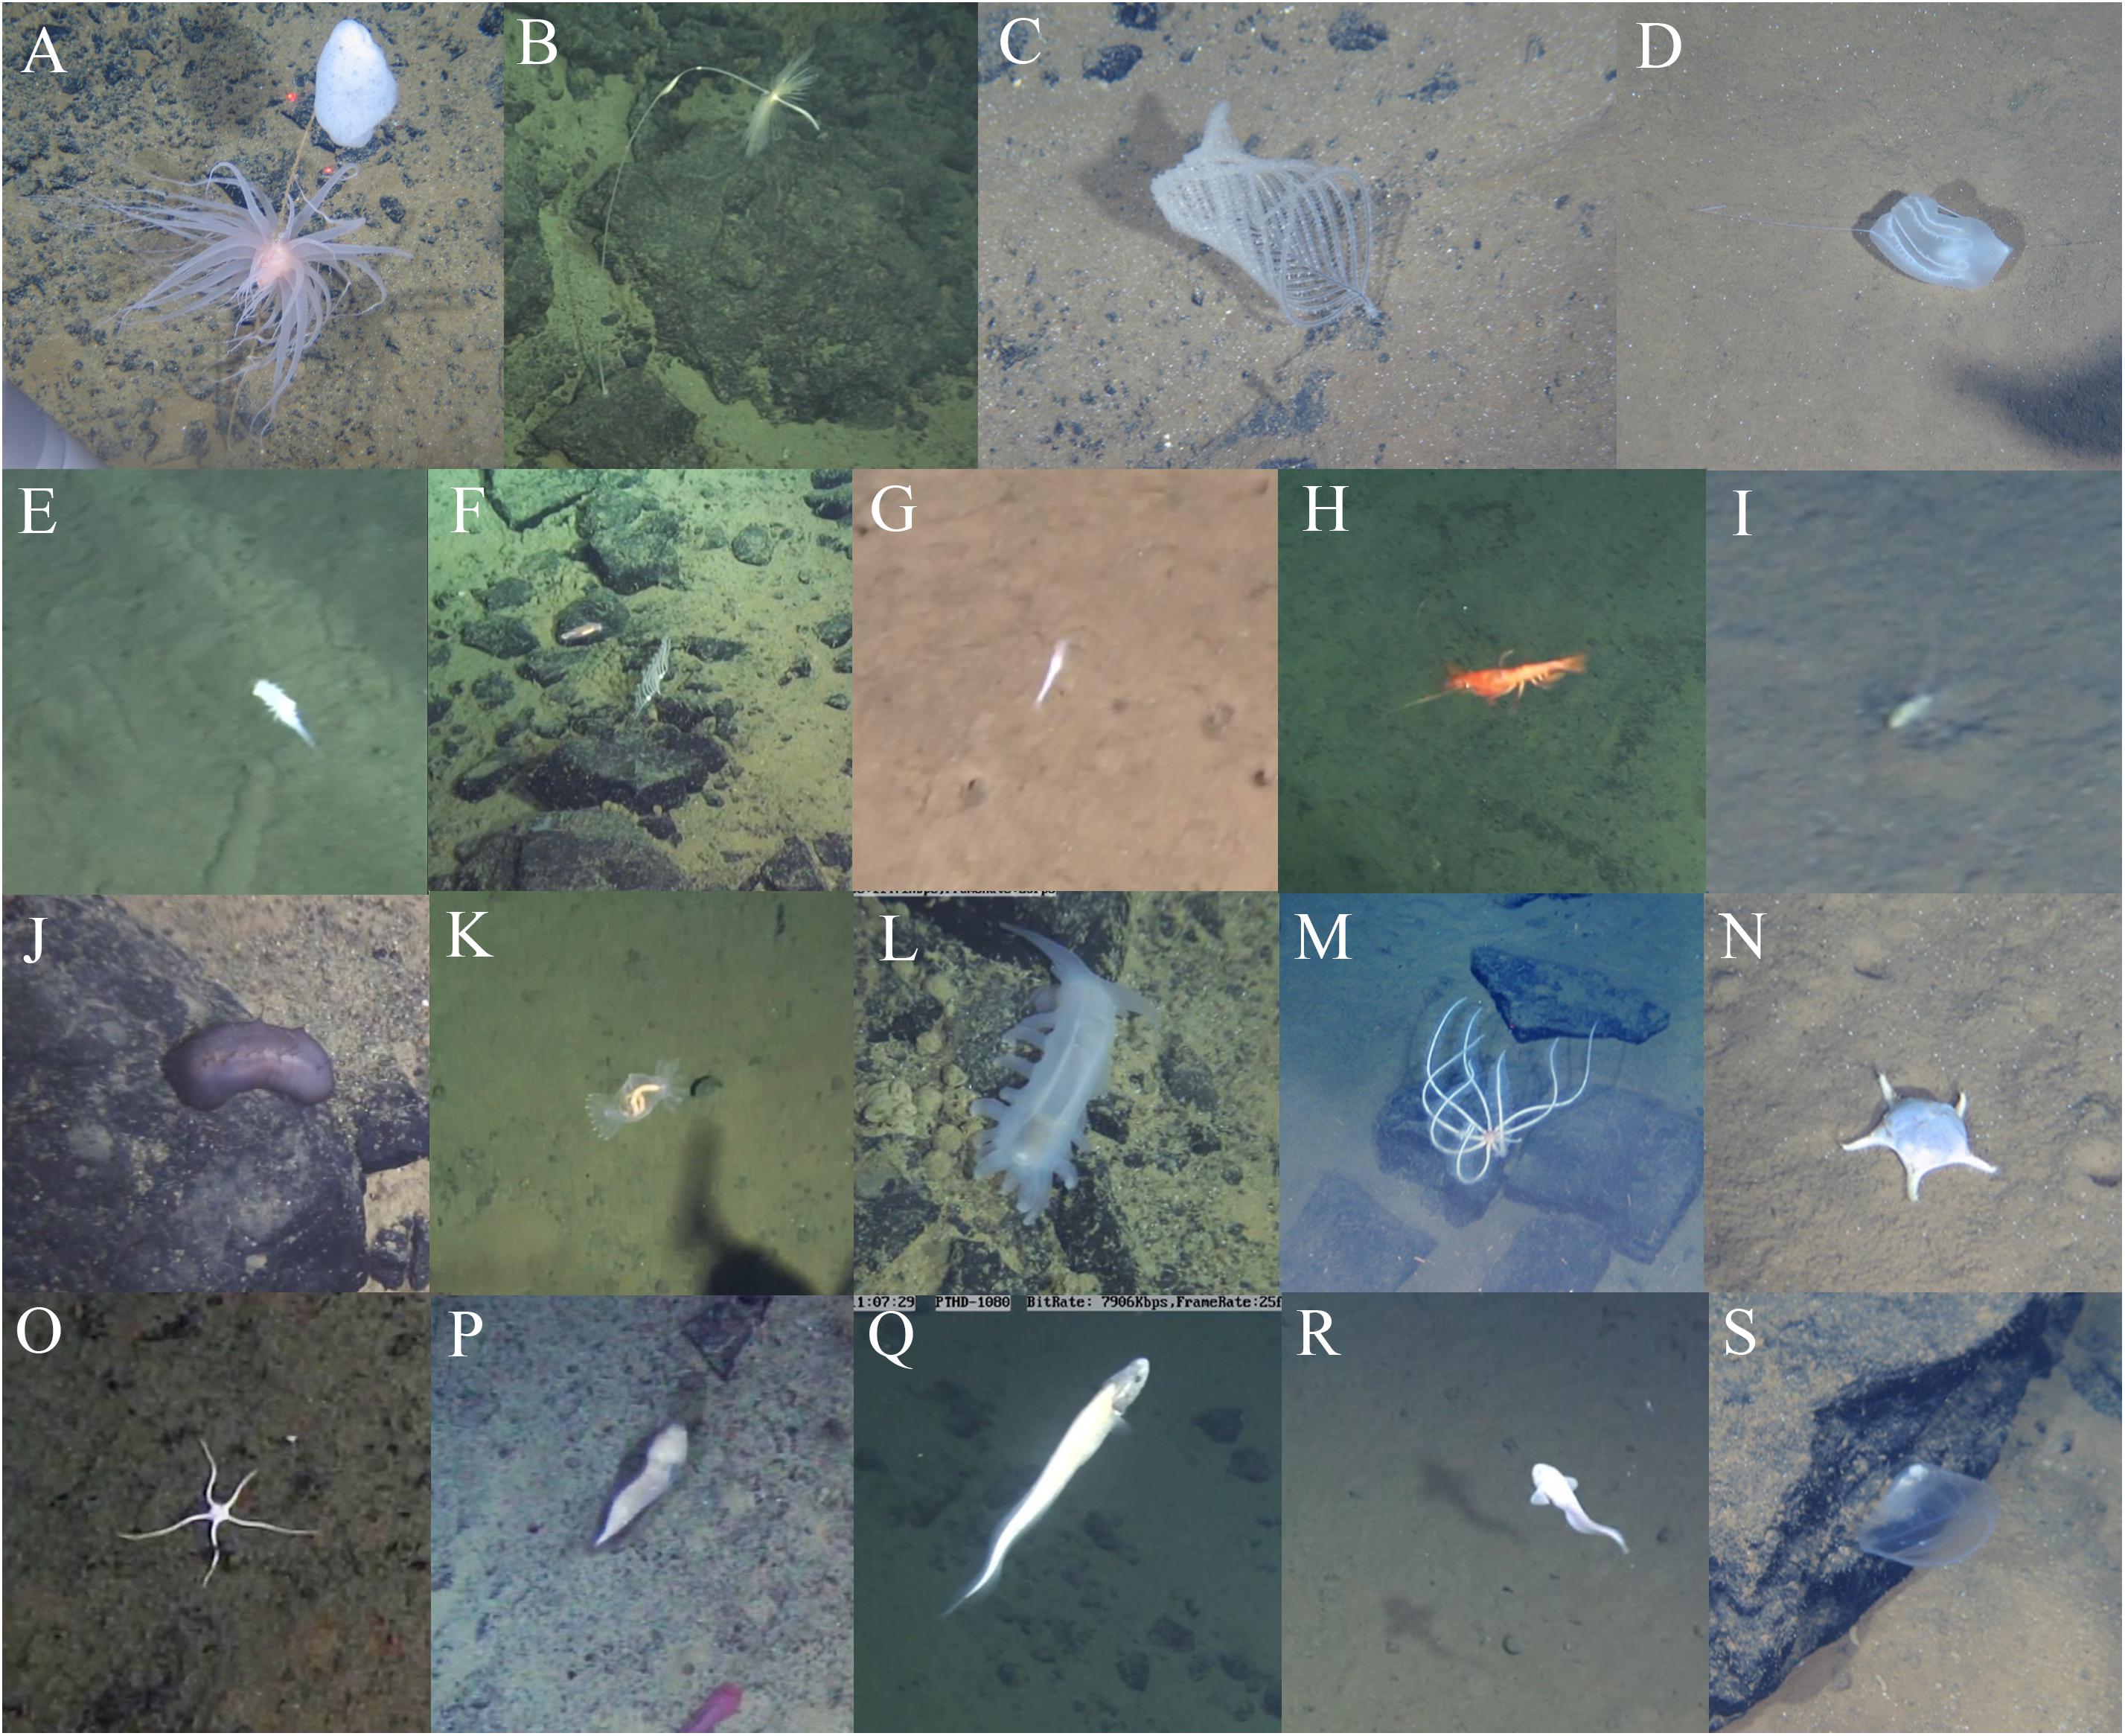
Figure 2. In situ photos of megafauna in the Yap Trench. (A) Rhizophyta yapensis and Relicanthus sp., 4,781 m (D109); (B) Cladorhiza sp., 5,042 m (D149); (C) Abyssopathes sp., 4,862 m (D109); (D) Ctenophora sp., 6,777 m (D111); (E) Polynoidae sp.2, 6,258 m (D112); (F) Polychaeta sp.2 and Chondrocladia (Symmetrocladia) lyra, 5,062 m (D149); (G) Mysidae spp. 6,554 m (D113); (H) Benthesicymus cf. crenatus, 5,109 m (D149); (I) Munnopsidae spp., 6,269 m (D112); (J) Synallactida sp.2, 5,091 m (D149); (K) Elpidiidae sp.1, 6,414 m (D152); (L) Peniagone sp.1, 4,994 m (D149); (M) Freyella sp., 5,715 m (D110); (N) Styracaster yapensis, 6,576 m (D113); (O) Ophiopyrgidae sp.1, 5,123 m (D149); (P) Typhlonus nasus, 4,900 m (D109); (Q) Ophidiidae sp.1, 5,071 m (D149); (R) Pseudoliparis swirei, 6,509 m (D152); (S) Ascidiacea sp.1, 6,351 m (D112).
The abundance of megafauna increased significantly with depth (linear regression, r = 0.344, p = 0.014, n = 41, Figure 3), whereas diversity decreased with increasing depth (linear regression, r = −0.508, p < 0.001, n = 41, Figure 3). The megafauna structure was distinctly different between the abyssal zone and the hadal zone. Echinoderms dominated the megafauna in the abyssal zone, especially the holothuroids contributing 37.41% of the total abundance. Arthropoda was the second dominant group contributing 21.11% of the total abundance, followed by Chordata (12.59%) and Annelida (10.74%) (Figure 4A). While in the hadal zone, Arthropoda (mostly mysids) becomes the most dominant group, contributing 77.34% of the total abundance, followed by Annelida (10.63%). Other groups contributed very small percentages of the total abundance, most of them taking up about one percent or less (Figure 4B). It was worth noting that DV152 contributed a large percentage (57%) of the total number of animals recorded in the hadal zone.
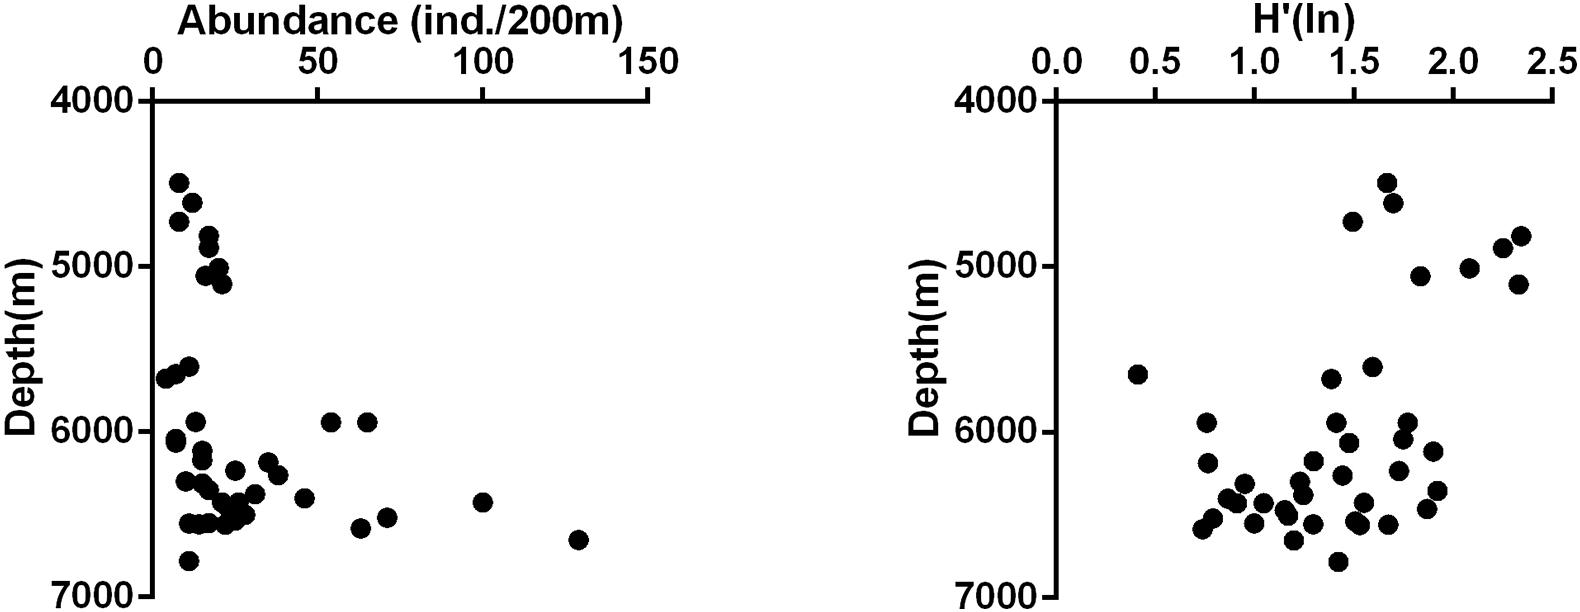
Figure 3. Vertical variation of abundance and Shannon diversity of megafauna in the Yap Trench.
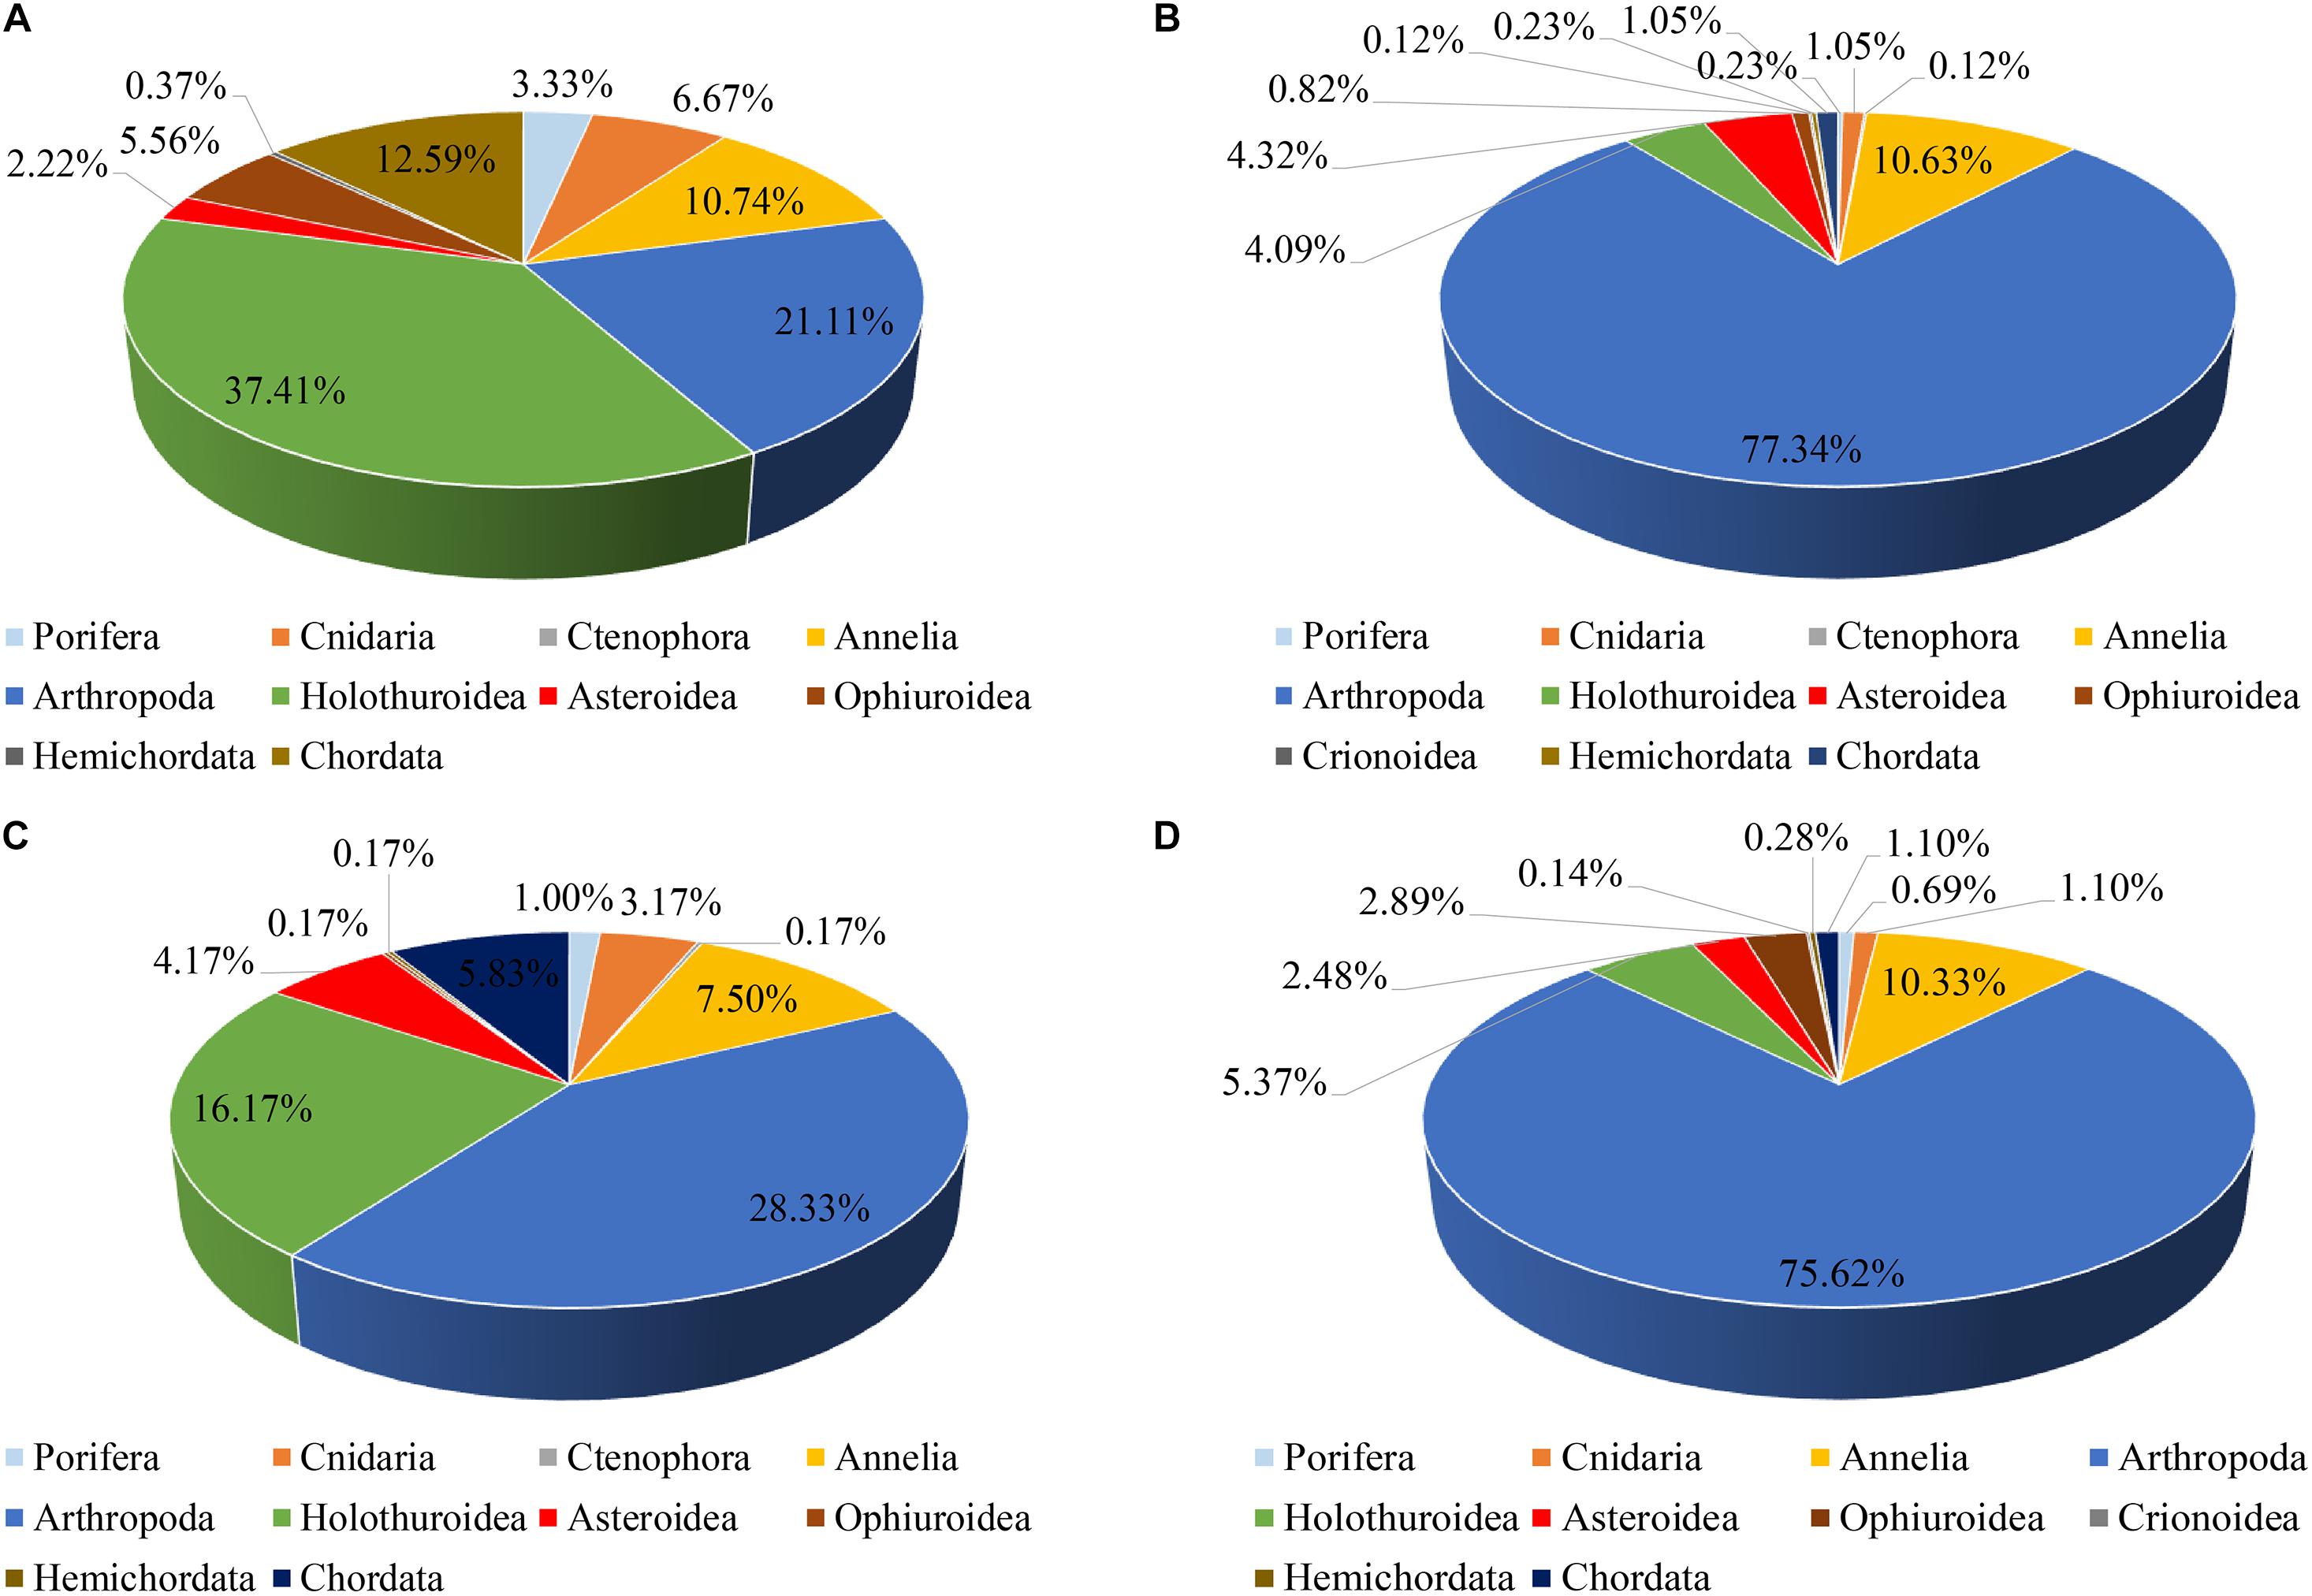
Figure 4. Comparison of megafauna structure among (A) the abyssal zone; (B) the hadal zone; (C) the north section; (D) the south section in the Yap Trench.
On the other hand, the megafauna structure in the north section was also different from that in the south section. In the north sections, Arthropoda was the most dominant group contributing 28.33% of the total abundance, followed by Holothuroidea (16.17%). The other groups contributed less than 10% of the total abundance (Figure 4C). While in the south sections, Arthropoda took up a much larger percentage (75.62%) of the total abundance than that in the north section. Annelida was the second dominant group contributing 10.33% of the total abundance, and other groups contributing less than 5% of the total abundance (Figure 4D). The vertically and horizontally spatial differentiation of megafauna suggested that depth and geographical position may play important roles in structuring megabenthic community.
The species accumulation curves did not reach an asymptote, indicating that the sampling effort is inadequate (Figure 5). The results also suggested that the abyssal zone had higher species richness than the hadal zone, whereas the north section and the south section had similar species richness.
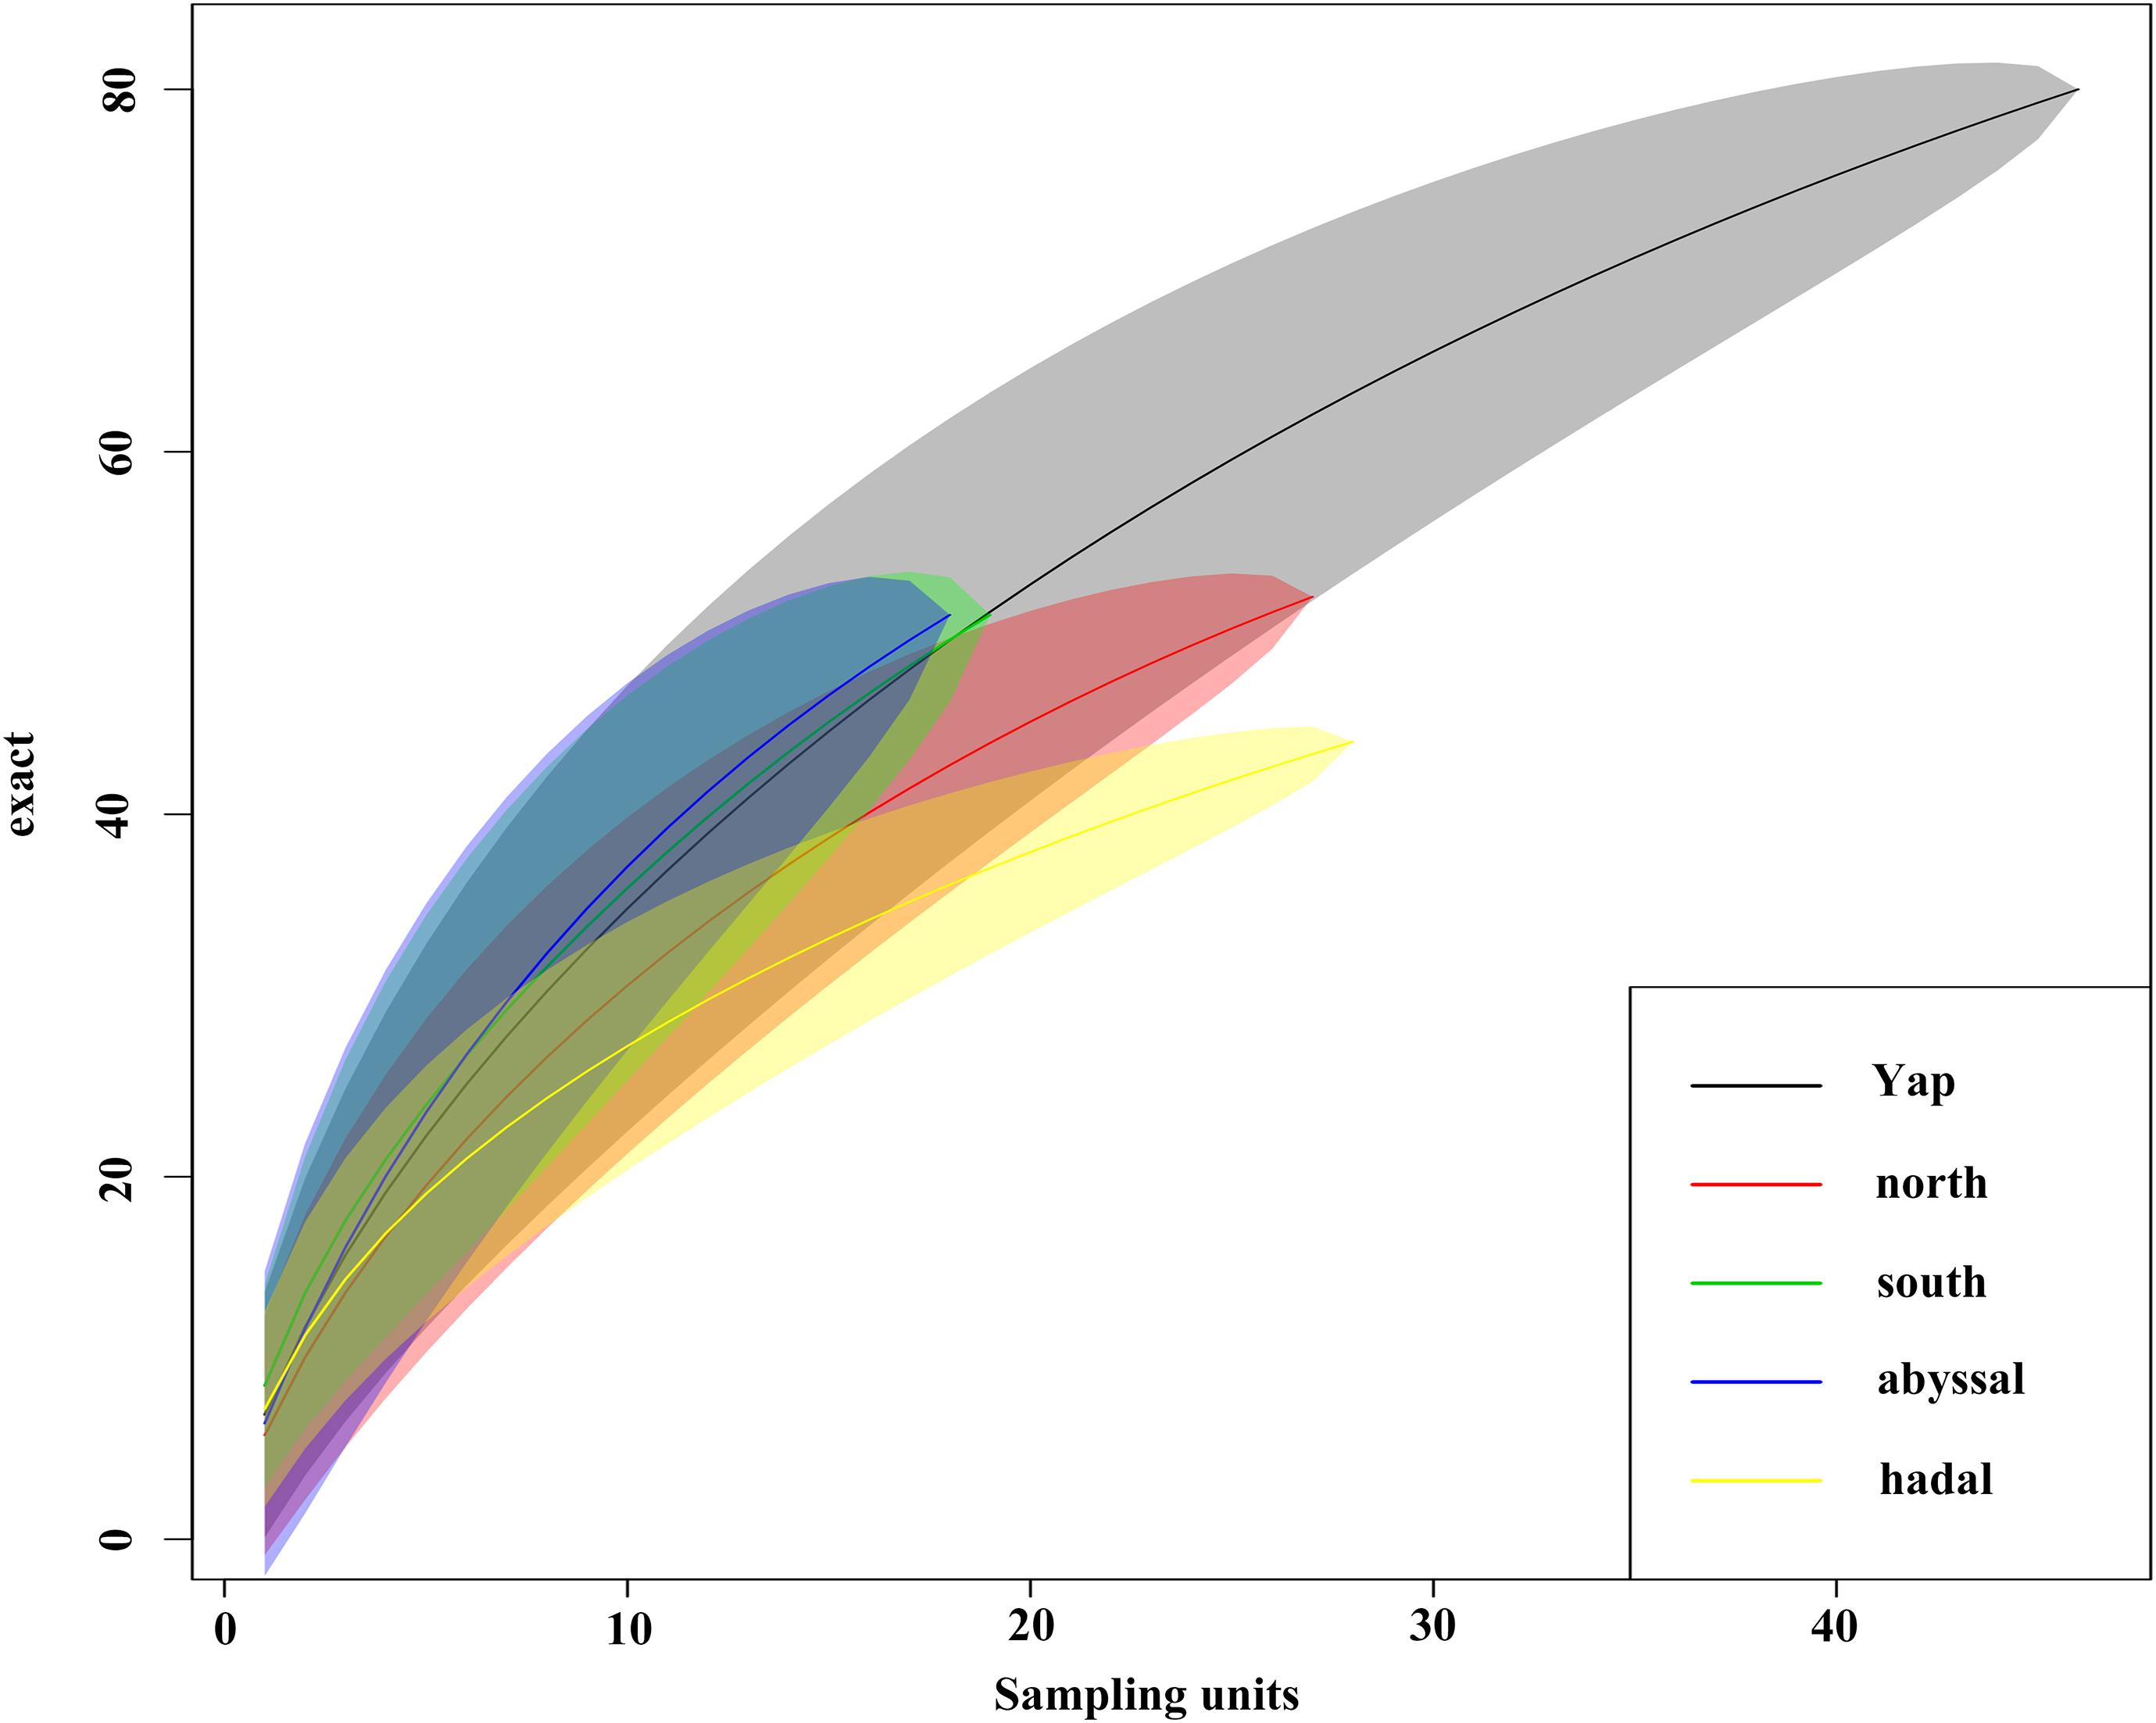
Figure 5. Species accumulation curves calculated for the whole trench, the north and south sections and the abyssal and hadal zones separately.
To further test the megafauna structure and its relationship with environmental factors, statistical analysis was processed. According to the cluster results, a total of 41 SUs were clustered into seven assemblages, with a mean within-assemblage similarity ranging from 41.98 to 47.15%. Five assemblages (A, B, C, D, F) were identified as abyssal groups, three of which (A, C, F) were composed of only one SU, the other two (B, D) were composed of two and three SUs respectively. Among these, assemblage B was mostly characterized by Peniagone sp.2 (32.04%), Mysidae spp. (22.65%), and Peniagone sp.1 (22.65%), whereas assemblage D was mostly characterized by Elpidiidae sp.2 (23.50%), Chordata sp.2 (23.12%), Mysidae spp. (17.10%), Cnidaria spp. (15.46%). Assemblage E was identified as a mixed group, mostly characterized by Polynoidae sp.1 (35.81%), Mysidae spp. (25.1%) and Decapoda sp.2 (20.09%). Assemblage G can be characterized as a hadal group, with 26 of 28 SUs from hadal zone. The average similarity within assemblage G was highest among the seven assemblages (47.15%). Mysidae spp. made the highest contribution (53.16%) to assemblage G followed by Amphipoda spp. (17.02%).
nMDS plots illustrated the relative dis/similarity of the SUs and allowed the overlay of potential drivers (Figure 6). Due to their high within-group similarity, most SUs from assemblage G were closely distributed indicating similar megafauna composition, mostly from the hadal zone and associated with sediment substrate (Figures 6B,C). While SUs from the other six assemblages had a more dispersed distribution and were mainly from the abyssal zone and associated with all three types of substrate (Figures 6B,C). The shade plot shows a gradual change of megabenthic community along depth from abyssal to hadal zone, but a higher homogeneity of megafauna within the hadal zone (Figure 7A), which is consistent with nMDS analysis. Species composition in the hard substrate was clearly different from those in sediment and mixed substrates (Figure 7B). However, neither the shade plot (Figure 7C) nor the nMDS plot (Figure 6C) reveal any evident differences of megafauna among geographic locations. Both nMDS and the shade plots suggest that depth and substrate may be two important factors in controlling megafauna communities.
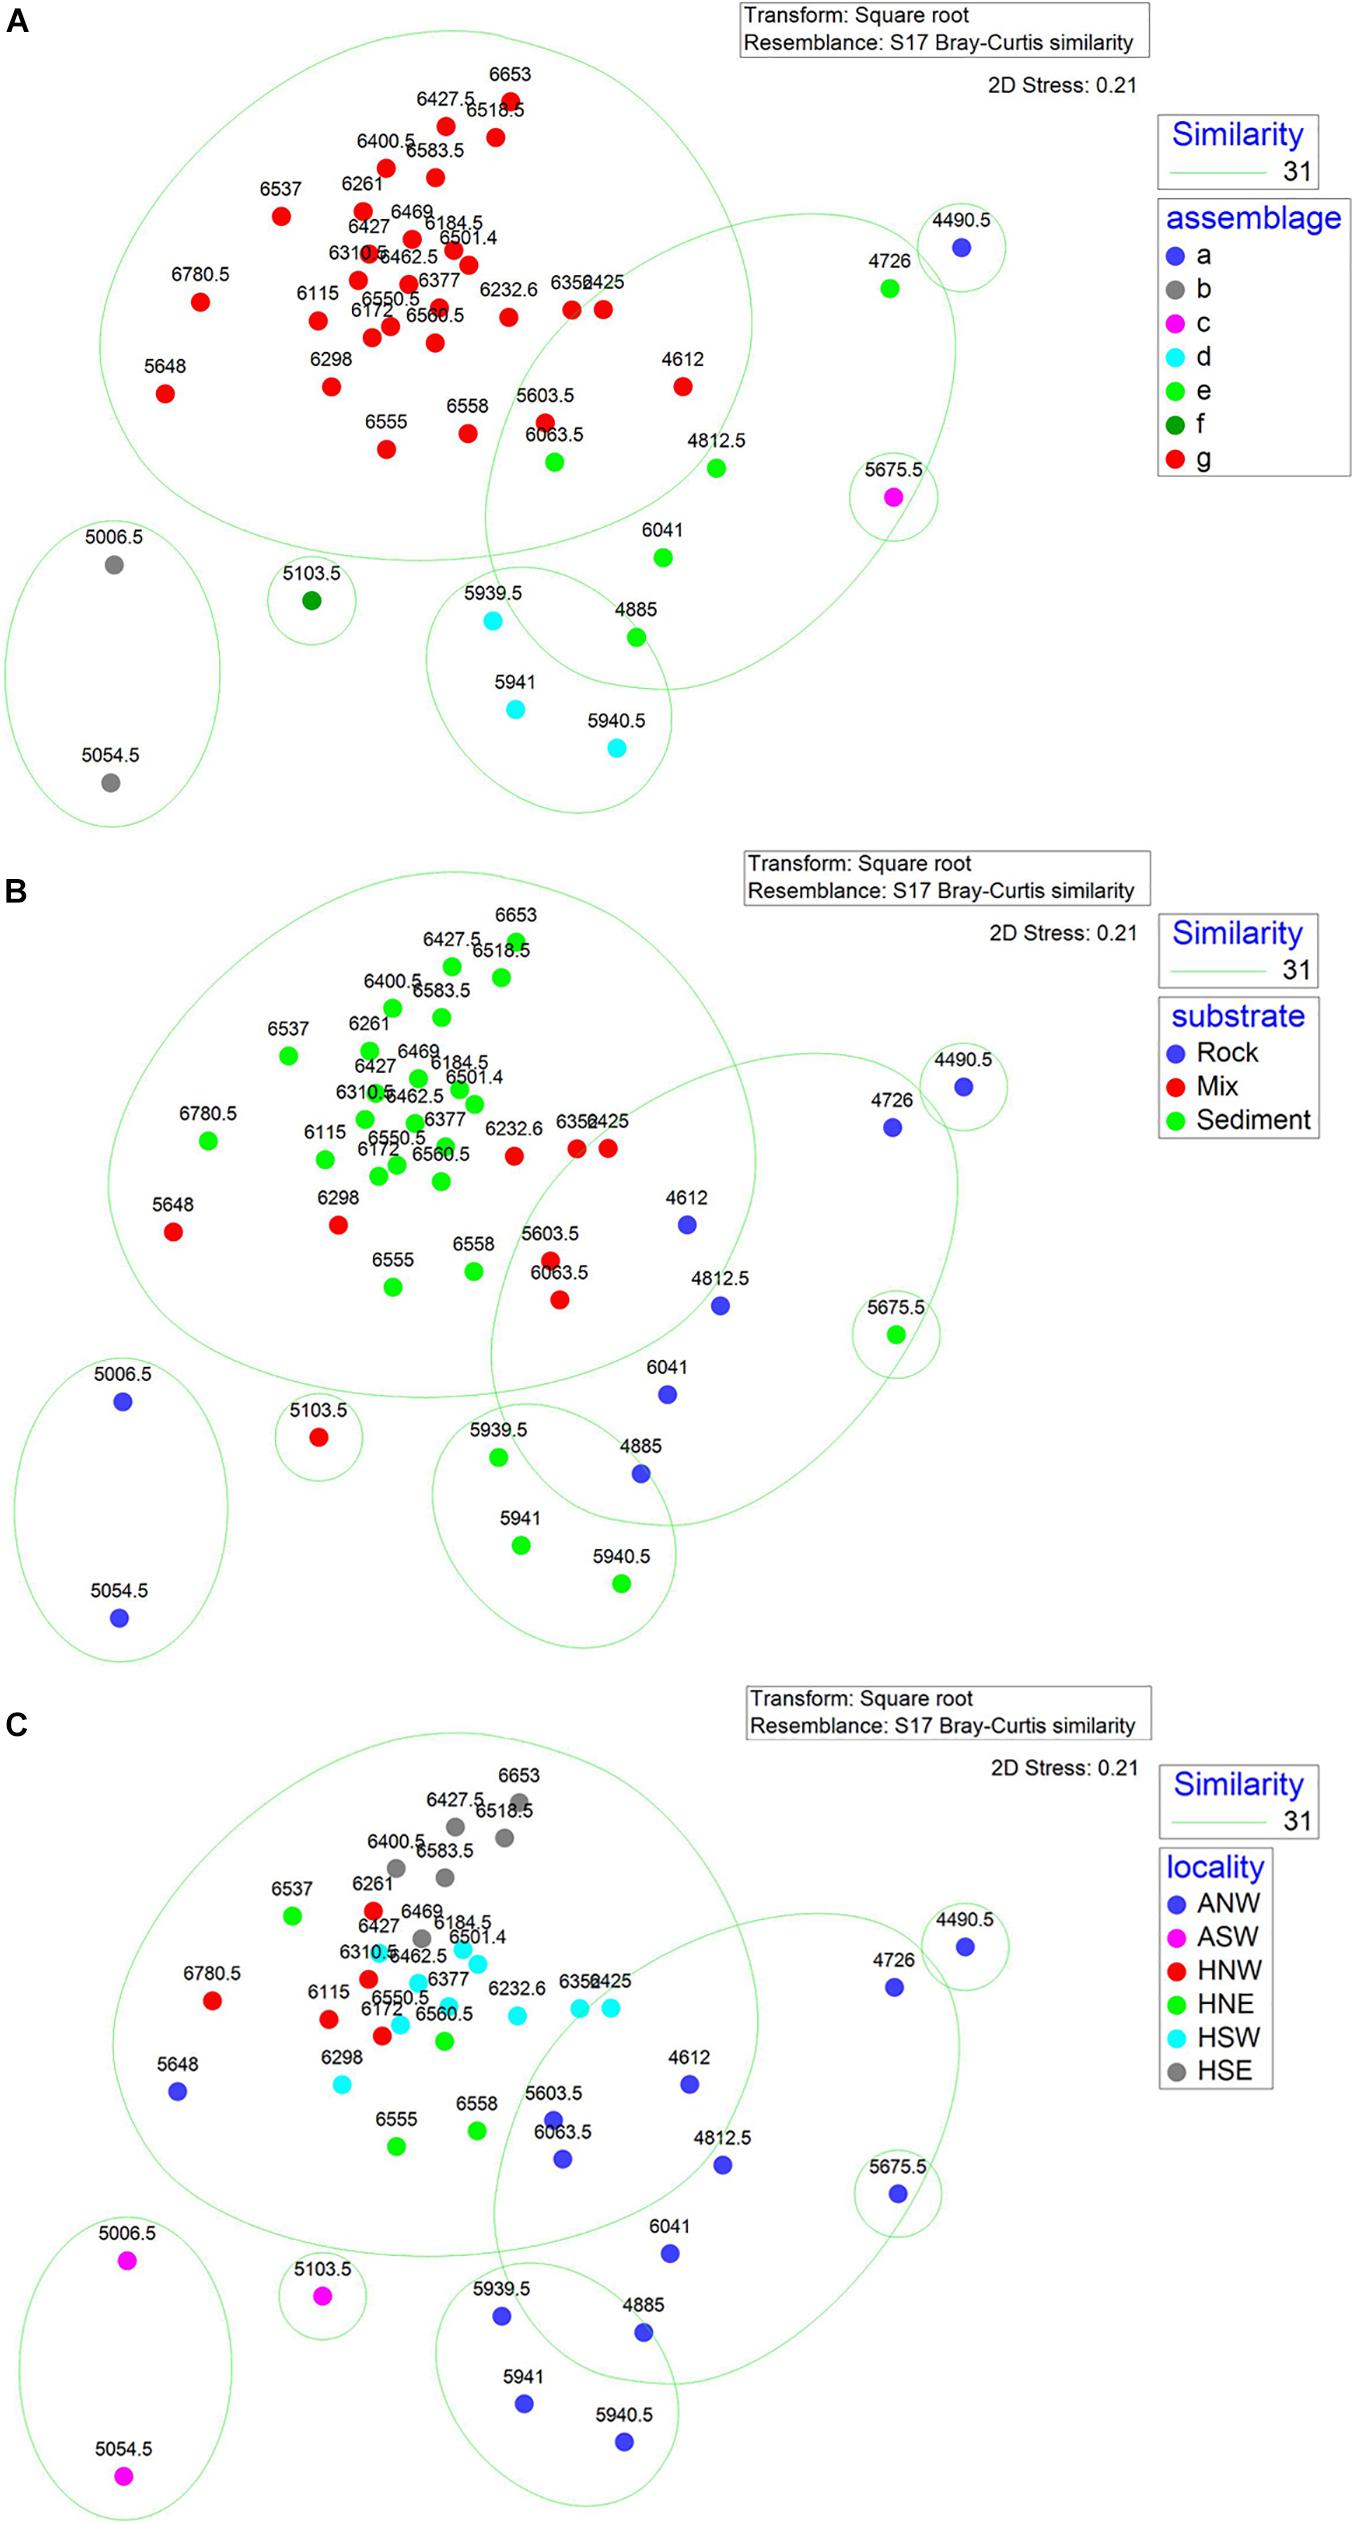
Figure 6. Non-metric multi-dimensional scaling (nMDS) plots of sampling units labeled by (A) assemblages from cluster and SIMPROF; (B) substrate type; (C) geographic position. Numbers on the dots indicate the water depth of each segment.
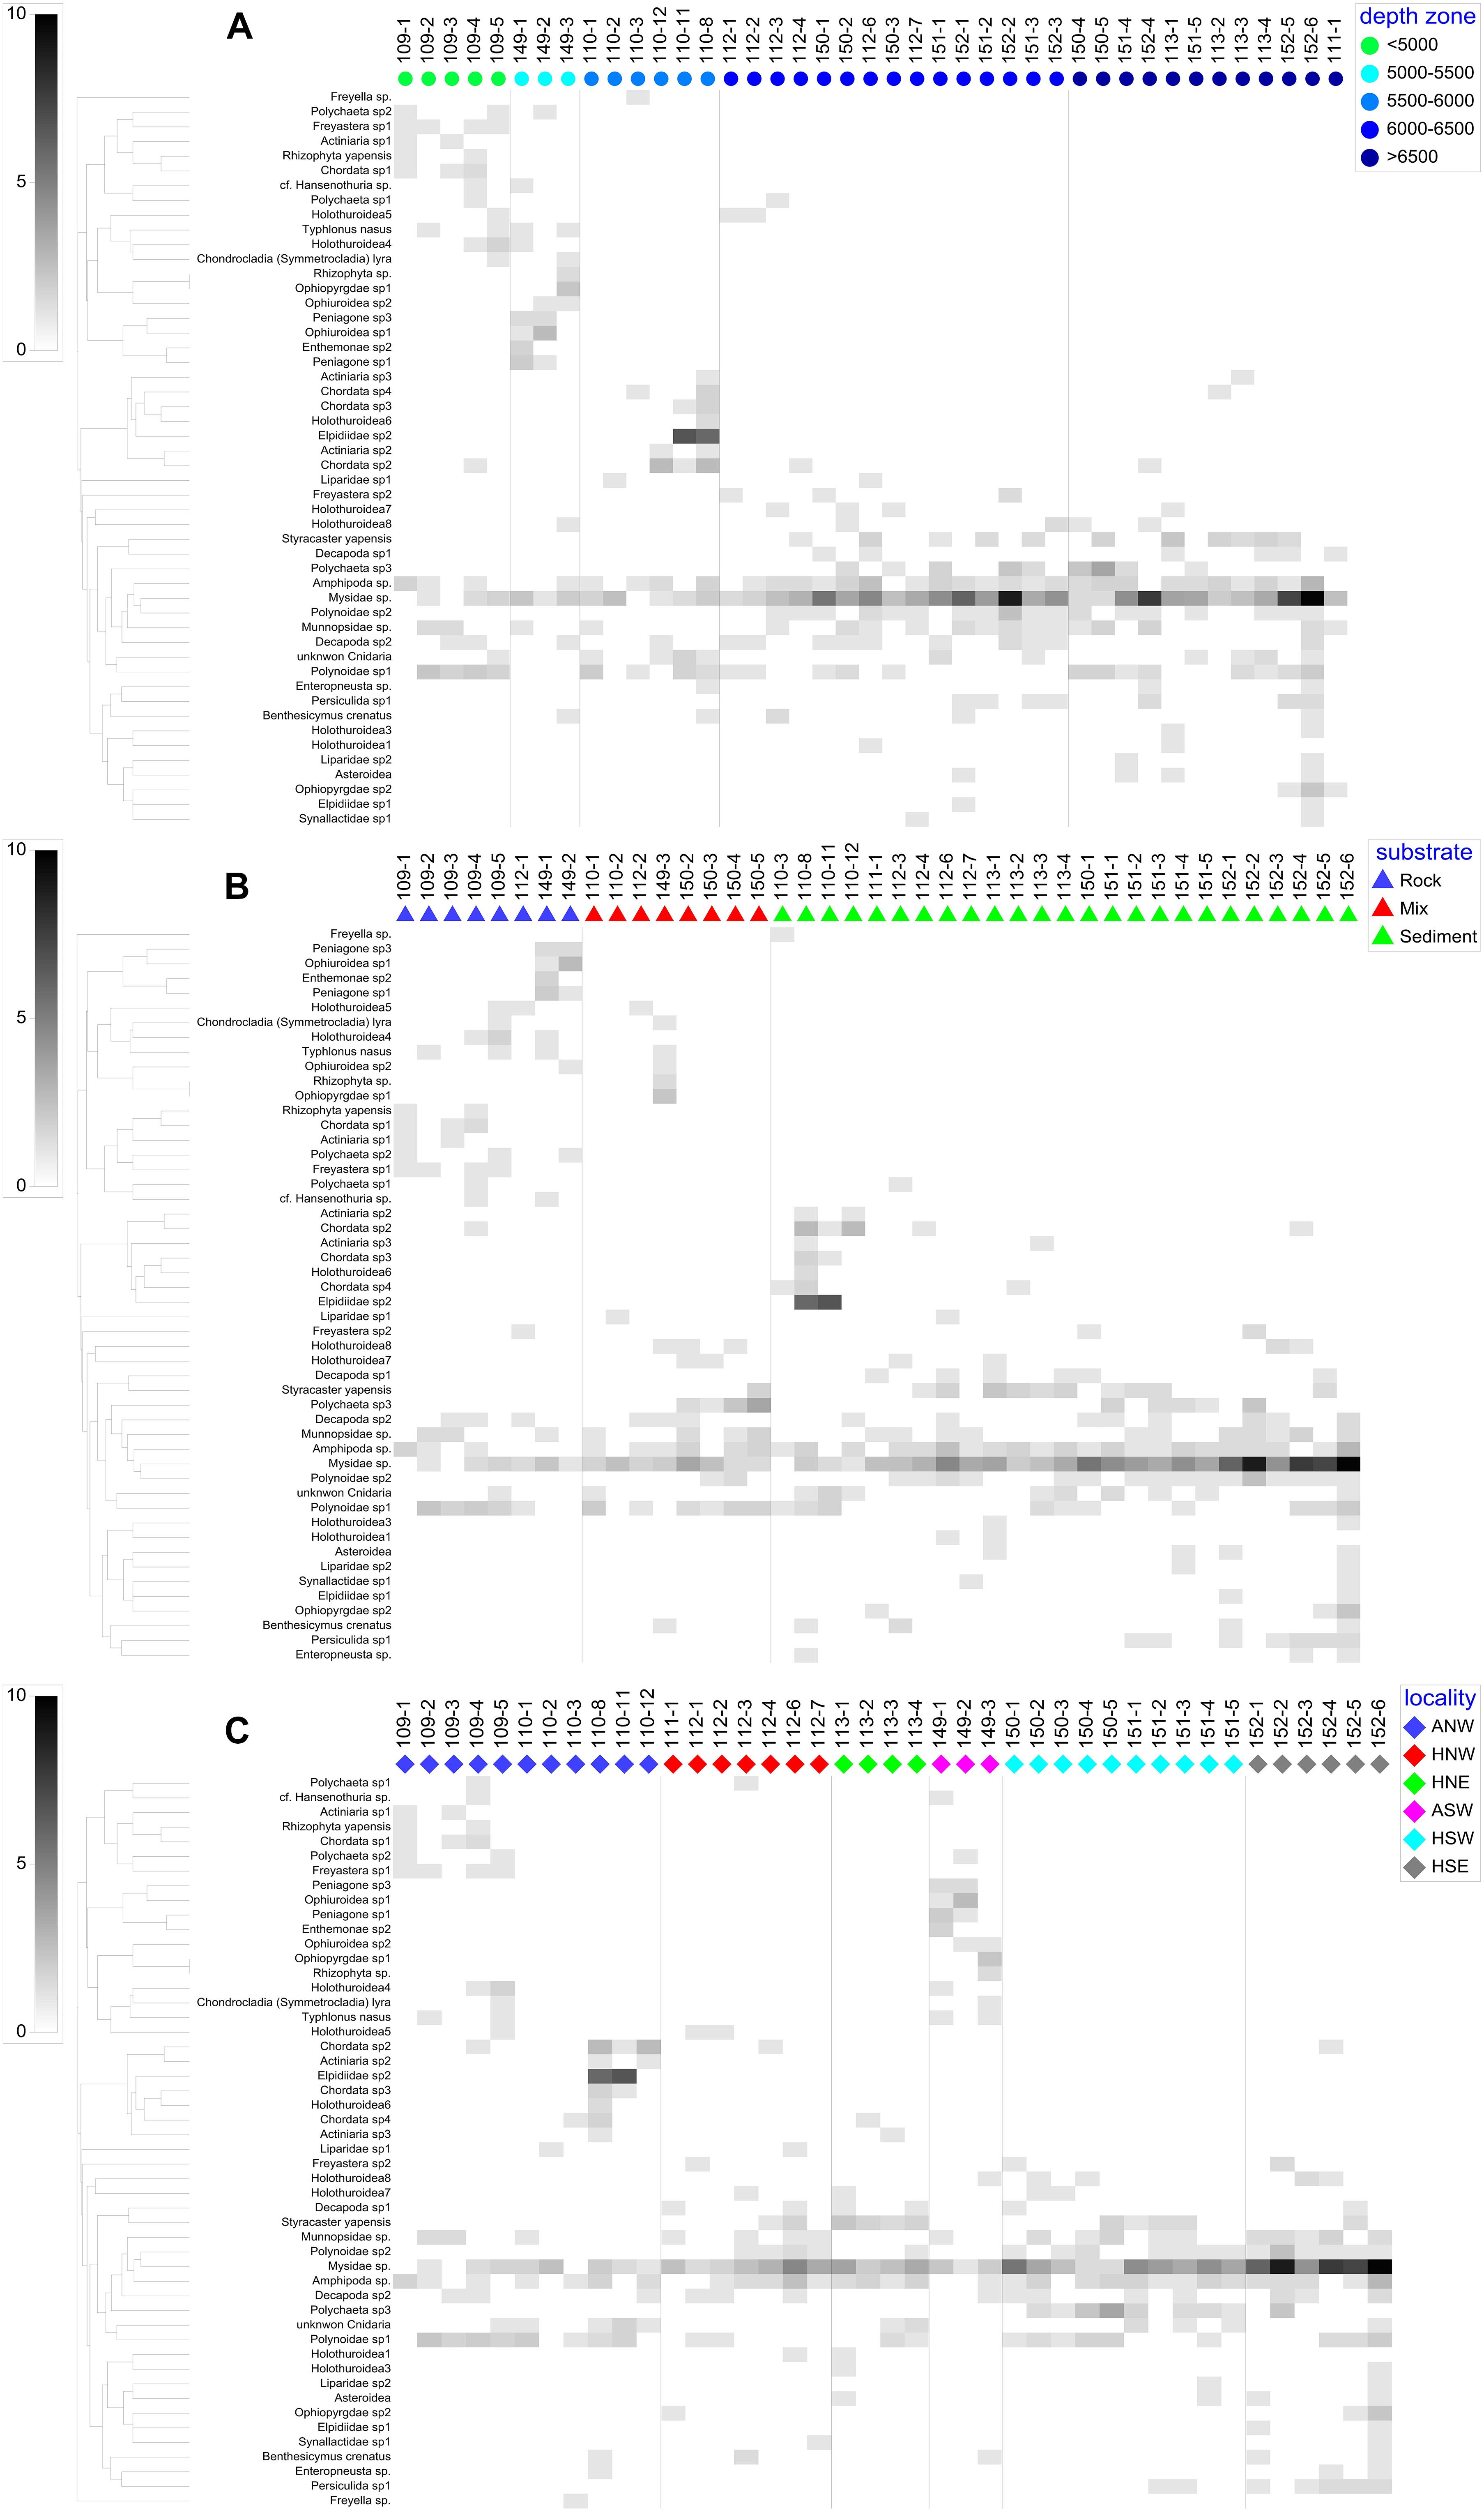
Figure 7. Shade plots showing the variation of megafaunal communities in the Yap Trench with (A) depth zone, (B) substrate type, and (C) locality.
To test the relationship between megafauna and environmental factors, PERMANOVA and PERMDISP were conducted. The results revealed a significant influence of depth and locality on megafauna communities, substrate was only significant through PERMANOVA analysis (Table 3). Pairwise comparisons of PERMDISP showed significant differences between AZ and UHZ or LHZ, but no significant difference between UHZ and LHZ (Table 4).
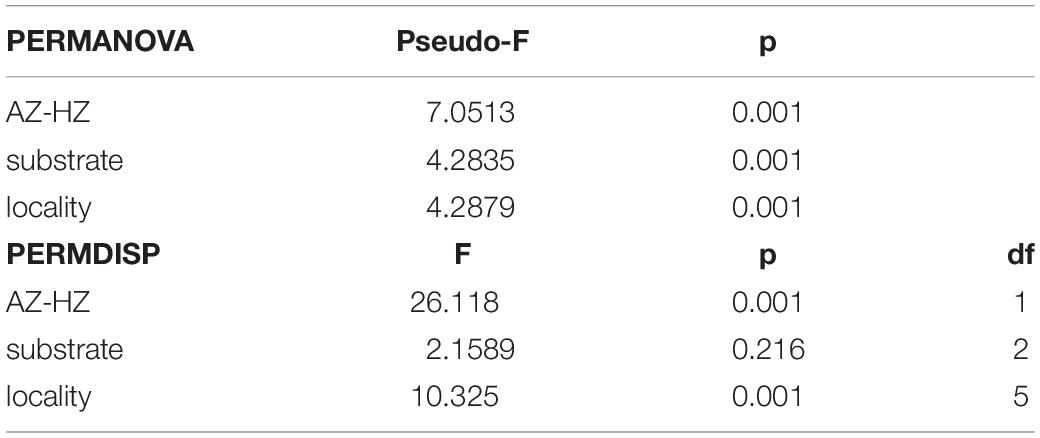
Table 3. Results of PERMANOVA and PERMDISP analysis.
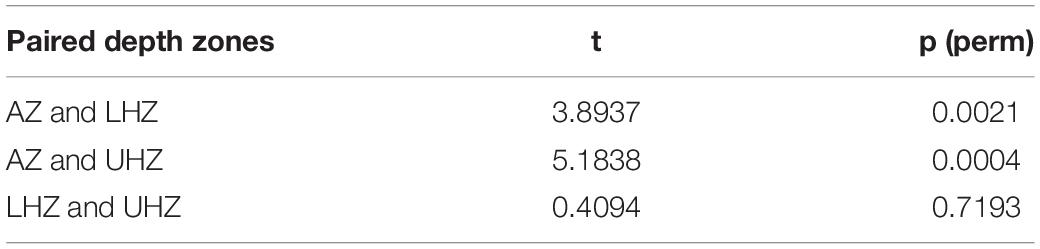
Table 4. Pairwise comparisons in PERMDISP among SUs from AZ (<6,000 m), UHZ (6,000–6,500 m), and LHZ (>6,500 m) in the Yap Trench.
The DistLM analysis was conducted to identify the environmental factors responsible for megafauna community structure. Marginal tests revealed significant effects from all four factors, with depth and substrate accounting for 15.91 and 13.67%, respectively, and the other two variables accounting for less than 10% of total variation. Sequential tests revealed that the best model included all four factors and accounted for 32.94% of the total variation (Table 5). The dbRDA plot showed that the distribution of SUs along the first axis mainly reflected the influence of depth. Sampling units from deep water (depth > 6,000 m) distributed at the left side of the first axis supporting 6,000 m as a boundary between abyssal and hadal zone. Slope and latitude mainly structured SUs along the second axis, whereas substrate structured SUs on both axes (Figure 8).
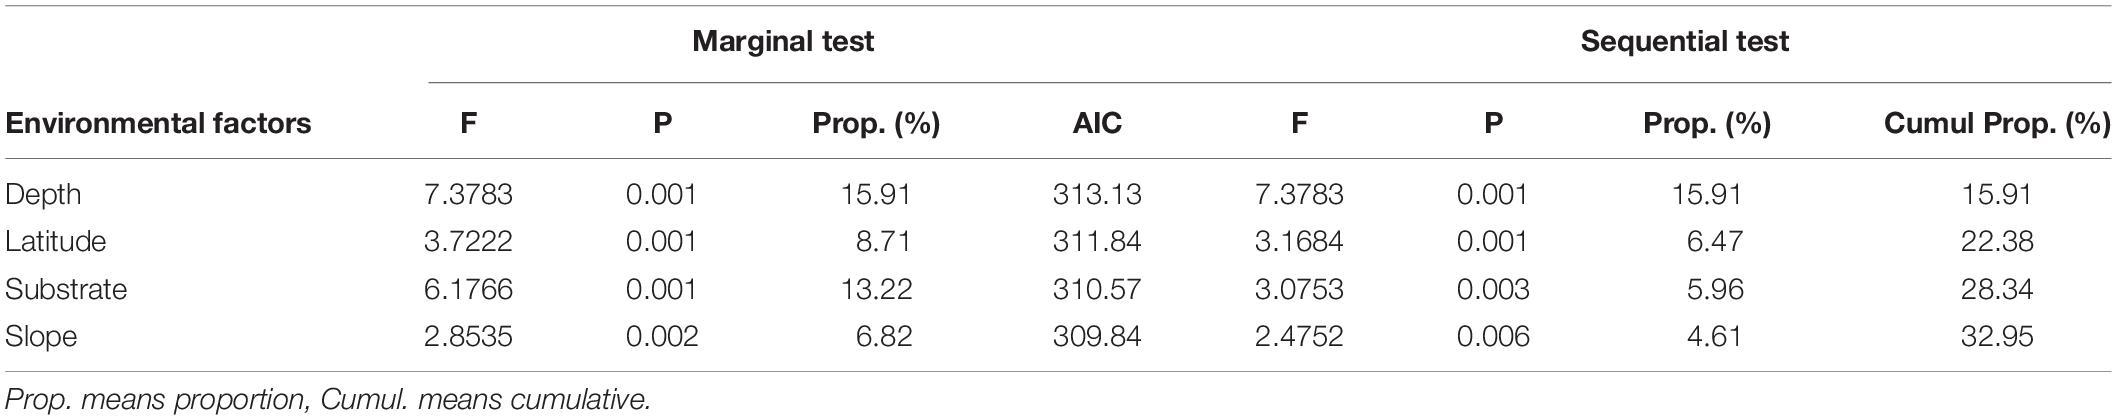
Table 5. Results of DistLM analyses on megafaunal community and environmental factors.
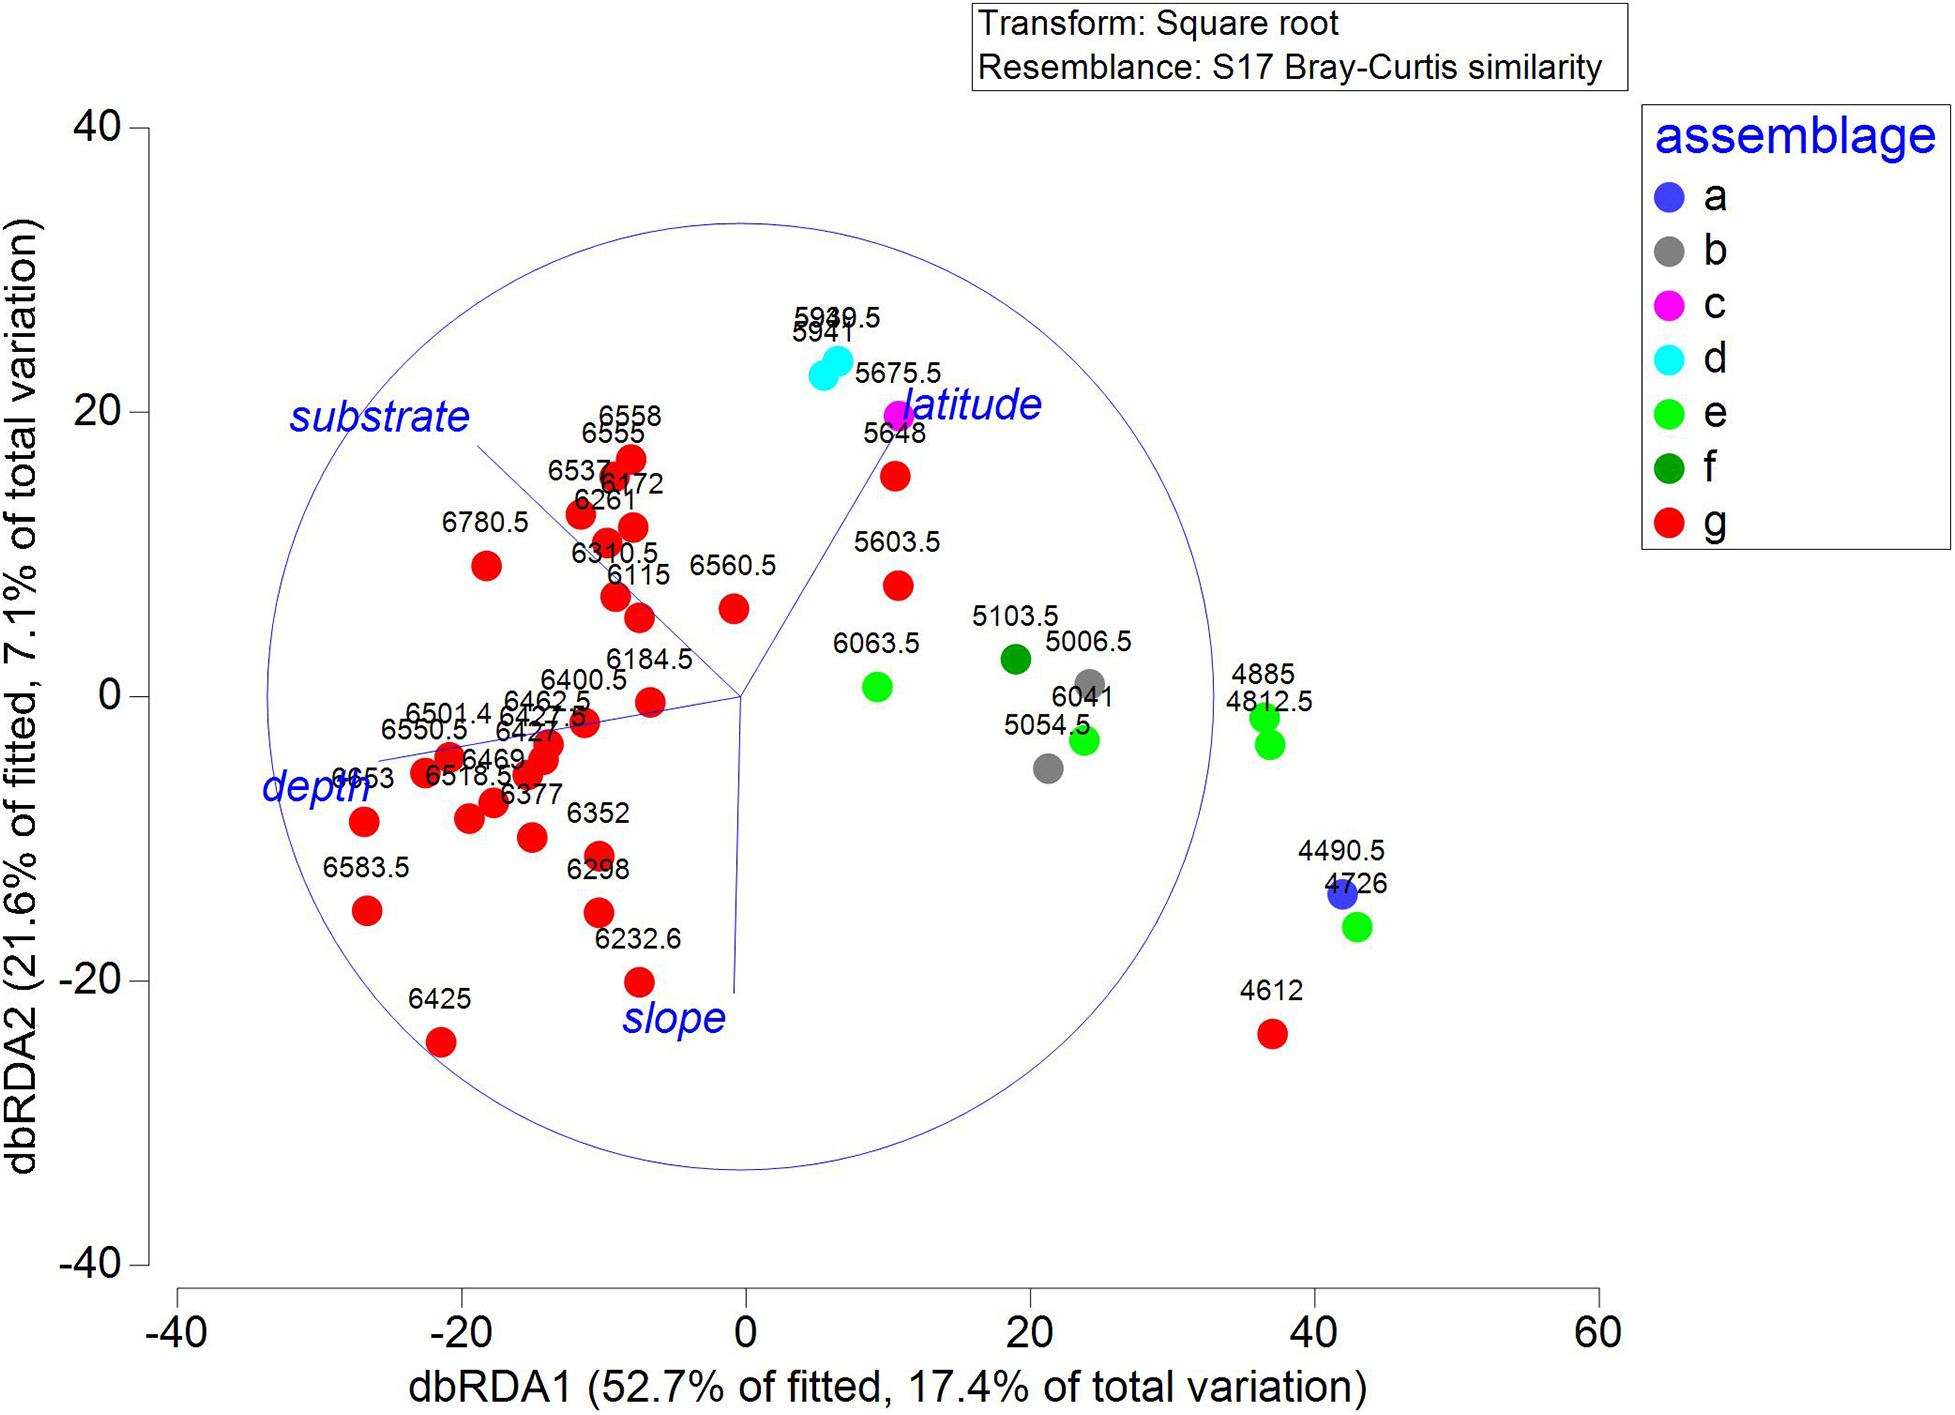
Figure 8. Distance-based redundancy analysis (dbRDA) plots showing ordination of the DistLM model, sampling units are labeled by SIMPER assemblages and water depth, the lengths of overlaid vectors indicate the relative influence of the fitted predicting factors.
The linear gradient of SUs was tested to significantly affect the community distribution. The spatial analysis suggested that the environmental factors and spatial structure totally explained 14.68% of the variation of the megafauna. Of the 13.27% variation explained by significant environmental factors, 9.91% was linearly structured and only 3.36% was associated with just local environmental conditions. In addition, the linear trend explained 11.32% variation, of which merely 1.41% were independent to environmental factors (Supplementary Figure S2).
Since the early hadal expeditions during 1950–1960 (Barham et al., 1967; Lemche et al., 1976; Belyaev, 1989), only a few video expeditions had been conducted to survey the hadal trench sea floor, such as the DEEPSEA CHALLENGER expeditions (Gallo et al., 2015) and the five deeps expeditions by the DSV Limiting Factor (Jamieson, 2020). Although it is challenging to identify animals from video and images to species level, the video expeditions provide more comprehensive information of community (Aguzzi et al., 2019).
In the Yap Trench, twenty-one species from hadal zone were reviewed and summarized (Belyaev, 1989; Jamieson, 2015), and three more species were recently reported (Zhang et al., 2017, 2019; Wang et al., 2018). Fauna knowledge from previous research were mostly based on trawling specimens, among which small epibenthic animals with weak mobility were dominant. These animals mainly include mollusks, polychaetes and small crustaceans, which are easily ignored by camera surveys (Lemche et al., 1976; Gallo et al., 2015). Video data from this study described a more comprehensive megafauna community compared to the previous results, but small animals which are dominant in trawling samples might not be taken into account and identified properly.
Crustacea and Polychaeta are the most diverse groups of the hadal fauna (Belyaev, 1989; Jamieson, 2015). According to previous studies, more than 77 known species of 42 genera belonging to the order Amphipoda were recorded at hadal depths (Jamieson, 2015). However, due to their small body size, identification through camera could be difficult (Lemche et al., 1976). Additionally, crustaceans and polychaetes are sometimes infaunal and such diversity would not be recorded by visual surveys. In this study, large numbers of crustaceans and polychaetes were observed, but only six and five msps were identified, respectively. Therefore, the diversity of these animals was certainly underestimated, which should be complemented by other sampling methods. Mollusca is another important component of the hadal fauna and reported from several hadal trenches (Belyaev, 1989; Linse and Schwabe, 2018; Kamenev, 2019). In the Yap Trench, five mollusk species were collected by trawling in the middle of last century (Belyaev, 1989), recently two chiton specimens were collected from surface of sediment during the same cruise of this study (Wang et al., 2018). However, no mollusks were observed by the HOV in this study, as well as previous camera investigations (Lemche et al., 1976; Gallo et al., 2015), which may be attributed to their small body size and indistinguishable color (Jamieson, 2015).
This is the first report of fishes in the Yap Trench with seven msps identified, dominated by three different snailfishes in hadal depths. Two snailfishes were morphologically similar to the “Ethereal snailfish” and the “Mariana snailfish” reported from the Mariana Trench (Linley et al., 2016; Gerringer et al., 2017a), indicating a potential connectivity between the two adjacent trenches (Watling et al., 2013; Ritchie et al., 2017). Snailfishes are the top predator in hadal trenches. Before this study, they were mainly observed by baited landers (Jamieson et al., 2009c; Fujii et al., 2010; Linley et al., 2016), except in the Puerto-Rico Trench by the bathyscaphe Archimède (Pérès, 1965). According to the video data from baited landers, snailfish is likely targeting swarms of amphipods that are feeding on squid or fish remains (Gerringer et al., 2017b; Linley et al., 2017), swimming in an irregular spiral pattern, as well as temporarily resting in an unbalanced arched position (Pérès, 1965; Fujii et al., 2010). However, it was suggested that the active swimming observed by lander may be a response to the presence of amphipods attracted by the bait (Jamieson et al., 2009a).
In this study, four of the five observed snailfishes were discovered resting on the sea floor rather than swimming to search the prey. The hadal trench is an extremely food-limited environment, our results showed that the average abundance of amphipods in hadal depth is only 2.4 ind./200 m. Predation might be energy costly and any excessive swimming may result in the rapid exhaustion for snailfishes (Fujii et al., 2010). Less activity is more likely an energy-conserving response to the extremely food-limited environment (Sogard et al., 1996). Therefore, although with only a few records, our results present a different possibility of the snailfish behavior that rest routinely while prey periodically. Further researches are necessary to test this hypothesis.
Zoarcidae was only recently observed at hadal depth in the New Hebrides Trench and the Mariana Trench (Linley et al., 2016). In this study, it was discovered in the hadal depth of the Yap Trench, further confirming the presence of zoarcids in hadal trench. Holothuroidea was the most diverse group of hadal fauna in the Yap Trench, with 12 msps identified in hadal zone, including different types such as benthopelagic and benthic holothuroids (Supplementary Table S2). Their large body size and characteristic appearance facilitate identification from images (Lemche et al., 1976). Most msps are of low abundance in this study, which is possibly because HOV dives mainly covered the slope but did not reach the axis of the trench where the food resources are elevated due to the funnel effect (Ichino et al., 2015). At D110, however, large gathering of Elpidiids were observed, which might be owing to the special topography (sea 4.3 for detailed discussion). Ophiuroidea and Crinoidea are reported in many other hadal trenches before (Jamieson, 2015; Mironov et al., 2019), this study is the first report of these two groups of Echinoderms in the Yap Trench. One msp of Ophiuroid belonging to Ophiopyrgidae was discovered on the surface of sediment from both north and south sections. One crinoid was collected and identified to the genus Bathycrinus, a dominant stalked crinoid in the hadal zone (Mironov, 2019).
Additionally, Hemichordata and Ctenophora were also firstly reported in the Yap Trench. Hemichordata is a prominent member of the epibenthic community in the deep sea (Osborn et al., 2011), which has been reported from several hadal trenches in both the Pacific and Atlantic Ocean (Jamieson, 2015; Brandt et al., 2018). Besides the single observation of Hemichordata, many of their traces were observed majorly from the surface of sediment, just as previous observations (Heezen and Hollister, 1971; Lemche et al., 1976; Gallo et al., 2015). Only two records of Ctenophora in hadal trench has been published by now, from the Ryukyu Trench (Lindsay and Miyake, 2007) and the New Britain Trench (Gallo et al., 2015). The ctenophore observed in the Yap Trench is morphologically similar to that in the Ryukyu Trench, possessing long white reflective structures arranged in pairs along edges of their rectangular box-shaped body, but the two long flexible filaments, it possibly belongs the order Cydippida (Podar et al., 2001).
Depth has been proven to be one of the strongest environmental factors affecting megafaunal communities in deep sea environments, including continental slope, seamounts, and the hadal trenches (Carney, 2005; Blankenship et al., 2006; McClain et al., 2010; Lacey et al., 2016; Linley et al., 2017; Schmidt et al., 2019). However, the boundary between the abyssal and hadal zones is still controversial. A wide transition zone had been suggested between them, ranging from 6,000 to 6,500 m (Wolff, 1970; Belyaev, 1989). Recently, a boundary was indicated, lying differently between 5,600–6,000 m and 6,097–6,709 m for different trenches (Lacey et al., 2016). In this study, the DistLM model selected the depth as the major factor driving the distribution of megafauna in the Yap Trench, accounting for 15.91% of the variance in megafauna species composition (Table 4 and Figure 7A).
The differentiation of species composition between the abyssal and hadal zones (Figure 7) may be one of the results under the influence of water depth. Mysidae spp. contributed most to hadal and abyssal fauna differences, according to the SIMPER analysis, with a distinct increase in abundance from the abyssal to the hadal zone. On the contrary, the abundance of fish was higher in the abyssal than the hadal zone, showing an opposite vertical distribution pattern to mysids (Figure 9). It was suggested that mysids and some other crustaceans other than amphipods, contributed a large proportion of prey items for typical abyssal fish, such as Macrourids, Ophidiids, and Zoarcids, whereas amphipods comprised the majority of stomach contents for hadal snailfish (Gerringer et al., 2017b). In this study, abyssal fishes were composed of two species of Ophidiidae, four unknown species, and only one species of Liparidae, while the hadal fish fauna was dominated by three Liparids. Therefore, the increasing abundance of mysids from the abyssal to the hadal zone may be attributed to less predation pressure.
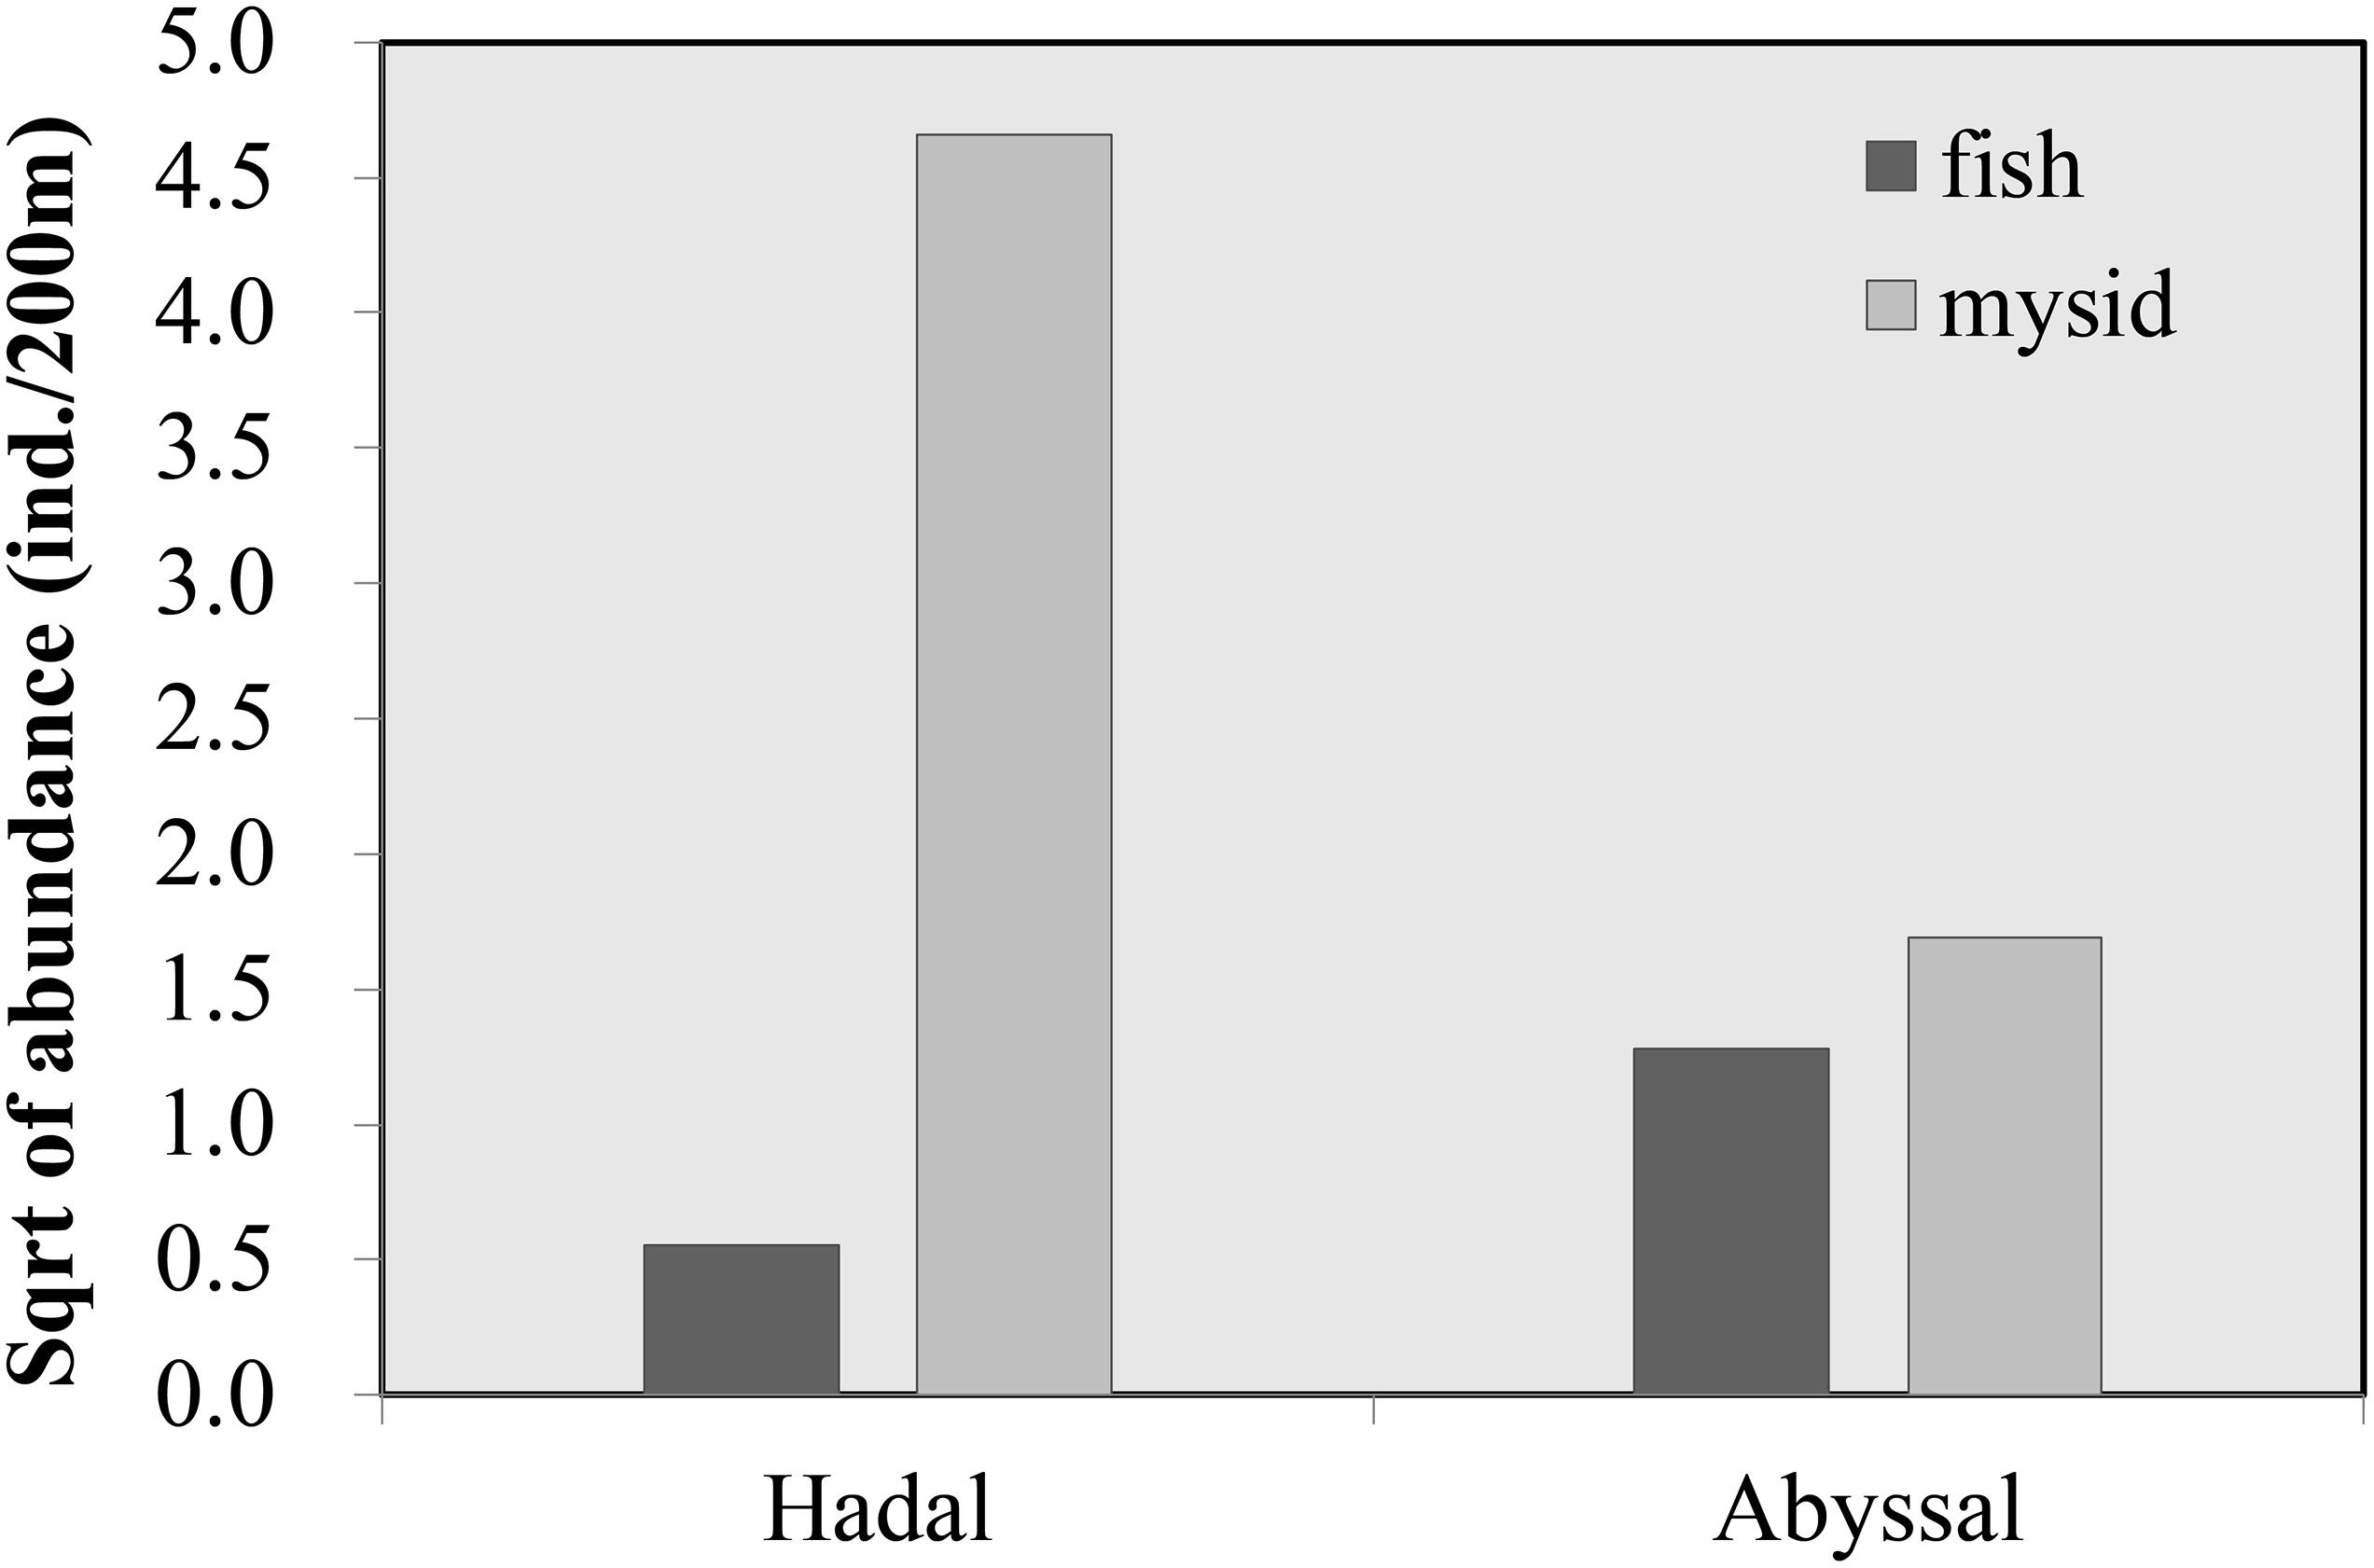
Figure 9. Comparison of the vertical distribution of fish and mysids between the abyssal and hadal zones.
Multiple-trench analysis suggested that the distinction between abyssal and hadal fauna may vary between trenches (Lacey et al., 2016). However, data from previous studies were discontinuous, so sampling with finer scale between 6,000 and 7,000 m is needed to confirm the transition pattern from abyssal to hadal (Jamieson et al., 2011). This study provided a more continuous and consistent dataset, and the results suggested a high faunal similarity within the hadal zone, even between UHZ and LHZ, as well as a clear difference between abyssal and hadal fauna (Figure 7A and Table 4), which supported that 6,000 m might be more suitable as the boundary between the abyssal and hadal zones in the Yap Trench than 6,500 m. However, what needs to be noted is that megafauna from hadal zone below 7,000 m (Wolff, 1970) was not investigated in this study. Comparing to Belyaev’s data (1989) of the trawled megafauna in the Yap Trench below 7,000 m depth, apparent difference can be easily noticed between the two datasets, which might be due to the differences of either sampling methods or sampling depths. Further investigations in the future using consistent data collected by modern survey methods to full depth are needed to confirm megafauna zonation patterns in the Yap Trench.
There is a growing realization in hadal science that ecological patterns and processes are not driven solely by responses to hydrostatic pressure (Stewart and Jamieson, 2018), with comparable levels of habitat heterogeneity as observed in other more accessible marine habitats cold seeps (Levin et al., 2016), hydrothermal vents (van Dover, 2000), sub-marine canyons (e.g., Amaro et al., 2016; Fernandez-Arcaya et al., 2017) and seamounts (e.g., Rowden et al., 2005). It had been hypothesized that higher seafloor heterogeneity supports larger variability of megabenthic assemblages (De Leo et al., 2010; McClain and Barry, 2010; Lacharité and Metaxas, 2017; Schmidt et al., 2019).
Multivariate analysis in this study revealed that substrate is an important environmental factor structuring the megafaunal species composition, accounted to 13.22% of the explanation individually (Table 5). Hard and mixed substrates account for higher sea floor coverage in the abyssal zone, whereas soft sediment is prevalent in the hadal zone (Table 2). Our observations showed that benthic sessile fauna, such as sponges and actiniarians, were mostly restricted to hard or mixed substrates, whereas small crustaceans such as mysids, amphipods, and munnopsids dominated the sedimentary seafloor (Figure 7B). A trend of reduction in the munnopsid abundance from abyssal to hadal depths was revealed in the Puerto–Rico Trench and Kuril–Kamchatka Trench (Brandt et al., 2018; Malyutina and Brandt, 2020). In contrast, the abundance of munnopsids increased with depth in the Yap Trench, which may be attributed to the higher sediment coverage in the hadal zone.
Jamieson et al. (2011) suggested that there was an abrupt abyssal–hadal transition in the Kermadec Trench, which may be attributed to the abrupt change in seafloor topography. There are two slope breaks which divide the arc-ward slope of the Yap Trench into three parts with different topography (Yang et al., 2017). The middle part between the two slope breaks (between ∼5,300 and 6,000 m) is gentle with an average slope angle of 4° (Yang et al., 2017). The lower slope break overlapped the proposed boundary between abyssal and hadal zones in the Yap Trench, suggesting that this abrupt change of topography may play important role in structuring the megafanua, leading to an ecotone across the abyssal-hadal transition as well as in the Kermadec Trench (Jamieson et al., 2011). Furthermore, numerous holothuroids with the abundance reached up to 44 ind./200 m, were discovered around the lower slope break (∼5,940 m), where there is a long sedimentary platform with slightly reversed slope angle (Figure 10). This slight V-shape topography is analogous to a miniature trench on the slope, possibly favoring the accumulation of POC (Danovaro et al., 2003) and providing a food source rich habitat. This may explain the gathering of deposit-feeding holothuroids. This “hotspot” of megafauna on the slope further highlighted the importance of habitat heterogeneity in structuring megafaunal community, providing guidance for future investigation.
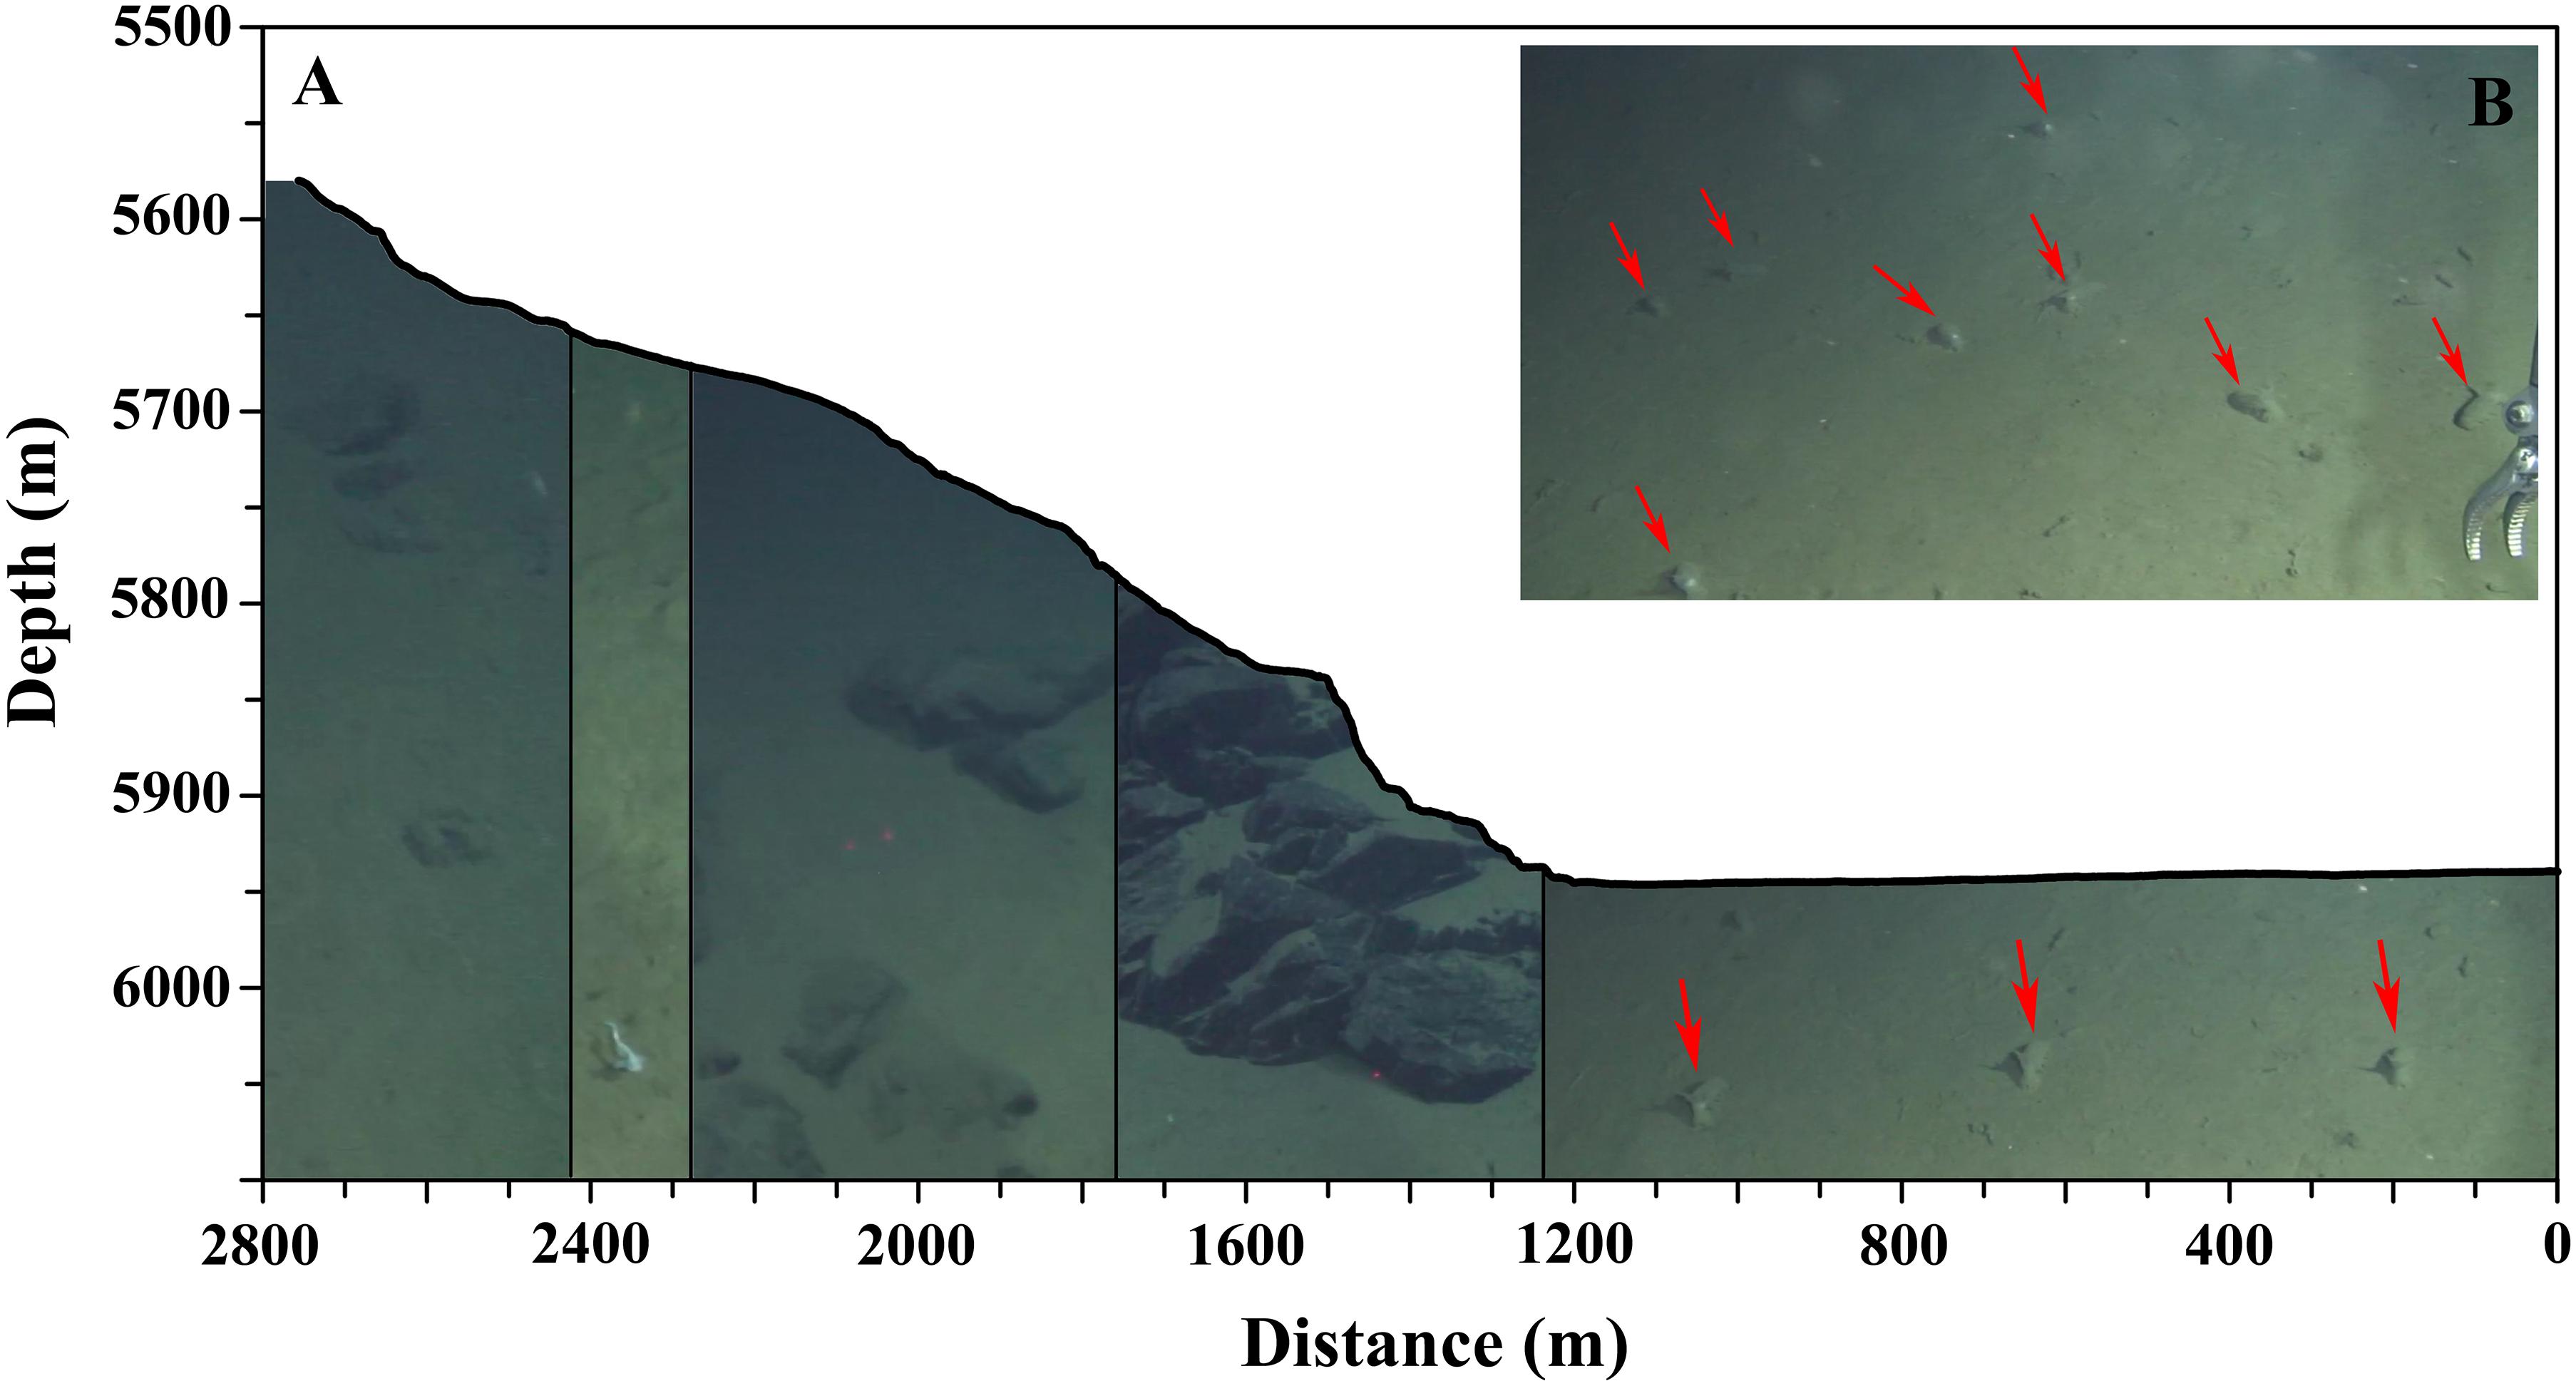
Figure 10. (A) survey profile of D110, pictures indicate different types of substrates; (B) several holothuroids in one frame. Red arrows indicated deposit-feeding elpidiids.
Study of the unique hadal trench fauna has been challenging because of the limited access to the extreme deep ecosystems. This study demonstrated the megafaunal community in the Yap Trench, revealing 80 msps of 8 phyla, most of which were reported for the first time, distinctly improving our knowledge of megafauna in the Yap Trench. Most SUs from hadal zone were highly similar to each other but were dissimilar to SUs from abyssal zone. A transition pattern of megafauna from abyssal zone to hadal zone was also proposed. Four environmental factors of depth, substrate, slope and latitude were suggested as key driven factors in structuring megafaunal community. Among which, depth played the most important role, with 6,000 m proposed as the boundary between abyssal and hadal zone. Two slope breaks along the arc-ward slope of the Yap Trench may play significant role in depth zonation of megafauna, further confirming the importance of habitat heterogeneity in ecological patterns and processes in hadal science.
This study was limited to 7,000 m maximum depth due to technological restrictions. Further study including the hadal zone below 7,000 m will be necessary to fully assess megafauna zonation patterns in the Yap Trench.
All datasets generated for this study are included in the article/Supplementary Material, further inquiries can be directed to the corresponding author/s.
DZ and CW conceptualized the study. DZ, YZ, JY, BL, and CW (chief scientist) participated in the research cruise and collected data. DZ, YZ, TL, RZ, BL, PX, CS, SL, DS, and XW performed the morph-species identification. DZ and JY performed environmental data analysis. DZ, TL, and YW performed the statistical analysis. DZ and CW wrote the manuscript with contributions from YZ, JY, TL, and RZ. All authors contributed to the article and approved the submitted version.
This study was funded by the National Program on Key Basic Research Project of China by the Ministry of Science and Technology of the People’s Republic of China (No. 2015CB755902), the National Key Research and Development Program of China (2017YFC0306604), and the Foundation of China Ocean Mineral Resources Research and Development Association (No. DY135-E2-2-03).
The authors declare that the research was conducted in the absence of any commercial or financial relationships that could be construed as a potential conflict of interest.
We thank the two reviewers for their corrections and comments that much improved the manuscript. We would like to thank the Jiaolong team from the National Deep Sea Center for their excellent job in the control and maintenance of the HOV during the sea investigation. We would also like to thank Marymegan Daly, Alexander Mironov, Tina Molodtsova, Timothy O’Hara, Estefania Rodriguez, Valcana Stoyanova, Ning Xiao, and Qi Kou for helping identify animals from video records. We also thank Zhang Tongwei and Xu Weikun for their help processing the USBL data.
The Supplementary Material for this article can be found online at: https://www.frontiersin.org/articles/10.3389/fmars.2021.617820/full#supplementary-material
Supplementary Figure 1 | Representative pictures of morph-species in the Yap Trench.
Supplementary Figure 2 | Spatial analysis of contributions of spatial and environmental factors in explaining the community structure.
Supplementary Table 1 | Eight categories of seabed substrates and their composition among bedrock, gravel, and sediment.
Supplementary Table 2 | Pairwise correlation of the six environmental factors.
Supplementary Table 3 | Taxa list of megafauna of the Yap Trench.
Aguzzi, J., Chatzievangelou, D., Marini, S., Fanelli, E., Danovaro, R., Flögel, S., et al. (2019). New high-tech flexible networks for the monitoring of deep-sea ecosystems. Environ. Sci. Technol. 53, 6616–6631. doi: 10.1021/acs.est.9b00409
Amaro, T., Huvenne, V. A. I., Allcock, A. L., Aslam, T., Davies, J. S., Danovaro, R., et al. (2016). The Whittard Canyon – a case study of submarine canyon processes. Prog. Oceanogr. 146, 38–57. doi: 10.1016/j.pocean.2016.06.003
Anderson, M. T., Gorley, R. N., and Clarke, K. R. (2008). PERMANOVA+ for PRIMER: Guide to Software and Statistical Methods. Plymouth: PRIMER-E.
Bao, R., Strasser, M., McNichol, A. P., Haghipour, N., McIntyre, C., Wefer, G., et al. (2018). Tectonically-triggered sediment and carbon export to the Hadal zone. Nat. Commun. 9:121. doi: 10.1038/s41467-017-02504-1
Barham, E. G., Ayer, N. J., and Boyce, R. E. (1967). Macrobenthos of the San Diego Trough: photographic census and observations from bathyscaphe, Trieste. Deep Sea Res. Part I 14, 773–784. doi: 10.1016/S0011-7471(67)80013-5
Belyaev, G. M. (1966). Bottom fauna of the ultra-abyssal depths of the world ocean. Akad. Nauk SSSR Inst. Okeanol. 991, 1–247.
Belyaev, G. M. (1989). Deep-Sea Ocean Trenches and Their Fauna: (Translated to English by Scripps Institution of Oceanography, USA, 2004). Moscow: Nauka Publishing House, 385.
Blankenship, L. E., Yayanos, A. A., Cadien, D. B., and Levin, L. L. (2006). Vertical zonation patterns of scavenging amphipods from the Hadal zone of the Tonga and Kermadec Trenches. Deep Sea Res. Part I 53, 48–61. doi: 10.1016/j.dsr.2005.09.006
Borcard, D., Legendre, P., and Drapeau, P. (1992). Partialling out the spatial component of ecological variation. Ecology 73, 1045–1055.
Brandt, A., Frutos, I., Bober, S., Brix, S., Brenke, N., Guggolz, T., et al. (2018). Composition of abyssal macrofauna along the Vema Fracture Zone and the hadal Puerto Rico Trench, northern tropical Atlantic. Deep Sea Res. Part II 148, 35–44. doi: 10.1016/j.dsr2.2017.07.014
Bruun, A. F. (1953). “Dybhavets dyreliv,” in Galatheas Jordomsejling 1950-1952, ed. A. F. Bruun (Copenhagen: National Library of Australia), 153–192.
Carney, R. S. (2005). Zonation of deep biota on continental margins. Oceanogr. Mar. Biol. 43, 211–279. doi: 10.1201/9781420037449.ch6
Clark, K. R., Tweedley, J. R., and Valesini, F. J. (2013). Simple shade plots aid better long-term choices of data pre-treatment in multivariate assemblage studies. J. Mar. Biol. Assoc. 94, 1–16. doi: 10.1017/S0025315413001227
Cui, W. (2013). Development of the Jiaolong deep manned submersible. Mar. Technol. Soc. J. 47, 37–54. doi: 10.4031/MTSJ.47.3.2
Danovaro, R., Della Croce, N., Dell’Anno, A., and Pusceddu, A. (2003). A depocenter of organic matter at 7800m depth in SE Pacific Ocean. Deep Sea Res. Part I 50, 1411–1420. doi: 10.1016/j.dsr.2003.07.001
Danovaro, R., Company, J. B., Corinaldesi, C., D’Onghia, G., Galil, B., Gambi, C., et al. (2010). Deep-Sea biodiveristy in the Mediterranean Sea: the known, the unknown, and the unknowable. PLoS ONE 5:e11832. doi: 10.1371/journal.pone.0011832
De Leo, F. C., Smith, C. R., Rowden, A. A., Bowden, D. A., and Clarke, M. R. (2010). Submarine canyons: hotspots of benthic biomass and productivity in the deep sea. Proc. R. Soc. B Biol. Sci. 277, 2783–2792. doi: 10.1098/rspb.2010.0462
Duffy, G. A., Horton, T., and Billett, D. S. M. (2012). Deep-sea scavenging amphipod assemblages from the submarine canyons of the Western Iberian Peninsula. Biogeosciences 9, 4861–4869. doi: 10.5194/bg-9-4861-2012
Fernandez-Arcaya, U., Ramirez-Llodra, E., Aguzzi, J., Allcock, A. L., Davies, J. S., Dissanayake, A., et al. (2017). Ecological role of submarine canyons and need for canyon conservation: review. Front. Mar. Sci. 4:5. doi: 10.3389/fmars.2017.00005
Fujii, T., Jamieson, A. J., Solan, M., Bagley, P. M., and Priede, I. G. (2010). A large aggregation of liparids at 7703 meters and a reappraisal of the abundance and diversity of hadal fish. BioScience 60, 506–515. doi: 10.1525/bio.2010.60.7.6
Fujii, T., Kilgallen, N. M., Rowden, A. A., and Jamieson, A. J. (2013). Deep-sea amphipod community structure across abyssal to hadal depths in the Peru-Chile and Kermadec trenches. Mar. Ecol. Prog. Ser. 492, 125–138. doi: 10.2307/24892783
Fujiwara, T., Tamura, C., Nishizawa, A., Fujioka, K., Kobayashi, K., and Iwabuchi, Y. (2000). Morphology and tectonics of the Yap Trench. Mar. Geophys. Res. 21, 69–86. doi: 10.1023/A:1004781927661
Gallo, N. D., Cameron, J., Hardy, K., Fryer, P., Bartlett, D. H., and Levin, L. A. (2015). Submersible- and lander-observed community patterns in the Mariana and New Britain trenches: influence of productivity and depth on epibenthic and scavenging communities. Deep Sea Res. Part I 99, 119–133. doi: 10.1016/j.dsr.2014.12.012
Gerringer, M. E., Linley, T. D., Jamieson, A. J., Goetze, E., and Drazen, J. C. (2017a). Pseudoliparis swirei sp. nov.: a newly-discovered hadal snailfish (Scorpaeniformes: Liparidae) from the Mariana Trench. Zootaxa 4358, 161–177. doi: 10.11646/zootaxa.4358.1.7
Gerringer, M. E., Popp, B. N., Linley, T. D., Jamieson, A. J., and Drazen, J. C. (2017b). Comparative feeding ecology of abyssal and hadal fishes through stomach content and amino acid isotope analysis. Deep Res. Part I Oceanogr. Res. Pap. 121, 110–120.
Heezen, B. C., and Hollister, C. D. (1971). The Face of the Deep. New York, NY: Oxford University Press, 659.
Hessler, R. R., Ingram, C. L., Yayanos, A. A., and Burnett, B. R. (1978). Scavenging amphipods from the floor of the Philippine Trench. Deep Sea Res. Part I 25, 1029–1047. doi: 10.1016/0146-6291(78)90585-4
Ichino, M. C., Clark, M. R., Drazen, J. C., Jamieson, A., Jones, D. O. B., Martin, A. P., et al. (2015). The distribution of benthic biomass in hadal trenches: a modelling approach to investigate the effect of vertical and lateral organic matter transport to the seafloor. Deep Sea Res. Part I 100, 21–33. doi: 10.1016/j.dsr.2015.01.010
Itou, M., Matsumura, I., and Noriki, S. (2000). A large flux of particulate matter in the deep Japan Trench observed just after the 1994 Sanriku-Oki earthquake. Deep Sea Res. Part I 47, 1987–1998. doi: 10.1016/S0967-0637(00)00012-1
Jamieson, A. J. (2011). “Ecology of deep oceans: hadal trenches,” in eLS, (Chichester: John Wiley and Sons, Ltd), doi: 10.1002/9780470015902.a0023606
Jamieson, A. J. (2015). The Hadal Zone: Life in the Deepest Oceans. Cambridge: Cambridge University Press.
Jamieson, A. J. (2020). The five deeps expedition and an update of full ocean depth exploration and explorers. Mar. Technol. Soc. J. 54, 6–12. doi: 10.4031/MTSJ.54.1.1
Jamieson, A. J., Boorman, B., and Jones, D. O. (2013). “Deep-sea benthic sampling,” in Methods for the Study of Marine Benthos, eds A. Eleftheriou and A. McIntyre (Chichester: John Wiley and Sons), 285–347.
Jamieson, A. J., Fujii, T., Mayor, D. J., Solan, M., and Priede, I. G. (2010). Hadal trenches: the ecology of the deepest places on Earth. Trends Ecol. Evol. 25, 190–197. doi: 10.1016/j.tree.2009.09.009
Jamieson, A. J., Fujii, T., Solan, M., Matsumoto, A. K., Bagley, P. M., and Priede, I. G. (2009a). First findings of decapod crustacea in the hadal zone. Deep Sea Res. Part I 56, 641–647. doi: 10.1016/j.dsr.2008.11.003
Jamieson, A. J., Fujii, T., Solan, M., and Priede, I. G. (2009b). HADEEP: free-falling landers to the deepest places on Earth. Mar. Technol. Soc. 43, 151–159. doi: 10.4031/MTSJ.43.5.17
Jamieson, A. J., Fujii, T., Solan, M., Matsumoto, A. K., Bagley, P. M., and Priede, I. G. (2009c). First findings of decapod crustacea in the hadal zone. Deep-Sea Res. I 56, 641–647.
Jamieson, A. J., Kilgallen, N. M., Rowden, A. A., Fujii, T., Horton, T., Lörz, A.-N., et al. (2011). Bait-attending fauna of the Kermadec Trench, SW Pacific Ocean: evidence for an ecotone across the abyssal–hadal transition zone. Deep Sea Res. Part I 58, 49–62. doi: 10.1016/j.dsr.2010.11.003
Jamieson, A. J., and Vecchione, M. (2020). First in situ observation of Cephalopoda at hadal depths (Octopoda: Opisthoteuthidae: Grimpoteuthis sp.). Mar. Biol. 167:82. doi: 10.1007/s00227-020-03701-1
Kamenev, G. M. (2019). Bivalve mollusks of the Kuril-Kamchatka Trench, Northwest Pacific Ocean: Species composition, distribution and taxonomic remarks. Prog. Oceanogr. 176:102127.
Kioka, A., Schwestermann, T., Moernaut, J., Ikehara, K., Kanamatsu, T., McHugh, C. M., et al. (2019). Megathrust earthquake drives drastic organic carbon supply to the hadal trench. Sci. Rep. 9, 1–10.
Kitahashi, T., Kawamura, K., Kojima, S., and Shimanaga, M. (2013). Assemblages gradually change from bathyal to hadal depth: a case study on harpacticoid copepods around the Kuril Trench (north-west Pacific Ocean). Deep Sea Res. Part I 74, 39–47. doi: 10.1016/j.dsr.2012.12.010
Lacey, N. C., Mayor, D. J., Linley, T. D., and Jamieson, A. J. (2018). Population structure of the hadal amphipod Bathycallisoma (Scopelocheirus) schellenbergi in the Kermadec Trench and New Hebrides Trench, SW Pacific. Deep Sea Res Part II 155, 50–60. doi: 10.1016/j.dsr2.2017.05.001
Lacey, N. C., Rowden, A. A., Clarke, M., Kilgallen, N. M., Linley, T. D., Mayor, D. J., et al. (2016). Community structure and diversity of scavenging amphipods from bathyal to hadal depths in three South Pacific trenches. Deep Sea Res. Part I 111, 121–137. doi: 10.1016/j.dsr.2016.02.014
Lacharité, M., and Metaxas, A. (2017). Hard substrate in the deep ocean: how sediment features influence epibenthic megafauna on the eastern Canadian margin. Deep Sea Res. Part I 126, 50–61. doi: 10.1016/j.dsr.2017.05.013
Legendre, P., and Legendre, L. (2012). Numerical Ecology, 3rd English edition. Amsterdam: Elsevier Science BV.
Lemche, H., Hansen, B., Madsen, F. J., Tendal, O. S., and Wolff, T. (1976). Hadal life as analyzed from photographs. Videnskabelige Meddelelser Dansk Naturhis torisk Forening 139, 263–336.
Levin, L. A., Baco, A. R., Bowden, D. A., Colaco, A., Cordes, E. E., Cunha, M. R., et al. (2016). Hydrothermal vents and methane seeps: Rethinking the sphere of influence. Front. Mar. Sci. 3:72. doi: 10.3389/fmars.2016.00072
Lindsay, D. J., and Miyake, H. (2007). A novel benthopelagic ctenophore from 7,217 m depth in the Ryukyu Trench, Japan, with notes on the taxonomy of deepsea cydippids. Plankton Benthos Res. 2, 98–102. doi: 10.3800/pbr.2.98
Linley, T. D., Gerringer, M. E., Yancey, P. H., Drazen, J. C., Wenstock, C. L., and Jamieson, A. J. (2016). Fishes of the hadal zone including new species, in situ observations and depth records of Liparidae. Deep Sea Res. Part I 114, 99–110. doi: 10.1016/j.dsr.2016.05.003
Linley, T. D., Stewart, A., McMillan, P., Clark, M., Gerringer, M. E., Drazen, J. C., et al. (2017). Bait attending fishes of the abyssal zone and hadal boundary: community structure, functional groups and species distribution in the Kermadec, New Hebrides and Mariana trenches. Deep Sea Res. Part I 121, 38–53. doi: 10.1016/j.dsr.2016.12.009
Linse, K., and Schwabe, E. (2018). Diversity of macrofaunal Mollusca of the abyssal Vema Fracture Zone and hadal Puerto Rico Trench, Tropical North Atlantic. Deep-Sea Res. Part II 148, 45–53. doi: 10.1016/j.dsr2.2017.02.001
Lutz, M. J., Caldeira, K., Dunbar, R. B., and Behrenfeld, M. J. (2007). Seasonal rhythms of net primary production and particulate organic carbon flux to depth describe the efficiency of biological pump in the global ocean. J. Geophys. Res. 112:C10011. doi: 10.1029/2006JC003706
Malyutina, M. V., and Brandt, A. (2020). Munnopsidae (Crustacea, Isopoda, Asellota) from the Kuril-Kamchatka Trench with a regional and inter-ocean comparison of their biogeographic and richness patterns. Prog. Oceanogr. 183:102289. doi: 10.1016/j.pocean.2020.102289
McClain, C. R., and Barry, J. P. (2010). Habitat heterogeneity, disturbance, and productivity work in concert to regulate biodiversity in deep submarine canyons. Ecology 91, 964–976. doi: 10.1890/09-0087.1
McClain, C. R., Lundsten, L., Barry, J., and Devogelaere, A. (2010). Assemblage structure, but not diversity or density, change with depth on a northeast Pacific seamount. Mar. Ecol. 31, 14–25. doi: 10.1111/j.1439-0485.2010.00367.x
Mironov, A. N. (2019). Sea lilies of the genus Bathycrinus (Echinodermata, Crinoidea: Bathycrinidae) from the North-West Pacific hadal trenches. Zootaxa 4604, 401–427. doi: 10.11646/zootaxa.4604.3.1
Mironov, A. N., Dilman, A. B., Gebruk, A. V., Kremenetskaia, A. V., Minin, K. V., and Smirnov, I. S. (2019). Echinoderms of the Kuril-Kamchatka Trench. Prog. Oceanogr. 179:102217. doi: 10.1016/j.pocean.2019.102217
Oguri, K., Kawamura, K., Sakaguchi, A., Toyofuku, T., Kasaya, T., Murayama, M., et al. (2013). Hadal disturbance in the Japan Trench induced by the 2011 Tohoku–Oki Earthquake. Sci. Rep. 3:1915.
Osborn, K. J., Kuhnz, L. A., Priede, I. G., Urata, M., Gebruk, A. V., and Holland, N. D. (2011). Diversification of acorn worms (Hemichordata, Enteropneusta) revealed in the deep sea. Proc. R. Soc. B 279, 1646–1654. doi: 10.1098/rspb.2011.1916
Pérès, J. M. (1965). Aperçu sur les résultats de deux plongées effectuees dans le ravin de Puerto-Rico par le bathyscaphe Archimède. Deep-Sea Res. 12, 883–891. doi: 10.1016/0011-7471(65)90811-9
Perez, J., Kitazato, H., Sumida, P. Y. G., and Sant’Ana, R. (2018). Benthopelagic megafauna assemblages of the Rio Grande Rise (SW Atlantic). Deep Sea Res. Part I 134, 1–11. doi: 10.1016/j.dsr.2018.03.001
Pierdomenico, M., Cardone, F., Carluccio, A., Casalbore, D., Chiocci, F., Maiorano, P., et al. (2019). Megafauna distribution along active submarine canyons of the central Mediterranean: relationships with environmental variables. Prog. Oceanogr. 171, 49–69. doi: 10.1016/j.pocean.2018.12.015
Podar, M., Haddock, S. H. D., Sogin, M., and Harbison, G. R. (2001). A molecular phylogenetic framework for the phylum Ctenophora based on 18s rRNA sequences. Mol. Phylogenetics Evol. 21, 218–230. doi: 10.1006/mpev.2001.1036
Ritchie, H., Jamieson, A. J., and Piertney, S. B. (2017). Population genetic structure of two congeneric deep-sea amphipod species from geographically isolated hadal trenches in the Pacific Ocean. Deep-Sea Res. Part I 119, 50–57. doi: 10.1016/j.dsr.2016.11.006
Rowden, A. A., Clark, M. R., and Wright, I. C. (2005). Physical characterisation and a biologically focused classification of “seamounts” in the New Zealand region. N. Z. J. Mar. Freshw. Res. 39, 1039–1059. doi: 10.1080/00288330.2005.9517374
Schmidt, C., Sattarova, V. V., Katrynski, L., and Marttínez Arbizu, P. (2019). New insights from the deep: meiofauna in the Kuril-Kamchatka Trench and adjacent abyssal plain. Prog. Oceanogr. 173, 192–207. doi: 10.1016/j.pocean.2019.02.010
Shen, C., Dohrmann, M., Zhang, D., Lu, B., and Wang, C. (2019). A new genus and a new species of Hexactinellida Sponge (Lyssacinosida: Euplectellidae: Bolosominae) from abyssal depth of the Yap Trench, northwestern Pacific Ocean. Zootaxa 4567, 367–378. doi: 10.11646/zootaxa.4567.2.9
Sogard, S. M., and Olla, B. L. (1996). Food deprivation affects vertical distribution and activity of a marine fish in a thermal gradient: potential energy-conserving mechanisms. Mar. Ecol. Prog. Ser. 133, 43–55. doi: 10.3354/meps133043
Stewart, H. A., and Jamieson, A. J. (2018). Habitat heterogeneity of hadal trenches: considerations and implications for future studies. Prog. Oceanogr. 161, 47–65. doi: 10.1016/j.pocean.2018.01.007
van Dover, C. (2000). The Ecology of Deep-Sea Hydrothermal Vents. Princeton, NJ: Princeton University Press.
Victorero, L., Robert, K., Robinson, L. F., Taylor, M., and Huvenne, V. A. (2018). Species replacement dominates megabenthos beta diversity in a remote seamount setting. Sci. Rep. 8:4152. doi: 10.1038/s41598-018-22296-8
Wang, C., Zhou, Y., Jiang, D., and Han, J. (2018). Report of a chiton in the genus Leptochiton (Lepidoleurida: Lepidopleurina: Leptochitonidae) from the Yap Trench in the West Pacific Ocean. Acta Oceanol. Sin. 37, 205–208. doi: 10.1007/s13131-018-1327-9
Watling, L., Guinotte, J., Clark, M. R., and Smith, C. R. (2013). A proposed biogeography of the deep ocean floor. Prog. Oceanogr. 111, 91–112. doi: 10.1016/j.pocean.2012.11.003
Wolff, T. (1960). The hadal community, an introduction. Deep Sea Res. 6, 95–124. doi: 10.1016/0146-6313(59)90063-2
Wolff, T. (1970). The concept of the hadal or ultra-abyssal fauna. Deep-Sea Res. 17, 983–1003. doi: 10.1016/0011-7471(70)90049-5
Yang, Y., Wu, S., Gao, J., Tian, L., Yang, J., and Xu, Y. (2017). Geology of the Yap Trench: New observations from a transect near 10°N from manned submersible Jiaolong. Int. Geol. Rev. 60, 1941–1953. doi: 10.1080/00206814.2017.1394226
Zhang, R., Wang, C., Zhou, Y., and Zhang, H. (2019). Morphology and molecular phylogeny of two new species in genus Freyastera (Asteroidea: Brisingida: Freyellidae), with a revised key to close species and ecological remarks. Deep Sea Res. Part I 154:103163. doi: 10.1016/j.dsr.2019.103163
Keywords: megafauna, hadal zone, abyssal zone, Yap Trench, environmental factors
Citation: Zhang D, Zhou Y, Yang J, Linley T, Zhang R, Lu B, Xu P, Shen C, Lin S, Wang Y, Sun D, Wang X and Wang C (2021) Megafaunal Community Structure From the Abyssal to Hadal Zone in the Yap Trench. Front. Mar. Sci. 8:617820. doi: 10.3389/fmars.2021.617820
Received: 15 October 2020; Accepted: 15 February 2021;
Published: 04 March 2021.
Edited by:
Ana Colaço, Marine Research Institute (IMAR), PortugalReviewed by:
Andrew Russell Gates, National Oceanography Centre, United KingdomCopyright © 2021 Zhang, Zhou, Yang, Linley, Zhang, Lu, Xu, Shen, Lin, Wang, Sun, Wang and Wang. This is an open-access article distributed under the terms of the Creative Commons Attribution License (CC BY). The use, distribution or reproduction in other forums is permitted, provided the original author(s) and the copyright owner(s) are credited and that the original publication in this journal is cited, in accordance with accepted academic practice. No use, distribution or reproduction is permitted which does not comply with these terms.
*Correspondence: Chunsheng Wang, d2FuZ3Npb0BzaW8ub3JnLmNu
Disclaimer: All claims expressed in this article are solely those of the authors and do not necessarily represent those of their affiliated organizations, or those of the publisher, the editors and the reviewers. Any product that may be evaluated in this article or claim that may be made by its manufacturer is not guaranteed or endorsed by the publisher.
Research integrity at Frontiers
Learn more about the work of our research integrity team to safeguard the quality of each article we publish.