
95% of researchers rate our articles as excellent or good
Learn more about the work of our research integrity team to safeguard the quality of each article we publish.
Find out more
ORIGINAL RESEARCH article
Front. Mar. Sci. , 08 October 2021
Sec. Marine Pollution
Volume 8 - 2021 | https://doi.org/10.3389/fmars.2021.617074
This article is part of the Research Topic Predicting Hydrocarbon Fate in the Ocean: Processes, Parameterizations, and Coupled Modeling View all 12 articles
This work presents a new laboratory study for understanding secondary intrusions in multiphase plumes in quiescent, stratified environments. The study is driven by field observations of secondary intrusions during the Deepwater Horizon (DWH) oil spill. The smaller trap heights observed at DWH for secondary versus primary intrusions could have resulted, in part, from decreasing plume buoyancy (due to gas dissolution) and increasing ambient stratification with elevation above the source. We seek additional mechanisms responsible for the observed smaller secondary trap heights through controlled laboratory experiments where buoyancy and ambient stratification are nominally constant throughout. A novel approach is adopted in the experiments to increase the visibility of secondary intrusions, which are traditionally difficult to visualize, thus investigate. The study reveals that a wider plume source width can also cause the secondary intrusions to trap earlier, providing another plausible explanation for the shallower secondary intrusions observed in the field data.
Previously published CTD-CDOM profiles during the Deepwater Horizon (DWH) oil spill showed a prominent intrusion of trapped hydrocarbons near the spill site, typically at elevations about 300–350 m above the seafloor (Valentine et al., 2010; Socolofsky et al., 2011; Camilli, 2014). Some profiles also suggested a second, less prominent intrusion at higher elevations with lower concentrations (Valentine et al., 2010; Camilli, 2014), as indicated in Figure 1.
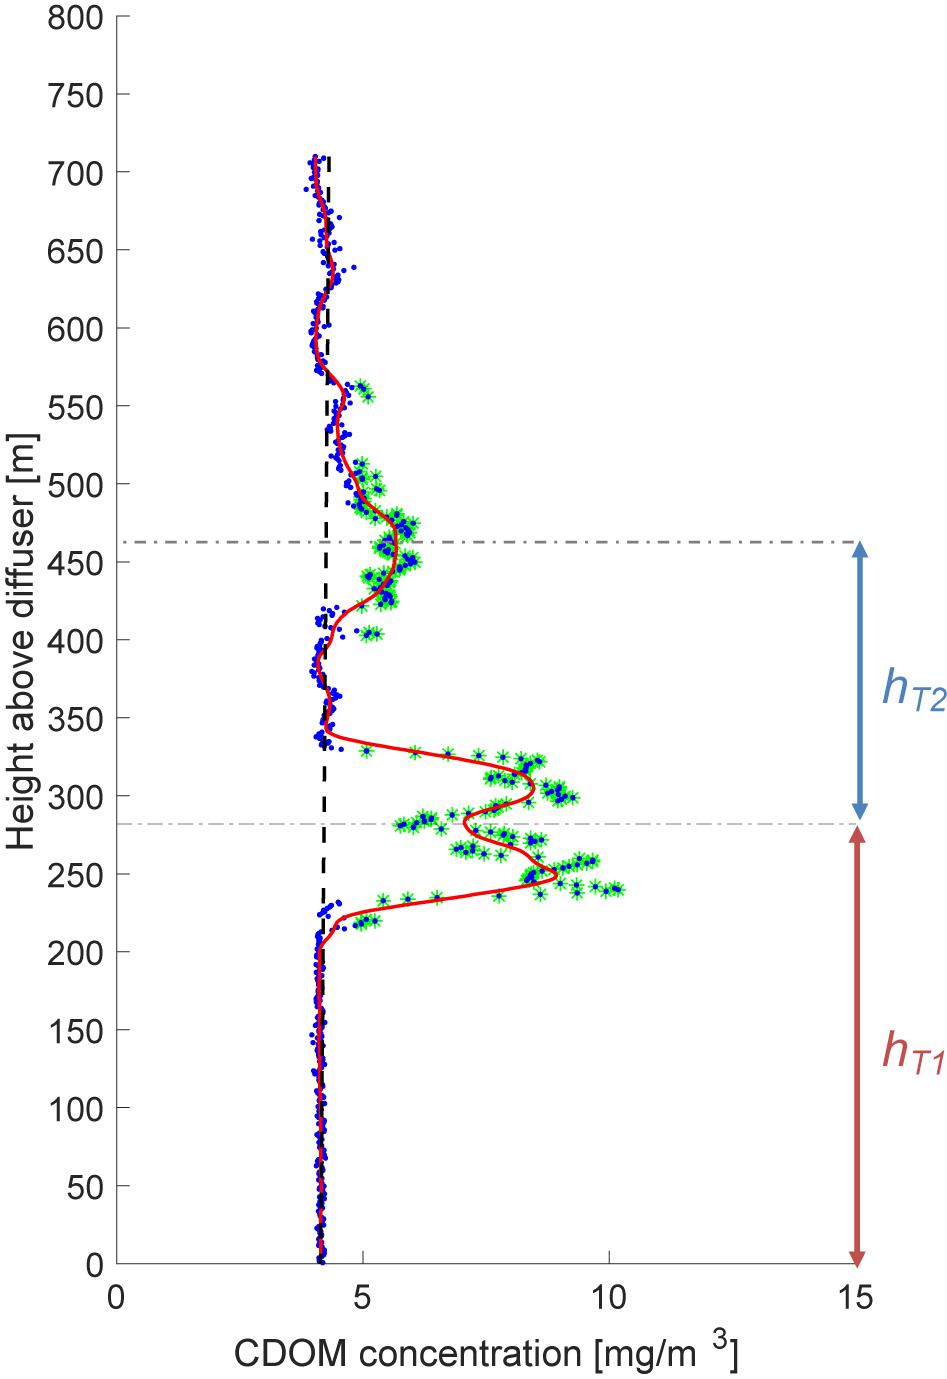
Figure 1. Profile of fluorescence for the field measurement of R/V Walton Smith at station WS048-A on May 31st, 2010. Blue dots are raw measurements. The solid red line is the smoothed curve for the data based on the moving average, and the broken vertical black line is the computed background concentration. A comparison between the background concentration and smoothed curve for data exposes data with excessive fluorescence concentration, highlighted in green. The broken horizontal lines are the observed trap height for the primary and secondary intrusions. hT1 and hT2 denote primary and secondary intrusion heights, respectively.
We analyzed 266 CTD-CDOM profiles within a 7 km radius from the wellhead using methods outlined in Socolofsky et al. (2011) and the Supplementary Information, and found 19 with a distinct secondary intrusion. To be counted as a secondary intrusion, we required that there must be a distinct vertical interval of background concentration (see Supplementary Information for definition) separating the first and second intrusions. Thus the overlapping peaks shown in the bottom portion of the profile in Figure 1 [and which are frequently observed in the lab (e.g., Socolofsky and Adams, 2005)] are considered part of a single intrusion. In all 19 profiles, the secondary intrusion concentrations were significantly smaller than those in the primary intrusion. Most likely, this stems from the fact that the more soluble hydrocarbons are dissolved near the source and hence enter the first intrusion, resulting in fewer hydrocarbons to enter the secondary (or further) intrusions, even if there are apparent hydrodynamic intrusions.
The first and second intrusion heights were defined by the first spatial moments of the concentration profiles, and are included as Supplementary Table 1 In all 19 profiles, the heights of secondary intrusions were less than those of the first intrusion, i.e., hT2/hT1 < 1. Multiple intrusions have also been observed in laboratory investigations of bubble plumes in a stratified ambient where generally hT2/hT1 < 1 as well (Asaeda and Imberger, 1993). Data from the field and lab are shown in Figure 2, where the combined average is hT2/hT1 = 0.70.
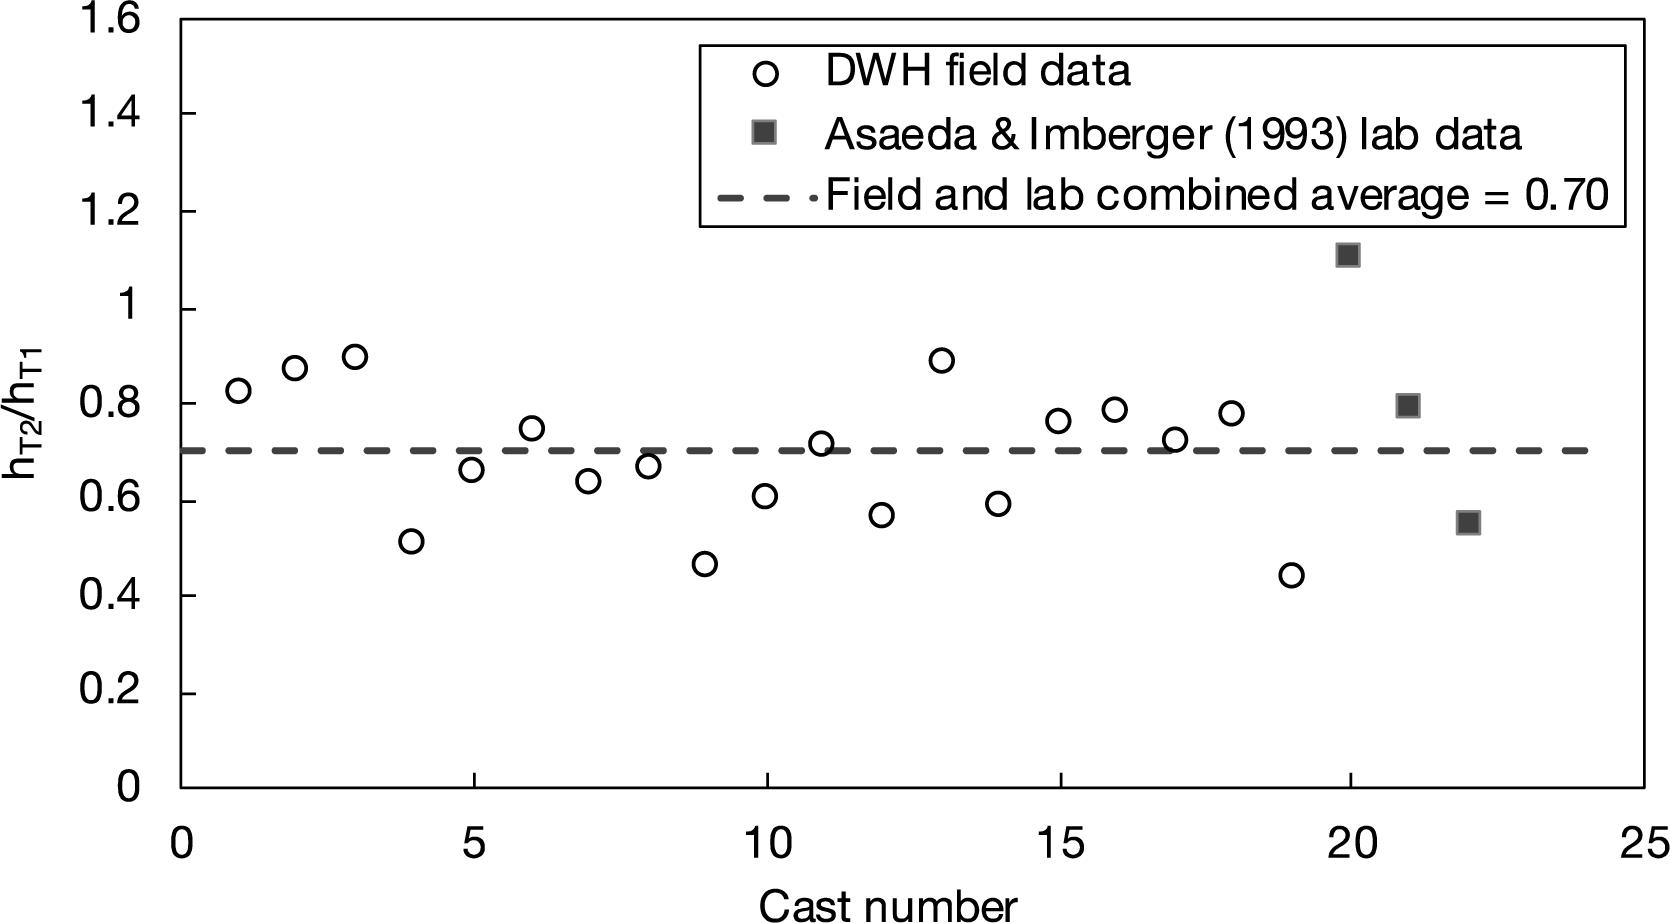
Figure 2. hT2/hT1 was observed during the Deepwater Horizon (DWH) Oil Spill and in lab experiments by Asaeda and Imberger (1993).
The primary intrusion height, hT1, scales with both the kinematic buoyancy flux, , and the stratification frequency, , as
(Morton et al., 1956). Here, Qg, Qo are the volumetric flow rates of gas and oil, ρg, ρo and ρw are the densities of gas, oil, and water, ρ is the density of seawater as a function of elevation z, and g is gravity.
Depending on the plume type, the plume will restart following the first intrusion, leading to a second intrusion. Asaeda and Imberger (1993); Socolofsky and Adams (2005), and Chan et al. (2014) categorized plume behavior in as many as four types based on a non-dimensional slip velocity where Us is the particle rising velocity (or settling velocity for sinking particles). Chan et al. (2014) found that secondary intrusions occurred for only two of the four types shown in Figure 3.
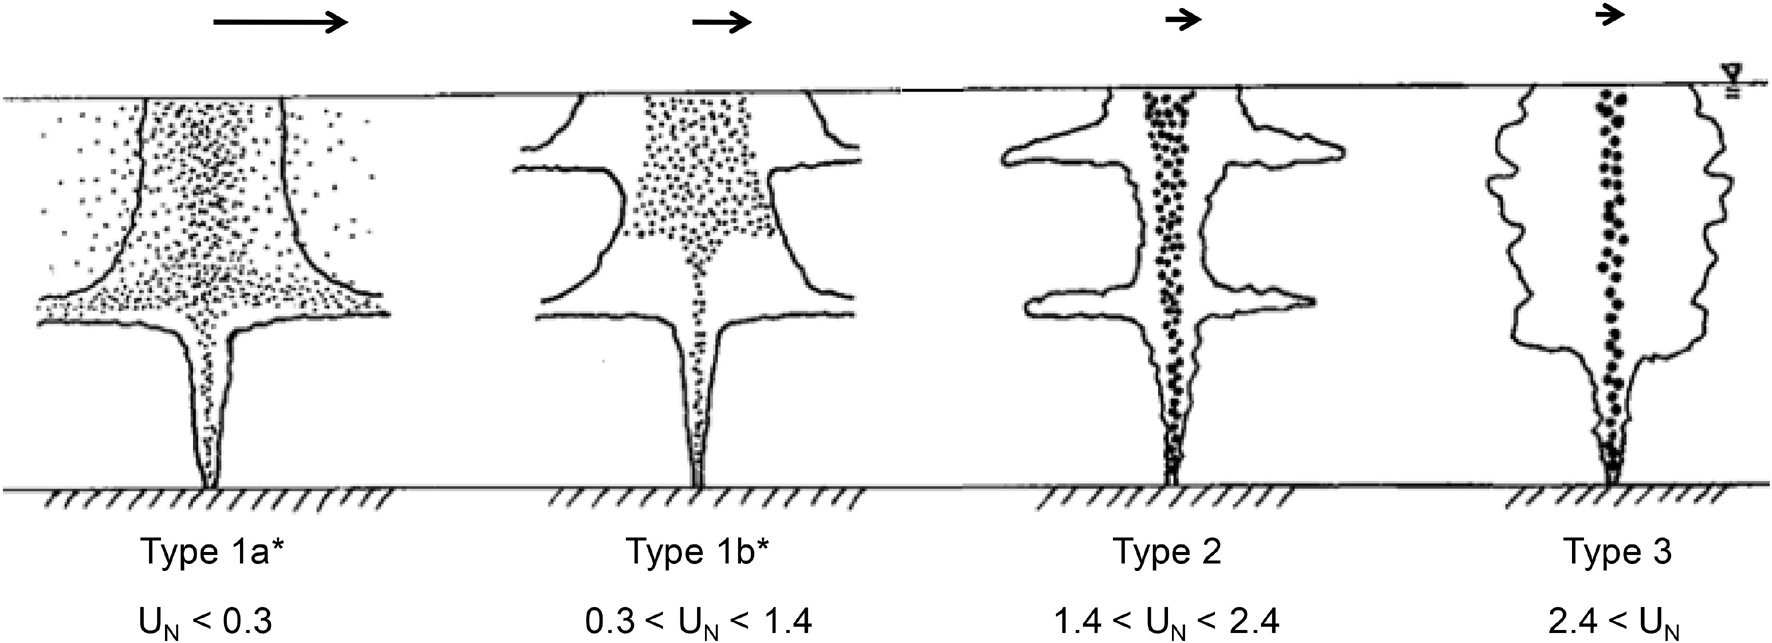
Figure 3. A typology for stagnant multiphase plumes in stratification showing secondary intrusions in Type 1b* and 2 plumes. The arrow length indicates qualitatively the width of the particle distribution. Image adapted from Chan et al. (2014) with permission.
Assuming hT2 scales with the same main parameters,
where B2 and N2 are defined at the elevation at which the plume reforms, and .
Spatial variation in either N and B can contribute to the shorter secondary intrusion height. Firstly, Socolofsky et al. (2011) observed that stratification varies nearly quadratically with elevation, in which case
Consequently, ε 2/ε 1 > 1 due to non-linearity in the vertical density profile. Secondly, much of the gas dissolved at or below the first intrusion. The initial plume buoyancy contributed by the gas was up to 81% of the total buoyancy (Socolofsky et al., 2011), and if all of the gas dissolved, then B2/B1 = 0.19. Combining these two effects,
or
Thus it appears that the combination of non-linear stratification and gas dissolution could explain the observed ratios of hT2/hT1.
To explore further, we conducted laboratory experiments that could eliminate the effects of variable B and N on hT2/hT1, by making B2/B1 and N2/N1 both equal to 1. Our experiments explored the conditions under which secondary intrusions occur in multiphase plumes, and the effects of varying UN and plume core width on changing the trap depth of secondary intrusions in particle plumes. The trap depth of particle plumes simulated in lab experiments is analogous to trap heights for droplet plumes in the field, and we refer to the two plume types interchangeably. It is noted that additional factors such as ambient current, rotation, and outlet orientation likely affect secondary intrusions, but these factors were not studied.
Experiments took place in an acrylic glass tank with dimensions 2.5 m (width) × 1.1 m (length) × 2.2 m (height). A separate cylindrical mixing tank with dimensions 1.57 m (diameter) × 1.5 m (height) was used to create linear stratification using the two-tank method described by Hill (2002). Salt was used as the stratifying agent. To minimize vertical mixing and hence retain stratification, a buoyant splash plate made of marine-grade plywood and overlaid by porous horsehair was attached to the outlet of the flexible filling hose as the tank was filled before each experiment. A conductivity probe was used to determine the conductivity, thus the density of water at various locations in the tank.
Experiments used sinking, negatively buoyant glass beads mixed with brine to simulate rising, positively buoyant oil droplets and gas bubbles in an inverted frame of reference. The discharge mixture was allowed to descend through the tank. During the descent, the plume dynamics were studied via photo imaging and in-situ fluorescence profile measurements at multiple locations after the experiments.
The discharge device consisted of six bottles arranged circularly at equal distances from the center, and each other (Figure 4). Each bottle had a flexible tube (3 mm in diameter) extending from the bottom of the bottle. As shown in Figure 4, the tubes could be brought close together to form a clustered discharge with a small effective diameter (1 cm between opposing pairs of bottles) or brought farther apart to create a distributed release with a larger effective diameter (8 cm between opposing pairs of bottles). The acrylic bottom plate enabled this by carrying two sets of differentially spaced holes into which the tubes could be plugged.
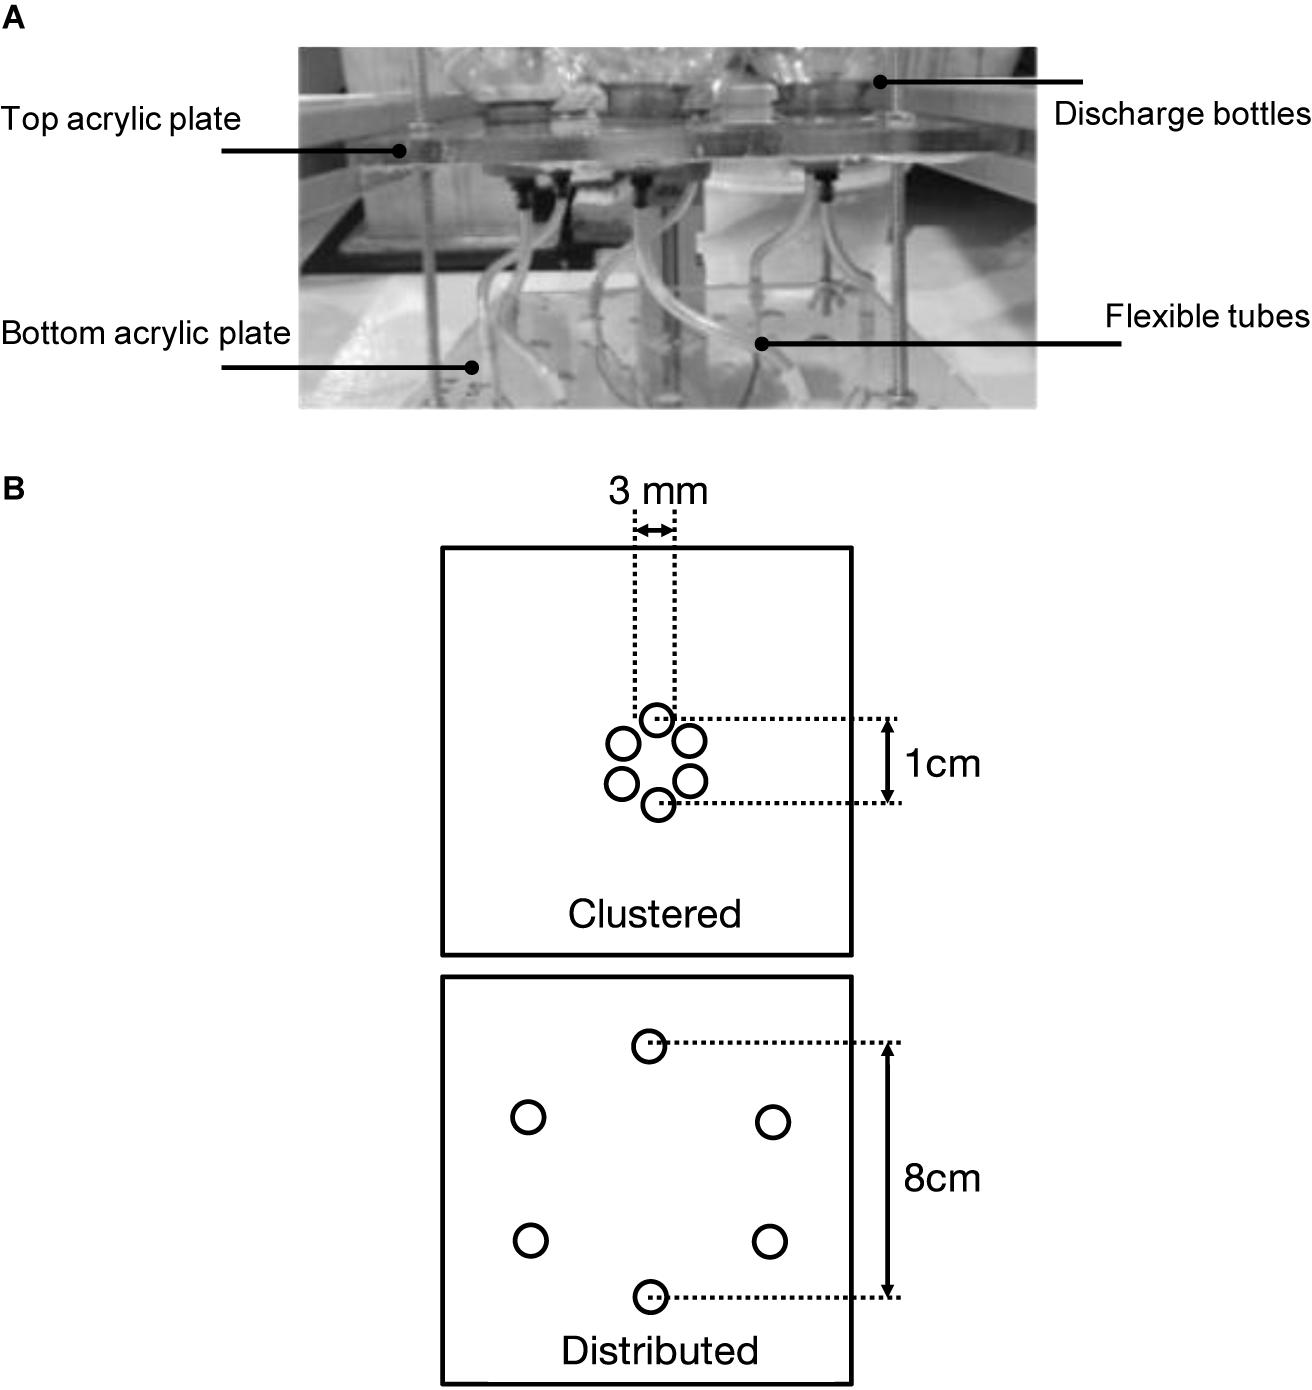
Figure 4. (A) Glass beads dispensing device (Side view). (B) Discharge nozzle configurations: clustered and distributed sources. Both configurations consist of six equal-sized holes.
Experiments were conducted using N = 1, 3 or 5 bottles. The flexible tubes connecting each source were identical ensuring equal flow to each “active” bottle. For 3 bottles, every other bottle was filled making the typical distance between filled bottles about 6.9 cm. For 5 bottles, all but one was filled so the typical distance between bottles was 4 cm (We had intended to fill all 6 bottles rather than 5 but found that the secondary intrusion was too close to the tank floor).
Clearly our approach to approximating a distributed source results in non-uniform plume velocity at short distances from the source. However, this distance can be shown to be relatively short. Conservatively assuming that each source is a point source that is advected vertically downward while spreading at a rate of 10% (Fischer et al., 1979), adjacent plumes for N = 3 will intersect their neighbors (3.5 cm away) at a depth of about 35 cm which is roughly half of the values of hT1 shown in Table 1 for N = 3. For N = 5, adjacent sources will begin merging with their neighbors (roughly 2 cm away) at a distance of 20 cm, which is between one-quarter and one-third of the values of hT1 shown in Table 1. In addition to the assumptions made above, additional conservatism comes from the fact that adjacent jets will experience dynamic pressures on their “inside” that will cause them to be sucked closer together, shortening the merging distance (Lai and Lee, 2012). Supplementary Figure 1 shows an image of the merging of opposing jets for N = 5 (Experiment SG07081865).
Each of the six bottles contained dense spherical glass beads with a specific gravity of 2.45, together with Rhodamine dye and brine, whose density matched the ambient water at the discharge level. The resulting mixture, in the form of a slurry, was kept well-mixed by vibration motors during the release. The mass ratio of glass beads to brine was determined to ensure both phases finished discharging simultaneously. The bead size dictated both the flow rate of the beads and the flow rate of the brine draining through the voids.
Three bead sizes (B, C, and AD) with decreasing settling (slip) velocities Us were used. The discharge flow rate, thus the buoyancy flux B, could be controlled by using fewer or greater numbers of bottles for the release. The variations in Us and B were reflected in the change in UN. Table 1 describes the properties and discharge conditions of the glass beads. The flow rates were consistent across different discharge bottles and steady in time (Supplementary Table 2).
For visualization and photo image analysis, a high-power laser was used to illuminate the center cross-section of the axisymmetric plume. We used a Dantec DuoPower 100–100 laser, which could generate pulsed laser light sheets at 2 × 100 mJ at a maximum of 100 Hz, with a wavelength of 532 nm (green light). We chose the dye concentration based on the most desirable brightness and contrasts for imaging the spreading of the dyed, entrained fluid and particles in the plume and the intrusion layer.
In addition to image analysis, vertical fluorescence profiles were taken in situ at various locations in the tank after each experiment. In previous experiments, it has proven challenging to visualize and measure secondary intrusions (Socolofsky and Adams, 2005) because the dye was only introduced at the point of discharge with the slurry, and most of it followed the detraining phase(s) into the first intrusion. To better highlight secondary intrusions where they exist, we positioned a rigid, submerged tube aligned with the surface discharge point to deliver dye at the secondary intrusion’s anticipated depth. The tube was made of transparent plastic and had an inside diameter of 2 mm. The top of the tube was attached to the bottom of a dye reservoir as in an interveinal injection system to eliminate any air bubbles, and the flow rate of dye could be controlled by adjusting a valve. In order not to disturb the flow, dye was introduced with minimum momentum and with a density close to that of the local ambient. Dye injection began once the plume dynamics were seen to have fully developed. The optimal delivery depth was just above the second intrusion, as suggested in Figure 5.
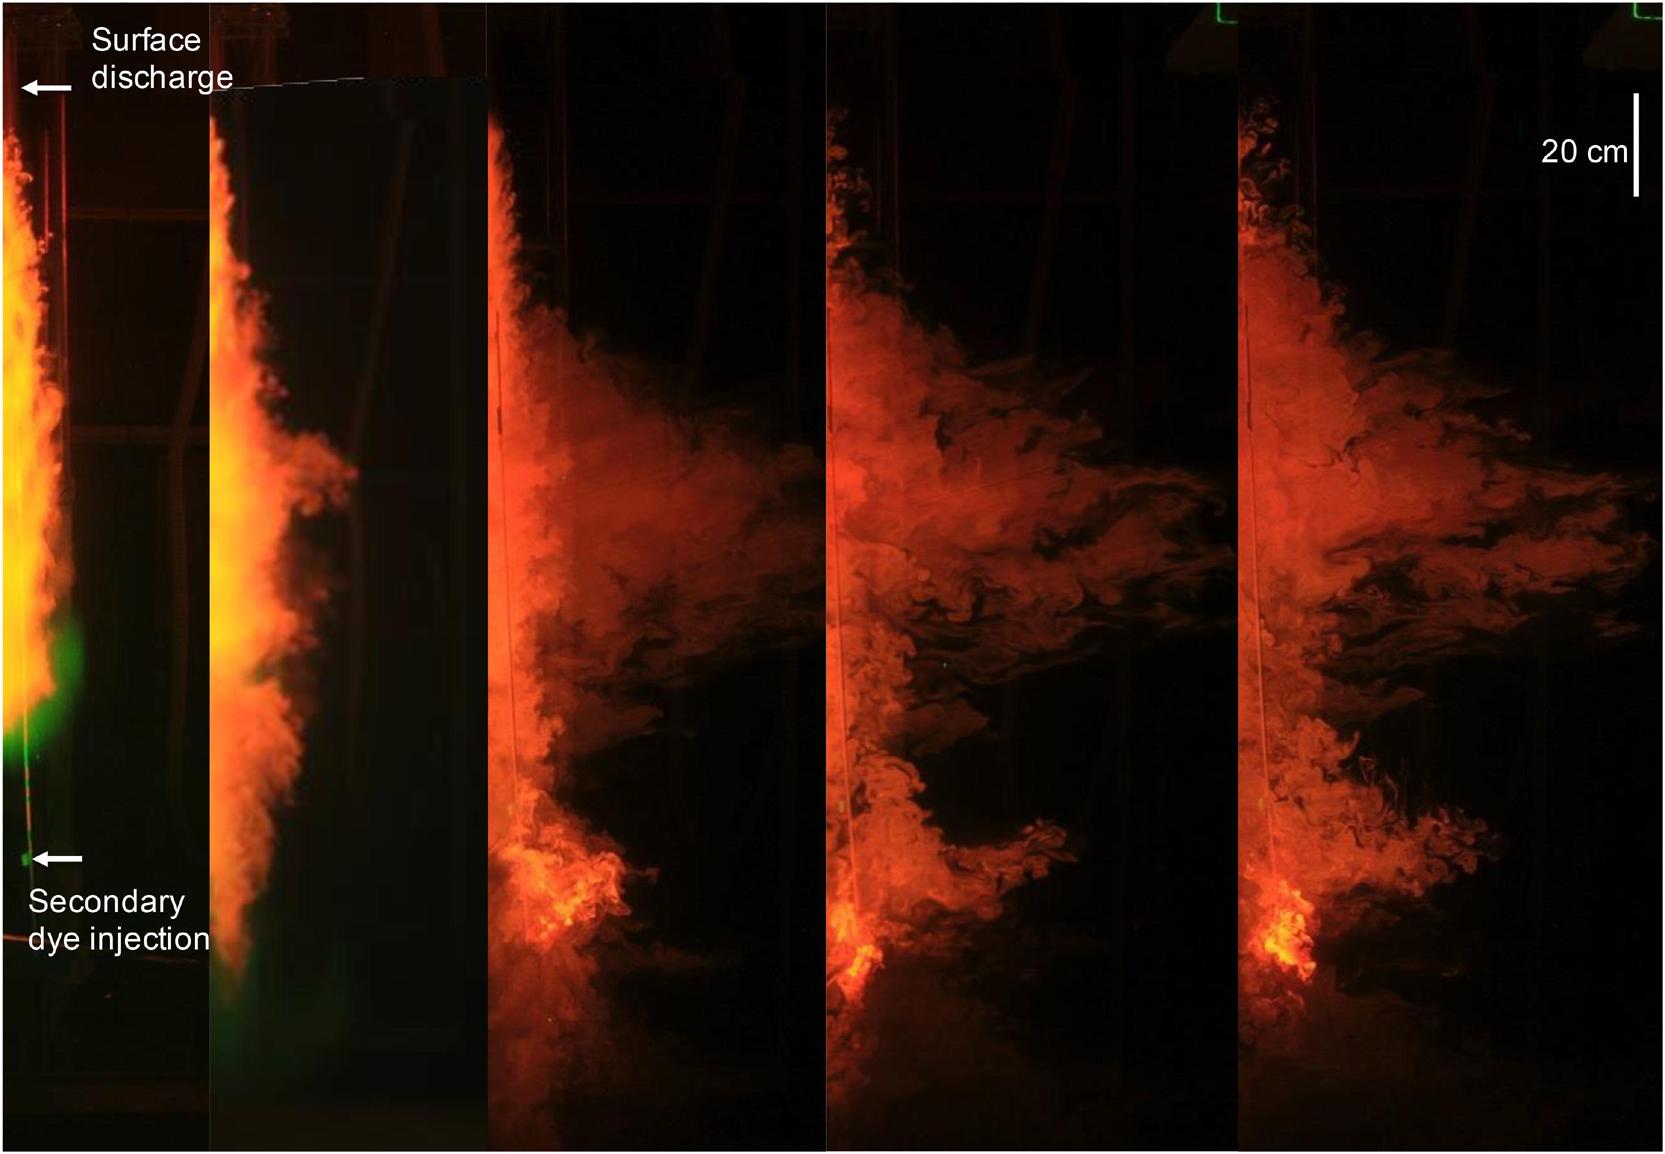
Figure 5. The time revolution of an experimental plume released from the surface ∼2.2 m above the tank floor. The development of one side of the plume profile (plume is axisymmetric) with time is shown from left to right.
For each experiment, 3–5 profiles were taken. Intrusion depths hT1 and hT2 (when observed) were computed from the first spatial moments of each profile, and then averaged to provide entries in Table 1. Reasonable repeatability in these averages can be seen by comparing runs with similar experimental conditions shown in the table. Figure 6 plots the experimentally observed ratio of hT2/hT1 versus UN superimposed on plume type as summarized by Chan et al. (2014). The figure suggests no secondary intrusion for Types 3 and 1a∗, and declining ratio as one progresses from Type 2 (ratio = 1) to 1b∗ (ratio approaches 0.7).
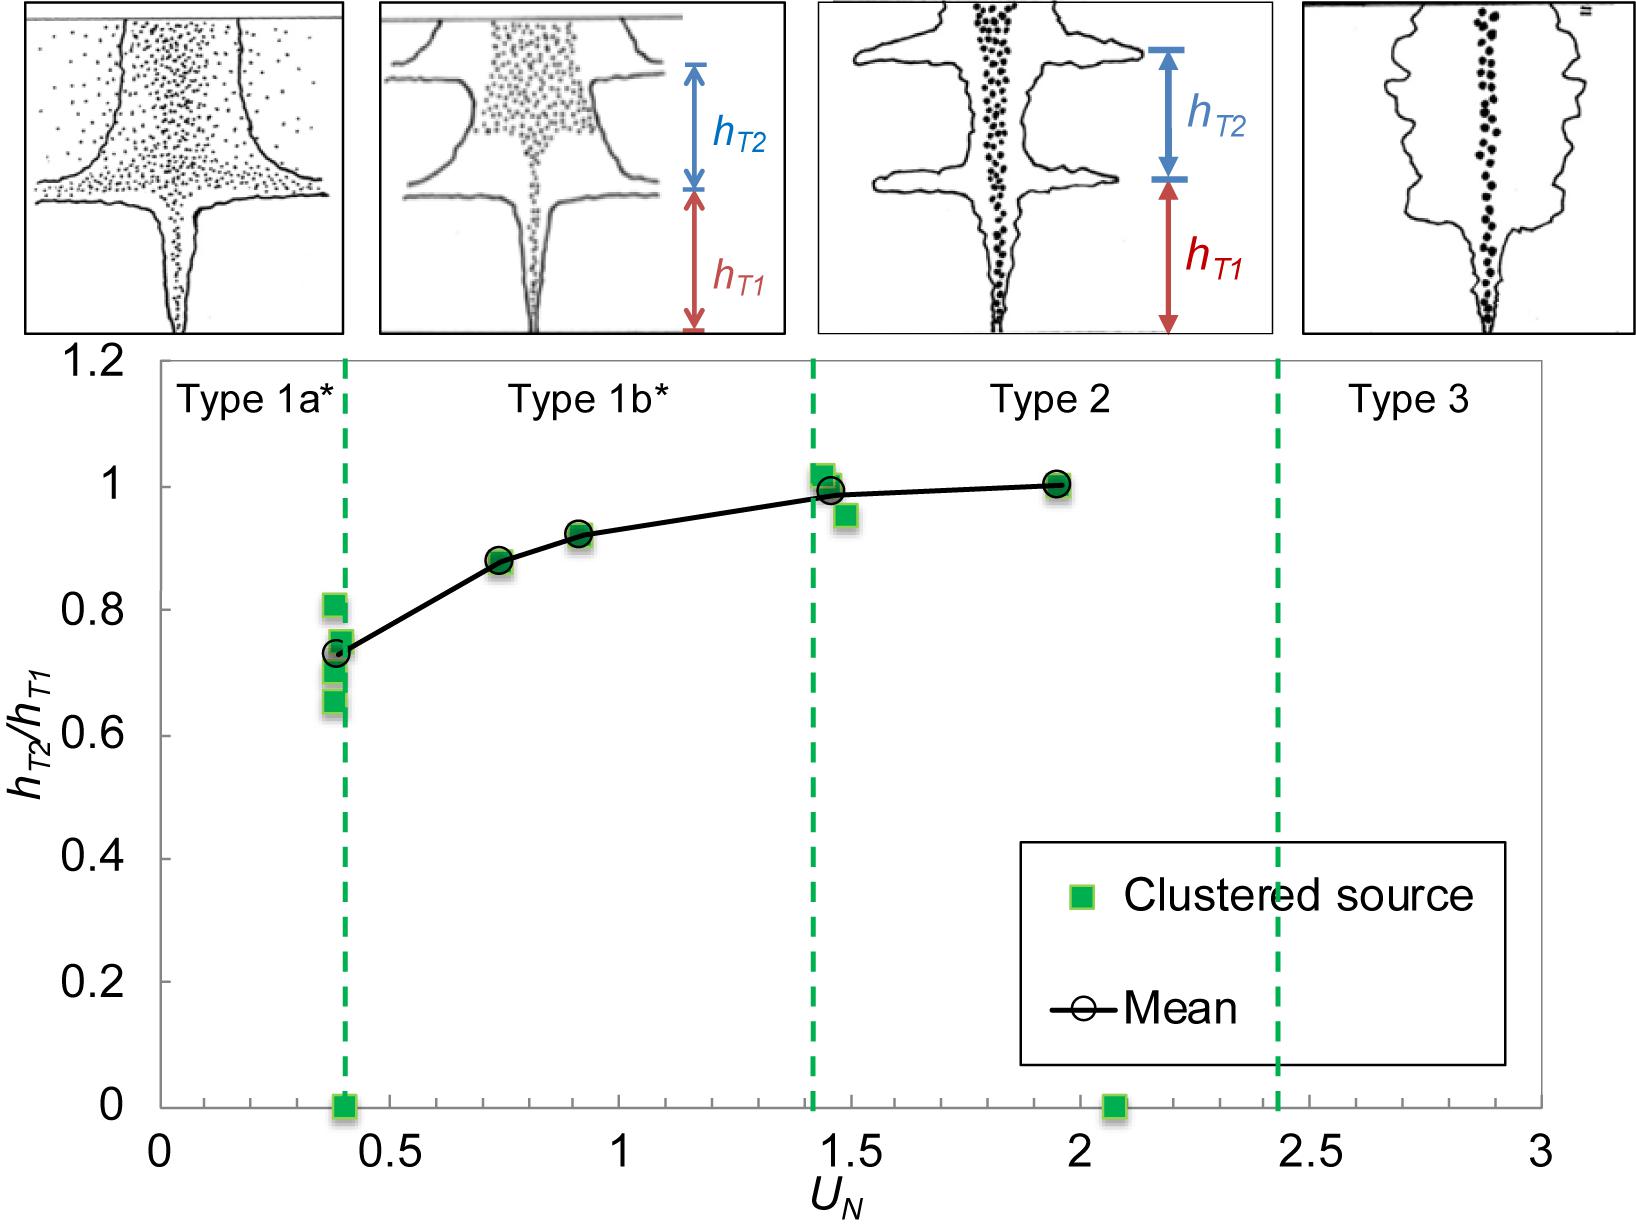
Figure 6. hT2/hT1 as a function of UN, showing increasing hT2/hT1 with UN for clustered source (green squares) configuration. Open circles denote the mean, and the solid line represents the trend. hT2/hT1 with a value of zero means no secondary intrusion was observed. Hence secondary intrusion was only observable for a range of UN. The plume types indicated on top of the figure (top four panels) are consistent with Figure 3.
It was anticipated that hT2/hT1 might be equal to unity as values of B and N do not change over the trajectory of a given experiment. While this was the case for Type 2 plumes (UN > 1.5), hT2/hT1 was less than one for Type 1b∗ (UN ∼ [0.4, 1.5]), implying that the secondary intrusion occurs sooner than the primary intrusion. The main difference between the two types, as evident in Figure 3, is the width of the plume source as the plume “restarts” after the primary intrusion. As Type 1b∗ plumes are characterized by droplets that detrain but do not enter the intrusion, they have a wider source for the secondary plume than Type 2 plumes, which do not experience detrainment. The widened plume core in Type 1b∗ may be responsible for a reduced hT2/hT1.
To further test this hypothesis, we observed the primary intrusions created using the two source widths, as illustrated in Figure 4B. Other than the effective source width, the two sources were identical, and the buoyancy fluxes, in particular, were identical. By focusing on the primary intrusion, we thus avoided the possibility that the source buoyancy might have been reduced, as discussed above. Figure 7 shows that for the clustered sources, the mean and std dev of the normalized first intrusion height hT1/Lc were 2.92 (std dev of 0.21), close to the value of 2.8 reported by others (e.g., Mingotti and Woods, 2019). For distributed sources, the corresponding mean and std dev were 2.36 and 0.06.
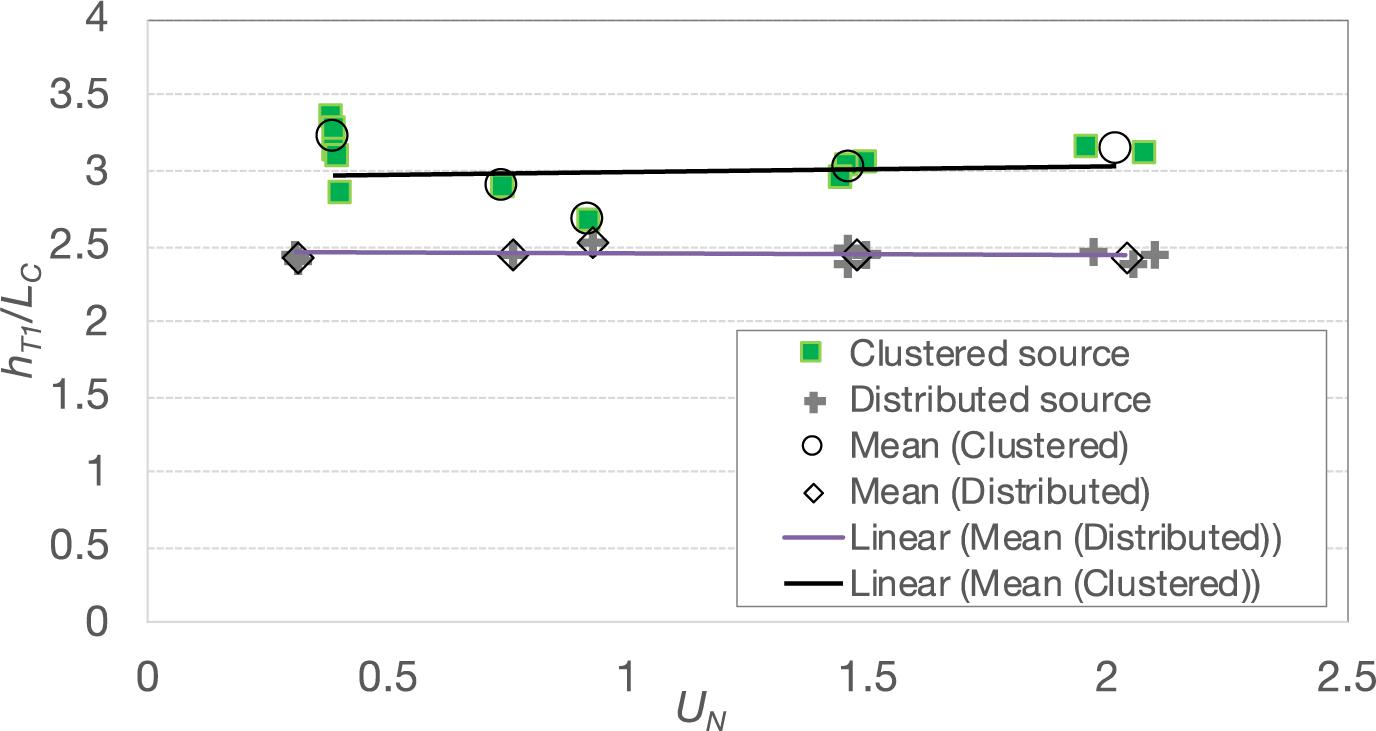
Figure 7. Normalized hT1 against UN for clustered and distributed sources. The solid trendlines are the mean of clustered (black) and distributed (gray) sources.
The mean trapping depth for the distributed sources is, on average, 81% of the trapping depth of the “clustered” source, with no apparent dependence on UN. The shallower trapping depth of the distributed source makes sense as both single-phase plumes (Hunt and Kaye, 2001) and multiphase plumes (Zhou, 2019) have a negative virtual origin. Zhou (2019) analyzed the trap depths resulting from the numerically simulated bubble plumes generated by large eddy simulations (LES). Zhou found that, compared with bubble plumes emanating from point sources, the trap levels of bubble plumes produced by a source of moderate radius bo were reduced by a factor of 9bo / [Lc(4.77−0.34UN)]. For wide sources, the fractional reduction was about half of this. Considering our distributed source to be “wide,” the percentage reduction in our experiments ranged from 13 to 22%, within the same ballpark as the observed 19% reduction in Figure 7.
Driven by field observations at DWH, we present a laboratory investigation that explores conditions under which secondary intrusions occur in multiphase plumes. The occurrence and the trap elevations of secondary intrusions are correlated with UN, the non-dimensional particle slip velocity, as well as the plume core width.
We conclude that the smaller trap heights observed at DWH for secondary versus primary intrusions could have resulted, in part, from decreasing plume buoyancy (due to gas dissolution) and increasing ambient stratification with elevation above the source. However, secondary intrusions observed in the lab, where B and N remain nominally constant with depth, also show a smaller ratio of hT2/hT1, with this ratio decreasing with decreasing droplet size (UN). Additional laboratory experiments focusing on primary intrusions resulting from plumes of different source width, but otherwise similar properties, including B, show that more distributed sources tend to trap at a shallower depth. This observation is consistent with observations of lazy plumes in the literature and could provide at least a partial explanation for the smaller secondary intrusions observed at DWH.
Our paper has explored the height of potential secondary intrusions. These heights are important, environmentally, because they determine the second layer within the water column at which dissolved hydrocarbons, and those remaining in the form of small droplets, are likely to intrude. Of course, hydrocarbon concentrations within the layer are also important, but are more complicated to analyze because they depend not only on the volumetric flow of seawater, but the mass flux of hydrocarbons, entering the intrusion. Such calculations can be addressed with the help of models such as TAMOC (Dissanayake et al., 2018), but are outside the scope of our study.
The original contributions presented in the study are included in the article/Supplementary Material, further inquiries can be directed to the corresponding author.
EA and DW were responsible for conceptualization. DW conducted the lab experiments and wrote the manuscript. EA provided supervision and editing. Both the authors contributed to the article and approved the submitted version.
This research was partially supported by the National Research Foundation Singapore through the Singapore-MIT Alliance for Research and Technology’s Center for Environmental Sensing and Modeling Interdisciplinary Research Program, and a grant from the Gulf of Mexico Research Initiative through the Gulf of Mexico Integrated Spill Response Consortium (GOMRI grant number 02-S140209).
DW was employed by the company Exponent.
The remaining author declares that the research was conducted in the absence of any commercial or financial relationships that could be construed as a potential conflict of interest.
All claims expressed in this article are solely those of the authors and do not necessarily represent those of their affiliated organizations, or those of the publisher, the editors and the reviewers. Any product that may be evaluated in this article, or claim that may be made by its manufacturer, is not guaranteed or endorsed by the publisher.
The authors thank Maciej Baranski for help in photo imaging and Felice Frankel for improving figure presentation.
The Supplementary Material for this article can be found online at: https://www.frontiersin.org/articles/10.3389/fmars.2021.617074/full#supplementary-material
Asaeda, T., and Imberger, J. (1993). Structure of bubble plumes in linearly stratified environments. J. Fluid Mech. 249, 36–57. doi: 10.1017/S0022112093001065
Camilli, R. (2014). Tracking hydrocarbon plume transport and biodegeneration at deepwater horizon. Science 330, 201–204. doi: 10.1126/science.1195223
Chan, G. K. Y., Chow, A. C., and Adams, E. E. (2014). Effects of droplet size on intrusion of sub-surface oil spills. Environ. Fluid Mech. 15, 959–973. doi: 10.1007/s10652-014-9389-5
Dissanayake, A. L., Gros, J., and Socolofsky, S. A. (2018). Integral models for bubble, droplet and multiphase plume dynamics in stratification and crossflow. Environ. Fluid Mech. 18, 1167–1202. doi: 10.1007/s10652-018-9591-y
Fischer, H., List, J., Koh, C., Imberger, J., and Brooks, N. (1979). Mixing in Inland and Coastal Waters. Amsterdam: Elsevier. doi: 10.1016/C2009-0-22051-4
Hill, D. F. (2002). General density gradients in general domains: the “Two-Tank” method revisited. Exp. Fluids 32, 434–440. doi: 10.1007/s00348-001-0376-5
Hunt, G. R., and Kaye, N. G. (2001). Virtual origin correction for lazy turbulent plumes. J. Fluid Mech. 435, 377–396. doi: 10.1017/S0022112001003871
Lai, A. C. H., and Lee, J. H. W. (2012). Dynamic interaction of multiple buoyant jets. J. Fluid Mech. 708, 539–575. doi: 10.1017/jfm.2012.332
Mingotti, N., and Woods, A. W. (2019). Multiphase plumes in a stratified ambient. J. Fluid Mech. 869, 292–312. doi: 10.1017/jfm.2019.198
Morton, B. R., Taylor, G., and Turner, J. S. (1956). Turbulent gravitational convection from maintained. Proc. R. Soc. Math. Phys. Eng. Sci. Instant. Sources 234, 1–23. doi: 10.1098/rspa.1956.0011
Socolofsky, S. A., and Adams, E. E. (2005). Role of slip velocity in the behavior of stratified multiphase plumes. J. Hydraul. Eng. 131, 273–282. doi: 10.1061/(ASCE)0733-94292005131:4(273)
Socolofsky, S. A., Adams, E. E., and Sherwood, C. R. (2011). Formation dynamics of subsurface hydrocarbon intrusions following the Deepwater Horizon blowout. Geophys. Res. Lett. 38, 2–7. doi: 10.1029/2011GL047174
Valentine, D. L., Kessler, J. D., Redmond, M. C., Mendes, S. D., Heintz, M. B., Farwell, C., et al. (2010). Propane respiration jump-starts microbial response to a deep oil spill. Science 330, 208–211. doi: 10.1126/science.1196830
Keywords: Deepwater Horizon, multiphase flow, oil well blowout, secondary intrusion, plume
Citation: Wang D and Adams EE (2021) Secondary Intrusion Formation of Multiphase Plumes. Front. Mar. Sci. 8:617074. doi: 10.3389/fmars.2021.617074
Received: 13 October 2020; Accepted: 13 September 2021;
Published: 08 October 2021.
Edited by:
Robert Hetland, Texas A&M University, United StatesReviewed by:
Tamay Ozgokmen, University of Miami, United StatesCopyright © 2021 Wang and Adams. This is an open-access article distributed under the terms of the Creative Commons Attribution License (CC BY). The use, distribution or reproduction in other forums is permitted, provided the original author(s) and the copyright owner(s) are credited and that the original publication in this journal is cited, in accordance with accepted academic practice. No use, distribution or reproduction is permitted which does not comply with these terms.
*Correspondence: Dayang Wang, d2FuZ2QwNEBnbWFpbC5jb20=
Disclaimer: All claims expressed in this article are solely those of the authors and do not necessarily represent those of their affiliated organizations, or those of the publisher, the editors and the reviewers. Any product that may be evaluated in this article or claim that may be made by its manufacturer is not guaranteed or endorsed by the publisher.
Research integrity at Frontiers

Learn more about the work of our research integrity team to safeguard the quality of each article we publish.