 Takako Masuda1*
 Ondřej Prášil1
 Virginia E. Villafañe2,3
 Macarena S. Valiñas2,3
 Keisuke Inomura4E. Walter Helbling2,3
- 1Institute of Microbiology, The Czech Academy of Sciences, Třeboň, Czechia
- 2Estación de Fotobiología Playa Unión, Chubut, Argentina
- 3Consejo Nacional de Investigaciones Científicas y Técnicas (CONICET), Chubut, Argentina
- 4Graduate School of Oceanography, University of Rhode Island, Narragansett, Rhode Island, RI, United States
Effect of global change variables on the structure and photosynthesis of phytoplankton communities was evaluated in three different sites of the Patagonian coast of Argentina: enclosed bay (Puerto Madryn, PM), estuarine (Playa Unión, PU), and open waters (Isla Escondida, IE). We exposed samples to two contrasting scenarios: Present (nutrients at in situ levels) vs. Future (with lowered pH and higher nutrients inputs), and determined growth and photosynthetic responses after 2 days of acclimation. Under the Future condition phytoplankton growth was higher in the estuarine site compared to those in PM and IE. This effect was the most pronounced on large diatoms. While the increase of photosynthetic activity was not always observed in the Future scenario, the lower photosynthetic electron requirement for carbon fixation (Φe,C = ETR/PmB) in this scenario compared to the Present, suggests a more effective energy utilization. Long-term experiments were also conducted to assess the responses along a 4 days acclimation period in PU. Diatoms benefited from the Future conditions and had significantly higher growth rates than in the Present. In addition, Φe,C was lower after the acclimation period in the Future scenario, compared to the Present. Our results suggest that the availability, frequency and amount of nutrients play a key role when evaluating the effects of global change on natural phytoplankton communities. The observed changes in diatom growth under the Future scenario in PU and IE and photosynthesis may have implications in the local trophodynamics by bottom up control.
Introduction
Global change is a phenomenon commonly associated with an increase in the average temperature that brings about significant changes in the ecosystems, affecting the marine life and its environment in various ways (IPCC, 2019). Other processes, directly or indirectly related to global change, will alter coastal environments, either through significantly decreased pH (associated with higher CO2 levels released into the atmosphere) and/or due to higher nutrient inputs resulting from increasing agricultural and industry activities and urban development (IPCC, 2019). The effects of such alterations as well as the capacity to adapt to such changes are species-specific among phytoplankton communities (Gao et al., 2012). Higher nutrient inputs usually favor phytoplankton growth and photosynthesis (Falkowski et al., 1998; Behrenfeld et al., 2006), especially under nutrient-limiting conditions (Howarth, 1988; Cloern, 1999). Many organisms on the other hand, benefit from increasing CO2 levels by investing less energy into carbon concentrating mechanisms (Levitan et al., 2007; Rost et al., 2008; Hopkinson et al., 2011). In nature, different environmental variables interact usually in a synergistic or antagonistic manner, enhancing or reducing their individual effects (Crain et al., 2008). For example, Domingues et al. (2016) found that nutrient enrichment suppressed the negative effects of high CO2 and UVR on cyanobacteria and diatoms in an estuarine community. Hama et al. (2016), on the other hand, found significant effects of nutrient addition on phytoplankton growth only during the early stages of a 1 month mesocosm experiment, while the negative effects of higher acidification were evident only during the post-bloom period.
Intensive efforts have been put in evaluating and potentially predicting the effects of global change on the growth and photosynthetic performance of phytoplanktonic organisms, due to their key role as primary producers in the aquatic food webs. Such efforts are evident from large available datasets (Dutkiewicz et al., 2015; Bach and Taucher, 2019) that also highlight the vulnerability of organisms and ecosystems to global change. Some geographical regions, however, have been poorly explored and represented, and thus there is an urgent need to fill the knowledge gaps in how global change may impact primary producers in these areas. One clear example of these gaps are the South West Atlantic Ocean coastal waters, in which relatively little is known about the effects of global change variables on these organisms, despite the fact that 6–11% of global primary productivity occurs in this area (Uitz et al., 2010; Rousseaux and Gregg, 2014). Patagonian waters constitute one of the most important fishery areas of the Atlantic Ocean Basin (Carli et al., 2012; Góngora et al., 2012). In this region, some studies have determined significant effects on different global change variables on the size structure, taxonomic composition and phytoplankton responses of natural communities [Villafañe et al. (2021) and references therein]. Only few studies (Villafañe et al., 2015, 2018; Bermejo et al., 2020) assessed the effects of both increased nutrients and lowered pH, conditions that are already present in Patagonian coastal waters (Bermejo et al., 2018; Orselli et al., 2018), on phytoplankton communities, however, since these studies were conducted in an estuarine site with unique characteristics it made the extrapolation of these results to other ecosystems unfeasible. To get a broader range of responses, we selected three geographical sites with similar temperature and radiation conditions but different geomorphological characteristics, and thus with different water exchange frequencies, on the Patagonian coast. The aim of our study is to assess the response and efficiency of photosynthesis in these three phytoplankton communities exposed to simulated conditions of global change (lowered pH and increased nutrients), using an experimental approach (Morris, 1991; Quinn and Keough, 2002; Boyd et al., 2010). We believe that these evaluations may have important implications on our understanding of current and potentially future local and regional ecosystem services.
Materials and Methods
Study Area
This study was carried out with seawater collected at three sites in the Patagonian coast, in the Chubut Province, Argentina: (a) Puerto Madryn (42° 39′ S; 64° 58′ 40′′ W, hereafter PM), located in the Golfo Nuevo; (b) Playa Unión, at the mouth of the Chubut River estuary (43° 20.5′S, 65° 0.20′W, hereafter PU), and (c) Isla Escondida (43° 47′ S; 65° 18′ 17′′ W, hereafter IE) (Figures 1A,B). These sites were selected because of their different physical, biological and chemical characteristics. The PM site is located within an enclosed gulf, with little exchange with open waters (Rivas and Beier, 1990) which results in high Chl a concentration at surface waters throughout the year (D’Agostino et al., 2018). Only a few studies have focused on the effects of global change variables in this site; namely, one investigated the impact of solar ultraviolet radiation (UVR) on photosynthesis, and another the interactive effects of UVR and nutrients on phytoplankton growth and species composition (Villafañe et al., 2004; Marcoval et al., 2008). The PU site is under the influence of riverine waters that carry a heavy load of anthropogenic nutrients (Helbling et al., 2010; Bermejo et al., 2018), which also results in high Chl a concentration at the plume of the river (Figure 1B). Several global change studies have been done on phytoplankton communities from this site, with variables such as lowered pH, nutrients, temperature, input of terrigenous materials and mixing (Helbling et al., 2015b; Bermejo et al., 2018; Villafañe et al., 2018; Bermejo et al., 2020). Contrary to the PU site, IE is located in the open waters, and is a highly productive area, being the main nursery location for the hake (Merlucius hubsii) (Álvarez-Colombo et al., 2011). To the best of our knowledge, in this site no research on the effects of global change on phytoplankton communities has yet been conducted.
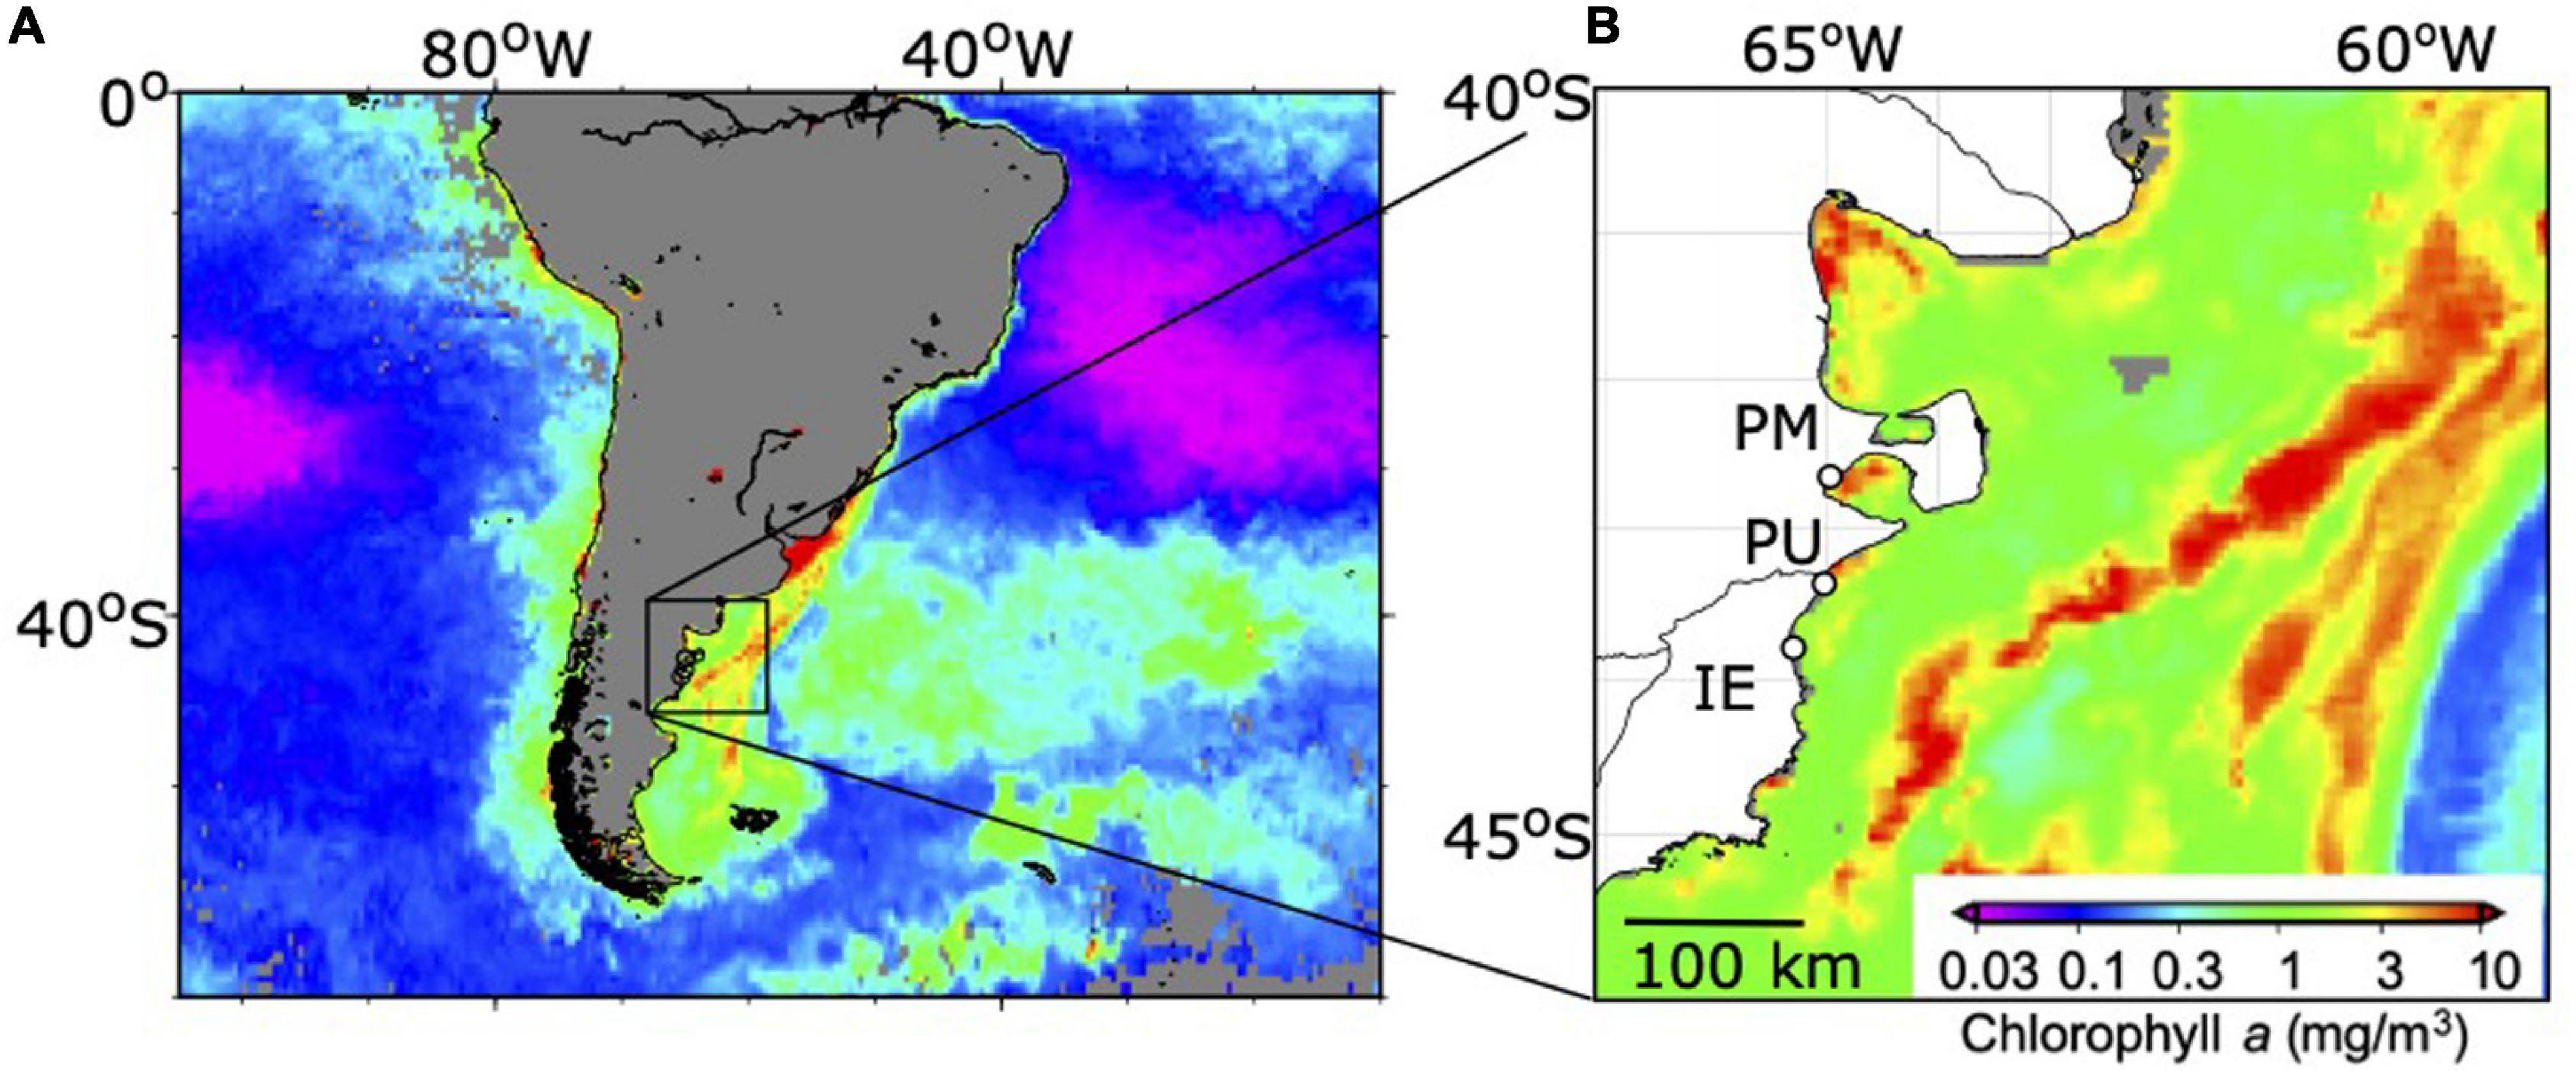
Figure 1. Sampling sites on the South West Atlantic coast. Background contours denote satellite-derived (MODIS-Aqua) chlorophyll a concentration, composited over (A) 1 month average (1–31 October, 2017) and (B) 8 days average (8–15 October, 2017). Daily Moderate Resolution Imaging Spectroradiometer-Aqua (MODIS) level-3 Chl a (in mg m–3) with 4-km resolution were obtained from NASA Goddard Space Flight Center (https://oceancolor.gsfc.nasa.gov/). Open circles represent sampling sites: PM, Puerto Madryn; PU, Playa Unión; IE, Isla Escondida (Chubut Province, Argentina).
Experimental Set up
Surface seawater (<0.5 m) samples (ca. 20 and 100 L, for the short- and long-term experiments, respectively) from the sites were collected with an acid-cleaned (1N HCl) bucket the day before the start of the experiments, and immediately taken to the laboratory at the Estación de Fotobiología Playa Unión (EFPU, 1 h, 10 and 40 min away from PM, PU, and IE, respectively). To remove large zooplankton, samples were pre-screened (200 μm mesh) and stored in the dark overnight in an incubator set at in situ temperature (14°C; Table 1A) until the start of experiments in the following morning. Two types of experiment were done: (a) Short-term experiments (PM, PU, and IE), where samples were allowed to acclimate for 2 days, and then measurements and analyses were performed during the day (see below) and (b) Long-term experiment at PU, where the analyses and measurements were performed along different acclimation periods (i.e., no acclimation, 2- and 4 days acclimation). A schematic representation of the experiments indicating the sampling and measurements is presented in Figure 2. The PU site for the long-term experiment was the most dynamic from the three selected sites, with large gradients in its biotic and abiotic variables due to the riverine input. As a consequence, the organisms here had different acclimation capacities compared to those from PM to IE, which came from more stable conditions. For this long-term experiments, we selected 2 and 4 days of acclimation that were defined mid- and long-term acclimation, respectively, as these periods were enough to acclimate to the different scenarios as seen in previous studies carried out at PU (Villafañe et al., 2015). Prior to these experiments, we collected samples for Chl a, nutrients, pH, and taxonomic composition to assess the main characteristics of the study sites.
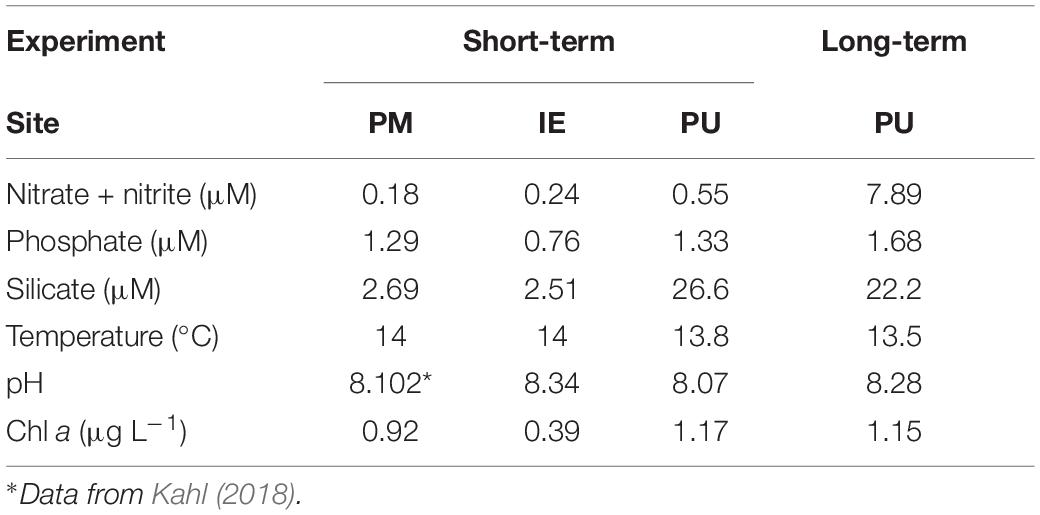
Table 1A. Chemical and biological characteristics of seawater collected for each experiment.
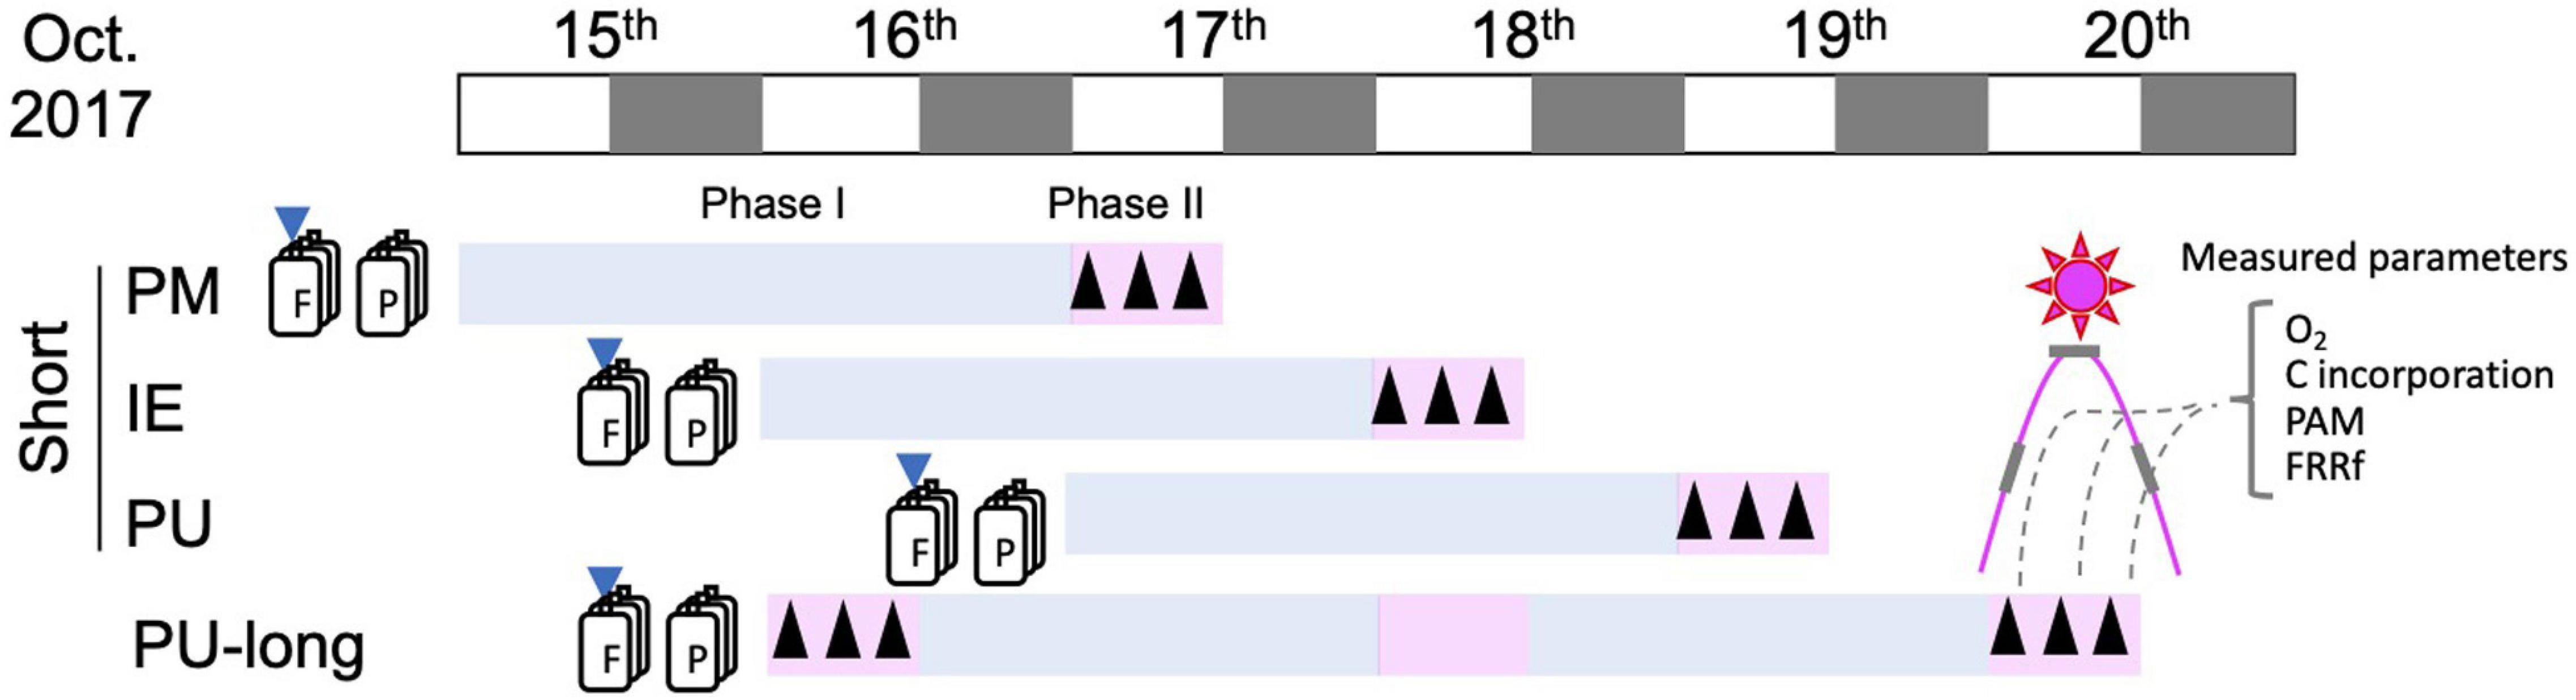
Figure 2. Schematic diagram of the experimental set up. White and black boxes show light and dark hours of the day. Downward arrows show nutrient and pH amendment, F and P represent Future and Present scenario, respectively. Upward arrows show the timing of measurements.
The short-term experiments consisted of two phases: Phase I (acclimation), in which the cells were placed in microcosms (500 mL of UV-transparent Teflon bottles) and were acclimated to solar radiation for 2 days in an outdoor water-bath. The temperature of the water-bath (14°C) was controlled manually by running water and the addition of ice when necessary. During the acclimation period, the Teflon bottles were mixed manually every 2–3 h to prevent cells from sinking. This process also ensured a homogeneous irradiance to the cells. The short-term experiments and acclimation periods started on 15, 16, and 17th of October 2017, for PM, IE, and PU, respectively (Figure 2). Two scenarios, Present and Future, were implemented in the microcosms (triplicate for each condition): (i) Present scenario: Samples with in situ nutrients concentration and pH; (ii) Future scenario: Samples with increased nutrients concentration and lower pH values. Here, pH was reduced by 0.4 units to reach the levels expected by the end of the century (IPCC, 2019). Increased nutrient concentration was achieved by adding macronutrients as in the f/20 medium (Guillard and Ryther, 1962). Nutrient enrichment mimicked a higher input (10 times compared with the Present scenario) due to human activity (Depetris et al., 2005) and increase in both atmospheric dust deposition (Wagener et al., 2008; Cloern et al., 2016), and river runoff (Rabalais et al., 2009; Bermejo et al., 2018). To lower the pH, CO32– (as Na2CO3), HCO3– (as NaHCO3), and HCl (0.01N) were added to the seawater samples to increase pCO2 and the dissolved inorganic carbon (DIC) content, as recommended by Gattuso et al. (2010). To determine the variations that may have occurred during the day, pH measurements in the microcosms were performed early in the morning, on a daily basis, using a pH meter (Hanna, model HI-2211, United States). Adjustments were done as required to maintain a difference of 0.4 units between the Present and the Future scenarios as described before. Phase II measurements started after 2 days of acclimation and consisted of oxygen evolution, carbon incorporation and fluorescence measurements (see below), three times of the day: morning (9–10 am), noon (12–1 pm), and afternoon (3–4 pm).
For the long-term (5 days) phytoplankton experiment from PU, the acclimation period started on the 16th of October (Figure 2). The collected sample (c.a. 100 L) was distributed into six microcosms—three for each scenario, as described above—in 10 L (LPDE Cubitainers, Nalgene), and put inside the outdoor water-bath for temperature control. Oxygen evolution, carbon incorporation and fluorescence parameter measurements were measured three times a day on October 16 and 20th, as described above for the short-term experiments (Figure 2). For the long-term PU experiment, Chl a was sampled on a daily basis, while samples for nutrient and taxonomic composition were collected on the 16, 18, and 20th of October.
Analyses and Measurements
Solar Radiation Measurements
Solar radiation was continuously monitored using a European Light Dosimeter Network broadband filter radiometer (ELDONET, Real Time Computers, Germany), which measures UV-B (280–315 nm), UV-A (315–400 nm), and PAR (400–700 nm) every second, averages the data over a 1 min interval, and stores them in a computer. This radiometer was permanently installed on the roof-top of EFPU, and routinely calibrated once a year using a solar calibration procedure. For this calibration, the irradiance data during a clear sky condition was compared with the output of radiation transfer models such as STAR (Ruggaber et al., 1994) and Daylight (Björn and Murphy, 1985).
Nutrients
Samples for the determination of macronutrient concentrations (NO3–+NO2–, PO43–, SiO32–; in triplicates for each scenario during the long-term at PU) were collected in 100 mL High Density Polyethylene (HDPE) bottles and kept frozen (−20°C) until the analyses. Nutrient concentrations were measured by colorimetric techniques (Strickland and Parsons, 1972) using a spectrophotometer (Hewlett Packard, model 8453E, United States). Specifically, NO3–+NO2– concentrations were measured by the Cd-Cu column method, while PO43– and SiO32– concentrations were measured by the molybdenum blue method. Detection limit (3 × standard deviation of the blank) for each nutrient was 0.09, 0.18, and 0.11 μM for NO3–+NO2–, PO43–, SiO32–, respectively.
Counting and Identification of Phytoplankton Cells
Samples for the identification and counting of phytoplankton cells (>2 μm, i.e., nano- and microplankton) were placed in 60 mL brown glass bottles and fixed with buffered formalin (final concentration of 0.4% of formaldehyde in the sample). Sub-samples of 10 or 25 mL were allowed to settle for 24 h in a sedimentation chamber (HydroBios GmbH, Germany). A drop of Rose Bengal was added to the chamber to better distinguish small cells from detritus and sediment. Species were identified and enumerated using an inverted microscope (Leica, model DM IL, Germany) following the technique described by Villafañe and Reid (1995). At least 200 cells were counted and identified at the species or genus level, although in some cases only the level group (e.g., flagellates) could be determined. To estimate cell size- and biovolume-based carbon biomass, unidentified species were sorted by size (e.g., flagellates in the 2–5 μm, 5–10 μm categories; diatoms in 10–20 μm; 20–30 μm etc.). Diatoms were sorted in centric and pennates. The biovolumes of the phytoplankton cells were calculated according to Hillebrand et al. (1999) and converted into carbon content (i.e., biomass) using the equations of Strathmann (1967), considering the abundance of cells in the samples.
Chlorophyll a (Chl a) Concentration
For the extraction of photosynthetic pigments, cells from 30 to 100 mL microcosm aliquots were collected on Munktell MG-F glass fiber filters (25 mm), and put in 15 mL centrifuge tubes with 5 mL of absolute methanol (Holm-Hansen and Riemann, 1978). The tubes containing the filters were then placed in a sonicator for 20 min at 20°C, and in dark for 40 min. The extracted samples were centrifuged for 15 min at 1,500 rpm (20°C), and the supernatants were collected. Samples were scanned at 250 and 750 nm using a spectrophotometer (Hewlett Packard, model HP 8453E, United States) and Chl a concentration was calculated using the equations of Porra (2002). Chl a concentrations of the same samples were also determined fluorometrically (Holm-Hansen et al., 1965) using a fluorometer (Turner Designs, Model Trilogy, United States) routinely calibrated against spectrophotometric measurements. There were no differences between the Chl a concentration calculated from both instruments, so the fluorometer data was used for all calculations.
Carbon Incorporation
Sub-samples for the determination of carbon incorporation were collected from the microcosms (in Phase II of the short-term, and on days 1 and 5 of the long-term experiment), and put into 30 mL Teflon bottles, inoculated with 0.185 MBq of radiocarbon (Holm-Hansen and Helbling, 1995) and placed inside a water-bath for temperature control. Samples were exposed to solar radiation (1 h) in the morning (9–10 am), noon (12–1 pm), and afternoon (3–4 pm). The inoculated samples were then immediately filtered through 0.7 μm Munktell GF/F filters (25 mm in diameter) under low pressure (<100 mm Hg). Filters were then put into 20 mL scintillation vials, and the excess of inorganic carbon was removed by exposing the filters to HCl fumes for 24 h. After acidification and following the addition of a scintillation cocktail (Optiphase Hisafe 3), samples were counted using a liquid scintillation counter. The rate of carbon incorporation was normalized by the Chl a concentration to calculate the assimilation number (PmB, in μmol C μg Chl a–1 h–1).
Variable Chlorophyll Fluorescence Parameters
Sub-samples from Phase II of the short-term, and from days 1 and 5 of the long-term experiment (Figure 2) were collected from the microcosms (triplicate for each scenario), put into 30 mL Teflon bottles in the outdoor water-bath for temperature control and exposed to solar radiation for 1 h in the morning (9–10 am), noon (12–1 pm), and afternoon (3–4 pm). Aliquots (2 mL) were taken from the Teflon bottles at the beginning, middle and end of the 1 h incubation period, and transferred to the measuring FastAct head of the benchtop FastOcean FRR (Chelsea Technologies Group, United Kingdom) for the photo-physiological measurements via fast repetition rate fluorometry (FRRf). Samples in the measuring chamber were kept at the outdoor temperature (14°C) using a laboratory thermostat. First, dark measurements were performed to derive the intrinsic and maximum Chl fluorescence Fo and Fm and the effective absorption cross-section of Photosystem II (σ). In order to analyze the in situ photo-physiology of the phytoplankton assemblage, samples were then exposed to actinic light intensity provided by the white LEDs of the FastAct illumination system attached to FastOcean that was set to the in situ light intensity, as measured by the local outside radiometer. The measurements in the presence of actinic light provided parameters F’ and Fm’. All measurements were conducted using a FastPro8 software. The single turnover FRR protocol consisted of 90 flashlets of 1 μs duration using the blue (450 nm) LED illumination; 70 sequences were averaged and then fitted using the equations of Kolber et al. (1998). A blank was measured every day by filtering the sample through a 0.2 μm filter. The Fo, Fm, F’, Fm’ values, measured for the blank, were then subtracted from the respective parameters measured in the samples. The maximum efficiency of absorbed light used for photochemistry (Fv/Fm) was estimated by the FRRf ST protocol during the dark-regulated state as ((Fm-Fo)/Fm). The absolute electron transport rate (ETR) normalized to Chl a [μmol electrons (μg Chl a)–1 h–1] was calculated using the “absorption” method of Oxborough et al. (2012) as:
where Fm, Fo, F’, Fm’ are the blank corrected Chl variable fluorescence parameters defined above, E is the intensity of the set irradiance (in μmol photons m–2 s–1), KA is the instrument-specific calibration factor (11,800 m–1), 3,600 is factor to convert seconds to hours and [Chl a] is the Chl a concentration (in mg m–3).
To estimate the overall responses to actinic light, photosynthesis-irradiance (P-E) curves were measured during the morning (9–10 am), noon (12–1 pm), and afternoon (3–4 pm). ETR vs. E curves were obtained by exposing the cells to increasing irradiances from 0 to 2,278 μmol photons m–2 s–1 using 11 light steps at 20 s interval between each steps. Each measurement was conducted in triplicates. Light use efficiency (α), light saturation index (Ek), and the maximum electron transport rate (ETRmax) were then estimated by fitting the data to the model using equations of (Eilers and Peeters, 1988).
Net Community Productivity
Sub-samples taken from the microcosms were placed in 30 mL Teflon bottles (Nalgene) and exposed to solar radiation for 1 h inside the outdoor water-bath for temperature control. Oxygen concentration was measured using an optode-probe system (Minioxy-10 Presens GmbH, Germany) equipped with fiber optics and sensor-spots (SP-PSt3-NAU-D5-YOP), together with the Oxyview 6.02 software, to register the data. The system was calibrated before the measurements using a two-point calibration for 100 and 0% oxygen saturation, at the desired temperature and at atmospheric pressure. Oxygen concentration measurements were done three times in each period (i.e., at 9, 9:30 and at 10 a.m.; at 12, 12:30 a.m. and 1 p.m.; and at 3, 3:30 and 4 p.m.), with each measurement lasting 1 min. Hence, ca. 20 data were obtained during each measured period. Net community productivity (NCP, in μmol O2 μg Chl a–1 h–1) was calculated by normalizing the change of oxygen concentration during the 1 h of exposure by Chl a concentration.
Computation of C Chemistry
We have applied the following equations for the computation of C chemistry (Emerson and Hedges, 2008):
where [] represents concentrations. We have computed [H+] from pH and used 2191 (μM) for [DIC], which is the expected value based on the method we used (Gattuso et al., 2010). For the pH values in PM, we used a value (8.102) from an earlier study (Kahl, 2018) close to PM; K1 and K2 were obtained by the following equations based on (Lueker et al., 2000; Emerson and Hedges, 2008):
where
where T is temperature (in K) and S is salinity.
pCO2 is approximated by the following equation (Weiss, 1974; DOE, 1994; Emerson and Hedges, 2008):
where
Data Treatment and Statistics
Specific growth rates (μ) in each scenario were calculated using the total cell abundances as:
where N0 and Nx represent the initial and final cell concentration at the initial time (t0) and at the end (tx) of each sampling period.
For the short-term experiments, differences in carbon incorporation, NCP, ETR, PmB and Φe,C, as the ratio of ETR and PmB (Lawrenz et al., 2013), were evaluated using two-way repeated measures ANOVAs with sites (PM, PU, and IE) and scenarios (Present and Future) as factors, and period of the day (i.e., morning, noon, and afternoon) as the repeated measures. When significant differences were obtained, a posteriori Tukey test was performed. In these experiments, limitation of sample volume precluded statistical analysis among samples for Chl a concentration, nutrients and phytoplankton abundance.
For the long-term experiment, differences in biomass and abundance between micro and nanoplankton cells, or among the most representative phytoplankton groups (i.e., centric diatoms, pennate diatoms, and flagellates) were evaluated using three-way ANOVAs, with size (micro vs. nanoplankton), groups (centric diatoms, pennate diatoms, or flagellates), scenarios (Present and Future), and acclimation (no, mid, or long-acclimation), as factors. The same type of analysis was done for the growth rates, but to compare μ for days 1–3 and 3–5, to assess the differences in mid- and long-acclimation. For carbon incorporation, NCP, ETR, PmB, and ETR (PmB)–1, two-way repeated measures ANOVAs were performed to evaluate differences in the measured parameters during the period of the day (i.e., morning, noon, and afternoon), with the scenario (i.e., Present and Future) and the acclimation (no-, mid-, and long-acclimation) as factors. When significant differences were determined, a posteriori Tukey test was performed. For comparisons of Chl a among acclimation time and between scenarios, we performed a repeated measures ANOVA.
In all cases, the data sets were tested for normality, homoscedasticity and sphericity using Kolmogorov-Smirnov, Cochran and Mauchley’s tests, respectively. If the data did not meet sphericity, we adjusted them using Greenhouse-Geisser correction. Although in some cases the data did not meet the assumptions, we decided to continue with the ANOVA’s tests, as for a large and balanced design, ANOVA are highly robust to such deviations (Underwood, 1997).
Results
In situ Conditions at the Sampling Sites and Radiation Levels During the Experiments
The initial conditions at sampling time, as well as the irradiance during the acclimation and measurement periods for each site are shown in Table 1. In the short-term experiments, the temperature was rather similar among the study sites (13.5–14°C), while pH was lower at PU (8.07) compared to IE (8.34). Nutrient concentrations presented some differences among the sites, with PM having the lowest nitrate + nitrite values (0.18 μM), whereas PU the highest (0.55 μM), during the short-term experiment; phosphate concentrations, on the other hand, were similar in PM and PU (1.29 and 1.33 μM, respectively), and almost two times higher than that in IE (0.76 μM). Silicate concentrations displayed the largest differences among sites, with PU having ca. 10 times more than the other (26.6 μM in PU, 2.69 and 2.51 μM in PM, and IE, respectively, Table 1A). Initial Chl a concentrations were low in the three sampling sites, with IE being the lowest (0.39 μg L–1) and PU the highest (1.17 μg L–1). For the long-term experiment, the initial conditions were similar to that of short-term experiment, except for the nitrate + nitrite concentrations, which were much higher in the former case (7.89 μM; Table 1A), suggesting an extra input via riverine waters. The influence of clouds on solar PAR was generally insignificant during the experiments, so the samples were exposed to rather similar irradiances at the same time of the day for the different experiments. An exception to this was the afternoon of October 20th, when the long-term experiment had much lower PAR values (Table 1B).
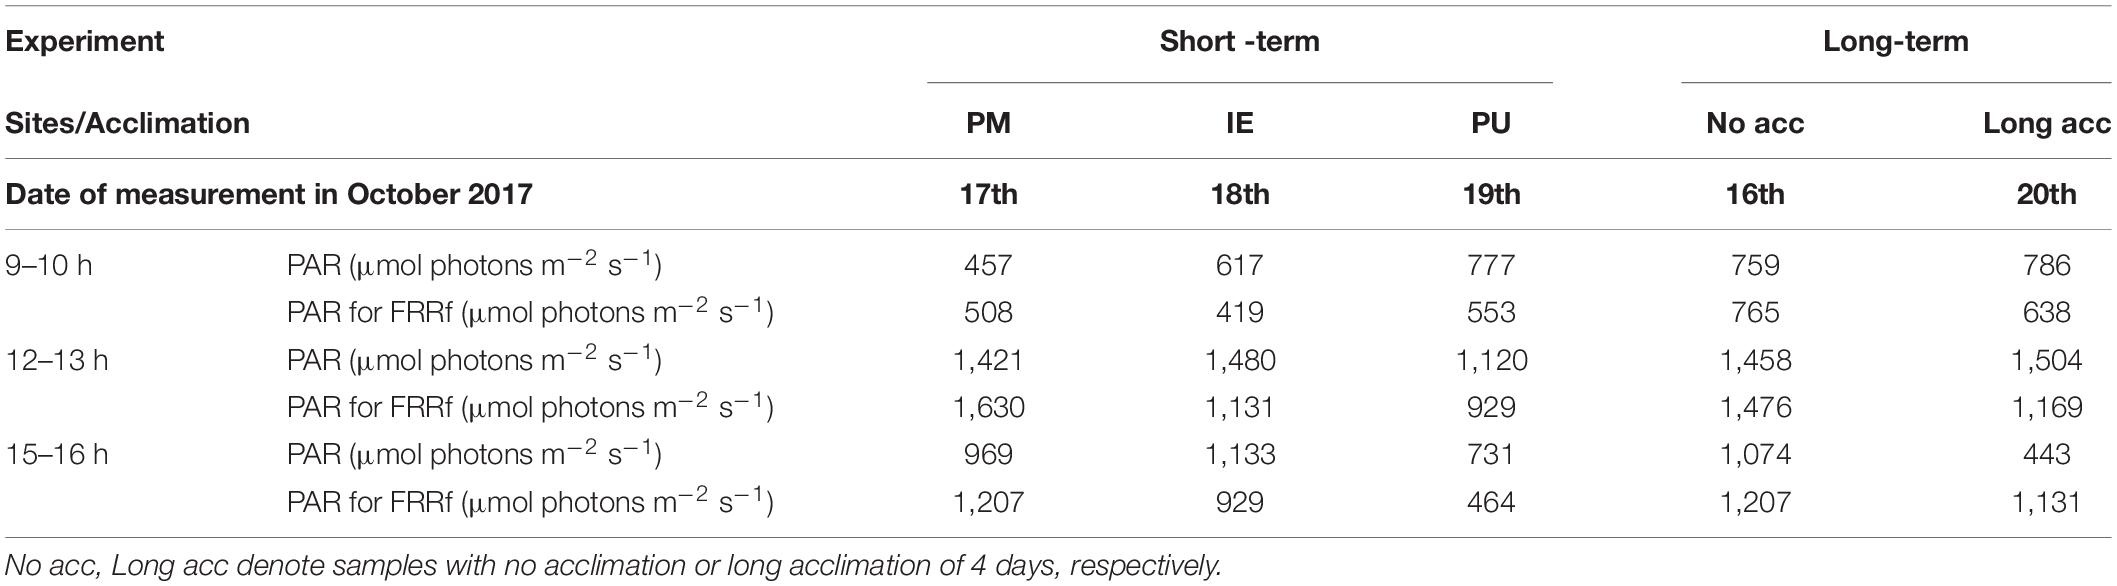
Table 1B. Incident solar radiation (PAR, irradiances, μmol photons m–2 s–1) during the short- and long-term experiments.
Carbon Chemistry
The estimated CO2 concentrations at the sampling time varied between 7.6 and 15.2 μM, during both short- and long-term experiments. pH reduction (by 0.4 units) increased these estimated CO2 concentrations from 20.6 to 39.6 μM (Table 2). The biggest change (24.4 μM) was observed at PU during short-term experiment. pCO2 increased from 387.5 to 1,008 μatm as expected (Table 2). The pCO2 at all sites and experiments increased by a comparable amount as the ratio of increased pCO2 (i.e., values after divided by values before the acid addition) varied between 2.60 and 2.71.
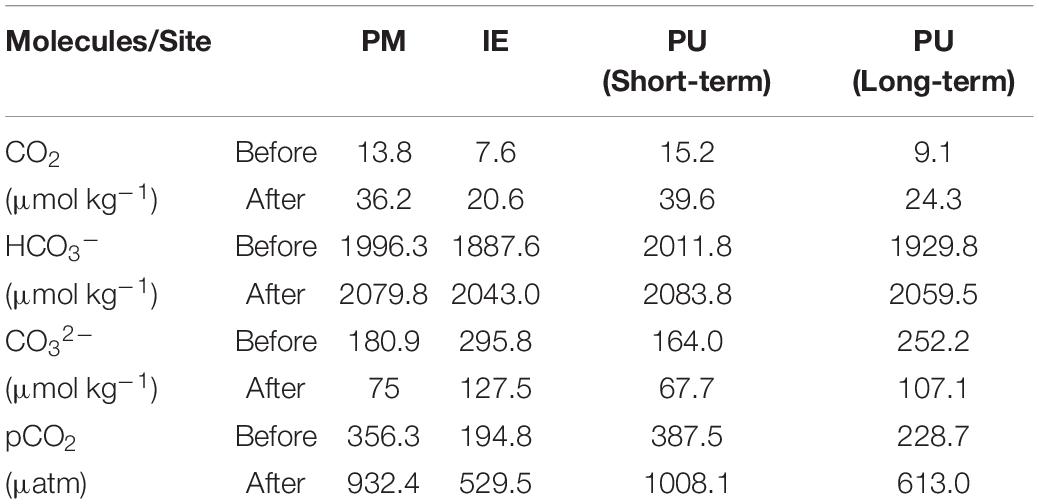
Table 2. Estimated concentrations of CO2, HCO3–, CO32– before and after the pH-reducing treatment.
Short-Term Experiments (PM, PU, IE)
Relative Abundance, Growth, and Changes in the Phytoplankton Community Structure
In terms of abundance, nanoplanktonic cells (<20 μm) dominated (92%) in all the three sites (Figure 3A); however, in terms of carbon biomass, microplanktonic cells (>20 μm) had the largest share (>50%) in PM and PU, whereas nanoplankton biomass was higher in IE (Figure 3B). The three sites were initially characterized by different proportions of phytoplankton groups (Figure 3C), but in terms of abundance, unidentified flagellates dominated in all sites (65–90%). The dominance of unidentified flagellates in terms of abundance was more evident at PU, compared to PM and IE. The rest of the community in PM was composed of pennate diatoms only (e.g., Grammatophora marina, Nitzschia longissima, and Navicula spp.), while this group were present together with centric diatoms (e.g., Thalassiosira spp.) in PU and IE (Figure 3C). In PM there were small changes in the size composition, both in terms of abundance (Figure 3A) or biomass (Figure 3B) in the two scenarios, at the end of the 2 days acclimation period. Nevertheless, the total abundance and biomass increased in both experimental scenarios (numbers inside the circular graphs; Figure 3C). A similar situation was observed in PU, but the Future scenario stimulated the growth of centric diatoms (e.g., Thalassiosira spp. and Chaetoceros spp.) compared to the Present (e.g., mainly Thalassiosira spp.), reaching the highest abundances and carbon biomass of the three sites (Figure 3C). Similarly, in IE, centric diatoms (Thalassiosira spp.) increased in abundance and biomass from the initial value, reaching similar values in the Present and Future scenarios (Figure 3C). The dominance of centric diatoms in abundance and biomass was the highest in IE, and the lowest in PM (Figure 3C). Overall, small cells dominated at the end of the acclimation period in PM, with the carbon concentration per cell decreasing from 24 ng C cell–1 in the initial sample to ∼10 ng C cell–1 in the Present and Future scenarios. On the other hand, large cells dominated in PU, with the carbon concentration per cell increasing from 17 ng C cell–1 in the initial sample to 48 and 44.5 ng C cell–1, for the Present and Future scenarios, respectively, having the largest change throughout the experimental period as compared to the other sites. Although cellular carbon content also increased in IE after the acclimation period, this change was smaller compared to PU, as in the initial sample the cellular carbon content was 18 ng C cell–1 and at the end these values reached 28.2 and 27.8 ng C cell–1, for both the Present and Future scenarios, respectively.
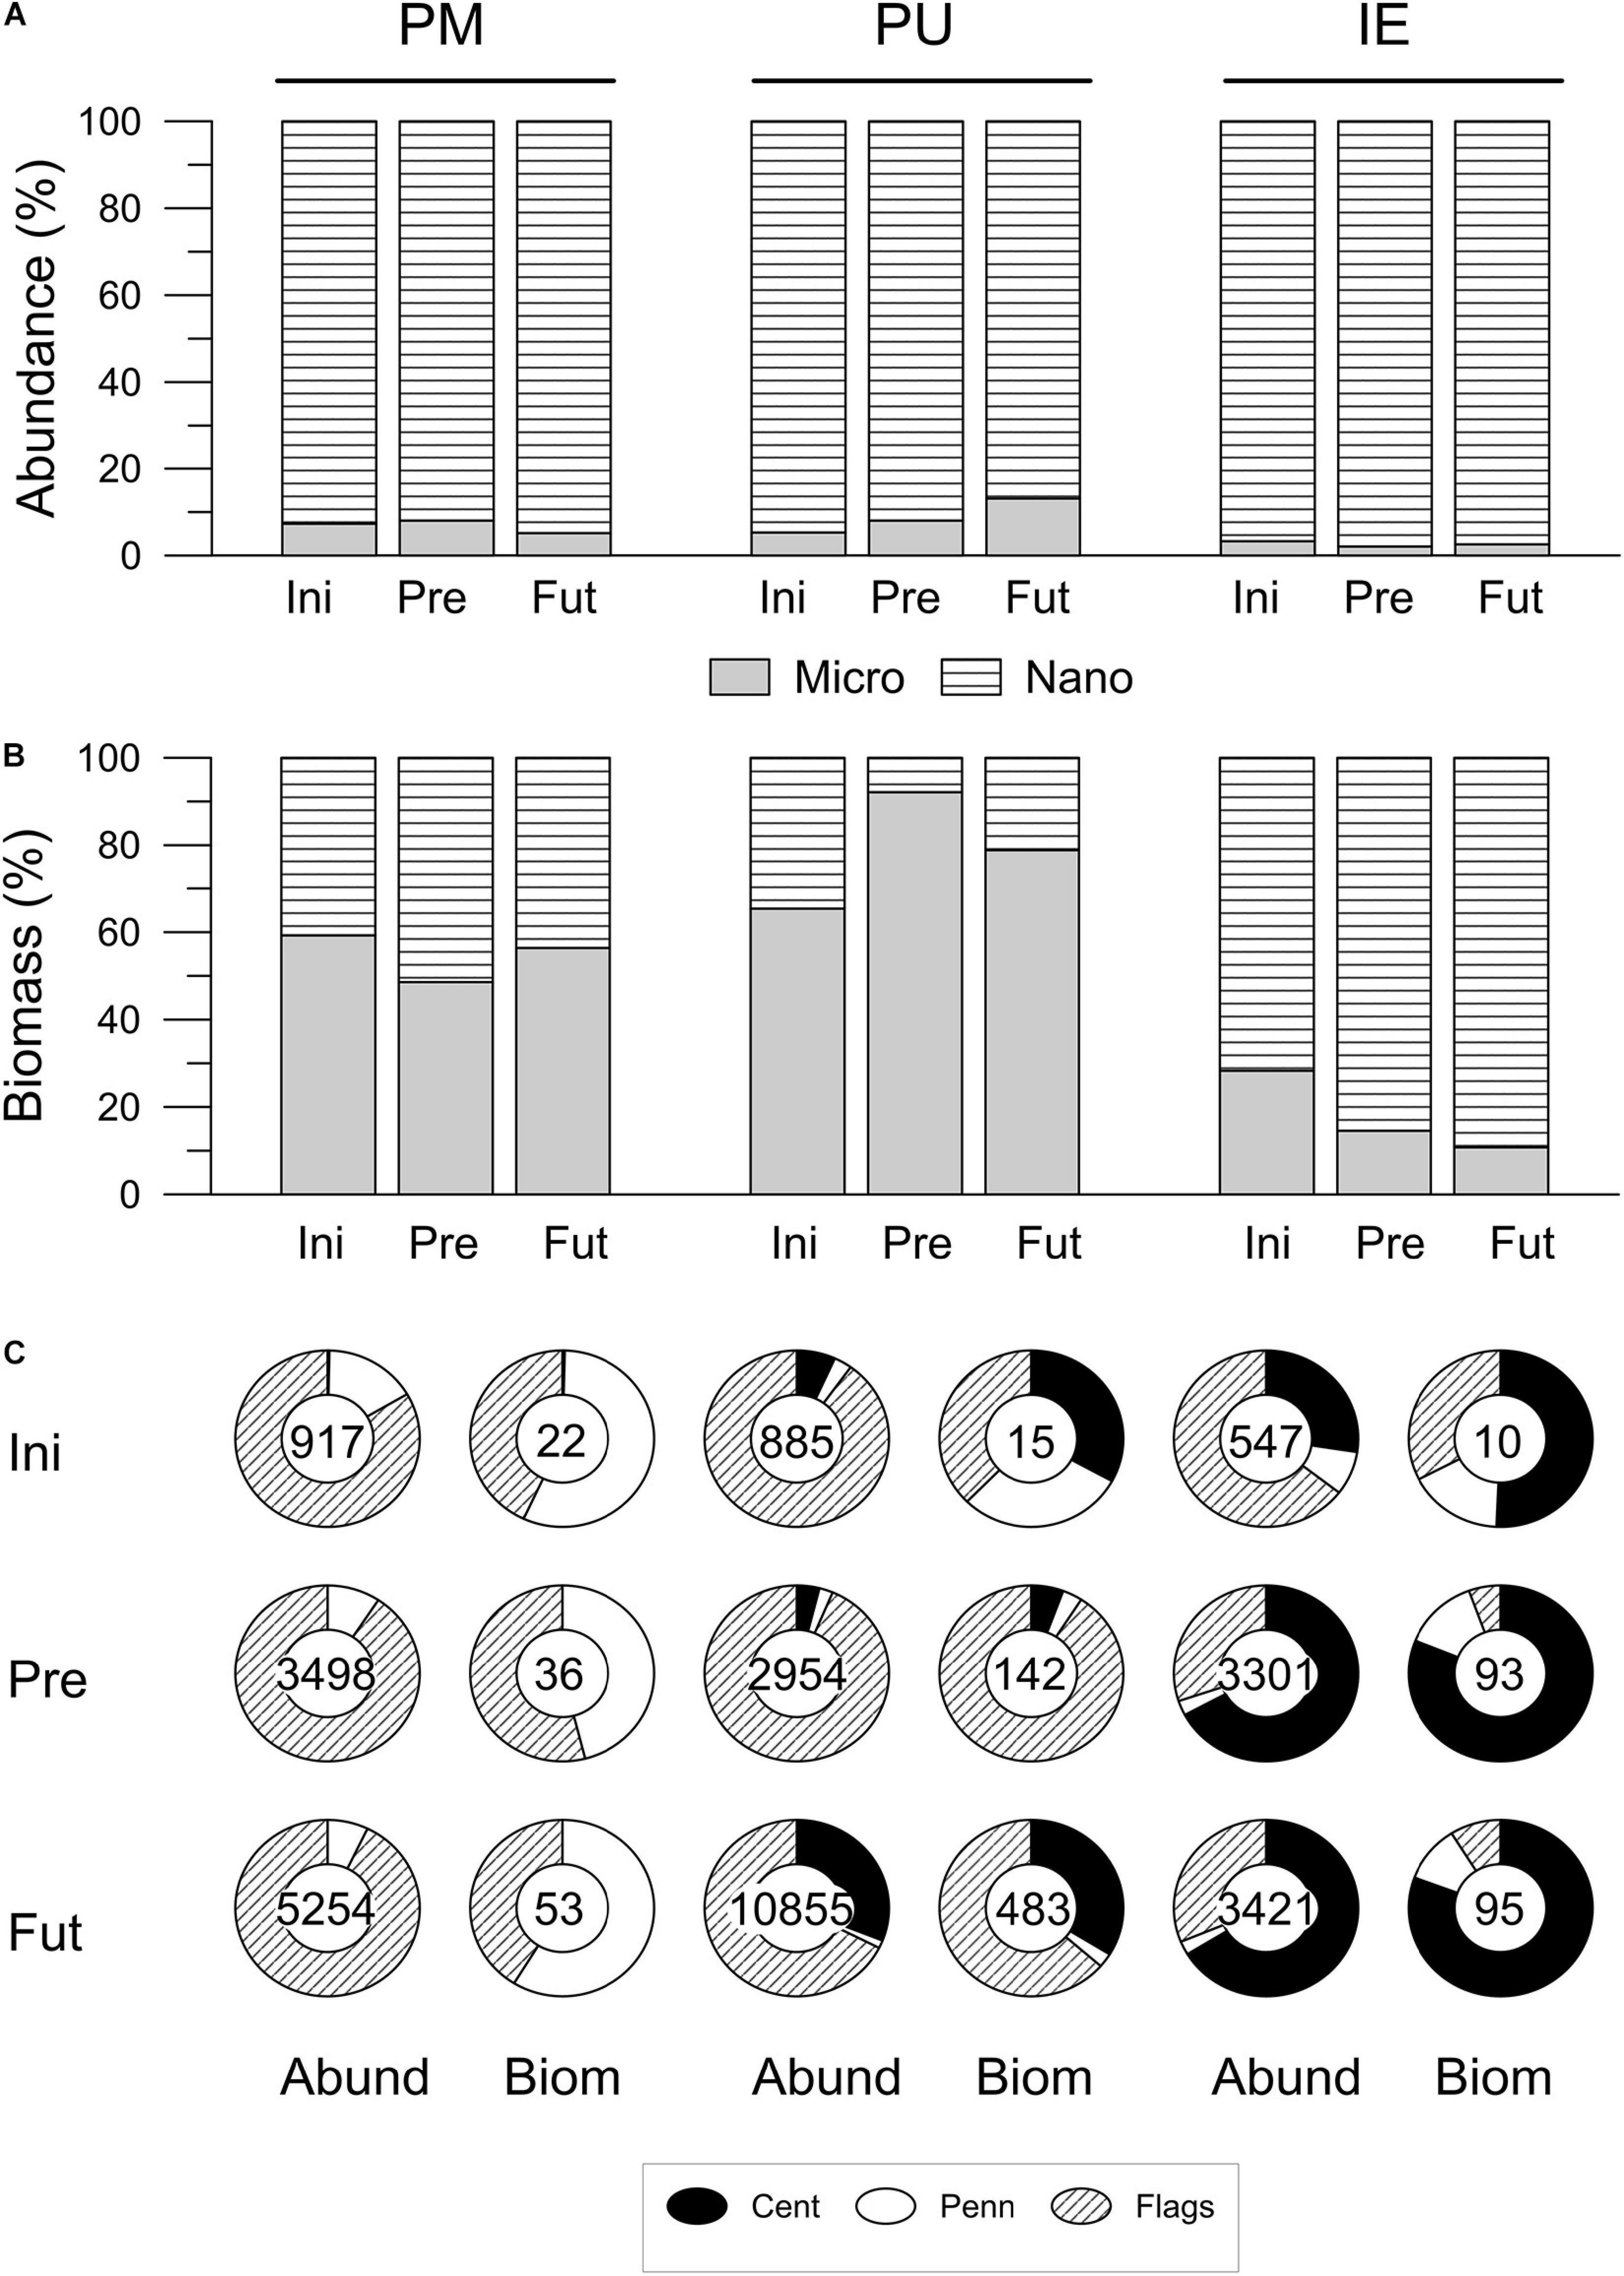
Figure 3. Phytoplankton community structure: size (micro and nanoplankton) and groups (centric diatoms: Cent, pennate diatoms: Penn, and flagellates: Flags), in terms of cell abundance (A) and biomass (B) for the three studied sites–Puerto Madryn (PM), Playa Unión (PM) and Isla Escondida (IE). The data correspond to the beginning –sampling time (Ini), and after the 2 days acclimation period, for the Present (Pre) and Future (Fut) scenarios. Numbers inside the circular graphs in (C) indicate the abundance (Abund, in cells ml–1) or the biomass (Biom, in μg C l–1).
Photosynthetic Rates
Photosynthetic rates were evaluated using three different and independent measurements: (a) net community production NCP [in μmol O2 (μg Chl a)–1 h–1], the net budget of photosynthetic oxygen production and active respiratory processes by all microorganisms present, (b) electron transport rates, ETR (in μmol e– (μg Chl a) –1 h–1), the electrons passed through photosystem II (PSII), and (c) assimilation numbers, as PmB [in μmol C (μg Chl a) –1 h–1], the inorganic carbon incorporated in the photosynthetic Calvin–Benson–Bassham cycle. All photosynthetic parameters were normalized to the Chl a concentrations measured at the same sampling periods. Chl a was in general higher in the Future scenario compared to the Present (Figure 4A) in all sites, being this increase especially evident in PU, and less in IE. In addition, Chl a concentrations increased along the day in the Future scenario in all sites, suggesting an active growth during the light period (Figure 4A). A similar trend was observed for bulk carbon incorporation (Figure 4B and Table 3), with values increasing during the day (especially in samples under the Future scenario) and these being significantly higher in the Future scenario (28.5 ± 3.4–76.4 ± 3.4 μg C L–1) than in the Present (8.8 ± 1.2–12.9 ± 0.6 μg C L–1) for PU during all the days. For PM the significant differences between Present and Future scenarios were observed at noon and afternoon, while for IE only at noon. Compared to PM and IE, PU had the highest values of carbon incorporation in the Future scenario (76.4 ± 3.4 μg C L–1; Figure 4B and Table 3).
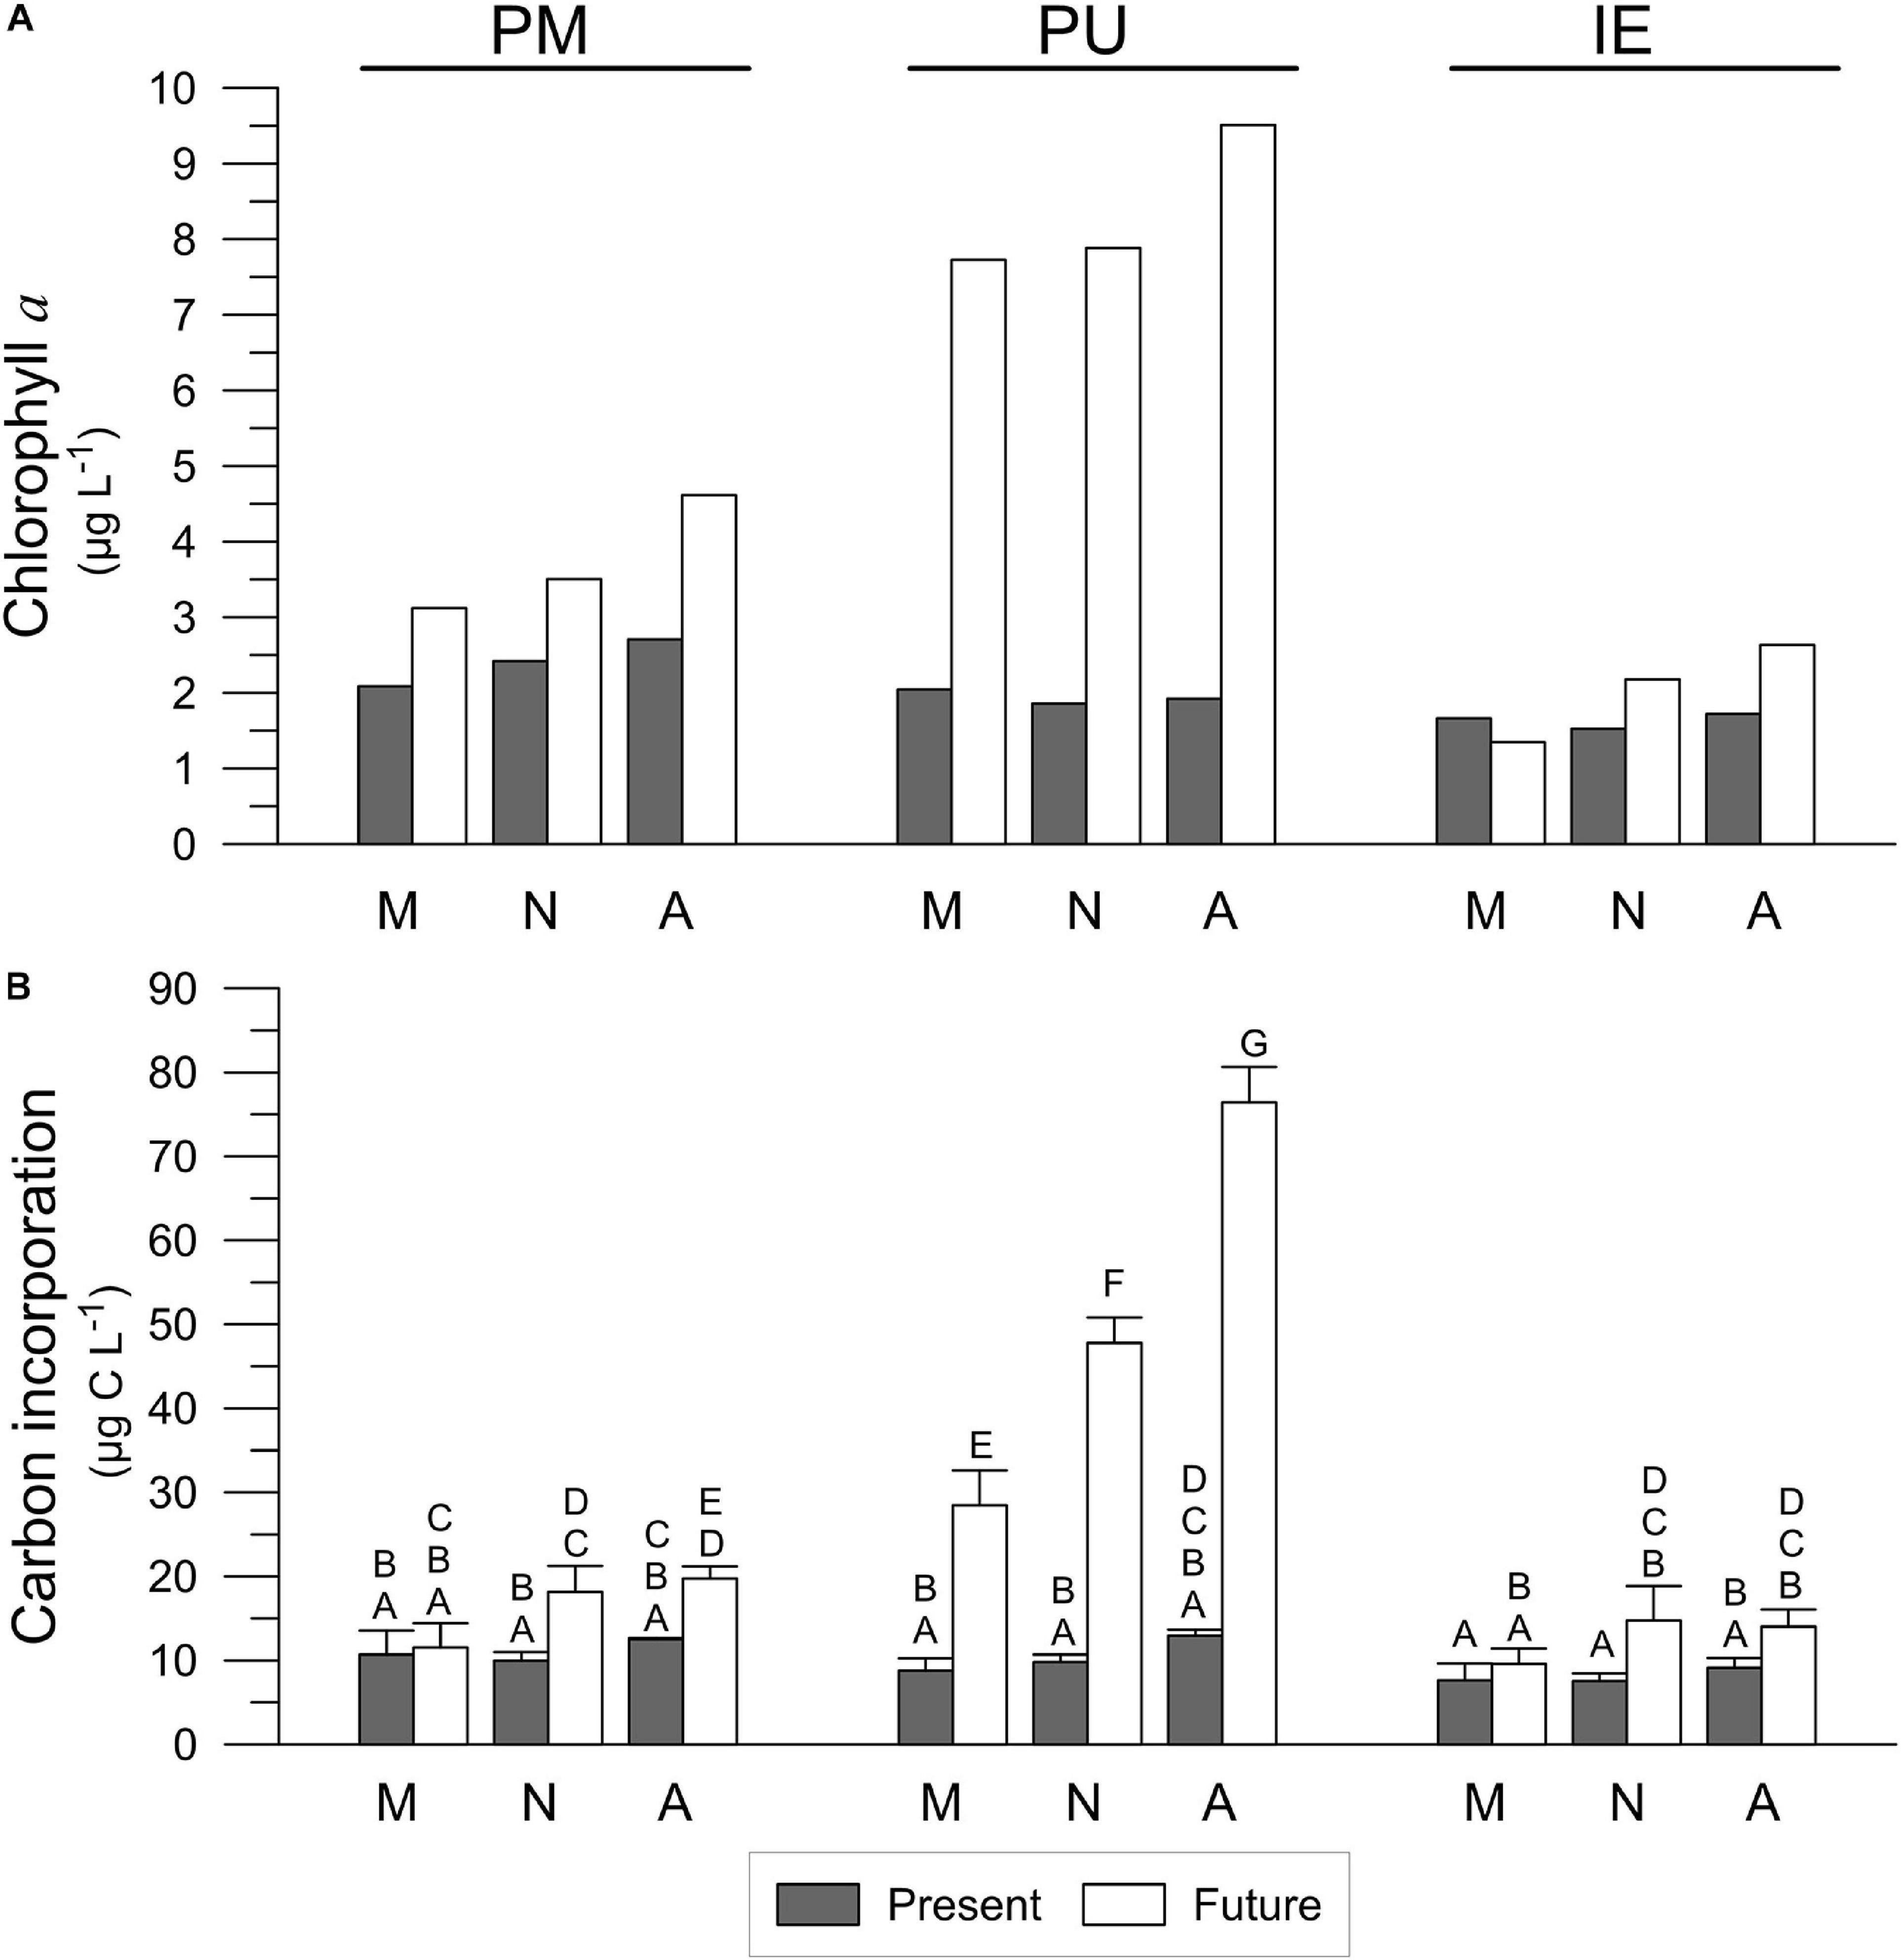
Figure 4. Chlorophyll a concentration (A) and carbon incorporation (B) of the samples collected in Puerto Madryn (PM), Playa Unión (PU) and Isla Escondida (IE) after being acclimated for 2 days under the Present (Pre) and Future (Fut) scenarios. Capital letters indicate the post-hoc results for the interaction time × site × scenario (2-way RM-ANOVA). M, N and A letters indicate morning, noon and afternoon, respectively. Lines on the top of the bars indicate standard deviation.
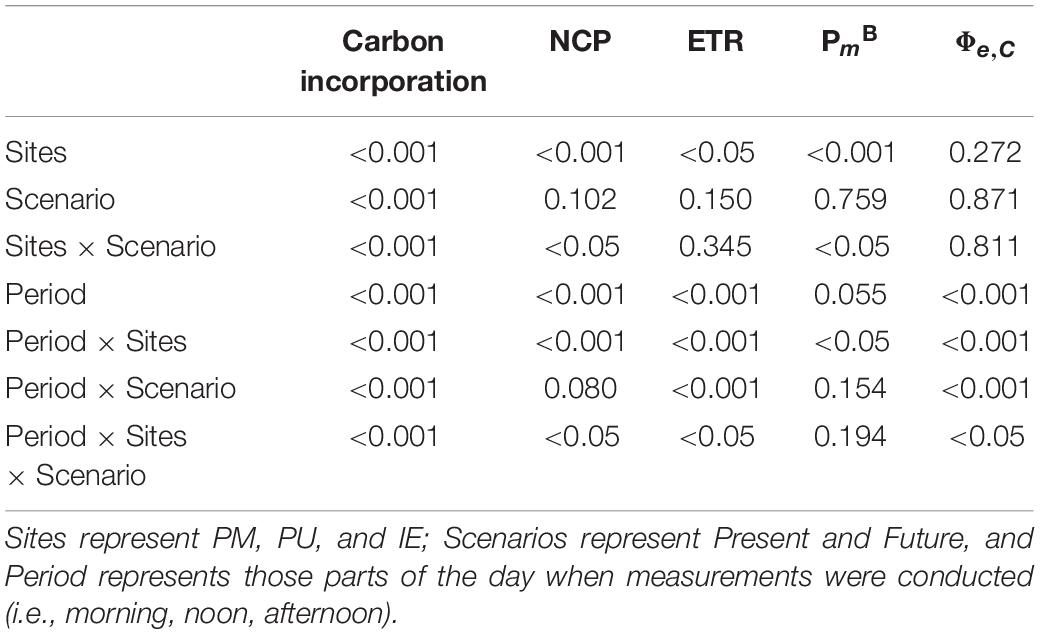
Table 3. p-values of the two-way RM-ANOVAs for carbon incorporation (Figure 4B), net community production (NCP) (Figure 5A), electron transport rates (ETR) (Figure 5B), assimilation number (PmB) (Figure 5C), and ratio ETR to PmB (Φe,C; Figure 5D).
For NCP, there was a significant interaction between the period of the day, site and scenario (Figure 5A and Table 3), with higher values in the morning, which decreased during the day. In PM and IE, negative values were determined, indicating that community respiration surpassed oxygen production by phototrophs (Figure 5A). Significant differences between Future and Present scenarios were observed only for the PU samples, with NCP values being higher in the Present [3.21 ± 0.12 μmol O2 (μg Chl a)–1 h–1] than in the Future [1.04 ± 0.05 μmol O2 (μg Chl a)–1 h–1] during the morning measurements. A significant interaction among the period of the day, site and scenario was also determined for ETR (Figure 5B and Table 3), but it increased during the day in both scenarios. Differences among the period of the day were only significant in PU, with values during the noon and the afternoon being higher than in the morning. ETR values were similar between the Present and Future scenarios in all sites with the exception of samples measured during the morning in IE, where higher values were registered in the Future (Figure 5B and Table 3). Finally, PmB values were similar along the day for each site; however, there was a significant interaction between the period of the day and site, with values in PU increasing from morning to afternoon, especially when compared to PM and IE (Figure 5C and Table 3). Moreover, a significant interaction between sites and scenario was determined in the Present scenario, with higher PmB values in PU than in PM and IE (Figure 5C and Table 3). There was also a significant interaction among the period of the day, site and scenario for the electron requirement for carbon fixation Φe,C (calculated as ETR/PmB at in situ irradiance) (Figure 5D and Table 3) with values varying between 5.8 and 11.8, and being generally (but not significantly) higher in the Present than in the Future scenario.
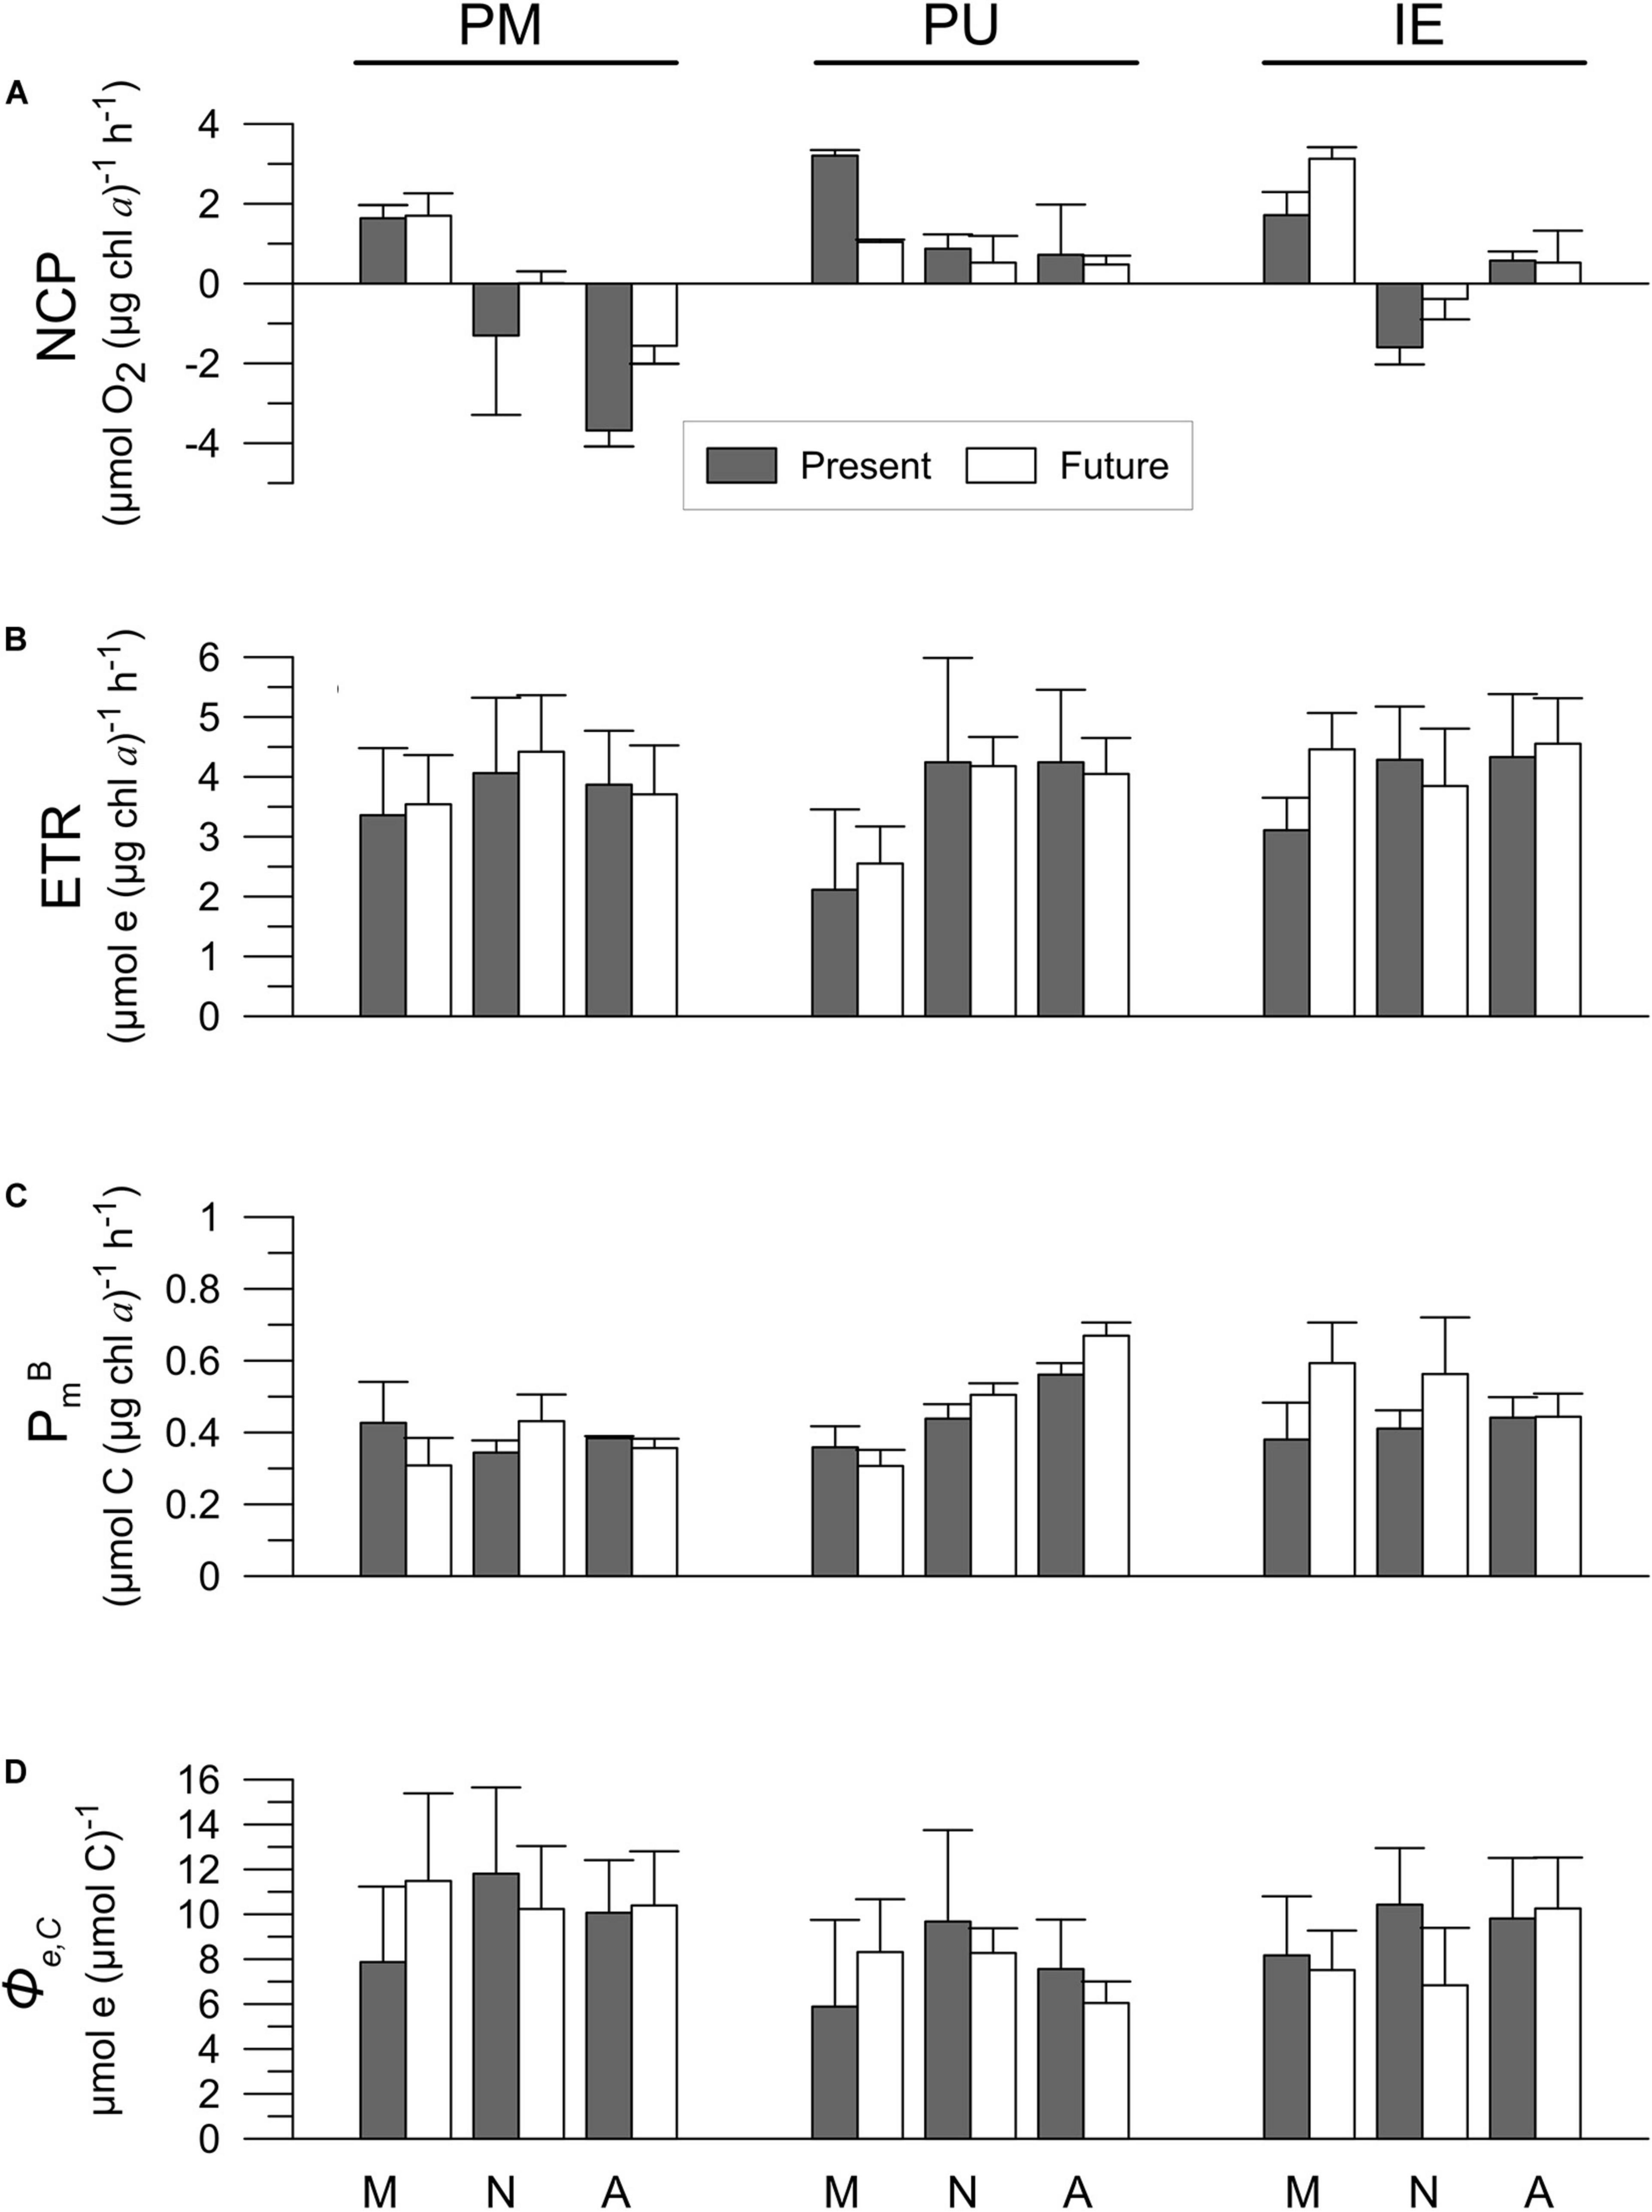
Figure 5. (A) Net community productivity (NCP); (B) electron transport rates (ETR); (C) assimilation numbers (PmB), and (D) ratio of ETR and PmB (Φe,C) of the samples collected in Puerto Madryn (PM), Playa Unión (PU) and Isla Escondida (IE) after being acclimated for 2 days under the Present (Pres) and Future (Fut) scenarios. M, N and A letters indicate morning, noon and afternoon, respectively. Lines on the top of the bars indicate standard deviation.
Long-Term Experiment (PU)
Abundance of Cells, Growth and Changes in the Phytoplankton Community Structure
Throughout the long-term experiment at PU, nanoplanktonic cells were dominant in terms of abundance in the both scenarios, accounting for > 86% of the phytoplankton community (Figure 6A). In terms of biomass, microplanktonic cells were the most represented group, except for the samples at the end of the acclimation period (day 5), where nanoplankton biomass (∼53%) surpassed it slightly (Figure 6C). Unidentified flagellates and centric diatoms (e.g., Thalassiosira spp.) were the most representative groups in terms of both, abundance (Figure 6B) and biomass (Figure 6D); pennate diatoms (mainly Asterionellopsis glacialis) only contributed in a small proportion (<19%, Figures 6B,D). Cell abundances, either based on size or groups, increased throughout the experiment, reaching their highest values in the Future scenario at the end of the acclimation period (Figures 6A,B). In day 5 significant differences between scenarios were detected, with higher nano- and microplankton abundances under the Future scenario (Figure 6A and Table 4), and with significant differences only for centric diatoms (Figure 6B). Both cell size- and group-based biomass (Figures 6C,D) increased throughout the acclimation period, having significant differences between the Present and the Future scenarios after 5 days of acclimation. Growth rates based either on size (Figure 6E) or groups (Figure 6F) decreased toward the end of the acclimation period (long acclimation). During the first half of the experiment (mid-acclimation) no differences were detected between Present and Future scenarios; however, at the end of the acclimation period, growth rates were significantly higher under the Future (Figures 6E,F) compared to the Present. There were significant interactions between scenarios and groups (Figure 6F and Table 4); for example, higher growth rates were recorded for centric diatoms in the Future than in the Present scenario (Figure 6F).
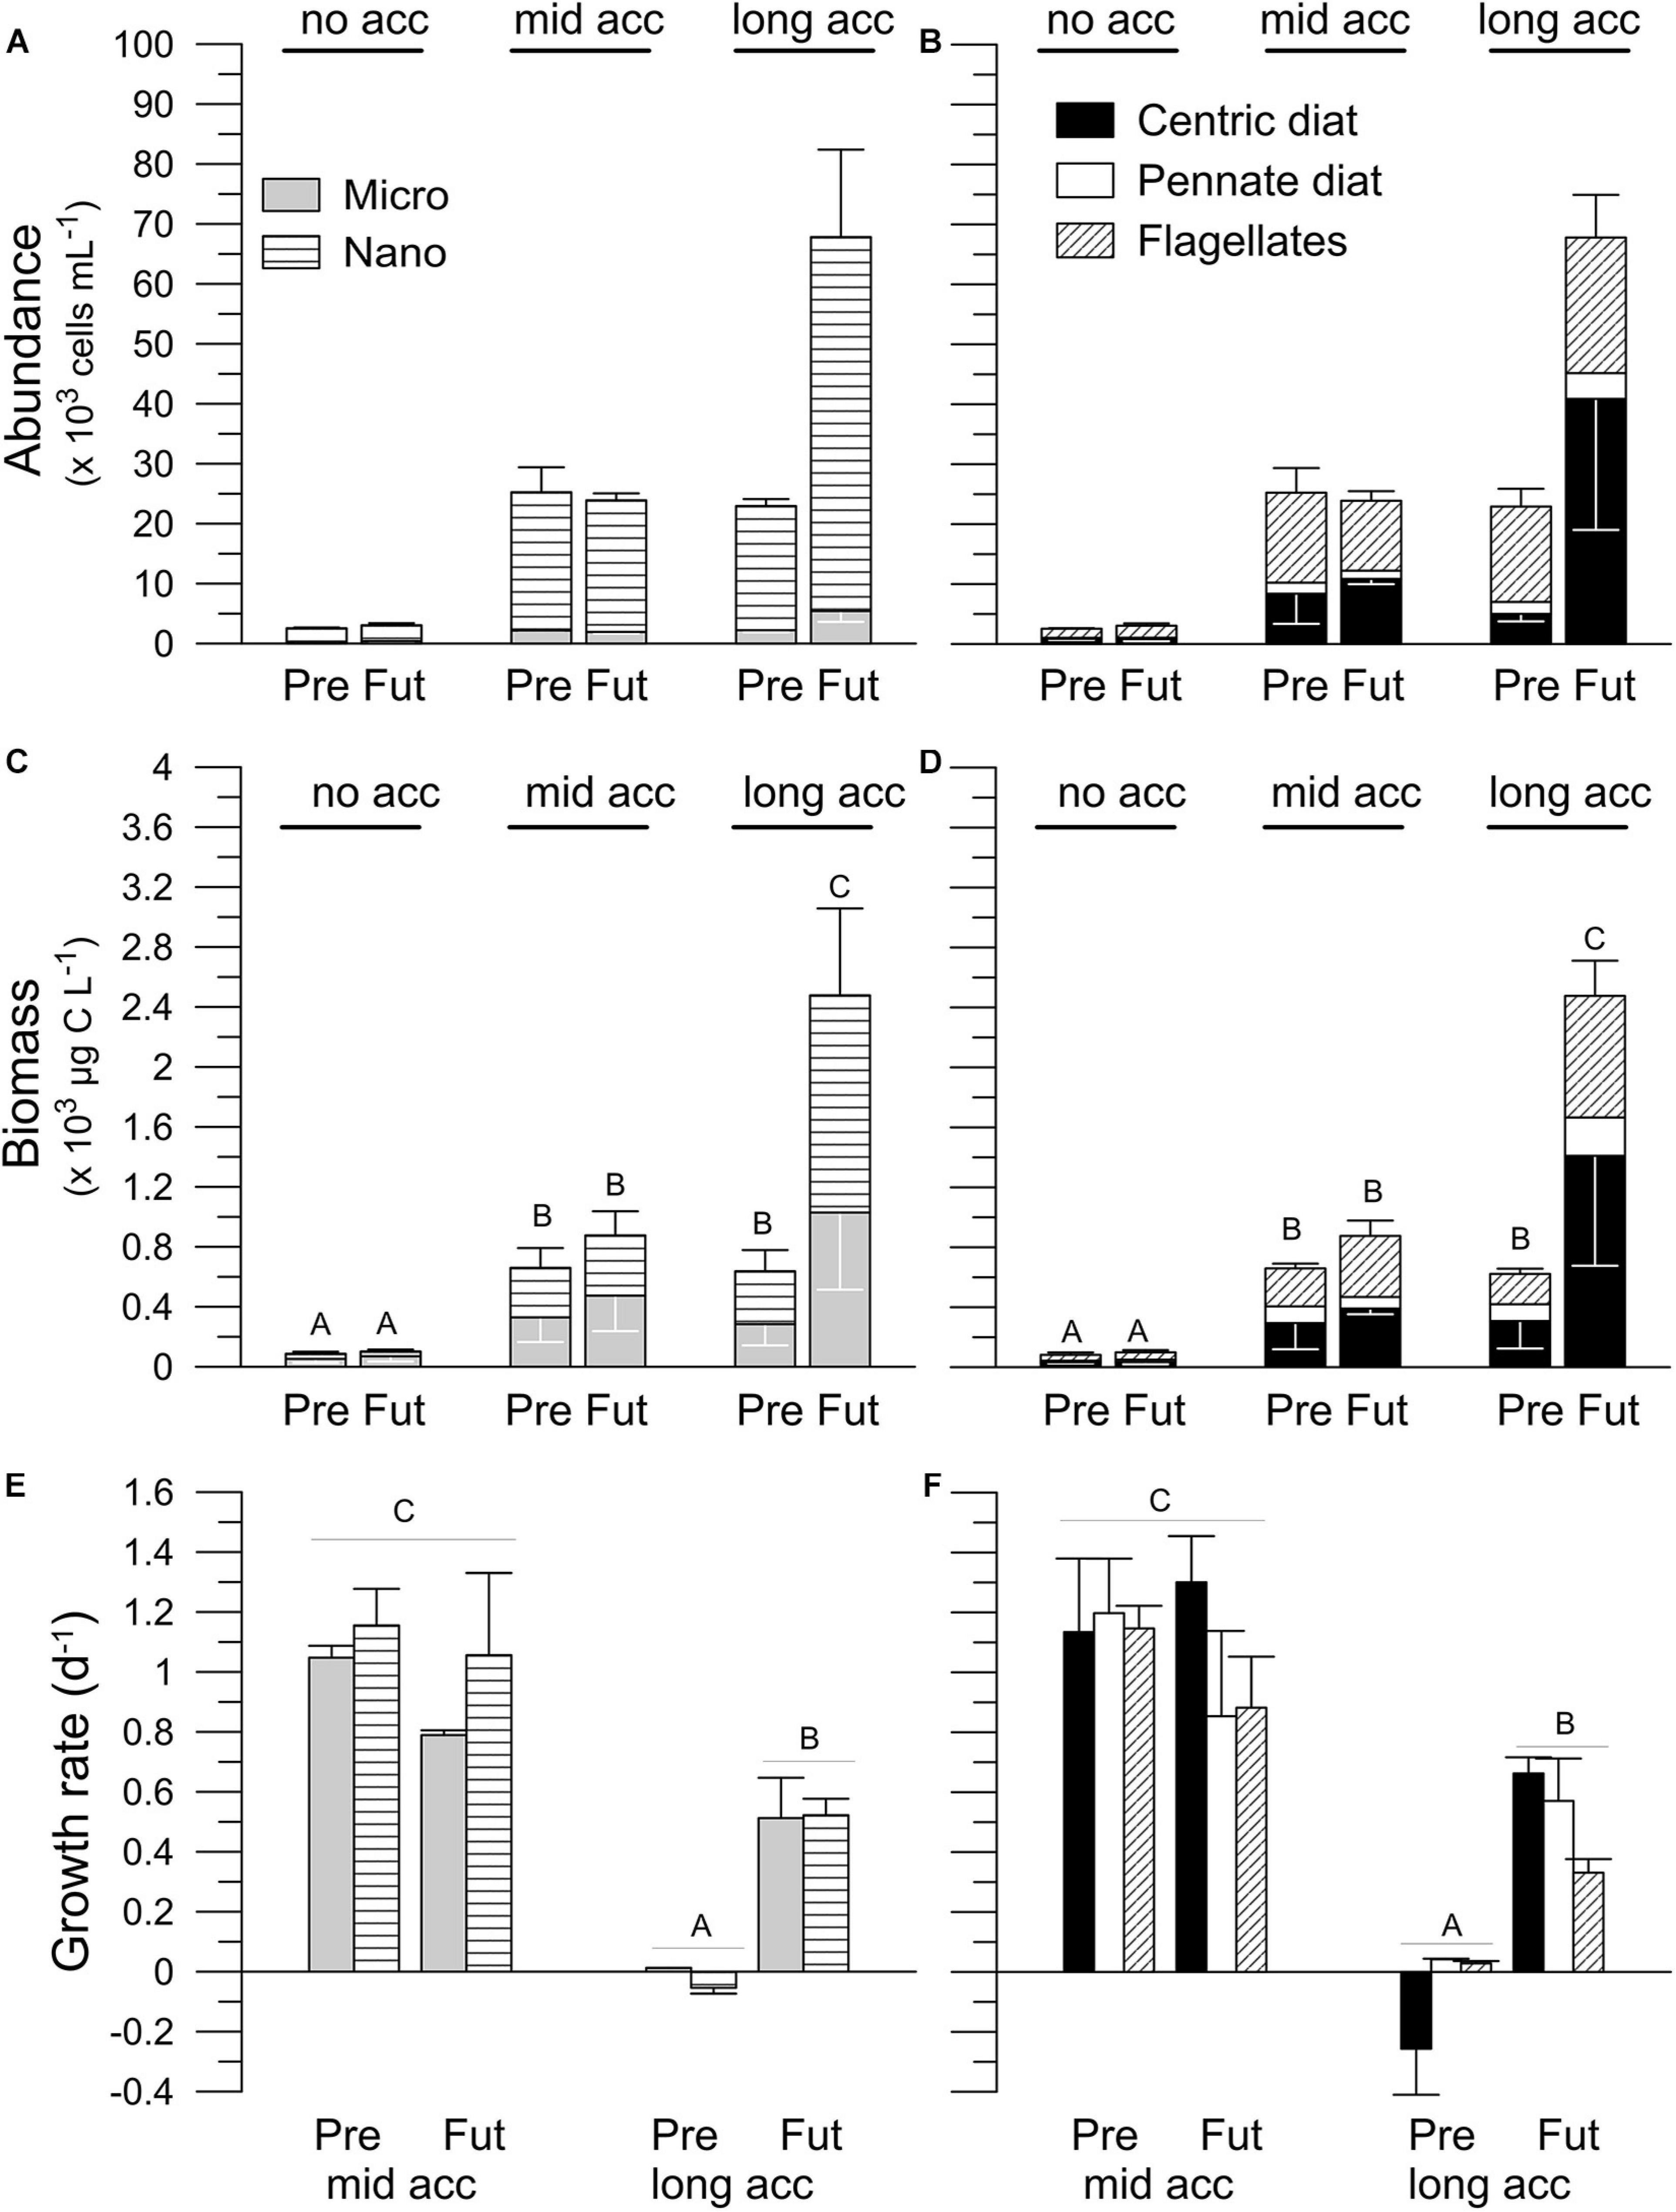
Figure 6. Phytoplankton community structure: size (micro and nanoplankton) and groups (centric diatoms: Cent, pennate diatoms: Penn, and flagellates: Flags) in terms of cell abundance (A,B) and biomass (C,D), and growth rates (E,F) for the different stages of acclimation (no, mid- and long acclimation) to the Present (Pre) and Future (Fut) scenarios for samples collected in Playa Unión. Capital letters indicate the post-hoc results for the interaction acclimation × scenario (3-way ANOVAs). Lines on the top of the bars indicate standard deviation.
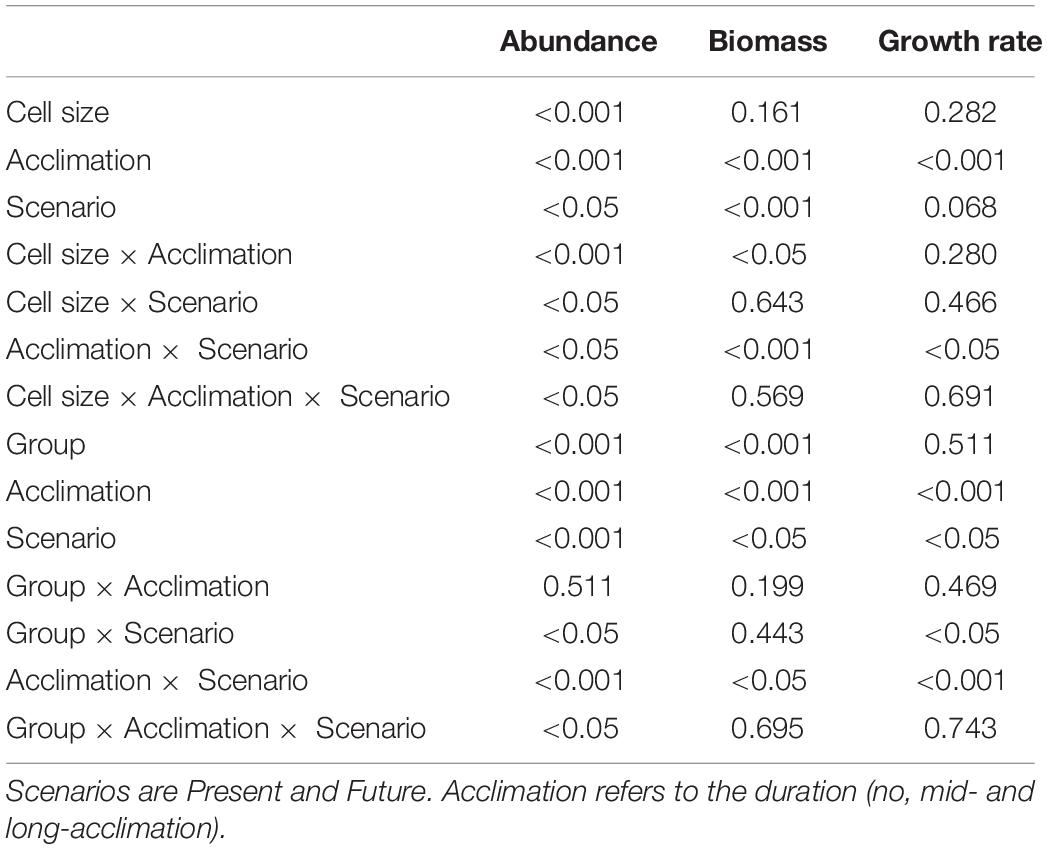
Table 4. p-values of the three-way ANOVAs for phytoplankton abundance (Figures 6A,B), biomass (Figures 6C,D), and growth rates (Figures 6E,F) based on cell sizes (i.e., nanoplankton, microplankton) or groups (i.e., centric diatoms, pennate diatoms or flagellates).
Photosynthetic Rates
Chl a concentration increased during the long-term experiment at PU until the third day of experiment from an initial value of 2.79 and 2.57 μg L–1 in the Present and Future scenario, respectively, but decreased afterward in the Present, while it kept increasing in the Future, reaching a concentration of ca. 60 μg Chl a L–1 (Figure 7A). Carbon incorporation (Figure 7B) was similar on day 1 (no acclimation) in both scenarios, but was significantly higher in the Future scenario as compared to the Present at the end of the acclimation period (long acclimation). Moreover, carbon incorporation also significantly increased on this day from morning to afternoon (Figure 7B and Table 5).
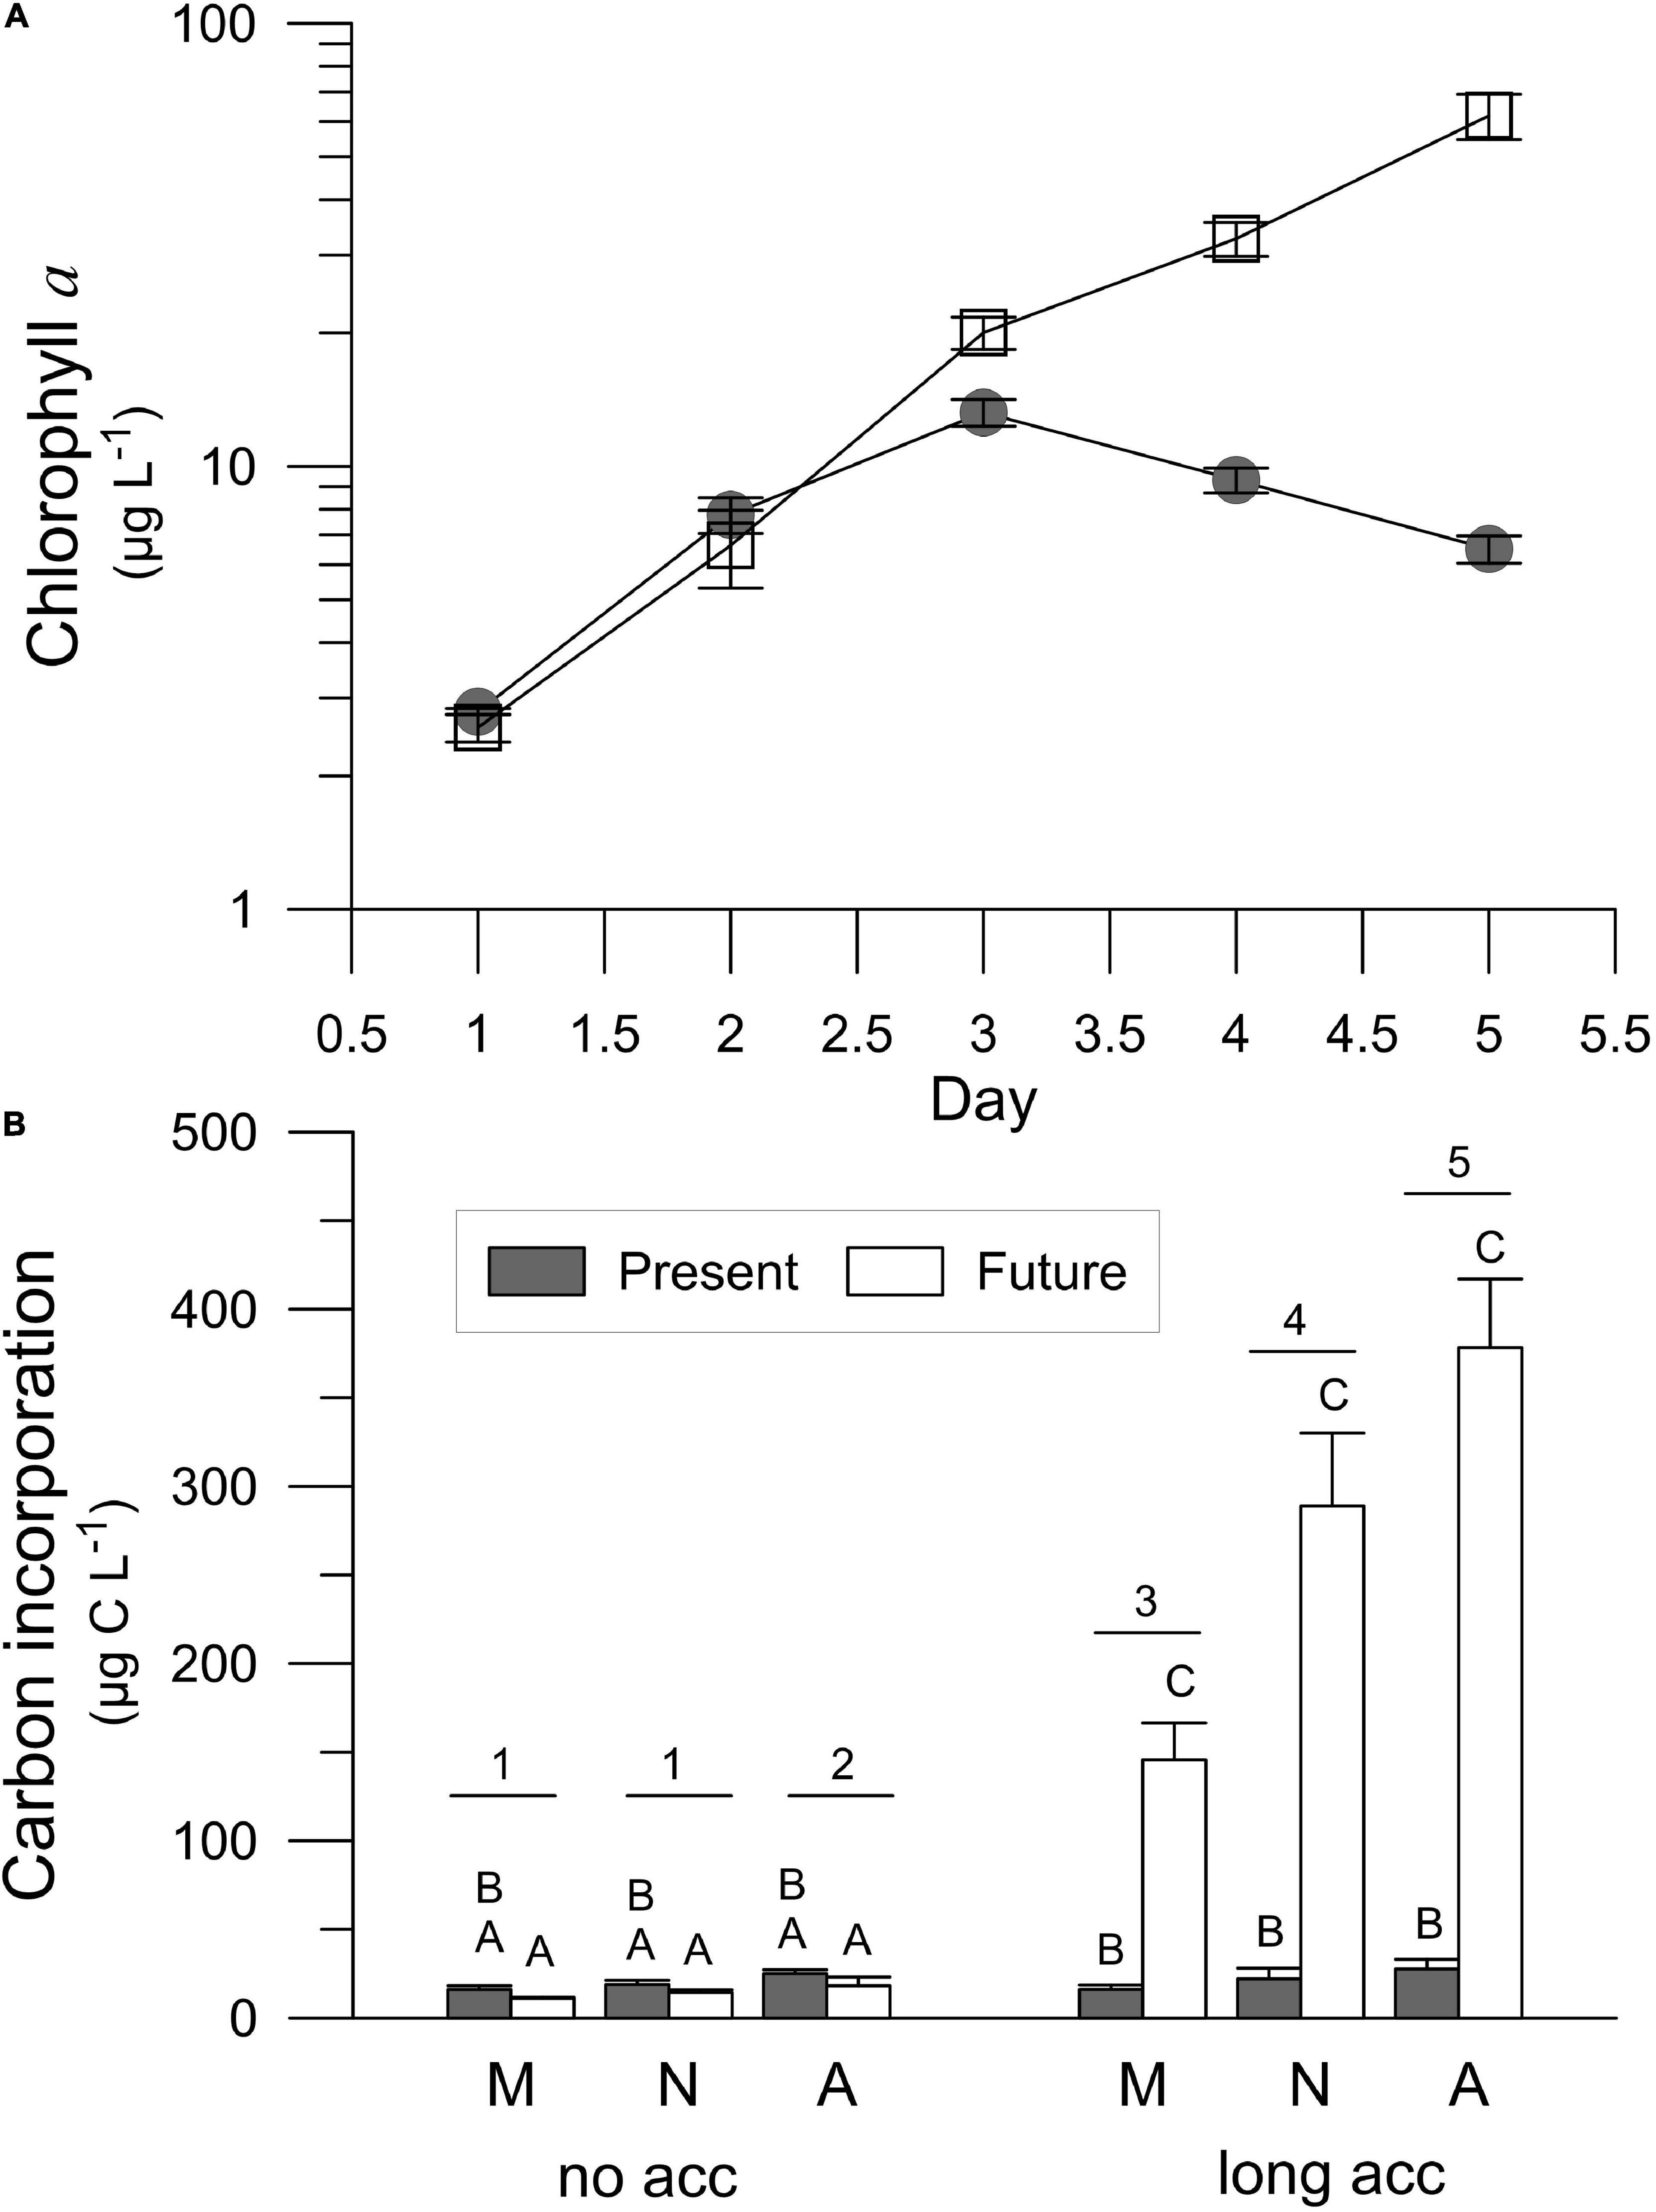
Figure 7. Chlorophyll a concentration (A) and carbon incorporation (B) during the long-term experiment performed with samples collected in Playa Unión (PU) and exposed to the Present and Future scenarios. Capital letters indicate the post-hoc results for the interaction acclimation × scenario, and the numbers indicate the post-hoc results for the interaction time × acclimation (2-way RM-ANOVA). Lines on the top of the bars indicate standard deviation.
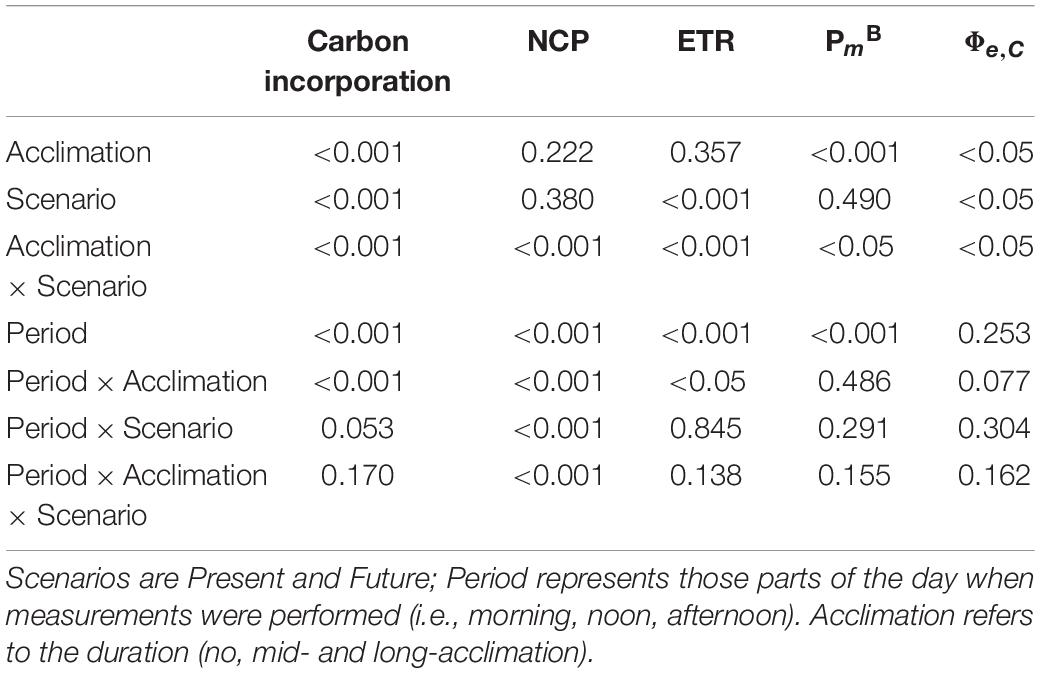
Table 5. p-values of the two-way RM-ANOVAs for carbon incorporation (Figure 7B), net community production (NCP) (Figure 8A), electron transport rates (ETR) (Figure 8B), assimilation number (PmB) (Figure 8C), and ratio of ETR and PmB (Φe,C; Figure 8D).
We found significant differences in the NCP for no-acclimated cells, with decreasing values toward noon and increasing again during the afternoon (Figure 8A and Table 5). In the no acclimation condition, respiration surpassed oxygen production only at noon (i.e., negative values) and also NCP was significantly lower in the Future than in the Present scenario (Figure 8A). Under long acclimation, NCP rates were much lower than at the beginning of the experiment, with no significant differences between scenarios, except for the Present in the afternoon, where NCP was significantly lower than in the Future (Figure 8A and Table 5). ETR values were similar in both scenarios in the no acclimation condition, but they were significantly higher in the Present than in the Future scenario at the end of the experiment (Figure 8B and Table 5). The highest ETR values were registered at the end of the experiment, during the afternoon measurements (Figure 8B). PmB showed a clear diurnal pattern of increasing values from morning to afternoon both at the beginning (no acclimation) and end (long acclimation) of the experiment in both scenarios (Figure 8C and Table 5). PmB values were higher in the no acclimated compared to the long acclimated cells, but only for the Present scenario (Figure 8C and Table 5). Finally, the electron requirement for carbon fixation Φe,C ratio was similar in both scenarios when cells were not acclimated (Figure 8D), but cells in the Present showed higher values compared to those in the Future scenario at the end of the experiment (Figure 8D and Table 5).
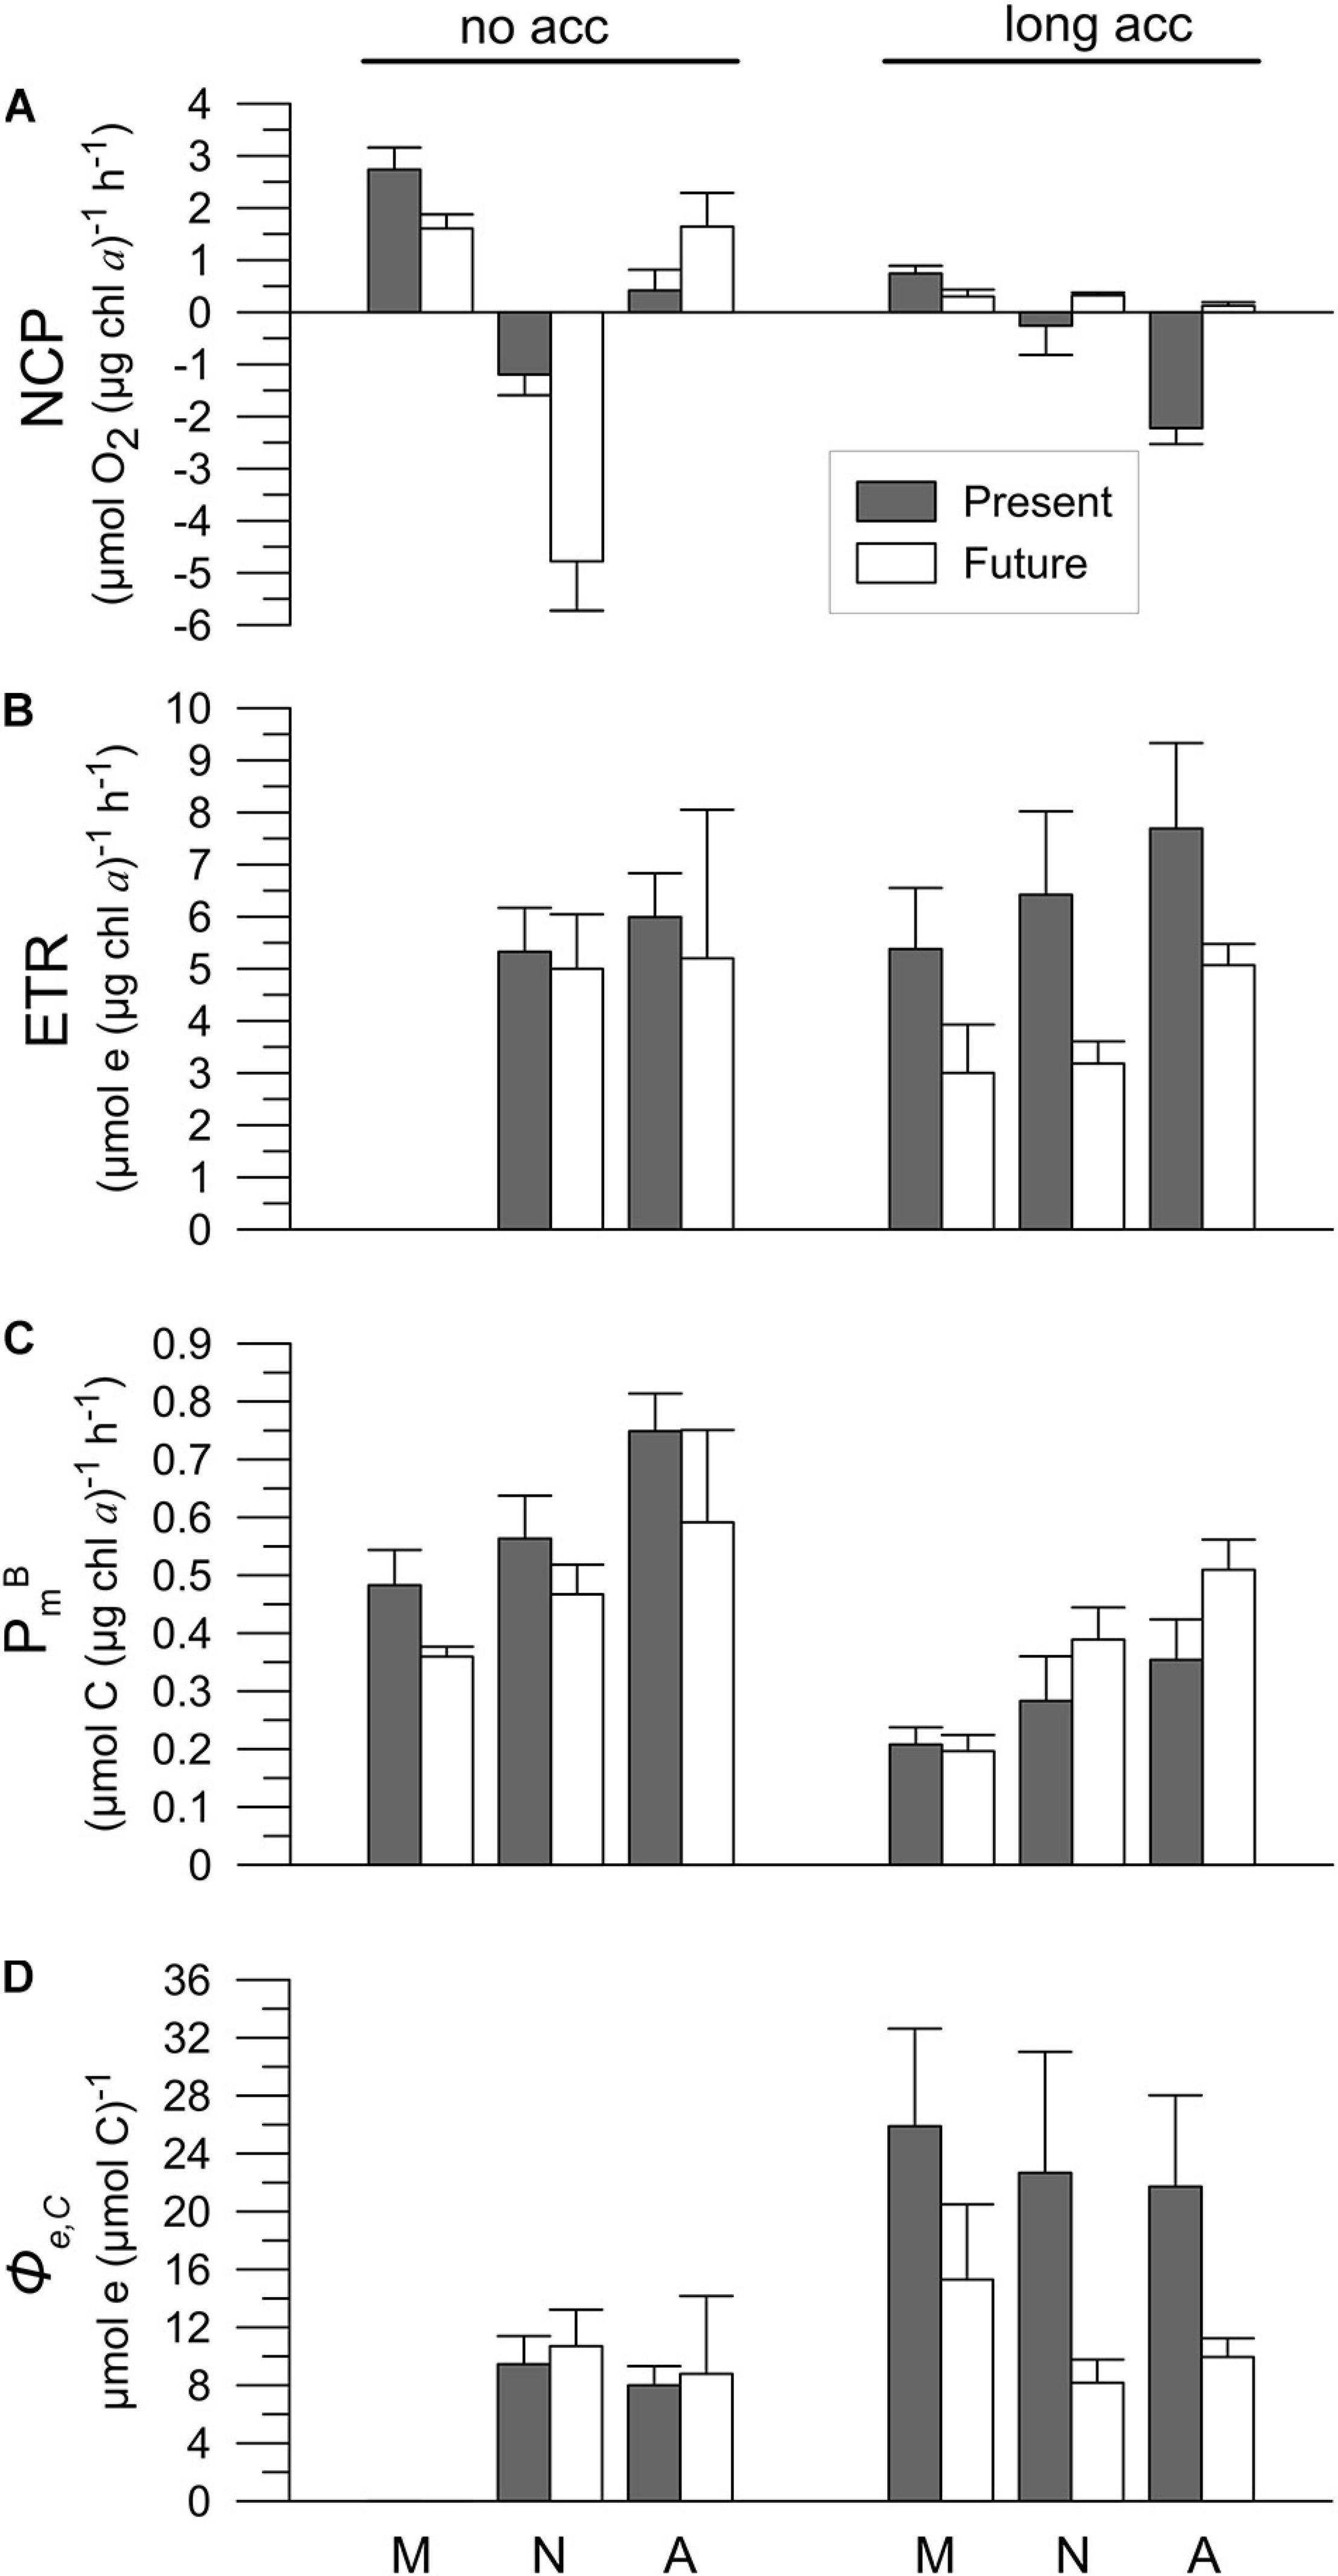
Figure 8. (A) Net community productivity (NCP); (B) electron transport rates (ETR); (C) assimilation numbers (PmB), and (D) ratio of ETR and PmB (Φe,C) of samples collected in Playa Unión (PU) after being acclimated for 1 and 5 days under the Present (Pres) and Future (Fut) scenarios. M, N and A letters indicate morning, noon and afternoon, respectively. Lines on the top of the bars indicate standard deviation.
Discussion
In this study, we aimed to enhance our knowledge about the effects of global change variables on phytoplankton growth and photosynthesis in three different sites of the Patagonian coast, by applying an experimental cluster (Future scenario). We especially focused on key components of the photosynthetic processes; the water splitting complex (by oxygen evolution measurements), PSII photochemistry (by PAM and FRRf measurements), and Calvin-Benson-Bassham cycle (by carbon incorporation measurement), in an attempt to determine the extents of their vulnerability to increased nutrient and lowered pH conditions. This is a novel approach, as most field studies have generally considered the effects of global change variables on single photosynthesis targets. Our previous studies have determined that Future scenarios had differential impacts on oxygen dynamics and PSII photochemistry (Villafañe et al., 2018; Vizzo et al., 2021), and that acclimation over time changed the rETR vs. NCP relation (Villafañe et al., 2018). We used the same photosynthetic parameters as in these previous studies to get a more realistic response to global change. We hope that our results, together with those obtained for the phytoplankton community structure (e.g., taxonomic changes, effects on different size fractions), will provide a better assessment of the secondary production in the Argentinean Sea. Consequently, we discuss our findings together with the potential mechanisms that could explain our observations, and consider some of the implications for this area, which is believed to sustain one of the highest productivities of the World’s oceans (Longhurst et al., 1995; Gregg and Rousseaux, 2019).
Future Conditions Stimulate Growth and Photosynthetic Activity, Especially in Estuarine Waters
The experimental sites in the South West Atlantic Ocean (SWAO) are normally exposed to intense winds (Gaiero et al., 2003; Gassó and Stein, 2007), and the water column over the continental shelf is generally well mixed (Neale et al., 2003). There is, however, a marked seasonal change, with intense winds in spring-summer and a relatively calm period during winter (Villafañe, 2004; Helbling et al., 2005; Bermejo et al., 2018). Previous reports for the area (Villafañe, 2004) indicate that phytoplankton blooms occur during winter (June–August), when wind speeds are low (Helbling et al., 2005; Fitch and Moore, 2007; Bermejo et al., 2018). Thus, our sampling period during October corresponded to post bloom (Villafañe, 2004). At PU, nutrient concentrations are relatively high during the whole year due to riverine input (i.e., from the Chubut river), which not only carries nutrients, but also particles and dissolved matter (Bermejo et al., 2018; Vizzo et al., 2021). It has been determined that the nutrient inputs due to riverine runoff are increasing over time (Bermejo et al., 2018) because of anthropogenic activity (i.e., farming, uses of land, fisheries by-products, etc.) and extreme rain events that are more frequent (Vizzo et al., 2021). On the other hand, PM and IE do not receive a constant input of nutrients, and their dynamics are more subjected to biological activity rather than anthropogenic input via a riverine runoff. Our results also highlight the different strategies of phytoplankton used for growth in the three sites for the effects of nutrient inputs. Fresh nutrient inputs seldom occur in PM and IE, while nutrients from riverine origin are received twice a day in PU (Helbling et al., 1992; Bermejo et al., 2018) due to the semi-diurnal tide regime (Piccolo and Perillo, 1999). It is known that, diatoms and larger cells are r-strategists, characterized by rapid growth under a nutrient-replete environment (Margalef, 1978; Thomsen et al., 1994; Litchman, 2007). On the other hand, dinoflagellates and most flagellates are expected to be K-strategists (Smayda and Reynolds, 2001; Litchman, 2007; Glibert, 2016), with slow growth and with higher nutrient affinity. It is recognized that the r-strategists allocate a large portion of resources to cell division, which is advantageous in a variable environment such as PU, whereas K-strategists would be favored in less variable environments such as PM and IE.
Cabrerizo et al. (2018) studied the impact of different nutrient sources (aeoline vs. riverine) on community structure, and determined that the combination of high solar UVR and nutrient addition decreased CO2 sink capacity of coastal ecosystems in the SWAO by 27%, by changing the phytoplankton community toward heterotrophic nanoflagellates. Our Future generally stimulated the increase of biomass and carbon incorporation in the three sites, in spite of the dominance of different phytoplankton groups (Figures 3, 4). Nevertheless, some differences were observed among the sites; for example in PM, where new nutrient inputs are limited due to little water exchange (Rivas and Beier, 1990), we observed an increase in the abundance of small flagellates (Figure 3A) and pennate diatom biomass (Figure 3C), with only small changes in the photosynthetic rates (Figure 5). A similar behavior was observed at IE, with only small changes between the Present and Future scenarios (Figures 3, 5). In PU, however, growth—especially that of large centric diatoms such as Thalassiosira spp. (Figure 3C), and carbon incorporation (Figure 4) were significantly stimulated by the Future scenario. The differential growth of the large taxonomic groups in our study agrees with those previous findings where different communities were exposed to lowered pH conditions. For example, a study that compiled the results of 69 experiments on ocean acidification (Bach and Taucher, 2019) determined that diatoms responded to high CO2 in ca. 60% of the experiments, and from this total, 56% indicated a positive response while 32% responded in a negative way. A recent study reported no major changes in the species composition of a dinoflagellate-dominated community under lowered pH in the Derwent River estuary, Australia (Nielsen et al., 2012). A similar study in the Godavari River Estuary (India) on the other hand reported that not only lowered pH but also nutrient supply play key role in shaping the community structure during microcosms experiments (Biswas et al., 2011). The growth rates at PU determined during the mid-acclimation (Figure 6E) were similar to those reported by Durán-Romero et al. (2017), while the growth rates for the long acclimation (Figure 6E) agrees with those reported by Villafañe et al. (2018); in this latter study the Future condition had higher rates than the Present, as observed in our study. The differential responses observed among these studies are most likely related to the acclimation period that not only change community structure but also condition the physiology of cells.
Villafañe et al. (2018) addressed the dual role of DOM carried by the Chubut river, and determined that the photosynthesis of cells exposed to solar radiation with an input of DOM inside the microcosms (i.e., physico-chemical role, attenuation of solar radiation and chemical exposure) were less efficient compared to cells that received an extra input of DOM outside the microcosms (i.e., physical role, attenuation of solar radiation). In our study, using the same global change variables, NCP values at PU were positive throughout the day, with significant diurnal increases of ETR from morning to noon and continuous increases in PmB throughout a day, unlike in the other sites (Figure 5). The estuarine area around PU had high primary productivity as it was highlighted both in our previous (Villafañe, 2004) and current study (Figure 4), and in a recent review about primary production in the SWAO (Lutz et al., 2018). Better fitness of phytoplankton observed in PU could also be due to the fact that here, compared to the other sites, phytoplankton were less stressed by the high-light conditions, also evidenced by the positive NCP values and the generally lower electron requirement for carbon fixation (Φe,C) during the day (Tables 1, 3 and Figures 5A–C). On the other hand, no significant effect on the biomass was observed, when pCO2 was manipulated, but competition among species and its growth phase lead succession in phytoplankton species composition and abundance (Osma et al., 2020). Better diatom fitness in growth under lowered pH at the PU site may also be due to their adaptation to a larger carbonate chemistry variability related to carbon concentration mechanisms (CCMs) (Burkhardt et al., 2001; Reinfelder, 2011), which often occurs in estuarine environments (Duarte et al., 2013). Although increasing temperatures stimulate gene expression and RuBisCO activity in diatoms (Helbling et al., 2011), free ocean CO2 is a limiting factor for RuBisCO, the primary enzyme of carbon fixation (Beardall and Raven, 2004). To overcome this constraint, many phytoplankton species have developed an intracellular mechanisms that converts bicarbonate ions (HCO3–) to CO2, supporting higher carbon fixation rates than what would be possible if photosynthesis only relied on diffusive CO2 uptake (Giordano et al., 2005). Since the efficiency and regulation of CCMs differ among the species (Burkhardt et al., 2001; Trimborn et al., 2008), the proportion of direct CO2 uptake and HCO3– uptake also varies among the phytoplankton species (Matsuda and Kroth, 2014). Increased CO2 may benefit those phytoplankton species that rely on CO2 uptake, as well as CCM efficient species that can downregulate CCM (Rost et al., 2008; Eggers et al., 2014; Taucher et al., 2015). The downregulation of CCM under elevated CO2 has been observed for two diatom species (Thalassiosira weissflogii and Dactyliosolen fragilissimus) under nutrient limited condition (Taucher et al., 2015).
Influence of Acclimation Period on the Synergistic Interaction of CO2 and Nutrient Enrichment
Earlier studies suggested a controversial synergistic interaction among increased CO2 and nutrient concentrations. For example, beneficial effects of high CO2 on phytoplankton (Domingues et al., 2016) including cyanobacteria (Hutchins et al., 2007; Fu et al., 2008), diatoms (Sun et al., 2011; Tatters et al., 2012) and dinoflagellates (Fu et al., 2010) were reported under nutrient-replete conditions, whereas Hama et al. (2016) reported significant effect of acidification during post-blooming period, when ambient nutrient concentrations are negligible. In our study, the positive interaction of lowered pH and increased nutrients was observed after 2 days of acclimation during the short-term experiment (Figures 3, 5). The positive synergistic effect of the Future treatment on abundance, biomass, Chl concentrations and carbon incorporation was observed also after 4 days of acclimation during the long-term experiment (Figures 6, 7). On the other hand, the lower growth rates after 3 days in both treatments (Figure 6E) suggest that the cells were stressed due to a gradual exhaustion of nutrients and/or inorganic carbon at the end of the long-term experiment. Stress was more pronounced in the Present treatment of this long-term experiment, and was also manifested as Chl a decline and a stagnant C incorporation between the days 1 and 5 (Figure 7). Stress in the later phase of the long-term experiment caused the loss of NCP diurnal dynamics (Figure 8A), the uncoupling between the photosynthetic membrane electron transport (ETR, Figure 8B), and a declining C-fixation (PBm, Figure 8C). This uncoupling was more pronounced under the Present conditions, resulting in the increase of Φe,C values (Figure 8D). The most probable reason behind this decline in the Present scenario was nutrient limitation, as after only 2 days the amount of nitrate decreased from its initial value of 7.89 μM to 0.05 μM (Table 1).
We noted differences in the dominance of the phytoplankton groups, but also in the growth and other photosynthetic parameters measured between the short- and long-term experiments (cf. Figures 3–5 with Figures 6–8). These differences between the experiments carried out in the same site (PU) highlight the role of nutrients and/or light intensity in the observed responses, as seen in the higher nitrate availability at the beginning of the long-term and compared with the short-term experiment (Table 1). These results suggest that the effect of acidification might be much more pronounced when ambient nutrient concentrations are negligible, as it was observed by Hama et al. (2016), or could be because of downregulation of CCMs.
The high initial nitrate concentrations in PU are due to an active exchange between the river and the sea, which are the characteristics of estuarine waters (Helbling et al., 1992; Bermejo et al., 2018), which include anthropogenic nutrient loading (Kennish, 1992; Paerl et al., 2006). As reported by Bermejo et al. (2018), the main nutrient source in PU is the riverine water, which is influenced by rainfall (Vizzo et al., 2021) and possibly also from the fish processing factories (Arvanitoyannis and Kassaveti, 2008). Since anthropogenic nutrient loading impacts marine ecosystems and decreases biodiversity, it eventually decreases also its ecosystem services (Halpern et al., 2008; Vörösmarty et al., 2010; Barbier et al., 2011). Periodical evaluation, especially of nutrient concentrations as well as plankton community composition, is vital to maintain biodiversity and ecosystem services of the studied area.
The Energy Transfer Efficiency Under Lowered pH and Nutrient Enrichment
The electron requirement for carbon fixation, Φe,C, calculated as ETR (PmB)–1 was in general higher (i.e., less efficient) in the Present as compared to the Future scenario, especially at noon, suggesting a better performance in the later scenario, with more carbon fixed per mole of electron transferred via PSII. This was more relevant at noon maybe because of the high light stress at this period of the day, widely reported along a long latitudinal range e.g., from tropical to polar environments (Rivkin and Putt, 1988; Levy et al., 2004; Aikawa et al., 2009). As a result of high light stress, the diurnal hysteresis—asymmetric response of photosynthetic entities to the similar irradiance levels in the morning vs. afternoon—was observed as many earlier studies (Villafañe et al., 2013; Helbling et al., 2015a). The Φe,C values were in all cases higher (ca. 6–12 mole e– (mol C) –1) after 2 days acclimation (Figure 5D) than the theoretical values of 4–6 mol e– (mol C) –1 (Genty et al., 1989; Lawrenz et al., 2013). This slight inefficiency suggests an extra use of electrons by other processes such as photorespiration (Badger et al., 2000), or alternative electron transport (Wagner et al., 2006; Suggett et al., 2009; Waring et al., 2010; Thamatrakoln et al., 2013). Energy transfer efficiency in our phytoplankton communities (Figures 5D, 8D) were within the range of earlier field and laboratory studies, namely from 1.2 to 54.3 mol e– (mol C) –1, with a mean value of ca. 10 mol e– (mol C) –1 (Suggett et al., 2009; Lawrenz et al., 2013). While the detailed mechanisms driving the variations of Φe,C are not well understood, we conclude that the less energy required by carbon concentrating mechanisms operating under higher nutrient availability coupled with acidification conditions, will result in a more efficient reductant energy flow from the primary photosynthetic processes to the biochemical carbon fixation. Since the variability of Φe,C occurs also on taxonomic level (Hughes et al., 2018), the combination of microscopic identification and molecular techniques, such as next generation sequencing, together with physiological investigation using freshly isolated monoclonal cultures from the ecosystems will help to understand the role of key players in energy transfer in various ecosystems.
Implications for Primary Production in the Future Patagonia
Our study clearly showed the different growth strategies of phytoplankton communities under increased nutrient availability and lowered pH in three different sampling sites of the Patagonian coastal waters (Argentina). The largest growth stimulation in the estuarine site indicate that future global change conditions will significantly influence environments with high fluctuations and gradients in their abiotic variables (Cloern, 2001). Our results also demonstrate the importance of carbon-nutrient history of the phytoplankton community, namely that planktons in PU under frequent nutrient availability have advantage using enriched nutrient for cell growth. Finally, since we observed an important growth of the large diatoms that are in general tightly connected to larger zooplankton (Landry, 1977), we believe that future global conditions may also change the trophodynamics of certain areas by favoring large-sized species.
Data Availability Statement
The original contributions presented in the study are included in the article/supplementary material, further inquiries can be directed to the corresponding author/s. The code used for the computation of C chemistry is written in Python 3 and freely available in Zenodo at https://zenodo.org/record/4304878.
Author Contributions
TM, OP, VV, MV, and EWH designed the experiments, and performed measurements and analysis. TM, VV, EWH, and OP interpreted data. EWH prepared the figures. MV analyzed statistical data. KI computed carbon chemistry. TM and VV prepared the original draft, which was revised by all the co-authors.
Funding
This work was supported by the Consejo Nacional de Investigaciones Cientificas y Técnicas (CONICET)-The Czech Academy of Sciences (CAS) and Bilateral Mobility project #16-10 awarded to OP and EWH. Agencia Nacional de Promoción Cientifica y Tecnológica-ANPCyT (PICT 2015-0462) and Fundación Playa Unión.
Conflict of Interest
The authors declare that the research was conducted in the absence of any commercial or financial relationships that could be construed as a potential conflict of interest.
Acknowledgments
We thank the comments and suggestions of two reviewers that helped us to greatly improve the manuscript. KI was supported by the Simons Foundation (Simons Postdoctoral Fellowship in Marine Microbial Ecology, Award 544338). We thank P. Bermejo and R. Blum for nutrient analyses, and Dr. T. Shiozaki for satellite image analysis. The Cooperativa Eléctrica y de Servicios de Rawson provided the building’s infrastructure to carry out this work. This is Contribution No. 188 of Estación de Fotobiología Playa Unión.
References
Aikawa, S., Hattori, H., Gomi, Y., Watanabe, K., Kudoh, S., Kashino, Y., et al. (2009). Diel tuning of photosynthetic systems in ice algae at Saroma-ko Lagoon, Hokkaido, Japan. Polar Sci. 3, 57–72. doi: 10.1016/j.polar.2008.12.001
Álvarez-Colombo, G., Dato, C., Macchi, G., Palma, E., Machinandiarena, L., Christiansen, H., et al. (2011). Distribution and behavior of Argentine hake larvae: evidence of a biophysical mechanism for self-recruitment in northern Patagonian shelf waters. Cienc. Mar. 37, 633–657. doi: 10.7773/cm.v37i4b.1777
Arvanitoyannis, I. S., and Kassaveti, A. (2008). Fish industry waste: treatments, environmental impacts, current and potential uses. Int. J. Food Sci. 43, 726–745. doi: 10.1111/j.1365-2621.2006.01513.x
Bach, L. T., and Taucher, J. (2019). CO2 effects on diatoms: a synthesis of more than a decade of ocean acidification experiments with natural communities. Ocean Sci. J. 15, 1159–1175. doi: 10.5194/os-15-1159-2019
Badger, M. R., Von Caemmerer, S., Ruuska, S., and Nakano, H. (2000). Electron flow to oxygen in higher plants and algae: rates and control of direct photoreduction (Mehler reaction) and rubisco oxygenase. Philos. Trans. R. Soc. Lond. B. Biol. Sci. 355, 1433–1446. doi: 10.1098/rstb.2000.0704
Barbier, E. B., Hacker, S. D., Kennedy, C., Koch, E. W., Stier, A. C., and Silliman, B. R. (2011). The value of estuarine and coastal ecosystem services. Ecol. Monogr. 81, 169–193.
Beardall, J., and Raven, J. A. (2004). The potential effects of global climate change on microalgal photosynthesis, growth and ecology. Phycologia 43, 26–40. doi: 10.2216/i0031-8884-43-1-26.1
Behrenfeld, M. J., O’malley, R. T., Siegel, D. A., Mcclain, C. R., Sarmiento, J. L., Feldman, G. C., et al. (2006). Climate-driven trends in contemporary ocean productivity. Nature 444, 752–755. doi: 10.1038/nature05317
Bermejo, P., Durán-Romero, C., Villafañe, V. E., and Helbling, E. W. (2020). Influence of fluctuating irradiance on photosynthesis, growth and community structure of estuarine phytoplankton under increased nutrients and acidification. J. Exp. Mar. Biol. Ecol. 526, 151348. doi: 10.1016/j.jembe.2020.151348
Bermejo, P., Helbling, E. W., Durán-Romero, C., Cabrerizo, M. J., and Villafañe, V. E. (2018). Abiotic control of phytoplankton blooms in temperate coastal marine ecosystems: a case study in the South Atlantic Ocean. Sci. Total Environ. 612, 894–902. doi: 10.1016/j.scitotenv.2017.08.176
Biswas, H., Cros, A., Yadav, K., Ramana, V. V., Prasad, V. R., Acharyya, T., et al. (2011). The response of a natural phytoplankton community from the Godavari River Estuary to increasing CO2 concentration during the pre-monsoon period. J. Exp. Mar. Biol. Ecol. 407, 284–293. doi: 10.1016/j.jembe.2011.06.027
Björn, L. O., and Murphy, T. M. (1985). Computer calculation of solar ultraviolet radiation at ground level. Physiol. Veg. 23, 555–561.
Boyd, P. W., Strzepek, R., Fu, F., and Hutchins, D. A. (2010). Environmental control of open-ocean phytoplankton groups: now and in the future. Limnol. Oceanogr. 55, 1353–1376. doi: 10.4319/lo.2010.55.3.1353
Burkhardt, S., Amoroso, G., Riebesell, U., and Sültemeyer, D. (2001). CO2 and HCO3-uptake in marine diatoms acclimated to different CO2 concentrations. Limnol. Oceanogr. 46, 1378–1391. doi: 10.4319/lo.2001.46.6.1378
Cabrerizo, M. J., Carrillo, P., Villafañe, V. E., Medina-Sánchez, J. M., and Helbling, E. W. (2018). Increased nutrients from aeolian-dust and riverine origin decrease the CO2-sink capacity of coastal South Atlantic waters under UVR exposure. Limnol. Oceanogr. 63, 1191–1203. doi: 10.1002/lno.10764
Carli, P. D., Braccalenti, J. C., García-De-León, F. J., and Gómez, E. P. A. (2012). La pesquería del langostino argentino Pleoticus muelleri en Patagonia Un único stock? Anales. Inst. Patagonia. 40, 103–112. doi: 10.4067/s0718-686x2012000200009
Cloern, J. E. (1999). The relative importance of light and nutrient limitation of phytoplankton growth: a simple index of coastal ecosystem sensitivity to nutrient enrichment. Aquatic. Ecology. 33, 3–16.
Cloern, J. E. (2001). Our evolving conceptual model of the coastal eutrophication problem. Mar. Ecol. Prog. Ser. 210, 223–253. doi: 10.3354/meps210223
Cloern, J. E., Abreu, P. C., Carstensen, J., Chauvaud, L., Elmgren, R., Grall, J., et al. (2016). Human activities and climate variability drive fast-paced change across the world’s estuarine-coastal ecosystems. Glob. Chang. Biol. 22, 513–529. doi: 10.1111/gcb.13059
Crain, C. M., Kroeker, K., and Halpern, B. S. (2008). Interactive and cumulative effects of multiple human stressors in marine systems. Ecol. Lett. 11, 1304–1315. doi: 10.1111/j.1461-0248.2008.01253.x
D’Agostino, V. C., Degrati, M., Santinelli, N., Sastre, V., Dans, S. L., and Hoffmeyer, M. S. (2018). The seasonal dynamics of plankton communities relative to the foraging of the southern right whale (Eubalaena australis) in northern Patagonian gulfs, Península Valdés, Argentina. Continent. Shelf Res. 164, 45–57. doi: 10.1016/j.csr.2018.06.003
Depetris, P. J., Gaiero, D. M., Probst, J. L., Hartmann, J., and Kempe, S. (2005). Biogeochemical output and typology of rivers draining Patagonia’s Atlantic seaboard. J. Coast. Res. 214, 835–844. doi: 10.2112/015-nis.1
DOE (1994). Handbook of Methods for the Analysis of the Various Parameters of the Carbon Dioxide System in Sea Water, Version 2, eds A. G. Dickson and C. Govet (Washington, DC: DOE).
Domingues, R. B., Guerra, C. C., Galvão, H. M., Brotas, V., and Barbosa, A. B. (2016). Short-term interactive effects of ultraviolet radiation, carbon dioxide and nutrient enrichment on phytoplankton in a shallow coastal lagoon. Aquat. Ecol. 51, 91–105. doi: 10.1007/s10452-016-9601-4
Duarte, C. M., Hendriks, I. E., Moore, T. S., Olsen, Y. S., Steckbauer, A., Ramajo, L., et al. (2013). Is ocean acidification an open-ocean syndrome? Understanding anthropogenic impacts on seawater pH. Estuaries Coasts 36, 221–236. doi: 10.1007/s12237-013-9594-3
Durán-Romero, C., Villafañe, V. E., Valiñas, M. S., Gonçalves, R. J., Helbling, E. W., and Sathyendranath, S. (2017). Solar UVR sensitivity of phyto- and bacterioplankton communities from Patagonian coastal waters under increased nutrients and acidification. ICES J. Mar. Sci. 74, 1062–1073. doi: 10.1093/icesjms/fsw248
Dutkiewicz, S., Morris, J. J., Follows, M. J., Scott, J., Levitan, O., Dyhrman, S. T., et al. (2015). Impact of ocean acidification on the structure of future phytoplankton communities. Nat. Clim. Change. 5, 1002–1006. doi: 10.1038/nclimate2722
Eggers, S. L., Lewandowska, A. M., Barcelos, E. R. J., Blanco-Ameijeiras, S., Gallo, F., and Matthiessen, B. (2014). Community composition has greater impact on the functioning of marine phytoplankton communities than ocean acidification. Glob. Chang. Biol. 20, 713–723. doi: 10.1111/gcb.12421
Eilers, P. H. C., and Peeters, J. C. H. (1988). A model for the relationship between light-intensity and the rate of photosynthesis in phytoplankton. Ecol. Model. 42, 199–215. doi: 10.1016/0304-3800(88)90057-9
Emerson, S. R., and Hedges, J. I. (2008). Chemical Oceanography and the Marine Carbon Cycle, 1 Edn. Cambridge: Cambridge University Press.
Falkowski, P. G., Barber, R. T., and Smetacek, V. (1998). Biogeochemical controls and feedbacks on ocean primary production. Science 281, 200–206. doi: 10.1126/science.281.5374.200
Fitch, D. T., and Moore, J. K. (2007). Wind speed influence on phytoplankton bloom dynamics in the Southern Ocean Marginal Ice Zone. J. Geophys. Res. 112:C08006. doi: 10.1029/2006jc004061
Fu, F. X., Mullholand, M. R., Garcia, N. S., Beck, A., Bernhardt, P. W., Warner, M. E., et al. (2008). Interactions between changing pCO2, N2 fixation, and Fe limitation in the marine unicellular cyanobacterium Crocosphaera. Limnol. Oceanogr. 53, 2472–2484. doi: 10.4319/lo.2008.53.6.2472
Fu, F. X., Place, A. R., Garcia, N. S., and Hutchins, D. A. (2010). CO2 and phosphate availability control the toxicity of the harmful bloom dinoflagellate Karlodinium veneficum. Aquat. Microb. Ecol. 59, 55–65. doi: 10.3354/ame01396
Gaiero, D. M., Probst, J. L., Depetris, P. J., Bidart, S. M., and Leleyter, L. (2003). Iron and other transition metals in Patagonian riverborne and windborne materials: geochemical control and transport to the southern South Atlantic Ocean. Geochim. Cosmochim. Acta 67, 3603–3623. doi: 10.1016/s0016-7037(03)00211-4
Gao, K., Helbling, E. W., Häder, D. P., and Hutchins, D. A. (2012). Responses of marine primary producers to interactions between ocean acidification, solar radiation, and warming. Mar. Ecol. Prog. Ser. 470, 167–189. doi: 10.3354/meps10043
Gassó, S., and Stein, A. F. (2007). Does dust from Patagonia reach the sub-Antarctic Atlantic Ocean? Geophys. Res. Lett. 34:L01801.
Gattuso, J.-P., Gao, K., Lee, K., Rost, B., and Schulz, K. G. (2010). “Approaches and tools to manipulate the carbonate chemistry,” in Guide to Best Practices for Ocean Acidification Research and Data Reporting, eds U. Riebesell, V. J. Fabry, L. Hansson, and J. P. Gattuso (Brussels: European Union), 41–52.
Genty, B., Briantais, J.-M., and Baker, N. (1989). The relationship between the quantum yield of photosynthetic electron transport and quenching of chlorophyll fluorescence. BBA Bioener. 990, 87–92. doi: 10.1016/s0304-4165(89)80016-9
Giordano, M., Beardall, J., and Raven, J. A. (2005). CO2 concentrating mechanisms in algae: mechanisms, environmental modulation, and evolution. Annu. Rev. Plant. Biol. 56, 99–131. doi: 10.1146/annurev.arplant.56.032604.144052
Glibert, P. M. (2016). Margalef revisited: a new phytoplankton mandala incorporating twelve dimensions, including nutritional physiology. Harmful Algae 55, 25–30. doi: 10.1016/j.hal.2016.01.008
Góngora, M. E., González Zevallos, D., Pettovello, A., and Mendía, L. (2012). Caracterizacion de las principales pesquerias del golfo San Jorge Patagonia. Argentina. Lat. Am. J. Aquat. Res. 40, 1–11. doi: 10.3856/vol40-issue1-fulltext-1
Gregg, W. W., and Rousseaux, C. S. (2019). Global ocean primary production trends in the modern ocean color satellite record (1998–2015). Environm. Res. Lett. 14:124011. doi: 10.1088/1748-9326/ab4667
Guillard, R. R. L., and Ryther, J. H. (1962). Studies of marine planktonic diatoms. I. Cyclotella nana Hustedt and Detonula confervacea Cleve. Can. J. Microbiol. 8, 229–239. doi: 10.1139/m62-029
Halpern, B. S., Walbridge, S., Selkoe, K. A., Kappel, C. V., Micheli, F., D’agrosa, C., et al. (2008). A global map of human impact on marine ecosystems. Science 319, 948–952.
Hama, T., Inoue, T., Suzuki, R., Kashiwazaki, H., Wada, S., Sasano, D., et al. (2016). Response of a phytoplankton community to nutrient addition under different CO2 and pH conditions. J. Oceanogr. 72, 207–223. doi: 10.1007/s10872-015-0322-4
Helbling, E. W., Banaszak, A. T., and Villafañe, V. E. (2015a). Differential responses of two phytoplankton communities from the chubut river estuary (Patagonia, Argentina) to the combination of UVR and elevated temperature. Estuaries Coasts 38, 1134–1146. doi: 10.1007/s12237-013-9752-7
Helbling, E. W., Banaszak, A. T., and Villafañe, V. E. (2015b). Global change feed-back inhibits cyanobacterial photosynthesis. Sci. Rep. 5:14514.
Helbling, E. W., Barbierilg, E. S., Gonc, M. A. M., Alves, R. J., and Villafañe, E. V. (2005). Impact of solar ultraviolet radiation on marine phytoplankton of Patagonia, Argentina. Photochem. Photobiol. 81, 807–818. doi: 10.1562/2005-03-02-ra-452r.1
Helbling, E. W., Buma, A. G. J., Boelen, P., Van Der Strate, H. J., Giordanino, M. V. F., and Villafañe, V. E. (2011). Increase in Rubisco activity and gene expression due to elevated temperature partially counteracts ultraviolet radiation-induced photoinhibition in the marine diatom Thalassiosira weissflogii. Limnol. Oceanogr. 56, 1330–1342. doi: 10.4319/lo.2011.56.4.1330
Helbling, E. W., Pérez, D. E., Medina, C. D., Lagunas, M. G., and Villafañe, V. E. (2010). Phytoplankton distribution and photosynthesis dynamics in the Chubut River estuary (Patagonia, Argentina) throughout tidal cycles. Limnol. Oceanogr. 55, 55–65. doi: 10.4319/lo.2010.55.1.0055
Helbling, E. W., Santamarina, J. M., and Villafañe, V. E. (1992). Chubut river estuary (Argentina): estuarine variability under different conditions of river discharge. Rev. Biol. Mar. (Valparaíso) 27, 73–90.
Hillebrand, H., Dürselen, C.-D., Kirschtel, D., Pollingher, U., and Zohary, T. (1999). Biovolume calculation for pelagic and benthic microalgae. J. Phycol. 35, 403–424. doi: 10.1046/j.1529-8817.1999.3520403.x
Holm-Hansen, O., and Helbling, E. (1995). “Técnicas para la medición de la productividad primaria en el fitoplancton,” in Manual de Métodos Ficológicos, eds K. Alveal, M. E. Ferrario, E. C. Oliveira, and E. Sar (Concepción: Universidad de Concepción), 329–350.
Holm-Hansen, O., Lorenzen, C. J., Holmes, R. W., and Strickland, J. D. H. (1965). Fluorometric determination of chlorophyll. J. Cons. Perm. Int. Explor. Mar. 30, 3–15. doi: 10.1093/icesjms/30.1.3
Holm-Hansen, O., and Riemann, B. (1978). Chlorophyll a determination: improvements in methodology. Oikos 30, 438–447. doi: 10.2307/3543338
Hopkinson, B. M., Dupont, C. L., Allen, A. E., and Morel, F. M. (2011). Efficiency of the CO2-concentrating mechanism of diatoms. Proc. Natl. Acad. Sci. U.S.A. 108, 3830–3837. doi: 10.1073/pnas.1018062108
Howarth, R. W. (1988). Nutrient limitation of net primary production in marine ecosystems. Ann. Rev. Ecol. 19, 89–110. doi: 10.1146/annurev.es.19.110188.000513
Hughes, D. J., Campbell, D. A., Doblin, M. A., Kromkamp, J. C., Lawrenz, E., Moore, C. M., et al. (2018). Roadmaps and detours: Active chlorophyll-a assessments of primary productivity across marine and freshwater systems. Environ. Sci. Technol. 52, 12039–12054. doi: 10.1021/acs.est.8b03488
Hutchins, D. A., Fu, F.-X., Zhang, Y., Warner, M. E., Feng, Y., Portune, K., et al. (2007). CO2 control of Trichodesmium N2 fixation, photosynthesis, growth rates, and elemental ratios: Implications for past, present, and future ocean biogeochemistry. Limnol. Oceanogr. 52, 1293–1304. doi: 10.4319/lo.2007.52.4.1293
IPCC (2019). IPCC Special Report on the Ocean and Cryosphere in a Changing Climate, eds H.-O. Pörtner, D. C. Roberts, V. Masson-Delmotte, P. Zhai, M. Tignor, E. Poloczanska, et al. (Geneva: IPCC).
Kahl, L. (2018). Dinámica del CO2 en el Océano Atlántico Sudoccidental. Ph.D. thesis, Universidad de Buenos Aires, Buenos Aires.
Kolber, Z. S., Prášil, O., and Falkowski, P. G. (1998). Measurements of variable chlorophyll fluorescence using fast repetition rate techniques: defining methodology and experimental protocols. Biochim. Biophys. Acta-Bioenerg. 1367, 88–106. doi: 10.1016/s0005-2728(98)00135-2
Landry, M. R. (1977). A review of important concept in the trophic organization of pelagic ecosystems. Helgol. Meeres. 30, 8–17. doi: 10.1007/bf02207821
Lawrenz, E., Silsbe, G., Capuzzo, E., Ylostalo, P., Forster, R. M., Simis, S. G., et al. (2013). Predicting the electron requirement for carbon fixation in seas and oceans. PLoS One 8:e58137. doi: 10.1371/journal.pone.0058137
Levitan, O., Rosenberg, G., Setlik, I., Setlikova, E., Grigel, J., Klepetar, J., et al. (2007). Elevated CO2 enhances nitrogen fixation and growth in the marine cyanobacterium Trichodesmium. Glob. Chang. Biol. 13, 531–538. doi: 10.1111/j.1365-2486.2006.01314.x
Levy, O., Dubinsky, Z., Schneider, K., Achituv, Y., Zakai, D., and Gorbunov, M. Y. (2004). Diurnal hysteresis in coral photosynthesis. Mar. Ecol. Prog. Ser. 268, 105–117. doi: 10.3354/meps268105
Litchman, E. (2007). “Resource competition and the ecological success of phytoplankton,” in Evolution of Primary Producers in the Sea, eds P. G. Falkowski and A. H. Knoll (Cambridge, MA: Academic Press), 351–375. doi: 10.1016/b978-012370518-1/50017-5
Longhurst, A., Sathyendranath, S., Platt, T., and Caverhill, C. (1995). An estimate of global primary production in the ocean from satellite radiometer data. J. Plankton Res. 17, 1245–1271. doi: 10.1093/plankt/17.6.1245
Lueker, T. J., Dickson, A. G., and Keeling, C. D. (2000). Ocean pCO2 calculated from dissolved inorganic carbon, alkalinity, and equations for K1 and K2: validation based on laboratory measurements of CO2 in gas and seawater at equilibrium. Mar. Chem. 70, 105–119. doi: 10.1016/S0304-4203(00)00022-0
Lutz, V., Segura, V., Dogliotti, A., Tavano, V., Brandini, F. P., Calliari, D. L., et al. (2018). “Overview of primary production in the Southwestern Atlantic,” in Plankton ecology of the Southwestern Atlantic – From the Subtropical to the Subantarctic Realm, eds M. S. Hoffmeyer, M. E. Sabatini, F. P. Brandini, D. L. Calliari, and N. H. Santinelli (Heidelberg: Springer), 101–126. doi: 10.1007/978-3-319-77869-3_6
Marcoval, M. A., Villafane, V. E., and Helbling, E. W. (2008). Combined effects of solar ultraviolet radiation and nutrients addition on growth, biomass and taxonomic composition of coastal marine phytoplankton communities of Patagonia. J. Photochem. Photobiol. B 91, 157–166. doi: 10.1016/j.jphotobiol.2008.03.002
Margalef, R. (1978). Life-forms of phytoplankton as survival alternatives in an unstable environment. Oceanol. Acta 1, 493–509.
Matsuda, Y., and Kroth, P. G. (2014). “Carbon fixation in diatoms,” in The Structural Basis of Biological Energy Generation, ed. M. F. Hohmann-Marriott (Heidelberg: Springer), 335–362. doi: 10.1007/978-94-017-8742-0_18
Morris, M. D. (1991). Factorial sampling plans for preliminary computational experiments. Technometrics 33, 161–174. doi: 10.1080/00401706.1991.10484804
Neale, P. J., Helbling, E. W., and Zagarese, H. E. (2003). “Modulation of UVR exposure and effects by vertical mixing and advection,” in UV Effects in Aquatic Organisms and Ecosystems, eds E. W. Helbling and H. E. Zagarese (Cambridge: Royal Society of Chemistry), 108–134.
Nielsen, L. T., Hallegraeff, G. M., Wright, S. W., and Hansen, P. J. (2012). Effects of experimental seawater acidification on an estuarine plankton community. Aquat. Microb. Ecol. 65, 271–286. doi: 10.3354/ame01554
Orselli, I. B. M., Kerr, R., Ito, R. G., Tavano, V. M., Mendes, C. R. B., and Garcia, C. a. E. (2018). How fast is the Patagonian shelf-break acidifying? J. Marine Syst. 178, 1–14. doi: 10.1016/j.jmarsys.2017.10.007
Osma, N., Latorre-Melín, L., Jacob, B., Contreras, P. Y., Von Dassow, P., and Vargas, C. A. (2020). Response of phytoplankton assemblages from naturally acidic coastal ecosystems to elevated pCO2. Front. Mar. Sci. 7:323. doi: 10.3389/fmars.2020.00323
Oxborough, K., Moore, C. M., Suggett, D. J., Lawson, T., Chan, H. G., and Geider, R. J. (2012). Direct estimation of functional PSII reaction center concentration and PSII electron flux on a volume basis: a new approach to the analysis of Fast Repetition Rate fluorometry (FRRf) data. Limnol. Oceanogr.-Meth. 10, 142–154. doi: 10.4319/lom.2012.10.142
Paerl, H. W., Valdes, L. M., Peierls, B. L., Adolf, J. E., Lawrence, W., and Harding, J. (2006). Anthropogenic and climatic influences on the eutrophication of large estuarine ecosystems Limnol. Oceanogr. 51, 448–462. doi: 10.4319/lo.2006.51.1_part_2.0448
Piccolo, M. C., and Perillo, G. M. E. (1999). “Estuaries of argentina: a review,” in Estuaries of South America: Their Geomorphology and Dynamics, eds G. M. E. Perillo, M. C. Piccolo, and M. P. Quivira (Berlin: Spring-Verlag), 101–132. doi: 10.1007/978-3-642-60131-6_6
Porra, R. J. (2002). The chequered history of the development and use of simultaneous equations for the accurate determination of chlorophylls a and b. Photosynth. Res. 73, 149–156.
Quinn, G. P., and Keough, M. J. (2002). Experimental Design and Data Analysis for Biologists. Cambridge: Cambridge University Press.
Rabalais, N. N., Turner, R. E., Díaz, R. J., and Justić, D. (2009). Global change and eutrophication of coastal waters. ICES J. Mar. Sci. 66, 1528–1537. doi: 10.1093/icesjms/fsp047
Reinfelder, J. R. (2011). Carbon concentrating mechanisms in eukaryotic marine phytoplankton. Ann. Rev. Mar. Sci. 3, 291–315. doi: 10.1146/annurev-marine-120709-142720
Rivas, A. L., and Beier, E. J. (1990). Temperature and salinity fields in the Northpatagonic Gulfs. Oceanol. Acta 13, 15–20.
Rivkin, R. B., and Putt, M. (1988). Seasonal pattern of diel periodicity in photosynthesis by polar phytoplankton: species-specific responses. J. Phycol 24, 369–376. doi: 10.1111/j.1529-8817.1988.tb00186.x
Rost, B., Zondervan, I., and Wolf-Gladrow, D. (2008). Sensitivity of phytoplankton to future changes in ocean carbonate chemistry: current knowledge, contradictions and research directions. Mar. Ecol. Prog. Ser. 373, 227–237. doi: 10.3354/meps07776
Rousseaux, C., and Gregg, W. (2014). Interannual variation in phytoplankton primary production at a global scale. Remote Sens. 6, 1–19. doi: 10.3390/rs6010001
Ruggaber, A., Dlugi, R., and Nakajima, T. (1994). Modelling of radiation quantities and photolysis frequencies in the troposphere. J. Atmos. Chem. 18, 171–210. doi: 10.1007/bf00696813
Smayda, T. J., and Reynolds, C. S. (2001). Community assembly in marine phytoplankton: application of recent models to harmful dinoflagellate blooms. J. Plankton Res. 23, 447–461. doi: 10.1093/plankt/23.5.447
Strathmann, R. R. (1967). Estimating the organic carbon content of phytoplankton from cell volume or plasma volume. Limnol. Oceanogr. 12, 411–418. doi: 10.4319/lo.1967.12.3.0411
Strickland, J. D. H., and Parsons, T. R. (1972). A practical handbook of seawater analysis. J. Fish Res. Board Can. 167, 1–310.
Suggett, D. J., Moore, C. M., Hickman, A. E., and Geider, R. J. (2009). Interpretation of fast repetition rate (FRR) fluorescence: signatures of phytoplankton community structure versus physiological state. Mar. Ecol. Prog. Ser. 376, 1–19. doi: 10.3354/meps07830
Sun, J., Hutchins, D. A., Feng, Y., Seubert, E. L., Caron, D. A., and Fu, F.-X. (2011). Effects of changingp CO2 and phosphate availability on domoic acid production and physiology of the marine harmful bloom diatom Pseudo-nitzschia multiseries. Limnol. Oceanogr. 56, 829–840. doi: 10.4319/lo.2011.56.3.0829
Tatters, A. O., Fu, F. X., and Hutchins, D. A. (2012). High CO2 and silicate limitation synergistically increase the toxicity of Pseudo-nitzschia fraudulenta. PLoS One 7:e32116. doi: 10.1371/journal.pone.0032116
Taucher, J., Jones, J., James, A., Brzezinski, M. A., Carlson, C. A., Riebesell, U., et al. (2015). Combined effects of CO2 and temperature on carbon uptake and partitioning by the marine diatoms Thalassiosira weissflogii and Dactyliosolen fragilissimus. Limnol. Oceanogr. 60, 901–919. doi: 10.1002/lno.10063
Thamatrakoln, K., Bailleul, B., Brown, C. M., Gorbunov, M. Y., Kustka, A. B., Frada, M., et al. (2013). Death-specific protein in a marine diatom regulates photosynthetic responses to iron and light availability. Proc. Natl. Acad. Sci. U.S.A. 110, 20123–20128. doi: 10.1073/pnas.1304727110
Thomsen, H. A., Buck, K. R., and Chavez, F. P. (1994). “Haptophytes as components of marine phytoplankton,” in Haptophyte Algae, eds J. C. Green and B. S. C. Leadbeater (Oxford: Clarendon Press), 187–208.
Trimborn, S., Lundholm, N., Thoms, S., Richter, K. U., Krock, B., Hansen, P. J., et al. (2008). Inorganic carbon acquisition in potentially toxic and non-toxic diatoms: the effect of pH-induced changes in seawater carbonate chemistry. Physiol. Plant. 133, 92–105. doi: 10.1111/j.1399-3054.2007.01038.x
Uitz, J., Claustre, H., Gentili, B., and Stramski, D. (2010). Phytoplankton class-specific primary production in the world’s oceans: Seasonal and interannual variability from satellite observations. Global Biogeochem. Cy 24:GB3016.
Underwood, A. J. (1997). Experiments in Ecology: Their Logical Design and Interpretation Using Analysis of Variance. Cambridge: Cambridge University Press.
Villafañe, V. E. (2004). Annual patterns of ultraviolet radiation effects on temperate marine phytoplankton off Patagonia. Argentina. J. Plankton Res. 26, 167–174. doi: 10.1093/plankt/fbh011
Villafañe, V. E., Banaszak, A. T., Guendulain-García, S. D., Strauch, S. M., Halac, S. R., and Helbling, E. W. (2013). Influence of seasonal variables associated with climate change on photochemical diurnal cycles of marine phytoplankton from Patagonia (Argentina). Limnol. Oceanogr. 58, 203–214. doi: 10.4319/lo.2013.58.1.0203
Villafañe, V. E., Cabrerizo, M. J., Carrillo, P., Hernando, M. P., Medina-Sánchez, J. M., and Narvarte, M. A. (2021). “Global change effects on plankton from Atlantic Patagonian coastal waters: role of interacting drivers,” in Global Change in Atlantic Coastal Patagonian Ecosystems: A Journey Through Time, eds E. W. Helbling, M. A. Narvarte, R. A. González, and V. E. Villafañe (Heidelberg: Springer).
Villafañe, V. E., Marcoval, M. A., and Helbling, E. W. (2004). Photosynthesis versus irradiance characteristics in phytoplankton assemblages off Patagonia (Argentina): temporal variability and solar UVR effects. Mar. Ecol. Prog. Ser. 284, 23–34.
Villafañe, V. E., Paczkowska, J., Andersson, A., Duran Romero, C., Valinas, M. S., and Helbling, E. W. (2018). Dual role of DOM in a scenario of global change on photosynthesis and structure of coastal phytoplankton from the South Atlantic Ocean. Sci. Total Environ. 634, 1352–1361.
Villafañe, V. E., and Reid, F. M. H. (1995). “Métodos de microscopía para la cuantificación del fitoplancton,” in Manual de Métodos Ficologicós, eds K. Alveal, M. E. Ferrario, E. C. Oliveira, and E. Sar (Concepcion: Universidad de Concepcion), 169–185.
Villafañe, V. E., Valiñas, M. S., Cabrerizo, M. J., and Helbling, E. W. (2015). Physio-ecological responses of Patagonian coastal marine phytoplankton in a scenario of global change: role of acidification, nutrients and solar UVR. Mar. Chem. 177, 411–420.
Vizzo, J. I., Cabrerizo, M. J., Helbling, E. W., and Villafane, V. E. (2021). Extreme and gradual rainfall effects on winter and summer estuarine phytoplankton communities from Patagonia (Argentina). Mar. Environ. Res. 163:105235.
Vörösmarty, C. J., Mcintyre, P. B., Gessner, M. O., Dudgeon, D., Prusevich, A., Green, P., et al. (2010). Global threats to human water security and river biodiversity. Nature 467, 555–561.
Wagener, T., Guieu, C., Losno, R., Bonnet, S., and Mahowald, N. (2008). Revisiting atmospheric dust export to the Southern Hemisphere ocean: biogeochemical implications. Global Biogeochem. Cy 22, GB2006.
Wagner, H., Jakob, T., and Wilhelm, C. (2006). Balancing the energy flow from captured light to biomass under fluctuating light conditions. New Phytol. 169, 95–108.
Waring, J., Klenell, M., Bechtold, U., Underwood, G. J. C., and Baker, N. R. (2010). Light-induced responses of oxygen photoreduction, reactive oxygen species production and scavenging in two diatom species1. J. Phycol. 46, 1206–1217.
Keywords: global change, plankton community structure, carbon incorporation, oxygen production, PSII photochemistry
Citation: Masuda T, Prášil O, Villafañe VE, Valiñas MS, Inomura K and Helbling EW (2021) Impact of Increased Nutrients and Lowered pH on Photosynthesis and Growth of Three Marine Phytoplankton Communities From the Coastal South West Atlantic (Patagonia, Argentina). Front. Mar. Sci. 8:609962. doi: 10.3389/fmars.2021.609962
Received: 24 September 2020; Accepted: 07 January 2021;
Published: 12 February 2021.
Edited by:
Eva Ortega-Retuerta, UMR 7621 Laboratoire d’Océanographie Microbienne (LOMIC), FranceReviewed by:
Haimanti Biswas, National Institute of Oceanography (CSIR), IndiaAntonietta Quigg, Texas A&M University at Galveston, United States
Copyright © 2021 Masuda, Prášil, Villafañe, Valiñas, Inomura and Helbling. This is an open-access article distributed under the terms of the Creative Commons Attribution License (CC BY). The use, distribution or reproduction in other forums is permitted, provided the original author(s) and the copyright owner(s) are credited and that the original publication in this journal is cited, in accordance with accepted academic practice. No use, distribution or reproduction is permitted which does not comply with these terms.
*Correspondence: Takako Masuda, dGFrYWtvQGFsZ2EuY3o=