 Toby Samuels
 Tatiana A. Rynearson
 Sinéad Collins1*†
- 1Institute of Evolutionary Biology, School of Biological Sciences, The University of Edinburgh, Edinburgh, United Kingdom
- 2Graduate School of Oceanography, University of Rhode Island, Kingston, RI, United States
Extreme environmental fluctuations such as marine heatwaves (MHWs) can have devastating effects on ecosystem health and functioning through rapid population declines and destabilization of trophic interactions. However, recent studies have highlighted that population tolerance to MHWs is variable, with some populations even benefitting from MHWs. A number of factors can explain variation in responses between populations including their genetic variation, previous thermal experience and the cumulative heatwave intensity (°C d) of the heatwave itself. We disentangle the contributions of these factors on population mortality and post-heatwave growth rates by experimentally simulating heatwaves (7.5 or 9.2°C, for up to 9 days) for three genotypes of the Southern Ocean diatom Actinocyclus actinochilus. The effects of simulated heatwaves on mortality and population growth rates varied with genotype, thermal experience and the cumulative intensity of the heatwave itself. Firstly, hotter and longer heatwaves increased mortality and decreased post-heatwave growth rates relative to milder, shorter heatwaves. Secondly, growth above the thermal optimum before heatwaves exacerbated heatwave-associated negative effects, leading to increased mortality during heatwaves and slower growth after heatwaves. Thirdly, hotter and longer heatwaves resulted in more pronounced changes to thermal optima (Topt) immediately following heatwaves. Finally, there is substantial intraspecific variation in post-heatwave growth rates. Our findings shed light on the potential of Southern Ocean diatoms to tolerate MHWs, which will increase both in frequency and in intensity under future climate change.
Introduction
Extreme temperature fluctuations in terrestrial and marine systems have occurred with increasing frequency and duration over the past century, and will increase further with continued anthropogenic climate change (Frölicher et al., 2018; Lyon et al., 2019; Oliver et al., 2019; Rohini et al., 2019). Marine heatwaves (MHWs) are one such example of temperature fluctuations, and are defined as “discrete prolonged anomalous warm water events” (Hobday et al., 2016) that can result in rapid population declines and reduced ecosystem functioning (Frölicher and Laufkötter, 2018; Oliver et al., 2019; Smale et al., 2019). Recent work has uncovered a broad range of organismal response to MHWs, from negative to positive (Stuhr et al., 2017; Pansch et al., 2018; Bartosiewicz et al., 2019; Saha et al., 2019; Britton et al., 2020). Furthermore, varied responses among species to MHWs can lead to significant food web alterations in marine habitats (Ryan et al., 2017; Jones et al., 2018; Peña et al., 2019; von Biela et al., 2019; Piatt et al., 2020), illustrating that the responses of individual species will influence the resilience of entire marine ecosystems under global change.
The ecological impact of marine heatwaves in the Southern Ocean has not previously received as much attention as MHWs in Arctic, temperate or tropical locations. However, between 2002 and 2018 nineteen heatwave events were detected across the Southern Ocean (Montie et al., 2020) and MHWs are predicted to increase in frequency in the Southern Ocean in coming decades (Frölicher et al., 2018). Indeed, heatwaves recorded across Antarctica in the summer of 2019–2020 are likely to have significant implications, both negative and positive, for the Antarctic ecosystem. For example, enhanced ice melt due to heatwaves can provide relief from drought stress for terrestrial plant species, but temperature extremes can simultaneously also enhance thermal stress (Robinson et al., 2020). These recent events highlight the urgent need to understand how Southern Ocean organisms respond to MHWs. Diatoms dominate phytoplankton blooms in the Southern Ocean, are important primary producers that support the Southern Ocean ecosystem and are major exporters of silica and carbon from surface waters to marine sediments (Deppeler and Davidson, 2017). Constant elevated temperature can affect both population dynamics and the nutritional value of Southern Ocean diatoms (Boyd et al., 2016), indicating that diatom responses to future warming could have significant implications for trophic interactions and biogeochemical cycling. These findings are echoed by a large body of literature that concludes that environmental change is affecting marine phytoplankton, and will continue to do so in the future (Collins et al., 2020). Despite this, only a handful of studies have directly investigated the effect of MHWs on diatoms under controlled laboratory conditions (Bedolfe, 2015; Remy et al., 2017; Feijão et al., 2018). Microcosm experiments with marine phytoplankton communities exposed to simulated heatwaves and increased turbidity demonstrated that milder heatwaves (+4°C from control) enhanced diatom growth rates, resulting in their dominance of the community, while in contrast, diatoms were completely absent in communities exposed to more intense heatwaves (+6°C) (Remy et al., 2017). Feijão et al. (2018) identified a number of physiological changes in the diatom Phaeodactylum tricornutum when exposed to heatwaves, including reduced photosynthetic efficiency and biomass production. These studies provide insight into how diatoms can respond to rapid temperature increases, but do not explore how diatoms behave under more complex, thermally variable environments.
From a physiological perspective, two key mechanisms affect the responses of organisms to thermal extremes, (a) the cellular stress response (Schroda et al., 2015) and (b) acclimation, which can result in “heat hardening” (Bowler, 2005). The cellular stress response, defined as the upregulation of stress response genes including those that express heat shock proteins, enhances tolerance to stressful conditions (Schroda et al., 2015). Acclimation, or gradual phenotypic plasticity (Kremer et al., 2018), describes the effect of altered gene expression and epigenetic modifications to adjust a phenotype (e.g., growth rate) in response to an environmental change (Angilletta, 2009; Kronholm and Ketola, 2018). In phytoplankton, acclimation can alter organismal fitness in the new environment over several asexual generations, and is reversible if the environmental cue stops (Brand et al., 1981; Anning et al., 2001; Kremer et al., 2018). Across a wide variety of marine taxa, numerous studies have demonstrated that previous acclimation to elevated temperatures can enhance tolerance (heat hardening) when exposed to thermal extremes (Magozzi and Calosi, 2015; Scharf et al., 2015; Stuhr et al., 2017; Pansch et al., 2018; Hughes et al., 2019; Sasaki and Dam, 2019).
Across both terrestrial and marine taxa, physiological responses to elevated temperature depend on the intensity and duration of thermal conditions within the context of the organism’s thermal niche. For example, environmental warming that occurs below the thermal optimum, the temperature at which growth rate is fastest, can be beneficial by enhancing metabolic activity (Angilletta, 2009). However, environmental warming that occurs near or above the thermal optimum induces a number of physiological stress responses (Viant et al., 2003; Madeira et al., 2013; Leung et al., 2017; Low et al., 2018) that depend upon the duration of the thermal stress, ranging from acute (hours to days) to chronic (days to weeks) (Huey and Bennett, 1990). Energy and resource investment into the expression of acclimation and stress response genes, such as those that produce heat shock proteins, incur fitness costs (Krebs and Feder, 1997; Viant et al., 2003; Geider et al., 2009; Kingsolver and Woods, 2016) and if these are high they can limit responses to future environmental change (Sokolova et al., 2012). In the context of marine heatwaves, the impact of elevated temperatures will be dependent upon the thermal niche of the organisms present, which is subject to both interspecific and intraspecific variation (Boyd et al., 2013). Furthermore, the state of cellular condition (i.e., how stressed the cells are) before heatwaves has the potential to affect population resistance to heatwaves when they do occur (Short et al., 2015; Ainsworth et al., 2016; Stuhr et al., 2017; Siegle et al., 2018; Saha et al., 2019).
Several studies in marine organisms show that responses to MHWs depend upon multiple factors, including temperatures experienced prior to the thermal extreme (Siegle et al., 2018) and temperature variability (Stuhr et al., 2017; Saha et al., 2019; Lugo et al., 2020), and that responses vary between species (Magozzi and Calosi, 2015; Saha et al., 2019; Lugo et al., 2020). Given these factors, it is not surprising that studies have a range of findings. Stuhr et al. (2017) demonstrate that episodic heatwaves enabled maintenance of growth and activity in corals where chronic exposure reduced them. In contrast, Lugo et al. (2020) found that low-temperature periods in a fluctuating thermal regime did not provide relief after elevated temperature exposure in sea stars. Although these studies suggest that thermal experience interacts with taxonomic variation to constrain responses to marine heatwaves, this has not been explicitly addressed in marine phytoplankton, including diatoms.
To understand how intraspecific variation and thermal experience interact to determine mortality and population growth, we investigated the growth response of an Antarctic diatom species to heatwaves. Three genotypes of Actinocyclus actinochilus were used to assess the potential for intraspecific variation in heatwave responses. These genotypes were used in a complex experimental design in which we examined mortality (%) and maximum growth rates (asexual divisions per day) in response to differing thermal regimes, which had three phases: (1) growth below (2.5°C) or above (5.8°C) the thermal optimum before heatwaves, (2) exposure to heatwaves (7.5 or 9.2°C) for up to 9 days and (3) growth after heatwaves at seven temperatures spanning the organisms thermal niche to produce thermal performance curves (TPCs).
We examined whether experiencing high temperatures immediately before heatwaves dampens the negative consequences (decreased mortality and/or increased post-heatwave growth rates) of heatwave exposure by “heat hardening,” or if previous growth at a higher temperature exacerbates these negative effects which is consistent with deteriorating cellular condition rather than heat hardening. In addition, we show how heatwave mortality and acute post-heatwave growth depend on cumulative heatwave intensity. Finally, we explored the evidence for intraspecific variation in these heatwave responses.
Materials and Methods
Genotype Isolation and Culture Maintenance
Seawater samples were collected from surface waters (20 m depth) of the Ross Sea, Antarctica in January 2017. Individual cells and chains of the centric diatom A. actinochilus were isolated using a stereomicroscope (Olympus, Center Valley, United States) and a pipette, washed in sterile seawater and then incubated at 2°C in 1:10 F/2 medium under continuous light at 80–100 μmol photons m–2 s–1 in 24 and 48-well microtiter plates. Successfully cultivated isolates were then grown at 3°C under constant light intensity (∼50 μmol photons m–2 s–1, measured using a 2-pi sensor) and an aliquot transferred to F/2 medium (Guillard, 1975) every 3–4 weeks. The three isolates used in this study (A4, B7, D8) were collected from two sites (1) 74.64° S, 157° W (A4), (2) 73.91° S, 151.1° W (B7, D8). These isolates were identified to species using the 18S rDNA sequence. We describe isolate cultures as unique genotypes as they were founded from single cells isolated from natural seawater, where genetic diversity within diatom populations is high (Godhe and Rynearson, 2017). Furthermore, each isolate had distinct and repeatable growth responses to the temperature range investigated, as determined from preliminary experiments. For these reasons, we describe these isolates as unique genotypes throughout this study.
To determine the 18S rDNA sequences for each genotype, genomic DNA was extracted from filtered biomass using the DNeasy 96 Plant Kit (Qiagen, Hilden, Germany) following the manufacturer’s protocol, with additional lysis of biomass at 65°C for 10–20 min. The 18S was amplified using a 15 μL reaction mixture containing 1–2 ng DNA, 1X colorless GoTaq master mix (Promega, Madison, United States), and 0.5 mol L–1 each of the universal 18SA and 18SB primers (Medlin et al., 1988) in a thermal cycler (Eppendorf AG 22331 Mastercycler, Hamburg, Germany) at 94°C for 2 min, 40 cycles of 94°C for 30 s, 60°C for 60 s, and 72°C for 2 min followed by 10 min at 72°C. PCR amplicons were purified by ethanol precipitation (Zeugin and Hartley, 1985) and quantified by a Nanodrop 1000 (Thermo Scientific, Waltham, United States). Amplicons were sequenced unidirectionally using the 18SB primer either on a 3500XL Genetic Analyzer (Applied Biosystems, Foster City, CA, United States) at the University of Rhode Island Genomics and Sequencing Center, or on an ABI 3730XL (Applied Biosystems, Foster City, CA, United States) at Yale University’s Keck DNA Sequencing Facility. Sequences were analyzed using Genomics Workbench software, V9.0.1 (Qiagen, Hilden, Germany) and BLAST (Altschul et al., 1990).
Experimental Design
The effect of thermal experience on mortality and post-heatwave growth rates of A. actinochilus was assessed in an experiment with three phases (Figure 1). In phase one (acclimation) a single stationary-phase culture of each genotype, cultivated at 2.5°C, was used to inoculate six 25 mL cultures, three of which were kept at 2.5°C (below their thermal optima, or Topt) and three of which were transferred to 5.8°C (above Topt). Thermal optima was estimated from preliminary growth experiments to range between 3 and 4.5°C across the three genotypes. Phase one was comprised of 18 experimental populations (3 genotypes × 2 temperatures × 3 biological replicates). All cultures were inoculated at low density (200–700 cells/mL) and incubated for 19 days. This period provided sufficient time for experimental populations to reach carrying capacity (1.25 × 10⁴ – 1.25 × 10⁵ cells/mL), having grown for 5.8–7.5 generations (∼0.3–0.4 generations per day).
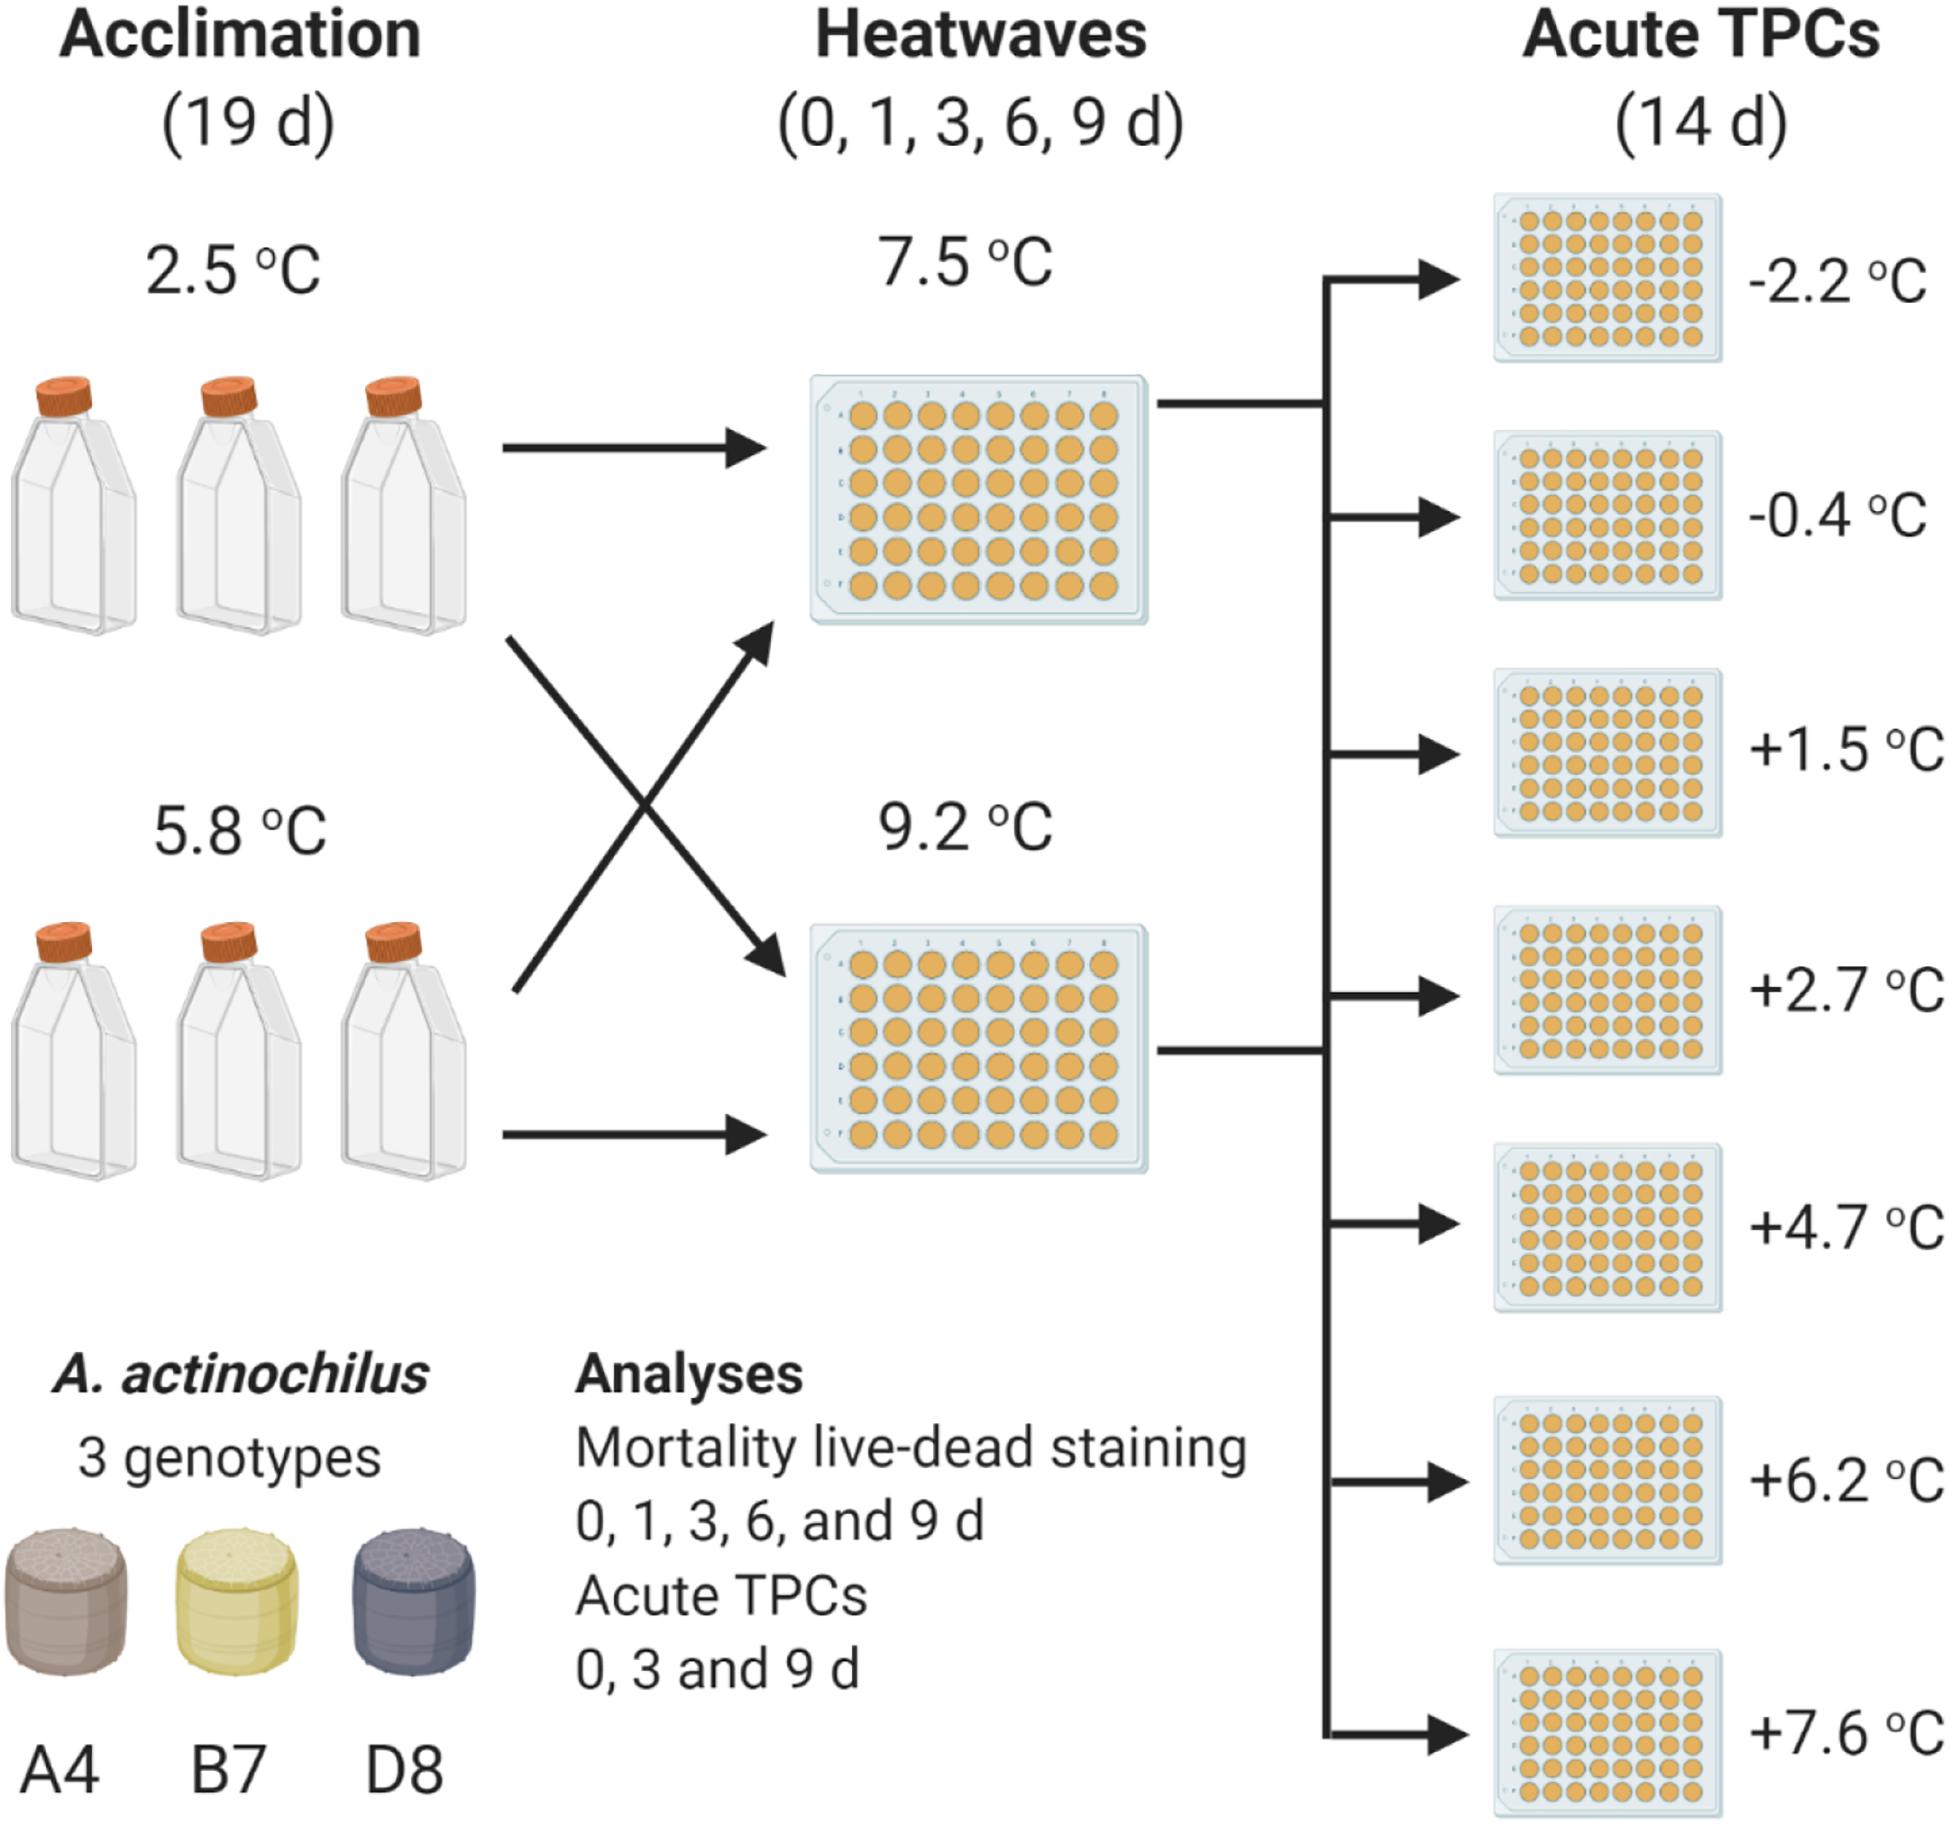
Figure 1. Overview of experimental design for the heatwave treatment. All temperatures shown are absolute temperatures for incubation. A near-identical design was used for the control treatment, in which cultures grown at 2.5 and 5.8°C in the first (acclimation) phase are maintained near these temperatures (2.7 and 6.2°C) in the second (heatwave) phase (Supplementary Figure 1).
In phase two (heatwaves), 1 mL volumes from the 25 mL, phase one cultures were aliquoted into individual wells of 48-well microtitre plates and incubated on a thermal gradient block at one of two heatwave temperatures (7.5 or 9.2°C). Each 1 mL population in this second phase was used as a sacrificial sample, so that a well was used for determination of mortality at a single time point and/or for propagation into the third phase. Phase two lasted between zero (non-exposed, no heatwave) and 9 days, with sacrificial samples collected for live-dead staining at 0, 1, 3, 6, and 9 days to determine mortality. Determining mortality for populations at day zero (non-exposed to heatwaves) provided a baseline for further comparison, and also allowed us to investigate the effect of growth above Topt in the first phase of the experiment on mortality. In total, 162 experiment populations were in the heatwave phase and underwent live-dead staining, 18 non-exposed populations and 144 heatwave exposed populations (4 heatwave durations × 2 heatwave temperatures × 18 acclimation phase experimental populations). In phase three (acute TPCs), experimental populations not exposed to heatwaves (d0) and populations exposed to 3 and 9 days heatwaves were transferred into nutrient-replete media in 48-well microtitre plates and allowed to recover and grow at a range of temperatures (−2.2, −0.4, +1.5, +2.7, +4.7, +6.2, and +7.6°C) for 14 days on a thermal gradient block to produce acute thermal performance curves. This totals to 630 experimental populations in this final phase of the experiment, 126 non-exposed populations (18 populations × 7 temperatures) and 504 heatwave exposed populations (72 populations × 7 temperatures).
Heatwave temperatures (7.5 and 9.2°C) were chosen to simulate thermally stressful environments for A. actinochilus, in which temperatures are either near to or beyond thermal maxima the for A. actinochilus and other Southern Ocean diatom species (Boyd, 2019). These temperatures, although not currently experienced in the Ross Sea where the genotypes used in this study were isolated, can occur in other parts of the Southern Ocean during heatwave events (Montie et al., 2020), and as such could be experienced by this species more broadly.
In phase three, experimental populations from phase two were diluted (1:20) into fresh media and allowed to grow until reaching stationary phase. Growth rates measured in this study are acute (Schulte et al., 2011). This enabled us to explore the role of recent thermal experience to extreme environmental fluctuations, when temperature changes over days rather than weeks; our setup reflects immediate recovery from a heatwave rather than the acclimated growth usually used in laboratory experiments aimed at identifying the thermal niche of organisms (Boyd et al., 2013).
An inherent limitation of this experiment comes from known interactions between thermal stress and nutrient limitation (Rhee and Gotham, 1981; Thomas et al., 2017). When stationary phase experimental populations were transferred from the first to the second phase of the experiment they were not diluted into fresh media; they were exposed to elevated temperature under nutrient limitation. This was necessary for accurate measurements of mortality during heatwaves. Growth needed to be arrested, or mortality would be confounded by the growth of new cells.
We have accounted for this in two ways. First, for each heatwave duration (0–9 days), each experimental population, regardless of thermal history (2.5 or 5.8°C), was exposed to nutrient limitation for the same length of time. Thus, differences in mortality and post-heatwave growth rates between treatment groups after a specific heatwave duration are directly comparable. Second, we performed control treatments to maintain nearly constant temperatures between the first and second phases (2.5–2.7°C or 5.8–6.2°C), so that experimental populations were exposed to nutrient limitation only, without heatwaves (Supplementary Figure 1). Due to space limitations, it was not possible to perform the heatwave treatments and control treatments simultaneously. Because of this, we treated these two data sets separately in our statistical analyses and compared the results of those analyses to test for nutrient limitation effects. The mortality analysis in this treatment was potentially confounded by the growth of new cells, so changes in density (both live and dead cells) over time were calculated.
Incubation Conditions
Experimental populations were grown in a cooled incubator (Panasonic MIR-154) set to 3 or 6°C for the first phase of both experiments. Temperature within flasks was measured in triplicate on four occasions, with the temperatures in the 3 and 6°C incubators averaging 2.50 ± 0.24°C and 5.77 ± 0.13°C, respectively. Incubation during the heatwave and post-heatwave growth phases were performed on two thermal gradient blocks (TGBs). Both TGBs were identical in materials and set-up, and were made of thick aluminum sheets (41 cm × 92 cm), with two channels drilled through the width of the block at either length end, enabling water or anti-freeze to be pumped through, producing a thermal gradient along the length of the block. Each TGB was covered with sheets of insulation foam, with slots for microtitre plates to be in direct contact with the block surface. Slots were arranged in two rows of seven columns, allowing two microtitre plates per temperature. To enhance thermal conductivity between the block and the plates, custom cut aluminum sheets were inserted into the base of microtitre plates. Temperature values for each column were determined by taking measurements in 1 mL volumes of seawater within 48-well microtitre plates, with six wells recorded per measurement with a minimum of three measurements taken. Simulated heatwave temperatures (mean average ± standard deviation) were 7.45 ± 0.34 and 9.24 ± 0.51. Temperatures included in analyses for the TPCs were −2.24 ± 0.66, −0.36 ± 0.40, +1.53 ± 0.43, 2.73 ± 0.46, 4.68 ± 0.28, 6.19 ± 0.4, 7.6 ± 0.42. Simulated heatwave temperatures for the control treatment were 2.73 and 6.19°C. Samples in incubators and TGBs were lit from above using cool white aquarium LED lights at 45–55 μmol m–2 s–1, measured using a 2-pi sensor.
Mortality Analysis
On each of the heatwave analysis days (0, 1, 3, 6, and 9), samples of either 1 mL (from flask cultures, for control treatments at day zero) or 0.5 mL (from microtiter plates after heatwave exposure, diluted to a volume of 1 mL) were obtained from experimental populations, aliquoted into micro-centrifuge tubes and stained with Evans Blue dye at a final concentration of 0.02%. Stained samples were incubated at 2.5°C for a minimum of 1 h. Samples were kept on ice until imaging (performed within 8 h of staining). The order of sample imaging was randomized. This method was adapted from Garrison and Tang (2014). Samples were loaded onto 1 mL Sedgewick rafter chambers and images acquired at 100× magnification using a mounted EOS 800D Canon digital SLR camera. Images were taken to obtain counts per sample of >600 cells total, or until images of 300 squares (300 μL) were acquired. Live cells ranged in color from dark to golden brown. Dead cells ranged in color from light to dark blue.
Determination of Acute Post-heatwave Growth Rates – Thermal Performance Curves (TPCs)
Acute growth rates of experimental populations were determined at seven temperatures ranging between −2.2 and +7.6°C on a TGB. These temperatures broadly covered the thermal tolerance range of A. actinochilus. On d0 (before heatwave), and on d3 and d9 of heatwave exposure, a single replicate from each experimental population was sub-cultured from the acclimation (2.5 or 5.8°C) or heatwave temperatures (7.5 or 9.2°C) directly to temperatures ranging from −2.2 to 7.6°C. Chlorophyll-a fluorescence was measured daily (Tecan Spark plate reader). Experimental populations were mixed by pipette every second day to disperse cellular aggregates (Siegel et al., 2020). Although fluorescence intensity per cell can vary with thermal stress in phytoplankton (Voznesenskiy et al., 2016), we measured relative changes of in vivo fluorescence in the same culture maintained under constant thermal conditions over time. Therefore, measurements within individual time series are comparable, allowing us to calculate maximum growth rates from the data. All growth curves were measured in 48 well plates.
Data and Statistical Analysis
All data analyses were performed in the R statistical environment (R Core Team, 2019) and plots were produced in the package ggplot2 (Wickham, 2016). Maximum growth rates were calculated from chlorophyll-a fluorescence data using the equation below, where x1 and x2 are the estimated chlorophyll fluorescence values at the beginning (t1) and end (t2) of the fitted regression through the exponential phase of growth curves.
The maximum slope gradient was estimated from the growth curves using a sliding window approach across the 14 days growth period, with the window providing the highest estimated value of growth rate accepted. The window length in all growth rate analyses was seven points, taken across consecutive days with the exception of anomalous data points removed from some growth series.
All estimated growth rates were assessed using R2 confidence values. Fit confidence of growth rates varied with temperature and growth rate (Supplementary Figure 2), and varied most at the lowest temperature (−2.24°C) and at lower growth rate values (μ < 0.2 d–1). Estimation of growth rates at extreme low temperatures and/or slower growth is more difficult due to small values of, and changes in, experimental population size. For this reason, we chose not to exclude growth rates based upon an R2 value cut-off. Visual assessment of all growth rate fits was used to confirm low, positive growth rates. Of the 598 positive growth rates, 589 had R2 values above 0.4, and 518 had R2 values above 0.75. The majority of growth rate estimates with R2 values below 0.75 were from the lowest (−2.24°C, 34/80) and second lowest (−0.4°C, 31/80), while eight out of nine growth rate estimates with R2 values below 0.4 were at −2.24°C (Supplementary Figure 2).
Relative growth differences (g) of experimental populations exposed to heatwaves after three or nine days (dx) of heatwave exposure, relative to the growth of non-exposed experimental populations (d0), was calculated using the following equation:
Since Topt has been shown to shift in response to recent thermal experience (Staehr and Birkeland, 2006; Padfield et al., 2016; Bernhardt et al., 2018; Kremer et al., 2018), Topt values were obtained from curves fitted using a modified Norberg function (Thomas et al., 2012) within the growthTools package (Kremer, 2020), using the function get.nbcurve.tpc(). Thermal optima values for were obtained from each individual set of fit parameters. Curves were fit from growth data across the thermal gradient for each biological replicate. There were thus triplicate curves per treatment, and ninety curves in total. Fits were assessed visually, with poor fits removed from the analysis. Eight fits were removed after visual inspection, with remaining fits having R2 values > 0.4 (78 fits had R2 values > 0.8). All data for genotype D8 acclimated to 5.8°C and then exposed to 9.2°C heatwaves for 9 days were removed, due to erratic growth. Furthermore, due to enhanced growth at the lower thermal extremes in populations of genotype A4 acclimated at 2.5°C and then exposed to 7.5°C heatwaves for 3 days, the relationship between growth and temperature was no longer quadratic, and as such all data for this treatment was also removed from the analysis. Thermal plasticity of the TPCs was calculated as the slope of the TPC below Topt, while the thermal plasticity of the thermal optimum (Topt) was calculated from shifts in Topt values between experimental conditions.
Mortality data after the acclimation phase was analyzed using a general linear model. Data after the heatwave treatment was analyzed using generalized linear models with binomial distributions in the glm function. Maximum growth rates from the acute TPCs were analyzed using general linear mixed models within the lmer function [package lme4 (Bates et al., 2014)] and Topt data was analyzed within a general linear model using the lm function. Due to collinearity between heatwave intensity (°C) and heatwave duration (d), we were unable to interpret results for these two variables independently. Because of this collinearity, we combined these two variables into a single variable, “cumulative heatwave intensity” (°C d), which was then used as the sole variable for heatwave treatment. For analysis of the mortality data, genotype, acclimation temperature, cumulative heatwave intensity and percentage of live cells at day zero were used as predictor variables, with proportional relative live cells (d0 = 1) as the response variable. Percentage of live cells at day zero was included within our statistical analyses due to differences in mortality during the acclimation phase. For the analysis of maximum growth rate data, genotype, growth temperature (both as a linear and a quadratic function), acclimation temperature and cumulative heatwave intensity were used as predictor variables, with growth rate as the response variable. TPC phase plate ID was included as random effect within this model, as ninety experimental populations were split across two plates per temperature. In the analysis of Topt, acclimation temperature, cumulative heatwave intensity and genotype were used as predictor variables, with Topt values as the response variable. Note that cumulative heatwave intensity (°C d) was modeled as a numeric variable in the analysis of mortality, but as a factor variable in the analysis of growth rates and Topt, due to the non-linear trends observed in the growth rate data with respect to this term. Post hoc testing was performed using the emmeans package emmeans() function with Tukey tests to assess the significance of pairwise treatment comparison.
For statistical analyses of mortality and thermal optimum data, all possible models were explored and selection based upon comparisons of differences in the corrected Akaike Information Criterion (ΔAICc) (Zuur et al., 2009). To analyze differences in maximum growth rate, a full model with all possible interactions was built and then run through the dredge() function in the package MuMIn, which produces all possible models and ranks them by AIC values (Barton and Barton, 2015). In analyses the top ranked model, either with AIC or AICc, was used. Model assumptions were checked for all selected models and were found not to have been violated.
Results
Effects of Growth Temperature and Heatwaves on Population Mortality
Analysis of mortality at the conclusion of the acclimation phase revealed that acclimation temperature (F = 45.03, df = 1, p < 0.001), genotype (F = 4.47, df = 2, p = 0.035) and the interaction between them (F = 4.55, df = 2, p = 0.034) had significant effects on the percentage of live cells in experimental populations on day 19. The average percentage of live cells on day 19 for each genotype was 95–98% for experimental populations acclimated at 2.5°C, and 86–93% for experimental populations acclimated at 5.8°C. Day 19 populations from the acclimation phase of the experiment were used to seed phase two of the experiment (heatwaves).
Analysis of mortality during the phase two heatwave treatments (Figure 2 and Supplementary Figure 3) showed that the effects of cumulative heatwave intensity (°C d) (GiLM, χ2 = 12.3685, df = 1, p = 0.0004) and acclimation temperature (GiLM, χ2 = 3.4029, df = 1, p = 0.0651) explain survivorship in these treatments, although acclimation temperature was only marginally significant (alpha = 0.05; Supplementary Table 1). By the end of heatwave exposure, average values of live cells remaining in populations were between 47 and 85% of values at the start of phase two. For two of three genotypes, A4 and B7, experimental populations grown at 2.5°C in the first phase of the experiment survived better when exposed to heatwaves than experimental populations grown at 5.8°C in the first phase. However, in genotype D8, mortality increased consistently regardless of acclimation temperature (Figure 2 and Supplementary Figure 3).
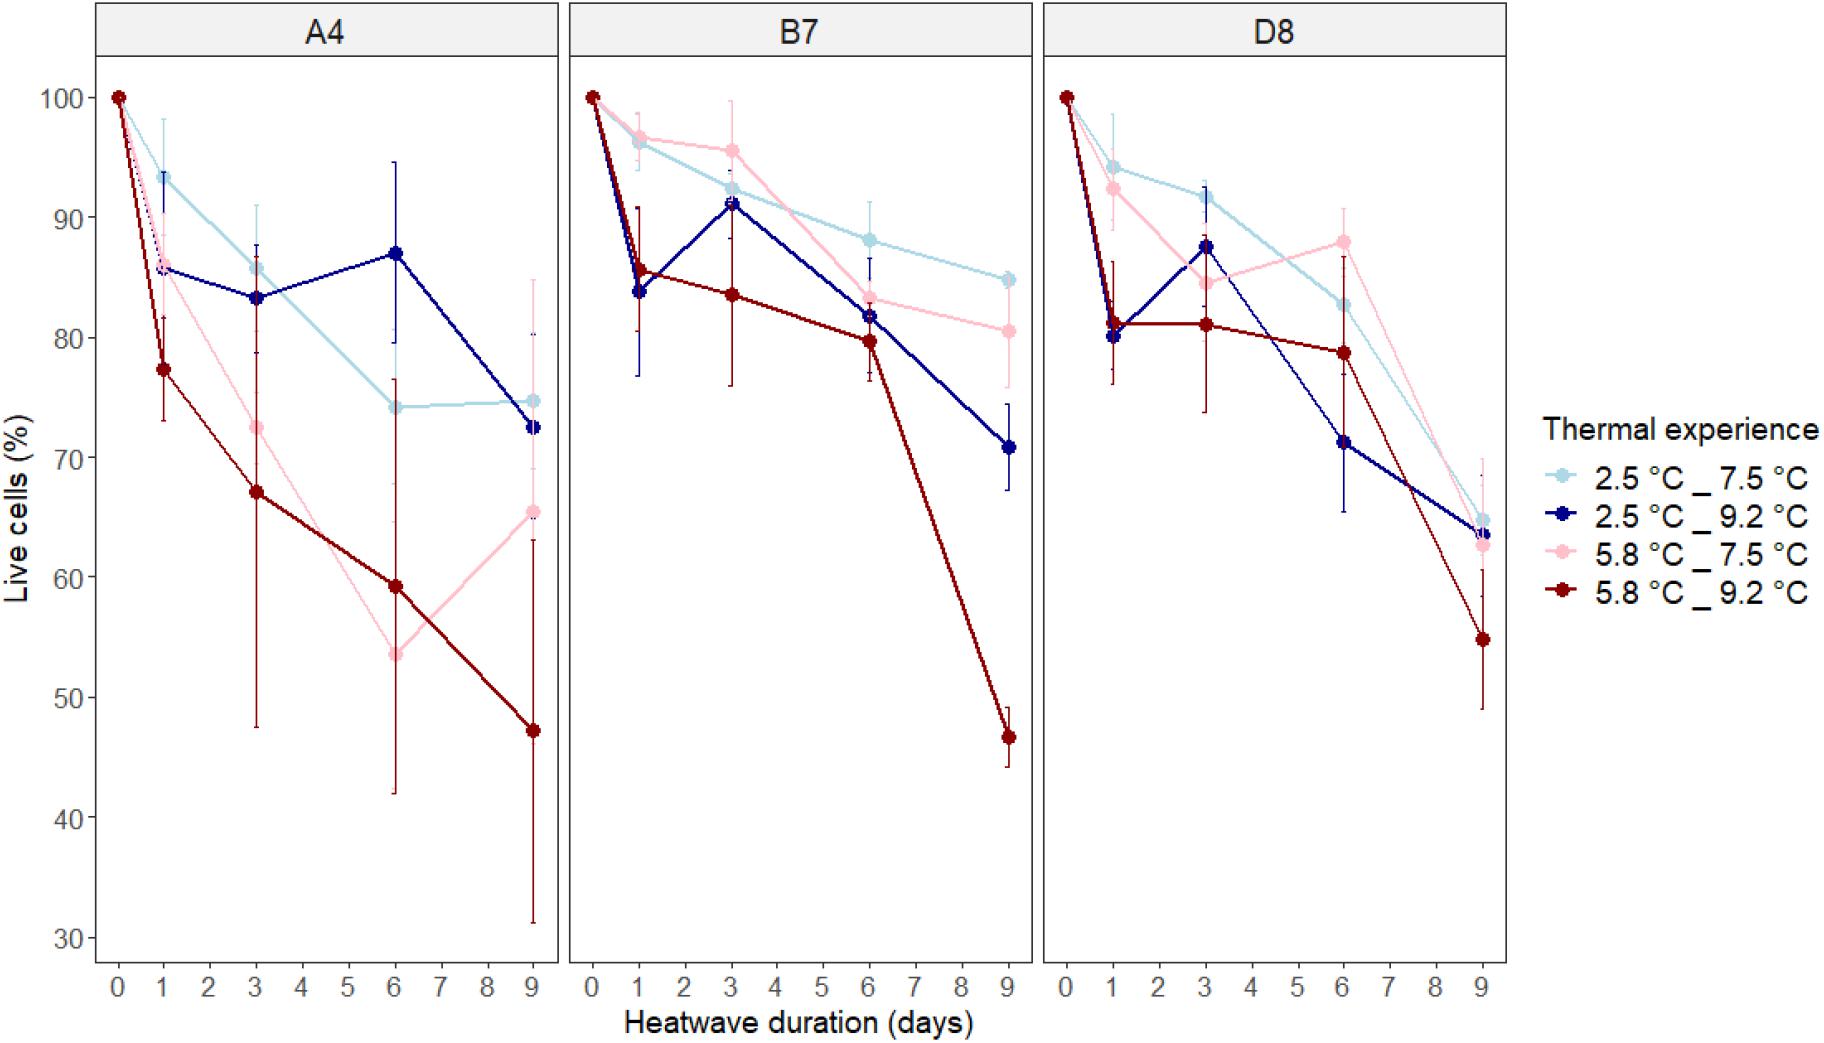
Figure 2. Mortality of experimental populations during simulated heatwaves, shown as the percentage of live cells in experimental populations relative to the percentage of live cells on day 0. Thermal experience is defined by the combination of acclimation temperature (2.5 or 5.8°C) and heatwave temperature (7.5 or 9.2°C). Panels show the results for each genotype (A4, B7, and D8) of A. actinochilus. Data points represent average values for three independent replicates ± one standard deviation.
We saw patterns consistent with warmer heatwaves (9.2°C, darker lines) increasing mortality more than cooler heatwaves (7.5°C, lighter lines) for genotypes B7 and D8 (Figure 2), although this could not be statistically tested due to collinearity between heatwave intensity and duration. Cumulative heatwave intensity (°C d) increased mortality in all three genotypes, with experimental populations acclimated to 2.5°C experiencing lower mortality during heatwaves than those acclimated to 5.8°C (Figure 2 and Supplementary Figure 3). There was no statistical evidence for genotype influencing mortality (GiLM, χ2 = 1.8158, df = 2, p = 0.4034) (Supplementary Table 1). Adding interactions between response variables reduced model AICc values, and none of these terms were significant.
In the control treatment, experimental populations were maintained in a stable thermal environment for up to 9 days to determine if time spent in stationary phase alone impacted mortality. We collected data for five of the six control treatment groups (genotypes A4, B7, and D8, in two thermal regimes) due to culturing failure in experimental populations of genotype D8 acclimated at 5.8°C. In a statistical analysis of the control treatment, the effect of cumulative heatwave intensity (°C d–1) was not significant (GiLM, χ2 = 0.3944, df = 1, p = 0.53) (Supplementary Table 2). In general, populations in the control treatment maintained high percentages of live cells relative to day zero of phase two (Supplementary Figure 5). After 9 days, percentages of live cells relative to day zero ranged between 88 and 99% in four of the five control treatment groups. In contrast, experimental populations exposed to 9 days of heatwave treatment had only 47–85% of live cells remaining relative to day zero (Supplementary Figure 5). It should be noted that in the fifth control treatment group, genotype D8 acclimated at 5.8°C and then exposed to 6.2°C for 9 days, mortality increased substantially (70% live cells after 9 days). While cumulative heatwave intensity (°C d) had a significant effect in the second phase of the heatwave treatment (GiLM, χ2 = 12.3685, df = 1, p = 0.0004) (Supplementary Table 1), the incubation of cultures at the control temperatures (2.7 and 6.2°C) in the second phase of the control treatment did not significantly influence mortality (Supplementary Figure 5). It should be noted that the effect acclimation temperature in the control treatment was significant (GiLM, χ2 = 6.4280, df = 1, p = 0.0112) (Supplementary Table 2) but was not significant at the 0.05 significance level in the heatwave treatment (GiLM, χ2 = 3.4029, df = 1, p = 0.0651) (Supplementary Table 1).
Overall cell densities (cells/mL, total live and dead cells) in experimental populations for both the heatwave and control treatments remained relatively constant over time (Supplementary Figures 4, 6). Minor fluctuations in density occurred, but these were not the large increases that would be associated with sustained growth. This indicates that the observed decline in live cells within experimental populations was not confounded by growth in our experiments.
Effects of Heatwaves on Thermal Performance Curves
In phase three, we characterized the plastic responses of experimental populations to changes in temperature using thermal performance curves spanning temperatures from −2.2 to +7.6°C. First we examined thermal performance of control populations that were held at constant temperatures. There was intraspecific variation in plasticity, defined as change in growth rate with increasing temperature below Topt, and in the effect of previous growth temperature (acclimation) on growth rates (Figure 3, left-hand panels). For example, genotype A4 showed limited plasticity from the lowest temperature assayed (−2.2°C, μ = 0.37 ± 0.02) to the temperature at which the highest growth rate was recorded (+4.7°C, μ = 0.49 ± 0.02), when previously grown at 3°C (top-left panel, blue line). In contrast, genotype B7 was more plastic, with growth rate increasing by more than three-fold from −2.2°C (0.11 ± 0.01) to 2.7°C (0.35 ± 0.02) (middle-left panel, blue line). For genotypes A4 and B7, the effect of previous growth temperature had minimal influence on plasticity (blue and red lines substantially overlap in top-left and middle left panels). However, previous growth at 5.8°C for genotype D8 resulted in significantly decreased growth rates across the central and upper temperature range, compared to experimental populations grown previously at 2.5°C (bottom-left panel).
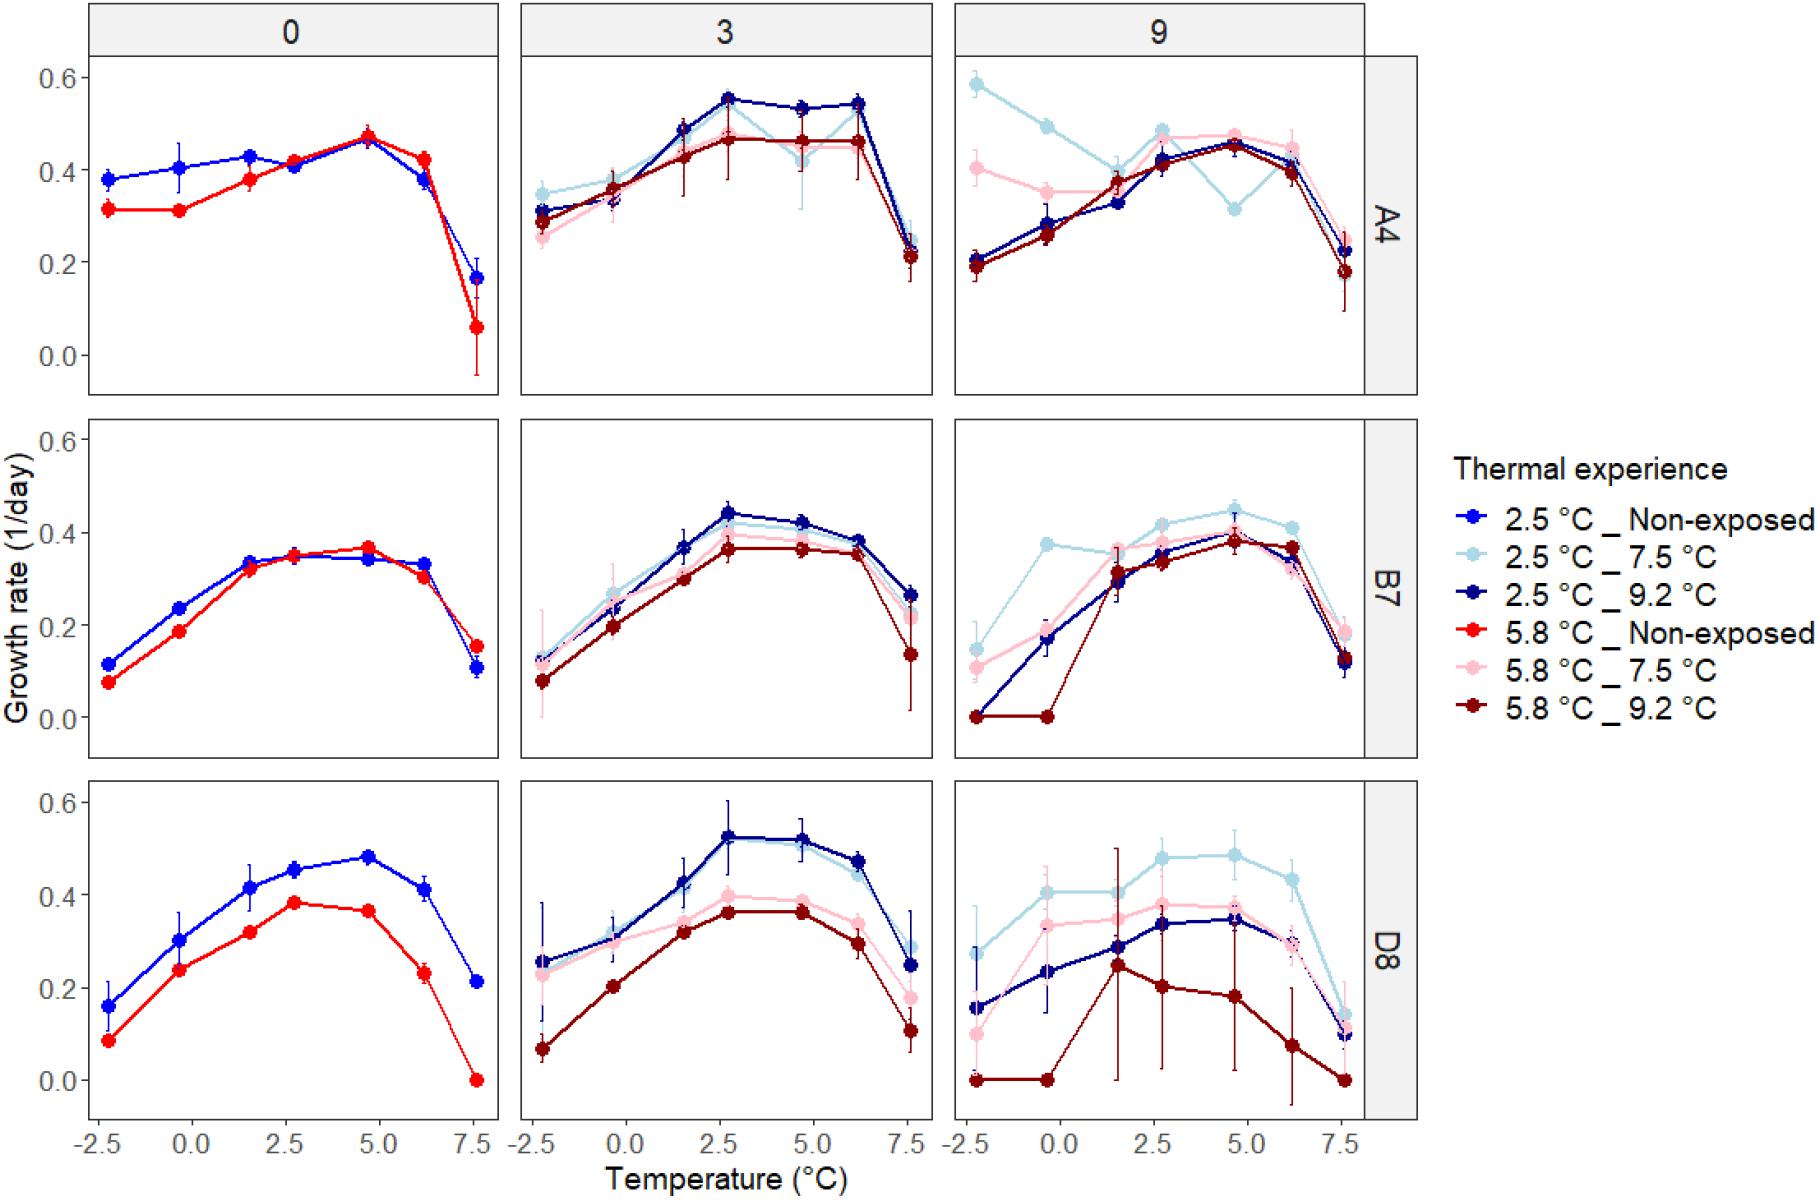
Figure 3. Maximum growth rates of non-exposed (d0) and heatwave-exposed (d3 and d9) experimental populations at seven temperatures for each genotype. Thermal experience combines acclimation temperature (2.5 or 5.8°C) and heatwave temperature (7.5 or 9.2°C). Data shown are average values across three replicates ± one standard deviation.
To assess how heatwaves affected subsequent plastic responses to temperature change, we constructed thermal performance curves for experimental populations after exposure to 3 and 9 day heatwaves (Figure 3). Heatwave exposure affected subsequent thermal performance curves, and cases of both increases and decreases in growth rates relative to experimental populations not exposed to heatwaves were observed (Figure 4). We explored the factors affecting changes in growth rates using a general linear mixed model (GLMM, Supplementary Table 3). Since not all temperature response curves had the same shape, we described the relationship between temperature and growth rate using a linear function (GLMM, F = 71.7293, df = 1, p < 0.001) and a quadratic function (GLMM, F = 76.0014, df = 1, p < 0.0001). Together, these terms captured the shape of the temperature response curves and explained 21% of the total variation explained by the model, as calculated by the sum of squares value for this term divided by the total sum of squares across the model and presented as a percentage. Genotype (GLMM, F = 239.8280, df = 2, p < 0.0001) and acclimation temperature (GLMM, F = 133.9460, df = 1, p < 0.0001) together explained the majority (53%) of the variance in growth rate (Figure 3 and Supplementary Table 3). Here, experimental populations that were acclimated at a lower temperature generally grew faster at a given temperature than those acclimated at a higher temperature, particularly after the first 3 days of heatwave exposure (Figure 3, central and right hand panels).
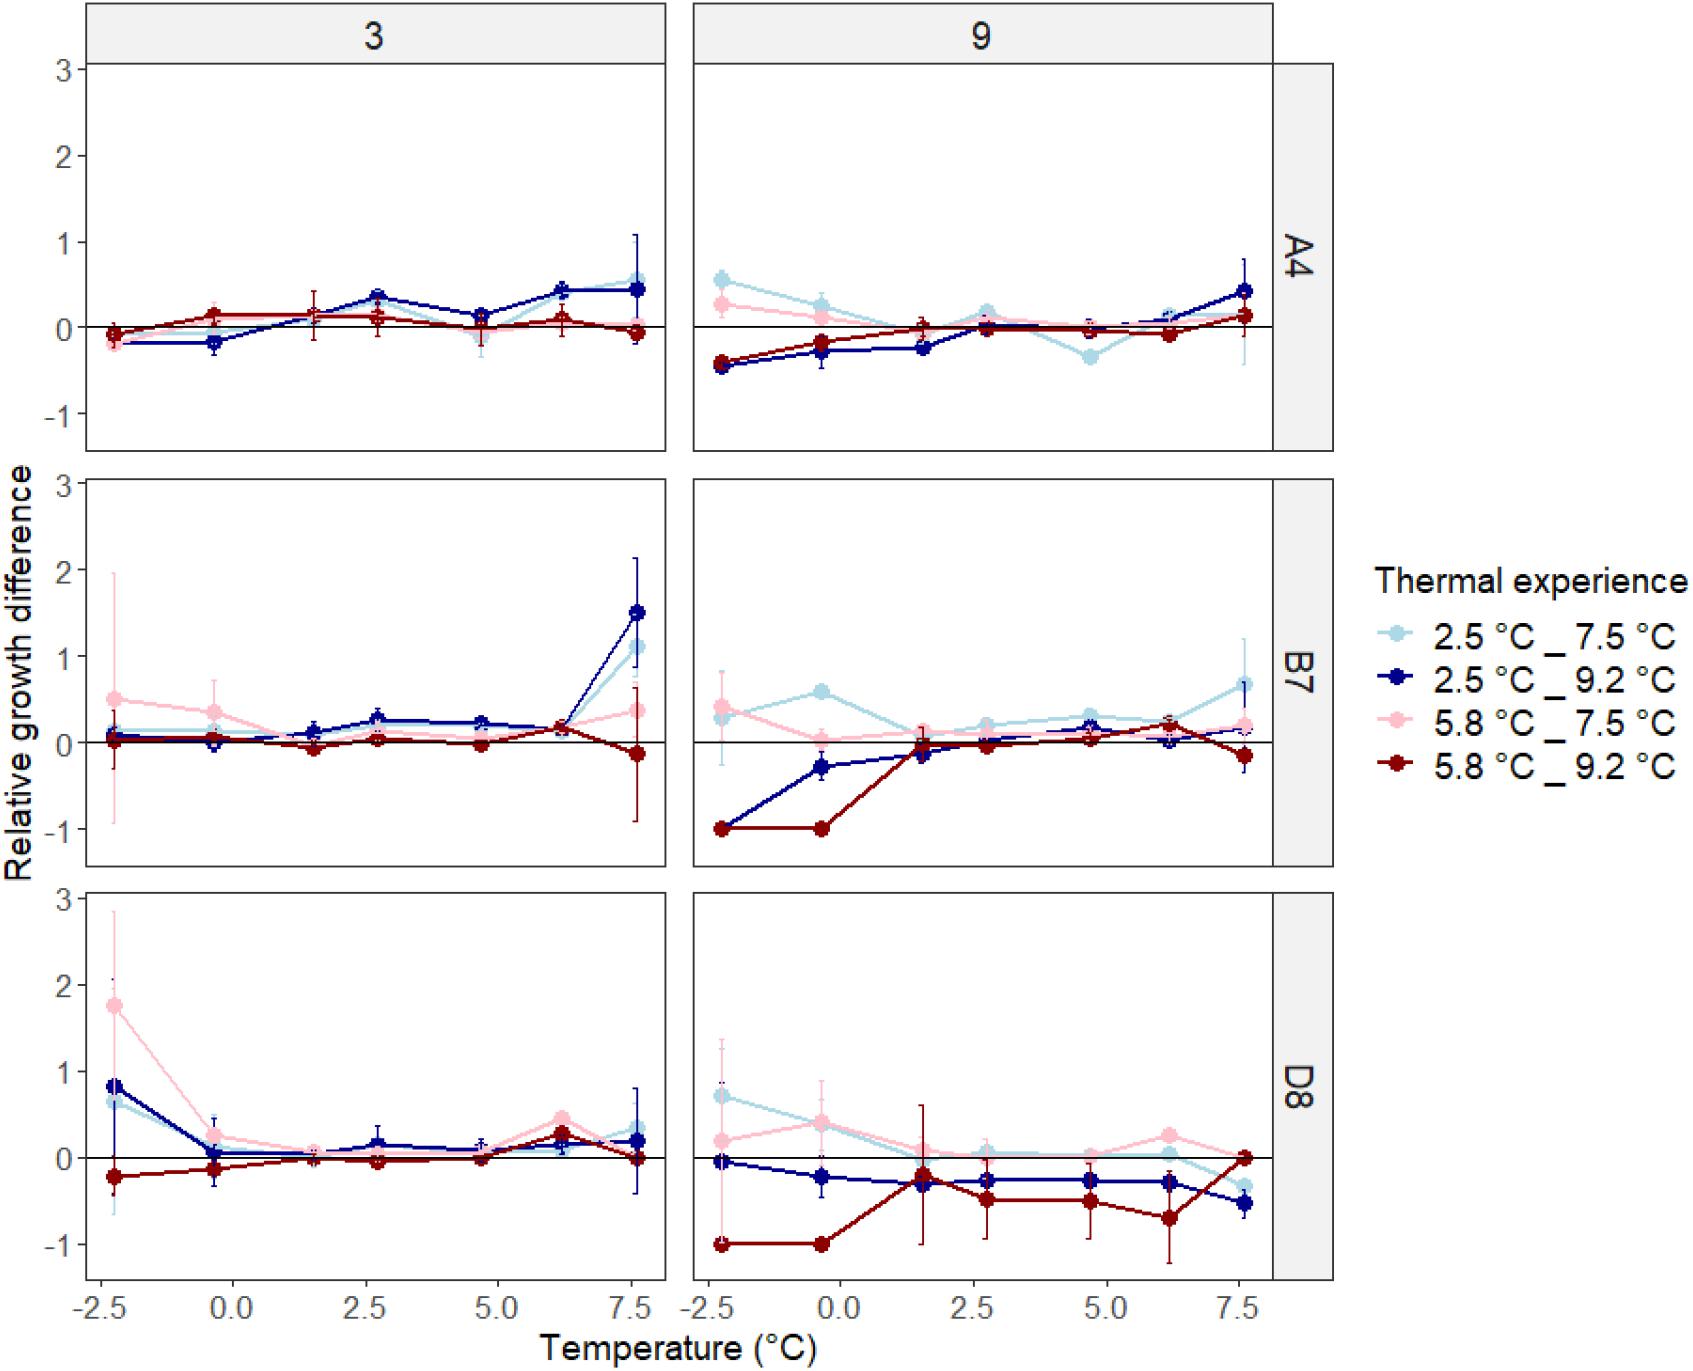
Figure 4. Relative growth difference of experimental populations grown at seven temperatures after exposure to 3 or 9 days heatwaves compared to non-exposed experimental populations, for each genotype. Data represent average values across three replicates ± one standard deviation.
Cumulative heatwave intensity (°C d) had a large and significant effect on experimental population growth rates (GLMM, F = 67.8707, df = 4, p < 0.0001). Post hoc testing (Supplementary Tables 4A–C) revealed that the effect of cumulative heatwave intensity was not linear. In general, growth was unaffected or enhanced by mild heatwaves, but reduced by intense heatwaves, relative to non-exposed populations. The extent of this alteration was modulated by genotype and acclimation temperature. For example, the most extreme growth rate increases occurred in B7 acclimated to 2.5°C, where all but the most intense heatwaves (79.83°C d, 9.2°C for 9 days) significantly increased growth rates relative to pre-heatwave values (Figure 4 and Supplementary Table 4B). However, the most intense heatwaves (79.83°C d, 9.2°C for 9 days) significantly decreased growth rate, relative to both pre-heatwave values and to experimental populations exposed to milder heatwaves, in almost all pairwise comparisons across genotypes (Supplementary Tables 4A–C). After intense heatwaves, growth at lower temperatures was either significantly reduced or completely arrested in all three genotypes. Furthermore, genotype D8 exposed to 9.2°C heatwaves decreased across the entire range of temperatures measured.
A number of interactions between all individual variables within the main growth rate statistical model were also identified (Supplementary Table 3), but these had much smaller effect sizes than the individual variables, so only three interactions will be examined in detail here. First, the interaction with the largest effect size was genotype with growth temperature (GLMM, F = 56.2742, df = 2, p < 0.0001), which can be explained by the differences in plasticity between genotypes described above.
Second, growth temperature also interacted with cumulative heatwave intensity (GLMM, F = 17.7256, df = 4, p < 0.0001). Growth at both temperature range extremes was most affected by cumulative heatwave intensity, with less intense heatwaves elevating growth rates while more intense heatwaves reduced them. Very high cumulative heatwave intensities (9-day heatwaves of 9.2°C) resulted in the largest reductions in growth rate, particularly at low temperatures (Figure 4, right-hand panels). For genotypes B7 and D8, growth at both −2.2 and −0.4°C was completely inhibited after a thermal experience where experimental populations had been grown at 5.8°C, and then exposed to a 9.2°C heatwave for 9 days. Finally, acclimation temperature also interacted with genotype (GLMM, F = 12.8787, df = 2, p < 0.0001).
Due to the lower confidence of growth rate fits at the extreme low temperature (−2.24°C), the statistical analysis of growth rates was repeated but without data from this temperature (Supplementary Table 5). Despite some minor changes in relative effect sizes and the significance of low-effect interactions, the relative size and significance of major terms and interactions remained consistent. As such, we decided to continue to use the full dataset in further analyses of the experiment.
Differences in thermal optima (Topt) between experimental populations depended on cumulative heatwave intensity (GLM, df = 4, F = 12.08, p < 0.0001) and genotype (GLM, df = 2, F = 8.08, p < 0.0001). There were also significant interactions between genotype and acclimation temperature (GLM, df = 2, F = 5.99, p = 0.0041), as well as genotype and cumulative heatwave intensity (GLM, df = 2, F = 2.19, p = 0.040) (Figure 5 and Supplementary Table 6).
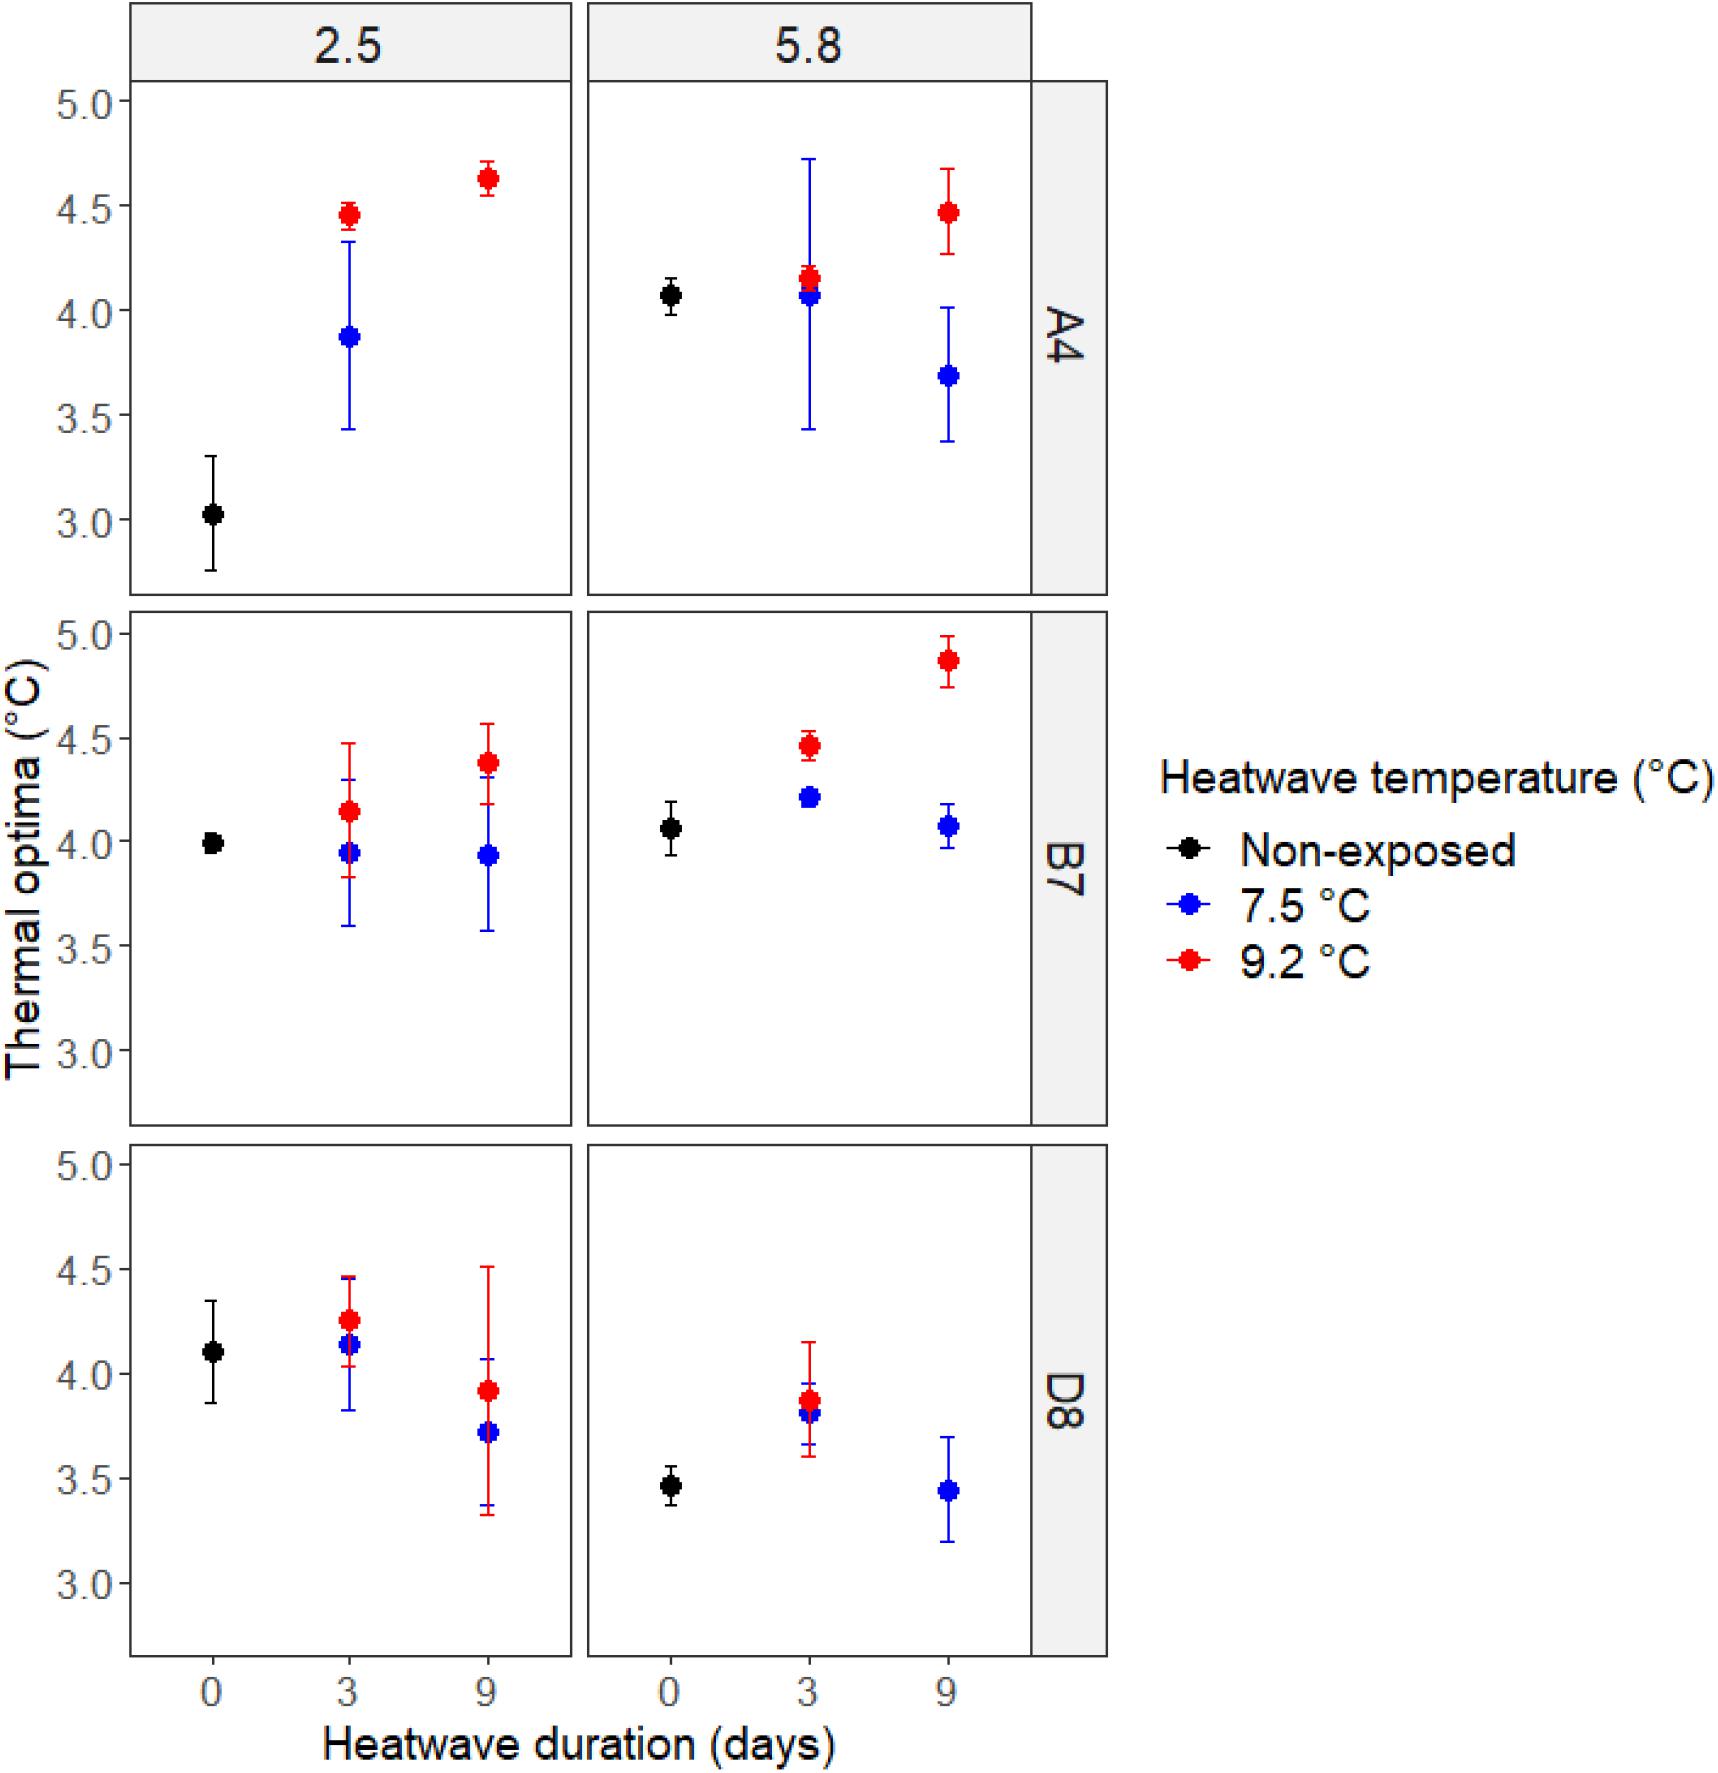
Figure 5. Growth rate thermal optima (°C) of non-exposed (black) and heatwave exposed (red/blue) experimental populations. Thermal performance curves were produced for non-exposed populations (d0) and populations exposed to 3 and 9 days of heatwave exposure, for different acclimation temperatures (columns) and genotypes (rows). Error bars represent ± one standard deviation across three biological replicates.
In general, hotter heatwaves resulted in a higher Topt. Over time, the difference in Topt between hotter and cooler heatwaves either held steady or grew, but did not get smaller. The magnitude of the effects of acclimation temperature and cumulative heatwave intensity on Topt were genotype specific. For example, before heatwave exposure, experimental populations of A4 acclimated at 5.8°C had a Topt higher than those acclimated at 2.5°C. In comparison, genotype B7 had the same Topt regardless of acclimation temperature (Figure 5). Heatwaves raised Topt values in genotype A4, regardless of acclimation temperature, but the cumulative heatwave intensity required to do this depended on acclimation temperature: both 7.5 and 9.2°C heatwaves caused an upward shift in Topt for experimental populations acclimated to 2.5°C (Figure 5, top left), but only 9.2°C for 9 days (79.83°C d) was able to further increase Topt values for those acclimated at 5.8°C (Figure 5, top right). In contrast, heatwaves caused no significant shifts in Topt in genotype D8, regardless of heatwave intensity or duration (Figure 5, bottom panels).
Post hoc testing of the effect of cumulative heatwave intensity, with all other variables kept equal, showed that heatwaves of 9.2°C significantly increased Topt relative to pre-heatwave experimental populations by 0.4°C for 3 days (26.61°C d, p < 0.0001) and 0.5°C for 9 days (79.83°C d, p < 0.0001). In contrast, heatwaves of 7.5°C did not significantly alter Topt from pre-heatwave values, for either 3 days (21.87°C d, p = 0.2024) or 9 days (65.61°C d, p = 0.9812) heatwaves.
Discussion
Previous studies have found both negative and positive effects of heatwaves on marine organisms (Stuhr et al., 2017; Pansch et al., 2018; Siegle et al., 2018; Bartosiewicz et al., 2019; Roberts et al., 2019; Lugo et al., 2020). Here, we systematically disentangled how thermal experience and genotype affect the mortality and growth responses of the Southern Ocean diatom A. actinochilus to simulated heatwaves, and show how both negative and positive heatwave effects can occur in the same study system. A wide range of growth and mortality effects occur during and after exposure to heatwaves, and this range of effects can be attributed to differences in temperature regimes. As expected, more intense heatwaves result in increased mortality and affect post-heatwave growth rates more than more moderate heatwaves, and the extent of this depends on previous growth temperature. We also found that genotypes vary in their responses to heatwaves. Our data show that the effects of marine heatwaves on primary producers depend on both environmental and genetic context. While there are general patterns in responses to heatwaves, a range of responses should be expected between populations with different thermal histories, and to a lesser extent, within genetically variable populations with the same history.
More intense heatwaves consistently resulted in increased mortality across all three genotypes (Figure 2 and Supplementary Table 1). This supports previous work showing that cumulative thermal stress is a strong predictor of population decline in marine populations and ecosystems (Eakin et al., 2010; Marbà and Duarte, 2010; Stuhr et al., 2017; Pansch et al., 2018; Siegle et al., 2018). Accumulated stress beyond a critical threshold results in mortality due to the degradation of cellular components and disruption of physiological functioning (Lesser, 2006; Magozzi and Calosi, 2015; Schroda et al., 2015; Feijão et al., 2018). Although exposure to non-lethal temperatures can also increase tolerance to further stress in some marine organisms (Clapp et al., 1997; Magozzi and Calosi, 2015; Sasaki and Dam, 2019), we do not find evidence for this in our experiment. Instead, we found that experimental populations grown at 5.8°C (above Topt) prior to heatwave exposure had higher levels of mortality than those grown at 2.5°C (below Topt), in both the heatwave and control treatments. This effect (F-value) was 3.40 (p = 0.0651) and 6.43 (p = 0.0112) in our heatwave and control treatments, respectively. It is unclear why the effect of acclimation temperature had a lower p-value in the control treatment. One potential explanation is that the negative effect of increasing cumulative heatwave intensity on the percentage of live cells partially masked previous acclimation effects, particularly in genotypes A4 and B7 (Figure 2 and Supplementary Figure 3).
Growing in warmer temperatures before heatwaves exacerbated the negative consequences of heatwaves in this experiment. A number of studies have come to similar conclusions; that previous growth at elevated, sub-lethal temperatures weakened the capacity to respond to further stress, rather than providing a “heat-hardening” effect (Marbà and Duarte, 2010; Pansch et al., 2018; Siegle et al., 2018). For example, Siegle et al. (2018) found that copepods isolated from splash pools with differing thermal histories responded differently to simulated heatwaves. Individuals that had experienced sub-lethal but warmer temperatures were less likely to survive simulated heatwaves, with this effect exacerbated by increasing heatwave intensity (Siegle et al., 2018). We suggest that in our study, the effect of previous heat exposure is related to whether experimental populations were acclimated above Topt, and nearer to the upper limit of temperatures normally experienced in the Southern Ocean during diatom blooms (5.8°C), or below Topt, and within the normal temperature range for diatoms growing in the Southern Ocean (2.5°C) (Boyd, 2019). Above Topt, one could reasonably suppose that cells would be stressed, and could accumulate damage, even if they are able to grow in the short term, which is consistent with, for example, reactive oxygen associated with rapid growth due to CO2 enrichment (Lindberg and Collins, 2020). In contrast, cells growing below Topt can be expected to be operating normally, if slowly, and even if they are not under ideal conditions, it is unlikely that they are experiencing severe thermal stress.
We investigated the effect of thermal experience on growth immediately following heatwaves by comparing thermal performance curves before and after heatwave exposure. Previous studies on Southern Ocean diatoms (Boyd et al., 2013, 2016; Xu et al., 2014; Coello-Camba and Agustí, 2017; Andrew et al., 2019; Boyd, 2019) produced acclimated TPCs, where growth rate at a given temperature is recorded after several generations of acclimation to a stable thermal environment (Brand et al., 1981). In contrast, we have used acute thermal responses. Our rationale for measuring acute responses is that population dynamics, and the ecological consequences of them, immediately following heatwaves will be driven by acute responses to the post-heatwave temperatures, as ecological and evolutionary processes will not pause while populations acclimate for days or weeks. We found that plastic responses to warming depended on genotype and thermal experience. Exposure to heatwaves affected growth in all three genotypes (Supplementary Table 3), but the extent of this impact differed between them (Figure 3). Broadly, genotype A4 appeared to have the largest tolerance (low mortality and high growth rates) to simulated heatwaves, while genotype D8 displayed the lowest tolerance. However, the effect of genotype was not statistical significant for mortality (p = 0.4034). This suggests that genotype effects are mainly important in post-heatwave performance rather than heatwave survival itself, at least in this study. Interestingly, 3 days of heatwave exposure did not have negative consequences for growth in any genotype (Figure 4 and Supplementary Tables 4A–C). This high tolerance to short but very warm heatwaves was surprising, as a previous study found that exposure to simulated heatwaves (+6°C above control temperature) for 3 days reduced growth rates in the model diatom P. tricornutum (Feijão et al., 2018). In contrast, we identified that 3-day heatwaves sometimes had positive effects on growth rate at either thermal extreme in all three genotypes tested (Figures 2, 3). An increase in growth rate at upper thermal extremes after heatwave exposure could indicate acclimation (Magozzi and Calosi, 2015; Scharf et al., 2016; Stuhr et al., 2017) where growth at elevated temperatures causes rapid physiological alterations that limit the negative impact of stress at temperatures above Topt (Low et al., 2018). However, we also observed high variation among genotype replicates at the upper temperature range, indicating that acclimation at very high temperatures was variable (Figure 4). Cells at very high temperatures may be more stressed, and cell function may deteriorate idiosyncratically (Sørensen et al., 2013; Magozzi and Calosi, 2015; Feijão et al., 2018).
The most intense heatwaves (79.83°C d, 9.2°C for 9 days) resulted in the largest reductions in growth rate in this study, in some cases completely arresting growth at thermal extremes (Figures 3, 4). This is consistent with our mortality measurements, and other studies where growth rate and survival decline as populations reach a critical level of accumulated thermal stress (Marbà and Duarte, 2010; Pansch et al., 2018; Siegle et al., 2018). The largest increases in mortality occurred between 6 and 9 days of heatwave exposure (Figure 2), indicating that differences in population growth rates for different heatwave durations is likely driven by increased cellular stress here (Figure 3). Strikingly, even after 9 days of heatwave exposure, a subset of experimental populations displayed remarkable tolerance to elevated temperature, measured as growth rate (Figures 3, 4). In genotypes A4 and B7, growth at 7.6°C was enhanced after heatwave exposure, further supporting the hypothesis that acclimation can partially mitigate the negative effects of growth under elevated temperatures, at least in some cases (Magozzi and Calosi, 2015; Scharf et al., 2016; Stuhr et al., 2017). Interestingly, some experimental populations exposed to 9 days heatwaves also displayed enhanced growth rates at low temperatures (Figure 4). As with experimental populations exposed to shorter heatwaves, there was high variation within genotypes in lower temperature growth rates, which suggests that the effects of stress may be idiosyncratic in extreme cases, where the breakdown versus improvement of cellular function may have a high stochastic component.
These results are in line with previous studies that have used genomic and transcriptomic approaches to characterize the thermal adaptations of Southern Ocean diatoms, demonstrating that cells may employ common stress mechanisms at both thermal extremes (Mock et al., 2017; Pargana et al., 2020). Growth of Fragilariopsis cylindrus under both thermal extremes (−2, +11°C) revealed similarities in altered gene expression relative to ambient conditions, indicating that generic stress responses were potentially employed in both thermal environments (Mock et al., 2017), and in Leptocylindrus aporus, expression of heat shock proteins (HSPs) was upregulated in both high and low temperature incubations (Pargana et al., 2020). The production of HSPs is known to increase during growth above Topt (Rousch et al., 2004; Leung et al., 2017), and has been shown to be maximized as temperatures approach thermal maxima (Tmax) (Low et al., 2018). However, HSPs are also produced during cold shock responses, which is consistent with the observation that heat shocks can enhance tolerance to subsequent cold shocks (Burton et al., 1988; Goto and Kimura, 1998; Scharf et al., 2015, 2016). Further work using molecular approaches would be required to confirm if these same mechanisms are in play in A. actinochilus.
Analysis of a key thermal trait, Topt, revealed that the plastic response to warming in A. actinochilus can change, and lead to enhanced growth in a warming environment, but that this does not occur in all genotypes (Figure 5). Increases in Topt of up to 1.5°C occurred in genotypes A4 and B7 grown at warmer acclimation temperatures and exposed to hotter heatwaves. We also found evidence of a limit to shifts in Topt, after which additional exposure to elevated temperatures did not increase Topt further. Recent work has shown that previous environmental history can influence thermal performance, with higher acclimation temperatures resulting in upward Topt shifts for a number of phenotypic traits (Seebacher et al., 2015; Padfield et al., 2016; Luhring and DeLong, 2017; Strock and Menden-Deuer, 2020). Our study, alongside others, confirms that thermal performance curves, which are often used to understand the thermal niche a taxon can occupy is plastic and can respond to rapid environmental change.
Taken together, our data show that whether heatwaves have a positive or a negative effect on growth depends on thermal experience. Though both genotype and cumulative heatwave intensity can affect growth, experimental populations acclimated to 2.5°C prior to heatwave exposure generally performed better than those acclimated to 5.8°C (Figure 3), indicating that growth temperatures above Topt prior to heatwaves generally had a negative impact on growth after heatwaves. However, thermal extremes experienced during the heatwaves themselves can enhance growth rates at thermal extremes (Figure 4) and result in upward shifts of thermal optima (Figure 5).
It is interesting to consider whether the acute phenotypic changes that we observed immediately after heatwave exposure (Figures 3–5) would persist or if genotypes would revert back to pre-heatwave states. Although numerous studies have investigated the long-term effects of warming on phytoplankton populations via adaptation (Listmann et al., 2016; Padfield et al., 2016; Baker et al., 2018; Jin and Agustí, 2018; O’Donnell et al., 2018; Schaum et al., 2018), few have investigated intermediate time scales between rapid acclimation processes and long-term evolution. Further research is needed to resolve the effects of prolonged acclimation periods before adaptive processes start to occur. In addition, the state of other environmental parameters such as nutrient availability have been shown to alter the effect of heatwaves on population dynamics in natural ecosystems (Hayashida et al., 2020), and this is worth exploring under controlled laboratory conditions.
The thermal niches of studied Southern Ocean diatoms largely fall within the thermal annual range of the Southern Ocean (−1.5 and 8°C) (Boyd, 2019), with thermal optima ranging between 0 and 7°C for the majority of species (Coello-Camba and Agustí, 2017). Growth of A. actinochilus in this study is consistent with this range, with thermal optimum values (3–5°C) depending on previous thermal experience (Figure 5). The ability of populations to shift their Topt toward warmer temperatures after experiencing thermal extremes may enable them to better tolerate further environmental change (Seebacher et al., 2015). However, the shifts in thermal responses identified in this study may be influenced by trade-offs under less permissive growth conditions, in particular under nutrient limitation. Boyd et al. (2016) investigated trait responses in the Southern Ocean diatom Pseudonitzschia multiseries to a number of predicted future climate scenarios. Temperature, along with iron availability, were found to be predominant drivers of phenotypic plasticity, with populations having faster growth rates and carrying capacity in warmed environments, but at the cost of reduced cellular quality. This is expected to have ecological consequences, as cells grown in warmer environments also had lower nutritional value. Their findings show that responses of SO diatoms to changing thermal environments can have important implications for trophic energy transfer and biogeochemical cycling. The enhanced growth (Figure 3) and Topt shifts (Figure 5) observed in this study may well have correlated effects on ecologically important traits such as nutritional value, and future work using additional trait assays, such as determination of cellular stress and elemental analysis, could reveal them.
In marine ecosystems, historical warming and heatwave events have resulted in a number of long-term changes to population responses to further warming, often driven by changes in the genetic structure of populations (Hughes et al., 2019; Coleman et al., 2020; Voolstra et al., 2020). Our study underscores the importance of intraspecific variation in heatwave responses, as genotype explained 35% of the total variation in growth rate after heatwaves (Figure 3 and Supplementary Table 3), and affected thermal optimum shifts after heatwaves (Figure 5 and Supplementary Table 6). Our findings add to a growing body of literature showing that intraspecific variation in responses to environmental change is common in phytoplankton, and that multiple genotypes should be considered in studies that aim to understand species-level or general responses (Schaum et al., 2013; Zhang et al., 2014; Pancic et al., 2015; Godhe and Rynearson, 2017; Wolf et al., 2018). Focus on a single genotype in this study would have produced misleading conclusions about the response of A. actinochilus to marine heatwaves, with either over estimation (e.g., A4) or under estimation (e.g., D8) of thermal tolerance. Our findings show that marine heatwaves can influence population dynamics and, through differential effects on lineage mortality during and growth rates after heatwaves, have the potential to result in rapid evolution in genetically-diverse diatom populations.
Data Availability Statement
The raw data supporting the conclusions of this article will be made available by the authors, without undue reservation, to any qualified researcher.
Author Contributions
TR and SC obtained research funding. TS, SC, and TR conceptualized the study and designed the experiments. TS performed the experiments and the data analysis and wrote the first draft of the manuscript. SC and TR contributed to final manuscript preparation. All authors approved the manuscript before submission.
Funding
This work was supported by an NSF GEO-NERC grant to TR (NSF - grant code 1543245) and SC (NERC - grant code NE/P006981/1).
Conflict of Interest
The authors declare that the research was conducted in the absence of any commercial or financial relationships that could be construed as a potential conflict of interest.
Acknowledgments
We would like to thank Stephanie Anderson for assisting with the design of the multi-well growth plate, S. Anderson and Kerry Whittaker for cell isolations during the 2016–2017 research cruise, Celia Gelfman for culture maintenance at URI, Katy McDonald, Jana Hinners and Ignacio Melero Jiménez for assistance in data collection, Ian Bishop for providing R code for growth rate calculations and, Albert Phillimore and Nick Colegrave for advice on statistical approaches. Part of this research was conducted using the University of Rhode Island’s Marine Science Research Facility, supported by NSF EPSCoR awards 1004057 and 1655221. This manuscript has been released as a pre-print on BioRxiv (doi: https://doi.org/10.1101/2020.08.25.264028) Samuels et al. (2020).
Supplementary Material
The Supplementary Material for this article can be found online at: https://www.frontiersin.org/articles/10.3389/fmars.2021.600343/full#supplementary-material
References
Ainsworth, T. D., Heron, S. F., Ortiz, J. C., Mumby, P. J., Grech, A., Ogawa, D., et al. (2016). Climate change disables coral bleaching protection on the Great Barrier Reef. Science 352, 338–342. doi: 10.1126/science.aac7125
Altschul, S. F., Gish, W., Miller, W., Myers, E. W., and Lipman, D. J. (1990). Basic local alignment search tool. J. Mol. Biol. 215, 403–410.
Andrew, S. M., Morell, H. T., Strzepek, R. F., Boyd, P. W., and Ellwood, M. J. (2019). Iron availability influences the tolerance of Southern Ocean phytoplankton to warming and elevated irradiance. Front. Mar. Sci. 6:681. doi: 10.3389/fmars.2019.00681
Angilletta, M. (2009). Thermal acclimation. Thermal Adaptation: A Theoretical and Empirical Synthesis. Oxford: Oxford University Press, 126–156.
Anning, T., Harris, G., and Geider, R. J. (2001). Thermal acclimation in the marine diatom Chaetoceros calcitrans (Bacillariophyceae). Eur. J. Phycol. 36, 233–241. doi: 10.1080/09670260110001735388
Baker, K. G., Radford, D. T., Evenhuis, C., Kuzhiumparam, U., Ralph, P. J., and Doblin, M. A. (2018). Thermal niche evolution of functional traits in a tropical marine phototroph. J. Phycol. 54, 799–810. doi: 10.1111/jpy.12759
Bartosiewicz, M., Przytulska, A., Deshpande, B. N., Antoniades, D., Cortes, A., MacIntyre, S., et al. (2019). Effects of climate change and episodic heat events on cyanobacteria in a eutrophic polymictic lake. Sci. Total Environ. 693:133414. doi: 10.1016/j.scitotenv.2019.07.220
Bates, D., Mächler, M., Bolker, B., and Walker, S. (2014). Fitting linear mixed-effects models using lme4. arXiv [Preprint]. Avaliable at: https://arxiv.org/abs/1406.5823 (accessed April 1, 2020).
Bedolfe, S. (2015). Heatwaves Decrease Production in Benthic Diatom Communities. Faculty of Science and Engineering. Groningen
Bernhardt, J. R., Sunday, J. M., Thompson, P. L., and O’connor, M. I. (2018). Nonlinear averaging of thermal experience predicts population growth rates in a thermally variable environment. Proc. R. Soc. B Biol. Sci. 285:20181076. doi: 10.1098/rspb.2018.1076
Bowler, K. (2005). Acclimation, heat shock and hardening. J. Therm. Biol. 30, 125–130. doi: 10.1016/j.jtherbio.2004.09.001
Boyd, P., Dillingham, P., Mcgraw, C., Armstrong, E. A., Cornwall, C. E., Feng, Y.-Y., et al. (2016). Physiological responses of a Southern Ocean diatom to complex future ocean conditions. Nat. Clim. te Change 6, 207–213. doi: 10.1038/nclimate2811
Boyd, P. W. (2019). Physiology and iron modulate diverse responses of diatoms to a warming Southern Ocean. Nat. Clim. Change 9, 148–152. doi: 10.1038/s41558-018-0389-1
Boyd, P. W., Rynearson, T. A., Armstrong, E. A., Fu, F., Hayashi, K., Hu, Z., et al. (2013). Marine phytoplankton temperature versus growth responses from polar to tropical waters–outcome of a scientific community-wide study. PLoS One 8:e63091. doi: 10.1371/journal.pone.0063091
Brand, L. E., Guillard, R. R., and Murphy, L. S. (1981). A method for the rapid and precise determination of acclimated phytoplankton reproduction rates. J. Plankton Res. 3, 193–201. doi: 10.1093/plankt/3.2.193
Britton, D., Schmid, M., Noisette, F., Havenhand, J. N., Paine, E., McGraw, C. M., et al. (2020). Adjustments in fatty acid composition is a mechanism that can explain resilience to marine heatwaves and future ocean conditions in the habitat-forming seaweed Phyllospora comosa (Labillardière) C. Agardh. Glob. Change Biol. 26, 1–13.
Burton, V., Mitchell, H. K., Young, P., and Petersen, N. S. (1988). Heat shock protection against cold stress of Drosophila melanogaster. Mol. Cell. Biol. 8, 3550–3552. doi: 10.1128/mcb.8.8.3550
Clapp, D. F., Bhagwat, Y., and Wahl, D. H. (1997). The effect of thermal stress on walleye fry and fingerling mortality. N. Am. J. Fish. Manag. 17, 429–437. doi: 10.1577/1548-8675(1997)017<0429:teotso>2.3.co;2
Coello-Camba, A., and Agustí, S. (2017). Thermal thresholds of phytoplankton growth in polar waters and their consequences for a warming polar ocean. Front. Mar. Sci. 4:168. doi: 10.3389/fmars.2017.00168
Coleman, M. A., Minne, A. J., Vranken, S., and Wernberg, T. (2020). Genetic tropicalisation following a marine heatwave. Sci. Rep. 10, 1–11.
Collins, S., Boyd, P. W., and Doblin, M. A. (2020). Evolution, microbes, and changing ocean conditions. Annu. Rev. Mar. Sci. 12, 181–208. doi: 10.1146/annurev-marine-010318-095311
Deppeler, S. L., and Davidson, A. T. (2017). Southern Ocean phytoplankton in a changing climate. Front. Mar. Sci. 4:40. doi: 10.3389/fmars.2017.00040
Eakin, C. M., Morgan, J. A., Heron, S. F., Smith, T. B., Liu, G., Alvarez-Filip, L., et al. (2010). Caribbean corals in crisis: record thermal stress, bleaching, and mortality in 2005. PLoS One 5:e13969. doi: 10.1371/journal.pone.0013969
Feijão, E., Gameiro, C., Franzitta, M., Duarte, B., Caçador, I., Cabrita, M. T., et al. (2018). Heat wave impacts on the model diatom Phaeodactylum tricornutum: searching for photochemical and fatty acid biomarkers of thermal stress. Ecol. Ind. 95, 1026–1037. doi: 10.1016/j.ecolind.2017.07.058
Frölicher, T. L., Fischer, E. M., and Gruber, N. (2018). Marine heatwaves under global warming. Nature 560, 360–364. doi: 10.1038/s41586-018-0383-9
Frölicher, T. L., and Laufkötter, C. (2018). Emerging risks from marine heat waves. Nat. Commun. 9:650.
Garrison, H. S., and Tang, K. W. (2014). Effects of episodic turbulence on diatom mortality and physiology, with a protocol for the use of Evans Blue stain for live-dead determinations. Hydrobiologia, 738, 155–170.
Geider, R. J., Moore, C. M., and Ross, O. N. (2009). The role of cost–benefit analysis in models of phytoplankton growth and acclimation. Plant Ecol. Divers. 2, 165–178. doi: 10.1080/17550870903300949
Godhe, A., and Rynearson, T. (2017). The role of intraspecific variation in the ecological and evolutionary success of diatoms in changing environments. Philos. Trans. R. Soc. B Biol. Sci. 372:20160399. doi: 10.1098/rstb.2016.0399
Goto, S. G., and Kimura, M. T. (1998). Heat-and cold-shock responses and temperature adaptations in subtropical and temperate species of Drosophila. J. Insect Physiol. 44, 1233–1239. doi: 10.1016/s0022-1910(98)00101-2
Guillard, R. R. (1975). Culture of phytoplankton for feeding marine invertebrates. in Culture of marine invertebrate animals 29–60. Springer, Boston, MA.
Hayashida, H., Matear, R. J., and Strutton, P. G. (2020). Background nutrient concentration determines phytoplankton bloom response to marine heatwaves. Glob. Change Biol. 26, 4800–4811. doi: 10.1111/gcb.15255
Hobday, A. J., Alexander, L. V., Perkins, S. E., Smale, D., Straub, S., Oliver, E. C. J., et al. (2016). A hierarchical approach to defining marine heatwaves. Prog. Oceanogr. 141, 227–238. doi: 10.1016/j.pocean.2015.12.014
Huey, R. B., and Bennett, A. F. (1990). Physiological adjustments to fluctuating thermal environments: an ecological and evolutionary perspective. Stress Proteins Biol. Med. 1, 37–59.
Hughes, T. P., Kerry, J. T., Connolly, S. R., Baird, A. H., Eakin, C. M., Eakin, S. E., et al. (2019). Ecological memory modifies the cumulative impact of recurrent climate extremes. Nat. Clim. Change 9, 40–43. doi: 10.1038/s41558-018-0351-2
Jin, P., and Agustí, S. (2018). Fast adaptation of tropical diatoms to increased warming with trade-offs. Sci. Rep. 8, 1–10.
Jones, T., Parrish, J. K., Peterson, W. T., Bjorkstedt, E. P., Bond, N. A., Ballance, L. T., et al. (2018). Massive mortality of a planktivorous seabird in response to a marine heatwave. Geophys. Res. Lett. 45, 3193–3202. doi: 10.1002/2017gl076164
Kingsolver, J. G., and Woods, H. A. (2016). Beyond thermal performance curves: modeling time-dependent effects of thermal stress on ectotherm growth rates. Am. Nat. 187, 283–294. doi: 10.1086/684786
Krebs, R. A., and Feder, M. E. (1997). Deleterious consequences of Hsp70 overexpression in Drosphilla melanogaster larvae. Cell Stress Chaperones 2, 60–71. doi: 10.1379/1466-1268(1997)002<0060:dcohoi>2.3.co;2
Kremer, C. T. (2020). growthTools: Tools for Analyzing Time Series of Microbial Abundances to Estimate Growth Rates. R Package Version 0.1.2.
Kremer, C. T., Fey, S. B., Arellano, A. A., and Vasseur, D. A. (2018). Gradual plasticity alters population dynamics in variable environments: thermal acclimation in the green alga Chlamydomonas reinhartdii. Proc. R. Soc. B Biol. Sci. 285:20171942. doi: 10.1098/rspb.2017.1942
Kronholm, I., and Ketola, T. (2018). Effects of acclimation time and epigenetic mechanisms on growth of Neurospora in fluctuating environments. Heredity 121, 327–341. doi: 10.1038/s41437-018-0138-2
Lesser, M. P. (2006). Oxidative stress in marine environments: biochemistry and physiological ecology. Annu. Rev. Physiol. 68, 253–278. doi: 10.1146/annurev.physiol.68.040104.110001
Leung, P. T., Yi, A. X., Ip, J. C., Mak, S. S., and Leung, K. M. (2017). Photosynthetic and transcriptional responses of the marine diatom Thalassiosira pseudonana to the combined effect of temperature stress and copper exposure. Mar.Pollut. Bull. 124, 938–945. doi: 10.1016/j.marpolbul.2017.03.038
Lindberg, R. T., and Collins, S. (2020). Quality–quantity trade-offs drive functional trait evolution in a model microalgal ‘climate change winner’. Ecol. Lett. 23, 780–790. doi: 10.1111/ele.13478
Listmann, L., Leroch, M., Schlüter, L., Thomas, M. K., and Reusch, T. B. (2016). Swift thermal reaction norm evolution in a key marine phytoplankton species. Evol. Appl. 9, 1156–1164. doi: 10.1111/eva.12362
Low, J. S., Chew, L. L., Ng, C. C., Goh, H. C., Lehette, P., and Chong, V. C. (2018). Heat shock response and metabolic stress in the tropical estuarine copepod Pseudodiaptomus annandalei converge at its upper thermal optimum. J. Therm. Biol. 74, 14–22. doi: 10.1016/j.jtherbio.2018.02.012
Lugo, S. C. M., Baumeister, M., Nour, O. M., Wolf, F., Stumpp, M., and Pansch, C. (2020). Warming and temperature variability determine the performance of two invertebrate predators. Sci. Rep. 10, 1–14. doi: 10.1002/9781444300932.ch1
Luhring, T. M., and DeLong, J. P. (2017). Scaling from metabolism to population growth rate to understand how acclimation temperature alters thermal performance. Integr. Comp. Biol. 57, 103–111. doi: 10.1093/icb/icx041
Lyon, B., Barnston, A. G., Coffel, E., and Horton, R. M. (2019). Projected increase in the spatial extent of contiguous US summer heat waves and associated attributes. Environ. Res. Lett. 14:114029. doi: 10.1088/1748-9326/ab4b41
Madeira, D., Narciso, L., Cabral, H., Vinagre, C., and Diniz, M. (2013). Influence of temperature in thermal and oxidative stress responses in estuarine fish. Comp. Biochem. Physiol. Part A Mol. Integr. Physiol. 166, 237–243. doi: 10.1016/j.cbpa.2013.06.008
Magozzi, S., and Calosi, P. (2015). Integrating metabolic performance, thermal tolerance, and plasticity enables for more accurate predictions on species vulnerability to acute and chronic effects of global warming. Glob. Change Biol. 21, 181–194. doi: 10.1111/gcb.12695
Marbà, N., and Duarte, C. M. (2010). Mediterranean warming triggers seagrass (Posidonia oceanica) shoot mortality. Glob. Change Biol. 16, 2366–2375. doi: 10.1111/j.1365-2486.2009.02130.x
Medlin, L., Elwood, H. J., Stickel, S., and Sogin, M. L. (1988). The characterization of enzymatically amplified eukaryotic 16S-like rRNA-coding regions. Gene 71, 491–499. doi: 10.1016/0378-1119(88)90066-2
Mock, T., Otillar, R. P., Strauss, J., McMullan, M., Paajanen, P., Schmutz, J., et al. (2017). Evolutionary genomics of the cold-adapted diatom Fragilariopsis cylindrus. Nature 541, 536–540.
Montie, S., Thomsen, M. S., Rack, W., and Broady, P. A. (2020). Extreme summer marine heatwaves increase chlorophyll a in the Southern Ocean. Antarct. Sci. 32, 1–2.
O’Donnell, D. R., Hamman, C. R., Johnson, E. C., Kremer, C. T., Klausmeier, C. A., and Litchman, E. (2018). Rapid thermal adaptation in a marine diatom reveals constraints and trade-offs. Glob. Change Biol. 24, 4554–4565. doi: 10.1111/gcb.14360
Oliver, E. C., Burrows, M. T., Donat, M. G., Sen Gupta, A., Alexander, L. V., Perkins-Kirkpatrick, S. E., et al. (2019). Projected marine heatwaves in the 21st century and the potential for ecological impact. Front. Mar. Sci. 6:734. doi: 10.3389/fmars.2019.00734
Padfield, D., Yvon-Durocher, G., Buckling, A., Jennings, S., and Yvon-Durocher, G. (2016). Rapid evolution of metabolic traits explains thermal adaptation in phytoplankton. Ecol. Lett. 19, 133–142. doi: 10.1111/ele.12545
Pancic, M., Hansen, P. J., Tammilehto, A., and Lundholm, N. (2015). Resilience to temperature and pH changes in a future climate change scenario in six strains of the polar diatom Fragilariopsis cylindrus. Biogeosciences 12, 4235–4244. doi: 10.5194/bg-12-4235-2015
Pansch, C., Scotti, M., Barboza, F. R., Al-Janabi, B., Brakel, J., Briski, E., et al. (2018). Heat waves and their significance for a temperate benthic community: a near-natural experimental approach. Glob. Change Biol. 24, 4357–4367. doi: 10.1111/gcb.14282
Pargana, A., Musacchia, F., Sanges, R., Russo, M. T., Ferrante, M. I., Bowler, C., et al. (2020). Intraspecific diversity in the cold stress response of transposable elements in the diatom Leptocylindrus aporus. Genes 11:9. doi: 10.3390/genes11010009
Peña, M. A., Nemcek, N., and Robert, M. (2019). Phytoplankton responses to the 2014–2016 warming anomaly in the northeast subarctic Pacific Ocean. Limnol. Oceanogr. 64, 515–525. doi: 10.1002/lno.11056
Piatt, J. F., Parrish, J. K., Renner, H. M., Schoen, S. K., Jones, T. T., Arimitsu, M. L., et al. (2020). Extreme mortality and reproductive failure of common murres resulting from the northeast Pacific marine heatwave of 2014-2016. PLoS One 15:e0226087. doi: 10.1371/journal.pone.0226087
R Core Team (2019). R: A Language and Environment for Statistical Computing. Vienna: R Foundation for Statistical Computing.
Remy, M., Hillebrand, H., and Flöder, S. (2017). Stability of marine phytoplankton communities facing stress related to global change: Interactive effects of heat waves and turbidity. J. Exp. Mar. Biol. Ecol. 497, 219–229. doi: 10.1016/j.jembe.2017.10.002
Rhee, G. Y., and Gotham, I. J. (1981). The effect of environmental factors on phytoplankton growth: temperature and the interactions of temperature with nutrient limitation 1. Limnol. Oceanogr. 26, 635–648. doi: 10.4319/lo.1981.26.4.0635
Roberts, S. D., Van Ruth, P., Wilkinson, C., Bastianello, S. B., and Bansemer, M. S. (2019). Marine heatwave, harmful algae blooms and an extensive fish kill event during 2013 in South Australia. Front. Mar. Sci. 6:610. doi: 10.3389/fmars.2019.00610
Robinson, S. A., Klekociuk, A. R., King, D. H., Rojas, M. P., Zúñiga, G. E., and Bergstrom, D. M. (2020). The 2019/2020 summer of Antarctic heatwaves. Glob. Change Biol. 26, 1–3.
Rohini, P., Rajeevan, M., and Mukhopadhay, P. (2019). Future projections of heat waves over India from CMIP5 models. Clim. Dyn. 53, 975–988. doi: 10.1007/s00382-019-04700-9
Rousch, J. M., Bingham, S. E., and Sommerfeld, M. R. (2004). Protein expression during heat stress in thermo-intolerant and thermo-tolerant diatoms. J. Exp. Mar. Biol. Ecol. 306, 231–243. doi: 10.1016/j.jembe.2004.01.009
Ryan, J., Kudela, R., Birch, J., Blum, M., Bowers, H., Chavez, F. P., et al. (2017). Causality of an extreme harmful algal bloom in Monterey Bay, California, during the 2014–2016 northeast Pacific warm anomaly. Geophys. Res. Lett. 44, 5571–5579. doi: 10.1002/2017gl072637
Saha, M., Barboza, F. R., Somerfield, P. J., Al-Janabi, B., Beck, M., Brakel, J., et al. (2019). Response of foundation macrophytes to near-natural simulated marine heatwaves. Glob. Change Biol. 26, 417–430. doi: 10.1111/gcb.14801
Samuels, T., Rynearson, T. A., and Collins, S. (2020). Surviving heatwaves: thermal experience predicts life and death in a Southern Ocean diatom. bioRxiv [Preprint]. doi: 10.1101/2020.08.25.264028
Sasaki, M. C., and Dam, H. G. (2019). Integrating patterns of thermal tolerance and phenotypic plasticity with population genetics to improve understanding of vulnerability to warming in a widespread copepod. Glob. Change Biol. 25, 4147–4164. doi: 10.1111/gcb.14811
Scharf, I., Galkin, N., and Halle, S. (2015). Disentangling the consequences of growth temperature and adult acclimation temperature on starvation and thermal tolerance in the red flour beetle. Evol. Biol. 42, 54–62. doi: 10.1007/s11692-014-9298-z
Scharf, I., Wexler, Y., Macmillan, H. A., Presman, S., Simson, E., and Rosenstein, S. (2016). The negative effect of starvation and the positive effect of mild thermal stress on thermal tolerance of the red flour beetle. Tribolium castaneum. Sci. Nat. 103:20.
Schaum, C.-E., Buckling, A., Smirnoff, N., Studholme, D., and Yvon-Durocher, G. (2018). Environmental fluctuations accelerate molecular evolution of thermal tolerance in a marine diatom. Nat. Commun. 9, 1–14. doi: 10.1016/j.marmicro.2007.05.002
Schaum, E., Rost, B., Millar, A. J., and Collins, S. (2013). Variation in plastic responses of a globally distributed picoplankton species to ocean acidification. Nat. Clim. Change 3, 298–302. doi: 10.1038/nclimate1774
Schroda, M., Hemme, D., and Mühlhaus, T. (2015). The Chlamydomonas heat stress response. Plant J. 82, 466–480.
Schulte, P. M., Healy, T. M., and Fangue, N. A. (2011). Thermal performance curves, phenotypic plasticity, and the time scales of temperature exposure. Integr. Comp. Biol. 51, 691–702. doi: 10.1093/icb/icr097
Seebacher, F., Ducret, V., Little, A. G., and Adriaenssens, B. (2015). Generalist–specialist trade-off during thermal acclimation. R. Soc. Open Sci. 2:140251. doi: 10.1098/rsos.140251
Short, J., Foster, T., Falter, J., Kendrick, G. A., and Mcculloch, M. T. (2015). Crustose coralline algal growth, calcification and mortality following a marine heatwave in Western Australia. Cont. Shelf Res. 106, 38–44.
Siegel, P., Baker, K. G., Low-Décarie, E., and Geider, R. J. (2020). High predictability of direct competition between marine diatoms under different temperatures and nutrient states. Ecol. Evol. 10, 7276–7290.
Siegle, M. R., Taylor, E. B., and O’connor, M. I. (2018). Prior heat accumulation reduces survival during subsequent experimental heat waves. J. Exp. Mar. Biol. Ecol. 501, 109–117.
Smale, D. A., Wernberg, T., Oliver, E. C., Thomsen, M., Harvey, B. P., Straub, S. C., et al. (2019). Marine heatwaves threaten global biodiversity and the provision of ecosystem services. Nat. Clim. Change 9, 306–312.
Sokolova, I. M., Frederich, M., Bagwe, R., Lannig, G., and Sukhotin, A. A. (2012). Energy homeostasis as an integrative tool for assessing limits of environmental stress tolerance in aquatic invertebrates. Mar. Environ. Res. 79, 1–15.
Sørensen, J. G., Loeschcke, V., and Kristensen, T. N. (2013). Cellular damage as induced by high temperature is dependent on rate of temperature change–investigating consequences of ramping rates on molecular and organismal phenotypes in Drosophila melanogaster. J. Exp. Biol. 216, 809–814.
Staehr, P. A., and Birkeland, M. J. (2006). Temperature acclimation of growth, photosynthesis and respiration in two mesophilic phytoplankton species. Phycologia 45, 648–656.
Strock, J. S., and Menden-Deuer, S. (2020). Temperature acclimation alters phytoplankton growth and production rates. Limnol. Oceanogr. 9999, 1–13.
Stuhr, M., Reymond, C. E., Rieder, V., Hallock, P., Rahnenführer, J., Westphal, H., et al. (2017). Reef calcifiers are adapted to episodic heat stress but vulnerable to sustained warming. PLoS One 12:e0179753. doi: 10.1371/journal.pone.0179753
Thomas, M. K., Aranguren-Gassis, M., Kremer, C. T., Gould, M. R., Anderson, K., Klausmeier, C. A., et al. (2017). Temperature–nutrient interactions exacerbate sensitivity to warming in phytoplankton. Glob. Change Biol. 23, 3269–3280.
Thomas, M. K., Kremer, C. T., Klausmeier, C. A., and Litchman, E. (2012). A global pattern of thermal adaptation in marine phytoplankton. Science 338, 1085–1088.
Viant, M., Werner, I., Rosenblum, E., Gantner, A., Tjeerdema, R., and Johnson, M. (2003). Correlation between heat-shock protein induction and reduced metabolic condition in juvenile steelhead trout (Oncorhynchus mykiss) chronically exposed to elevated temperature. Fish Physiol. Biochem. 29, 159–171.
von Biela, V. R., Arimitsu, M. L., Piatt, J. F., Heflin, B., Schoen, S. K., Trowbridge, J. L., et al. (2019). Extreme reduction in nutritional value of a key forage fish during the Pacific marine heatwave of 2014-2016. Mar. Ecol. Prog. Ser. 613, 171–182.
Voolstra, C. R., Buitrago-López, C., Perna, G., Cárdenas, A., Hume, B. C., Rädecker, N., et al. (2020). Standardized short-term acute heat stress assays resolve historical differences in coral thermotolerance across microhabitat reef sites. Glob. Change Biol. 26, 4328–4343.
Voznesenskiy, S., Popik, A. Y., Gamayunov, E., Markina, Z. V., and Orlova, T. Y. (2016). The dependence of phytoplankton fluorescence on the thermal stress factor. Biophysics 61, 73–77.
Wolf, K. K., Hoppe, C. J., and Rost, B. (2018). Resilience by diversity: Large intraspecific differences in climate change responses of an Arctic diatom. Limnol. Oceanogr. 63, 397–411.
Xu, K., Fu, F. X., and Hutchins, D. A. (2014). Comparative responses of two dominant Antarctic phytoplankton taxa to interactions between ocean acidification, warming, irradiance, and iron availability. Limnol. Oceanogr. 59, 1919–1931.
Zhang, Y., Klapper, R., Lohbeck, K. T., Bach, L. T., Schulz, K. G., Reusch, T. B., et al. (2014). Between-and within-population variations in thermal reaction norms of the coccolithophore Emiliania huxleyi. Limnol. Oceanogr. 59, 1570–1580.
Keywords: marine diatoms (Bacillariophyceae), thermal acclimation, marine heatwaves, growth rates, mortality, Southern Ocean, Actinocyclus
Citation: Samuels T, Rynearson TA and Collins S (2021) Surviving Heatwaves: Thermal Experience Predicts Life and Death in a Southern Ocean Diatom. Front. Mar. Sci. 8:600343. doi: 10.3389/fmars.2021.600343
Received: 29 August 2020; Accepted: 05 January 2021;
Published: 27 January 2021.
Edited by:
Michael Raatz, Max Planck Institute for Evolutionary Biology, GermanyReviewed by:
Miriam Gerhard, Institute for Chemistry and Biology of the Marine Environment, GermanyPeng Jin, Guangzhou University, China
Anke Kremp, Leibniz Institute for Baltic Sea Research (LG), Germany
Copyright © 2021 Samuels, Rynearson and Collins. This is an open-access article distributed under the terms of the Creative Commons Attribution License (CC BY). The use, distribution or reproduction in other forums is permitted, provided the original author(s) and the copyright owner(s) are credited and that the original publication in this journal is cited, in accordance with accepted academic practice. No use, distribution or reproduction is permitted which does not comply with these terms.
*Correspondence: Sinéad Collins, cy5jb2xsaW5zQGVkLmFjLnVr
†ORCID: Toby Samuels, orcid.org/0000-0001-9850-1230; Tatiana A. Rynearson, orcid.org/0000-0003-2951-0066; Sinéad Collins, orcid.org/0000-0003-3856-4285