
95% of researchers rate our articles as excellent or good
Learn more about the work of our research integrity team to safeguard the quality of each article we publish.
Find out more
ORIGINAL RESEARCH article
Front. Mar. Sci. , 23 April 2021
Sec. Physical Oceanography
Volume 8 - 2021 | https://doi.org/10.3389/fmars.2021.598101
This article is part of the Research Topic Island Dynamical Systems: Atmosphere, Ocean and Biogeochemical Processes View all 13 articles
 Alex Costa da Silva1*
 Alexis Chaigneau2,3,4
 Alina N. Dossa1
 Gerard Eldin2
 Moacyr Araujo1,5
 Arnaud Bertrand6
Using current, hydrographic and satellite observations collected off Northeast Brazil around the Fernando de Noronha Archipelago and Rocas Atoll during two oceanographic cruises (spring 2015 and fall 2017), we investigated the general oceanic circulation and its modifications induced by the islands. In spring 2015, the area was characterized by lower SST (26.6°C) and deep mixed-layer (∼90 m). At this depth, a strong current shear was observed between the central branch of the eastward flowing near-surface South Equatorial Current and the westward flowing South Equatorial Undercurrent. In contrast, in fall 2017, SST was higher (∼28.8°C) and the mixed-layer shallower (∼50 m). The shear between the central South Equatorial Current and the South Equatorial Undercurrent was weaker during this period. Interestingly, no oxygen-rich water from the south (retroflection of the North Brazil undercurrent) was observed in the region in fall 2017. In contrast, we revealed the presence of an oxygen-rich water entrained by the South Equatorial Undercurrent reaching Rocas Atoll in spring 2015. Beside these global patterns, island wake effects were noted. The presence of islands, in particular Fernando de Noronha, strongly perturbs central South Equatorial Current and South Equatorial Undercurrent features, with an upstream core splitting and a reorganization of single current core structures downstream of the islands. Near islands, flow disturbances impact the thermohaline structure and biogeochemistry, with a negative anomaly in temperature (−1.3°C) and salinity (−0.15) between 200 and 400 m depth in the southeast side of Fernando Noronha (station 5), where the fluorescence peak (>1.0 mg m–3) was shallower than at other stations located around Fernando de Noronha, reinforcing the influence of flow-topography. Satellite maps of sea-surface temperature and chlorophyll-a confirmed the presence of several submesoscale features in the study region. Altimetry data suggested the presence of a cyclonic mesoscale eddy around Rocas Atoll in spring 2015. A cyclonic vortex (radius of 28 km) was actually observed in subsurface (150–350 m depth) southeast of Rocas Atoll. This vortex was associated with topographically induced South Equatorial Undercurrent flow separation. These features are likely key processes providing an enrichment from the subsurface to the euphotic layer near islands, supplying local productivity.
The tropical Atlantic presents a relatively strong static stability with a well-marked thermocline, which is seasonally modulated by the meridional displacement of the Intertropical Convergence Zone (ITCZ), controlling the regime of precipitation and trade winds (Araujo et al., 2011; Nogueira Neto et al., 2018; Assunção et al., 2020). In such regions, vertical mixing, and upwelling are usually restricted to local mechanisms such as divergence of currents, winds and interactions between ocean currents and topography. Interactions between currents and topography, such as oceanic islands and seamounts, can lead to the generation of (sub)mesoscale eddies, changes in current intensity and directions, disturbances of the thermohaline structure, or orographically-induced upwelling [e.g., the special issues dealing with flow encountering abrupt topography (Oceanography, 2019; Vol. 32, No 4) and bio-physical coupling around seamounts (Deep-Sea Research, 2020; Vol. 176)]. This kind of processes is observed in the western tropical Atlantic off northeast Brazil around the oceanic islands of Fernando de Noronha Archipelago (FN) and the Rocas Atoll (RA) (Lessa et al., 1999; Travassos et al., 1999; Chaves et al., 2006; Tchamabi et al., 2017, 2018).
FN and RA, located ∼350 km from the mainland (Figure 1) encompass oceanic ecosystems classified as “Ecologically or Biologically significant Marine Areas (EBSAs)”1. Oceanic areas nearby FN and RA are energetic regions subjected to strong seasonally driven features, such as the complex system of zonal equatorial currents and countercurrents, the confluence of water masses, or the trade winds systems (Araujo et al., 2011; Tchamabi et al., 2017, 2018; Foltz et al., 2019). The principal currents of the region are the central branch of the South Equatorial Current (cSEC) located north of the South Equatorial Countercurrent, and the South Equatorial Undercurrent (SEUC) centered at about 4°S (Figure 1). These zonal currents flow in opposite direction, with cSEC flowing westwards and SEUC flowing eastwards (Silveira et al., 1994; Stramma and Schott, 1999; Lumpkin and Garzoli, 2005). The near-surface circulation in the region is mostly driven by the meridional migration of the ITCZ. In austral winter (June to August), the ITCZ is located north of the equator and trade winds are stronger. Conversely, in austral fall (March-May), the ITCZ is located close to the equator and the winds are relaxed (Servain et al., 2014; Hounsou-Gbo et al., 2015, 2019). The seasonal ITCZ displacement also influences precipitation regime at FN and RA, with a rainy season extending from March to July, and a dry season extending from August to January (Assunção et al., 2016).
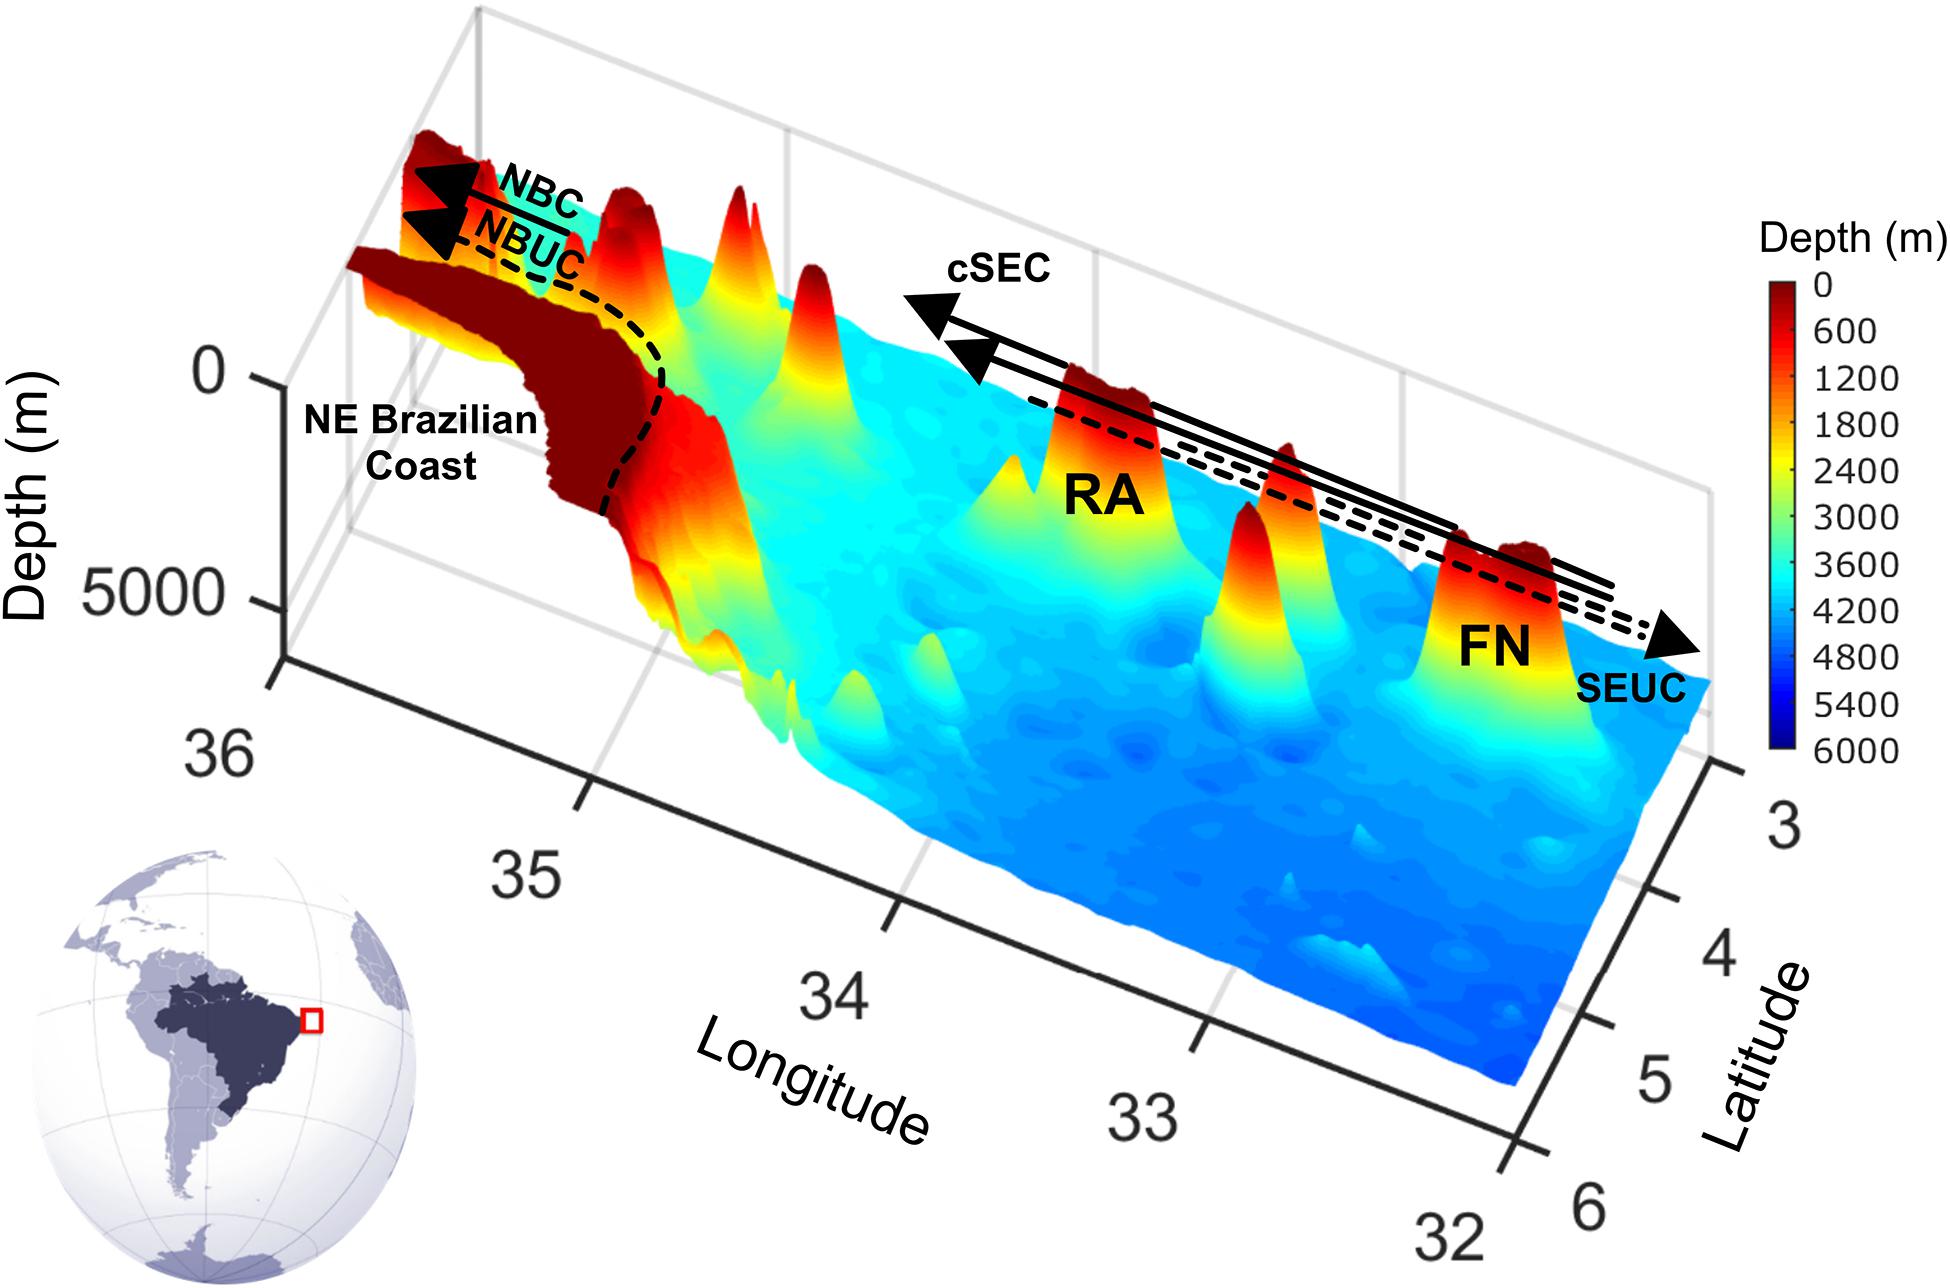
Figure 1. Map of the study area in the western Tropical Atlantic Ocean off northeast Brazil (also indicated by the red box on the globe). General bathymetric (colour scale) is shown at 0–6,000 m depth. Surface and subsurface currents are represented by solid and dashed lines, respectively. RA, Rocas Atoll; FN, Fernando de Noronha Archipelago; cSEC, central branch of the South Equatorial Current, SEUC, South Equatorial Undercurrent, NBC, North Brazil Current; NBUC, North Brazil Undercurrent.
In the western tropical Atlantic, many complex physical processes around oceanic island wake are not well described because most of survey efforts have focused on broader processes. The main large-scale currents were well identified by several historical programs developed along the western edge of the tropical Atlantic (e.g., the Global Atmospheric Research Program—GARP; Atlantic Tropical Experiment—GATE; Francais Océan Climat Atlantique Equatorial—FOCAL; Prediction and Research moored Array in the Tropical Atlantic—PIRATA programs, and the ETAMBOT and CITHER projects). Although numerous, all those previous initiatives focused on a large-scale picture of the tropical Atlantic circulation and knowledge about the interaction of the large-scale currents with RA and FN is still scarce. To provide a detailed picture of the current-island interactions, here we use current, hydrographic, and satellite data collected during the Acoustic along the BRAzilian COaSt (ABRACOS) cruises in Austral spring 2015 and fall 2017 (Bertrand et al., 2015; 2017). These two periods were found to be representative of canonical spring and fall conditions in the area (Assunção et al., 2020; Dossa et al., 2021). More specifically, we describe the upper-ocean circulation around FN and RA and highlight some mesoscale features observed on currents, thermohaline structure and primary productivity.
In situ data were collected during the two ABRACOS surveys carried out onboard the French R/V Antea in austral spring 2015 (ABRACOS 1, 30 September—08 October 2015) and fall 2017 (ABRACOS 2, 26 April—03 May 2017) (Figure 2). The in situ datasets described below are publically available (Bertrand et al., 2015, 2017).
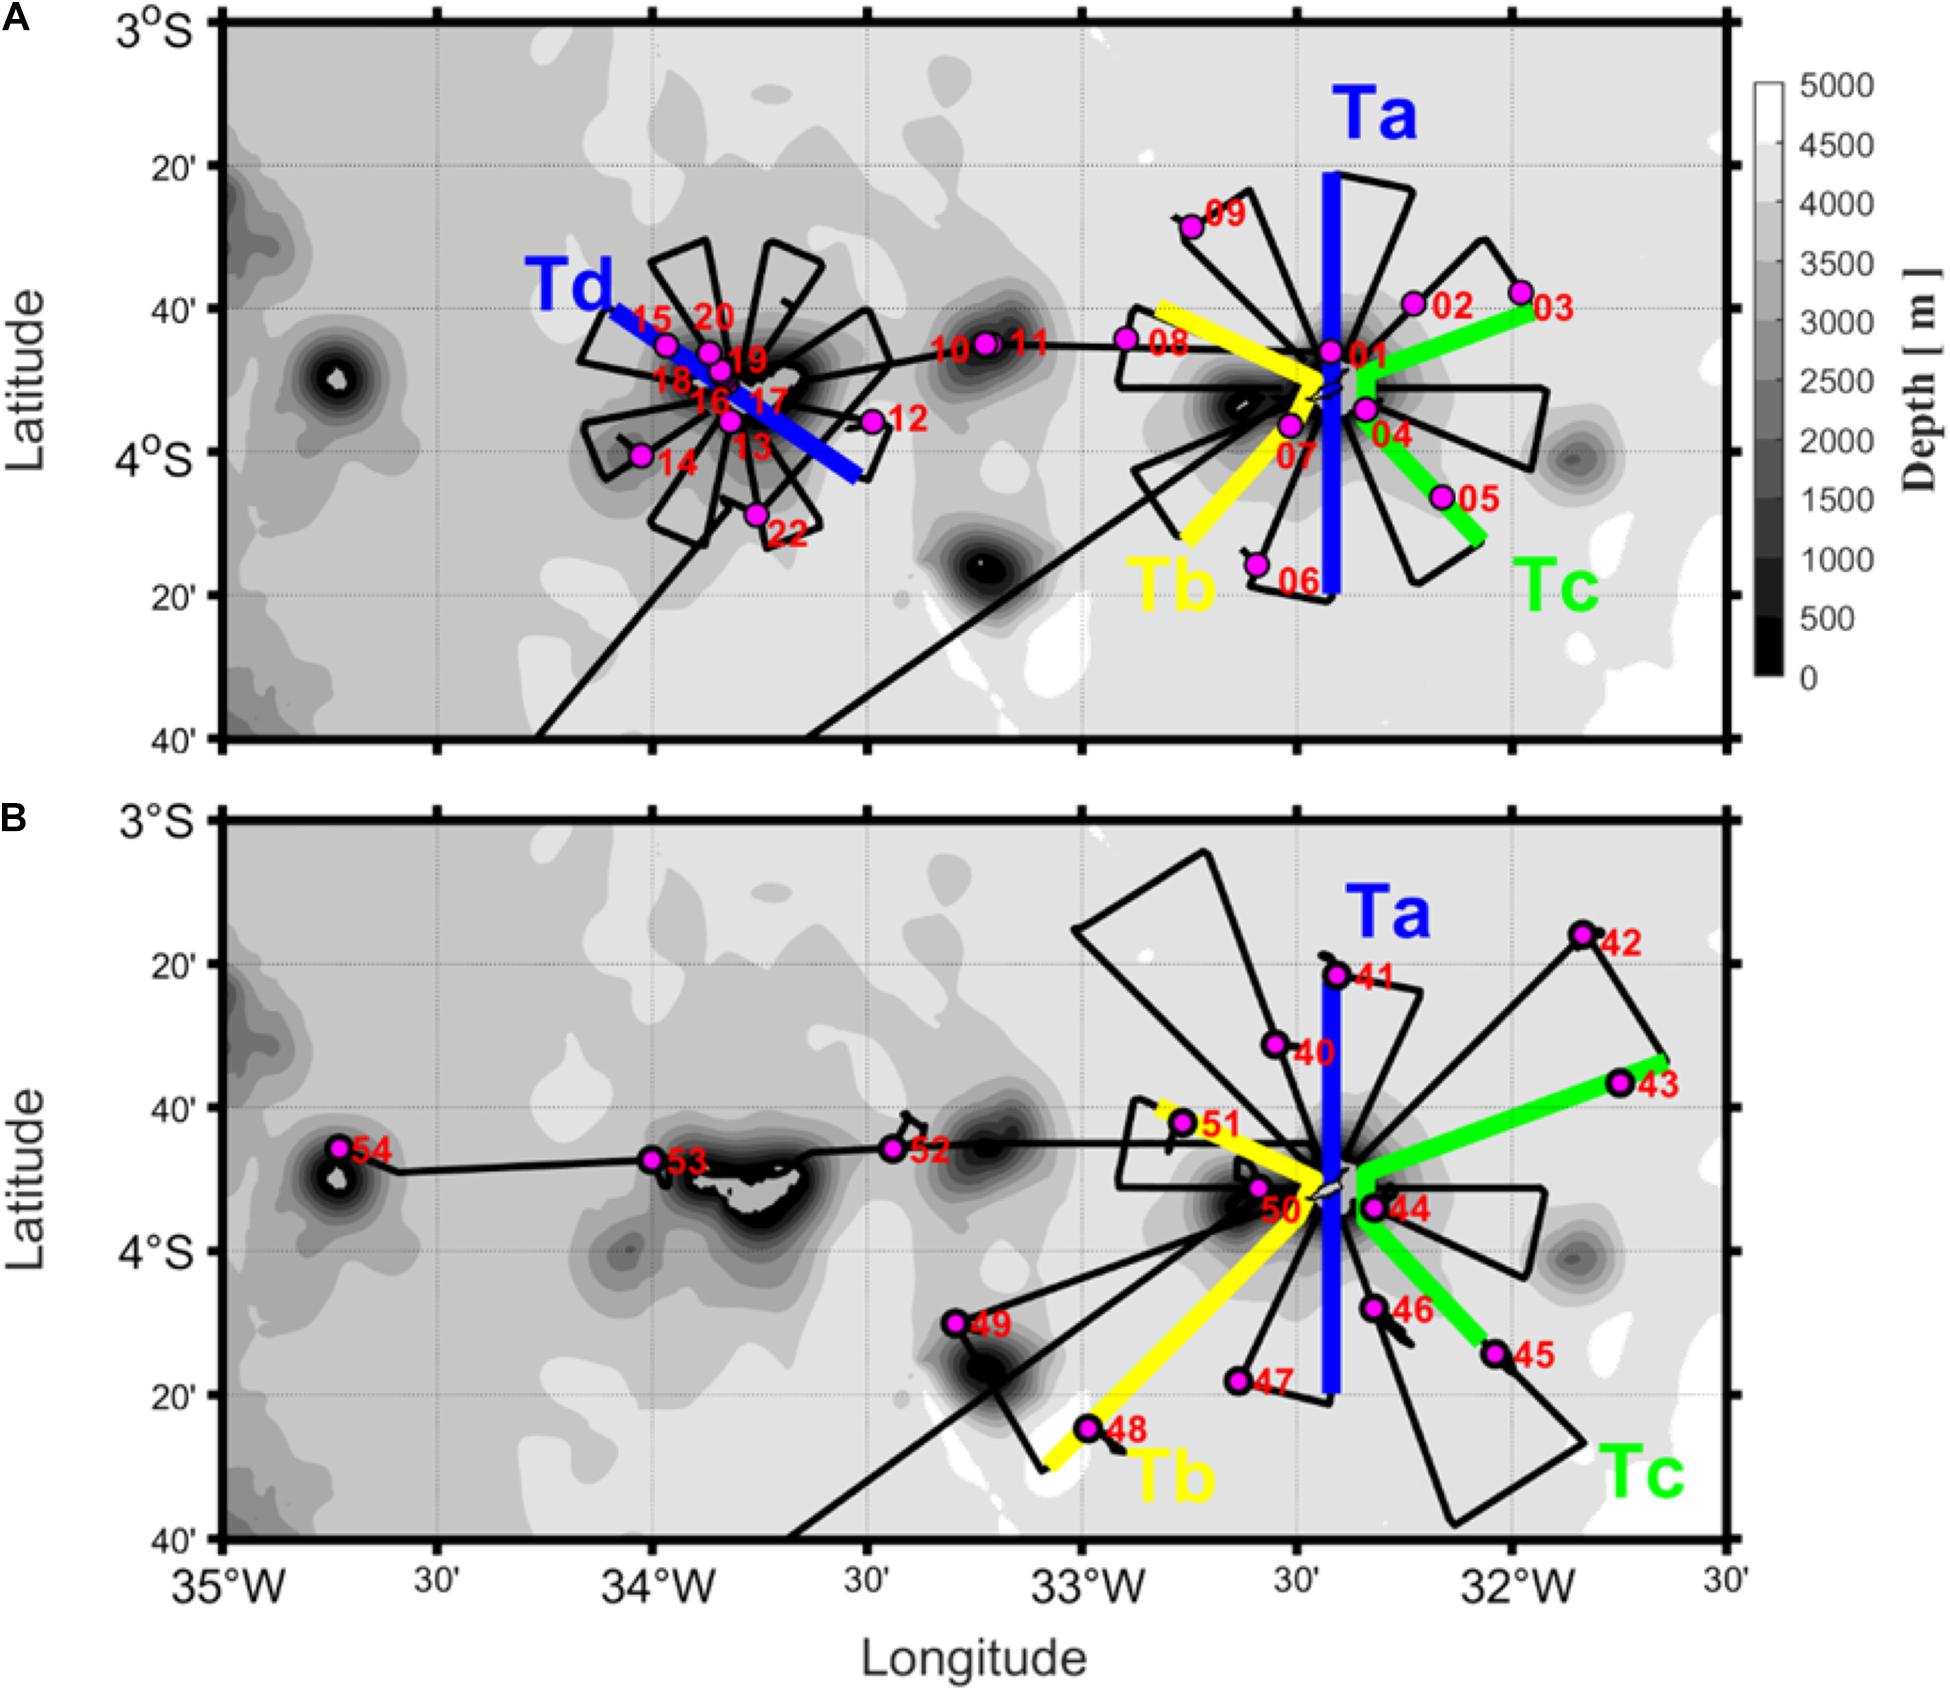
Figure 2. Bathymetric maps of the study area with SADCP sections (black solid lines) acquired during ABRAÇOS 1 in spring 2015 (A) and ABRACOS 2 in fall 2017 (B). The thick blue lines (Ta) indicate the transect detailed in section “Circulation Patterns.” The thick yellow lines (Tb), the thick green lines (Tc) and the thick blue lines (Td) indicate the transects discussed in section “Discussion.” Pink dots show the positions of the CTD profiles.
Vertical profiles of physical and biogeochemical parameters were collected from the surface to 1,000 m depth using a Seabird SBE911+ conductivity temperature depth (CTD) probe equipped with dissolved oxygen (SBE43) and fluorescence (Wetlabs®ECO) sensors. Data were acquired at a frequency of 24 Hz and averaged every 0.1 dbar. All the sensors were laboratory-calibrated before and after each cruise. In the study area, a total of 20 (15, respectively) CTD profiles were acquired during ABRACOS 1 (ABRACOS 2) (Figure 2). Conductivity, temperature, pressure, and dissolved oxygen accuracies are of 3 mS/m, 0.001°C, 0.7 dbar, and 0.09 ml l–1, respectively. The fluorescence sensor measures chlorophyll concentration in the range 0–125 mg m–3 with a sensitivity of 0.02 mg m–3. A total of 30 water samples (15 for each survey) were collected using Niskin bottles to determine dissolved oxygen (DO) concentrations using the Winkler titration method (Grasshoff et al., 1983).
In order to investigate the stability of the water column, the Brunt-Väisälä (N) frequency was computed from temperature and salinity profiles, using the equation:
where z is depth (in m), g is gravity, ρ is density and ρ0 = 1,025 kg m–3 is the reference density. Seawater density was based on the atmosphere International Equation of State of Seawater (UNESCO, 1981).
We use vertical profiles of current velocity and hydrographic data to calculate the Richardson number. The Richardson number (Ri) is a measure of the dynamic stability associated with the competing effects of stratification and shear in the flow. It is expressed as the ratio of the vertical gradient of buoyancy over the vertical shear of horizontal velocity:
The vortex Rossby Number (Ro) is used to compare the local relative vorticity of the eddy to the planetary vorticity (Eq. 3). Rossby number and Burger number were used to determine the significance of Coriolis acceleration and stratification, respectively, and their impacts on flow dynamics.
Where f is the Coriolis parameter, U is the maximum velocity and L is the horizontal length scale of the vortex.
The Burger number (Eq. 4) (Pedlosky, 1987) is a dimensionless parameter related to the aspect ratio (H/L), where H is the vertical length scale of the vortex. The Burger number can also be defined as the square of the ratio of the deformation radius to the horizontal scale of the vortex. The Rossby deformation radius is given in Eq. 5.
Vertical profiles of current velocity were continuously acquired along the ship track using a ship-mounted Acoustic Doppler Current Profiler (SADCP) from Teledyne-RDI (OS75 instrument). Raw SADCP data were collected every 3 s in deep water (water-depth < 150 m), and every 1 s in shallow water (water-depth < 150 m) using a vertical bin length of 8 m, and averaged into 10 min profiles. SADCP data were processed and edited using the Common Ocean Data Access System (CODAS) software package developed by the SOEST, University of Hawaii2. The relative velocities were rotated from the transducer to the Earth reference frame using the ship gyrocompass. The global positioning system (GPS) was used to retrieve the absolute current velocities. The orientation of the transducer relative to the gyroscopic compass and an amplitude correction factor for the SADCP were determined by standard calibration procedures (Joyce, 1989; Pollard and Read, 1989). Finally, velocity profiles were averaged hourly, providing profiles in the 19–600 m range.
To better describe the main currents, we separated the data into 2 layers: the surface layer (0–100 m depth), which includes the cSEC, and the subsurface layer (100–400 m depth), where mainly the SEUC is present.
To provide a more comprehensive image of dynamical processes acting around FN and RA and help the interpretation of results obtained from in situ data, several satellite products distributed by the Copernicus Marine Environment Monitoring Service (CMEMS)3 were extracted in the study region for the periods corresponding to the ABRACOS cruises. The sea surface temperature (SST) product is the so-called OSTIA (Operational SST and Ice Analysis) that combines satellite and in situ data. This SST product is daily available from 1 October 1981 to 31 December 2018 on a regular grid of 0.05° resolution (Donlon et al., 2012). Sea-surface chlorophyll-a (Chl-a) concentration maps were from the Copernicus-GlobColour product provided by the ACRI-ST company. Chl-a was obtained from the merging of multi sensors such as SeaWiFS, MODIS, and MERIS. This product is daily available from 2007 to the present with a spatial resolution of 4 km (Garnesson, 2013). Wind-stress data were produced by CERSAT/IFREMER and consist on a blended wind dataset based on remotely sensed surface winds derived from scatterometters and radiometers. It spans from 1992 to present and is daily available on a regular grid of 0.25° (Bentamy and Croizé-Fillon, 2011). Altimetry data is the Salto/Duacs gridded product of sea-surface height (SSH) and derived geostrophic currents. This product, available from January 1993 to the present, was computed from several multimissions altimeter measurements of SSH, interpolated daily onto a 0.25° × 0.25° longitude/latitude grid (Ducet et al., 2000; Pujol et al., 2016; Taburet et al., 2019).
Based on the thermohaline properties observed during spring 2015 (Figures 3A,C) and fall 2017 (Figures 3B,D) and previous works (Schott et al., 1998; Stramma and Schott, 1999) four main water masses were identified in the 0–1,000 m depth-range: the Tropical Surface Water (TSW), the Subtropical Underwater (SUW), the South Atlantic Central Water (SACW), and the Antarctic Intermediate Water (AAIW). The TSW is located on the surface layer above the σθ = 24.5 kg m–3 isopycnal, located at about 100 m depth. During spring 2015 (Figures 3A,C) the TSW was characterized by relatively high values of temperature (>26°C), dissolved oxygen (4.3–5.0 ml l–1), and relatively low values of fluorescence (<1 mg m–3) and salinity (<36.5) in the mixed layer (limited to ∼90 m depth). During fall 2017, the mixed layer was shallower (∼50 m depth), and TSW was characterized by temperature higher than 27°C, salinity lower than 36.5, dissolved oxygen concentrations between 4.3 and 4.7 ml l–1 and fluorescence in the range 0–0.9 mg m–3 (Figures 3B,D). At both seasons, just below the TSW between σθ = 24.5 kg m–3 and σθ = 25.5 kg m–3, lied the SUW characterized by a local maximum in salinity (>36.5) (Figure 3). This water-mass, which was more clearly observed in spring 2015 than in fall 2017, is also characterized by relatively high oxygen (>4 ml l–1) and fluorescence (>0.5 mg m–3) values.

Figure 3. Temperature–salinity diagram obtained from ABRACOS hydrographic stations collected during spring 2015 (A,C) and fall 2017 (B,D) around RA and FN. Color-coded for dissolved oxygen concentration (A,B) and fluorescence (C,D). Isolines are the potential density anomaly contours referenced to the surface pressure.
Below the SUW, takes place the SACW characterized by a nearly linear temperature-salinity relationship covering wide temperature (10–20°C) and salinity (34.9–36.2) ranges. This water-mass was associated with a relative oxygen minimum of 3.3–3.5 ml l–1 (2.3–2.7 ml l–1, respectively) during spring 2015 (fall 2017) at 150–500 m depth. At these depths, fluorescence values were weak due to light limitation. Finally, the isopycnal σθ = 27.1 kg m–3 (about 500 m) marks the transition between SACW and AAIW. AAIW is characterized by a local salinity minimum of ∼34.5 and a local oxygen maximum of ∼3–3.5 ml l–1. Fluorescence is almost zero at the depth of the AAIW.
In the surface layer, the mixed-layer containing TSW was spatially very homogeneous and characterized by a mean SST of 26.7°C (28.8°C, respectively) in spring 2015 (fall 2017) (Figures 4A, 5A, 6A). Surface salinity was also higher in spring 2015 (∼36.2) than in fall 2017 (∼ 35.9) (Figures 4B, 5B, 6B). Below, a sharp thermocline-halocline was observed with an upper limit at ∼90 and 50 m in spring 2015 and fall 2017, respectively (Figures 4A, 5A, 6A). The seasonal thermocline extended down to ∼150 m in spring 2015 and to ∼100 m depth in fall 2017. During both cruises, a thin layer with maximum salinity (≥36.7 and ≥36.3) was present at ∼80–120 m and ∼60–90 m, respectively (Figures 4B, 5B, 6B), associated with SUW.
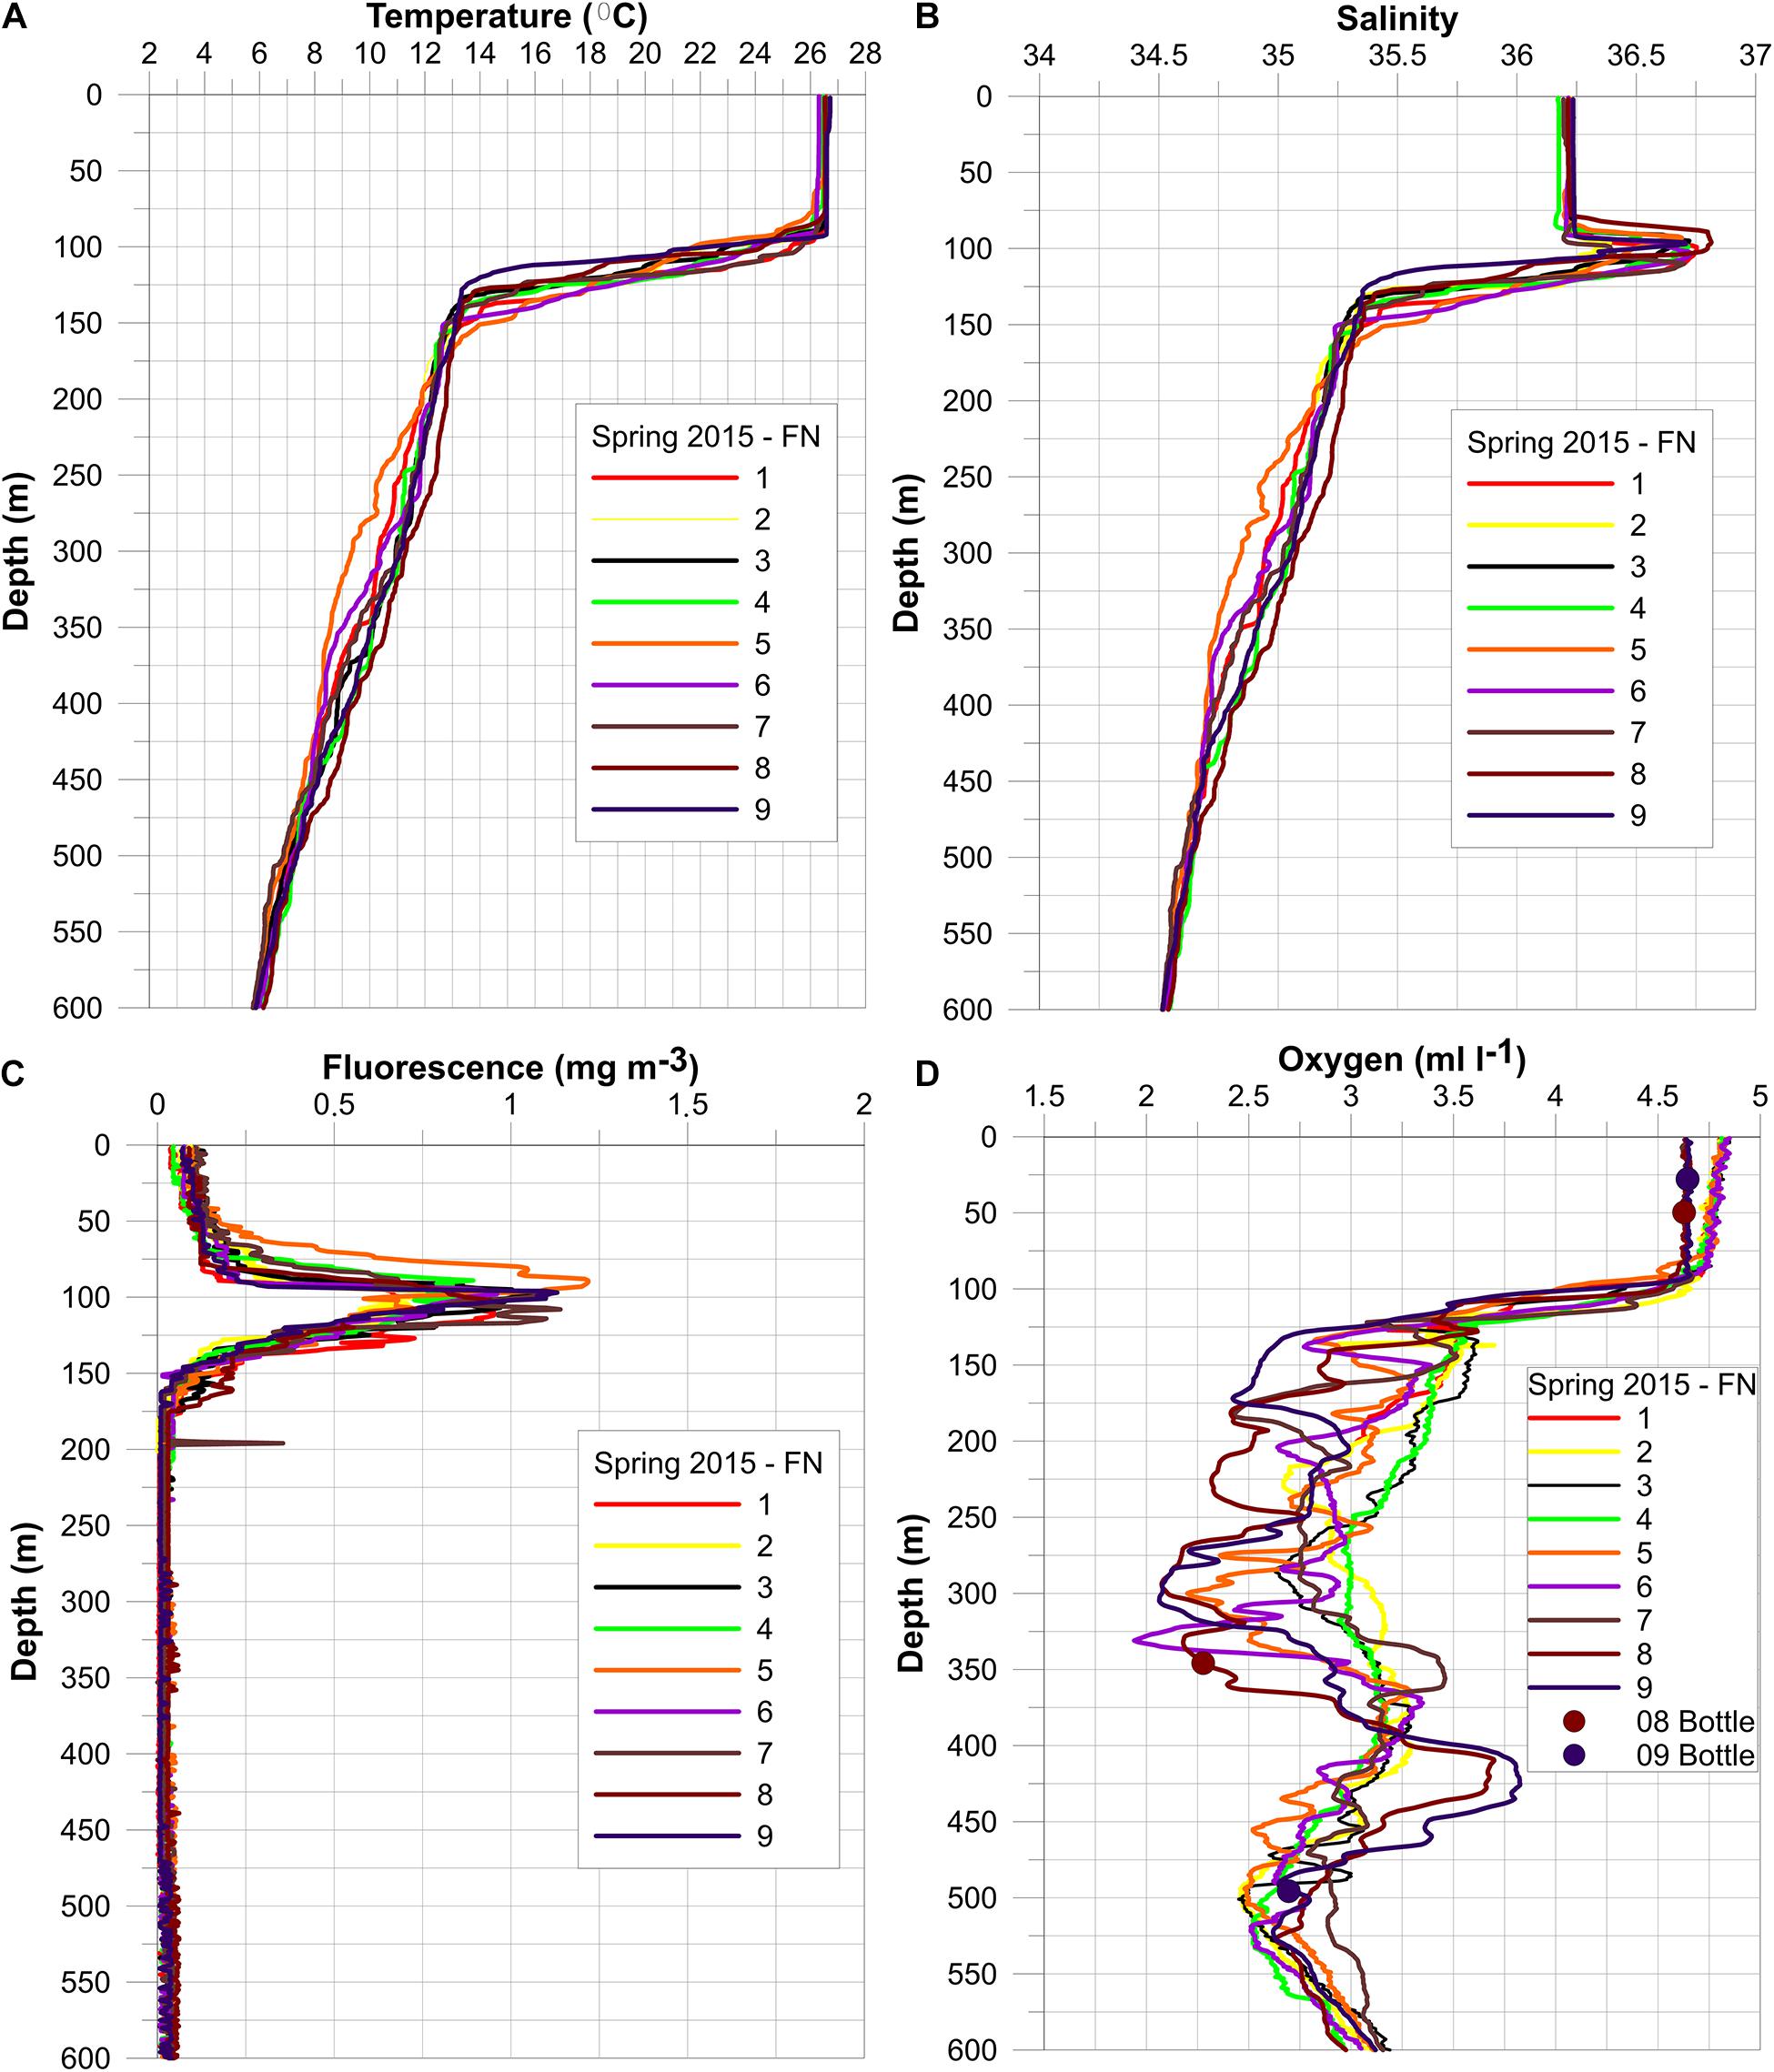
Figure 4. CTD profiles obtained during the ABRACOS surveys in spring 2015 around the Fernando de Noronha Archipelago. Vertical profiles of temperature (A), salinity (B), fluorescence (C), and dissolved oxygen (D).
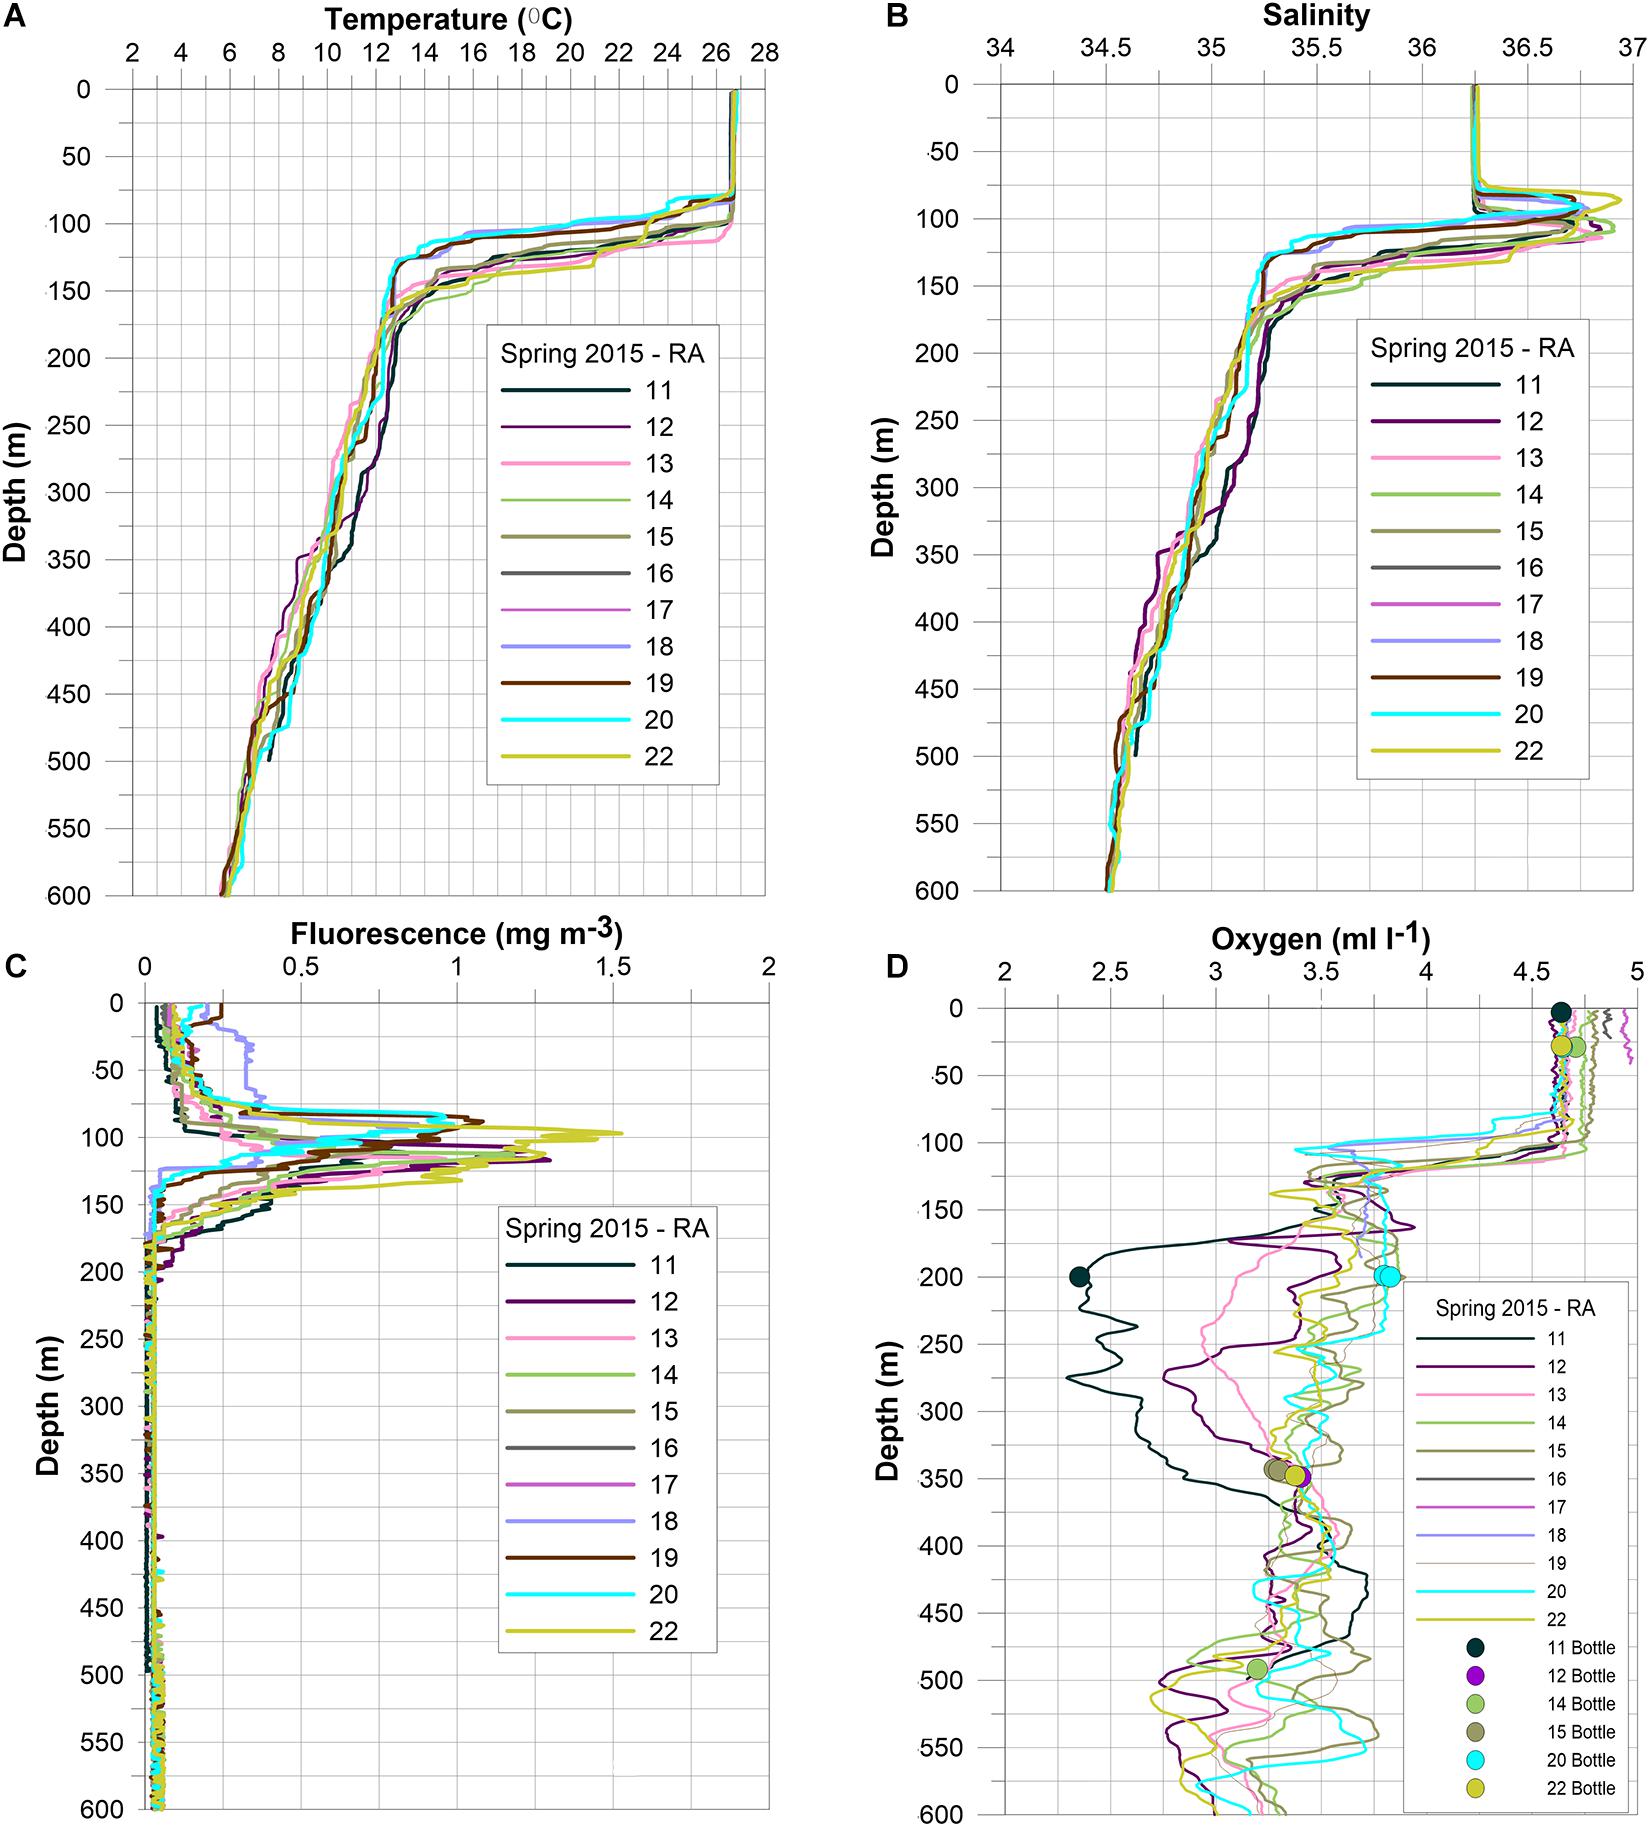
Figure 5. CTD profiles obtained during the ABRACOS surveys in spring 2015 around the Rocas Atoll. Vertical profiles of temperature (A), salinity (B), fluorescence (C), and dissolved oxygen (D).
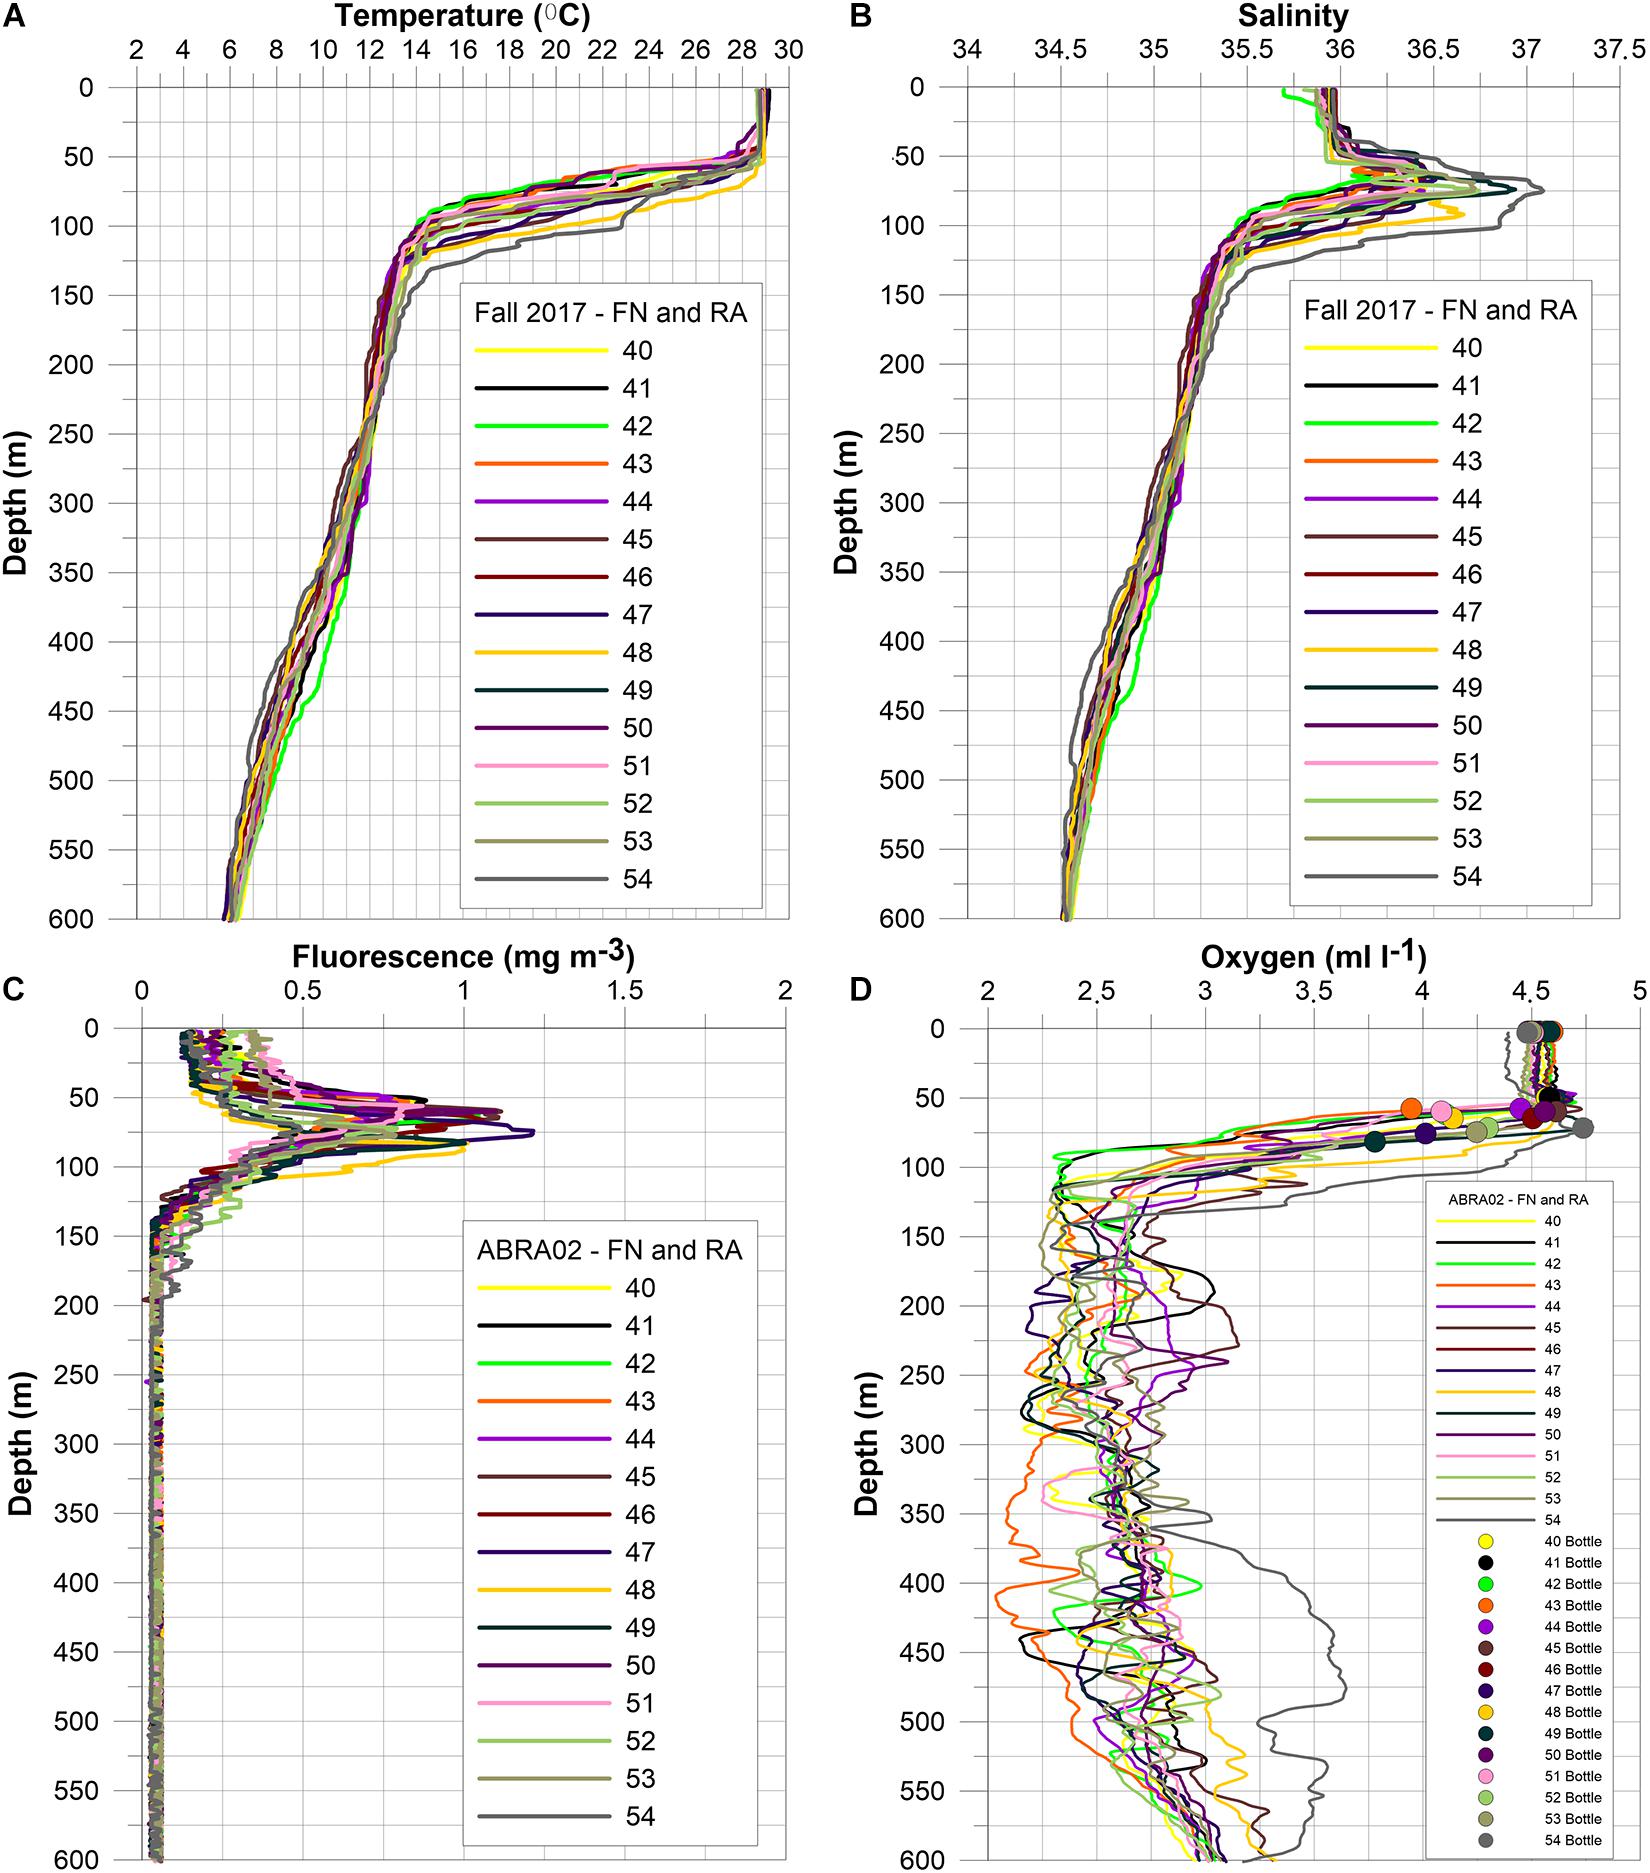
Figure 6. CTD profiles obtained during the ABRACOS surveys in fall 2017 around the Fernando de Noronha Archipelago and Rocas Atoll. Vertical profiles of temperature (A), salinity (B), fluorescence (C), and dissolved oxygen (D).
Surface fluorescence concentration of the TSW was twice lower in spring 2015 (average: 0.10 mg m–3) than in fall 2017 (average: 0.20 mg m–3) (Figures 4C, 5C, 6C). Peaks of maximum fluorescence (average: ∼1 mg m–3) were observed in the SUW during spring 2015 and fall 2017 (Figures 4C, 5C, 6C).
In the surface layer, DO concentrations were similar and of ∼4.5 ml l–1 during both cruises (Figures 4D, 5D, 6D). During spring 2015, CTD stations located north and south of RA also presented higher DO concentrations (≥3.5 ml l–1) below the thermocline layer. During fall 2017 low DO concentrations (∼2.5 ml l–1) were observed in subsurface around FN and RA (Figures 5D, 6D).
More specifically, during spring 2015, temperature profiles at stations 11 and 12, close to RA, presented positive temperature (+1°C) and salinity (+0.16) anomalies in the depth range 200–350 m (Figure 5A). Corresponding DO concentration were lower than 3.5 ml l–1 (Figure 5D). Conversely, at station 05 close to FN, a negative anomaly in temperature (−1.3°C) and salinity (−0.15) was observed in the depth range 200–400 m (Figure 4A). At this station, the fluorescence peak was shallower than at other stations located around FN (Figure 4C). In addition, a shallower thermocline and halocline was observed at stations 18, 19, and 20, located north of RA, when compared to the other stations around RA (Figure 5A). In those stations, surface fluorescence concentration was higher (0.18–0.24 mg m–3) and the peaks of maximum fluorescence were shallower (above 100 m) (Figure 5C). Finally, stations 14–22 located north and south of RA did not show a marked DO minimum (Figure 5D).
During fall 2017, at stations 48 and 54, the thermocline and halocline were deeper than at other stations (Figure 6A). In addition, station 42 located north of FN presented a positive temperature (+1°C) and salinity (+0.1) anomaly between 350 and 450 m depth. At this station, in the depth range 425–600 m, DO concentration was higher (>3.2 ml l–1) than at other stations.
Finally, the upper thermocline was deeper in spring 2015 (∼90 m) than fall 2017 (∼50 m). Specifically, in spring 2015, stations 05, 09, 12, 20, and 22 (Figures 7A–E) presented deeper halocline and thermocline when compared to stations 53 in fall 2017 (Figures 7E,F). The area north of FN and RA (stations 09 and 20; Figures 7B,D) presented stronger vertical gradients at the lower limit of the mixed layer depth than in the southern area (stations 05 and 12, Figures 7A,C). Station 20 located north of RA presented a low Ri between 150 and 250 m depth.
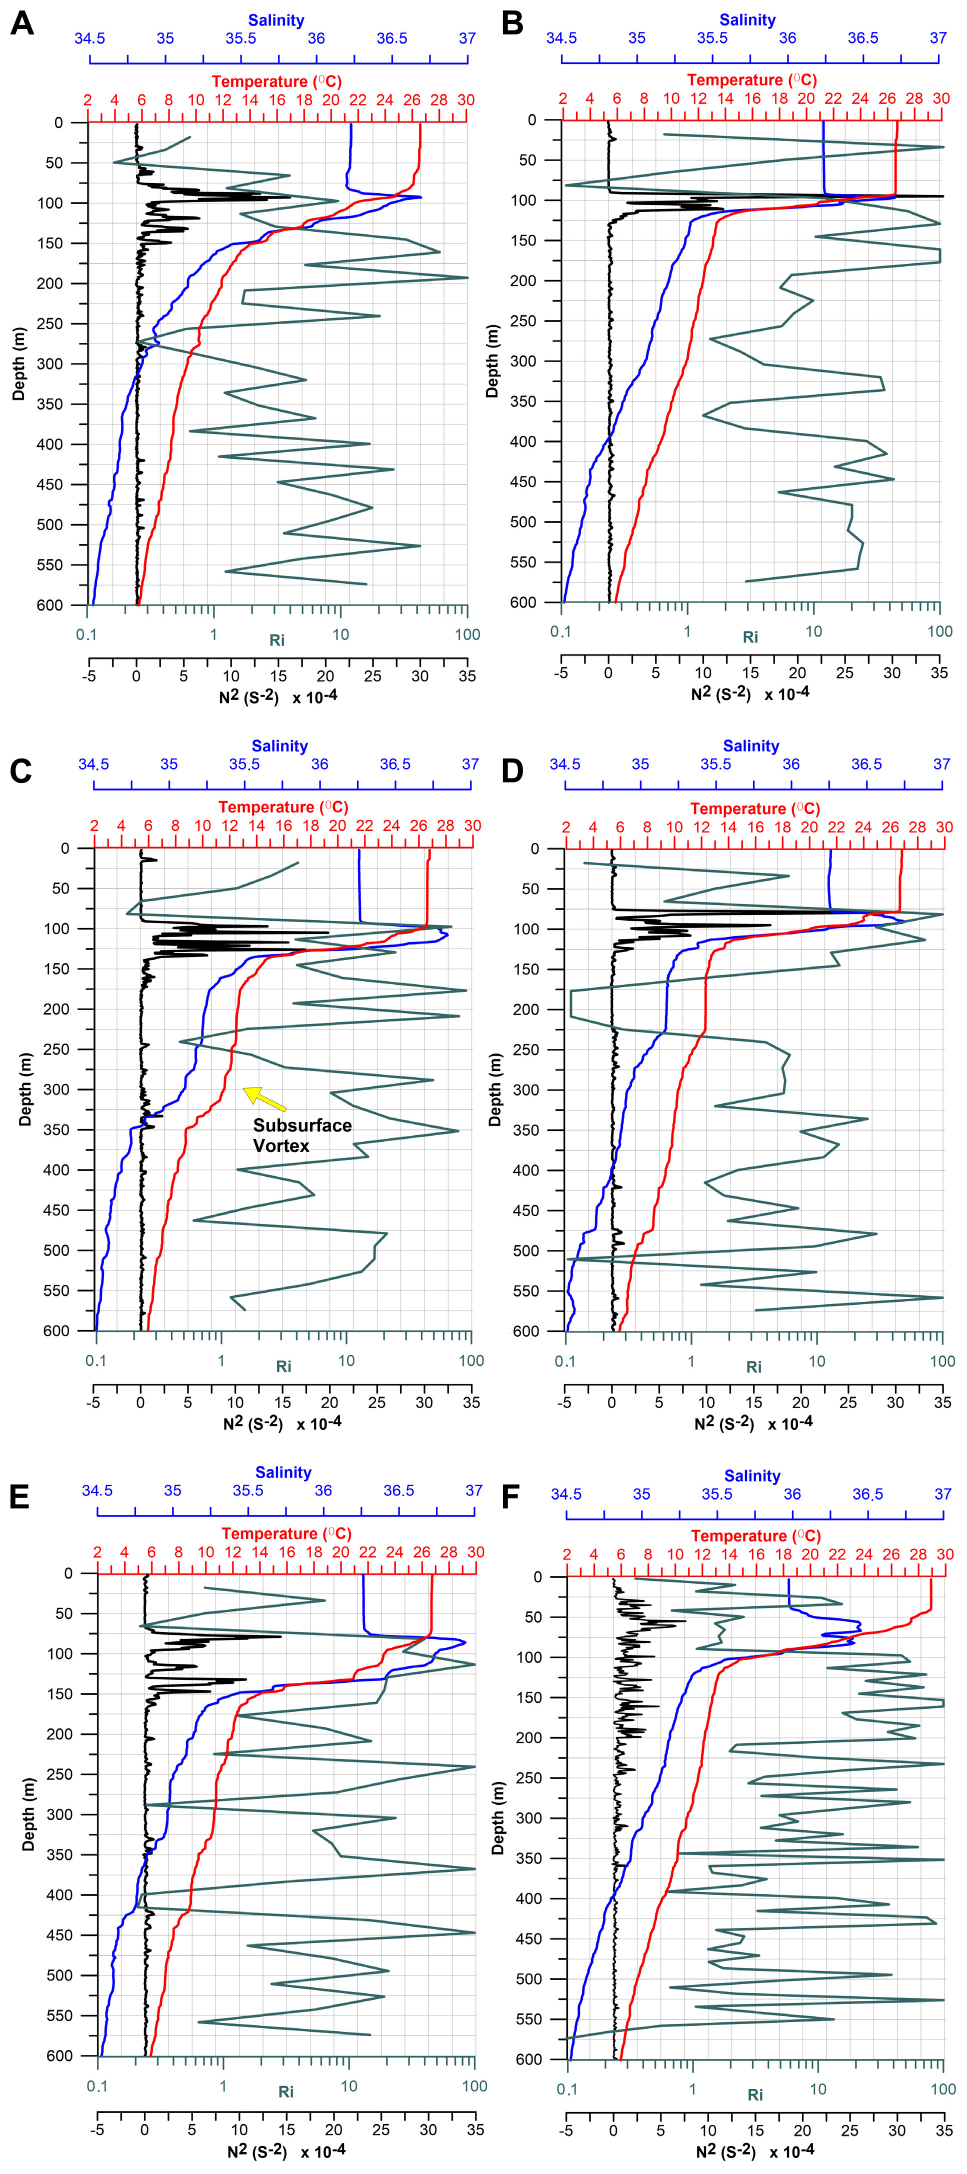
Figure 7. Typical profiles of temperature, salinity, Brunt-Väisälä frequency (N) and Richardson number (Ri) for stations 5 (A), 9 (B), 12 (C), 20 (D), and 22 (E) during spring 2015 and for stations 46 (F) during fall 2017.
Below the surface layer (near 250 m depth), stations 12 and 22 show low Ri values (<0.5 and <0.3, respectively) in the southeast side of RA (Figures 7C,E).
During spring 2015, the upper thermocline and maximum salinity depth (between 50 and 100 m depth) presented a higher peak of Brunt-Väisälä frequency near in surface than in fall 2017 (Figure 7F), confirming a stronger vertical stratification and static stability.
Although several SADCP sections were performed around FN and RA, we selected a meridional section (crossing FN from North to South (transect Ta in Figure 2) to represent the ocean circulation in the region. In spring 2015, the cSEC flowed westward above 100 m depth on both sides of FN (Figure 8) but was more intense on the northern side (U ∼−50 cm s–1) than on the southern side (U ∼−20 cm s–1) (Figure 8A). The cSEC westward transport was estimated to be of 1.2 ± 0.1 Sv across this meridional section in spring 2015. In fall 2017, the cSEC was restricted above 70 m (Figure 8B) and its zonal velocity component was higher than in spring 2015, with an average of ∼−60 cm s–1 in the surface layer (0–100 m) in both sides of the island (Figure 8B). Corresponding westward transport was estimated to be of 4 ± 0.2 Sv.
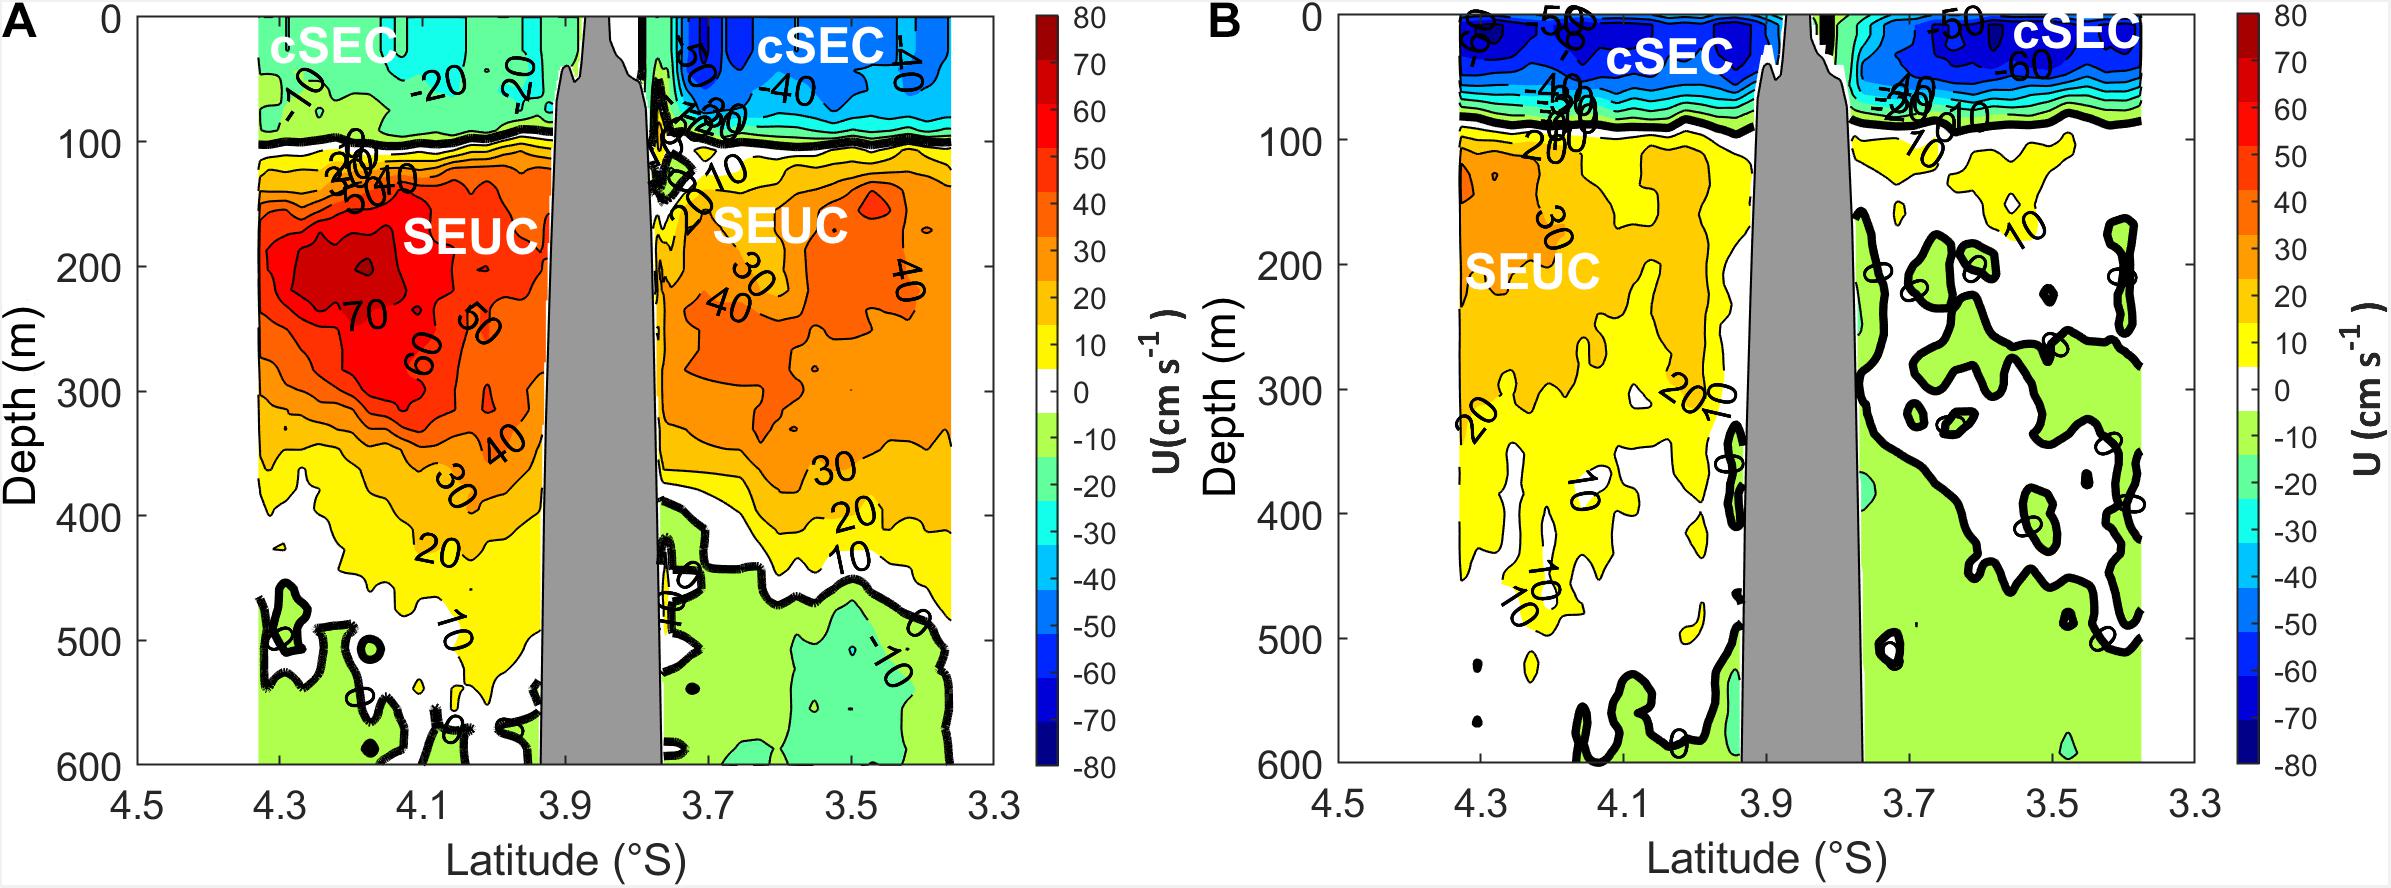
Figure 8. Mean zonal velocity components (in cm s–1) obtained from ABRACOS cruises in spring 2015 (A) and fall 2017 (B) around Fernando de Noronha archipelago (vertical blue transect Ta in Figure 2). The contour interval is 10 cm s–1.
In the subsurface layer, between 100 and 400 m depth, the zonal component of the flow reversed and the current was oriented eastward, as is typical of the SEUC. Therefore, a strong current shear occurred between the near-surface cSEC and the subsurface SEUC. In spring 2015, the SEUC presented a maximum zonal velocity of 70 cm s–1 south of FN at ∼200 m depth (Figure 8A). North of FN, the SEUC zonal velocity was weaker (≤40 cm s–1). The SEUC eastward transport, integrated between 100 and 400 m depth along the meridional section, was estimated to 5.6 ± 0.5 Sv. In fall 2017, the SEUC was weaker than in spring 2015, having a maximum zonal velocity of 30 cm s–1 south of FN around 150 m depth (Figure 8B). On the northern side of FN, the SEUC velocity was much weaker (<10 cm s–1) (Figure 8B). In fall 2017, the integrated SEUC transport was estimated to 3.8 ± 0.7 Sv. Finally, below ∼450 m, the circulation was weak and not further investigated in this study.
In order to depict the regional circulation around FN and RA, we divided the circulation into two distinct layers: the near-surface layer (0–100 m depth) that includes the cSEC and the subsurface layer (100–400 m depth) mainly associated with the SEUC.
In spring 2015, the near-surface circulation was dominated by the cSEC (Figures 8A, 9A). Around FN, surface currents varied in direction and intensity on both sides (north and south) of the archipelago. On the northern side of the archipelago, surface current was more intense (50 cm s–1) with a prevailing northwestward flow (Figure 9A). A similar northwestward flow was also observed on the northern side of RA. In fall 2017, the cSEC had a prevailing westward direction with mean velocities of 50 cm s–1 (Figure 9C). During this period, no clear current-islands interaction was observed.
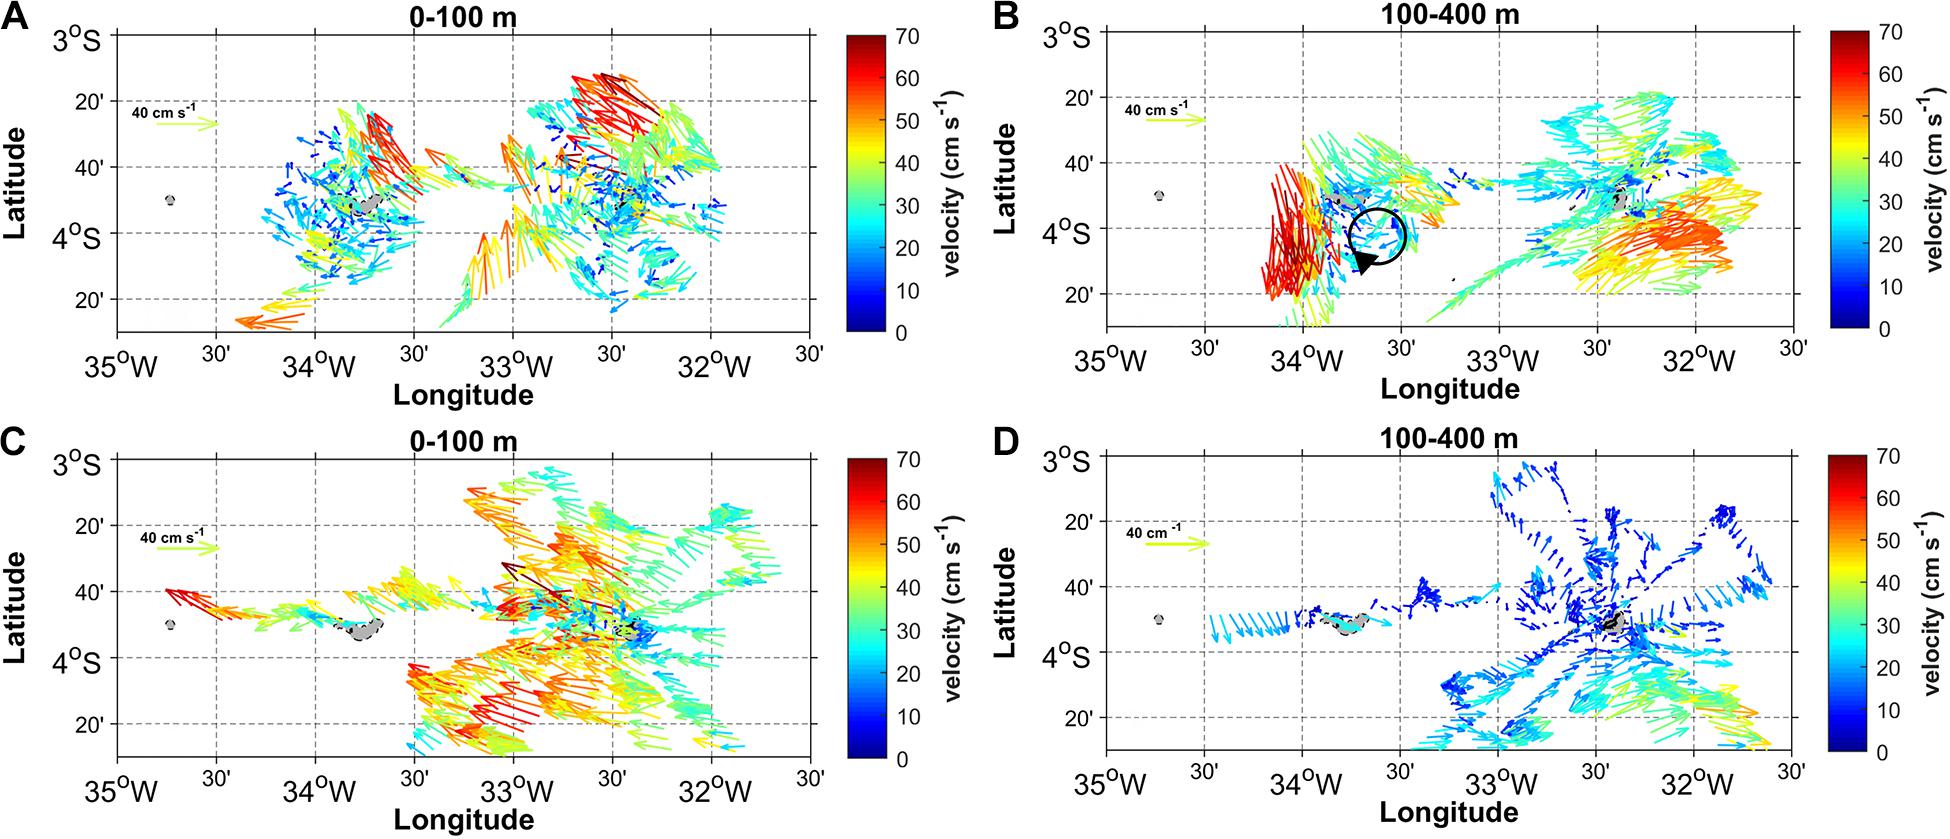
Figure 9. Mean current velocity obtained from ABRACOS cruises at 0–100 m during spring 2015 (A) and fall 2017 (C), and at 100–400 during spring 2015 (B) and fall 2017 (D). Black circle in Figure 8B indicates the cyclonic mesoscale circulation.
In the subsurface layer (100–400 m depth), during spring 2015, the SEUC dominated around FN with maximum velocity (30 cm s–1) south of the island. Near RA, currents flowed predominantly south/southeastwards, being more intense on the western side of the atoll. Between FN and RA (about 33°W), the eastward flow was weaker (<10 cm s–1). Interestingly, in spring 2015, a small-scale subsurface cyclonic circulation was observed southeast of RA (illustrated by a black circle in Figure 9B). This subsurface cyclonic eddy had an estimated radius of ∼28 km and was probably driven by the topographically induced flow separation (Figure 9B). This eddy-like structure, centered at 33.38°W and 4°S and having a typical swirl velocity of 20 cm s–1, did not have a signature in the near-surface layer dominated by the cSEC. In fall 2017 the influence of the SEUC was observed in the 100–400 m depth layer around FN, with an average current velocity of 20 cm s–1 flowing eastward south of FN. Northwest of FN, the northeast flow was weaker (≤10 cm s–1). Finally, west of RA currents moved southwards (Figure 9D).
SST was lower in spring 2015 (<27°C) than in fall 2017 (>28°C) (Figures 10A,B), in agreement with the SST values observed from CTD data. In spring 2015, the SST showed a large-scale northwestward gradient, varying from 26°C southeast of FN to 27°C northwest of RA. This SST distribution suggests that the cSEC tended to cool the downstream regions. In fall 2017, the SST was much more homogeneous in the study region and varied by less than 0.4°C. Several mesoscale temperature structures were observed during both seasons (Figures 10A,B).
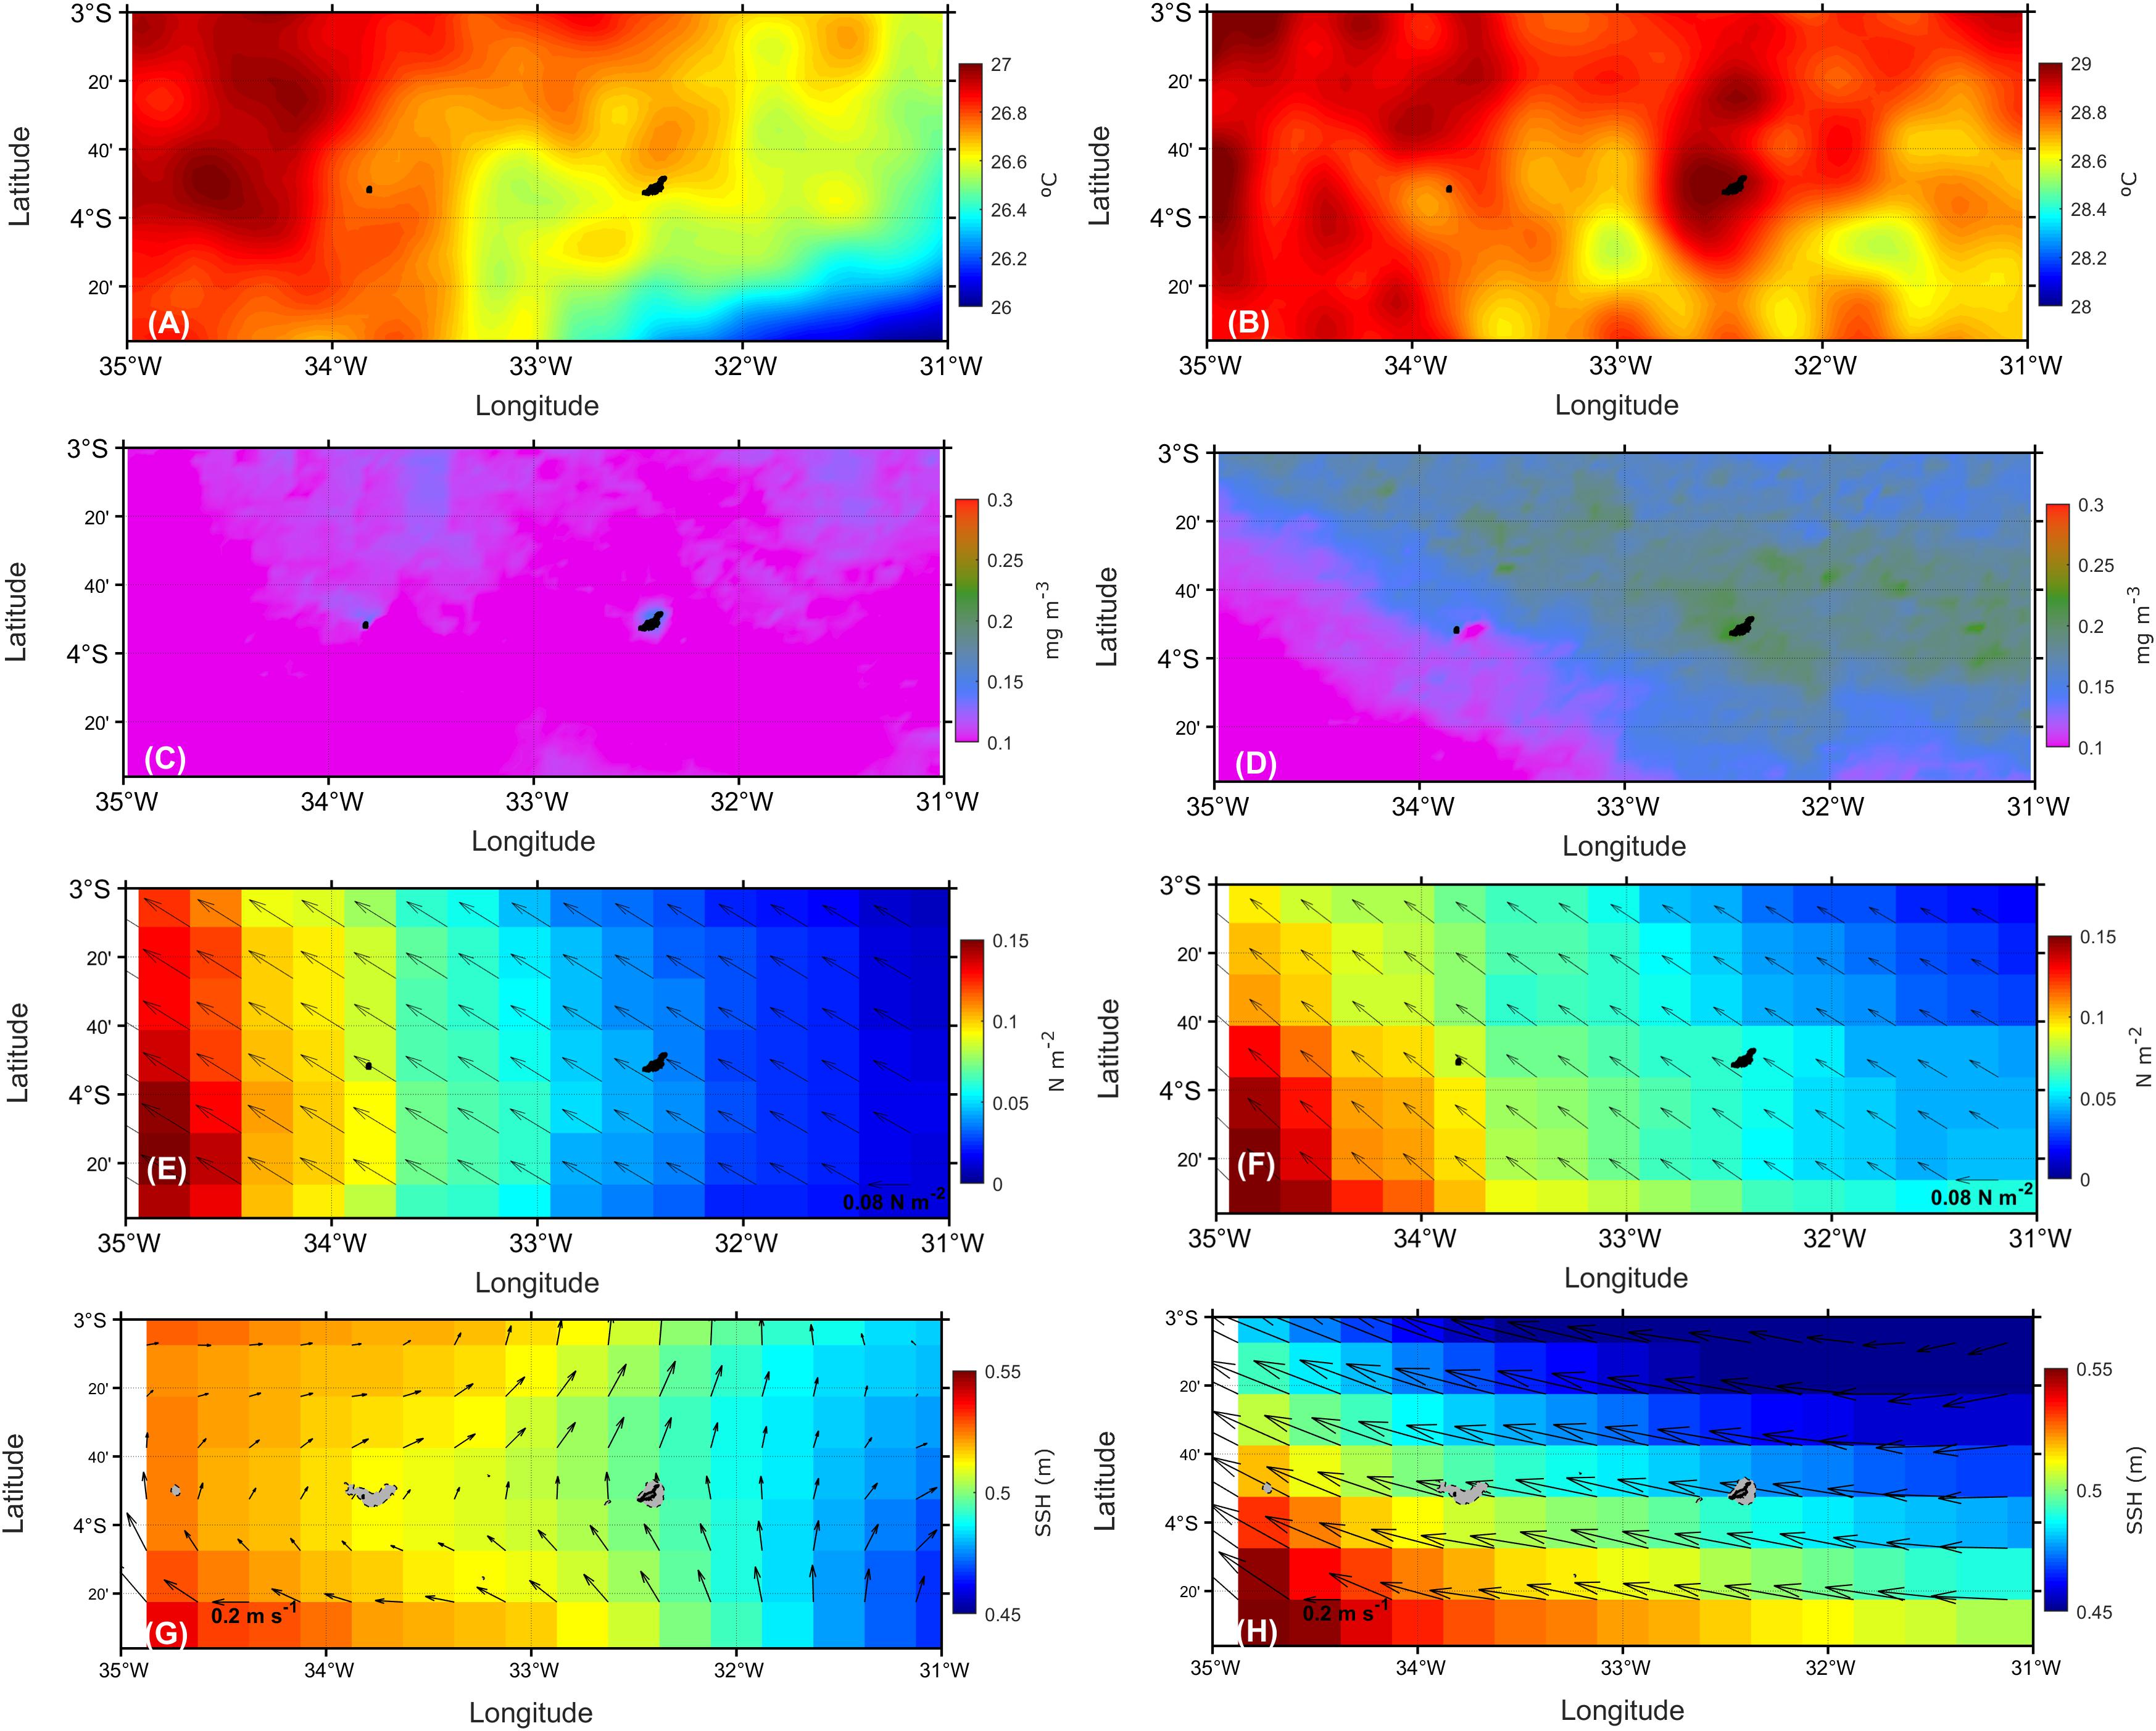
Figure 10. Sea surface temperature in °C (A,B), Sea surface Chl-a concentration in mg m–3 (C,D), wind velocity in m s–1 (arrows in E,F), wind stress in N m–2 (colors in E,F), surface geostrophic velocities in m s–1 (arrows in G,H) and sea surface height (colors in G,H) in the southwestern tropical Atlantic region (3°S-4.5°S, 35°W-31°), for the time periods of ABRACOS cruises in spring 2015 (left side panels) and fall 2017 (right side panels).
Surface Chl-a concentration was lower in spring 2015 (about 0.1 mg m–3) than in fall 2017 (0.2 mg m–3) (Figures 10C,D). Higher surface fluorescence values were also observed in fall 2017 from CTD data. In spring 2015, satellite Chl-a concentrations were higher in the vicinity of FN and RA, suggesting a topographic influence on the primary productivity. In fall 2017, a large-scale northeastward Chl-a gradient was observed, with mean Chl-a concentrations varying from 0.10 to 0.23 mg m–3.
Surface winds blew northwestwards and intensified westwards (Figures 10E,F and Supplementary Figures 1E,F). It might be related with coastal effects associated with the proximity of land. This intensification was more pronounced in spring 2015 than in fall 2017. Overall surface winds were higher in spring 2015 (≥0.1 N m–2) than fall 2017 (≤0.1 N m–2).
In spring 2015, some changes were observed in the predominant directions of the surface currents (0–100 m depth) around FN and RA, which was not observed in fall 2017. In spring 2015, SSH and associated geostrophic currents depicted a surface current flowing northward on the northern and eastern sides of FN. On the northern side of RA, a northeastward flow was observed (Figure 10G). The presence of a mesoscale cyclonic eddy around RA was depicted. In fall 2017, a clear geostrophic westward flow was observed (Figure 10H) around FN and RA and no eddy was observed (Supplementary Figure 1H).
In situ and satellite data are used to discuss the temporal variability of the oceanic characteristics around FN and RA in spring 2015 and fall 2017 that have been shown to be representative of canonical spring and fall conditions (Assunção et al., 2020; Dossa et al., 2021). We also discuss the impacts of FN and RA on the thermohaline structure, local circulation, including mesoscale features, primary productivity and dissolved oxygen distribution.
In the southwestern tropical Atlantic, negative ocean-atmosphere heat fluxes and stronger winds are observed in spring, leading to a lower SST and deeper mixed-layer. In contrast, in fall, positive buoyancy due to positive heat fluxes and the relaxation of southeast trade winds lead to a higher SST and shallower mixed-layer (Araujo et al., 2011; Servain et al., 2014; Nogueira Neto et al., 2018; Assunção et al., 2020). Similarly, in situ ABRACOS measurements showed higher SST values in fall 2017 (28.8°C) than in spring 2015 (26.7°C). In fall 2017, during the rainy season, relatively low surface salinity and low wind stress were associated with warmer SST in the western tropical Atlantic (Supplementary Figure 1).
Previous studies (Schott et al., 1998, 2003; Stramma and Schott, 1999) described the SEUC characteristics across two meridional sections (35 and 31°W) between 2 and 5°S. These studies underlined the relatively small variability of the SEUC vertical position at 35°W in a depth range of 200–500 m between 2.5 and 4°S. However, using the ABRACOS mesoscale cruises, we showed that the SEUC can exhibit important temporal variability. The SEUC flowed eastward with greater intensity in the southern part of FN during spring 2015, with a weakening in fall 2017. In the northern part of FN, the influence of the SEUC was not observed in fall 2017.
We observed an influence of the cSEC on the southern and northern sides of the island in the surface layer. This strong surface current was also associated with a variation of the mixed layer depth, which was shallower around FN and RA during fall 2017.
In situ and satellite data revealed a relatively strong variability of near surface fluorescence/Chl-a concentrations in the oceanic area around FN and RA among cruise periods with high concentration in fall 2017 when the mixed layer was shallower. In spring 2015, Chl-a was slightly higher in the northern part of the study area (Figure 10C and Supplementary Figure 1C), along the equatorial region, which may be associated to equatorial wind-driven upwelling. In fall 2017, a clear surface zonal “tongue” of maximum Chl-a was observed at 3°S, involving FN and RA areas, reaching a maximum of about 0.2 mg m–3. This high productivity may be associated to nutrient rich waters transported westward by the cSEC, which is stronger during fall 2017 reaching a maximum of about 0.2 mg m–3 (Figures 10G,H and Supplementary Figures 1G,H). CTD profiles confirm the increase in fluorescence concentrations around FN and RA during fall 2017, with two to fourfold higher concentrations when compared to spring 2015 (Figures 4C, 5C, 6C). Note that the Chl-a variability in the equatorial Atlantic can be influenced by several mechanisms, such as the seasonal variations of upwelling driven by the meridional displacement of the ITCZ, the westward advection by the SEC, or the perturbation of the equatorial upwelling by eastward propagating Kelvin waves (Servain et al., 1982; Grodsky et al., 2008). We here highlighted that FN and RA can also locally impact the Chl-a distribution.
Around FN and RA, DO concentration was lower than ∼3 ml l–1 in the depth range 150–350 m in fall 2017 (Figure 6D). In spring 2015, this pattern was observed around FN but 5 out of 8 profiles around AR presented DO > 3 ml l–1 in this depth range (Figures 4D, 5D). These oxygen maxima have been reported in the SEUC farther east (Tsuchiya, 1986; Schott et al., 1998). These oxygen signatures are used to diagnose the origin of the SEUC. Our results can provide further insight in a current debate. Indeed, according to Bourlès et al. (1999), in the region where the NBC forms, the NBUC weakens and retroflects to feed the SEUC. On the contrary, Schott et al. (1998) indicated that the SEUC is not supplied by the oxygen-rich and high-salinity NBUC waters, but is mostly made up of low-oxygen interior recirculation waters out of the SEC. This was also supported by Goes et al. (2005), that stated that apart from the gyre recirculation, there is a minor contribution from the NBUC to the SEUC. Finally, recently, Dossa et al. (2021) also showed that the NBUC retroflection does not feed the SEUC, which instead originates from the SEC retroflection, at least in fall. Still, the presence of profiles with higher DO concentration in spring 2015 raise again the question about a potential contribution of the NBUC to the SEUC. The orientation of the subsurface currents in the area of RA in spring 2015 may also indicate the presence of a retroflection. In the same sense, using float trajectories (around 200 m depth), Fischer et al. (2008) reported that, in austral spring, a float deployed south of the SEUC followed its eastward flow but then drifted westwards. The float was then entrained by the NBUC and re-entered the SEUC northwest of RA. At 23°W, Brandt et al. (2008) observed an oxygen maximum in the deepest part of the SEUC (∼400 m), indicating either a direct connection to the western boundary flow or a recirculation of oxygen-rich water from the south. Around RA, we observed a south/southeastwards flow (100–400 m depth) (Figure 9B). It seems therefore that in spring, the NBUC can retroflect to reach RA. However, the contribution of this retroflection to the SEUC remains unclear since the NBUC signature was lost close to RA and no more observable around FN. Therefore, it seems that as proposed by Goes et al. (2005), the NBUC can retroflect, at least in spring, but the contribution of the NBUC to the SEUC is likely negligible. Further studies are needed to quantify such effects and fully explain the mechanisms potentially involved in the NBUC-SEUC connection.
To study possible effects of local flow-topography interactions over the large-scale circulation patterns, in Figures 11, 12, we examined the vertical zonal velocity profiles (0–600 m depth) in the western and eastern side of FN (transects Tb and Tc in Figure 2) and in the northwestern and southeastern side of RA (transect Td in Figure 2). The westward near-surface cSEC and eastward subsurface SEUC dominated at both periods, with stronger cSEC velocities in fall 2017 than spring 2015. On the opposite and, the subsurface SEUC transport was stronger in spring 2015 (Figure 11). In addition, a quite different circulation patterns was observed west and east of FN for both periods. In spring 2015, near-surface (0–100 m depth) zonal currents undergo important changes in their direction and intensity between upstream and downstream areas near FN, with maximal values higher in the western (U ∼ 20 cm s–1) than the eastern (U ∼ 10 cm s–1) side of FN (Figures 11A,B). The presence of the archipelago also induced strong perturbations of the cSEC, with a splitting of the cSEC core upstream of the archipelago in both periods (Figure 11A versus Figure 11B, and Figure 11C versus Figure 11D), although higher currents were observed in fall 2017, with maxima intensity (∼80 cm s–1) measured at the western side of FN (Figure 11C).
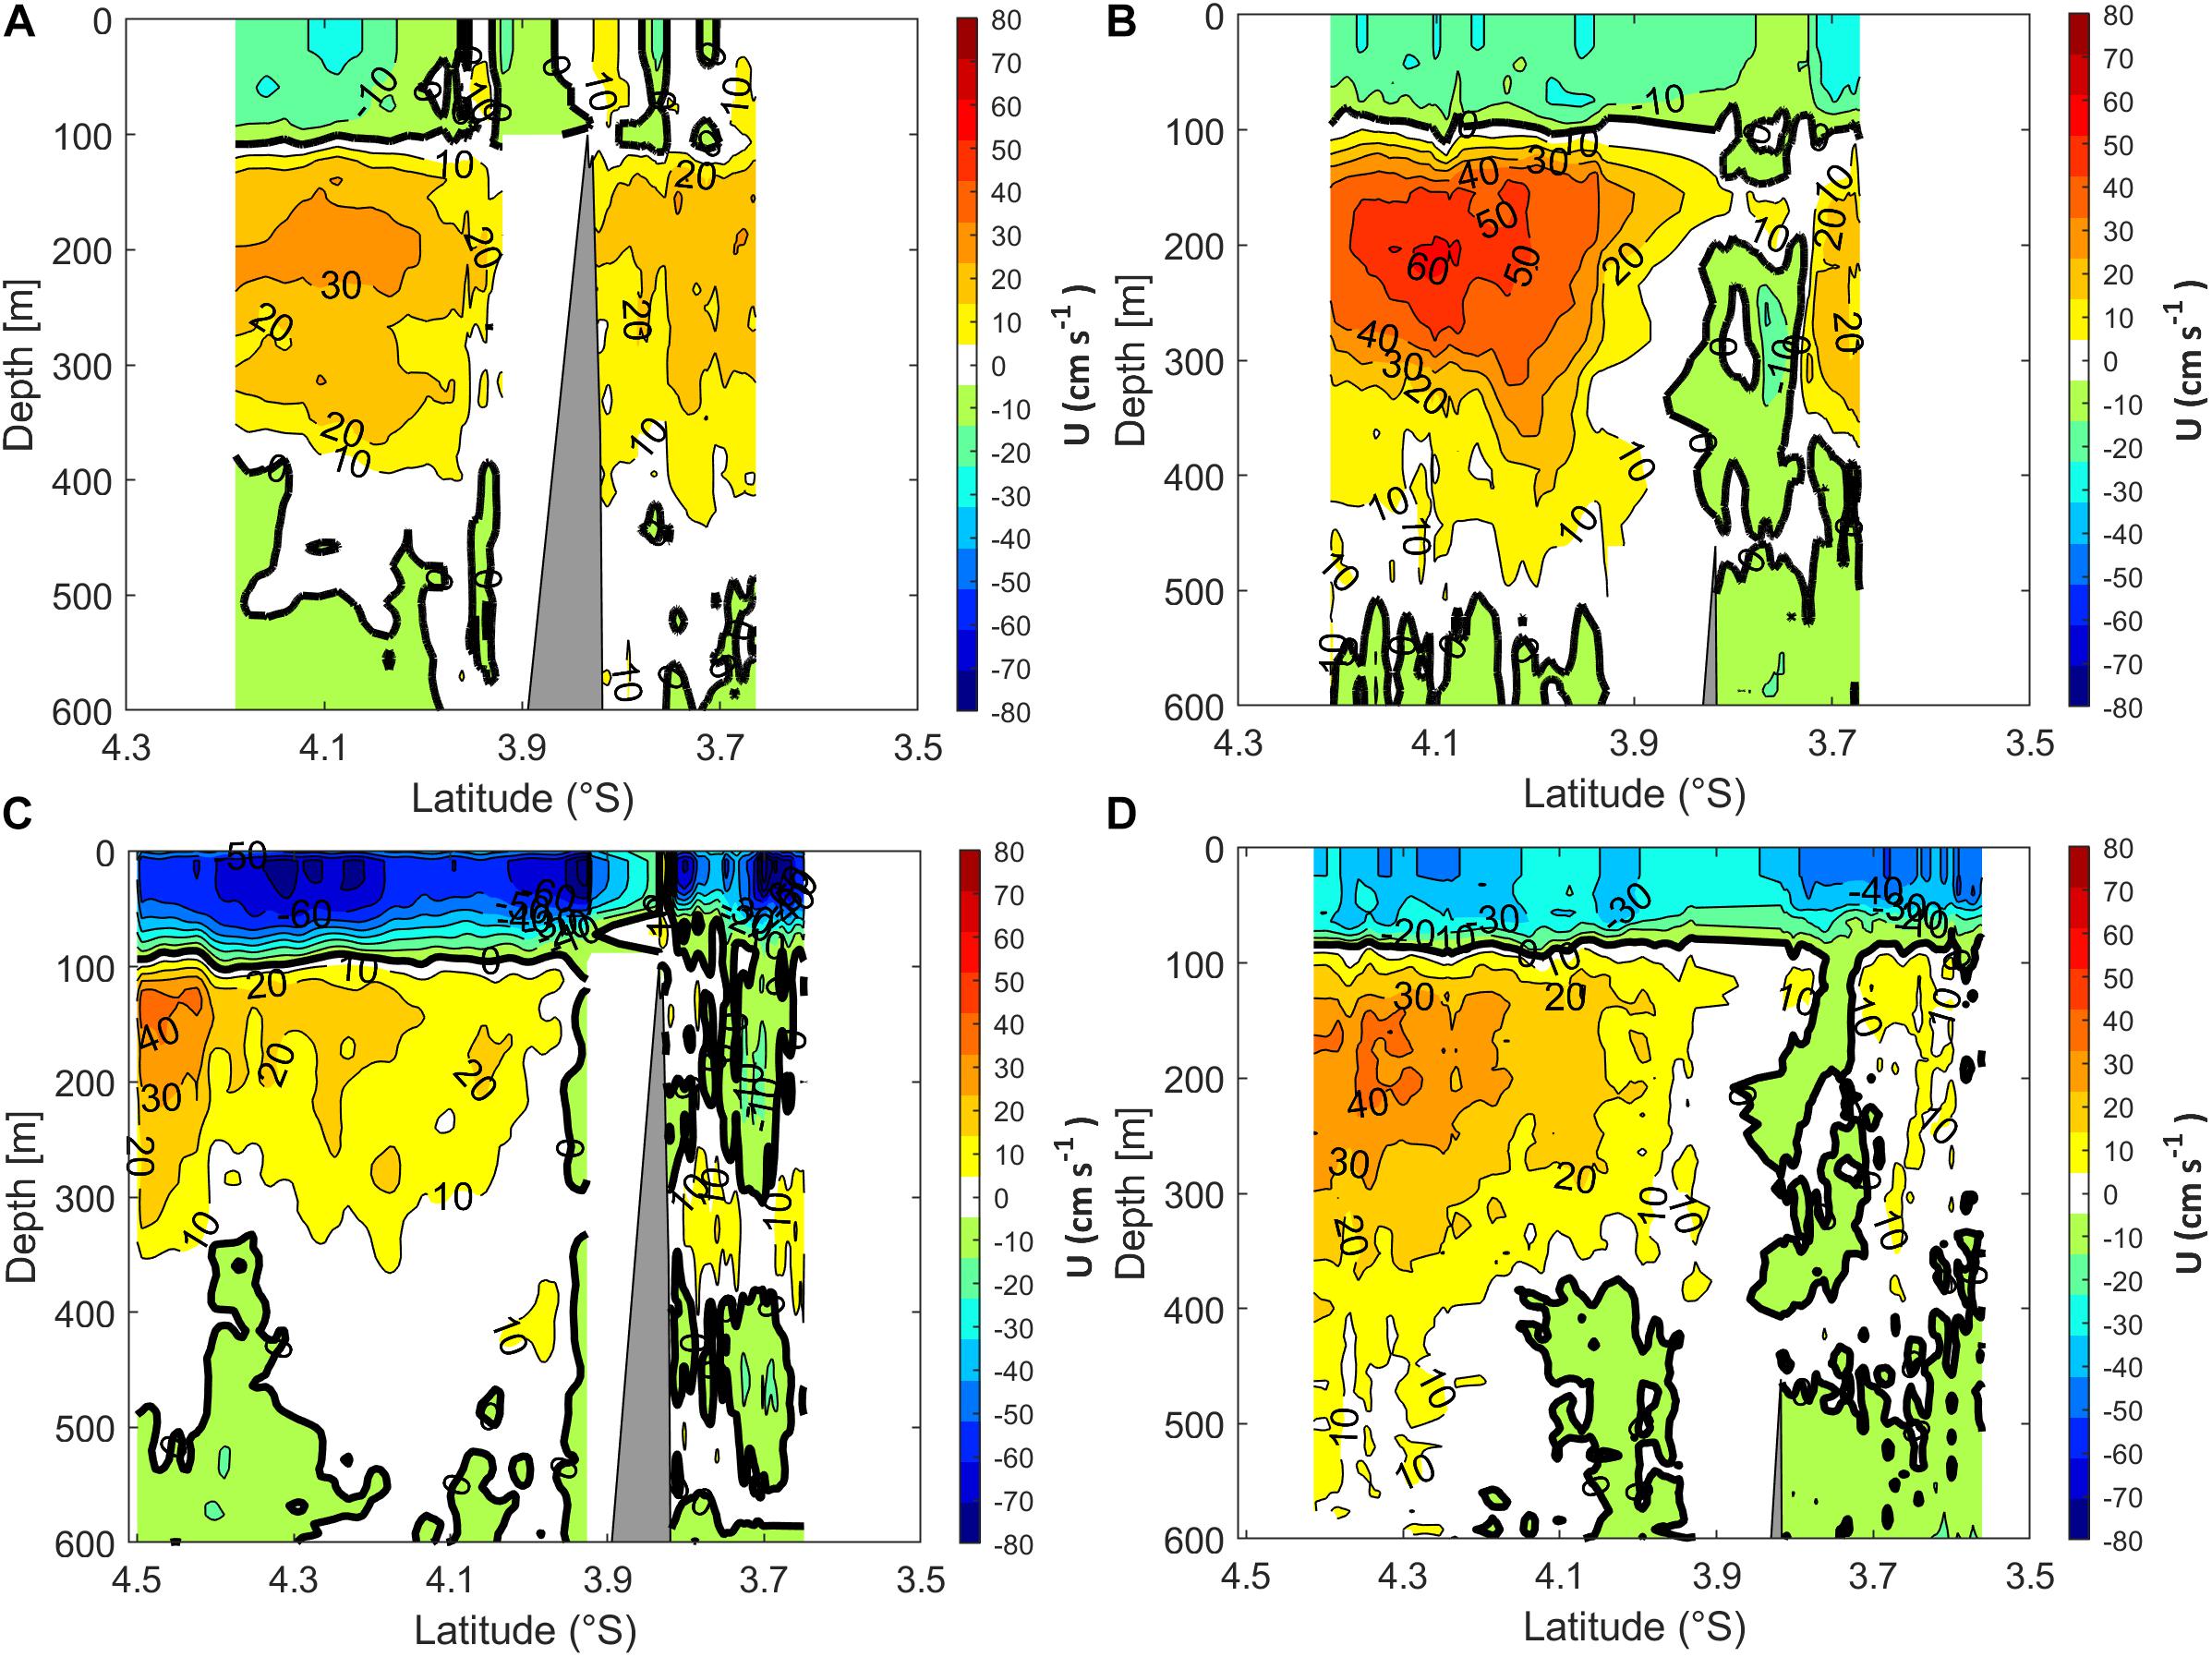
Figure 11. Zonal velocity component (in cm s–1, 0–600 m depth) near FN in the western (left side, see Tb transects in Figure 2) and eastern (right side, see Tc transects in Figure 2) regions, during spring 2015 (A,B) and fall 2017 (C,D). The contour interval is 10 cm s–1. The transects (Tb and Tc) are not along a single straight line, but along two non-meridional line segments.
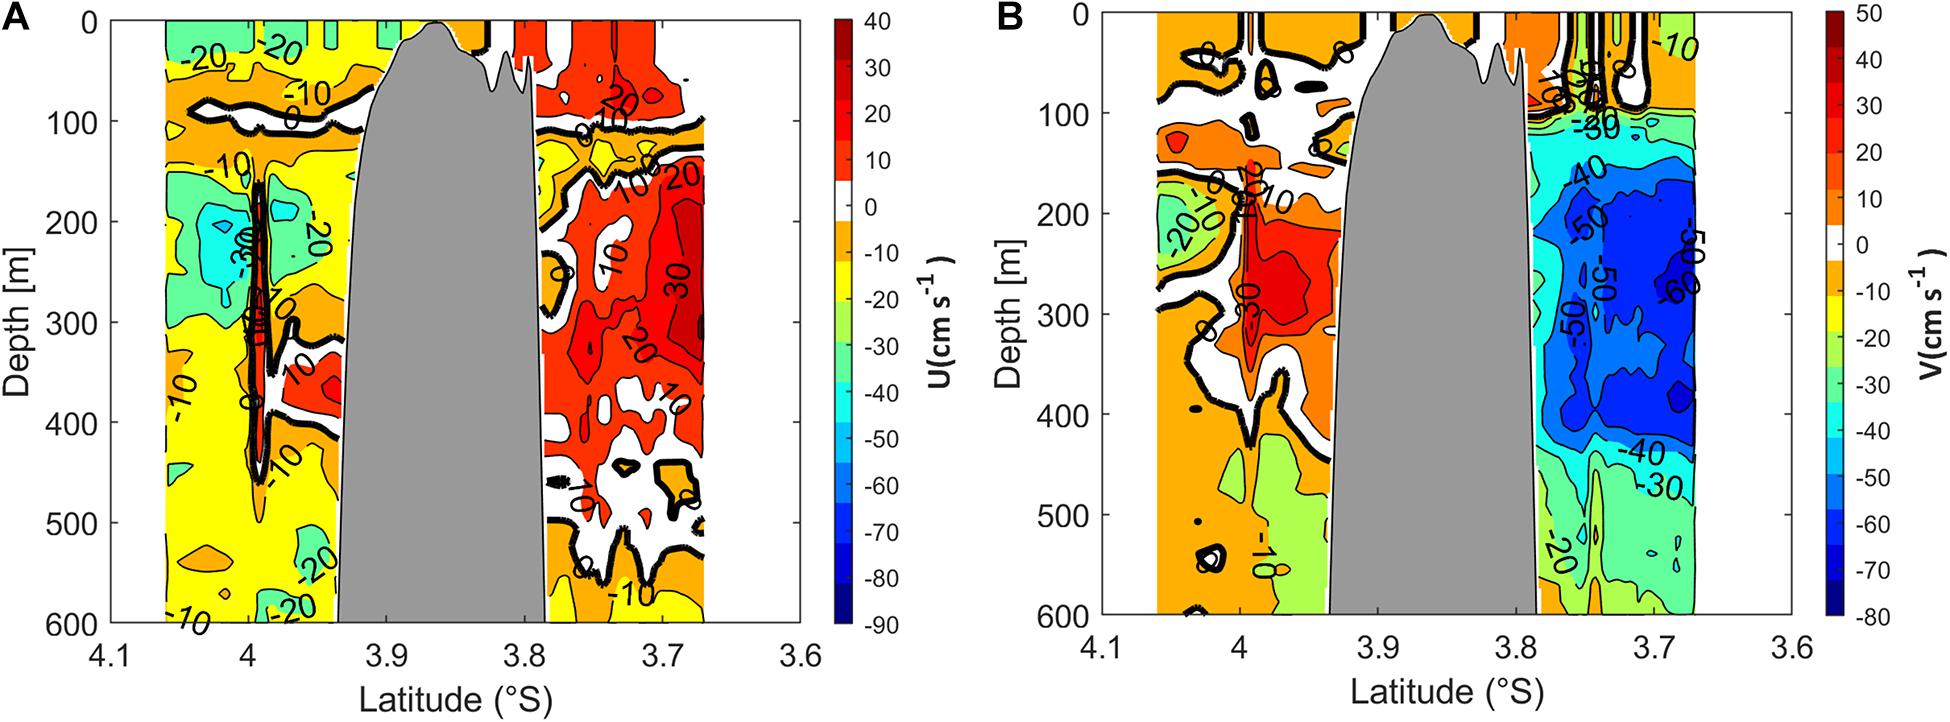
Figure 12. Mean zonal (A) and meridional (B) velocity components (in cm.s–1) during spring 2015 around RA (see Td transect in Figure 2). The contour interval is 10 cm.s–1. In each panel, the bold black solid line contours represents null value of the velocity.
Below the surface layer, between 100 and 400 m depth, the effects of island wake on the SEUC was also visible. A current core splitting was indeed observed in the eastern side of FN, with maximum velocities occurring north of 3.9°S (U ∼30 cm s–1) and a core of 20 cm s–1 centered at 3.7°S in spring 2015 (Figure 11A). A stronger and single SEUC core was observed downstream of FN, suggesting a reorganization of the eastward subsurface flow in the eastern portion of the archipelago, with eastward velocities higher than 50 cm s–1 at 3.9–4.2°S (Figure 11B). A similar scenario was observed in fall 2017 west of FN and north of 3.9°S, although with a much less intense and even a reversed transport north of the archipelago (U ∼−10 cm s–1 at 3.7°S). East of FN, the SEUC presented a maximum intensity of 40 cm s–1 at ∼4.5°S (Figure 11C). In the subsurface layer (100–400 m) SEUC intensity was maximal of 40 cm s–1 in the east side of FN at ∼200 m depth (Figure 11D).
These changes in the intensity and direction of the currents around the islands can be related to local topography. Cross-sectional vertical profiles of the temperature, salinity, fluorescence/Chl-a and dissolved oxygen concentrations are presented in Supplementary Figure 2. Transects were constructed from CTDO stations 05, 04, 01, and 08 (spring 2015), and 45, 44, 50, and 51 (fall 2017), represented by black triangles (see Figure 2 for the stations position).
Besides currents (intensity and direction) differences, vertical distributions of temperature and salinity are not the same in both sides of FN (Hydrographic transects in Supplementary Figures 2C,D). During spring 2015, we notice below 100 m depth a deepening of isotherms (see for example 10°C, Supplementary Figure 2A) and isohalines (for example 35.2 and 34.9, Supplementary Figure 2C) in the west side of FN, which is associated to observed splitting in SEUC structure due to the presence of the island (Figure 11A). Although less intense, this scenario is also observed during fall 2017 for the same isotherms and isohalines (Supplementary Figures 2B,D), which seems to be also associated to perturbations in SEUC structure imposed by the island wake (Figure 11C).
Indeed numerical simulations (e.g., Tchamabi et al., 2017), showed a subsurface cooling around the FN and RA, which was mainly driven by the interruption of cSEC by the bathymetry, enhancing vertical mixing and mesoscale eddy activity in the thermocline. It suggests that the island wake leads to an enrichment from the subsurface to the euphotic layer near FN and RA, supplying the productivity in these regions. This locally enhanced productivity is also visible on the satellite Chl-a observations (Figure 10C).
Another section is carried out on the northwestern and southeastern sides of the atoll (transects Td in Figure 2). In the surface layer (0–100 m), there is a predominantly eastward flow (U > 0 and V < 0) and below the surface layer there is an eastward flow centered at 250 meters in the northwestern part of RA (Figure 12). As shown later, in the subsurface layer (around 150–350 m depth), a cyclonic vortex structure was observed downstream (southeast side) of RA (red circle in Figures 9B, 12). However, the application of existing Richardson number (station 12 and 22) shows low Ri (<0.3) values around 200–400 m depth indicating the vortex (Figures 7D,E).
The maximal vortex velocity Umax ≈ 20 cm.s–1 is reached for the characteristic radius Rmax ≈ 28 km, resulting in a vortex Rossby number Ro ≈ 0.7 of this cyclonic vortex. The Rossby radius of deformation (Rd) is 23 km, a value very close to the vortex radius. In the equatorial region, Rd is one order of magnitude larger (Houry et al., 1987; Simoes-Sousa et al., 2021). Strong surface Eddies close to the equator present very small values of the Coriolis parameter f, leading to high Rossby number. Although some of these eddies are also highly circular, most of them have very small amplitudes (Douglass and Richman, 2015). The Burger number of the vortex is about 3. These values are consistent with the processes associated with a cyclonic eddy shedding observed in the Gulf of Guinea (Djakouré et al., 2014).
Corresponding temperature and salinity signatures were observed between 150 and 350 m depth at the same position (station 12 and 22, Figures 7C,E). At this depth range, an anomalous (and almost stepwise) increase in temperature and salinity was observed, associated with subsurface mesoscale changes in currents (Figure 12) and small Richardson numbers (Figures 7C,E). This subsurface vortex structure was also probably generated by the island wake (e.g., Arístegui et al., 1997; Chérubin and Garavelli, 2016). The maximum of subsurface fluorescence was also observed at Station 22, in the edge of the eddy-like feature (Figure 5A). Cyclonic and anticyclonic eddies are known to strongly modulate primary production in oligotrophic waters around islands (e.g., Arístegui et al., 1997). Maximum primary productivity is often observed near eddy edges, where numerous filaments are observed due to enhanced lateral straining, stretching and stirring (e.g., Mahadevan, 2016; Lévy et al., 2018).
Based on two regional mesoscale cruises realized off the Northeast Brazilian coast, we described the upper-ocean circulation and how island wake impact the main features around Fernando de Noronha island and Rocas Atoll in two contrasted periods, Austral spring 2015 and fall 2017, considered as representative of the mean spring and fall conditions. In spring, the area was characterized by a lower SST (26.6°C) and deeper mixed-layer (∼90 m). At this depth, a strong vertical shear was observed between the surface cSEC and the subsurface SEUC. In contrast, in fall, SST was higher (∼28.8°C), the mixed-layer shallower (∼50 m), and the vertical shear between the cSEC and the SEUC weaker. Our study suggested that SEUC was fed (not fed, respectively) by the NBUC in spring 2015 (fall 2017). However, from the available datasets, it was not possible to quantify how much this retroflection fed the SEUC in spring 2015. To unravel the scientific debate on the NBUC-SEUC connection, dedicated oceanographic cruises and numerical modeling approaches would be needed. Beside these global patterns, the physical processes in the wakes of islands were clear with the splitting of the large-scale currents, the presence of mesoscale meanders and a subsurface eddy-like structure. These features are likely key processes providing an enrichment from the subsurface to the euphotic layer near FN and RA, supplying the local productivity. Enhancement of primary production around the archipelago was also observed from satellite data in spring 2015. In addition to the new information described above, this work enables the planning of future cruises to be carried out for a better understanding of mesoscale vortex processes, water mass transport around the islands and in the tropical Atlantic.
The datasets presented in this study can be found in online repositories. The names of the repository/repositories and accession number(s) can be found below: ABRACOS Data (doi: 10.17600/15005600 and doi: 10.17600/17004100).
ACo and AB planned and organized oceanographic surveys. GE, AB, AD, and ACo worked in data processing and QC. All authors wrote and reviewed the manuscript.
This work was a contribution to the LMI TAPIOCA, the SMAC project (CAPES/COFECUB no. 88881.142689/2017–01), the PADDLE project (funding by the European Union’s Horizon 2020 Research and Innovation Programme—Grant Agreement 73427) and EU H2020 TRIATLAS project under Grant Agreement 817578.
The authors declare that the research was conducted in the absence of any commercial or financial relationships that could be construed as a potential conflict of interest.
We thank the officers and crew of the R/V Antea for their able assistance and cooperation. MA thanks the Brazilian Research Network on Global Climate Change—Rede CLIMA (FINEP-CNPq 437167/2016-0) and the Brazilian National Institute of Science and Technology for Tropical Marine Environments—INCT AmbTropic (CNPq/FAPESB 565054/2010-4 and 8936/2011) for their support.
The Supplementary Material for this article can be found online at: https://www.frontiersin.org/articles/10.3389/fmars.2021.598101/full#supplementary-material
Supplementary Figure 1 | Sea surface temperature, Sea surface Chl-a concentration, Surface winds stress, and Sea surface height/surface geostrophic velocities, obtained from OSTIA product in the southwestern tropical Atlantic region (4°N-8°S, 39.25°W-27°W), involving Fernando de Noronha Archipelago and Rocas Atoll (rectangle), for the same time periods of ABRACOS cruises: spring 2015 (left side panels), and fall 2017 (right side panels).
Supplementary Figure 2 | Vertical distributions of temperature, salinity, fluorescence, dissolved oxygen concentrations and Brunt-Väisälä frequency (N) near FN, during spring 2015 (left panels) and fall 2017 (right panels). Transects were obtained from CTDO stations 05, 04, 01, and 08 (spring 2015), and 45, 44, 50, and 51 (fall 2017), represented by black triangles. See Figure 2 for CTDO stations positions (pink dots).
Araujo, M., Limongi, C., Servain, J., Silva, M., Leite, F. S., Veleda, D., et al. (2011). Salinity-induced mixed and barrier layers in the southwestern tropical Atlantic Ocean off the northeast of Brazil. Ocean Sci. 7, 63–73. doi: 10.5194/os-7-63-2011
Arístegui, J., Tett, P., Hernandez-Guerra, A., Basterretxea, G., Montero, M. F., Wild, K., et al. (1997). The influence of island-generated eddies on chlorophyll distribution: a study of mesoscale variation around Gran Canaria. Deep-Sea Res. 44, 71–96. doi: 10.1016/S0967-0637(96)00093-3
Assunção, R. V., Silva, A. C., Amédée, R., Bourlès, B., Silva, C. H. S., Ternon, J. F., et al. (2020). 3D characterisation of the thermohaline structure in the southwestern tropical Atlantic derived from functional data analysis of in situ profiles. Prog. Oceanogr. 187:102399. doi: 10.1016/j.pocean.2020.102399
Assunção, R. V., Silva, A. C., Martins, J., and Flores, M. M. (2016). Spatial-Temporal variability of the thermohaline properties in the coastal region of Fernando de Noronha Archipelago. Brazil. J. Coast. Res. Special Issue 75, 512–516. doi: 10.2112/SI75-103.1
Bentamy, A., and Croizé-Fillon, D. (2011). Gridded surface wind fields from Metop/ASCAT measurements. Int. J. Remote Sens. 33, 1729–1754. doi: 10.1080/01431161.2011.600348
Bertrand, A., Alory, G., Chaigneau, A., Eldin, G., Grelet, J., Devesa, J., et al. (2017). ABRACOS 2 Cruise - Physical Datasets. SEANOE, doi: 10.17882/76352
Bertrand, A., Costa Da Silva, A., Chaigneau, A., Eldin, G., Roubaut, F., Grelet, J., et al. (2015). ABRACOS Cruise - Physical Datasets. SEANOE, doi: 10.17882/76696
Bourlès, B., Molinari, R. L., Johns, E., Wilson, W. D., and Leaman, K. D. (1999). Upper layer currents in the western tropical North Atlantic (1989–1991). J. Geophys. Res. 104, 1361–1375. doi: 10.1029/1998JC900025
Brandt, P., Hormann, V., Bourlès, B., Fischer, J., Schott, F. A., Stramma, L., et al. (2008). Oxygen tongues and zonal currents in the equatorial Atlantic. J. Geophys. Res. 113:C04012. doi: 10.1029/2007JC004435
Chaves, T. B. C., Mafalda, J. R. P., Santos, C., Souza, C. S., Moura, G., Sampaio, J., et al. (2006). Planktonic biomass and hydrography in the Exclusive Economic Zone of Brazilian Northeast. Trop. Oceanogr. 34, 12–30.
Chérubin, L. M., and Garavelli, L. (2016). Eastern Caribbean circulation and island mass effect on St. Croix, US Virgin Islands: a mechanism for relatively consistent recruitment patterns. PLoS One 11:e0150409. doi: 10.1371/journal.pone.0150409
Djakouré, S., Penven, P., Bourlés, B., Veitch, J., and Koné, V. (2014). Coastally trapped eddies in the north of the gulf of guinea. J. Geophys. Res. 119, 6805–6819. doi: 10.1002/2014JC010243
Donlon, C. J., Martin, M., Stark, J., Roberts-Jones, J., Fiedler, E., and Wimmer, W. (2012). The Operational Sea Surface Temperature and Sea Ice analysis (OSTIA). Remote Sens Environ. 116, 140-158. doi: 10.1016/j.rse.2010.10
Dossa, A. N., Silva, A. C., Chaigneau, A., Eldin, G., Araujo, M., and Bertrand, A. (2021). Near-surface western boundary circulation off Northeast Brazil. Prog. Oceanogr. 80:102475. doi: 10.1016/j.pocean.2020.102475
Douglass, E. M., and Richman, J. G. (2015). Analysis of ageostrophy in strong surface eddies in the Atlantic Ocean. J. Geophys. Res. 120, 1490–1507.
Ducet, N., Le Traon, P. Y., and Reverdun, G. (2000). Global high-resolution mapping of ocean circulation from TOPEX/Poseidon and ERS-1 and -2. J. Geophys. Res. 105, 19477–19498. doi: 10.1029/2000JC900063
Fischer, J., Hormann, V., Brandt, P., Schott, F. A., Rabe, B., and Funk, A. (2008). South Equatorial 834 Undercurrent in the western to central tropical Atlantic. Geophys. Res. Lett. 35:L21601. doi: 10.1029/2008GL035753
Foltz, G. R., Brandt, P., Richter, I., Rodriguez-Fonseca, B., Hernandez, F., Dengler, M., et al. (2019). The Tropical Atlantic Observing System. Front. Mar. Sci. 6:206. doi: 10.3389/fmars.2019.00206
Garnesson, P. (2013). Global Ocean Chlorophyll, PP and PFT (Copernicus-GlobColour) From Satellite Observations - Near Real Time. Available online at: https://sextant.ifremer.fr/record/bc19d37d-fa0d-4035-b80e-33a15e7e29e4/
Goes, M., Molinari, R., Da Silveira, I., and Wainer, I. (2005). Retroflections of the North Brazil Current during February 2002. Deep-Sea Res. I 52, 647–667. doi: 10.1016/j.dsr.2004.10.010
Grasshoff, K., Ehrhardt, M., and Kremling, K. (1983). Methods of Seawater Analysis. Hoboken NJ: Wiley.
Grodsky, S. A., Carton, J. A., and McClain, C. R. (2008). Variability of upwelling and chlorophyll in the equatorial Atlantic. Geophys. Res. Lett. 35:L03610. doi: 10.1029/2007GL032466
Hounsou-Gbo, G. A., Araujo, M., Bourlès, B., Veleda, D. R. A., and Servain, J. (2015). Tropical Atlantic contributions to strong rainfall variability along the Northeast Brazilian coast. Adv. Meteorol. 2015:902084. doi: 10.1155/2015/902084
Hounsou-Gbo, G. A., Servain, J., Araujo, M., Caniaux, G., Bourlès, B., Fontenele, D., et al. (2019). SST Indexes in the tropical South Atlantic for Forecasting Rainy Seasons in Northeast Brazil. Atmosphere 10:335. doi: 10.3390/atmos10060335
Houry, S., Dombrowsky, E., De Mey, P., and Minster, J. (1987). Brunt-vaisala frequency and rossby radii in the south Atlantic. J. Phys. Oceanogr. 17, 1619–1626. doi: 10.1175/1520-04851987017<1619:BVFARR>2.0.CO;2
Joyce, T. M. (1989). On in situ “calibration” of shipboard ADCPs. J. Atmos. Oceanic Technol. 6, 169–172.
Lessa, R. P. T., Mafalda, P. Jr., Advincula, R., Lucchesi, R. B., Bezerra, J. L. Jr., Vaskejr, T., et al. (1999). Distribution and abundance of ichthyoneuston at seamounts and islands off North-Eastern Brazil. Arch. Fish. Mar. Res. 47, 239–252.
Lévy, M., Franks, P. J. S., and Smith, K. S. (2018). The role of submesoscale currents in structuring marine ecosystems. Nat. Commun. 9:4758. doi: 10.1038/s41467-018-07059-3
Lumpkin, R., and Garzoli, S. L. (2005). Near-surface circulation in the tropical Atlantic Ocean. Deep Sea Res Part I 52, 495–518. doi: 10.1016/j.dsr.2004.09.001
Mahadevan, A. (2016). The impact of submesoscale physics on primary productivity of plankton. Ann. Rev. Mar. Sci. 8, 161–184. doi: 10.1146/annurev-marine-010814-015912
Nogueira Neto, A. V., Giordani, H., Caniaux, G., and Araujo, M. (2018). Seasonal and interannual mixed-layer heat budget variability in the western tropical Atlantic from Argo floats (2007–2012). J. Geophys. Res. Oceans. 123, 5298–5322. doi: 10.1029/2017JC013436
Pollard, R. T., and Read, J. F. (1989). A method for calibrating ship-mounted acoustic doppler profilers and the limitations of gyro compasses. J. Atmos. Oceanic Technol. 6, 859–865.
Pujol, M.-I., Faugère, Y., Taburet, G., Dupuy, S., Pelloquin, C., Ablain, M., et al. (2016). DUACS DT2014: the new multi-mission altimeter data set reprocessed over 20 years. Ocean Sci. 12, 1067–1090. doi: 10.5194/os-12-1067-2016
Schott, F. A., Dengler, M., Brandt, P., Affler, K., Fischer, J., Bourlès, B., et al. (2003). The zonal currents and transports at 35W in the tropical Atlantic. Geophys. Res. Lett. 30:1349. doi: 10.1029/2002GL016849
Schott, F. A., Fischer, J., and Stramma, L. (1998). Transports and pathways of the upper-layer circulation in the western tropical Atlantic. J. Phys. Oceanogr. 28, 1904–1928.
Servain, J., Caniaux, G., Kouadio, Y. K., McPhaden, M. J., and Araujo, M. (2014). Recent climatic trends in the tropical Atlantic. Clim. Dyn. 34, 3071–3089. doi: 10.1007/s00382-014-2168-7
Servain, J., Picaut, J., and Merle, J. (1982). Evidence of remote forcing in the equatorial Atlantic Ocean. J. Phys. Oceanogr. 12, 457–463.
Silveira, I. C. A., Miranda, L. B., and Brown, W. S. (1994). On the origins of the North Brazil Current. J Geophys. Res. 99, 501–522.
Simoes-Sousa, I. T., Silveira, I. C. A., Tandon, A., Flierl, G. R., Ribeiro, C. H. A., and Martins, R. P. (2021). The Barreirinhas Eddies: Stable Energetic Anticyclones in the Near-Equatorial South Atlantic. Front. Mar. Sci. 8:617011. doi: 10.3389/fmars.2021.617011
Stramma, L., and Schott, F. (1999). The mean flow field of the tropical Atlantic Ocean. Deep Sea Res II 46, 279–303.
Taburet, G., Sanchez-Roman, A., Ballarotta, M., Pujol, M.-I., Legeais, J.-F., Fournier, F., et al. (2019). DUACS DT-2018: 25 years of reprocessed sea level altimeter products. Ocean Sci. 15, 1207–1224. doi: 10.5194/os-15-1207-2019
Tchamabi, C., Araujo, M., Silva, M. A., Bourlès, B., and Travassos, P. (2018). Ichthyoplankton transport around the Brazilian Fernando de Noronha archipelago and Rocas Atoll: are there any connectivity patterns ? Indian J. Geo Mar. Sci. 47, 812–818.
Tchamabi, C. C., Araújo, M., Silva, M., and Bourlès, B. (2017). A study of the Brazilian Fernando de Noronha Island and Rocas Atoll wakes in the tropical Atlantic. Ocean Model 111, 9–18. doi: 10.1016/j.ocemod.2016.12.009
Travassos, P. E. P. F., Hazin, F. H. V., Zagaglia, J. R., Rocha, R. A., and Schober, J. (1999). Thermohaline structure around seamounts and islands off Northeast Brazilian coast. Arch. Fish. Mar. Res. 47, 211–222.
Tsuchiya, M. (1986). Thermostads and circulation in the upper layer of the Atlantic Ocean. Prog. Oceanogr. 16, 235–267.
Keywords: mesoscale activity, satellite data, western tropical Atlantic, shipboard measurements, island wake, central South Equatorial Current, South Equatorial Undercurrent
Citation: Costa da Silva A, Chaigneau A, Dossa AN, Eldin G, Araujo M and Bertrand A (2021) Surface Circulation and Vertical Structure of Upper Ocean Variability Around Fernando de Noronha Archipelago and Rocas Atoll During Spring 2015 and Fall 2017. Front. Mar. Sci. 8:598101. doi: 10.3389/fmars.2021.598101
Received: 23 August 2020; Accepted: 30 March 2021;
Published: 23 April 2021.
Edited by:
Miguel A. C. Teixeira, University of Reading, United KingdomReviewed by:
Zhongxiang Zhao, University of Washington, United StatesCopyright © 2021 Costa da Silva, Chaigneau, Dossa, Eldin, Araujo and Bertrand. This is an open-access article distributed under the terms of the Creative Commons Attribution License (CC BY). The use, distribution or reproduction in other forums is permitted, provided the original author(s) and the copyright owner(s) are credited and that the original publication in this journal is cited, in accordance with accepted academic practice. No use, distribution or reproduction is permitted which does not comply with these terms.
*Correspondence: Alex Costa da Silva, YWxleC5jc2lsdmFAdWZwZS5icg==
Disclaimer: All claims expressed in this article are solely those of the authors and do not necessarily represent those of their affiliated organizations, or those of the publisher, the editors and the reviewers. Any product that may be evaluated in this article or claim that may be made by its manufacturer is not guaranteed or endorsed by the publisher.
Research integrity at Frontiers
Learn more about the work of our research integrity team to safeguard the quality of each article we publish.