
95% of researchers rate our articles as excellent or good
Learn more about the work of our research integrity team to safeguard the quality of each article we publish.
Find out more
ORIGINAL RESEARCH article
Front. Mar. Sci. , 24 February 2021
Sec. Coastal Ocean Processes
Volume 8 - 2021 | https://doi.org/10.3389/fmars.2021.585396
This article is part of the Research Topic Coastal Extension of CMEMS Products. Models, Data and Applications View all 24 articles
In the Mediterranean Sea unique environmental characteristics and sensitive assets coexist with intense maritime traffic that is represented by frequent daily passages of vessels along the main waterways. In order to assess the risk of oil stranding in case of at-sea emergencies and provide key products for environmental agencies or policymakers preparedness, a geographically relocatable, operational numerical system is implemented and tested. The system relies on the application of oceanographic and particle tracking models and is able to provide, on a high-resolution and unstructured computational grid, a 3-days forecast of those variables known as the main drivers of oil slicks at sea. The risk of potential oil stranding is computed through a combination of anthropogenic hazard and shoreline vulnerability. The sources of hazard vary on time and space in relation to local maritime vessel traffic. The shoreline vulnerability is based on the current knowledge of slope, main grain size, geology of rocks, and occurrence of manmade structures at coast. The operational system is enriched by a web graphical user interface and includes automatic and on-demand working modes. Its functionality is demonstrated in the Strait of Bonifacio (western Mediterranean Sea), area with a high potential risk of oil stranding due to an intense maritime traffic. Risk assessment is hence computed for a test year, the 2018. Critical values of risk are found in correspondence of long stretches of littoral while many of them are currently characterized by a low anthropogenic pressure. The results emphasize the geomorphological features of the shorelines as reducing or amplifying factors to any potential impact of oil stranding at coast.
At the end of 2019 the European Maritime Safety Agency has published traffic density maps (European Maritime Safety Agency, 2019) which provide an astonishing description of ship movement patterns to both professionals and the public. These products raise citizen’s awareness and encourage science and authorities to implement operational risk management systems. Their objective is to improve marine traffic planning to enhance ship safety and adequately protect the coastal environment from damaging consequences of potential pollution events.
The Mediterranean Sea is a major shipping routes with about 30% of the total world vessel traffic (Campana et al., 2017). Its space hosts important transit routes for international shipping activities. Thousands of cargos, oil tankers and all kind of vessels populate the sea routes and overcrowd sea straits like the busy Gibraltar and Bosporus straits, the Strait of Sicily and the straits of Messina and Bonifacio.
The Mediterranean Quality Status Report (2017) of the United Nations Environmental Programme cites a correlation between vessel traffic density and accidents causing pollution, being collisions, the first cause of accidents resulting in an oil spill. REMPEC (2008) estimated that 18%, or 421 million tons, of global seaborne crude oil shipments took place through the Mediterranean Sea in 2006. Thus, the routes of oil tankers are one of the main sources of danger that exacerbates the risk of an oil spill accident or a deliberate illegal discharge.
Moreover, maritime traffic may also affect the high biodiversity of the Mediterranean Sea being one of the major threats for marine environment in terms of collisions with cetaceans (Pennino et al., 2016; Ritter and Panigada, 2019), noise, alien species, and pollution (Abdulla and Linden, 2008; Coll et al., 2012). In particular, chemical pollution by oil or other toxic substances severely impact on water, fauna, flora and seabed sediments, and such an impact becomes more manifest when trails of pollution reach the littorals. There, except for relatively limited industrial areas, many social and economic activities (tourism, fisheries, and spin-off companies) often rely on a good environmental status of the ecosystem. In Italy, national parks like Cinque Terre, the Tuscany (northern Tyrrhenian Sea), and La Maddalena (Sardinia) archipelagos and the Sardinian Asinara Island embrace extended shorelines, representing, along with the marine protected areas, a high environmental, social and hence economic value for the country.
In response to international regulations and recommendations (see United Nations Convention on the Law of the Sea—UNCLOS) national and local authorities have currently available numerous operational risk management systems that can provide pollutants hazard assessment scenarios or a rapid hazard evaluation in case of unexpected at-sea accidents. These systems are mostly based on the application of the particle-tracking models (PTMs) to predict the trajectory of pollutants dispersion under specific meteorological and marine conditions.
Over years, commercial companies or research institutions that are often involved to provide risk assessments in case of accident, have developed PTMs based on structured computational grid (e.g., Caballero et al., 2008; Sotillo et al., 2008; Coppini et al., 2011; Liubartseva et al., 2016; Zodiatis et al., 2016; Sorgente et al., 2020) or based on unstructured computational grid like those presented by Chen et al. (2007); Azevedo et al. (2009), Wang and Shen (2010), Olita et al. (2012), and Cucco et al. (2012). The former approaches offer successful results in the open sea, defining shape of the slick and its volume changes in relation to weathering processes, the latter find appropriate application into irregular sea domains with a complex bathymetry and provide, in addition, efficient and detailed indications on pollutants displacement.
The PTMs based on unstructured computational grids allow high spatial resolution for those parts of the domain where it is required, and they can provide hazard information at the same spatial scale of the littoral’s vulnerability information. Adopting this type of tool, the authors aim to realize an operational numerical system to support the oil stranding risk preparedness and predict the risk that unexpected oil spills could impact the littorals of the high-density vessel traffic area of the Strait of Bonifacio and its surroundings (see www.seaforecast.cnr.it/sicomarplus/index.php/en). The preparedness can actually reduce the risk that many sensitive littorals could suffer of a potential oil stranding with consequent long natural recovery and it relies on the scientific knowledge of local environmental forcing and coastal vulnerability. The latter is defined on the base of the main geomorphological features of the littorals that will modulate the risk computation in the domain of investigation revealing unexpected critical states along pristine traits of coast.
The numerical system is indeed designed to combine the current knowledge of the local environment features with technological innovations, improving decision making. This is possible through the production of risk assessment scenarios that, for the first time in this region, include the evaluation of vulnerability in correspondence of the littoral and the adoption of a dynamical source of hazard, represented by the spatial and temporal variations of the vessel traffic information.
The numerical system consists of a coupled suite of oceanographic and PTM models, a vulnerability database and a risk computation engine. The essentials of the system have been applied in previous studies of waves, hydrodynamics and pollutant surface transport in shallow waters and coastal seas (e.g., Cucco et al., 2012; Canu et al., 2015). Ad hoc designed web graphical user interface is also implemented to easily manage the system (Figure 1). Hazard is estimated by the PTM solutions that give information on pollutants that can potentially reach the coast within a specific time frame. The potential sources of hazard vary on space and time and they are based on the vessels traffic records1.
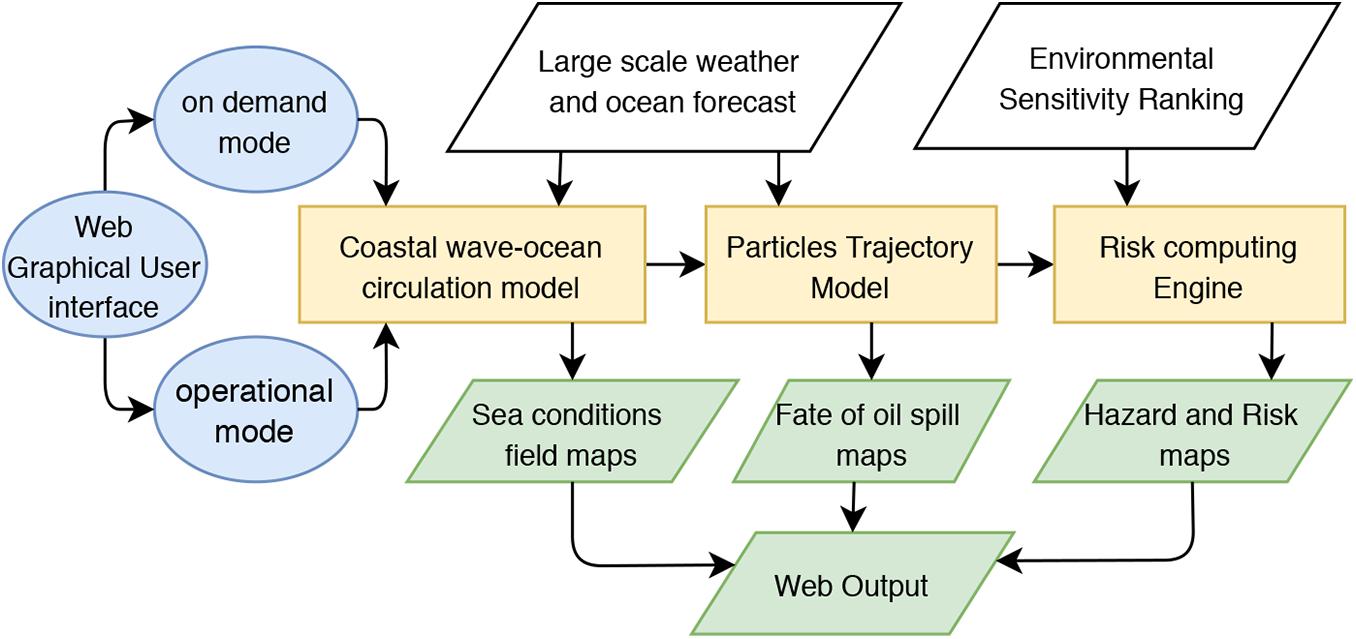
Figure 1. Flow chart representing the functioning scheme of the numerical system for oil stranding risk assessment.
Vulnerability information are derived by the intrinsic properties of the land-sea interface like slope, geology of rocks, and grain size that can reduce or amplify the littoral vulnerability in case of pollutants stranding (Gundlach et al., 1978; Wang et al., 2005; Olita et al., 2012; Grottoli and Ciavola, 2019).
The risk is computed in purely quantitative terms, resulting from the linear interaction between anthropogenic hazard and the in-situ vulnerability (e.g., Christensen et al., 2003; United Nations/Inter-Agency Secretariat of the International Strategy for Disaster Reduction, 2004; Azevedo et al., 2009 for vocabulary; De Lange et al., 2010).
The functioning of the system is demonstrated through the computation of an oil stranding risk assessment scenario in the coastal domain of the Strait of Bonifacio (SoB domain, hereafter), a busy strait to navigate between the north-western Tyrrhenian Sea at east and the Algero-Provençal basin (western Mediterranean Sea) at west. All products are computed for the test year 2018.
The main geophysical features of the SoB and its surrounding are described in section “Site Description.” All components and the functioning of the operational numerical system along as the innovations in hazard, vulnerability and risk metric are described in section “Materials and Methods.” The main outcomes of the system like the sea conditions operational products, vulnerability, hazard and risk assessment are explained in section “Results.” In section “Discussion,” a synthesis of the adopted approach and the results are discussed in relation to the recent literature to draw the main conclusions (section “Conclusion”).
The domain of the SoB is part of the Pelagos Sanctuary2 and it hosts a French and an Italian marine national park. The strait is connecting the Tyrrhenian Sea and the western Mediterranean Sea (Figures 2A,B) with a narrow passage in the east, due to shallow waters around Lavezzi (Corsica) and La Maddalena (Sardinia) archipelagos and a wider passage in the west that is opening to the Gulf of Asinara. The average depth of the strait is approximately 70 m with eastern and western openings slowly increasing at about 100 m before approaching the continental slope, where strong bathymetric gradients occur (Cucco et al., 2012).
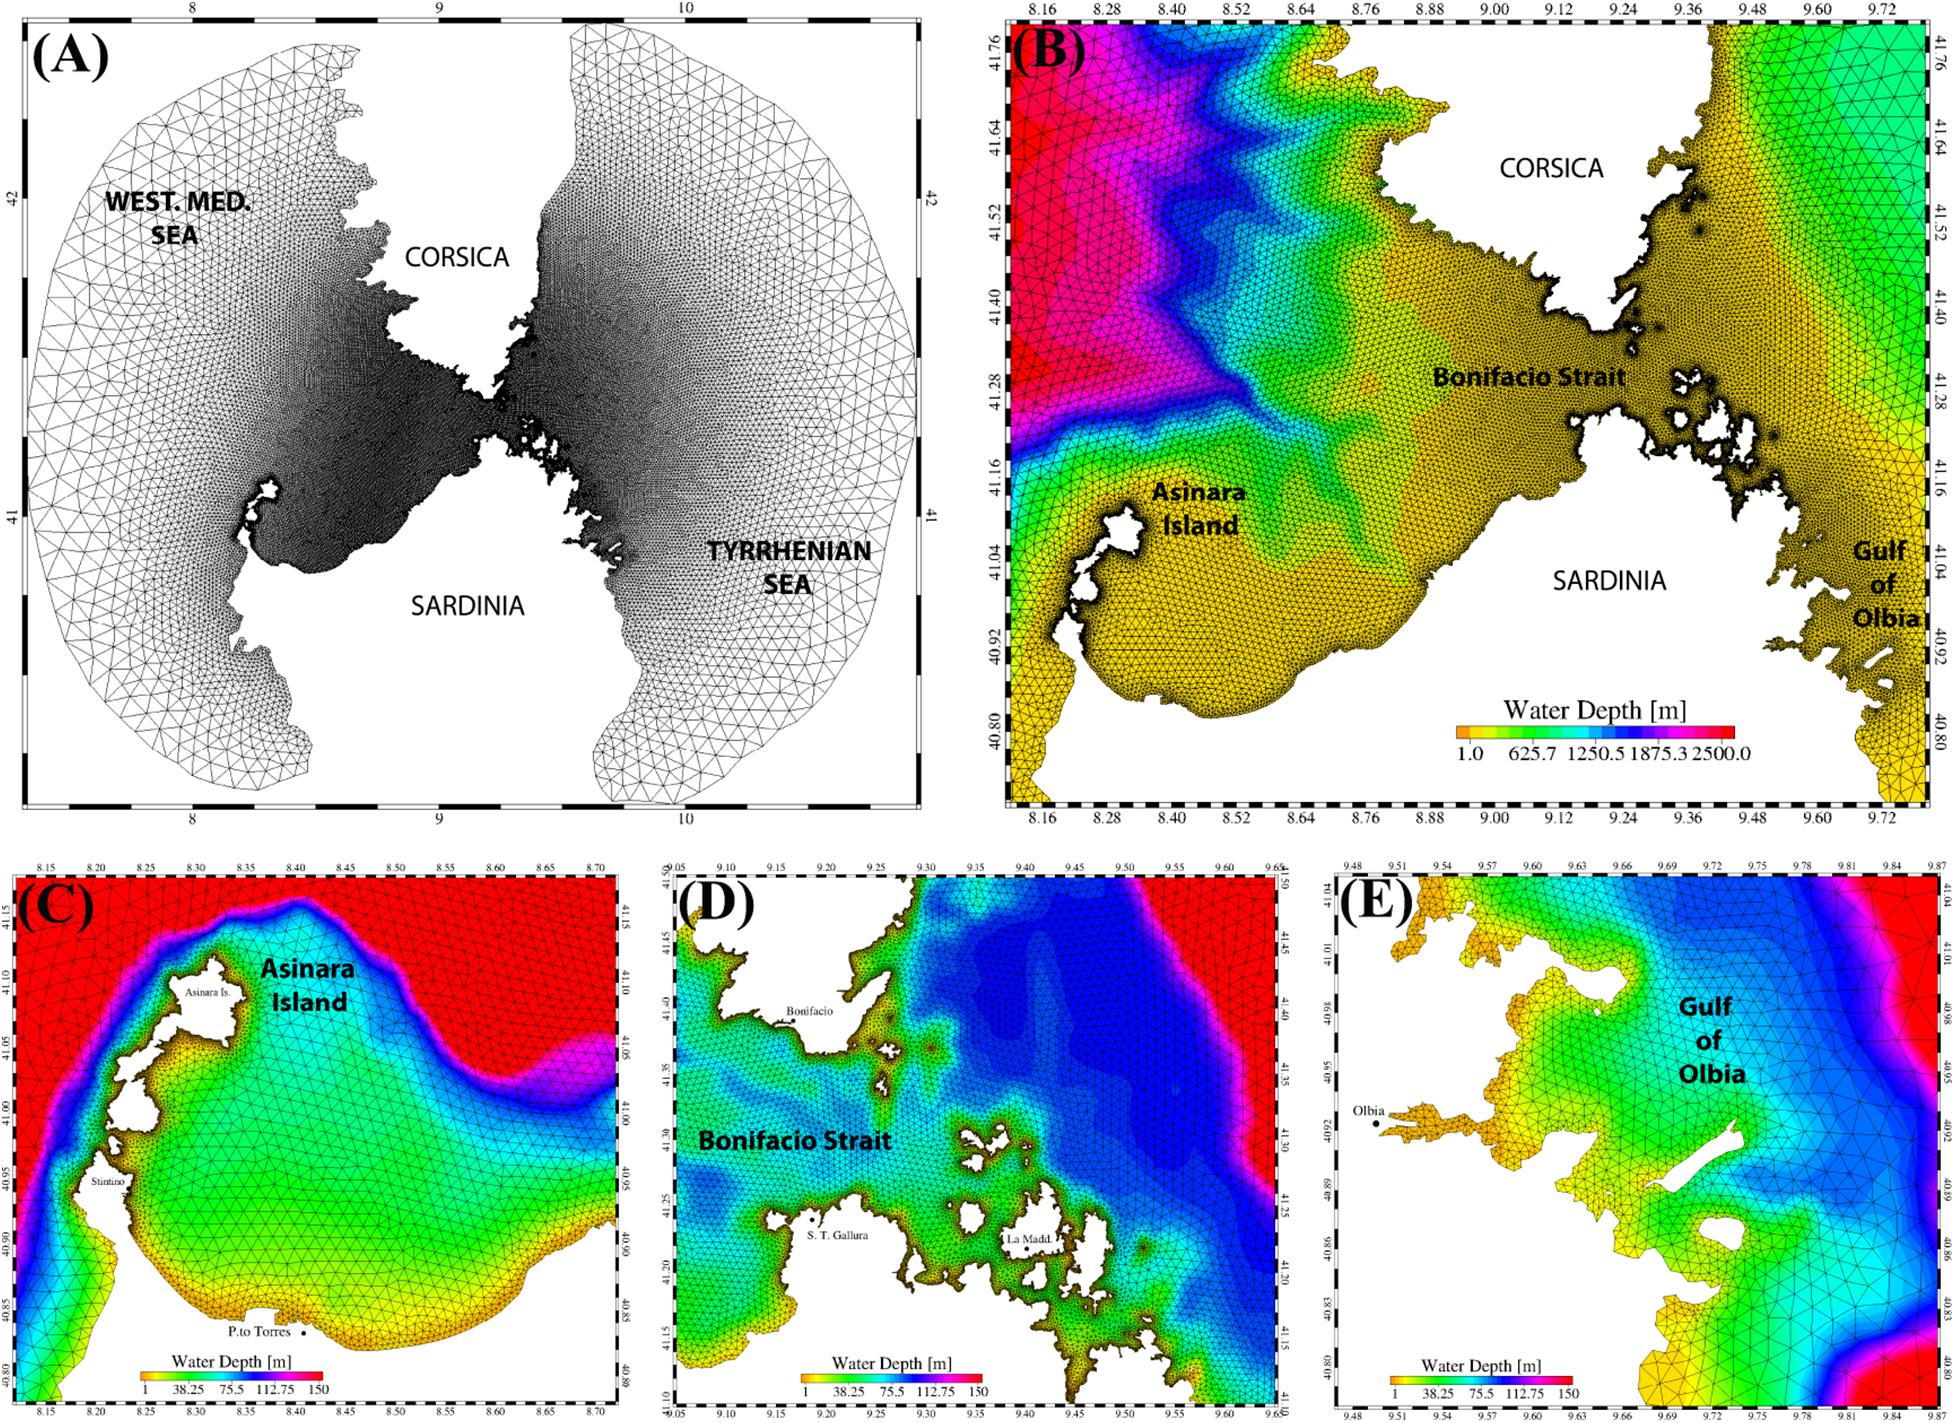
Figure 2. Finite element computational mesh and bathymetry representing the hydrodynamic and wave model domain. Panels represent the entire mesh (A,B) and the zoom for the Gulf of Asinara (C), the Strait of Bonifacio (D), and the Gulf of Olbia (E).
The winds are blowing around 10 months to a year and the north-western Mistral and the south-western Libeccio, primary wind regimes, can often exceed the maximum speed of 16 m/s (Cucco et al., 2012).
The river inflows are characterized by a torrential regime determining a weak variation of salinity that is ranging in between 37.7 and 38.8 PSU throughout the year. Sea surface waters temperatures approximatively vary from 15°C in early spring, to 25°C in late autumn (Artale et al., 1994; Cucco et al., 2012).
The tidal forcing is weak (Cucco et al., 2012) and the sea current circulation is mainly wind driven with observed maxima near 1.46 m/s (Gerigny et al., 2011). The pressure gradients between the adjacent basins (Artale et al., 1994) and its interaction with local bathymetry determine the deep waters dynamics.
Wave events may be severe at the entrances of the SoB. The analysis of a 10 years (2007–2017) dataset, derived by a wave model hindcast (Copernicus Marine Service, 2020) gives significant wave height maxima of 6.4 m at the east side (41.36° N, 9.61° E) and 7.54 m at the west (41.40° N, 9.0° E) side of the SoB. In the first case the mean wave direction is from the north, in the second case from the north-west (Life – European Project, 2020, Life17CCM/IT/000121).
In the narrow ship transit corridor of the SoB the navigation may hence be dangerous, representing a relevant threat for its sensitive space. During the period 2000–2009, the Italian national system of maritime traffic control has recorded 35,188 transits through the SoB with numerous transits of high bunker volumes vessels, which are associated with a medium and high potential risk index (Sorgente et al., 2012).
Although in the course of such a decade vessel transits started a sensibly reduction (Sorgente et al., 2012), since 1972, 29 ships accidents were documented (La Stampa in English, 2019) and recent examples are given by the ship collision between the cargo vessel Cls Virginia and the RO-RO Ulysse, off Capo Corso (Corsica, October 2018), and by the case of Rhodanus General Cargo Ship stranded in the south-east of Corsica (October 2019).
The core of the system is an evolution of previous ones that have been developed in the context of the European and Italian research projects SOS-Piattaforme e Impatti Offshore (Ribotti et al., 2019; Sorgente et al., 2020) and the Mediterranean Decision Support System for Marine Safety (Zodiatis et al., 2016). It is based on SHYFEM (Umgiesser et al., 2004), a suite of high-resolution numerical finite elements models describing waves, sea current dynamics and the fate of advected pollutants at the sea surface (Cucco et al., 2012; Canu et al., 2015).
The numerical tools are implemented over a shared unstructured mesh (Figure 2A) with a spatial resolution ranging in between 20 km offshore and 100 m in correspondence of specific focuses in the SoB domain (Figures 2B–E). Indeed, size and shape of the elements is variable, and the element density is higher along the coasts and in correspondence of specific sites like small islands. The vertical dimension is discretized by 30 uneven z-levels and the depth of each layer is varying between 2 m, for the surface, and 200 m, for the bottom. The mesh is constituted by about 93,000 triangular elements with a total of about 50,000 computational nodes.
The hydrodynamic 3D model resolves the shallow water equations integrated over each layer in their formulations with water levels and transports. The equation system reads as:
where l indicates the vertical layer, (Ul,Vl) the horizontal transport components in x and y directions for each layer, and the advective terms, f the Coriolis parameter, pa the atmospheric pressure,g the gravitational constant, ζ the sea level, ρ0 the typical water density, ρ = ρ′ + ρ0 the water density, τ the internal stress term at the top and bottom of each layer, hl the layer thickness, Hl the depth of the bottom of the layer l, AH the horizontal eddy viscosity (Smagorinsky, 1993) and, the gradients of wave-induced surface stresses in the x and y directions, respectively. The General Ocean Turbulence Model (Burchard and Petersen, 1999) is used for the computation of the vertical viscosity Kl. Wind and bottom friction terms, corresponding to the boundary conditions of the stress terms (τx,τy), are defined as:
with c_D as the wind drag coefficient, c_B the bottom friction coefficient, ρa the air density (wx,wy) the wind velocity components and (uL,vL) the bottom velocity components.
Two boundaries are open to the basin scale dynamics and they are located at the western and eastern side of the mesh in the Algero-Provencal basin and in the Tyrrhenian Sea, respectively. There, the large-scale sea conditions are defined via Dirichlet formulation for water levels, whereas a nudging procedure was adopted for the temperature and salinity variables (Cucco et al., 2012). At the closed boundaries, only the normal velocity was set to zero, whereas the tangential velocity was a free parameter corresponding to a full slip condition (Umgiesser et al., 2004).
The wave module WWM, solving the random phase spectral action density balance equation for wavenumber-direction spectra (Roland et al., 2009), is used to describe wave patterns. The module describes growth, decay, advection, refraction and diffraction of wind waves due to the wind action, depth gradient and coastal geometry and it provides the gradients of wave-induced surface stress to the hydrodynamic module.
The coupled hydro-wave numerical model provides the oceanographic drivers to the PTM that solves the advection and diffusion equations (Eq. 2) in a Lagrangian framework of reference to predict the particles trajectories (Cucco et al., 2012; Quattrocchi et al., 2016). The PTM equations system reads as:
where uadv, vadv are the advective velocities components and udif, vdif are the diffusive velocities components in x and y directions, respectively.
The components uadv and vadv are solved following:
where u1, v1 are the horizontal velocities computed by the hydrodynamic model for the 1st vertical layer; wx, wy are the wind velocity components; Cc and Cw are the current transport and the wind transport factors.
The horizontal components of the turbulent diffusive velocities, udif and vdif, are computed using a random walk technique on the basis of the Fisher et al. (1979) study, with turbulent diffusion coefficients obtained using the Smagorinsky formula (Smagorinsky, 1993).
The transport of oil particles is mainly due to the direct action of the currents and winds (Caballero et al., 2008; Sotillo et al., 2008; Cucco et al., 2012; Liubartseva et al., 2016), whereas the wave contribution is generally related to emulsification and weathering processes that were considered but not explicitly modeled in this version of the operational numerical system (see Supplementary Material).
The simulation setup of the SHYFEM model for calibration and further runs of the operational numerical system was designed for the case study application of the SoB domain (Figures 2A–E) and the necessary inputs are described in the following.
A calibration procedure was carried out to improves the accuracy of the SHYFEM models in predicting the sea surface transport when different wind regimes take place in the SoB domain. A Trial and Error method was used to reduce the discrepancies between Lagrangian currents measurements, collected during October 2018 and September 2019, and simulated trajectories.
According to statistical procedures found in Cucco et al. (2012), 225 numerical particles were released at each observed drifter position and their trajectories computed. At each run of the model calibration procedure, the values of CD, in Eq. 2, Cw and Cc, in Eq. 4, were changed within their typical ranges. For each run of the model, the obtained results were compared with observations and a trajectories relative error (TRE, see Cucco et al., 2016b, 2019).
where, t is the prediction time lag, x and y the components of the drifter position at the time t, o and m indicating observations and numerical particles and Do indicating the length of the path followed by the drifters at the time t. The average of the TRE computed within the first 6 h from the release (TRE6) was selected as reference metric for estimating the model accuracy.
The calibration procedure brought to an optimal combination of model parameters consisting in to CD = 2.8×10⁻³, Cc = 0.95,and Cw = 4×10⁻³.
In Figure 3, all panels, the observed (black lines) and computed trajectories (blue and gray lines) are reported for the whole set of Lagrangian measurements. The model was able to reproduce the observations with a TRE24 ranging between 0.12 and 0.34. The discrepancies between numerical particles and drifter’s location over the 24 h predictions varied on average between 1.3 km up to around 7.7 km with a best match for short-term experiments A, B, C and E. Long-term experiments, like G and H showed a less accurate but satisfactory agreement between the modeled and observed trajectories, reproducing multiple days trajectories and, in the case G, the drifter landing area.
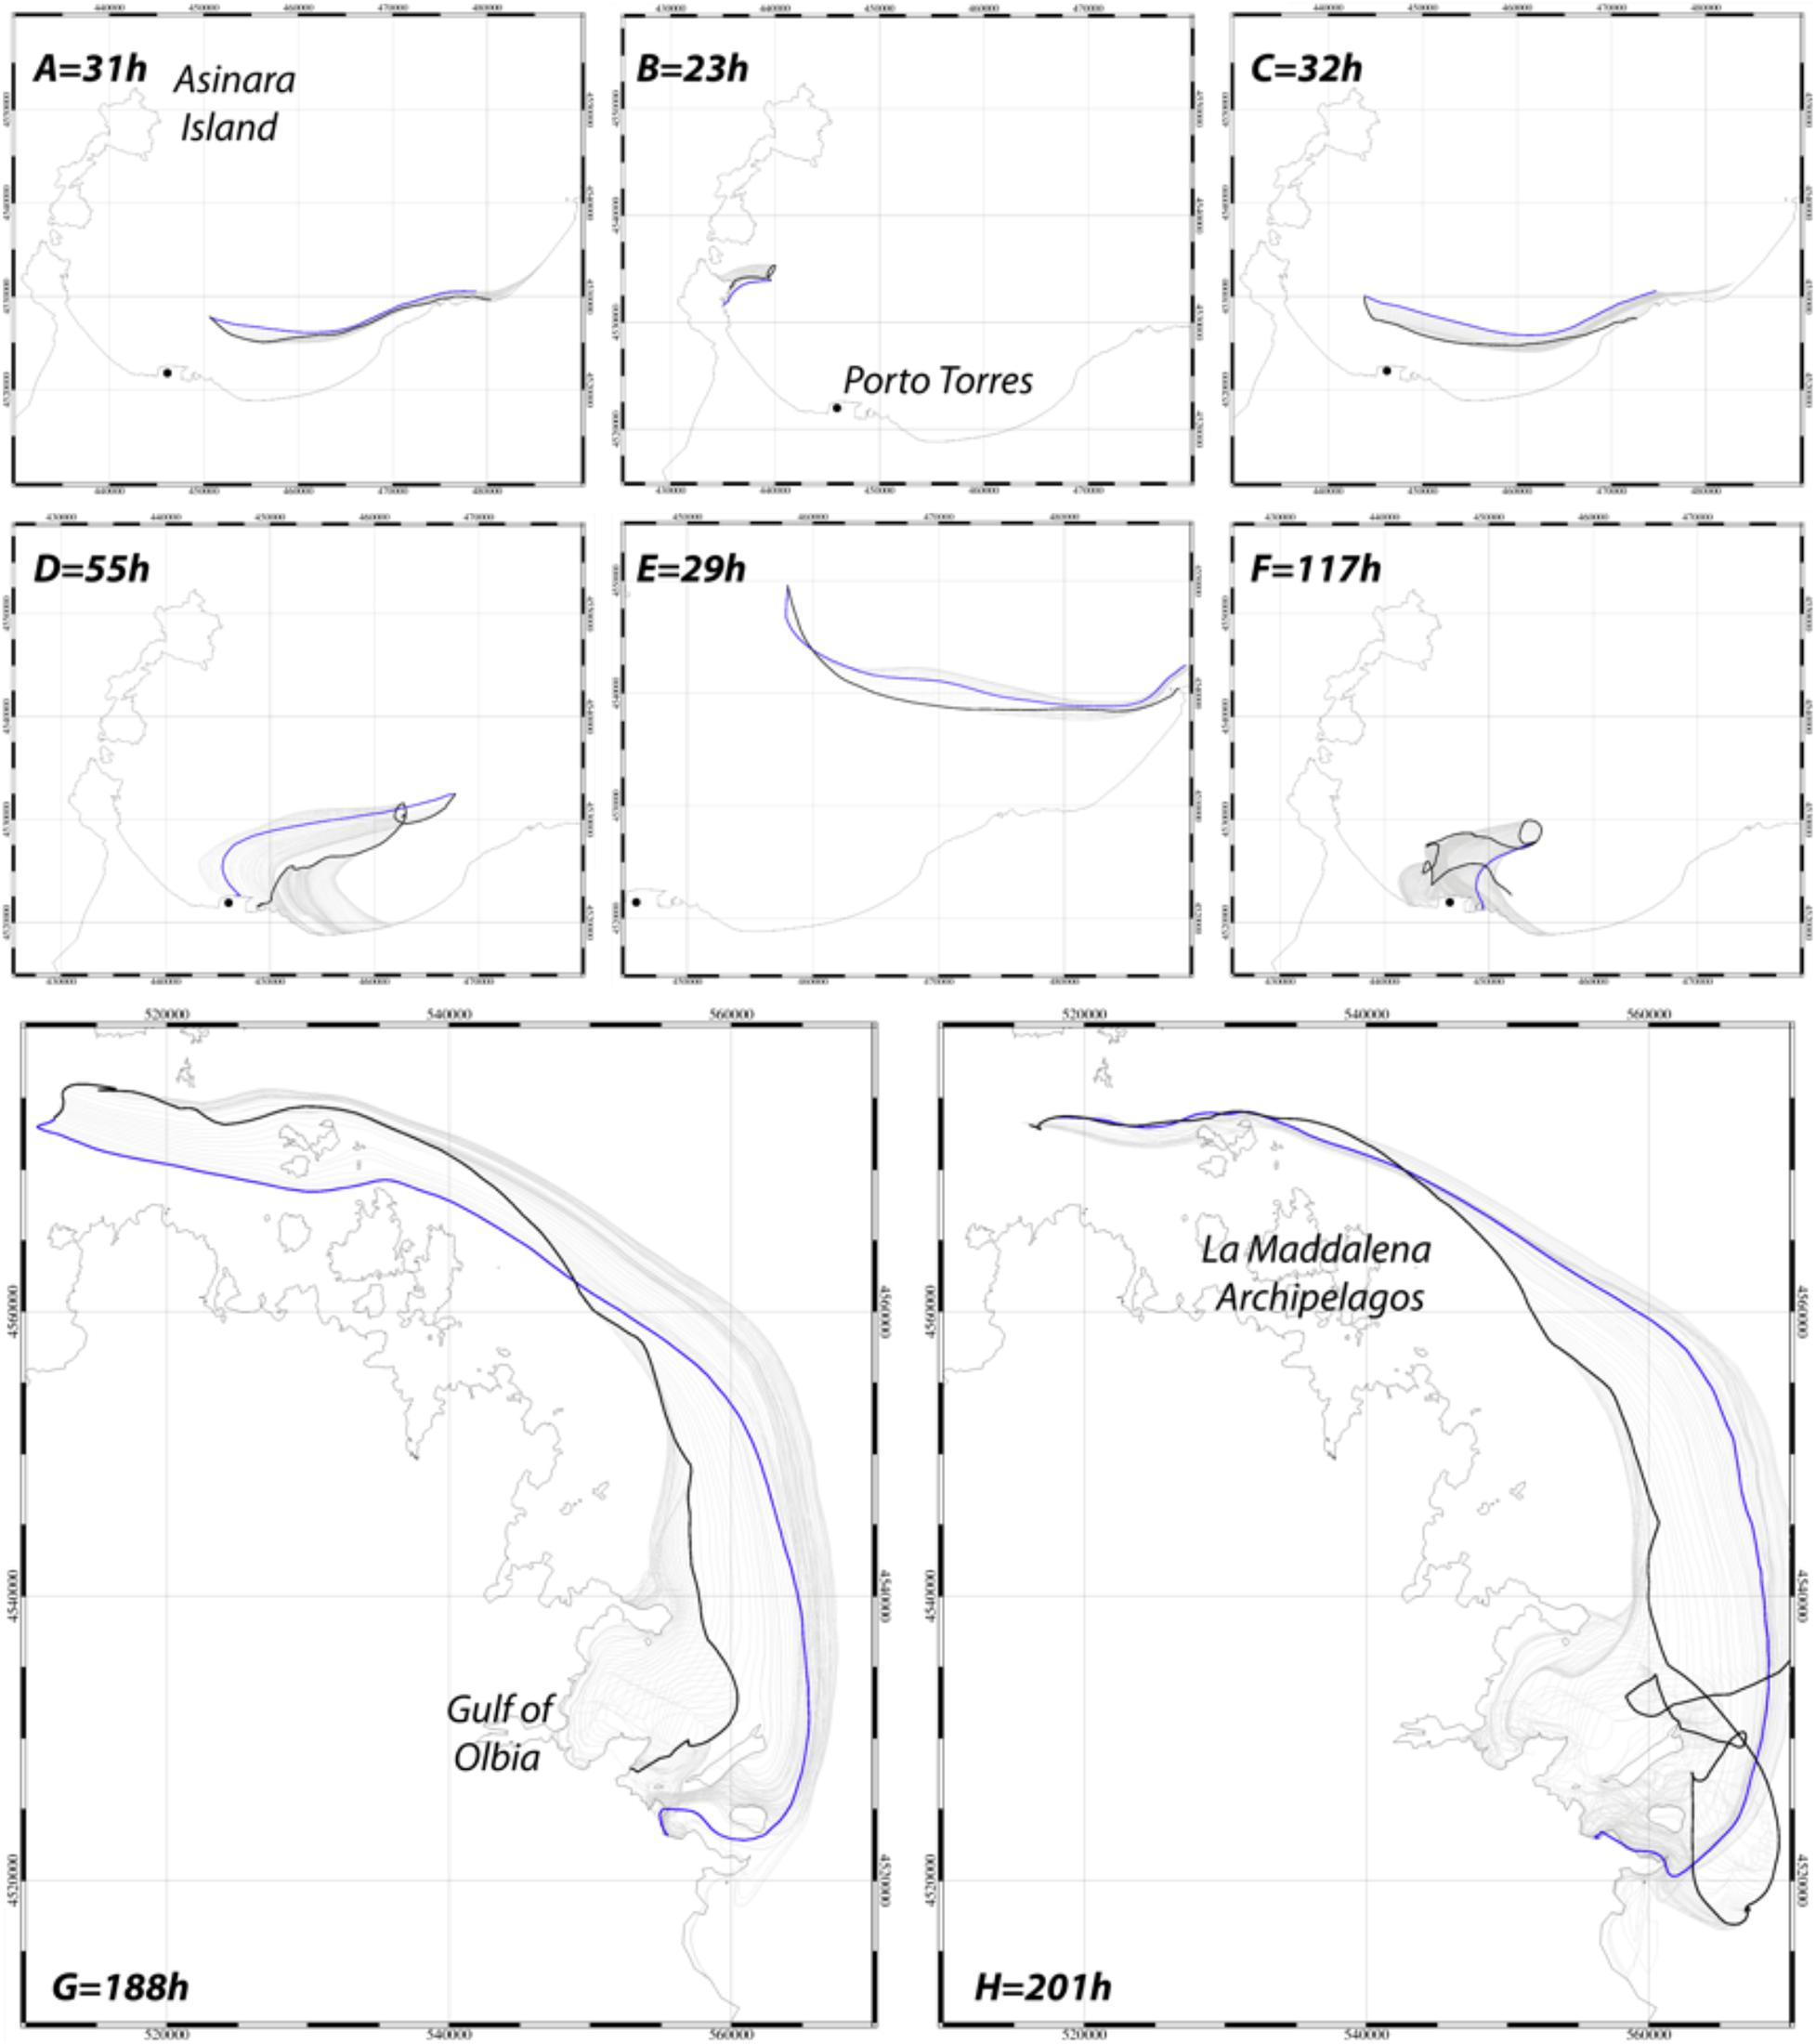
Figure 3. Calibration procedures. Observed and simulated trajectories of the whole set of released drifters. Black lines represent the observed trajectories. Gray lines represent the average trajectories followed by each set of particles that are released at every drifter starting positions. Blue lines the average of the gray lines envelop. Dot indicates the harbor of Porto Torres. Time, in hours, indicates the duration of the measurements.
Atmospheric and ocean analysis and forecast are provided at the top and side open boundaries of the models with a 3- and 24-h frequency, respectively. Atmospheric fluxes are obtained by the European Centre for the Medium-Range Weather Forecasts (ECMWF), the state of art weather forecast system in Europe. Ocean variables are provided on a regular grid of about 4 km. They are derived by the runs of the Mediterranean Forecasting System (Simoncelli et al., 2019) that include a variational scheme for data assimilation and it is released by the Copernicus Marine Service3.
Geomorphologic data, needed to setup the vulnerability index, were obtained by the Regione Sardegna Geodatabase (2020)4, the European Environmental Agency (2005) and with the adoption of the Google Earth software. In order to discretize the available information, squared cells were centered along the shoreline. The choice of a 100 m facet provides an effective description of the main geomorphological features of the coastlines in the SoB domain. Every cell contains relevant information about the enclosed tract of shoreline: the slope of the beaches, the main grain size of their sediments (gravel, sand, or mud), the geology of the rocks (hard rock, eroding rock) and the existence of manmade structures (bank, ports, jetties).
Sources of anthropogenic hazard were derived, for the year 2018, by monthly values of the vessel density, a measure of the shipping traffic in relation to the time and the unit of surface (see text footnote 1). Vessel density is released by means of a georeferenced grid composed by squared cells of 1 km per side and indicating the total time, expressed in hours, per surface unit, expressed in km2, during which the cells are occupied by ships.
For the computation of the risk assessment the sources of hazard and their space-time variation are represented by thousand numerical particles that are released where vessel density is defined for tanker, cargo, and passenger vessels. This choice is justified by the significant threat that such type of vessels represents for the SoB domain, considering their dimensions, dangerous load, and number in Mediterranean waters.
The top picture in Panel A of Figure 4 displays the monthly extent of those areas that, within the SoB domain, are crossed by such type of vessels, highlighting the macroscopic difference between tanker vessels and other categories. The bottom picture in the same panel displays vessel density, per month and for each vessel category showing a weak variability for tanker and cargo vessels all year long and an increase for passenger category during the best weather season.
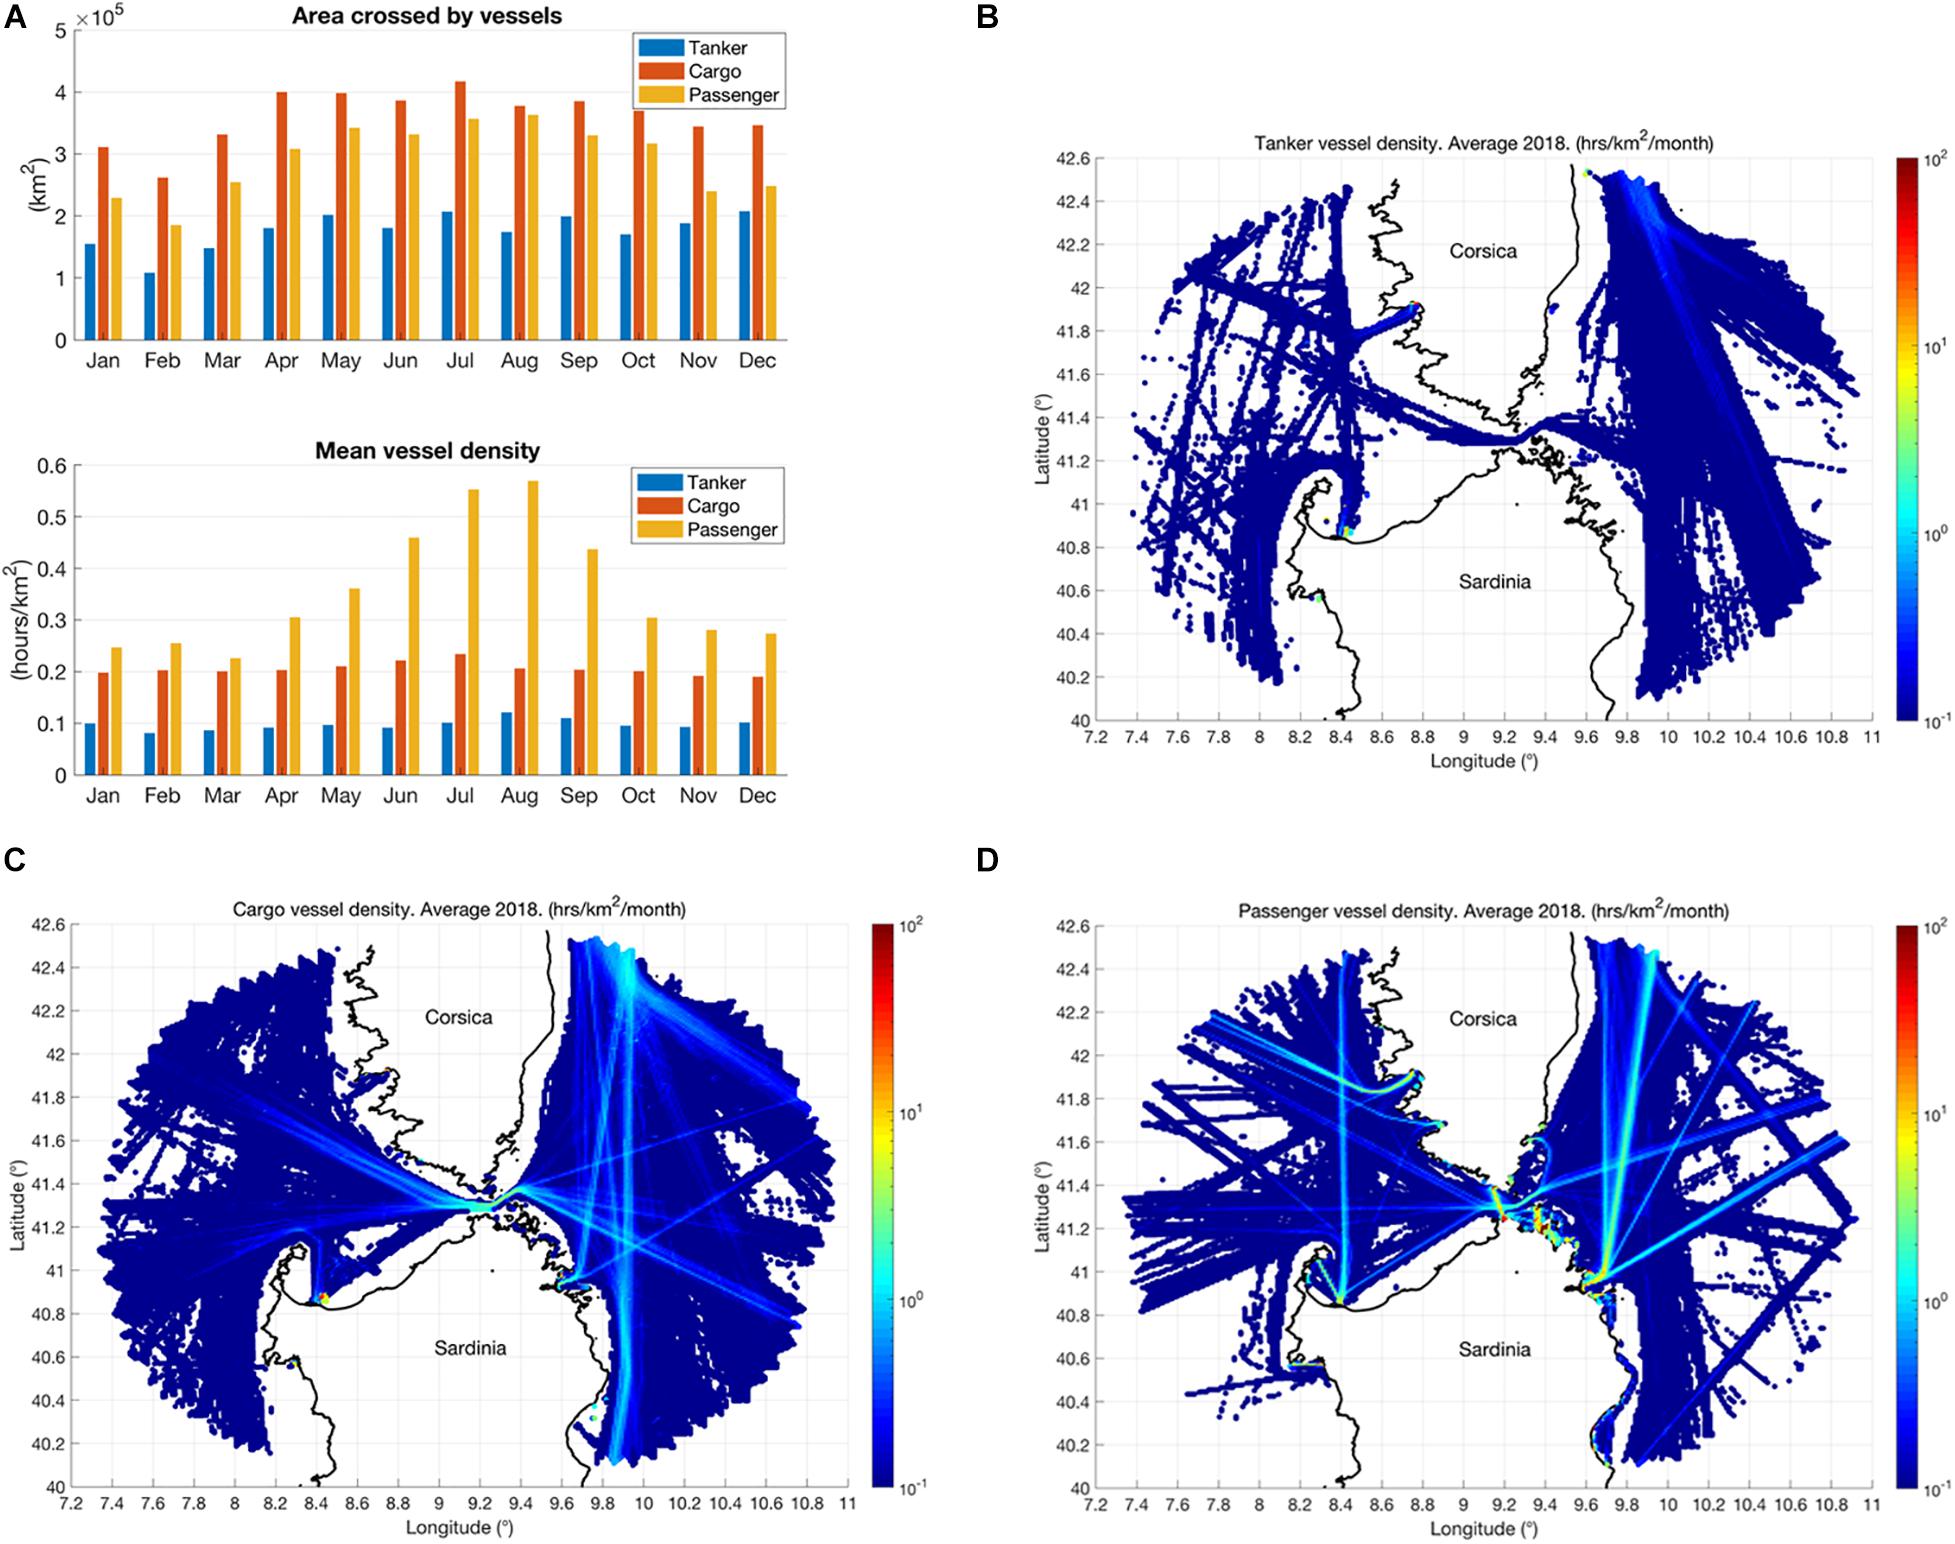
Figure 4. In (A) the area of the SoB domain that is monthly crossed by each type of vessel and related mean vessel density. (B–D) give a geographical representation of the area crossed by each vessel’s category providing annual mean with related vessel density.
In order to provide a geographical representation of the areas crossed by each category of vessels, Figure 4, panels B, C and D, gives annual mean values with the related vessel density. Tanker vessels typically follow a wide route at east, cross the SoB and, at west, they turn around the Asinara Island to reach or leave the industrial harbor of Porto Torres in Sardinia and Corsica, where they probably shelter in the bay. Cargo vessels traffic covers a wide area with high vessel density in correspondence of the SoB and toward the main commercial ports. Passenger vessels, including Ro-Ro, route toward the ports of the main towns where touristic interests are also found.
According to Cutter (1993) the authors consider hazard as the probability of occurrence that a natural or anthropogenic event will affect a specific area within a given time period. The solutions of the hydro-wave model and PTM are used to compute the hazard statistic in correspondence of each discretized coastal segment.
On the basis of the monthly information about the extent of the areas and related vessel density values, numerical particles, representing the dangerous sources are released and they are advected by the PTM in relation to the hydrodynamic and wave conditions. Indeed, for each category of vessel, with daily frequency, a total of 600,000 particles are released per month within a variable area that is representing the density of the shipping routes.
The number of particles is consistent with the maximum spatial resolution of the hydrodynamic model to guarantee that numerical particles are released from all elements of the model mesh. Each particle location was updated computing the transport induced by the currents and the wind with a 300 s time step for a duration of 10 days after the release or until its stranding at coast. The release frequency is the same of the open ocean boundaries update while estimates of weathering processes time scale suggest that evaporation, dispersion, spreading, emulsification, and dissolution acting on the oil volume with immediate effects and within a few days (Coppini et al., 2011; Fernandes, 2018).
During the advection, numerical particles retain memory of the release time and the vessel density at the release location. Therefore, if one or a set of particles strand at coast, hazard is computed for each coastal segment by combining the following indicators:
(i) impact density [m–1], the number of stranded particles per coastal segment length expressed as:
where L is the length of the jth coastal segment and n is the total number of particles that reach the jth coastal segment.
(ii) averaged vessel density [h km–2], the average of the vessel density related to the release point of each stranded numerical particle
where VD, the vessel density, is the number of hours per month that any vessel spends over a squared area of 1-km side and n is the total number of particles that reach the jth coastal segment.
(iii) residual volume of light (VLO) and heavy oil (VHO) associated to the stranded set of particles
where for the jth coastal segment the residual volume over time (t) was obtained by evaluating the average age of such set of particles through specific theoretical volume reduction functions g and f. Indeed, the values of the residual volume of oil associated to a set of stranding particles is computed on the basis of their average age (unit of measure: hours), the average of their ages since release
The functions g and f were defined by fitting the solutions of a process study experiment that was conducted with MEDSLIK_II (Zodiatis et al., 2008; De Dominicis et al., 2013b, Part 1 and Part 2), a community model that is designed to predict the transport and weathering of an oil spill. In fact, MEDSLIK_II was here used to evaluate the effects of the weathering processes on a unitary oil volume under synthetic sea state conditions. The reader can refer to Supplementary Materials for a detailed description of the model simulation setup and related interesting solutions. It is here essential to know that function g describes how for a medium density Arabian crude oil, a type of oil carried by tankers, the unitary volume is reduced by the 55% after 10 days and 45% after 2 days since its release at sea, while function f describes how, for a highly viscous oil typically used as fuel for vessels, the unitary volume is reduced by 72% after 10 days and 52% after 2 days since its release at sea.
Hazard is hence computed for the jth coastal segment and for each type of vessel according to the following equation
where
with the upper case s = {T, C, P} indicating T for tanker, C for cargo and P for passenger vessels, k and m used as weights to consider the type of oil transported by the vessels: k = m = 0.5 if one considers the volume of oil carried by tanker (crude oil plus fuel), k = 1 and m = 0 if we consider the volume of oil carried by cargo or passenger vessels (fuel only).
Vulnerability can be defined as a measure of the weakness of the environmental system that can suffer one or multiple threats (Azevedo et al., 2017 and its reference list). Vulnerability of complex contexts, involving relationship between people and their ecological space, should primarily be related to the intrinsic properties of the environment that can represent weakness or strong points to potential hazard sources, that is, resistance and resilience of the exposed environment modulate the measure of its vulnerability (Salter, 1997; Kleissen et al., 2007; Lahr and Kooistra, 2010).
In the specific case of the intertidal environment, intrinsic properties include shoreline geomorphology that should be considered to evaluate the vulnerability of littorals, where human activities mainly insist and the exposure to pollution events is very high. For these reasons and in the context of the present case study an environmental sensitivity index (ESI rank = {1, 9}) was defined on the basis of the local geomorphologic features (i.e., slope, main grain size, geology, and manmade structures of the littoral), that are described per each 100 m squared cell, centered at the shoreline. The higher is the ESI rank the higher is the vulnerability of the shoreline.
Indeed, in order to assess the vulnerability of specific shorelines to oil stranding, local geomorphologic features were evaluated in relation to the shoreline classification that is found in ESI guidelines, ad hoc established by the National Oceanic and Atmospheric Administration to draw maps of vulnerability (NOAA, 2002).
Similarly as done by NOAA, the authors assigns ESI rank = {1, 2} to high-energy shorelines, regularly exposed to large waves or strong tidal currents during all seasons, ESI rank = {3, 4, 5, 6} to Medium-energy shorelines that often have seasonal patterns in storm frequency and wave size, ESI rank = {7, 8} to low-energy shorelines that are sheltered from wave and tidal energy, except during unusual or infrequent events, ESI rank = {9} to anthropized shorelines. A rapid (from days to weeks) natural removal of stranded oil is associated to those littorals with low values of ESI rank, a slow natural removal (years) is associated to those littorals with high ESI rank values, days to months is the time-scale of oil removal associated to intermediate ESI rank values (NOAA, 2002).
Embracing the expression reported by Azevedo et al. (2017), the risk concept can be defined as the expected losses due to the occurrence of the adverse event for a given time period and specified area, that result from the interaction between the natural or anthropogenic hazard and the vulnerable assets (United Nations/Inter-Agency Secretariat of the International Strategy for Disaster Reduction, 2004; De Lange et al., 2010). The numerical computation of the risk (RI) was hence implemented, along the shoreline and according to the following equation, as the product of the hazard and the ESI indices:
where the risk is computed for jth coastal segment and for each type of vessels s = {T, C, P}.
The approximation in Eq. 13 excludes the values of other exposed elements, such as human lives, sensitive infrastructure and cultural heritage but it provides a straight and reasonable assessment of the risk (Blong, 1996; Sayers et al., 2002), leaving decision makers free to adopt proper management solutions in relation to a wider range of vulnerable elements.
The computed risk can change on the base of the adopted definition of hazard sources and/or vulnerability. Thus, for the sake of a clear representation and further comparisons with other risk assessment, the risk values are normalized by their maximum value, providing a scale that is ranging in between 0 and 1.
In the following the authors explain the main operational products of the prediction system and the results obtained by the modeling scenarios of risk assessment carried out for the high-density vessel traffic area of the SoB domain, during the test year 2018.
The operational hydrodynamic and wave models provide, with daily frequency, sea conditions information for a 3-days forecast horizon.
Some examples are displayed by Figure 5, where snapshots of the sea state condition products are reported for the entire domain of investigation (Panel A) and for the focus sub-areas of the Bonifacio Strait (Panel B) and Asinara Island (Panel C), that are characterized by a high naturalistic relevance. These pictures represent the sea state conditions that typically arises from the most common meteorological forcing in correspondence of the SoB domain (Cucco et al., 2012), a Mistral wind that blows with high intensity, up to 12 m/s, for around 2 days.
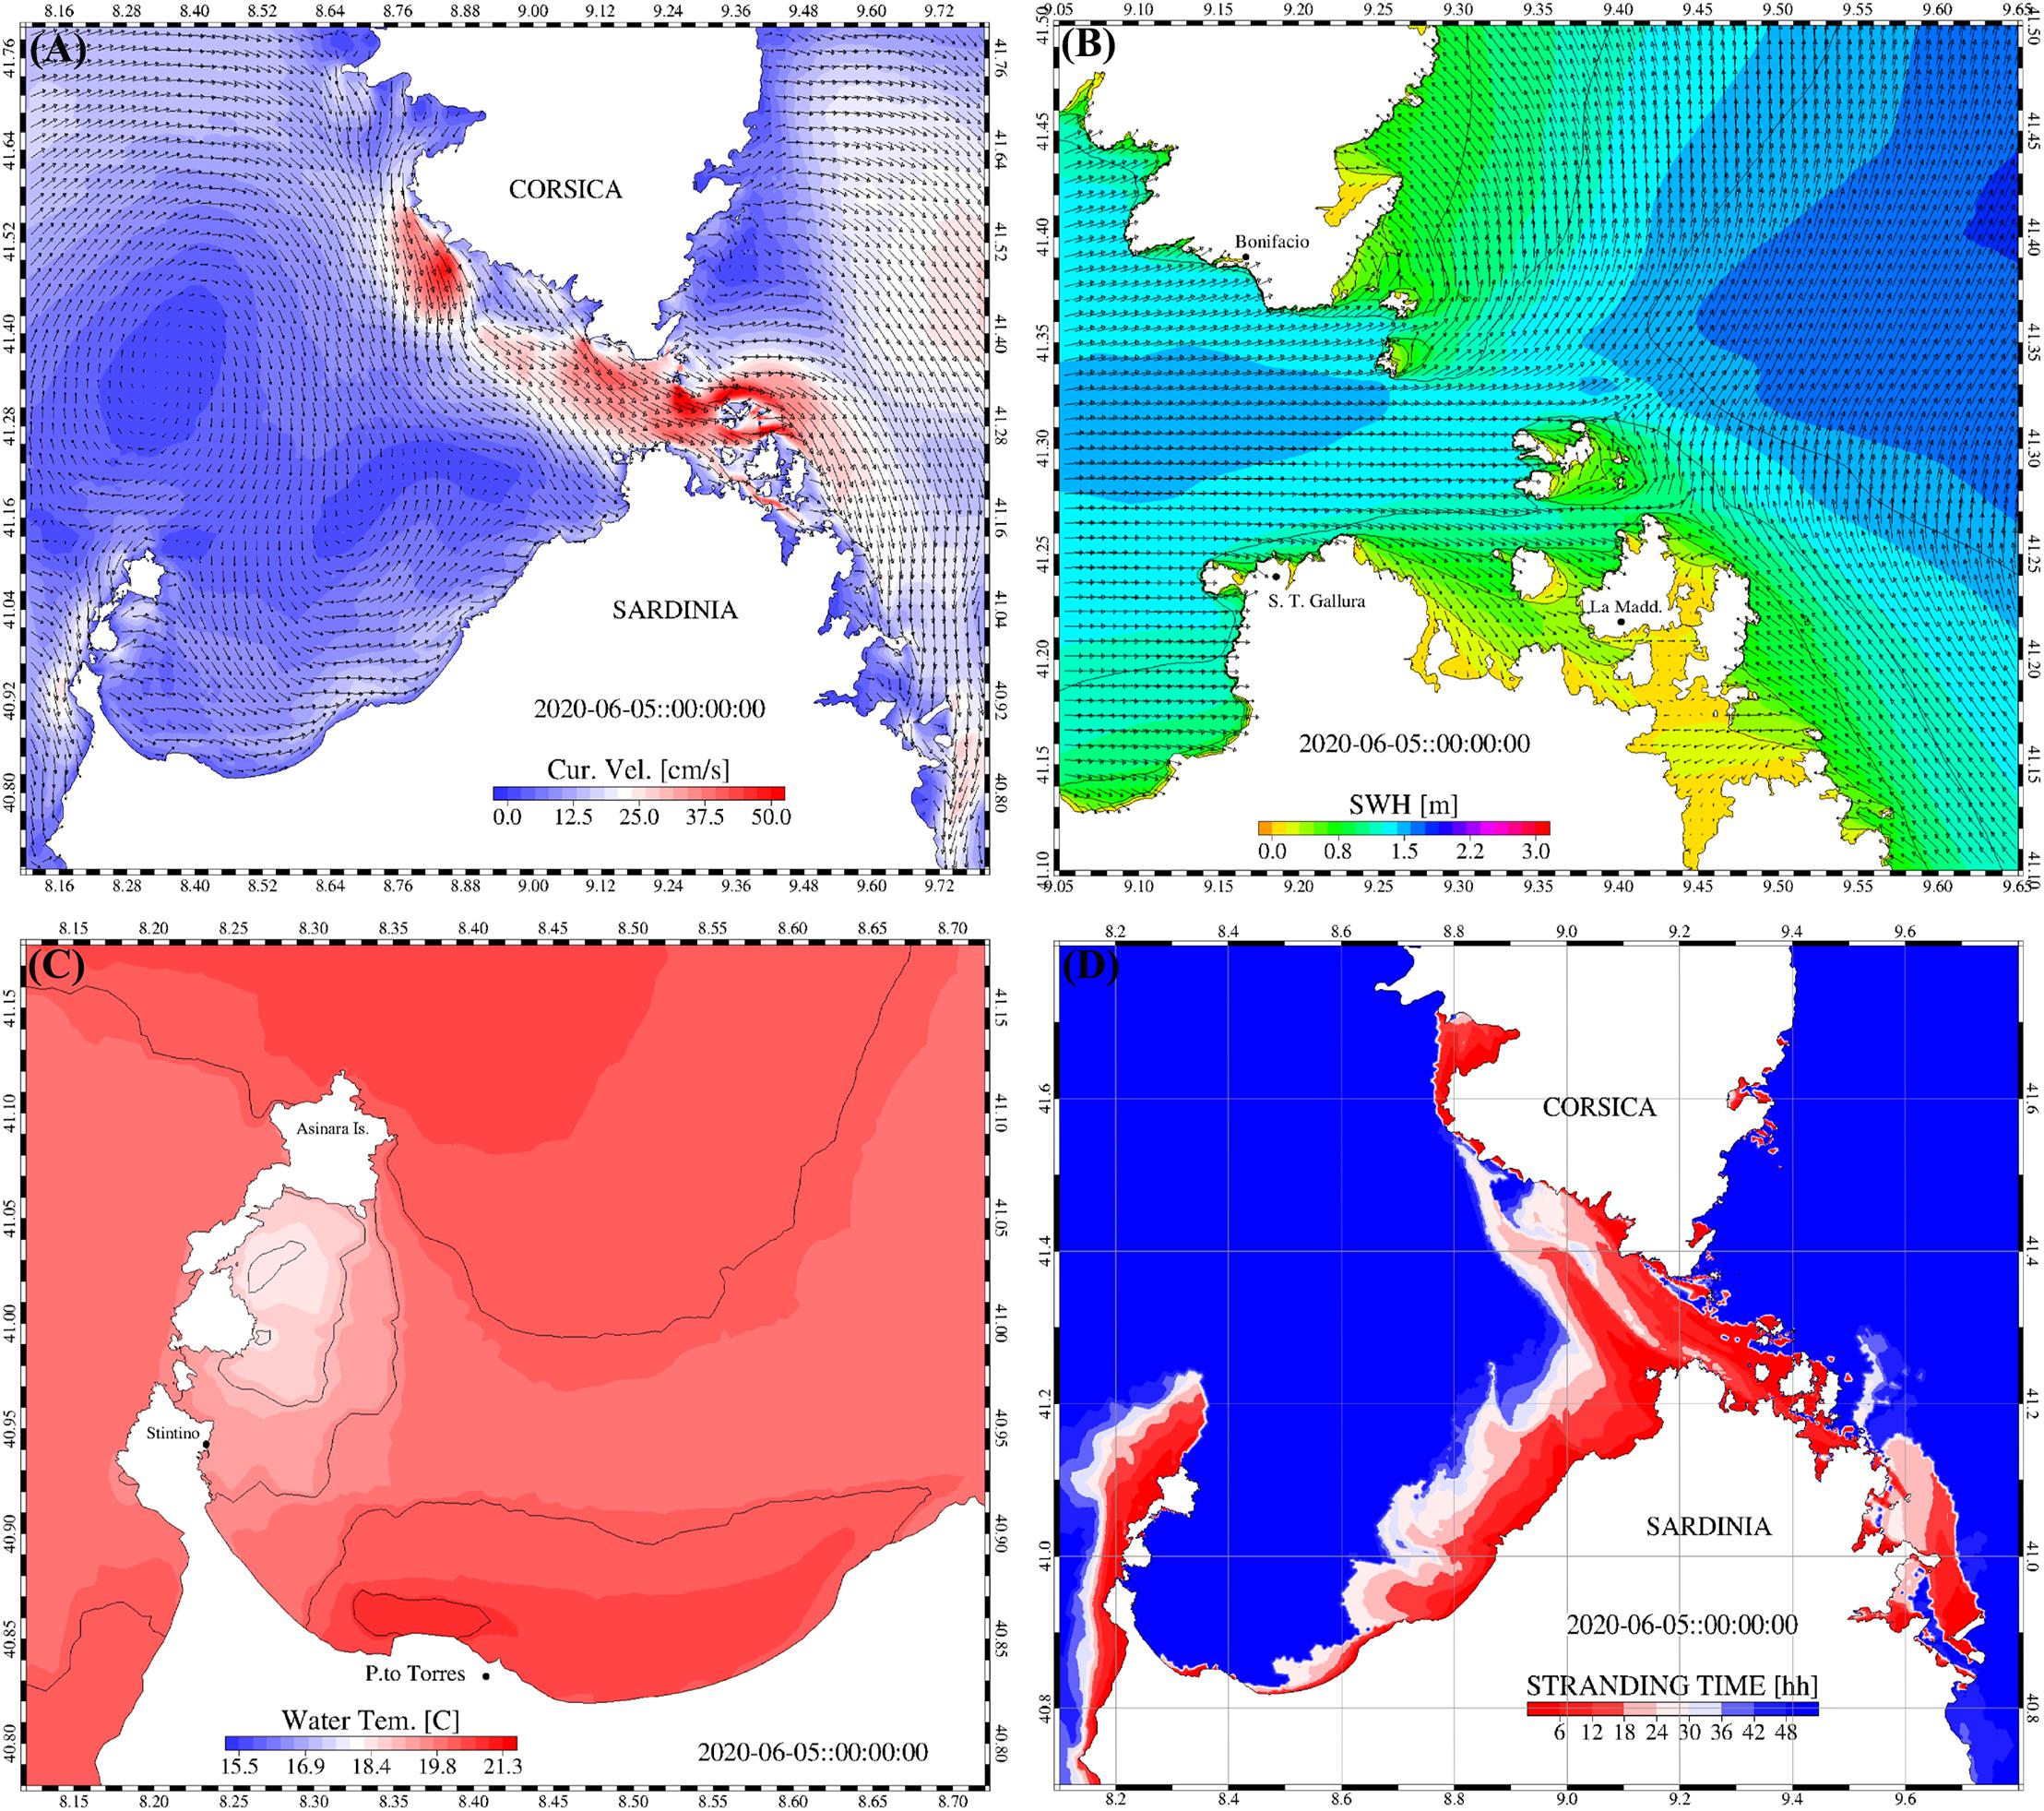
Figure 5. Snapshots of the forecasting products reported for the whole domain and, with high details, for specific areas. Surface water currents (A), significant wave height and direction (B), sea surface water temperature (C), and stranding time (D).
The Panel A shows the pattern of the sea surface current. At west, far from the entrance of the SoB, the sea current dynamics is dominated by basin scale general circulation structures that start to interact with the morphology of the local coastal boundaries. In the coastal area, near the SoB, the current come from northwest, it is strong and enters the SoB following the same direction of the wind. Entering the SoB, current maxima of 50 cm/s result from local bathymetric and coastal morphology constraints. Once to the east the current follows the eastern coast of Sardinia meandering around the numerous islands and join the large-scale circulation that, at the surface, also displays the effects of the strong northwesterly wind. Similar oceanographic conditions were observed by Gerigny et al. (2011) that, through the analysis of meteorological and oceanographic measurements in the SoB, explained how in many cases the wind and current are strong and orientated in the same direction. Also, their correlation is strong on the whole water column in case of strong winds (>7.0 m s–1).
Panel B shows an example of significant wave height and direction of the wave field which highlight how complex coastal geometry can protect specific traits of coast, for instance, by reducing the strength of the wave and the related current field. Panel C shows an example of the sea surface temperature displaying a relatively homogeneous field characterized by a high temperature located at north of Asinara Island and a coastal high and low temperature dipole, within the Gulf of Asinara, that is modulated by local upwelling and downwelling due to a combined wind-coast orientation effect.
As part of the output, the Stranding Time is also reported in the Panel D of Figure 5. It consists on the time needed by numerical particles that are released at the sea surface to reach the littoral. The spatial distribution of the stranding time is computed each 6 h for the 1st day of prediction using the hydrodynamic model and accounting for the transport processes induced by wind and currents of the next 48 h. Specifically, every day four simulations are carried out initializing the model domain with a homogeneous distribution of numerical particles that are advected by wind and currents for 48 h. The ages of the particles at the time of stranding is therefore computed and such vales referred to the particles release positions, obtaining, for each single run, the spatial distribution of the so-called Stranding Time.
This quantity reverses the paradigm of the risk from pollutant at sea identifying potentially endangered waters instead of coastal zones. The stranding time distribution, in fact, allows the detection of the areas where a hypothetical oil-spill could reach the coast quickly, for stranding time lower then few hours, or after longer period. In the first case, those areas can be defined as critical and more attention should be given to the control the vessel passages.
The sensitivity of the littorals to potential oil spill stranding was evaluated in the SoB domain. As stated above, the coastline slope, main grain size, geology and anthropogenic infrastructures, contribute to the definition of the littoral’s sensitivity that is showed in the map of Figure 6 by means of the assigned ESI rank.
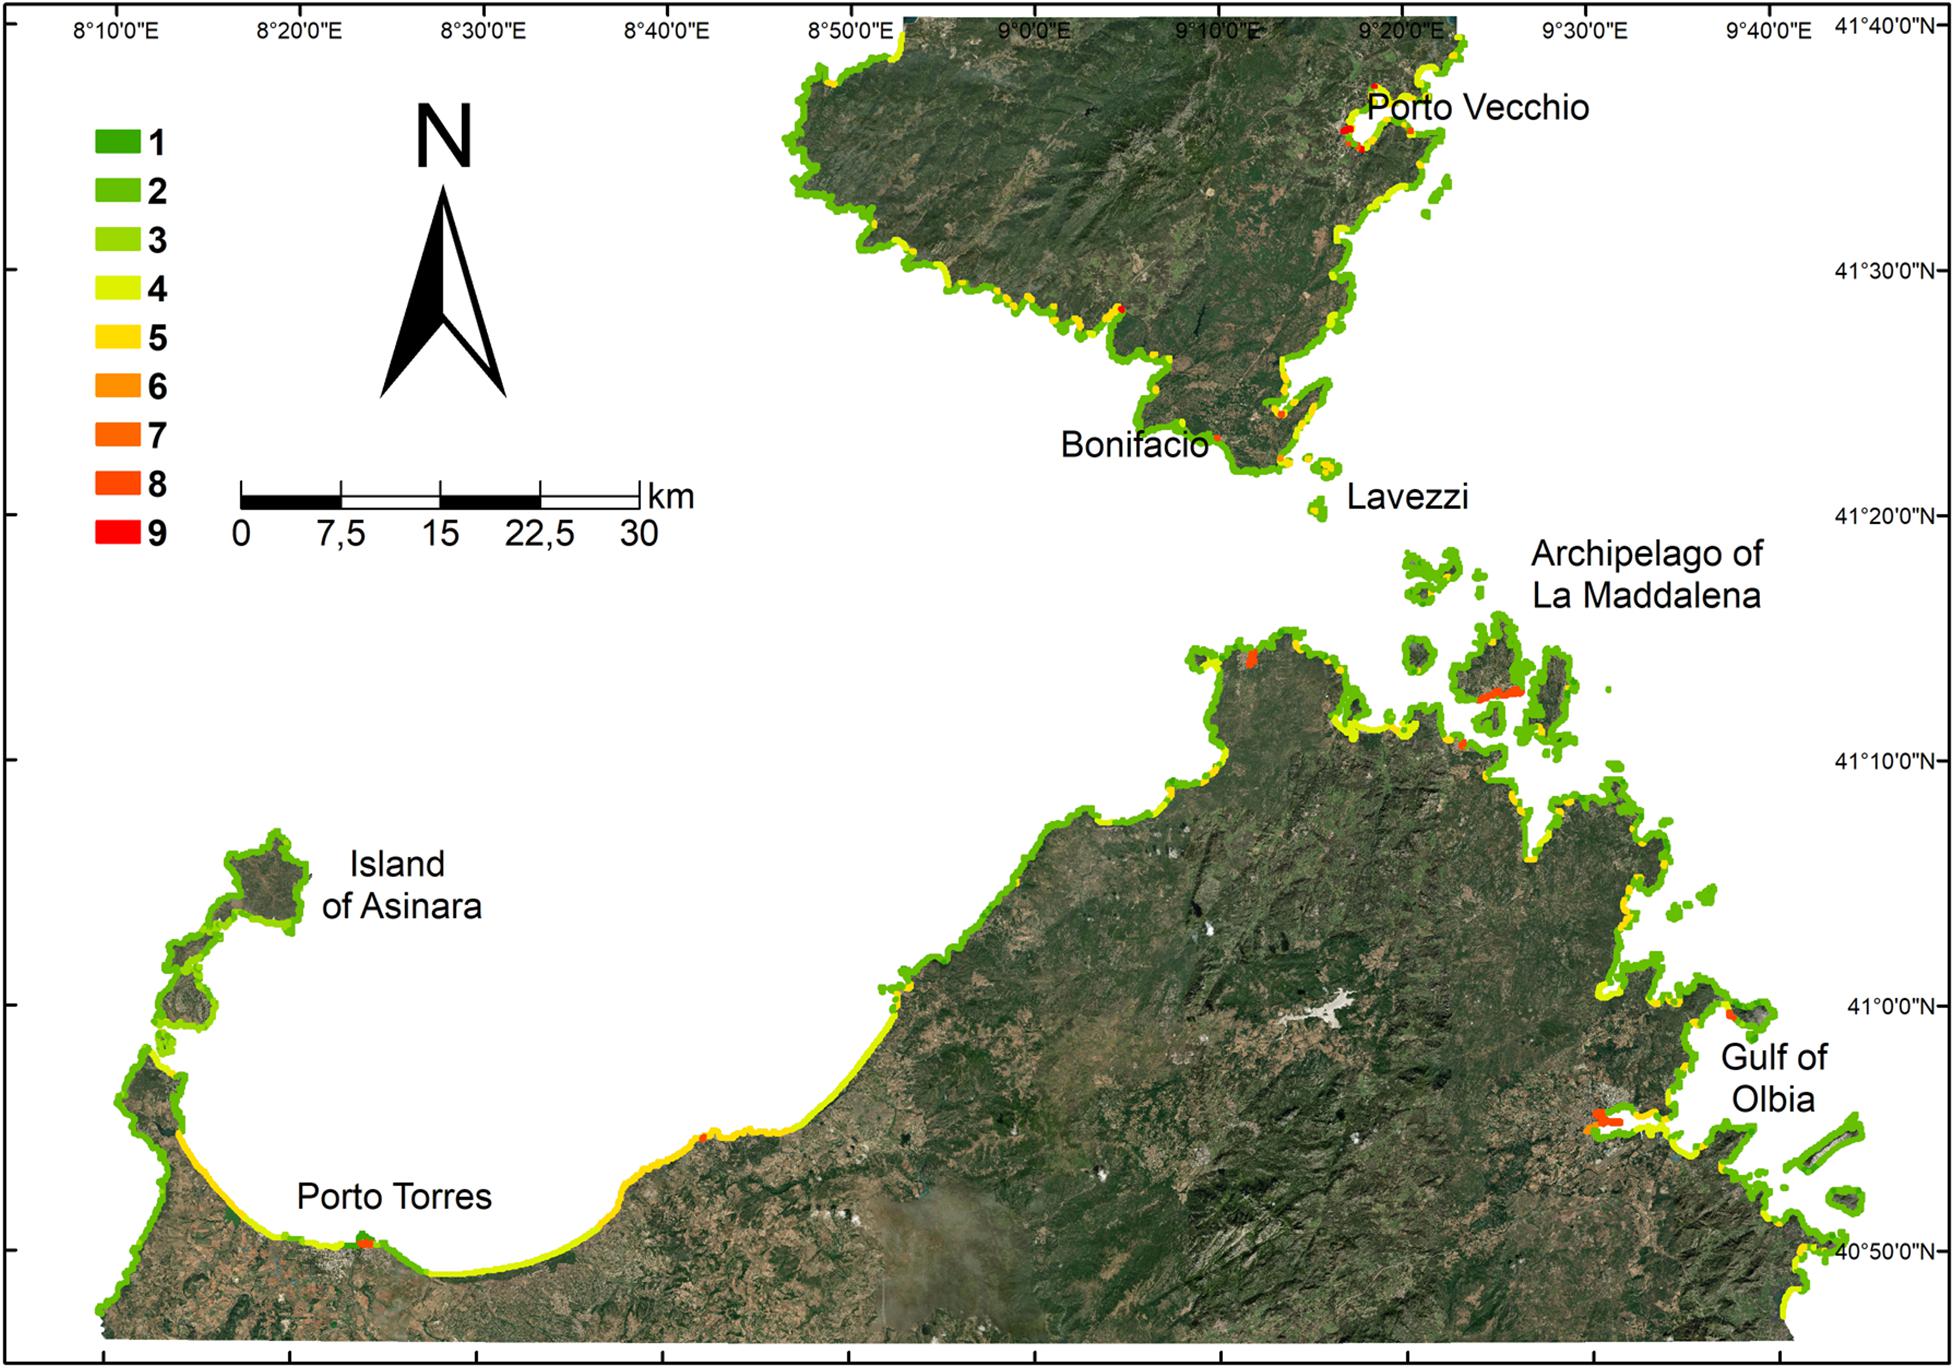
Figure 6. ESI rank = {1, 9} computed along the littoral of the SoB domain. The higher is the ESI rank the higher is the vulnerability of the shoreline.
There, high-energy littorals with high slope gradients, typically rocky cliffs, have low sensitivity with ESI rank = {1, 2}. This is due to their intrinsic features that could promote a relatively fast natural recovery of the site after potential oil stranding. In the SoB domain, the 75% of the littorals, including the archipelagos, have such vulnerability.
Mixed-energy littorals with medium slope gradients, such as gravel and boulder beaches, as well as sandy beaches, have medium sensitivity with ESI rank = {3, 6} and they represent the 22% of the SoB domain. Some examples are given by open beaches in the surrounding of Porto Torres and by pocket beaches of the Corsica and east Sardinia, where complex coastal geometries can protect from severe sea conditions but, at the same time, preclude from any fast, natural recovery of the site after a potential oil stranding.
Low-energy and low slope littorals, like open and/or sandy beaches, and littorals with anthropogenic pressure, have high vulnerability with ESI rank = {7, 9}. They are located along the littorals of Porto Torres, Olbia, La Maddalena (Sardinia), Bonifacio and Porto Vecchio (Corsica), representing a percentage of the 3% in the SoB domain.
The vulnerability that is defined by ESI rank will be used in linear combination with hazard values to assess the risk in 2018, according to Eq. 13.
The assessment 2018 of computed hazard along the littorals of the SoB domain is obtained according to Eq. 11 where the indices of impact density, vessel density and residual volume of oil are modulated by sea state conditions.
Before displaying, the hazard values are normalized by the maximum values found in the area and its non-gaussian distribution, with positive skewness, gives a median value near 0.02. Thus, it is plausible to define a value of 0.03 as a threshold for hazard values indicating a high one.
In Figure 7 the hazard maps are shown for each vessel category that defines a different dangerous source for the SoB domain that is tanker (Panel A), cargo (Panel B), and passenger vessels (Panel C).
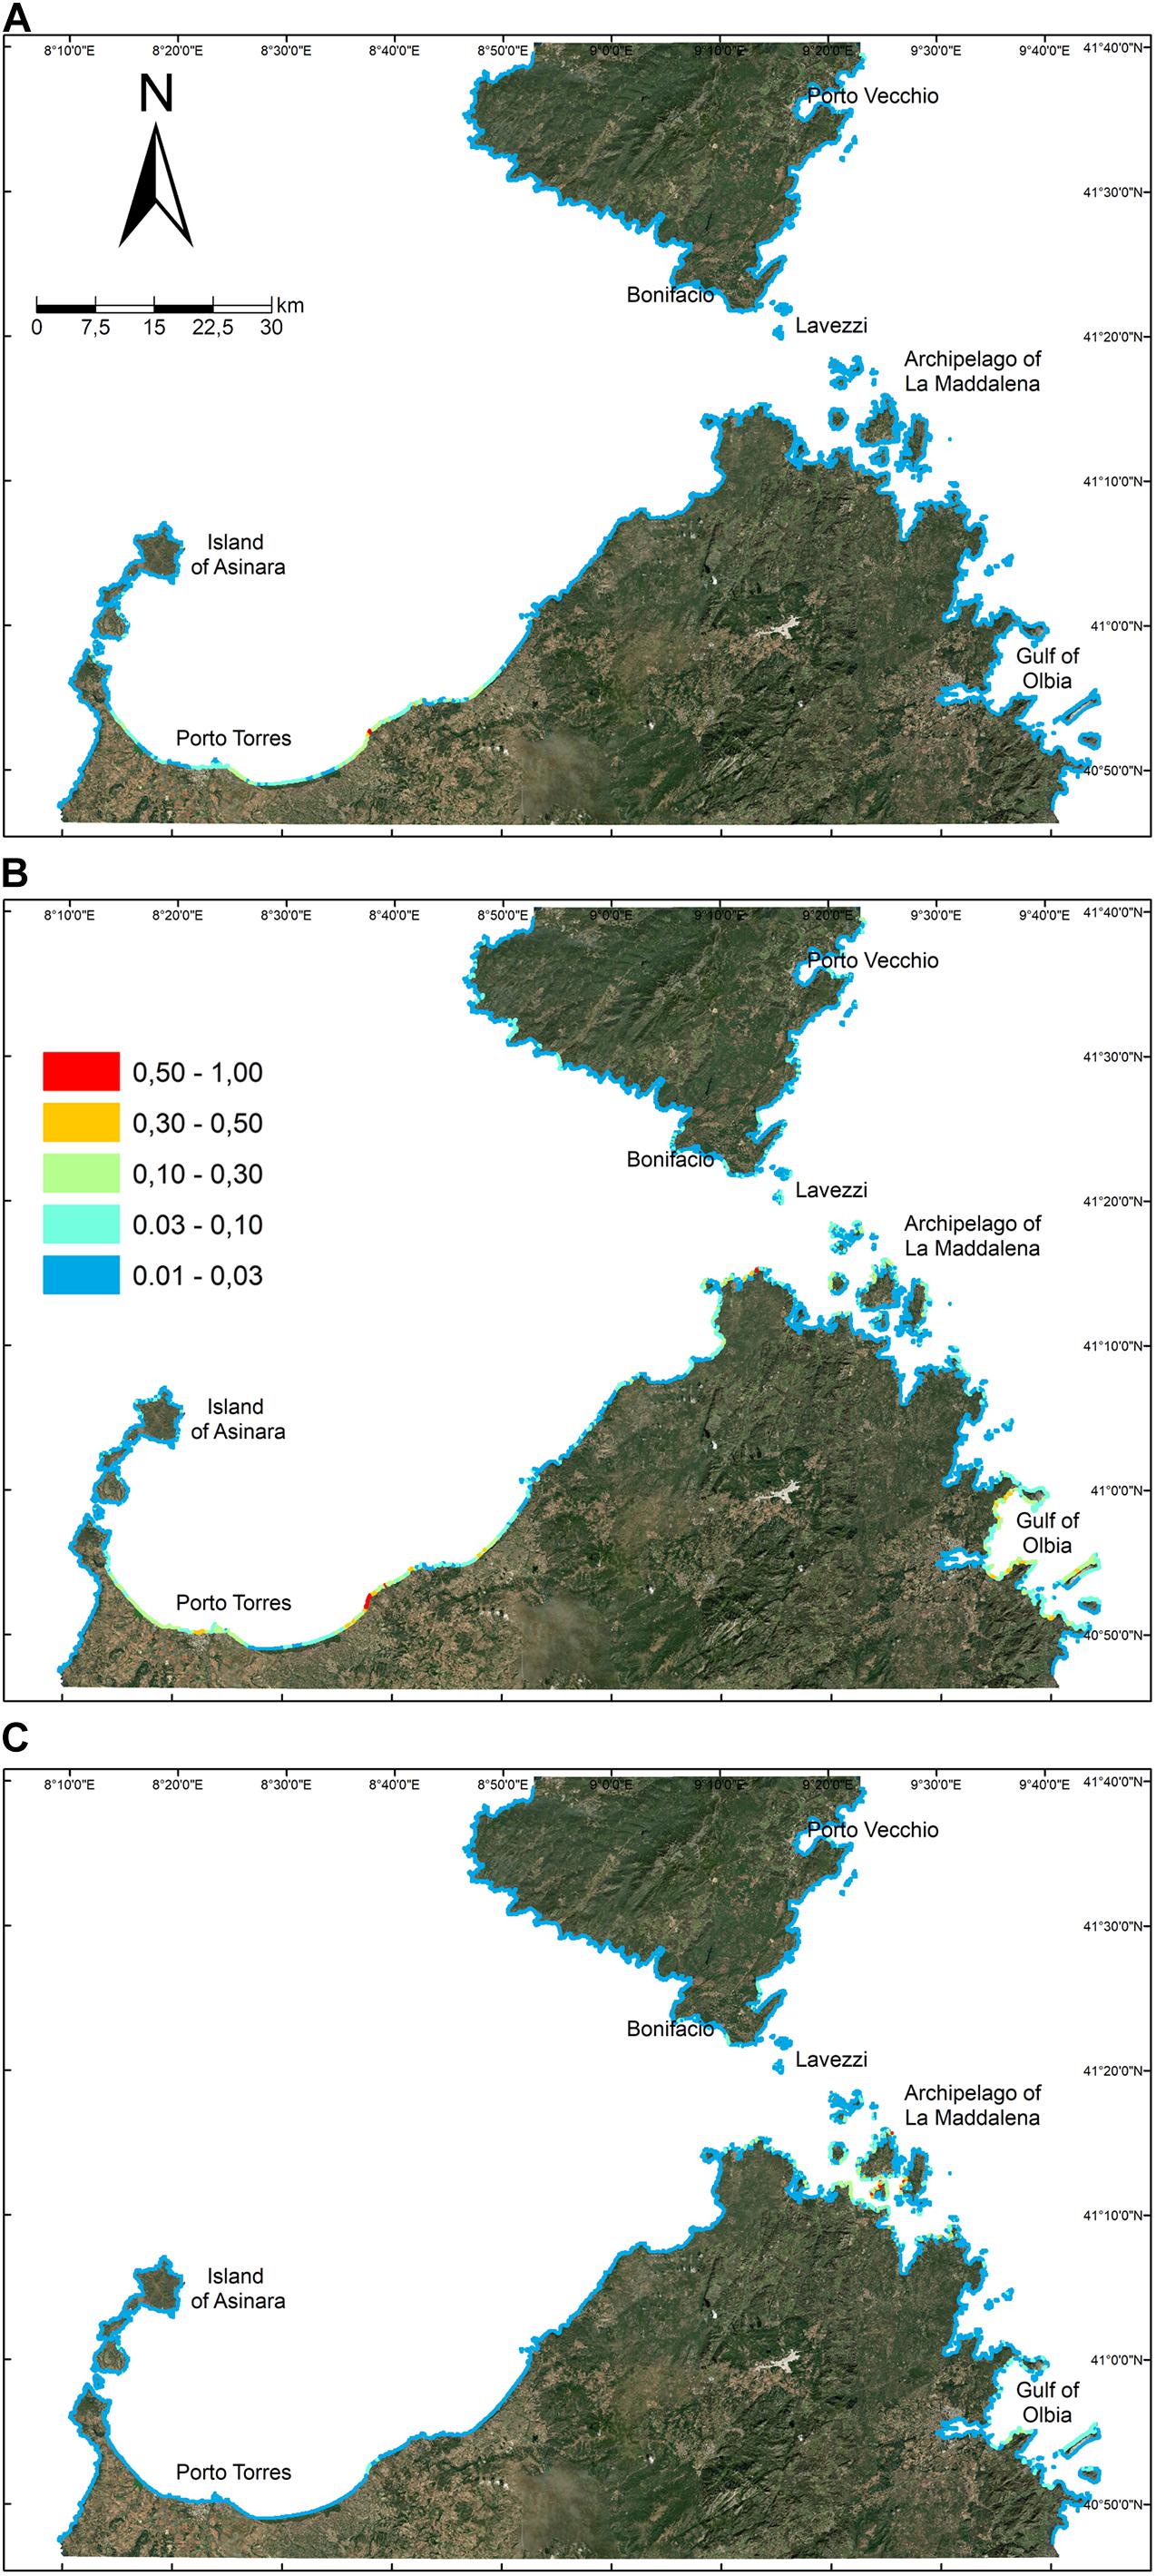
Figure 7. Hazard maps of the assessment 2018 in relation to dangerous sources derived by tanker (A), cargo (B), and passenger (C) vessels density and routes. The maps display the main localities and their toponomy and the normalized values (ranging in between 0 and 1) of hazard in correspondence of the littorals of the SoB domain.
In the Panel A high values of hazard are found in correspondence of the industrial harbor of Porto Torres in Sardinia where noticeable traffic of tanker vessels is also found (Figure 4). Other littorals in the SoB domain display low hazard values in relation to tanker vessel traffic that, with some exception, mostly occurs offshore.
In the Panel B hazard values and their geographical distribution are comparable with those of Panel A, indeed high values are found in correspondence and near Porto Torres. In addition, medium-high values are found along the limits of the Gulf of Olbia, where the homonym touristic and relatively big city fosters cargo vessels traffic, and in correspondence of the SoB that is often crossed by cargo vessels, generating hazardous conditions also for the Lavezzi (Corsica) and La Maddalena (Sardinia) archipelagos.
In the Panel C, medium-high values of hazard are obtained for long traits of coast in correspondence of the Gulf of Olbia, the La Maddalena Archipelago and Bonifacio, where the traffic of passenger vessel is dense for roughly 6 months per year. The values are geographically scattered due to the complex coastal geometry that protect many littorals from prevalent meteorological and sea conditions.
Hazard values are used to compute the risk assessment 2018 for the SoB domain in a linear combination with ESI rank values, identifying those parts of the littoral that deserve a more attentive monitoring to reduce the effects of potential accidents at sea.
As done for hazard, the risk assessment in 2018 is analyzed on the basis of different sources of danger that, in this application, are represented by the passages of three distinct vessels categories. The risk datasets are normalized by their maximum values and their distributions have positive skewness. Thus, the risk could be considered critical if its values overpass the threshold of 0.03.
Figures 8–10 show the risk maps obtained for the SoB domain in relation to tanker, cargo and passenger vessels traffic. In each figure, panels A, B and C display enlargements of the SoB domain in the Gulf of Asinara, the SoB and in the Gulf of Olbia, Panel D displays the seasonal variation of the impacted littoral in relation to different thresholds of the risk values. Here the percentage of impacted littoral is large if all risk values are over the threshold of 0.01, while it is drastically low if all risk values are over the threshold of 0.5.
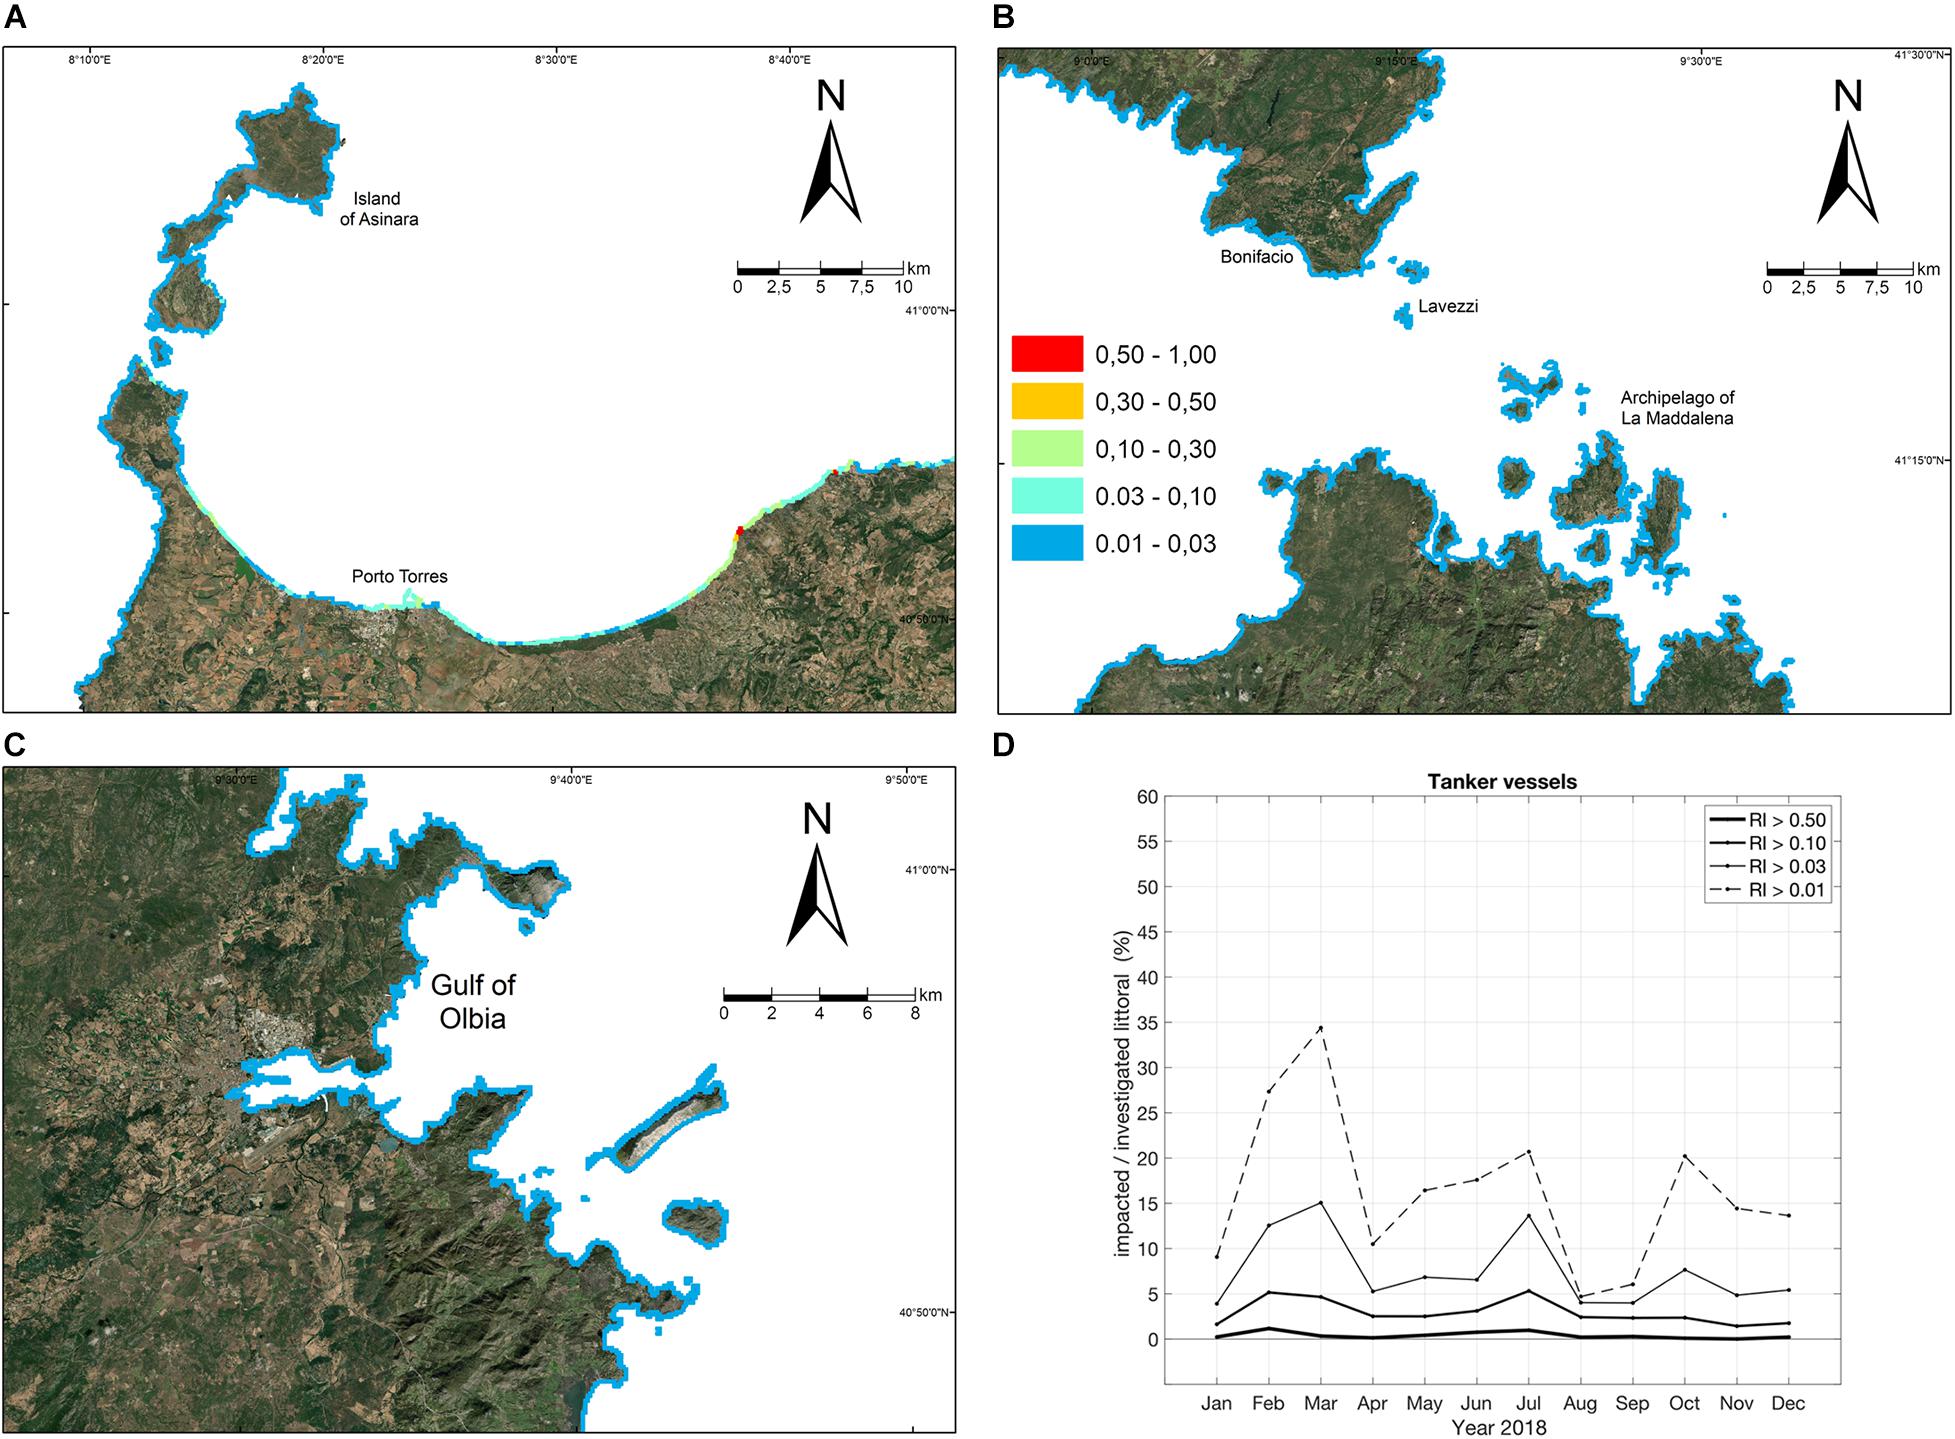
Figure 8. Risk assessment 2018 in relation to dangerous sources derived by routes and vessels density of tanker vessels. (A–C) Display magnifications of the SoB domain risk map in correspondence of the Asinara Island, the SoB and the Gulf of Olbia. (D) Displays the monthly percentage of the impacted littoral in relation to different thresholds of the risk (RI = 0.5 indicating very high risk, RI = 0.1 high risk, RI = 0.03 intermediate risk and RI = 0.01 low risk).
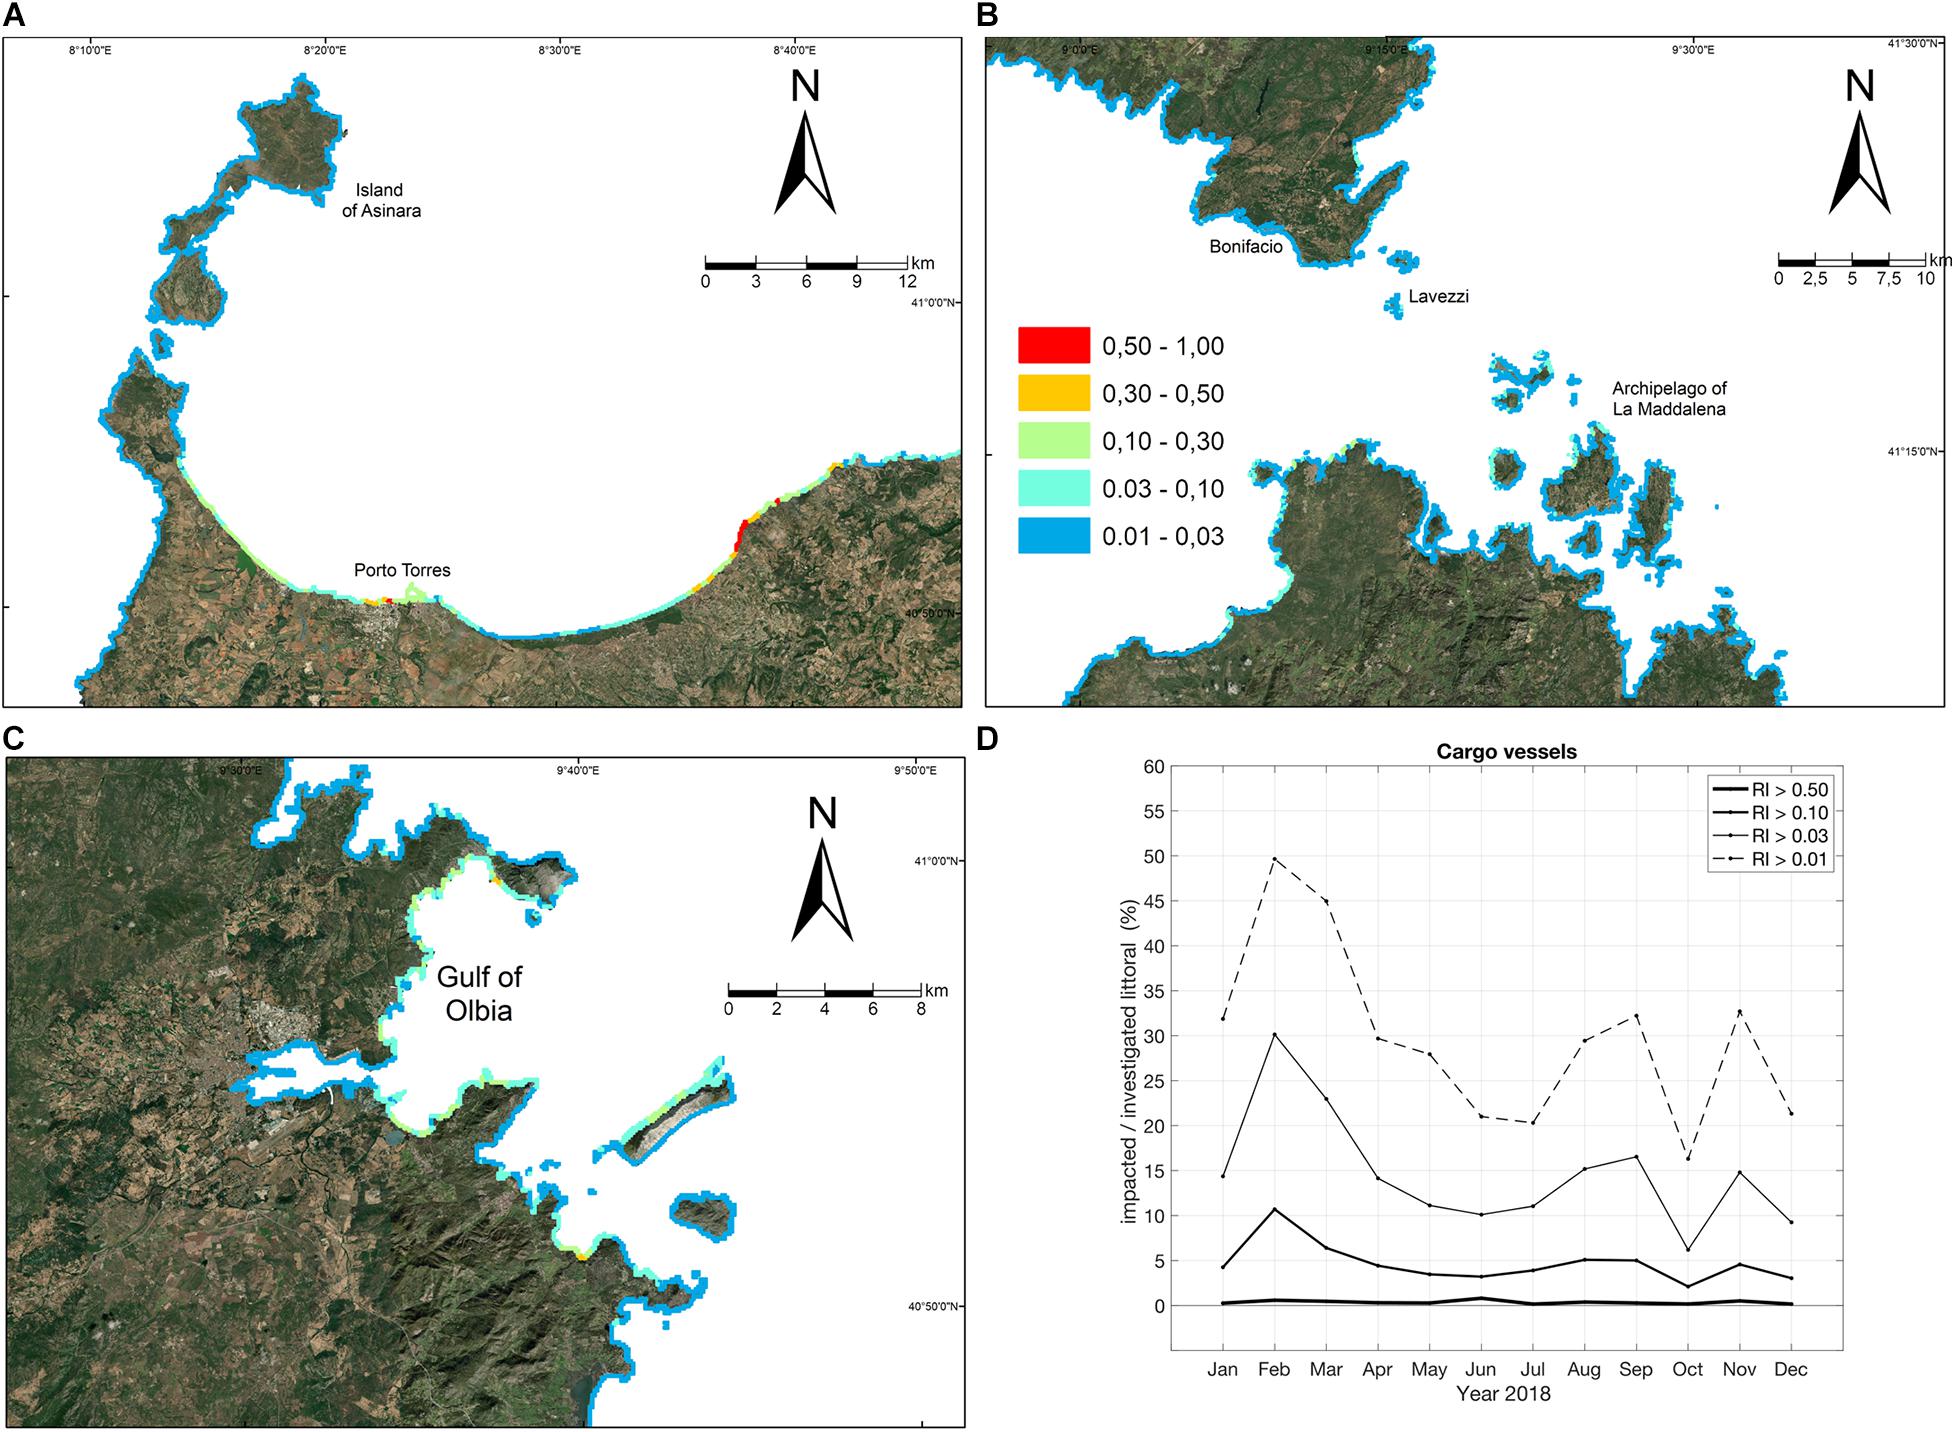
Figure 9. Risk assessment 2018 in relation to dangerous sources derived by routes and vessels density of cargo vessels. (A–C) Display magnifications of the SoB domain risk map in correspondence of the Asinara Island, the SoB and the Gulf of Olbia. (D) Displays the monthly percentage of the impacted littoral in relation to different thresholds of the risk (RI = 0.5 indicating very high risk, RI = 0.1 high risk, RI = 0.03 intermediate risk and RI = 0.01 low risk).
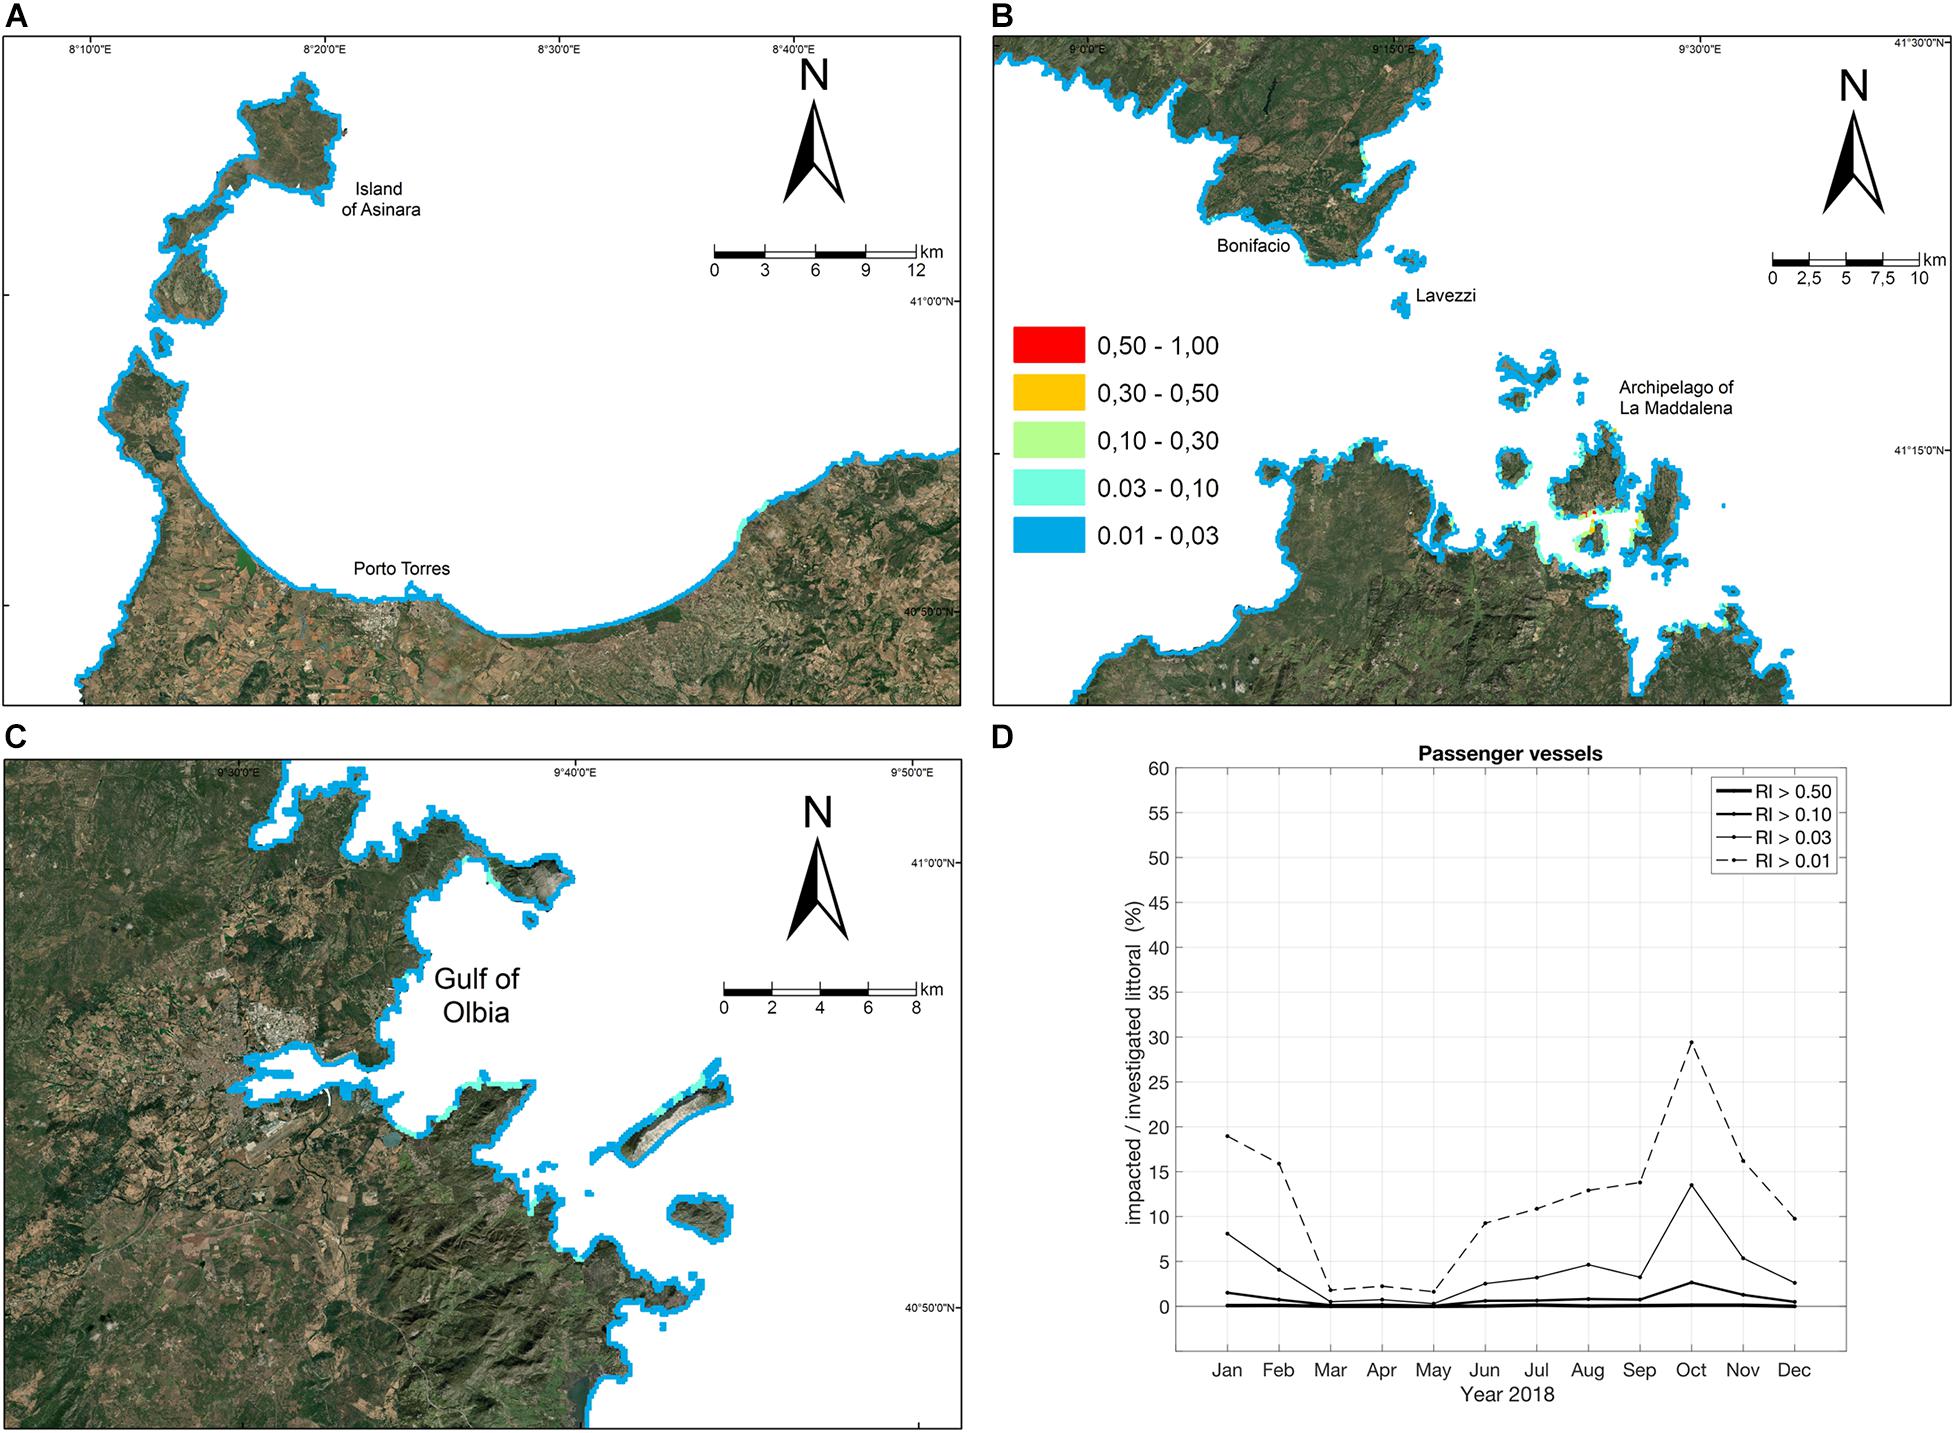
Figure 10. Risk assessment 2018 in relation to dangerous sources derived by routes and vessels density of passenger vessels. (A–C) Display magnifications of the SoB domain risk map in correspondence of the Asinara Island, the SoB and the Gulf of Olbia. (D) Displays the monthly percentage of the impacted littoral in relation to different thresholds of the risk (RI = 0.5 indicating very high risk, RI = 0.1 high risk, RI = 0.03 intermediate risk and RI = 0.01 low risk).
In Figure 8, the risk assessment gives critical values along the littoral of the Gulf of Asinara with maxima in correspondence of Porto Torres and on the beaches in its surrounding. The littorals in the SoB and the Gulf of Olbia have low values of risk. Considering the threshold of 0.03, the percentage of littoral that could be impacted by oil stranding does not vary a lot during the year (Panel D), displaying two maxima near 15%, in March and July.
In Figure 9, critical values of risk are found along the littorals of the gulfs of Asinara and Olbia while they are scattered in correspondence of the SoB. Considering the threshold of 0.03, the percentage of potentially impacted littoral widely varies during the year (Panel D), displaying a maximum close to 30%, in February and a minimum close to 5%, in July.
In Figure 10, the risk assessment gives critical values along some littorals of the La Maddalena Archipelago and the northern part of Sardinia including some sites near Olbia. The percentage of the impacted littorals, for threshold of 0.03, increases during summer (from May to August), with a peak of 5% in August, and in autumn (from September to November), potentially related to changing sea conditions.
In this paper a novel operational numerical system for oil stranding risk assessment, with a dedicated web interface, is implemented. The aim of the work is to provide a user friendly and innovative tool to assess the risk at coast and support the preparedness to the management at-sea emergencies that could arise from oil spillage or floating pollutants in the Strait of Bonifacio. Its functioning core is based on a suite of coupled numerical models that can predict the sea state conditions and the potential risk of oil stranding along littorals.
Similar systems already exist and are widely used for comparable purposes (e.g., Azevedo et al., 2009; Wang and Shen, 2010; Cucco et al., 2012; Olita et al., 2012; Canu et al., 2015). This demonstrates how the scientific community has a common view about the adopted methodology. However, local geophysical constraints, sources of hazard and vulnerable assets, must be considered to enrich the methodology and adequately implement the operational numerical system.
For these reasons, the presented operational numerical system includes a number of innovations for coastal applications. First, the adoption of a high-resolution grid to accurately reproduce the complex coastal geometry of the investigation domain and provide a detailed risk evaluation, at the same resolution of the geo-morphological information. Second, the adoption of time-varying maritime traffic density information as potential sources of hazard that, in the SoB domain, primarily originated offshore, where wide extents are yearly crossed by thousands of vessels, many of which with dangerous loads. Third, the web interface that was especially designed to define the offshore origin of the hazard, allowing the user to map the shape of the slick of pollutant, the time of the accident and, finally, displaying the risk assessment at coast. Fourth, an ad hoc formulation of hazard index and vulnerable assets.
The hazard index computation changes between authors and specific applications with the final aim of properly define the origin and the features of local hazardous sources. For example, three different approaches have been followed by Lan et al. (2015), Azevedo et al. (2017), and Al Shami et al. (2017). They introduced predisposing factors (e.g., favorable or not weather conditions) and control states (e.g., emergency input and emergency plan of sea area), historical records on past oil spill events or indicators of the time of exposure of the oil and susceptibility of shorelines to oiling.
In the present formulation, the hazard index accounts for: (i) the number of numerical particles that, representing floating oil droplets, hit the coast (i.e., impact density); (ii) the theoretical evaluation of the oil volume reduction at the sea surface that is due to weathering exposure and is computed as a function of particle age; (iii) the vessel density at the release point, that virtually assigns a high probability of accident where the maritime traffic is denser.
For what concerns the vulnerable assets, the adoption of social and economic sensitivities requires long data collection in the investigated area. Thus, in terms of a primary need for environmental protection, the adoption of geomorphological information gives, here, a reasonable measure of the littoral sensitivity to the oil exposure. Indeed, geomorphological features may promote or reduce the effect of oil stranding.
Littoral sensitivity is often assessed (Gugliermetti et al., 2007; Olita et al., 2012; Al Shami et al., 2017) with the adoption of the environmental sensitivity index (ESI) that is defined to classify shoreline sensitivity in relation to oil stranding (NOAA, 2002).
The combination of hazard index and ESI rank is a formulation for risk assessment (Eq. 13). The maps in Figures 8–10 uncover the geographic locations that are exposed to critical values of risk on the basis of the intrinsic sensitivity of the littoral and the potential threat derived by seasonal variability of the maritime traffic density.
The authors expected, for instance, to find critical values of risk in the surrounding of Porto Torres, if tanker routes are considered a source of hazard (Figure 8). However, it was not obvious to find critical values near Olbia and in correspondence of the La Maddalena Archipelago when cargo routes are considered a source of hazard (Figure 9). Also, passenger vessel traffic is very dense in correspondence of La Maddalena Archipelago with the result that long stretches of coast display critical values of risk (Figure 10). The south of Corsica displays non-critical values of risk along the littoral, with the exception of some of the numerous embayed sandy beaches that typically inhibit any natural recovery after unexpected accident of oil spillage at sea.
Figure 11 synthesizes the results obtained by the risk assessment 2018 and highlights a seasonal variation of risk that should be considered for the implementation of any risk management plan in the area. By considering risk values above the critical threshold of 0.03, the Panel A displays the cumulated percentage of the impacted littoral due to each hazard source, tanker, cargo and passenger vessels routes. A seasonal modulation of such percentage is shown by each vessel category, presumably related to the variability of the vessel density values and the area crossed by vessels, but it is clear that navigation can really be a threat for an averaged impacted littoral of 24%, with a minimum of 16% on December and a maximum of 45% on February. By considering the average of those risk values above 0.03, the Panel B displays a risk that does not significantly vary during the year, except for tanker vessels, showing that the dangerous loads, moving offshore, give high risk values at coast but affecting a lower percentage of littoral if compared with cargo vessels (Panel A).
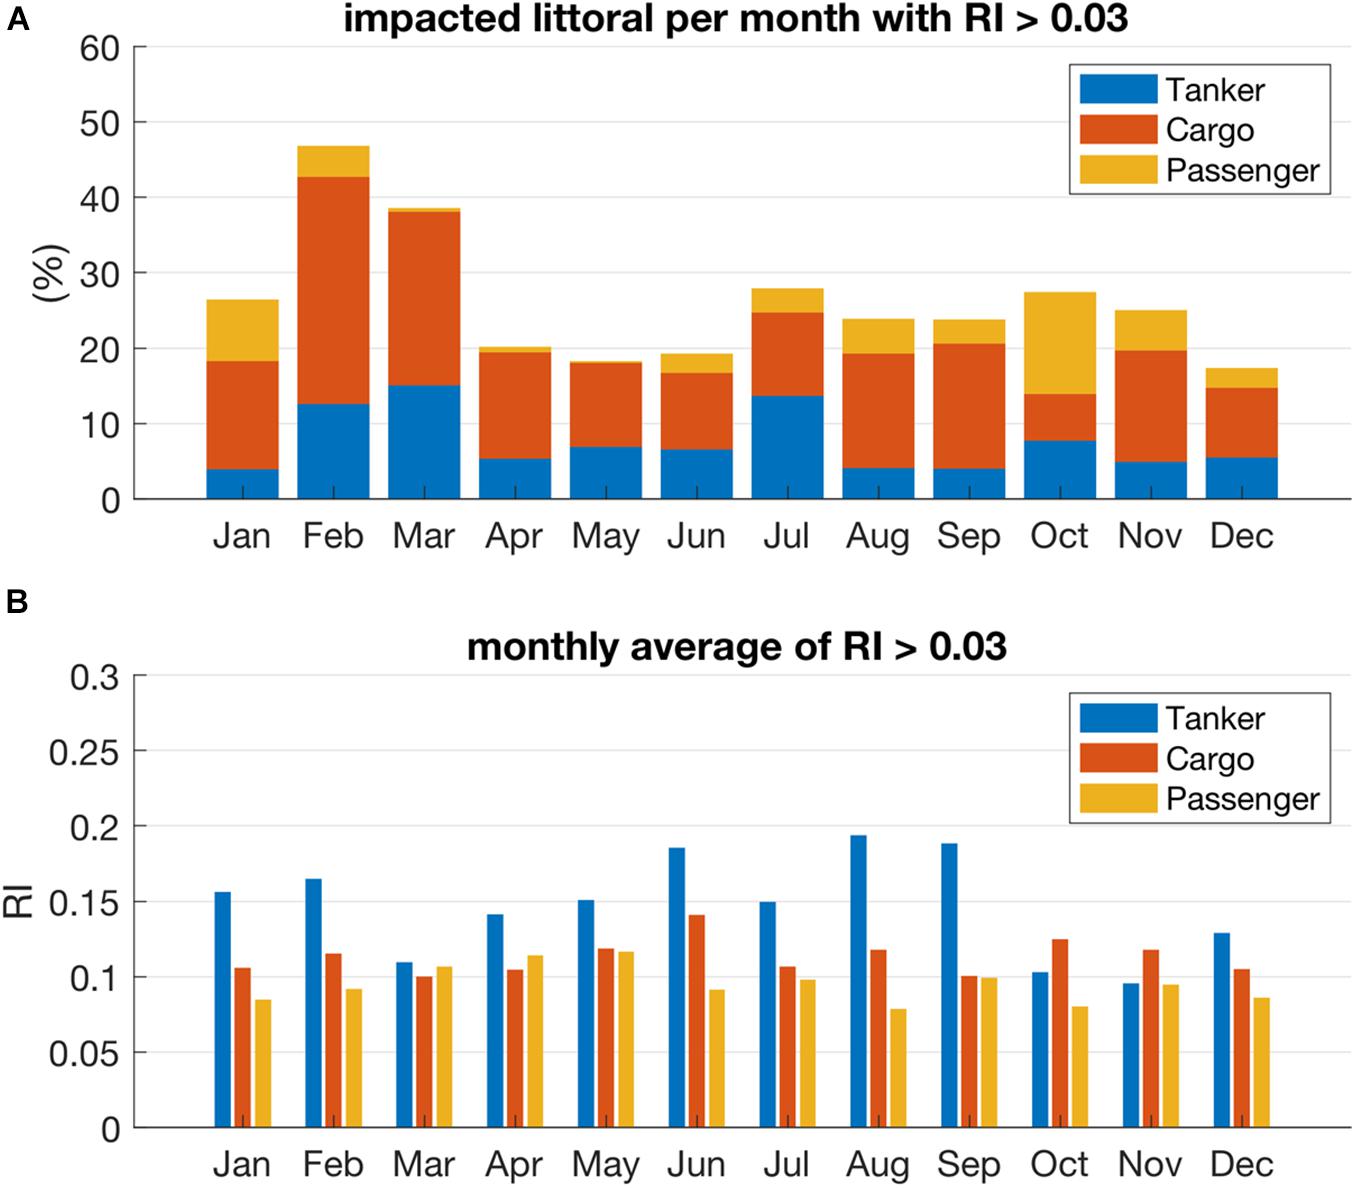
Figure 11. Monthly variation of the cumulative (tanker, cargo, and passenger vessels) percentage of impacted littoral when RI values are greater than 0.03 (A). Mean values of a RI data set greater than 0.03, per month and vessels category (B).
The oil spillage at sea remains a global threat affecting world coastal areas. The scientific community is engaged in the study of the whole set of chemical, physical, biological, social and economic phenomena that can result from marine pollution events and provides continual upgrades of the last innovations in terms of software, infrastructure and indicators. In fact, the appropriate integration of the current knowledge and scientific advances in relation to local environmental assets is the key of successful solutions for the management of marine pollution events. In this framework the authors proposed the inclusion of specific technical advances and research-based innovations into an operational numerical system for oil stranding risk assessment that is based on a core of hydrodynamic, wave and PTMs. Its functioning is demonstrated in the marine area of the SoB and its surroundings where the vessel traffic is a real threat for local assets and where the environmental agencies and policy makers ask for innovative responses from the scientific community. Technical advances include the adoption of a high-resolution unstructured computational grid for domain discretization and the implementation of a web interface to easily meet the needs of the final users of the system. Research-based innovations includes the identification of the spatial and temporal variation of the vessel traffic and routes as source of hazard and the ad-hoc formulations for hazard indicators and vulnerability that for the first time in the SoB domain was included in the risk assessment computation. Vulnerability is computed on the basis of the main geomorphological features of the littoral that can favor or not the negative consequences of a potential oil stranding. This approach provided a clear identification of critical risk values also in correspondence of very low-anthropized littorals and high environmental and indirect economic value.
The datasets generated for this study can be found in the online repositories. The names of the repository/repositories and accession number(s) can be found below: https://drive.google.com/drive/folders/1R6oE-IN4_6-XqHr496jlqrh2GOKdQ5M0?usp=sharing.
GQ and AC conceived the research approach and with SS provided pictures of all figures. GQ wrote the manuscript and processed the input and output data of the operational numerical system. AC applied the hydrodynamic, wave, and trajectory models in the SoB domain. SS also provided ESI rank information. AP and AC designed and implemented the Web GUI. RS applied the oil spill model MEDSLIK-II in a synthetic configuration, providing necessary indication to fit a theoretical curve of oil volume reduction due to weathering processes. GQ, AC, and AR designed the at-sea Lagrangian survey. AR provided the post-processing of the Lagrangian survey. All authors provided valuable contribution to the text contents.
This study was financed by the Projects SICOMARplus-SIstema transfrontaliero per la sicurezza in mare COntro i rischi della navigazione e per la salvaguardia dell’ambiente MARino and GEREMIA “GEstione dei REflui per il MIglioramento delle Acque portuali both funded by the EU program Interreg France-Italy Maritime 2014–2020.”
The authors declare that the research was conducted in the absence of any commercial or financial relationships that could be construed as a potential conflict of interest.
We thank the Centro Operativo per la Meteorologia of the Italian Aeronautiaca Militare to have furnished meteorological forcing, and the Office de l’Environnement de la Corse for friendly support.
The Supplementary Material for this article can be found online at: https://www.frontiersin.org/articles/10.3389/fmars.2021.585396/full#supplementary-material
Abdulla, A., and Linden, O. (2008). Maritime Traffic Effects on Biodiversity in the Mediterranean Sea, Volume 1 – Review of Impacts, Priority Areas and Mitigation Measures. Gland: IUCN.
Al Shami, A., Harik, G., Alameddine, I., Bruschi, D., Garcia, D. A., and El-Fadel, M. (2017). Risk assessment of oil spills along the Mediterranean coast: A sensitivity analysis of the choice of hazard quantification. Sci. Total Environ. 574, 234–245. doi: 10.1016/j.scitotenv.2016.09.064
Artale, V., Astraldi, M., Buffoni, G., and Gasparini, G. P. (1994). Seasonal variability of gyre-scale circulation in the northern Tyrrhenian Sea. J. Geophys. Res. Ocean. 99, 14127–14137. doi: 10.1029/94JC00284
Azevedo, A., Fortunato, A. B., Epifânio, B., den Boer, S., Oliveira, E. R., Alves, F. L., et al. (2017). An oil risk management system based on high-resolution hazard and vulnerability calculations. Ocean Coast. Manag. 136, 1–18. doi: 10.1016/j.ocecoaman.2016.11.014
Azevedo, A., Oliveira, A., Fortunato, A., and Bertin, X. (2009). Application of an Eulerian- Lagrangian oil spill modeling system to Prestige. J. Coast. Res. 56, 777–781.
Blong, R. J. (1996). Monitoring and Mitigation of Volcanic Hazards. Berlin: Springer Science & Business Media.
Burchard, H., and Petersen, O. (1999). Models of turbulence in the marine environment—a comparative study of two-equation turbulence models. J. Mar. Syst. 21, 29–53. doi: 10.1016/S0924-7963(99)00004-4
Caballero, A., Espino, M., Sagarminaga, Y., Ferrer, L., Uriarte, A., and González, M. (2008). Simulating the migration of drifters deployed in the Bay of Biscay, during the Prestige crisis. Mar. Pollut. Bull. 56, 475–482. doi: 10.1016/j.marpolbul.2007.11.005
Campana, I., Angeletti, D., Crosti, R., Luperini, C., Ruvolo, A., Alessandrini, A., et al. (2017). Seasonal characterisation of maritime traffic and the relationship with cetacean presence in the Western Mediterranean Sea. Mar. Pollut. Bull. 115, 282–291. doi: 10.1016/j.marpolbul.2016.12.008
Canu, D. M., Solidoro, C., Bandelj, V., Quattrocchi, G., Sorgente, R., Olita, A., et al. (2015). Assessment of oil slick hazard and risk at vulnerable coastal sites. Mar. Pollut. Bull. 94, 84–95. doi: 10.1016/j.marpolbul.2015.03.006
Chen, H., Li, D., and Li, X. (2007). Mathematical modeling of oil spill on the sea and application of the modeling in Daya Bay. J. Hydrodyn. 19, 282–291. doi: 10.1016/s1001-6058(07)60060-2
Christensen, F. M., Andersen, O., Duijm, N. J., and Harremoës, P. (2003). Risk terminology—a platform for common understanding and better communication. J. Hazard. Mater. 103, 181–203. doi: 10.1016/s0304-3894(03)00039-6
Coll, M., Piroddi, C., Albouy, C., Ben Rais Lasram, F., Cheung, W. W. L., Christensen, V., et al. (2012). The Mediterranean Sea under siege: spatial overlap between marine biodiversity, cumulative threats and marine reserves. Glob. Ecol. Biogeogr. 21, 465–480. doi: 10.1111/j.1466-8238.2011.00697.x
Copernicus Marine Service (2020). Available online at: https://marine.copernicus.eu/ (accessed January 30, 2020).
Coppini, G., De Dominicis, M., Zodiatis, G., Lardner, R., Pinardi, N., Santoleri, R., et al. (2011). Hindcast of oil-spill pollution during the Lebanon crisis in the Eastern Mediterranean, July–August 2006. Mar. Pollut. Bull. 62, 140–153. doi: 10.1016/j.marpolbul.2010.08.021
Cucco, A., Quattrocchi, G., Olita, A., Fazioli, L., Ribotti, A., Sinerchia, M., et al. (2016a). Hydrodynamic modelling of coastal seas: the role of tidal dynamics in the Messina Strait, Western Mediterranean Sea. Nat. Hazards Earth Syst. Sci 16, 1553–1569. doi: 10.5194/nhess-16-1553-2016
Cucco, A., Quattrocchi, G., Satta, A., Antognarelli, F., De Biasio, F., Cadau, E., et al. (2016b). Predictability of wind-induced sea surface transport in coastal areas. J. Geophys. Res. Ocean. 121, 5847–5871. doi: 10.1002/2016JC011643
Cucco, A., Quattrocchi, G., and Zecchetto, S. (2019). The role of temporal resolution in modeling the wind induced sea surface transport in coastal seas. J. Mar. Syst. 193, 46–58. doi: 10.1016/j.jmarsys.2019.01.004
Cucco, A., Sinerchia, M., Lefrançois, C., Magni, P., Ghezzo, M., Umgiesser, G., et al. (2012). A high-resolution real-time forecasting system for predicting the fate of oil spills in the Strait of Bonifacio (western Mediterranean Sea). Ecol. Modell. 64, 1186–1200. doi: 10.1016/j.ecolmodel.2009.01.008
Cucco, A., Sinerchia, M., Ribotti, A., Olita, A., Fazioli, L., Perilli, A., et al. (2012). A high-resolution real-time forecasting system for predicting the fate of oil spills in the Strait of Bonifacio (western Mediterranean Sea). Mar. Pollut. Bull. 64, 1186–1200. doi: 10.1016/j.marpolbul.2012.03.019
Cutter, S. L. (1993). Living with Risk: The Geography of Technological Hazards. London: Edward Arnold.
De Dominicis, M., Pinardi, N., Zodiatis, G., and Archetti, R. (2013a). MEDSLIK_II, a Lagrangian marine surface oil spill model for short-term forecasting – Part 2: numerical simulations and validations. Geosci. Model Dev. 6, 1871–1888. doi: 10.5194/gmd-6-1871-2013
De Dominicis, M., Pinardi, N., Zodiatis, G., and Lardner, R. (2013b). MEDSLIK-II, a Lagrangian marine surface oil spill model for short-term forecasting – Part 1: theory. Geosci. Model Dev. 6, 1851–1869. doi: 10.5194/gmd-6-1851-2013
De Lange, H. J., Sala, S., Vighi, M., and Faber, J. H. (2010). Ecological vulnerability in risk assessment—a review and perspectives. Sci. Total Environ. 408, 3871–3879. doi: 10.1016/j.scitotenv.2009.11.009
European Environmental Agency (2005). Available online at: https://www.eea.europa.eu/data-and-maps/data/geomorphology-geology-erosion-trends-and-coastal-defence-works (accessed March 01, 2020)
European Maritime Safety Agency (2019). Available online at: http://www.emsa.europa.eu/news-a-press-centre/external-news/item/3775-traffic-density-maps-for-a-better-understanding-of-maritime-traffic.html (accessed March 01, 2020).
Fernandes, R. (2018). Risk Management of Coastal Pollution from Oil Spills Supported by Operational Numerical Modelling. Ph.D. Thesis. Universidade de Lisboa, Instituto Superior Tecnico. doi: 10.13140/RG.2.2.10667.95525
Fisher, H., List, E., Koh, R. C. Y., and Imberger, J. (1979). Mixing in Inland and Coastal Waters. Amsterdam: Elsevier.
Gerigny, O., Di Martino, B., and Romano, J.-C. (2011). The current dynamics inside the Strait of Bonifacio: impact of the wind effect in a little coastal strait. Cont. Shelf Res. 31, 1–8. doi: 10.1016/j.csr.2010.11.005
Grottoli, E., and Ciavola, P. (2019). The role of detailed geomorphic variability in the vulnerability assessment of potential oil spill events on mixed sand and gravel beaches: the cases of two Adriatic sites. Front. Earth Sci. 7:242. doi: 10.3389/feart.2019.00242
Gugliermetti, F., Cinquepalmi, F., and Garcia, D. A. (2007). The use of environmental sensitivity indices (ESI) maps for the evaluation of oil spill risk in Mediterranean coastlines and coastal waters. WIT Trans. Ecol. Environ 102, 8.
Gundlach, E. R., Ruby, C. H., Hayes, M. O., and Blount, A. E. (1978). TheUrquiola oil spill, La Coruña, Spain: impact and reaction on beaches and rocky coasts. Environ. Geol. 2, 131–143.
Kleissen, F. M., Arentz, L., Reed, M., and Johansen, O. (2007). Marine Environmental Risk Assessment System: Conceptual Design and Preliminary Demonstration for the Dutch Continental Shelf: Demo A: Inventory, Classification and Risk Assessment of Oil Transport on the North Sea. Z4339. Delft: Deltares.
La Stampa in English (2019). Available online at: https://www.lastampa.it/esteri/la-stampa-in-english/2018/10/09/news/cargoes-and-accidents-a-daily-threat-to-the-mediterranean-whale-sanctuary-1.34051224 (accessed March 30, 2020).
Lahr, J., and Kooistra, L. (2010). Environmental risk mapping of pollutants: state of the art and communication aspects. Sci. Total Environ. 408, 3899–3907. doi: 10.1016/j.scitotenv.2009.10.045
Lan, D., Liang, B., Bao, C., Ma, M., Xu, Y., and Yu, C. (2015). Marine oil spill risk mapping for accidental pollution and its application in a coastal city. Mar. Pollut. Bull. 96, 220–225. doi: 10.1016/j.marpolbul.2015.05.023
Life – European Project (2020). Life17CCM/IT/000121 SeaForest Life. Available online at: http://www.seaforestlife.eu/images/Prodotti/Report_Azione_A1_CNR.pdf. (accessed December 22, 2020)
Liubartseva, S., Coppini, G., Pinardi, N., De Dominicis, M., Lecci, R., Turrisi, G., et al. (2016). Decision support system for emergency management of oil spill accidents in the Mediterranean Sea. Nat. Hazards Earth Syst. Sci. 16, 2009–2020. doi: 10.5194/nhess-16-2009-2016
Olita, A., Cucco, A., Simeone, S., Ribotti, A., Fazioli, L., Sorgente, B., et al. (2012). Oil spill hazard and risk assessment for the shorelines of a Mediterranean coastal archipelago. Ocean Coast. Manag. 57, 44–52. doi: 10.1016/j.ocecoaman.2011.11.006
Pennino, M. G., Pérez Roda, M. A., Pierce, G. J., and Rotta, A. (2016). Effects of vessel traffic on relative abundance and behaviour of cetaceans: the case of the bottlenose dolphins in the Archipelago de La Maddalena, north-western Mediterranean Sea. Hydrobiologia 776, 237–248. doi: 10.1007/s10750-016-2756-0
Quattrocchi, G., Cucco, A., Antognarelli, F., Satta, A., Maicu, F., Ferrarin, C., et al. (2016). Optimal design of a lagrangian observing system for hydrodynamic surveys. J. Oper. Oceanogr. 9(Suppl. 1), s77–s88. doi: 10.1080/1755876X.2015.1114805
REMPEC (2008). Study of Maritime Traffic Flows in the Mediterranean Sea e Final Report. Available online at: http://docshare02.docshare.tips/files/5651/56517843.pdf (accessed January 15, 2020).
Ribotti, A., Antognarelli, F., Cucco, A., Falcieri, M. F., Fazioli, L., Ferrarin, C., et al. (2019). An operational marine oil spill forecasting tool for the management of emergencies in the Italian Seas. J. Mar. Sci. Eng. 7:1. doi: 10.3390/jmse7010001
Ritter, F., and Panigada, S. (2019). “Collisions of vessels with cetaceans–the underestimated threat,” in World Seas: an Environmental Evaluation, ed. C. Sheppard (Amsterdam: Elsevier), 531–547. doi: 10.1016/b978-0-12-805052-1.00026-7
Roland, A., Cucco, A., Ferrarin, C., Hsu, T.-W., Liau, J.-M., Ou, S.-H., et al. (2009). On the development and verification of a 2-D coupled wave-current model on unstructured meshes. J. Mar. Syst. 78, S244–S254. doi: 10.1016/j.jmarsys.2009.01.026
Salter, J. (1997). Risk management in a disaster management context. J. Contingen. Cris. Manag. 5, 60–65.
Sayers, P. B., Gouldby, B. P., Simm, J. D., Meadowcroft, I., and Hall, J. (2002). Risk, Performance and Uncertainty in Flood and Coastal Defence–A Review. DEFRA/EA R&D Technical Report FD2302/TR1. Wallingford: HR Wallingford.
Simoncelli, S., Fratianni, C., Pinardi, N., Grandi, A., Drudi, M., Oddo, P., et al. (2019). Mediterranean Sea Physical Reanalysis (CMEMS MED-Physics). Copernicus Monitoring Environment Marine Service (CMEMS). Available online at: https://marine.copernicus.eu/
Smagorinsky, J. (1993). “Some historical remarks on the use of nonlinear viscosities,” in Large Eddy Simulation of Complex Engineering and Geophysical Flows, Vol. 1, eds B. Galperin and S. A. Orszag (Cambridge: Cambridge University Press), 69–106.
Sorgente, B., Sorgente, R., Olita, A., Fazioli, L., Cucco, A., Perilli, A., et al. (2012). Effects of protection rules and measures in an important international strait area: the Bonifacio Strait. J. Oper. Oceanogr. 5, 35–44. doi: 10.1080/1755876x.2012.11020130
Sorgente, R., La Guardia, D., Ribotti, A., Arrigo, M., Signa, A., Pessini, F., et al. (2020). An operational supporting system for oil spill emergencies addressed to the the Italian coast guard. J. Mar. Sci. Eng. 8:1035. doi: 10.3390/jmse8121035
Sotillo, M. G., Fanjul, E. A., Castanedo, S., Abascal, A. J., Menendez, J., Emelianov, M., et al. (2008). Towards an operational system for oil-spill forecast over Spanish waters: Initial developments and implementation test. Mar. Pollut. Bull. 56, 686–703. doi: 10.1016/j.marpolbul.2007.12.021
The Mediterranean Quality Status Report (2017). Available online at: https://www.medqsr.org/ (accessed March 10, 2020).
Umgiesser, G., Canu, D. M., Cucco, A., and Solidoro, C. (2004). A finite element model for the Venice Lagoon. Development, set up, calibration and validation. J. Mar. Syst. 51, 123–145. doi: 10.1016/j.jmarsys.2004.05.009
United Nations/Inter-Agency Secretariat of the International Strategy for Disaster Reduction (2004). Living with Risk – A Global Review of Disaster Reduction Initiatives. New York, NY: United Nations/Inter-Agency Secretariat of the International Strategy for Disaster Reduction, 457.
Wang, J., and Shen, Y. (2010). Modeling oil spills transportation in seas based on unstructured grid, finite-volume, wave-ocean model. Ocean Model. 35, 332–344. doi: 10.1016/j.ocemod.2010.09.005
Wang, S. D., Shen, Y. M., and Zheng, Y. H. (2005). Two-dimensional numerical simulation for transport and fate of oil spills in seas. Ocean Eng. 32, 1556–1571. doi: 10.1016/j.oceaneng.2004.12.010
Zodiatis, G., De Dominicis, M., Perivoliotis, L., Radhakrishnan, H., Georgoudis, E., Sotillo, M., et al. (2016). The Mediterranean decision support system for marine safety dedicated to oil slicks predictions. Deep Sea Res. Part II Top. Stud. Oceanogr. 133, 4–20.
Zodiatis, G., Lardner, R., Hayes, D., Georgiou, G., Pinardi, N., De Dominicis, M., et al. (2008). “The mediterranean oil spill and trajectory prediction model in assisting the EU response agencies,” in Congreso Nacional de Salvamento en la Mar (Cadiz: libro de actas) 535–547. Available online at: https://www.yumpu.com/es/document/read/30391742/mesa-1-sergofi
Keywords: operational oceanography, risk assessment, geomorphology, oil spill, numerical modeling, web graphical user interface, particle tracking model
Citation: Quattrocchi G, Simeone S, Pes A, Sorgente R, Ribotti A and Cucco A (2021) An Operational Numerical System for Oil Stranding Risk Assessment in a High-Density Vessel Traffic Area. Front. Mar. Sci. 8:585396. doi: 10.3389/fmars.2021.585396
Received: 20 July 2020; Accepted: 02 February 2021;
Published: 24 February 2021.
Edited by:
Enrique Alvarez Fanjul, Ports and Coastal Dynamics Division, SpainReviewed by:
Fan Xu, East China Normal University, ChinaCopyright © 2021 Quattrocchi, Simeone, Pes, Sorgente, Ribotti and Cucco. This is an open-access article distributed under the terms of the Creative Commons Attribution License (CC BY). The use, distribution or reproduction in other forums is permitted, provided the original author(s) and the copyright owner(s) are credited and that the original publication in this journal is cited, in accordance with accepted academic practice. No use, distribution or reproduction is permitted which does not comply with these terms.
*Correspondence: Giovanni Quattrocchi, Z2lvdmFubmkucXVhdHRyb2NjaGlAY25yLml0
Disclaimer: All claims expressed in this article are solely those of the authors and do not necessarily represent those of their affiliated organizations, or those of the publisher, the editors and the reviewers. Any product that may be evaluated in this article or claim that may be made by its manufacturer is not guaranteed or endorsed by the publisher.
Research integrity at Frontiers

Learn more about the work of our research integrity team to safeguard the quality of each article we publish.