 Ana C. Vaz
- 1Paris Laboratory, Department of Ocean Sciences, Rosenstiel School of Marine and Atmospheric Science, University of Miami, Miami, FL, United States
- 2Ifremer, STH, Lorient, France
During the Deepwater Horizon (DWH) blowout, photooxidation of surface oil led to the formation of persistent photooxidized compounds, still found in shoreline sediments a decade later. Studies demonstrated that photooxidation modified both biodegradation rates of the surface oil and the effectiveness of aerial dispersant applications. Despite the significant consequences of this weathering pathway, the lack of measurements prevented photooxidation to be accounted for in the DWH oil budget calculations and in most predictive models. Here we develop a Lagrangian photooxidation module that estimates the dose of solar radiation individual oil droplets receive while moving in the ocean, quantifies the likelihood of photooxidative changes, and continues to track the transport of these persistent photooxidized compounds. We estimate and track the likelihood of photooxidation of Lagrangian oil droplets in the upper layers of the water column for the DWH case by coupling the net shortwave radiation from NOGAPS to the oil application of the Connectivity Modeling System (oil-CMS). The dose of solar radiation upon a droplet is computed with the intensity of the incoming irradiance at the ocean’s surface, the light attenuation coefficient, and the depth of the oil droplets. Considering a range of DWH empirical irradiance thresholds, we find that photooxidation can happen at short time scales of hours to days, in agreement with the new paradigm of oil photooxidation. Furthermore, the oxidized compounds are likely to form in a 110 km radius around the response site, suggesting that the oil reaching the coastline was already photooxidized. This new dynamic coupling provides a powerful tool to test oil weathering hypotheses, refine the oil budget during the DWH, and ultimately inform rapid response in future oil spills.
Introduction
The Deepwater Horizon (DWH) was an unprecedented spill: the deepest and the largest spill in history, it released over 130 million gallons of a mixture of oil and natural gas at 5000 feet under the sea surface for over 87 days (McNutt et al., 2012; Paris et al., 2018). Its unique magnitude, location, and multiphase oil composition proved a challenge for the accurate prediction of oil fate and transport at the time of the accident. In the aftermath of the DWH blowout, numerical models for the forecast of oil spills advanced significantly, and key processes driving oil fate and transport previously absent from predictive numerical tools were incorporated (Le Hénaff et al., 2012; Paris et al., 2013; Zhao et al., 2014, 2015, 2017; Lindo-Atichati et al., 2016; French-McCay et al., 2017; Gros et al., 2017; Dissanayake et al., 2018; Perlin et al., 2020; Boufadel et al., 2020; Bracco et al., 2020; Vaz et al., 2020). Yet the critical weathering pathway of near-surface photooxidation still lacks from oil spill numerical models, particularly the now well-defined effects of varying sunlight on photooxidation (Ward et al., 2018a,b; Ward and Overton, 2020). Here we fill this lacuna by translating recent laboratory and field studies into a photooxidation module for the oil fate and transport application of the Connectivity Modeling System (oil-CMS, Paris et al., 2012, 2013). The novel photooxidation Lagrangian algorithm integrates spatio-temporally explicit solar irradiance from Earth Systems models to estimate the cumulative irradiance received by each droplet as they are transported, along with estimating the likelihood of photo-induced changes on individual Lagrangian droplets.
During an oil spill, physical-chemical composition changes are set forward by a series of weathering processes including biodegradation, dissolution, evaporation, sedimentation and photooxidation once oil enters the oceanic environment (Tarr et al., 2016; Ward and Overton, 2020). It has been long known that solar radiation can change the physicochemical characteristics of oil (Payne and Phillips, 1985; Garrett et al., 1998; Lehr, 2001), and more recently two major mechanisms were described: (1) by direct photolysis of light-absorbing compounds such as PAHs (Shankar et al., 2015; Ward et al., 2020) or by (2) indirect photooxidation, which occurs when direct photolysis creates free oxygen species that can then combine with a number of hydrocarbon compounds; in this case, changes are not limited to light-absorbing ones (Shankar et al., 2015; Hall et al., 2013; Ray et al., 2014; Ray and Tarr, 2014; Ruddy et al., 2014; Ward et al., 2019). Both mechanisms thus form new products, which can be highly soluble in water and be further dispersed, or can lead to the formation of emulsifications (Payne and Phillips, 1985; Garrett et al., 1998; Lehr, 2001; Xie et al., 2007). Emulsification, on its turn, can reduce oil evaporation, change the oil spread characteristics, and enhance aggregations to organic and inorganic matter, thus increasing sedimentation (Payne and Phillips, 1985; Fingas et al., 1999; Hayworth et al., 2015; Ward and Overton, 2020). Additionally, emulsification can also affect the outcome of response alternatives since emulsions are heavier, more difficult to remove with traditional skimmers, and can turn chemical dispersants ineffective (Xie et al., 2007; Tarr et al., 2016; Ward et al., 2020). Emulsions are also the precursors of surface residual balls (SRBs), or tar balls, which can continue to reach and pollute nearshore environments years after a spill (Overton et al., 1980; Aeppli et al., 2012; Warnock et al., 2015; White et al., 2016; Aeppli et al., 2018).
At the time of the DWH spill, photooxidation was expected to occur mainly as direct photolysis, happening at temporal scales of weeks to months and affecting a small portion of the oil (Clark, 2001; National Research Council [NRC], 2003; Ward and Overton, 2020). Thus, there were not enough measurements to be considered in the DWH NOAA Oil Budget Calculator (Lehr et al., 2010) or in DWH’s predictive models. The best representation of this process was limited to a parameterization of PAH photolysis using seasonal coefficients constant for the first 20 m of the water column (French-McCay, 2004; French-McCay et al., 2017). To this day, solar irradiance is still not incorporated as a spatio-temporally explicit parameter in any Lagrangian model of oil transport (Ward and Overton, 2020). However, photooxidation was a significant fate pathway of DWH oil, leading to the formation of persistent partially oxidized compounds, which are still found in shoreline sediment for nearly a decade after the oil spill (Ward et al., 2018a,b; Aeppli et al., 2018). During the DWH spill, photooxidation acted at scales of hours to days (Ward et al., 2018b), and indirect photooxidation was revealed to be a primary pathway of photooxidation (Ray et al., 2014; Ray and Tarr, 2014; Aeppli et al., 2018; Ward et al., 2018b).
Remarkably, the chemical changes induced by photooxidation on the DWH oil affected the effectiveness of surface dispersant applications, lowering its expected dispersive effect (Ward et al., 2018a). Noteworthily, solar irradiance leads to changes not only on the oil but also modified the microbial fauna facilitating biodegradation (Bacosa et al., 2015), and altered the composition of the chemical dispersants used during the response to the DWH, COREXIT 9500A and 9527 (Glover et al., 2014). Taken together, these findings reveal that photooxidation needs to be taken into account not only in predictions of oil transport, but also for the planning of response and mitigation activities (Ward and Overton, 2020). Thus, it seems fundamental for Lagrangian models of oil to consider the effect of varying solar irradiance on the outcome of a spill. Here, we further use the novel module we developed to probabilistically explore the spatial and temporal scales of photooxidized compounds (POCs) generation during the DWH, their transport and fate, and investigate the importance of considering irradiance as an explicit input on oil spill models.
Methods
Oil-CMS Description
In this study, the far-field modeling of the blowout is done using a deep-sea oil spill application developed during and post DWH based on the Connectivity Modeling System (CMS, Paris et al., 2013), the oil-CMS (Paris et al., 2012; Perlin et al., 2020; Vaz et al., 2020). The oil-CMS is a Lagrangian model that estimates both the transport and continuous changes on the composition and fate of oil droplets. The oil-CMS uses velocity fields and observations to represent the local or regional hydrodynamic and pseudo-components, including a varying composition, to provide a detailed description of the two-phase petroleum mixture. At each time step, both transport and fate processes are calculated, and the output allows the conversion of location and droplet characteristics into four-dimensional grids of oil concentrations. The oil-CMS hindcasts the transport and fate of the surface oil, DWH plume, and deposition over a few months (Paris et al., 2012; Le Hénaff et al., 2012; Lindo-Atichati et al., 2016; Perlin et al., 2020; Berenshtein et al., 2020). It can also generate the most characteristic distributions of initial DSDs, including gaussian and log-normal (Perlin et al., 2020; Faillettaz et al., 2021).
Throughout the far-field, the advection of individual droplets is represented by a deterministic component—solved by a 4th order Runge-Kutta integration scheme of velocity fields over time and space—and an added random displacement, representing sub-grid scale turbulent diffusion (Okubo, 1971; Paris et al., 2013). To account for oil transport due to drift induced by the wind and wind-generated features, we incorporated a wind component in the surface velocities (Le Hénaff et al., 2012; Perlin et al., 2020). The vertical terminal velocities in oil-CMS are given by relationships dependent on the droplet buoyancy, density, size and shape, and the ambient fluid viscosity and density (Clift et al., 1978; Zheng et al., 2003; Paris et al., 2012). The processes affecting oil fate are calculated throughout their advection, including sedimentation, landfall, biodegradation, dissolution, and evaporation (Paris et al., 2012; Le Hénaff et al., 2012; Lindo-Atichati et al., 2016; Perlin et al., 2020).
Solar Irradiance Module Implementation in Oil-CMS
To account for the likelihood of photooxidation in oil-CMS, we calculate the incident solar irradiance, i.e., the sunlight, received by each droplet and time-step, following the method described in Faillettaz et al. (unpublished). In short, at each time-step the solar shortwave irradiance from NOGAPS (Hogan et al., 1991; Rosmond et al., 2002, see section “Input Data and Modeling Scenario”) is interpolated to each droplet’s horizontal position. The shortwave irradiance encompasses the UV and visible irradiance (Gould et al., 2019; Clough et al., 2005) which together drive most of O2 uptake (Ward et al., 2018a,b). The irradiance penetration in the water column is modulated by the Beer-Lambert law, Iz = I0m ∗ exp–K_d*z, where I0m is the surface irradiance, z is the droplet depth and Kd is the light attenuation coefficient, which can be defined explicitly in space and time. The oil-CMS then tracks the cumulative incident solar shortwave on each droplet over time, and these values are used to determine when photooxidation is likely to occur, based on the latest published evidence (Ward et al., 2018a,b). Thus, the cumulative irradiance is calculated over the entire dispersal of the oil droplets, which includes periods of high exposure, e.g., during the day and at surface, and low to no exposure when droplets are in the subsurface and at night. Our approach is modular and can be updated to accommodate new findings of photooxidation processes and oil changes, as they become available, particularly regarding specific changes in oil composition and physicochemical characteristics with exposure to sunlight. Our approach is a significant advancement from present models, by considering the incident solar radiation on each droplet. We are also able to circumvent current empirical data limitations by using an irradiance threshold from laboratory results to calculate the likelihood of photooxidation, which can thus consider the possibility of photooxidation by both direct and indirect processes.
Input Data and Modeling Scenario
Here we focus on the DWH spill scenario. The environmental variables (zonal, meridional, and vertical velocities, temperature, and salinity) were obtained from the Gulf of Mexico HYCOM (GoM-HYCOM) hindcast (0.04° horizontal resolution, and 40 vertical layers). The GoM-HYCOM is forced by the Navy Operational Global Atmospheric Prediction System (NOGAPS) winds and surface fluxes, by large-scale model fields at the Atlantic boundary, and by data assimilation with the Navy Coupled Ocean Data Assimilation (NCODA) system. We used 3-hourly wind velocities on a 0.5° grid resolution from NOGAPS to account for surface wind drift, and the 3-hourly irradiance from the NOGAPS given on a 0.5° grid to estimate the photooxidation. Our initial droplet size distribution (DSD) is defined by a log-normal distribution with a mean of 117 μm and a standard deviation of 0.72 μm, based on published distributions of oil droplet size (Spaulding et al., 2017). Droplets are released at the trap height, which is the depth at which individual droplets and gas bubbles rise out of the initial highly buoyant and coalescent near-field plume, and its represented approximately at 300 m above Macondo wellhead (Socolofsky et al., 2011).
For the estimation of photooxidation, we used a conservative attenuation coefficient Kd = 5 m–1, which attenuates sunlight to 0.7% of the surface irradiance at 1 m depth. This choice of a conservative Kd is higher than typical Kd values for offshore waters in the northern GoM (mean Kd = 0.06 ± 0.02 m–1, Bridges et al., 2018) to account for the oil reducing the light penetration. We have taken a probabilistic approach, whereby individual oil droplets are likely to become oxidized once solar irradiance accumulated over their trajectory (i.e., during each integration time step) reach a determined threshold. Further modeling of physicochemical changes (e.g., density, viscosity, IFT, oxidation state) of individual droplet is limited by the lack of data for specific hydrocarbon pseudo-components. Our model thus assumes that a droplet is likely to be oxidized by photooxidation once it accumulates solar irradiance up to a determined threshold. In this experiment, our thresholds were derived from the study by Ward et al. (2018a) who measured physical and chemical changes of oil under simulated sun radiation. The authors observed photooxidated oil after 24 h under a solar simulator (Suntest XLS+) generating 250 Wm–2 to 765 Wm–2 (Atlas Material Testing Solutions, 2016, Ward et al., 2018a). From the sunlight simulator’s lower and higher irradiance ranges, we estimate a lower and a higher thresholds of cumulative irradiance necessary for photooxidation to occur. Here, the photooxidative thresholds are given by TI = Solar_lamp_output ∗ time_exposure, which result in 1.16∗107 J m–2 for the lower limit of the sunlamp, and 6.60∗107 J m–2 for the higher limit. The spectrum of UV and visible light from the sun simulator used to estimate the doses in laboratory from Ward et al. (2018a) is comparable to the shortwave radiation provided in NOGAPS based on results from Gould et al. (2019), which revealed that the photosynthetically active radiation (PAR) estimated from NOGAPS shortwave solar irradiance is a good representation of PAR measured in situ in the region of the Gulf adjacent to the DWH response site.
Data Analysis
Hereafter a droplet is considered ‘photooxidized’ once its cumulative irradiance reaches the phootoxidation thresholds defined above. To analyze the distribution and time of the likelihood of solar radiation-driven changes, for each release and photooxidized droplet we estimate: (i) the distance from the DWH response site (i.e., above the Macondo well) at which photooxidation took place, (ii) the distance traveled by a droplet from its surfacing location to where it likely photooxidized, and finally (iii) the time from surfacing to probable photooxidation (Figure 3). Since droplets are released in the model at the trap height (1222 m depth), it is necessary to distinguish the different temporal ranges between the time/distance from release to reaching the photooxidation threshold (i.e., the droplets’ ascension and drift until photooxidation) and the time/distance traveled from droplet surfacing (i.e., when droplets reach depths of shallower than 2 m and start to accumulate incoming solar irradiance); the latter is automatically shorter than the former. We also calculated the probabilistic distribution functions (PDF) of initial distributions of POCs along the spill for both the low and high irradiance thresholds and quantified the distances from the DWH response site which encompasses 25, 50, 75, and 100% of the likelihood of photooxidized compounds formation.
Moreover, since oil-CMS simulates several processes of oil fate, we can identify the probable distributions of photooxidized droplets which were beached and/or deposited along the spill. We constructed a grid covering the northern Gulf (from 26°N to 31°N, from −98°W to −82°W), with a 0.25° resolution, using the coordinates (latitude and longitude) of each photooxidized droplet deposited on the seafloor or coastline. We then distributed the droplets along the grid, calculating the probability of landfall in each bin and plotting these as PDF maps of coastline oiling. To account for the variability of these processes, we also plotted the PDF maps at daily intervals and the overall probabilities for both scenarios (low and high irradiance thresholds).
Results
The median and the median absolute deviance (mad) of the solar irradiance are shown in Figure 1. Solar irradiance is taken from the NOGAPS irradiance forecasts during daylight hours (ca. 7am to 7pm CST) over the Gulf region adjacent to the DWH response site, encompassing most of the spilled oil (from 27°N to 30°N and from 90°W to 86°W). The solar irradiance median ranges from 177 Wm–2 to 716 Wm–2 over this period, with substantial daily and weekly changes, for example between June 1st and June 4th when the median solar irradiance varies from 695.9 Wm–2 on June 1st to 356 Wm–2 on June 2nd, back to 677.7 Wm–2 on June 4th. The passage of Hurricane Alex through the Gulf also drives low irradiance values and high variability, with 265.1 Wm–2 on July 1st, 373.4 W m–2 on July 3rd, and a sunnier day on July 2nd that triggered a marked increase in the median irradiance (546 Wm–2). The ranges of the median absolute deviance show that the solar irradiance over this region also varies over short (hourly) time scales and spatially based on the cloud coverage (Figure 1).
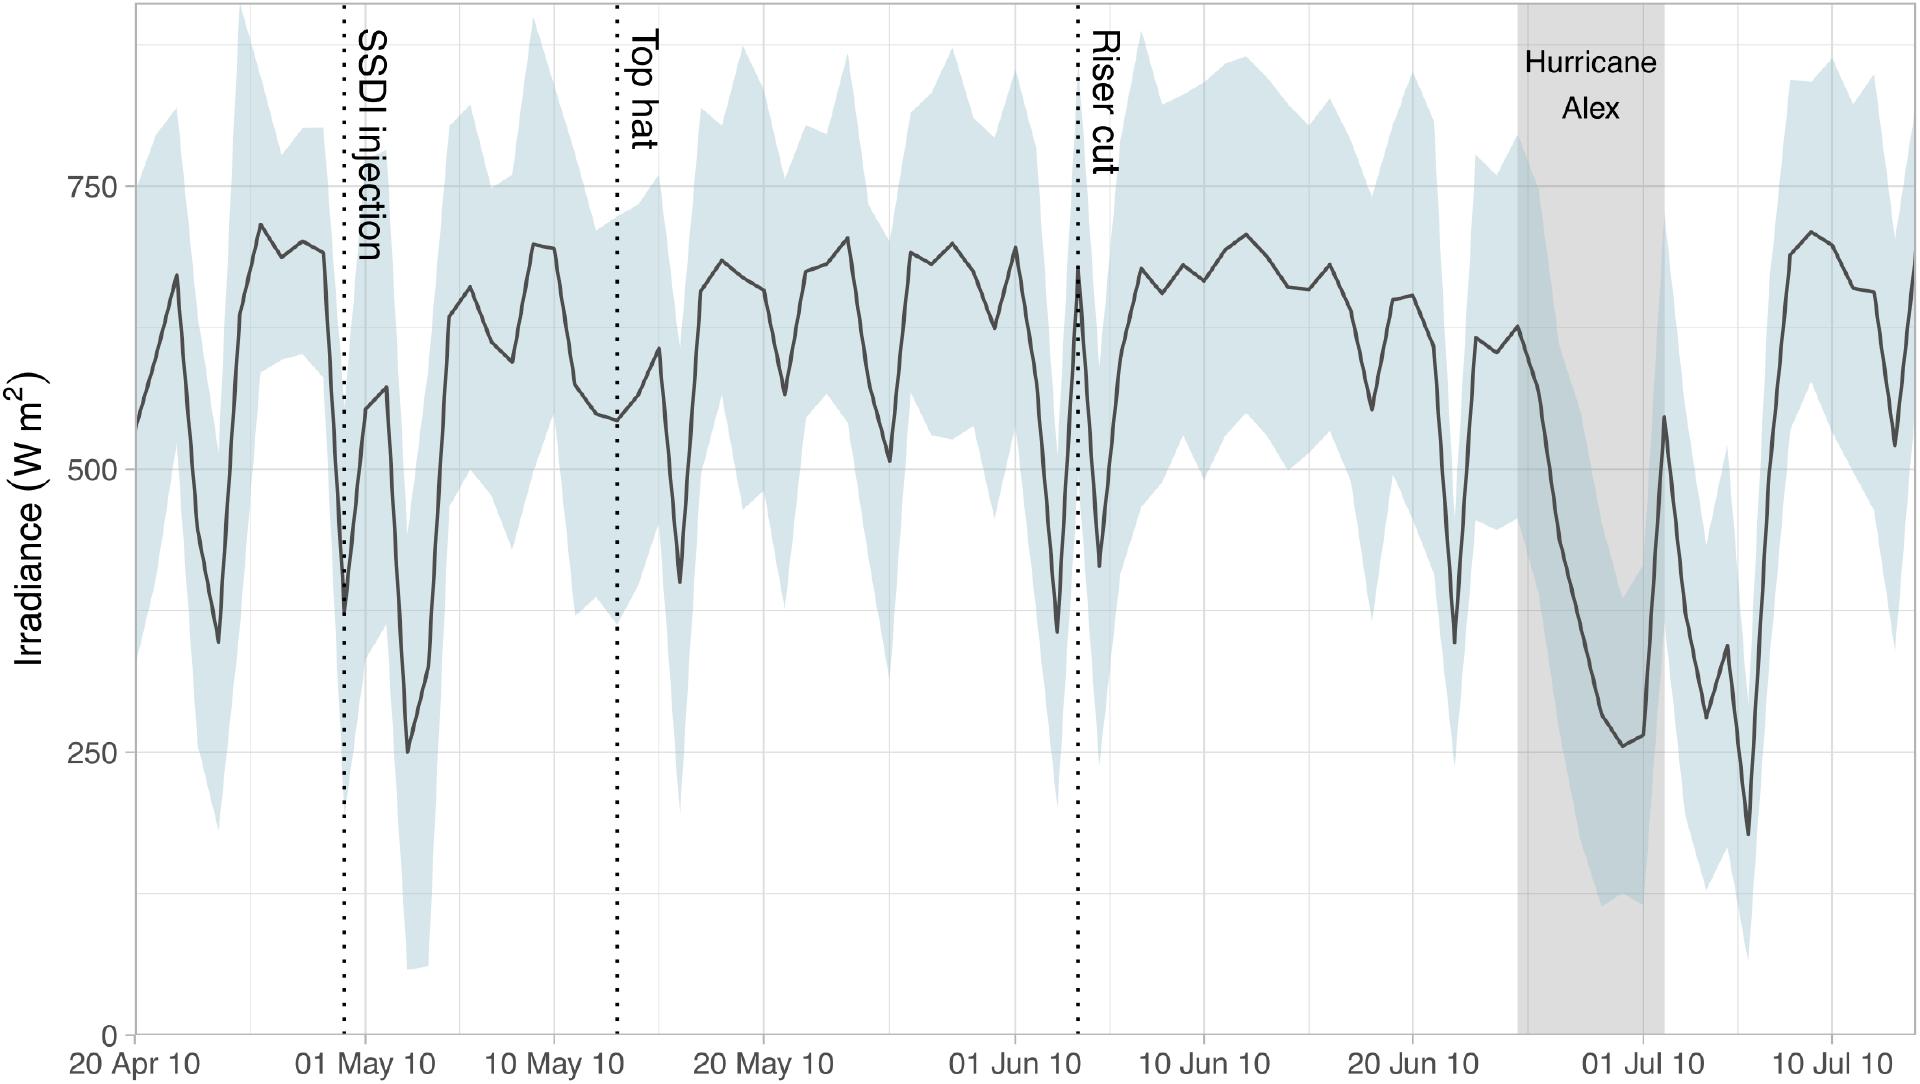
Figure 1. Median (line) and median absolute deviation (mad, blue shaded area) of solar irradiance (Wm–2) at the sea surface during daylight hours (7am to 7pm CST) over the area adjacent to the Macondo well and DWH response site (27°N to 30°N; 90°W to 86°W) in the Gulf of Mexico. Three-hourly shortwave solar irradiance values for the region were obtained from the 2010 NOGAPS model. Dates show significant events for response to the DWH oil spill, including the onset of SSDI (April 30th), top hat (May 13th), riser cut followed by the Lower Marine Riser Package (June 4th), and the period Hurricane Alex was present in the Gulf of Mexico (June 24th to July 2nd).
To explore how this varying solar irradiance can affect the probability of POCs formation, we investigate the locations where photooxidation likely took place along the spill duration, considering the higher, and thus most conservative, threshold for photooxidative changes (Ward et al., 2018a). As expected from the dynamic and turbulent nature of surface currents, the oil concentrations vary along the evolution of the spill (Figure 2). Interestingly, the locations where most photooxidation occurs are also highly variable and not necessarily in close proximity to the response site (Figure 2). For example, POCs accumulate in the region around the DWH response site on June 10th (Figure 2c), while on other days, POCs spread around a larger region: on April 20th, POCs are formed mainly along the southern branch of the surface oil slick (Figure 2a), and on July 10th, our model predicts that photooxidation likely occurs to the north, east and southeast of the DWH response site along coastal regions, over the DeSoto Canyon, and towards the Gulf interior where POCs are likely distributed in a semi-circular pattern, seemly along a mesoscale eddy, which is not observed for the oil surface concentrations (Figure 2b).
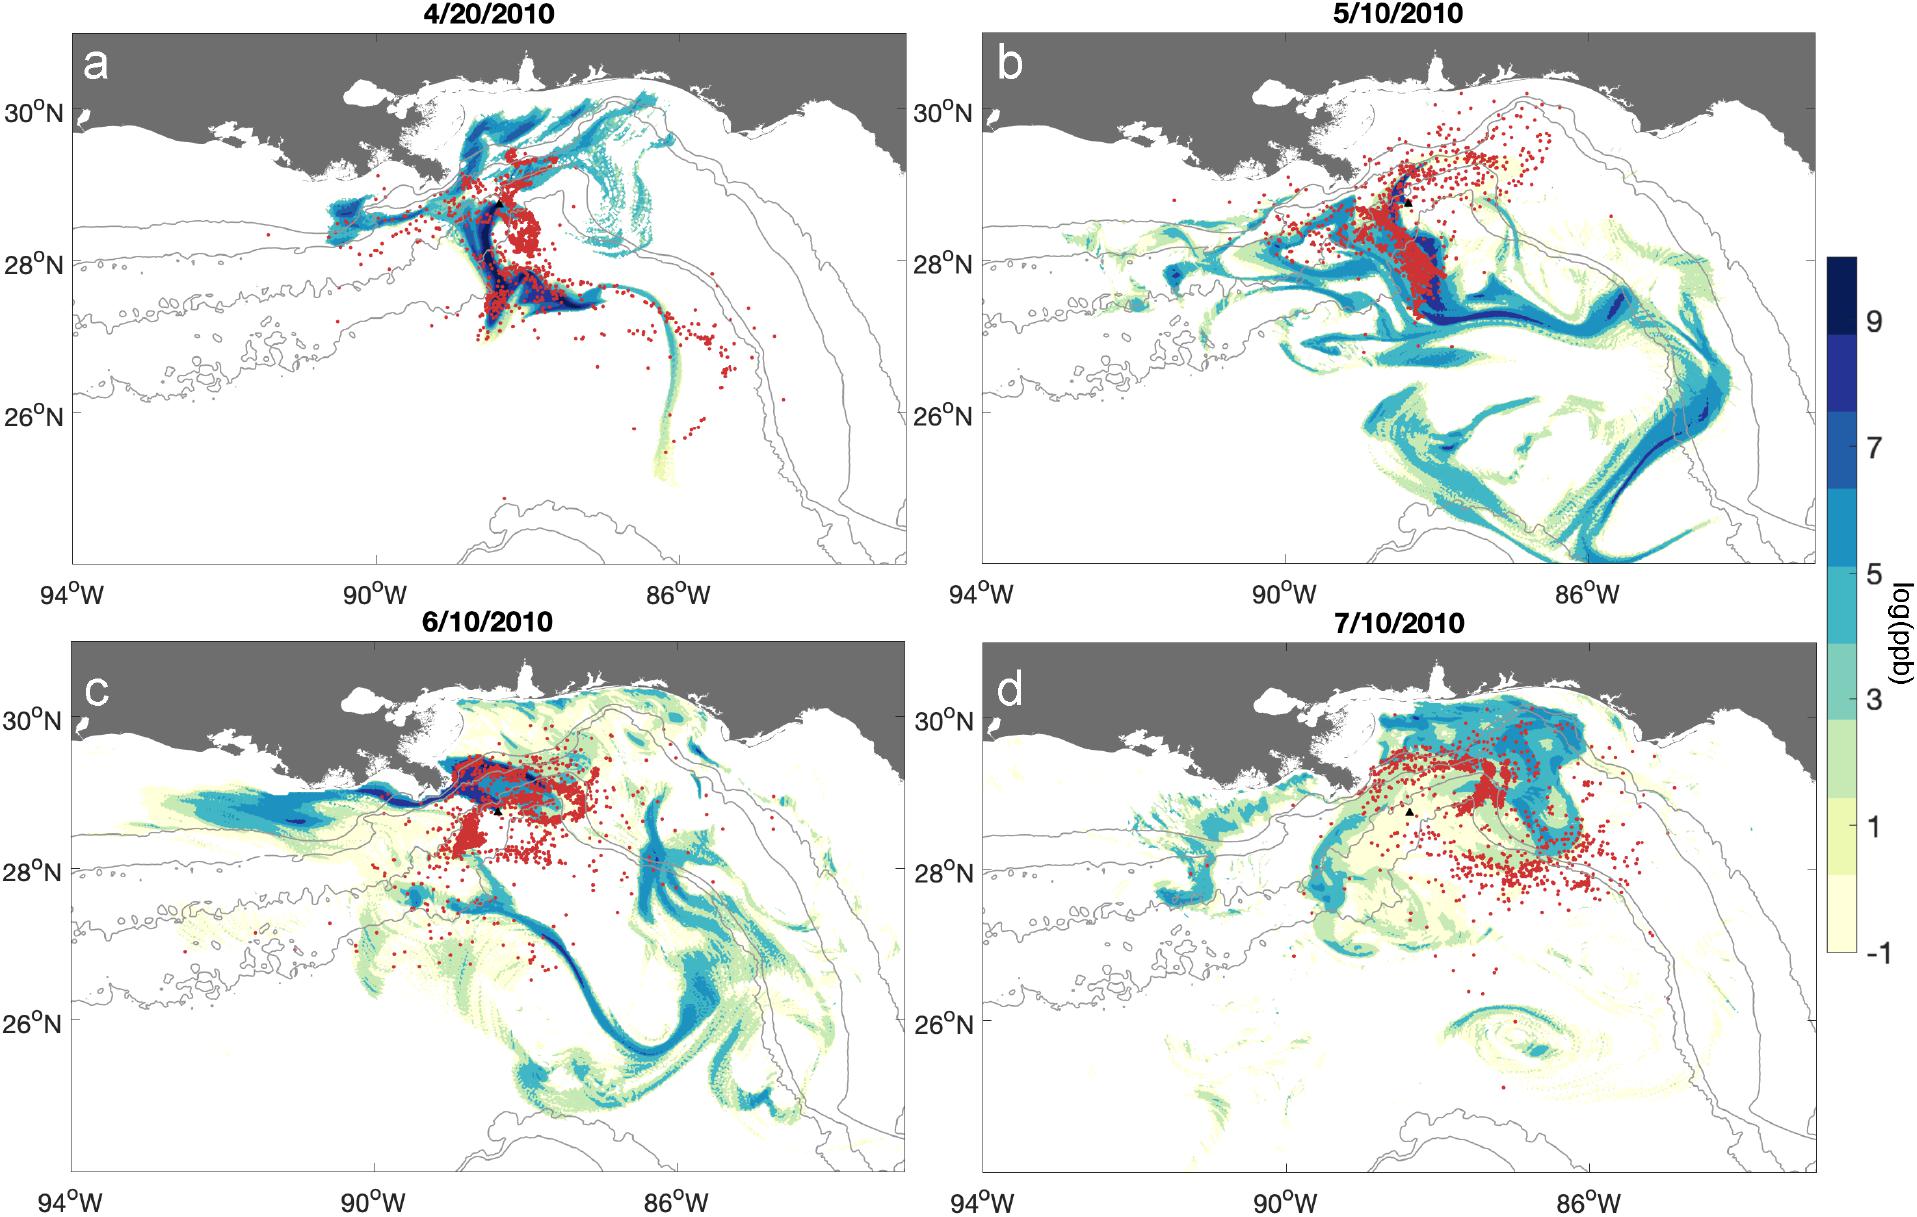
Figure 2. Photooxidized components (POCs, red dots) probable formation locations, for four release days along the DWH oil spill timeline: (a) April 20th, 2010, (b) May 10th, 2010, (c) June 10th, 2010 and (d) July 10th, 2010. The background colors illustrate the oil concentration (log ppb) at the surface layer (0 to 1 m depth) 20 days after each release date. POCs are considered to form when droplets received a cumulative irradiance dose of at least 6.60*107 J m–2 (Ward et al., 2018a).
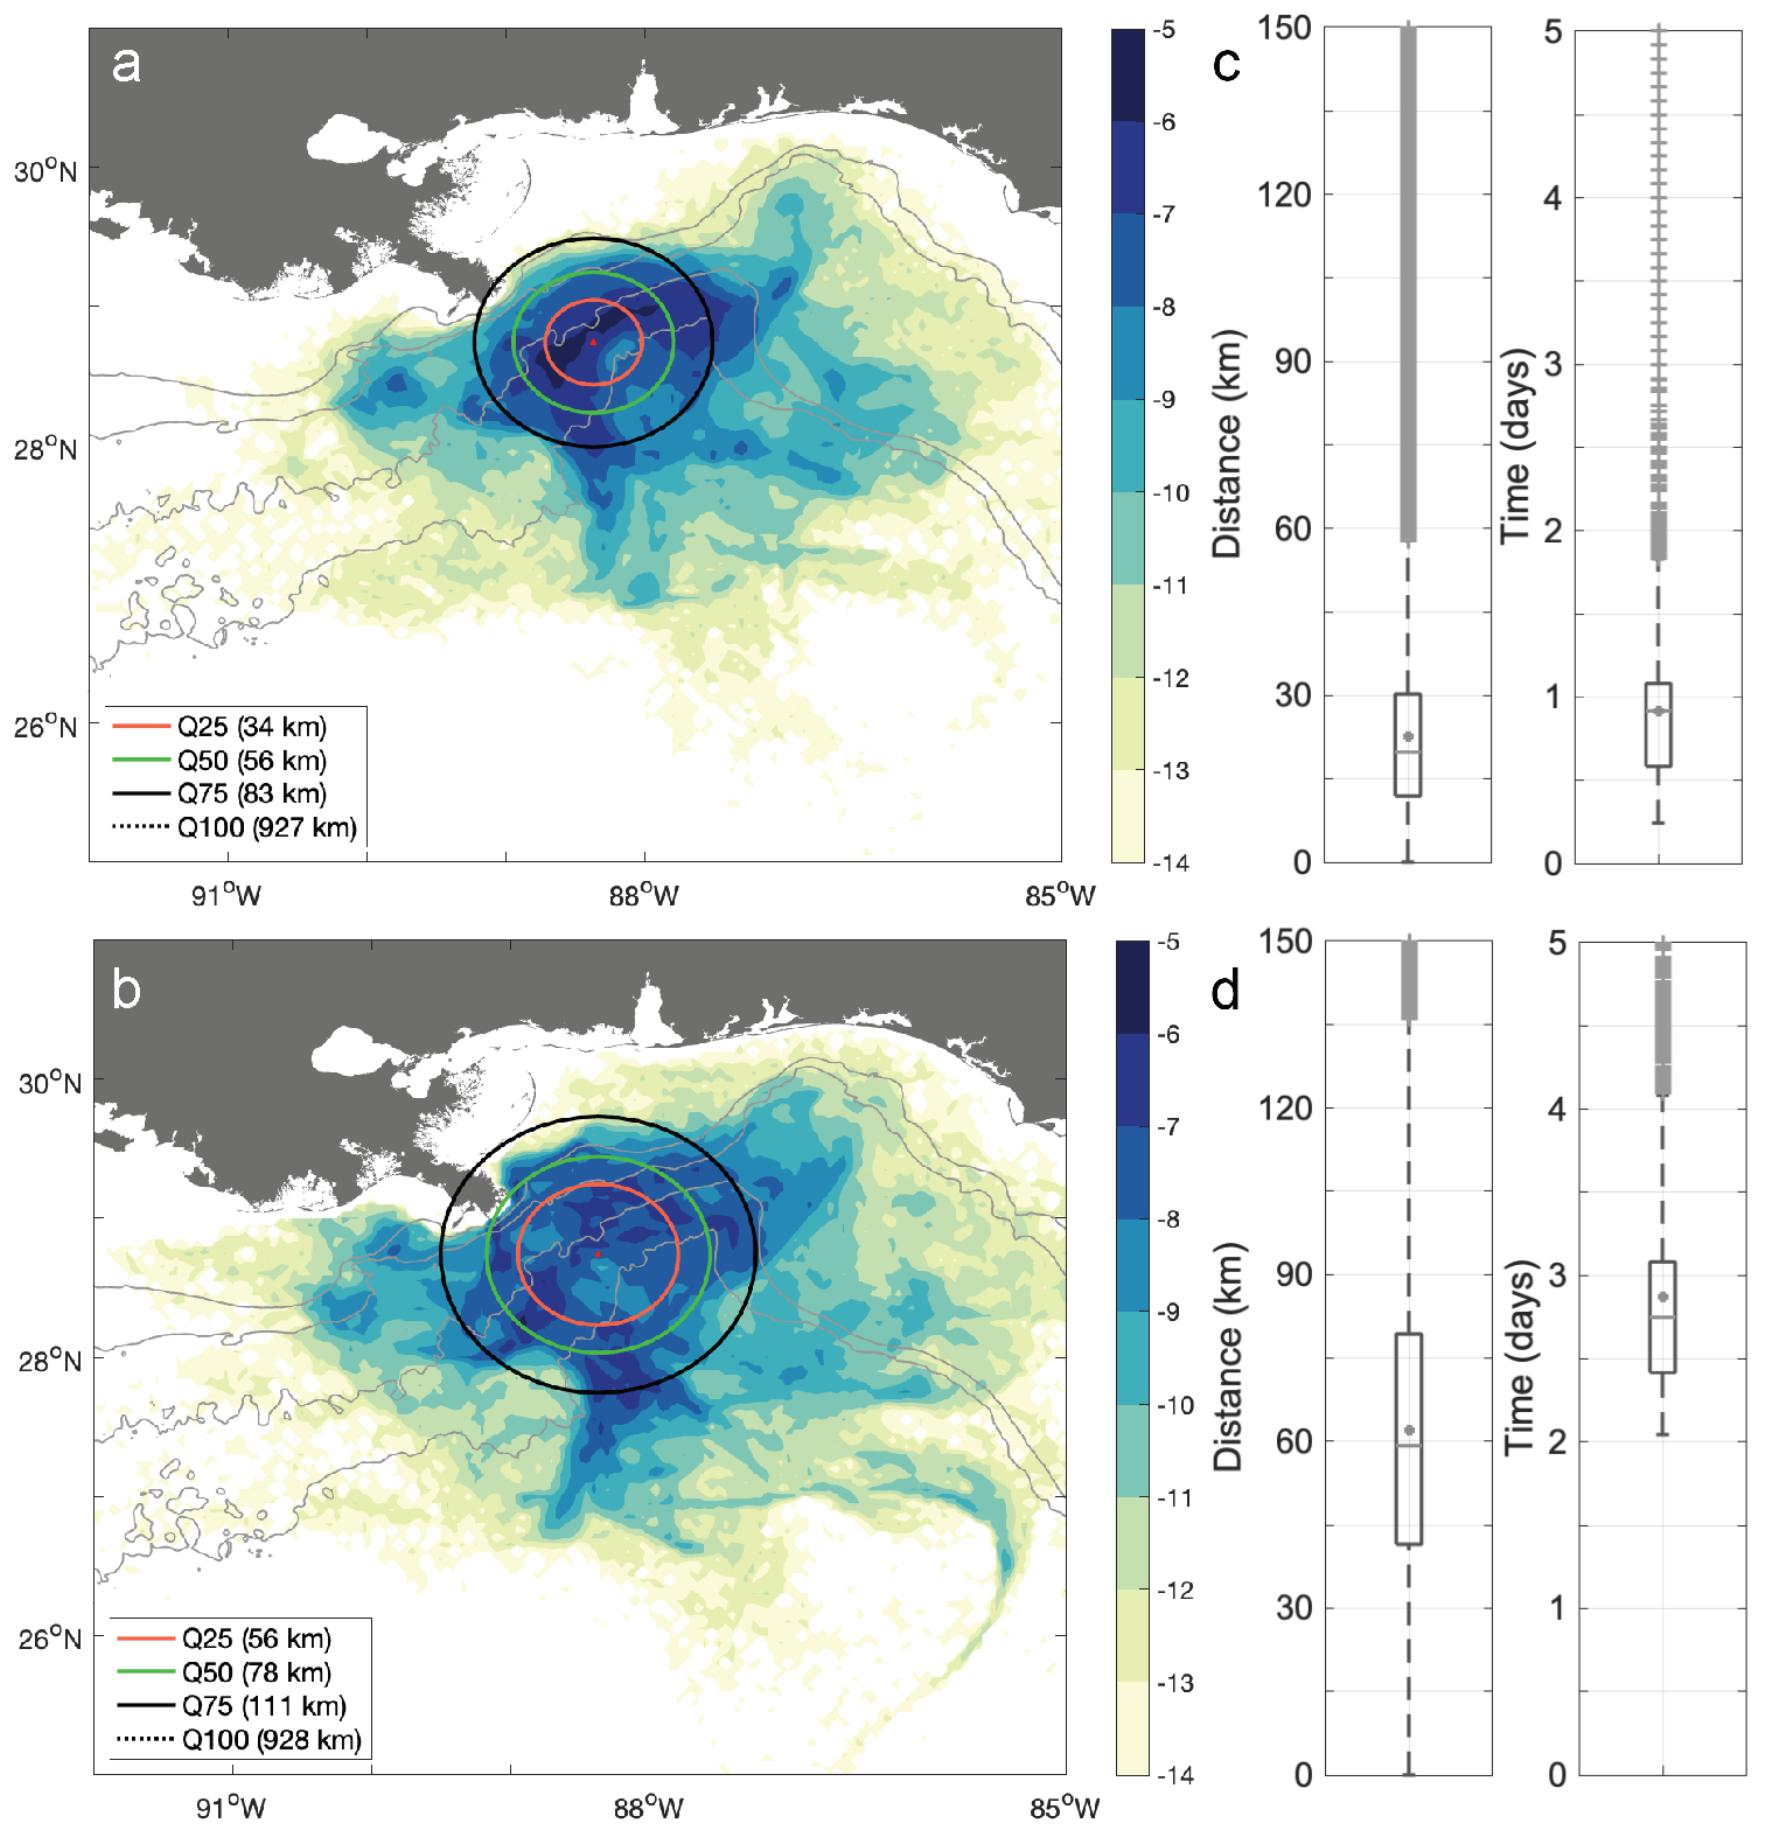
Figure 3. Probability (PDF) of photooxidized components (POCs) formation during the DWH blowout (a,b). Solid lines represent areas containing percentiles of POCs formation (Q25: quantile 0.25, Q50: quantile 0.5, Q75: quantile 0.75 and Q100: quantile 1), which radii are computed from the vertical axis of the Macondo well. Onset of the photooxidation process occurs as soon as the oil droplet reaches the surface, but here the likelihood of photooxidative changes is based on the observed thresholds of cumulative solar irradiance after Ward et al. (2018a). Upper panel are for the photooxidized compounds considering a lower solar irradiance threshold (1.16*107 J m–2), and lower panels considering a higher solar irradiance threshold (6.60*107 J m–2, Ward et al., 2018a). Boxplots (right panels, c,d) provide the distribution of the distance and time traveled to the likelihood of photooxidation, once the droplet reached the surface (0–1 m depth).
We then examine the spatio-temporal scales of photooxidation by computing PDFs of the locations where POCs likely formed throughout the duration of the DWH oil spill (Figures 3a,b). These areas are widely distributed, with the higher probabilities close to the response site above the Macondo well, for both the lower (Figure 3a) and the higher irradiance thresholds (Figure 3b). Under the lower threshold scenario, probabilities of POCs formation are restricted to the open ocean, in regions closer to the DWH response site, seldom occurring in depths less than 50 m near coastal zones. Under the higher threshold of irradiance, POCs form over a broader region, reaching both areas of open ocean south of the spill location and shallower areas (< 50 m) near the coast. These differences are reflected in the distance from the response site where photooxidation is likely to occur in our model. For the lower threshold (Figure 3a), 25% of photooxidative changes happen in an area of 34 km around the DWH response site, 50% at 56 km, 75% at 83 km, with a maximum distance reached by a POC of 927 km. For the higher threshold, 25% of changes are likely to occur within 56 km, 50% within 78 km and 75% within 111 km, while the maximum distance traveled before reaching the oxidation threshold remained similar (928 km, Figure 3b). On average, the distance to photooxidation from the DWH response site varies from ca. 60 km for the lower threshold to 80 km for the higher threshold. When considering the sea surface area where Corexit has been applied (Figure 4, Office of Response and Restoration, 2020; Houma ICP Aerial Dispersant Group, 2010), 93.9% of the applications (ca. 973,000 Gallons) took place where 75% of the POC formation is predicted to have occurred. This value rises to 99.3% of total dispersant applications by using the lower threshold.
Despite the overall variability in both the locations and the transport time in which photooxidation may have taken place, we are able to delineate spatio-temporal scales to probable photooxidation (Figures 3c,d). The average distance traveled by droplets from their surfacing location to their photooxidation is 22.6 km for the low threshold scenario, with the 25th and 75th percentiles varying from 11.9 to 30.2 km (Figure 3c). For the high solar irradiance scenario, the average distance is 62 km, with the 25th and 75th percentiles varying from 41.4 to 79.3 km (Figure 3d). The average time from surfacing to photooxidation for the low threshold scenario is 0.91 days (21.9 hours), with the 25th and 75th percentiles ranging from 0.58 to 1 day (Figure 3c). For the high solar irradiance threshold case, the average time is 2.8 days (68.9 h), with the 25th and 75th percentiles varying from 2.4 to 3 days (Figure 3d).
The variability of incoming solar irradiance is not only reflected in the areas where photooxidation likely occur, it is also evident in the probability of POCs fate, as shown by the probability of deposition of POCs in the northern GoM (Figure 5). The variable nature of solar irradiance reaching the ocean surface and consequently, of light-driven processes such as photooxidation, is also evident (Figure 5). The oil released at the beginning of the DWH spill, on April 20th 2010, not only accumulated enough irradiance within hours of surfacing to photooxidize, as defined in our model, but it could also reach the shoreline within the first 10 days of transport (Figure 5a). Nonetheless, the areas most likely to receive POCs change along the duration of the spill. Oil released on April 20th and photooxidized under the higher solar irradiance threshold is most likely to reach the coast of Louisiana along the Mississippi River Delta, specifically in the Lafourche Parish and Chandeleur Sound (south and east of New Orleans, respectively), and in Dauphin Islands on the Alabama coast (Figure 5a). Probabilities of coastline oiling are mostly distributed from Pensacola (Florida) to Marsh Island (Louisiana), yet with small probabilities of reaching as far as San Jose Islands near Corpus Christi, Texas, and Clearwater in Florida (Figure 5a). Conversely, the probabilities of POCs reaching the shoreline from oil spilled on May 10th are mostly distributed along the region from Marsh Island (Louisiana) to Apalachicola (Florida), with the farthest likelihoods of reaching the shore around Galveston (Texas) (Figure 5b). POCs from oil released on June 10th deposit in the coastline from Galveston (Texas) to Apalachicola (Florida), with higher probabilities toward the northwest of the DWH response site, around the Mississippi Delta (Figure 5c). For oil spewed on July 10th, shoreline POCs are mostly distributed to the Eastern Gulf, from Louisiana to Florida, with probabilities more evenly distributed along the coastline (Figure 5).
Despite the variable patterns of coastal oiling probabilities, we also characterize the overall probabilities along the entire duration of the oil spill, for the lower and higher solar irradiance thresholds (higher threshold results shown in Figure 5e). The overall probabilities of coastline deposition are similar for both scenarios, although differences are observed for the initial photooxidation locations. Low probabilities of sedimentation of POCs are spread throughout the northern Gulf, from southern Texas to Cayo Costa in southwest Florida (Figure 5e). The highest probabilities are confined to the northwest of the DWH response site, mostly around the banks and lobes of the Mississippi Delta. Oiling is less likely to occur around Mobile (AL) and Pensacola (FL). The time for POCs to reach the coastline is also similar for the two threshold cases, averaging 20 days and varying from 10 to 21 days (25th and 75th percentiles, respectively).
Discussion
Photooxidation is, remarkably, the only major weathering process largely absent from models of oil transport (Ward and Overton, 2020), particularly due to a lack of detailed understanding of this process. The opportunity afforded by the DWH spill to contrast laboratory experiment with field measurements, has renewed the understanding of photooxidation, demonstrating that photooxidation of the DWH oil: (1) likely occurred on short timescales of hours to weeks, (2) was a relevant fate process when compared to evaporation, dissolution and biodegradation, and (3) could lower the effectiveness the application of surface dispersants (Hall et al., 2013; Ray et al., 2014; Ruddy et al., 2014; Aeppli et al., 2018; Ward et al., 2018a,b, 2019). Given this scenario, the inclusion of 4D photooxidation on oil spill models is fundamental for the accurate prediction of oil transport, fate, and the evaluation of response alternatives (Ward and Overton, 2020). The module described on this paper, developed for oil-CMS (Paris et al., 2012), is the first representation of spatio-temporally explicit photooxidation processes in a Lagrangian model of oil transport. Our framework thus fulfills the previous lacuna and contributes to advance the field of oil modeling.
Our results are a strong indication that both the 4D movement of oil and spatio-temporally explicit processes driving its fate must be incorporated in oil models to fully represent this process. They further suggest that the use of constants to parameterize photooxidation cannot capture the spatio-temporal modulations of this variable process. This is exemplified in the graphs showing the locations where POCs are mostly likely formed (Figure 3). While the general pattern of probability of POC formation loosely follows the distribution of surface oil on this temporal snapshot, areas with higher probability of POC concentrations are not aligned with the areas with higher concentration of oil at this timeframe - 20 days after the spill - which is the average time to photooxidation from release at depth (Figure 3). Thus, if the likelihood of photooxidation had been estimated by a constant ratio of photooxidation based on oil concentration, it would have incorrectly captured the formation of photooxidation products. In addition, we show that solar irradiance intensity alone cannot represent the patterns of probability of photooxidation. For instance, for the period considered here, the probability of POC formation on July 10th was the one presenting the most spread throughout the surface waters of the Gulf (Figure 5d). Interestingly, the irradiance on July 10th is among the highest observed range over the spill region and period (ca. 715 Wm–2; Figure 1) and it remains high for the next 3 days. In this example, average values of irradiance are not adequate to represent a process which is stochastic and non-linear in nature: a 4D transport (i.e., in space and time) and fate model is necessary to capture the interplay between the varying solar irradiance values, the dynamic local hydrography and the droplet’s evolving physicochemical properties.
Our results support that the likelihood of oil photooxidation during the DWH is spatially and temporally variable, yet mostly constrained to occur during the first 20 days after release and within a 120 km radius from the DWH response site. We show that the regions along the Northern Gulf coast to which POCs are most likely transported, accumulated and sedimented are ever changing along the spill (Figure 5). However, despite the variability observed over short timescales (represented by the daily PDFs of shoreline oiling), the probabilities of POCs reaching coastline are similar over entire spill for both the lower and the higher threshold to trigger photooxidation. Thus, since photooxidative processes occur on timescales of hours to days, while the oil is on the sea surface, the final distribution of POCs on the coastline is driven by circulation patterns underlying their transport and deposition. At the end of the spill, probabilities of POC distributions are spread throughout the surface waters of the Gulf of Mexico, and through the shorelines from Texas to Florida (Figure 5). These results indicate that not only the location where these compounds form is relevant for response and mitigation, but it is also vital to forecast where they accumulate during their transport as well as their final fate. Thus, future studies should explore not only changes in droplet’s physicochemical properties, but also the influence of other physical mechanisms showed to alter oil distribution and droplet size at surface, such as waves (Zhao et al., 2014; Cui et al., 2020), and spatio-temporally explicit turbulence (Nordam et al., 2019; Boufadel et al., 2020).
Our model presents a probabilistic approach to the estimation of areas where photooxidized compounds are more likely to form, accumulate, and sediment. Comparisons of PDFs of POCs with field measurements would not yield any robust analyses given that a range of POCs cannot be captured by traditional analysis and were likely not detected during the DWH (Hall et al., 2013; Aeppli et al., 2014, 2018; Ray et al., 2014; Ruddy et al., 2014; Ward et al., 2018b). Still, our model estimates of time to initial photooxidation matched accurately the revised paradigm of photooxidation presented by Ward et al. (2018b), demonstrating its robustness. Our results show that, even for the most conservative scenario with high irradiance thresholds to photooxidation, this weathering process is likely to happen in the first 3 days after a droplet reaches the surface (Figure 3).
While oil deposition on beaches is well described by several studies based on the Shoreline Cleanup Assessment Technique surveys (SCAT, Michel et al., 2013; Operational Science Advisory Team III, 2013; Hayworth et al., 2015; Nixon et al., 2016), these studies assess the deposition of oil at any stage of weathering and there are no comprehensive measurements of shoreline oiling by photooxidized compounds. Oil reaching the shoreline can be further weathered by sun radiation (Hayworth et al., 2015), yet most of the photooxidation during the DWH may have occurred at surface, and the oil was transported to shore as POCs (Aeppli et al., 2018; Ward et al., 2018b). Our modeling results suggest the same: photooxidation happened in areas with depths greater than 30 m. Thus, our PDFs of POCs on shoreline can only be broadly contrasted with oil deposition from field surveys. In general, our estimates reproduce the observed extent of oiled shoreline reported by reviews of SCAT assessments (Michel et al., 2013; Operational Science Advisory Team III, 2013; Nixon et al., 2016), with probabilities of POCs reaching the coastline from Florida to Texas (Figure 5). The probabilities of oil reaching the farthest states (TX, FL) are small, but nonetheless there are reports of DWH tar balls reaching these areas (Operational Science Advisory Team III, 2013). Furthermore, the coastal areas most likely to receive POCs in our model are areas where SCAT reviews showed the largest accumulation of oil (Michel et al., 2013; Nixon et al., 2016), and also matched the sampling sites of oil sand patties (or SBRs) over six years following the DWH spill (Aeppli et al., 2012, 2018; White et al., 2016; Bociu et al., 2019), further supporting the representativeness of this weathering process by our model.
During the 87 days of the spill, 1.07 million gallons of Corexit 9500A and Corexit 9527A were applied at the surface by response ships and aerial applications from planes (BP Gulf Science Data, 2016). Most of the applications targeted the region in which we observed at least 75% of the formation of all POC formation in our model (Figure 4, Houma ICP Aerial Dispersant Group, 2010; Office of Response and Restoration, 2020). Considering a range of oil residency times at the Gulf’s surface and irradiance values, Ward et al. (2018b) extrapolated their laboratory experiments and estimated regions where dispersant effectiveness was reduced; the highest distance from the DWH response site the authors estimated dispersant effectiveness would reach 45% was 124 km. In our model, this distance encompasses more than 75% of POC formation on both the higher and the lower irradiance threshold scenarios, strengthening the conclusions that applications of Corexit in this region can presented limited effectiveness to disperse this—likely photooxidized—oil.
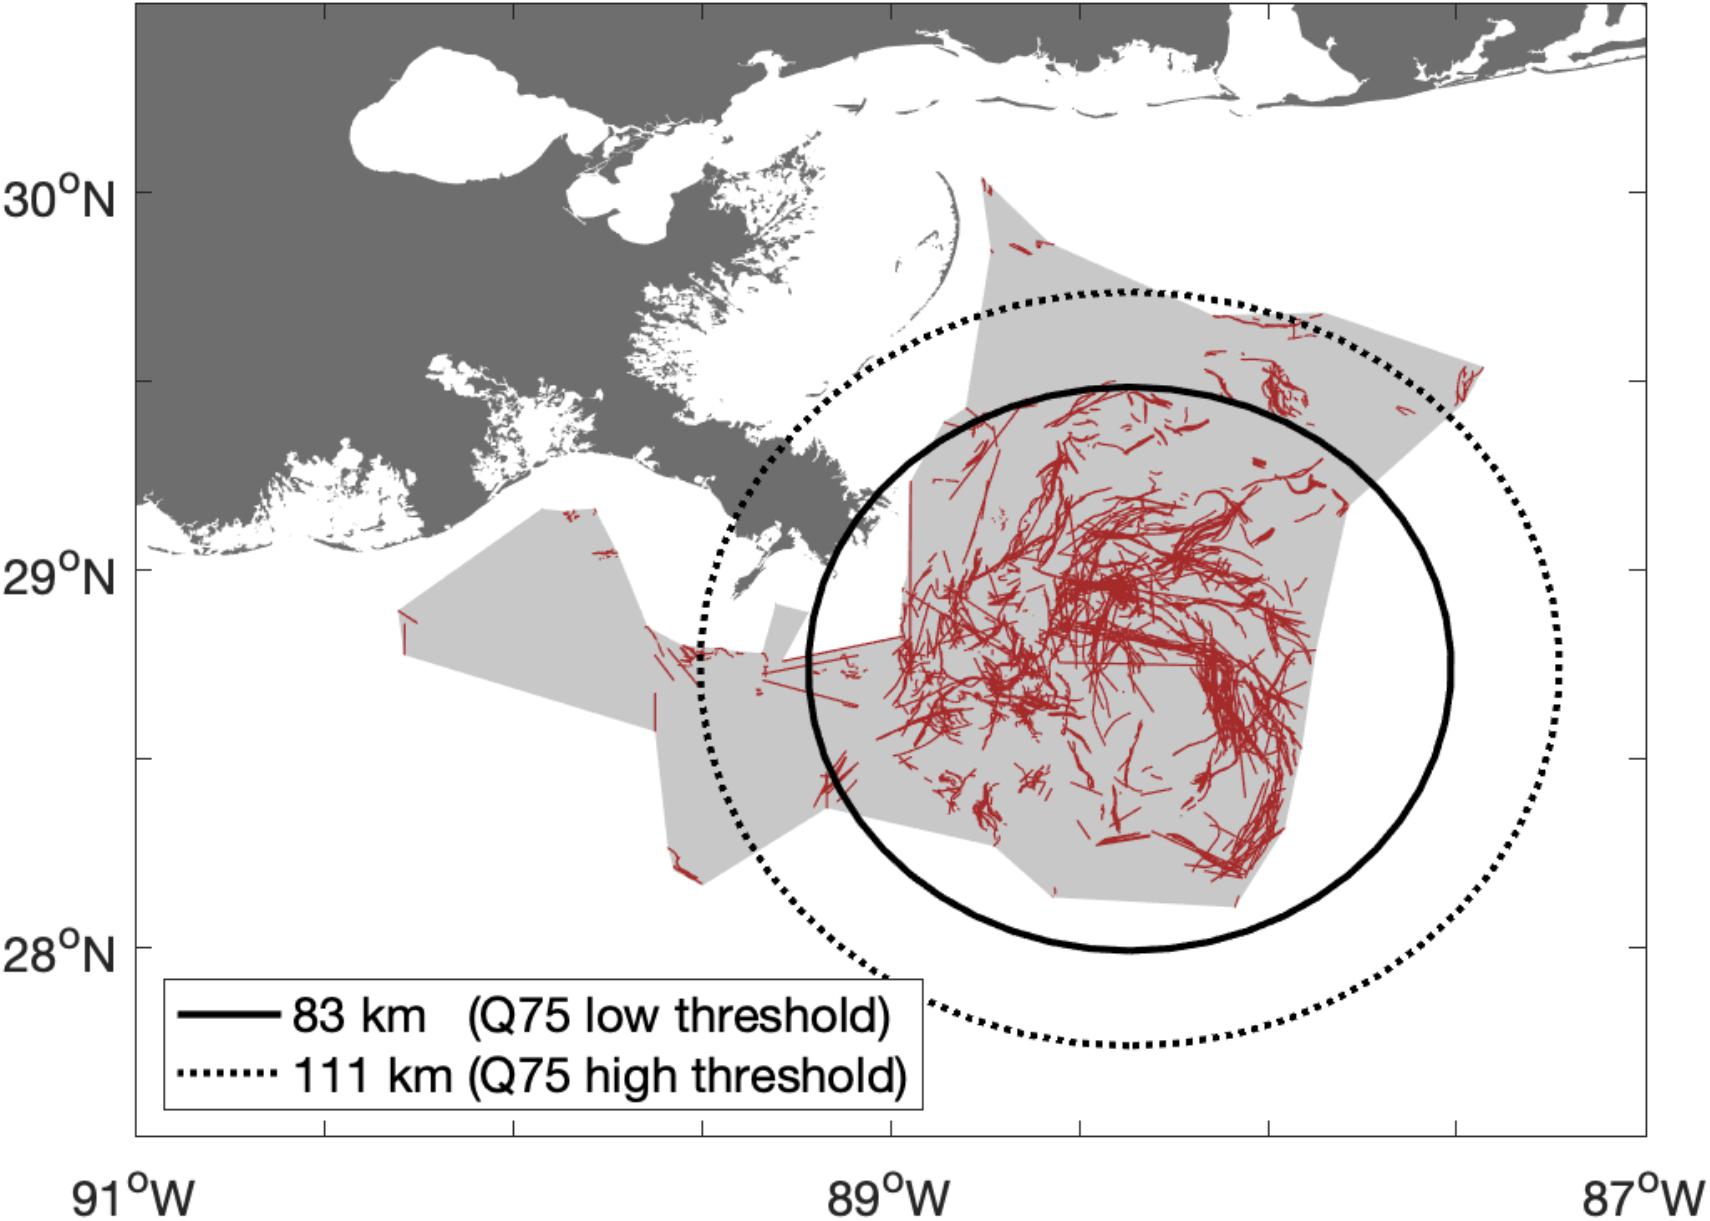
Figure 4. Surface dispersant application (red tracks) and their envelope (gray polygon) during the Deepwater Horizon oil spill. Dashed and solid circles represent areas containing Q75 percentile of POCs formation, at a radial distance of 83 km and 111 km for the low and high thresholds, respectively; 93.9% and 99.3% of surface dispersant applications (total ca. 973,000 Gallons) occurred in the region where 75% of POC formation occurred, for the lower solar irradiance threshold (1.16*107 J m–2) and higher irradiance threshold (6.60*107 J m–2, Ward et al., 2018a), respectively.
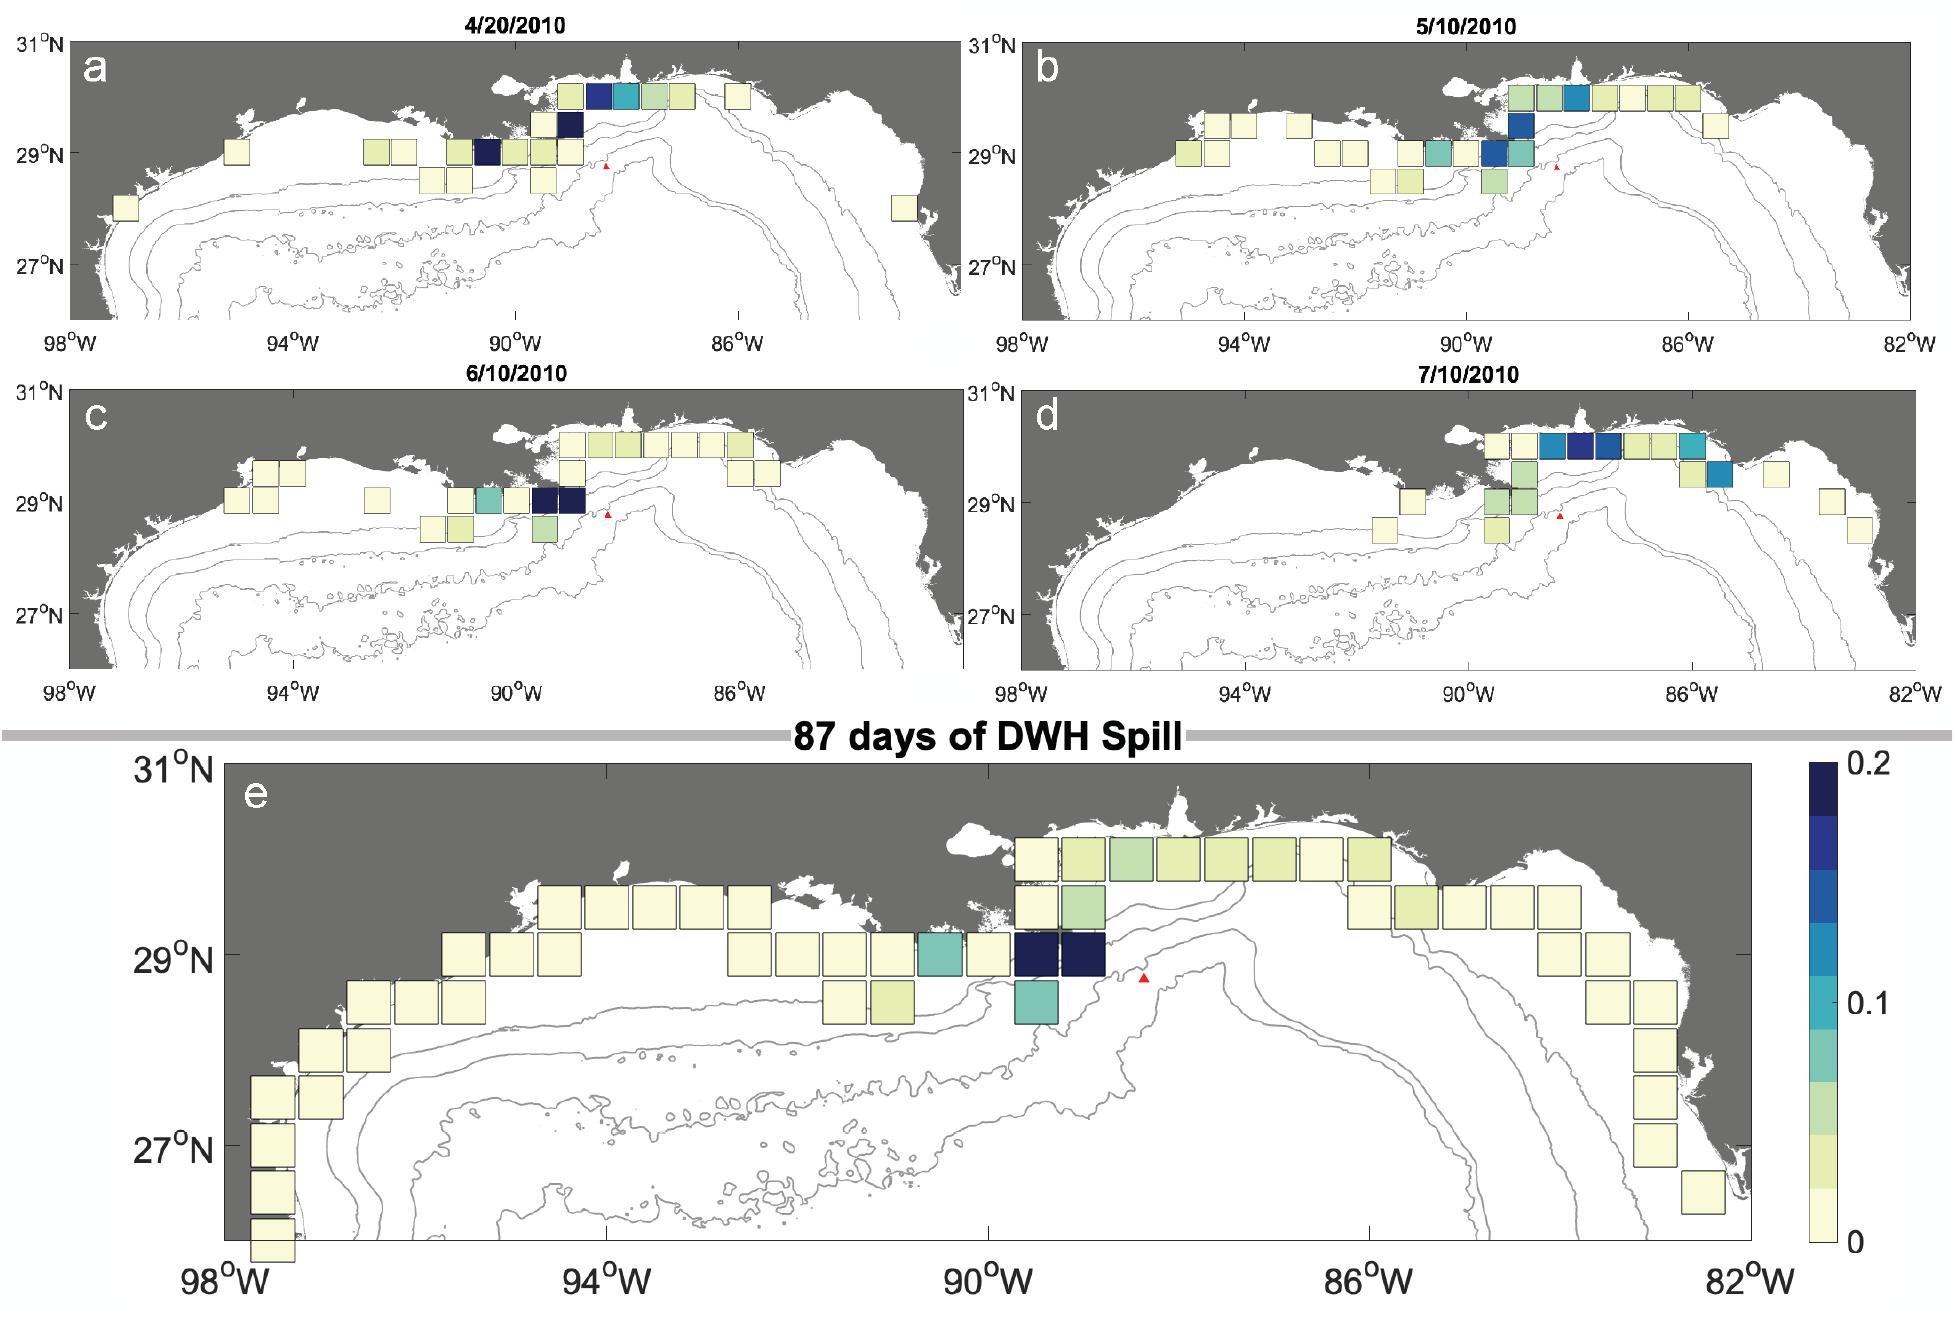
Figure 5. Probability (PDFs) of sedimented photooxidized compounds from oil released on: (a) April 20th, 2010, (b) May 10th, 2010, (c) June 10th, 2010, (d) July 10th, 2010, and (e) during the 87 days of the DWH blowout, considering the high solar irradiance threshold scenario (i.e., photooxidation occurring when the droplet’s cumulative irradiance reaches 6.60*107 Wm–2,Ward et al., 2018a). Probabilities are calculated throughout the region for each 0.5° × 0.5° bins.
Conclusion
We developed a new oil-fate module coupling the oil application of the Connectivity Modeling System (oil-CMS) with solar irradiance from Earth Systems Models (ESM) to compute spatially and temporally explicit photooxidation of petroleum fluids. The coupled oil-CMS and ESM model the can successfully capture the effects of solar irradiance variability on photooxidation of the spilled hydrocarbons on a probabilistic framework. The hindcast simulations of the DWH based on observed thresholds of cumulative irradiance (Ward et al., 2018), suggest that the temporal scales to photooxidation vary from hours to days (< 3 days) from the time fresh oil reached the surface, and that photooxidation occurred mostly in a 110 km radius from the DWH response site, agreeing with the revised paradigm of photooxidation proposed by Ward et al. (2018a). By incorporating both the 4D representation of oil droplet movement and the likelihood of weathering with variable solar irradiance, our photooxidation module is a unique tool which can be used in both forecasts and hindcasts of the formation of photooxidation products during and after a marine oil spill. Our results strongly support previous conclusions that photooxidation and the fate of POCs must be taken into account during the choice of response and in the calculation of their trade-offs.
Data Availability Statement
Data are publicly available through the Gulf of Mexico Research Initiative Information & Data Cooperative (GRIIDC) at https://data.gulfresearchinitiative.org, https://data.gulfresearchinitiative.org/data/R6.x805.000:0110, and 10.7266/ADGH8VGH.
Author Contributions
All authors contributed to the conception and design of the study. All authors participated in the development of the novel CMS module, ran the simulations, and analyzed the results. AV drafted the manuscript, and all authors wrote and revised the manuscript. All authors contributed to the article and approved the submitted version.
Funding
This research was made possible by two grants from the Gulf of Mexico Research Initiative (GoMRI): C-IMAGE III (Center for the Integrated Modeling and Analysis of the Gulf Ecosystem) No. SA 18–16 and RECOVER 2 (Relationship of Effects of Cardiac Outcomes in fish for Validation of Ecological Risk), No. SA-1520.
Conflict of Interest
The authors declare that the research was conducted in the absence of any commercial or financial relationships that could be construed as a potential conflict of interest.
Acknowledgments
We thank the reviewers for their throughout and helpful comments.
References
Aeppli, C., Carmichael, C. A., Nelson, R. K., Lemkau, K. L., Graham, W. M., Redmond, M. C., et al. (2012). Oil weathering after the Deepwater Horizon disaster led to the formation of oxygenated residues. Environ. Sci. Technol. 46, 8799–8807. doi: 10.1021/es3015138
Aeppli, C., Nelson, R. K., Jimenez, N., Reddy, C. M., Radovic, J. R., Bayona, J. M., et al. (2014). Assessment of photochemical processes in marine oil spill fingerprinting. Mar. Pollut. Bull. 79, 268–277. doi: 10.1016/j.marpolbul.2013.11.029
Aeppli, C., Swarthout, R. F., Neil, G. W. O., Katz, S. D., Nabi, D., Ward, C. P., et al. (2018). How Persistent and Bioavailable Are Oxygenated Deepwater Horizon. Environ. Sci. Technol. 52, 7250–7258. doi: 10.1021/acs.est.8b01001
Atlas Material Testing Solutions (2016). Suntest XLS+. Available online at: https://www.atlas-mts.com/products/standard-instruments/xenon-weathering/suntest/xls (accessed January 15, 2020).
Bacosa, H. P., Liu, Z., and Erdner, D. L. (2015). Natural sunlight shapes crude oil-degrading bacterial communities in northern Gulf of Mexico surface waters. Front. Microbiol. 6. doi: 10.3389/fmicb.2015.01325
Berenshtein, I., Perlin, N., Ainsworth, C. H., Ortega-Ortiz, J. G., Vaz, A. C., and Paris, C. B. (2020). “Comparison of the spatial extent, impacts to shorelines, and ecosystem and four-dimensional characteristics of simulated oil spills,” in Scenarios and Responses to Future Deep Oil Spills, eds S. Murawski et al. (Cham: Springer), doi: 10.1007/978-3-030-12963-7_20
Bociu, I., Shin, B., Wells, W. B., Kostka, J. E., Konstantinidis, K. T., and Huettel, M. (2019). Decomposition of sediment-oil-agglomerates in a Gulf of Mexico sandy beach. Sci. Rep. 9:10071. doi: 10.1038/s41598-019-46301-w
Boufadel, M., Liu, R., Zhao, L., Lu, Y., Özgökmen, T., Nedwed, T., et al. (2020). Transport of oil droplets in the upper ocean: impact of the eddy diffusivity. J. Geophys. Res. Oceans 125:e2019JC015727. doi: 10.1029/2019JC015727
BP Gulf Science Data (2016). Application of Dispersants to Surface Oil Slicks by Aircraft and by Boat in Approved Areas of the Gulf of Mexico from April 22, 2010 to Final Application on July 19, 2010. College Station, TX: Texas A&M University. doi: 10.7266/N70G3HK6
Bracco, A., Paris, C. B., Esbaugh, A. J., Frasier, K., Joye, S. B., Liu, G., et al. (2020). Transport, fate and impacts of the deep plume of petroleum hydrocarbons formed during the macondo blowout. Front. Marine Sci. 7:542147. doi: 10.3389/fmars.2020.542147
Bridges, K. N., Lay, C. R., Alloy, M. M., Gielazyn, M. L., Morris, J. M., Forth, H. P., et al. (2018). Estimating incident ultraviolet radiation exposure in the northern Gulf of Mexico during the Deepwater Horizon oil spill. Environ. Toxicol. Chem. 37, 1679–1687. doi: 10.1002/etc.4119
Clift, R., Grace, J., and Weber, W. E. (1978). Bubbles, Drops, and Particles. Mineola, N Y: Dover Publications Inc, 1978.
Clough, S. A., Shephard, M. W., Mlawer, E. J., Delamere, J. S., Iacono, M. J., Cady-Pereira, K., et al. (2005). Atmospheric radiative transfer modeling: a summary of the AER codes: Short communication. J. Quant. Spectrosc. Radiat. Transf. 91, 233–244. doi: 10.1016/j.jqsrt.2004.05.058
Cui, F., Daskiran, C., King, T., Robinson, B., Lee, K., Katz, J., et al. (2020). Modeling oil dispersion under breaking waves. Part I: wave hydrodynamics. Environ. Fluid Mech. 20, 1527–1551. doi: 10.1007/s10652-020-09753-7
Dissanayake, A. L., Gros, J., and Socolofsky, S. A. (2018). Integral models for bubble, droplet, and multiphase plume dynamics in stratification and crossflow. Environ. Fluid Mech. 18, 1167–1202. doi: 10.1007/s10652-018-9591-y
Faillettaz, R., Paris, C. B., Vaz, A. C., Perlin, N., Aman, Z., Schlüter, M., et al. (2021). The choice of droplet size probability distribution function for oil spill modeling is not trivial. Mar. Pollut. Bull. 163:11920
Fingas, M., Fieldhouse, B., and Mullin, J. (1999). Water-in-oil emulsions results of formation studies and applicability to oil spill modelling. Spill Sci. Technol. Bull. 5, 81–91.
French-McCay, D. P. (2004). Oil spill impact modeling: development and validation. Environ. Toxicol. Chem. 23, 2441–2456. doi: 10.1897/03-382
French-McCay, D., Crowley, D., and Rowe, J. (2017). Evaluation of oil fate and exposure from a deep water blowout with and without subsea dispersant injection treatment as well as traditional response activities. Int. Oil Spill Conf. Proc. 2017, 362–382. doi: 10.7901/2169-3358-2017.1.362
Garrett, R. M., Pickering, I. J., Haith, C. E., and Prince, R. C. (1998). Photooxidation of crude oils. Environ. Sci. Technol. 32, 3719–3723. doi: 10.1021/es980201r
Glover, C. M., Mezyk, S. P., Linden, K. G., and Rosario-Ortiz, F. L. (2014). Photochemical degradation of Corexit components in ocean water. Chemosphere 111, 596–602. doi: 10.1016/j.chemosphere.2014.05.012
Gould, R. W., Ko, D. S., Ladner, S. D., Lawson, T. A., and Macdonald, C. P. (2019). Comparison of satellite, model, and in situ values of photosynthetically available radiation (PAR). J. Atmos. Ocean. Technol. 36, 535–555. doi: 10.1175/JTECH-D-18-0096.1
Gros, J., Socolofsky, S. A., Dissanayake, A. L., Jun, I., Zhao, L., Boufadel, M. C., et al. (2017). Petroleum dynamics in the sea and influence of subsea dispersant injection during Deepwater Horizon. Proc. Natl. Acad. Sci. U.S.A. 114, 10065–10070. doi: 10.1073/pnas.1612518114
Hall, G. J., Frysinger, G. S., Aeppli, C., Carmichael, C. A., Gros, J., Lemkau, K. L., et al. (2013). Oxygenated weathering products of Deepwater Horizon oil come from surprising precursors. Mar. Pollut. Bull. 75, 140–149. doi: 10.1016/j.marpolbul.2013.07.048
Hayworth, J. S., Prabakhar Clement, T., John, G. F., and Yin, F. (2015). Fate of Deepwater Horizon oil in Alabama’s beach system: understanding physical evolution processes based on observational data. Mar. Pollut. Bull. 90, 95–105. doi: 10.1016/j.marpolbul.2014.11.016
Hogan, T. F., Rosmond, T. E., and Gelaro, R. (1991). The NOGAPS forecast manual: a technical description. NOARL Tech. Rep. 13:220.
Houma ICP Aerial Dispersant Group (2010). After Action Report: Deepwater Horizon MC252 Aerial dispersant Response. (TREX?013037). Available online at: http://www.mdl2179trialdocs.com/releases/release201501260800005/TREX-013037.pdf (May 19, 2020)
Le Hénaff, M., Kourafalou, V. H., Paris, C. B., Helgers, J., Aman, Z. M., Hogan, P. J., et al. (2012). Surface evolution of the deepwater horizon oil spill patch: combined effects of circulation and wind-induced drift. Environ. Sci. Technol. 46, 7267–7273. doi: 10.1021/es301570w
Lehr, W. J. (2001). “Review of the modeling procedures for oil spill weathering behavior,” in Oil Spill Modeling and Processes, ed. C. A. Brebbia (London: WIT Press), 161.
Lehr, W. J., Bristol, S., and Possolo, A. (2010). Deepwater Horizon Oil Budget Calculator: A Report to the National Incident Command. The Federal Interagency Solutions Group, Oil Budget Calculator Science and Engineering Team. Available online at: http://www.restorethegulf.gov/sites/default/files/documents/pdf/OilBudgetCalc_Full_HQ-Print_111110.pdf (accessed March 9, 2019).
Lindo-Atichati, D., Paris, C. B., Le Hénaff, M., Schedler, M., Valladares Juárez, A. G., and Müller, A. (2016). Simulating the effects of droplet size, high-pressure biodegradation, and variable flow rate on the subsea evolution of deep plumes from the Macondo blowout. Deep Sea Res. Part II Top. Stud. Oceanogr. 129, 301–310. doi: 10.1016/j.dsr2.2014.01.011
McNutt, M., Camilli, R., Crone, T. J., Guthrie, G. D., Hsieh, P. A., Ryerson, T. B., et al. (2012). Review of flow rate estimates of the Deepwater Horizon oil spill. Proc. Nat. Acad. Sci. U.S.A. 109, 20260–20267. doi: 10.1073/pnas.1112139108
Michel, J., Owens, E. H., Zengel, S., Graham, A., Nixon, Z., Allard, T., et al. (2013). Extent and degree of shoreline oiling: deepwater horizon oil spill, Gulf of Mexico, USA. PLoS One 8:e65087. doi: 10.1371/journal.pone.0065087
National Research Council [NRC] (2003). Oil in the Sea III: Inputs, Fates, and Effects. Washington, DC: The National Academies Press. doi: 10.17226/10388
Nixon, Z., Zengel, S., Baker, M., Steinhoff, M., Fricano, G., Rouhani, S., et al. (2016). Shoreline oiling from the Deepwater Horizon oil spill. Mar. Pollut. Bull. 107, 170–178. doi: 10.1016/j.marpolbul.2016.04.003
Nordam, T., Kristiansen, R., Nepstad, R., and Röhrs, J. (2019). Numerical analysis of boundary conditions in a Lagrangian particle model for vertical mixing, transport and surfacing of buoyant particles in the water column. Ocean Model. 136, 107–119. doi: 10.1016/j.ocemod.2019.03.003
Office of Response and Restoration (2020). Environmental Response Management Application (ERMA§) : Gulf of Mexico. Available online at: https://erma.noaa.gov/gulfofmexico/erma.html (accessed December 07, 2020).
Okubo, A. (1971). Oceanic diffusion diagrams. Deep Sea Res. Oceanogr. Abstr. 18, 789–802. doi: 10.1016/0011-7471(71)90046-5
Operational Science Advisory Team III (2013). Investigation of Recurring Residual Oil in Discrete Shoreline Areas in the Eastern Area of Responsibility. Available online at: https://www.restorethegulf.gov/sites/default/files/u372/OSAT%20III%20Eastern%20States.pdf (accessed September 1, 2014).
Overton, E. B., Laseter, J. L., Mascarella, S. W., Raschke, C., Nuiry, I., and Farrington, J. W. (1980). “Photochemical oxidation of IXTOC I oil,” in Proceedings of a Symposium on Preliminary Results from the September 1979 Researcher/Pierce IXTOC-I Cruise, (Florida: Key Biscayne), 341–383.
Paris, C. B., Berenshtein, I., Trillo, M. L., Faillettaz, R., Olascoaga, M. J., Aman, Z. M., et al. (2018). BP gulf science data reveals ineffectual sub-sea dispersant injection for the macondo blowout. Front. Mar. Sci. 5:389. doi: 10.3389/fmars.2018.00389
Paris, C. B., Helgers, J., van Sebille, E., and Srinivasan, A. (2013). Connectivity Modeling System: a probabilistic modeling tool for the multi-scale tracking of biotic and abiotic variability in the ocean. Environ. Model. Softw. 42, 47–54. doi: 10.1016/j.envsoft.2012.12.006
Paris, C. B., Le Hénaff, M., Aman, Z. M., Subramaniam, A., Helgers, J., Wang, D. P., et al. (2012). Evolution of the Macondo well blowout: simulating the effects of the circulation and synthetic dispersants on the subsea oil transport. Environ. Sci. Technol. 46, 13293–13302. doi: 10.1021/es303197h
Payne, J. R., and Phillips, C. R. (1985). Photochemistry of Petroleum in Water. Environ. Sci. Technol. 19, 569–579. doi: 10.1021/es00137a602
Perlin, N., Berenshtein, I., Vaz, A. C., Faillettaz, R., Schwing, P. T., Romero, P. T., et al. (2020). “Far-field modeling of deep-sea blowout: sensitivity studies of initial conditions, biodegradation, sedimentation and SSDI on surface slicks and oil plume concentrations,” in Deep Oil Spills: Facts, Fate, Effects, eds S. A. Murawski, C. Ainsworth, S. Gilbert, D. Hollander, C. B. Paris, M. Schlüter, et al. (Cham: Springer).
Ray, P. Z., Chen, H., Podgorski, D. C., Mckenna, A. M., and Tarr, M. A. (2014). Sunlight creates oxygenated species in water-soluble fractions of Deepwater horizon oil. Oceanography 280, 636–643. doi: 10.5670/oceanog.2016.77
Ray, P. Z., and Tarr, M. A. (2014). Petroleum films exposed to sunlight produce hydroxyl radical. Chemosphere 103, 220–227. doi: 10.1016/j.chemosphere.2013.12.005
Rosmond, T. E., Teixeira, J., Peng, M., Hogan, T. F., and Pauley, R. (2002). Navy operational global atmospheric prediction system (NOGAPS): forcing for ocean models. Oceanography 15, 99–108. doi: 10.5670/oceanog.2002.40
Ruddy, B. M., Huettel, M., Kostka, J. E., Lobodin, V. V., Bythell, B. J., McKenna, A. M., et al. (2014). Targeted petroleomics: analytical investigation of macondo well oil oxidation products from Pensacola Beach. Energy Fuels 28, 4043–4050. doi: 10.1021/ef500427n
Shankar, R., Shim, W. J., An, J. G., and Yim, U. H. (2015). A practical review on photooxidation of crude oil: laboratory lamp setup and factors affecting it. Water Res. 68, 304–315. doi: 10.1016/j.watres.2014.10.012
Socolofsky, S. A., Adams, E. E., and Sherwood, C. R. (2011). Formation dynamics of subsurface hydrocarbon intrusions following the Deepwater Horizon blowout. Geophys. Res. Lett. 38:L09602. doi: 10.1029/2011GL047174
Spaulding, M. S., Li, Z., Mendelsohn, D., Crowley, D., French-McCay, D., and Bird, A. (2017). Application of an integrated blowout model system, OILMAP DEEP, to the Deepwater Horizon (DWH) Spill. Mar. Pollut. Bull. 120, 37–50. doi: 10.1016/j.marpolbul.2017.04.043
Tarr, M. A., Zito, P., Overton, E. B., Olson, G. M., Adhikari, P. L., and Reddy, C. M. (2016). Weathering of oil spilled in the marine environment. Oceanography 29, 126–135. doi: 10.5670/oceanog.2016.77
Vaz, A. C., Paris, C. B., Dissanayake, A. L., Socolofsky, S. A., Gros, J., and Boufadel, M. C. (2020). “Dynamic coupling of near-field and far-field models,” in Deep Oil Spills: Facts, Fate, Effects, eds S. A. Murawski, C. Ainsworth, S. Gilbert, D. Hollander, C. B. Paris, M. Schlüter, et al. (Cham: Springer).
Ward, C. P., and Overton, E. B. (2020). How the 2010 Deepwater Horizon spill reshaped our understanding of crude oil photochemical weathering at sea: a past, present, and future perspective. Environ. Sci. Process. Impacts 22, 1125–1138. doi: 10.1039/d0em00027b
Ward, C. P., Reddy, C. M., and Overton, E. B. (2020). Why Sunlight Matters for Marine Oil Spills. Eos 101. Available online at: https://doi.org/10.1029/2020EO143427 (accessed August 14, 2020).
Ward, C. P., Armstrong, C. J., Conmy, R. N., French-McCay, D. P., and Reddy, C. M. (2018a). Photochemical oxidation of oil reduced the effectiveness of aerial dispersants applied in response to the deepwater horizon spill. Environ. Sci. Technol. Lett. 5, 226–231. doi: 10.1021/acs.estlett.8b00084
Ward, C. P., Sharpless, C. M., Valentine, D. L., French-mccay, D. P., Aeppli, C., White, H. K., et al. (2018b). Partial photochemical oxidation was a dominant fate of deepwater horizon surface oil. Environ. Sci. Technol. 52, 1797–1805. doi: 10.1021/acs.est.7b05948
Ward, C. P., Sharpless, C. M., Valentine, D. L., Aeppli, C., Sutherland, K. M., Wankel, S. D., et al. (2019). Oxygen isotopes (δ18O) trace photochemical hydrocarbon oxidation at the sea surface. Geophys. Res. Lett. 46, 6745–6754. doi: 10.1029/2019GL082867
Warnock, A. M., Hagen, S. C., and Passeri, D. L. (2015). Marine tar residues: a review. Water Air Soil Pollut. 226:68.
White, H. K., Wang, C. H., Williams, P. L., Findley, D. M., Thurston, A. M., Simister, R. L., et al. (2016). Long-term weathering and continued oxidation of oil residues from the Deepwater Horizon spill. Mar. Pollut. Bull. 113, 380–386. doi: 10.1016/j.marpolbul.2016.10.029
Xie, H., Yapa, P. D., and Nakata, K. (2007). Modeling emulsification after an oil spill in the sea. J. Mar. Syst. 68, 489–506. doi: 10.1016/j.jmarsys.2007.02.016
Zhao, L., Boufadel, M. C., Adams, E., Socolofsky, S. A., King, T., Lee, K., et al. (2015). Simulation of scenarios of oil droplet formation from the Deepwater Horizon blowout. Mar. Pollut. Bull. 101, 304–319. doi: 10.1016/j.marpolbul.2015.10.068
Zhao, L., Boufadel, M. C., King, T., Robinson, B., Gao, F., Socolofsky, S. A., et al. (2017). Droplet and bubble formation of combined oil and gas releases in subsea blowouts. Mar. Pollut. Bull. 120, 203–216. doi: 10.1016/j.marpolbul.2017.05.010
Zhao, L., Torlapati, J., Boufadel, M. C., King, T., Robinson, B., and Lee, K. (2014). VDROP: a comprehensive model for droplet formation of oils and gases in liquids - Incorporation of the interfacial tension and droplet viscosity. Chem. Eng. J. 253, 93–106. doi: 10.1016/j.cej.2014.04.082
Keywords: oil spill, oil photooxidation, irradiance, oil weathering, Deepwater Horizon, oil-Connectivity modeling System, oil modeling
Citation: Vaz AC, Faillettaz R and Paris CB (2021) A Coupled Lagrangian-Earth System Model for Predicting Oil Photooxidation. Front. Mar. Sci. 8:576747. doi: 10.3389/fmars.2021.576747
Received: 26 June 2020; Accepted: 11 January 2021;
Published: 19 February 2021.
Edited by:
Andrew James Manning, HR Wallingford, United KingdomReviewed by:
Phoebe Zito, University of New Orleans, United StatesMichel C. Boufadel, New Jersey Institute of Technology, United States
Copyright © 2021 Vaz, Faillettaz and Paris. This is an open-access article distributed under the terms of the Creative Commons Attribution License (CC BY). The use, distribution or reproduction in other forums is permitted, provided the original author(s) and the copyright owner(s) are credited and that the original publication in this journal is cited, in accordance with accepted academic practice. No use, distribution or reproduction is permitted which does not comply with these terms.
*Correspondence: Ana C. Vaz, avaz@rsmas.miami.edu; Claire B. Paris, cparis@rsmas.miami.edu